6/26/2007SE 652- 2007_6_26_TestResults_PSMp1.ppt1 Team Software Project (TSP) June 26, 2006 System...
45
6/26/2007 SE 652- 2007_6_26_TestResults_PSM p1.ppt 1 Team Software Project (TSP) June 26, 2006 System Test
-
date post
21-Dec-2015 -
Category
Documents
-
view
214 -
download
0
Transcript of 6/26/2007SE 652- 2007_6_26_TestResults_PSMp1.ppt1 Team Software Project (TSP) June 26, 2006 System...
6/26/2007 SE 652- 2007_6_26_TestResults_PSMp1.ppt 1
Team Software Project (TSP)
June 26, 2006
System Test

6/26/2007 SE 652- 2007_6_26_TestResults_PSMp1.ppt 2
Outline
Remaining Session Plan & Discussion
System Test Plan Discussion
Mythical Man Month
System Test Plan Recap
Metrics Presentations
More on Measurement
Next PhasesCycle 1 Test
Cycle 1 Post-Mortem & Presentations
Cycle 2 Plan & Strategy
6/26/2007 SE 652- 2007_6_26_TestResults_PSMp1.ppt 3
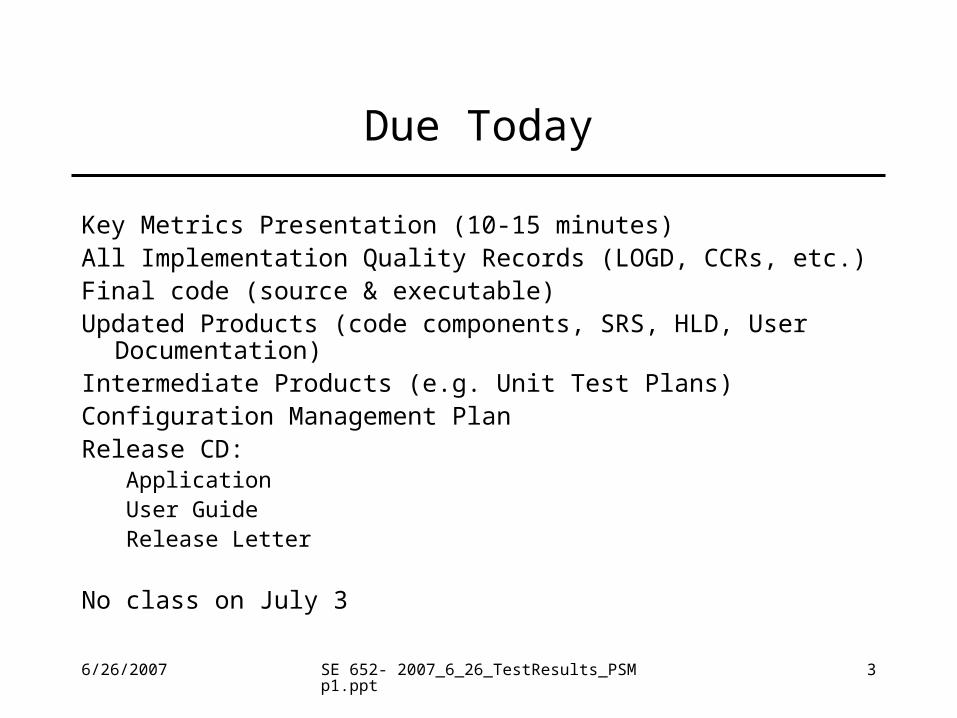
Due Today
Key Metrics Presentation (10-15 minutes)All Implementation Quality Records (LOGD, CCRs, etc.)Final code (source & executable)Updated Products (code components, SRS, HLD, User Documentation)Intermediate Products (e.g. Unit Test Plans)Configuration Management PlanRelease CD:
ApplicationUser GuideRelease Letter
No class on July 3

Project Performance Discussion

6/26/2007 SE 652- 2007_6_26_TestResults_PSMp1.ppt 5
Remaining Lectures Plan/Discussion
July 10 – Cycle 1 Test Complete & Post-MortemCycle 1 Results Presentation & DiscussionCycle 1 Reports & Post-MortemMeasurementTeam audit
July 17 – Cycle 2 LaunchCycle 2 Launch, Project & Measurement PlanningPeopleware Topics: Management, Teams, Open Kimono, Quality, Hiring/Morale, …
July 24 – Cycle 2 Requirements CompleteCycle 2 RequirementsDeath March Projects:
July 31 – Cycle 2 Implementation CompleteSystem Test Plan BaselinedCycle 2 Design & ImplementationProcess topics – CMMI, TL-9000, ISO
August 7 – Cycle 2 Test CompleteCycle 2 Test CompleteCycle 2 Post-Mortem Complete
August 14 - Course ReviewCourse ReviewClass exerciseFinal

Remaining Course Topics Discussion
6/26/2007 SE 652- 2007_6_26_TestResults_PSMp1.ppt 7
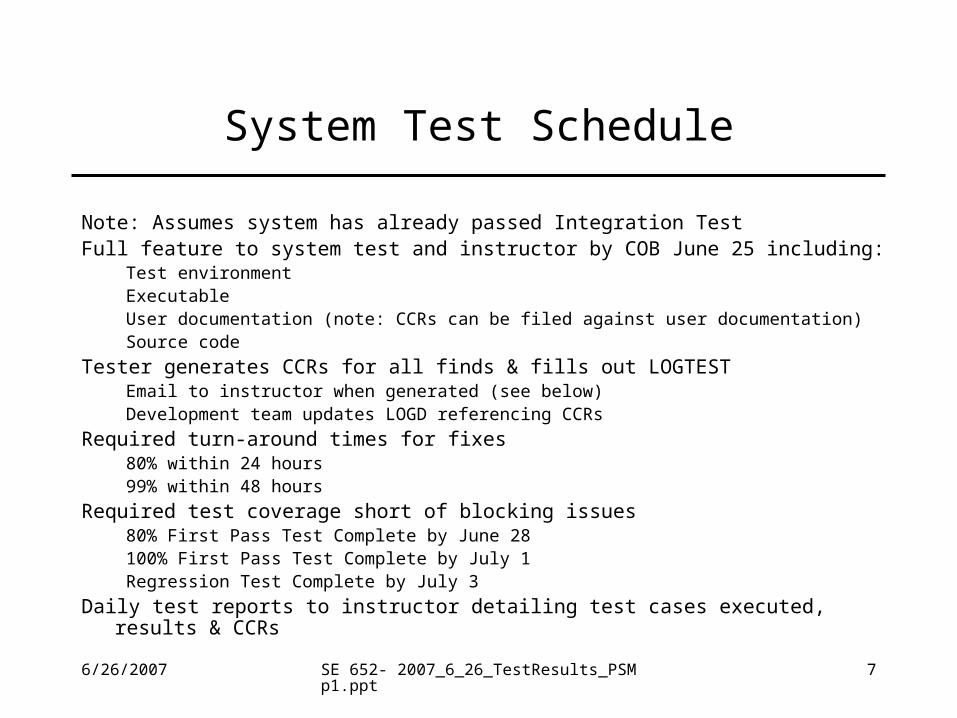
System Test Schedule
Note: Assumes system has already passed Integration TestFull feature to system test and instructor by COB June 25 including:
Test environmentExecutableUser documentation (note: CCRs can be filed against user documentation)Source code
Tester generates CCRs for all finds & fills out LOGTESTEmail to instructor when generated (see below)Development team updates LOGD referencing CCRs
Required turn-around times for fixes80% within 24 hours99% within 48 hours
Required test coverage short of blocking issues80% First Pass Test Complete by June 28 100% First Pass Test Complete by July 1Regression Test Complete by July 3
Daily test reports to instructor detailing test cases executed, results & CCRs
6/26/2007 SE 652- 2007_6_26_TestResults_PSMp1.ppt 8
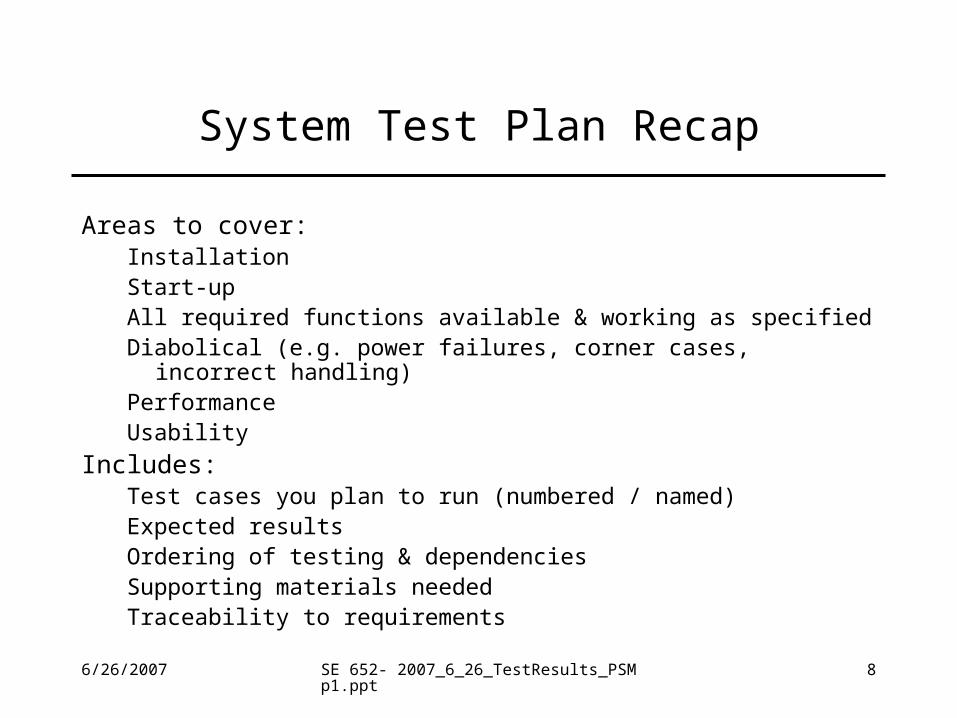
System Test Plan Recap
Areas to cover:InstallationStart-upAll required functions available & working as specifiedDiabolical (e.g. power failures, corner cases, incorrect handling)PerformanceUsability
Includes:Test cases you plan to run (numbered / named)Expected resultsOrdering of testing & dependenciesSupporting materials neededTraceability to requirements

6/26/2007 SE 652- 2007_6_26_TestResults_PSMp1.ppt 9
Release “Letters”
Purpose
What’s in it?– Version Information
– Release contentsExamples:
• All functionality defined in Change Counter Requirements v0.6 except GUI
• Phase 1 features as defined in project plan x.y
• Feature 1, Feature 2, Feature 3 as defined by …
– Known Problems• Change Request IDs w/ brief customer oriented description
– Fixed Problems
– Upgrade Information
– Other?

6/26/2007 SE 652- 2007_6_26_TestResults_PSMp1.ppt 10
Implementation Status
Implementation experience
Unit/Integration experience
Problems / Rework?
PIP forms

Team Presentation
Project Measurement
Source: Practical Software MeasurementJohn McGarry, et.al.

6/26/2007 SE 652- 2007_6_26_TestResults_PSMp1.ppt 14
Measurement
“If you can’t measure it,
you can’t manage it”
Tom DeMarco

6/26/2007 SE 652- 2007_6_26_TestResults_PSMp1.ppt 15
Fundamentals
Don’t try to measure everything
Align measures with:Project goals & risks (basic survival mode)
Process improvement areas (continual improvement mode)
Define measurement program up front
Monitor continuously & take action where needed

6/26/2007 SE 652- 2007_6_26_TestResults_PSMp1.ppt 16
Applications
Improve accuracy of size & cost estimates
Improve quality
Understand project status
Produce more predictable schedules
Improve organizational communication
Faster, better informed management decisions
Improve software processes

6/26/2007 SE 652- 2007_6_26_TestResults_PSMp1.ppt 17
Basic In-Process Measurement Examples
ScheduleEarned Value vs. Planned ValueSchedule Variance
DevelopmentTask completionActual code completed vs. planned
Project End GameDefect Creation vs. Closure
Variations: severity
System Test% Testing Complete
Variations: passed, failed, blocked
Test Time / DefectTest Coverage (vs. requirements, white box code coverage)
6/26/2007 SE 652- 2007_6_26_TestResults_PSMp1.ppt 18
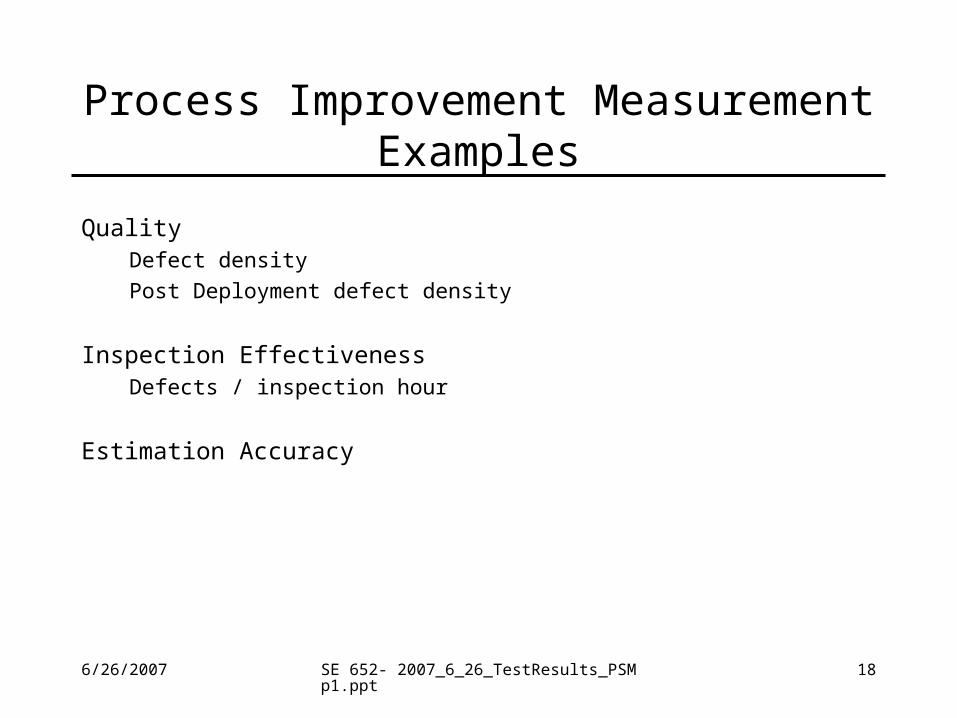
Process Improvement Measurement Examples
QualityDefect density
Post Deployment defect density
Inspection EffectivenessDefects / inspection hour
Estimation Accuracy

6/26/2007 SE 652- 2007_6_26_TestResults_PSMp1.ppt 19
Why Measure?
Support short & long term decision making
Mature software organization (CMMI level?) uses measurement to:
Plan & evaluate proposed projects
Objectively track actual performance against plan
Guide process improvement decisions
Assess business & technical performance
Organizations need the right kind of information, at the right time to make the right decisions

6/26/2007 SE 652- 2007_6_26_TestResults_PSMp1.ppt 20
Measurement in Software Lifecycle
Plan
Do – carry out change
Check – observe effects of change
Act – decide on additional areas for improvement
Repeat
Considerations: Cost, schedule, capability, quality

6/26/2007 SE 652- 2007_6_26_TestResults_PSMp1.ppt 21
Measurement Psychological Effects
Measurement as measures of individual performance
Hawthorne Effect
Measurement Errors
Conscious: rounding, pencil whipping (ie. False data entry)
Unintentional: inadvertent, technique (ie. Consistent)

6/26/2007 SE 652- 2007_6_26_TestResults_PSMp1.ppt 22
Use of Measures
Process Measures – time oriented, includes defect levels, events & cost elementsUsed to improve software development & maintenance process
Product Measures – deliverables & artifacts such as documentsincludes size, complexity, design features, performance & quality levels
Project Measures – project characteristics and executionincludes # of developers, cost, schedule, productivity
Resource Measures –resource utilizationincludes training, costs, speed & ergonomic data

6/26/2007 SE 652- 2007_6_26_TestResults_PSMp1.ppt 24
Glossary
Entity - object or event (e.g. personnel, materials, tools & methods)
Attribute - feature of an entity (e.g. # LOC inspected, # defects found, inspection time)
Measurement - # and symbols assigned to attributes to describe them
Measure – quantitative assessment of a product/process attribute (e.g. defect density, test pass rate, cyclomatic complexity)
Measurement Reliability – consistency of measurements assuming nochange to method/subject
Software validity – proof that the software is trouble free & functions correctly (ie. high quality)
Predictive validity – accuracy of model estimates
Measurement errors – systematic (associated with validity) & random (associated w/ reliability)
Software Metrics – approach to measuring some attribute
Defect – product anomaly
Failure – termination of product’s ability to perform a required function
6/26/2007 SE 652- 2007_6_26_TestResults_PSMp1.ppt 25
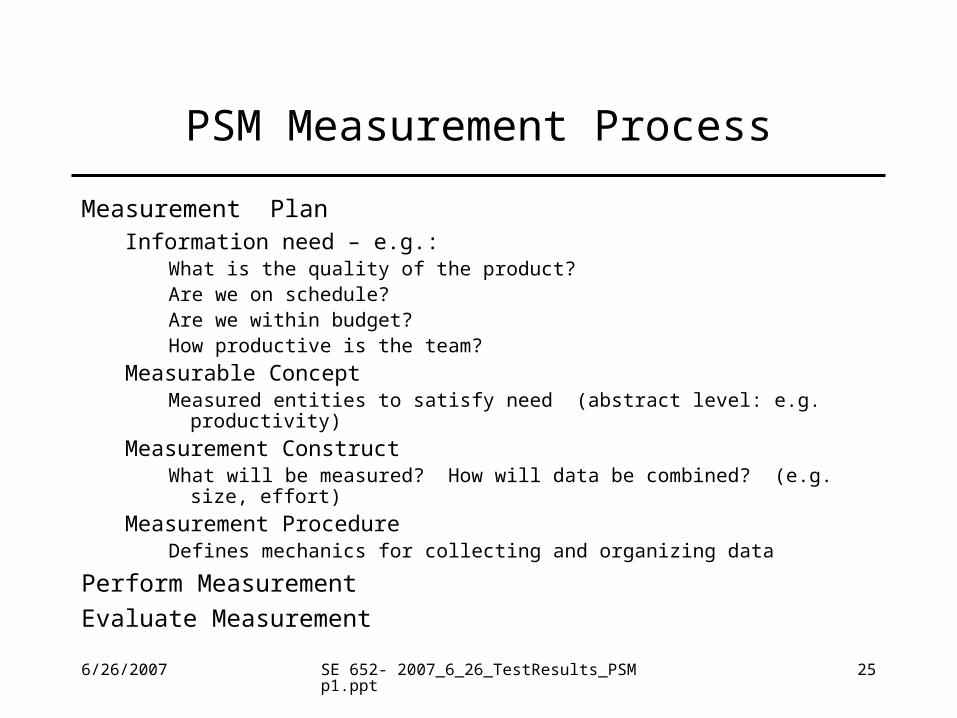
PSM Measurement Process
Measurement PlanInformation need – e.g.:
What is the quality of the product?Are we on schedule?Are we within budget?How productive is the team?
Measurable ConceptMeasured entities to satisfy need (abstract level: e.g. productivity)
Measurement ConstructWhat will be measured? How will data be combined? (e.g. size, effort)
Measurement ProcedureDefines mechanics for collecting and organizing data
Perform Measurement
Evaluate Measurement

6/26/2007 SE 652- 2007_6_26_TestResults_PSMp1.ppt 26
Measurement Construct
Attribute Attribute
Base Measure Base Measure
Derived Measure
Indicator
Derived Measure
Decision Criteria
Measurement method
Measurement Function
Measurement method
Analysis Model

6/26/2007 SE 652- 2007_6_26_TestResults_PSMp1.ppt 27
Attributes
Attribute
Distinguishable property or characteristic of a software entity
(Entities: processes, products, projects and resources)
Qualitative or Quantitative measure
Attribute Attribute
Base Measure Base Measure
Derived Measure
Indicator
Derived Measure

6/26/2007 SE 652- 2007_6_26_TestResults_PSMp1.ppt 28
Base Measure
Measure of an attribute (one to one relationship)
Measurement methodAttribute quantification with respect to a scale
Method typeSubjective (e.g. high, medium, low), Objective (e.g. KLOC)
ScaleRatio
Interval
Ordinal
Nominal
Unit of measuremente.g. hours, pages, KLOC
Attribute Attribute
Base Measure Base Measure
Derived Measure
Indicator
Derived Measure
6/26/2007 SE 652- 2007_6_26_TestResults_PSMp1.ppt 29
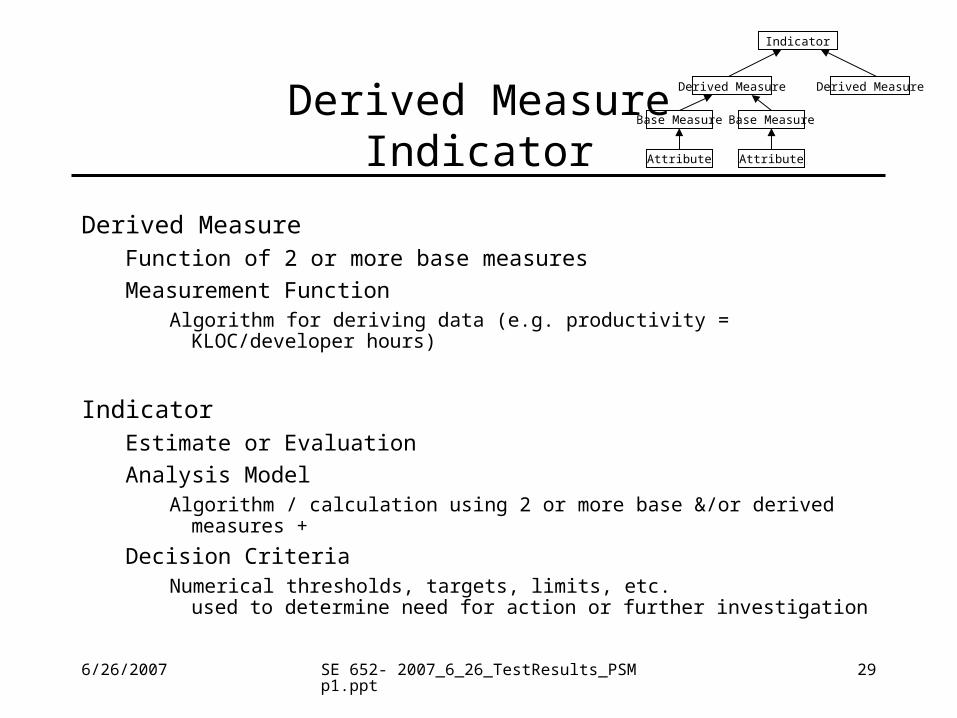
Derived MeasureIndicator
Derived MeasureFunction of 2 or more base measures
Measurement FunctionAlgorithm for deriving data (e.g. productivity = KLOC/developer hours)
IndicatorEstimate or Evaluation
Analysis ModelAlgorithm / calculation using 2 or more base &/or derived measures +
Decision CriteriaNumerical thresholds, targets, limits, etc.
used to determine need for action or further investigation
Attribute Attribute
Base Measure Base Measure
Derived Measure
Indicator
Derived Measure

6/26/2007 SE 652- 2007_6_26_TestResults_PSMp1.ppt 30
Measurement ConstructExamples
ProductivityAttributes: Hours, KLOC
Base Measures: Effort (count total hrs), Size (KLOC counter)
Derived Measure: Size / Effort = Productivity
Analysis Model: Compute Mean, compute std deviation
Indicator: Productivity: mean w/ 2 confidence limits
QualityAttributes: Defects, KLOC
Base Measures: # Defects (count defects), Size (KLOC counter)
Derived Measures: # Defects / Size = Defect Rate
Indicator: Defect rate control: baseline mean, control limits & measured defect rate
Attribute Attribute
Base Measure Base Measure
Derived Measure
Indicator
Derived Measure
6/26/2007 SE 652- 2007_6_26_TestResults_PSMp1.ppt 31
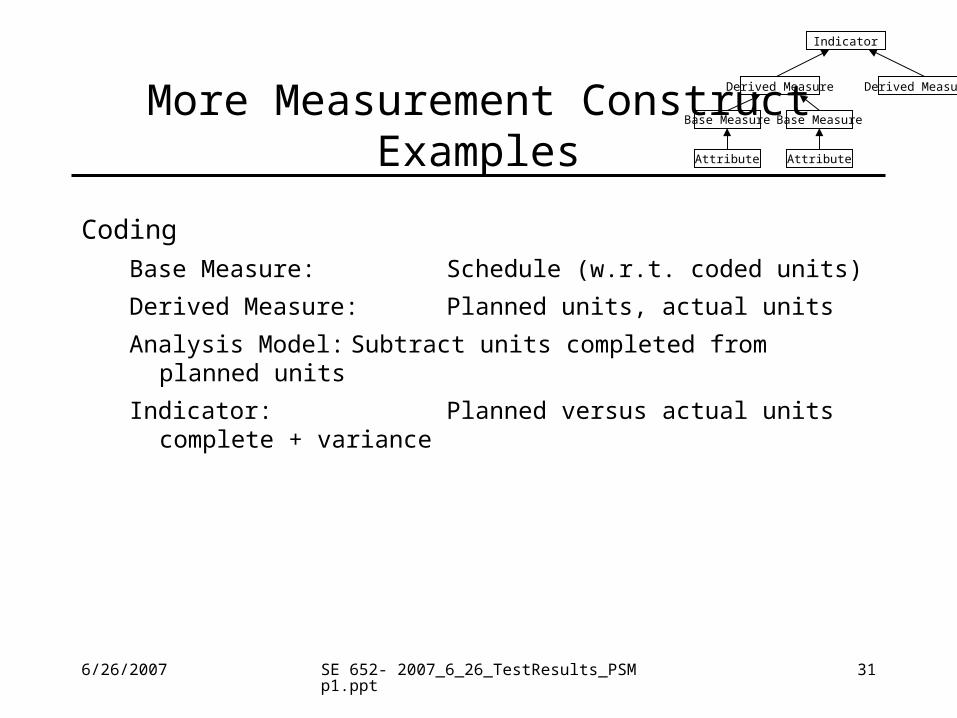
More Measurement ConstructExamples
Coding
Base Measure: Schedule (w.r.t. coded units)
Derived Measure: Planned units, actual units
Analysis Model: Subtract units completed from planned units
Indicator: Planned versus actual units complete + variance
Attribute Attribute
Base Measure Base Measure
Derived Measure
Indicator
Derived Measure

6/26/2007 SE 652- 2007_6_26_TestResults_PSMp1.ppt 32
Class Measurement ConstructExamples
Coding
Base Measure:
Derived Measure:
Analysis Model:
Indicator:
Attribute Attribute
Base Measure Base Measure
Derived Measure
Indicator
Derived Measure

6/26/2007 SE 652- 2007_6_26_TestResults_PSMp1.ppt 33
Identify Candidate Information NeedsProject Objectives
Cost, schedule, quality, capability
Risks
PrioritizeOne approach: probability of occurrence x project impact = project exposure
e.g.
Schedule
Budget
Reliability
Dependencies
Product Volatility
Measurement Planning
6/26/2007 SE 652- 2007_6_26_TestResults_PSMp1.ppt 34
PSM Common Information Categories
Schedule & Progress
Resources & Cost
Product Size & Stability
Product Quality
Process Performance
Technology Effectiveness
Customer Satisfaction

6/26/2007 SE 652- 2007_6_26_TestResults_PSMp1.ppt 35
PSM Common Information CategoriesMeasurement Concepts
Schedule & Progress - milestone dates/completion, EV/PV
Resources & Cost - staff level, effort, budget, expenditures
Product Size & Stability - KLOC/FP, # requirements, # interfaces
Product Quality - defects, defect age, MTBF, complexity
Process Performance- productivity, rework effort, yield
Technology Effectiveness - requirements coverage
Customer Satisfaction - customer feedback, satisfaction ratings, support requests, support time, willingness to repurchase

6/26/2007 SE 652- 2007_6_26_TestResults_PSMp1.ppt 36
Select & Specify Measures
Considerations
Utilize existing data collection mechanisms
As invisible as possible
Limit categories & choices
Use automated methods over manual
Beware of accuracy issues (e.g. timecards)
Frequency needs to be enough to support ongoing decision making(alternative: gate processes)

6/26/2007 SE 652- 2007_6_26_TestResults_PSMp1.ppt 37
Measurement Construct
Measurement ConstructInformation NeedMeasurable ConceptRelevant EntitiesAttributesBase MeasuresMeasurement MethodType of MethodScaleType of ScaleUnit of MeasurementDerived MeasuresMeasurement FunctionIndicatorAnalysis ModelDecision Criteria

6/26/2007 SE 652- 2007_6_26_TestResults_PSMp1.ppt 38
Project Measurement Plan Template
(from PSM figure 3-10, p 56)
Introduction
Project Description
Measurement Roles, Responsibilities & Communications
Description of Project Information Needs
Measurement Specifications (i.e. constructs)
Project Aggregation Structures
Reporting Mechanisms & Periodicity

6/26/2007 SE 652- 2007_6_26_TestResults_PSMp1.ppt 39
Team Project Postmortem
WhyInsanity
Continuous improvementMechanism to learn & improve
Improve by changing processes or better following current processes
Tracking process improvements during projectProcess Improvement Proposals (PIP)
Post-Mortem
Areas to considerBetter personal practices
Improved tools
Process changes
6/26/2007 SE 652- 2007_6_26_TestResults_PSMp1.ppt 40
Cycle 2 Measurement Plan
Identify cycle 2 risks & information needs
Review & revise measures & create measurement constructs
Document in a measurement plan
6/26/2007 SE 652- 2007_6_26_TestResults_PSMp1.ppt 41
Postmortem process
Team discussion of project data
Review & critique of roles
6/26/2007 SE 652- 2007_6_26_TestResults_PSMp1.ppt 42
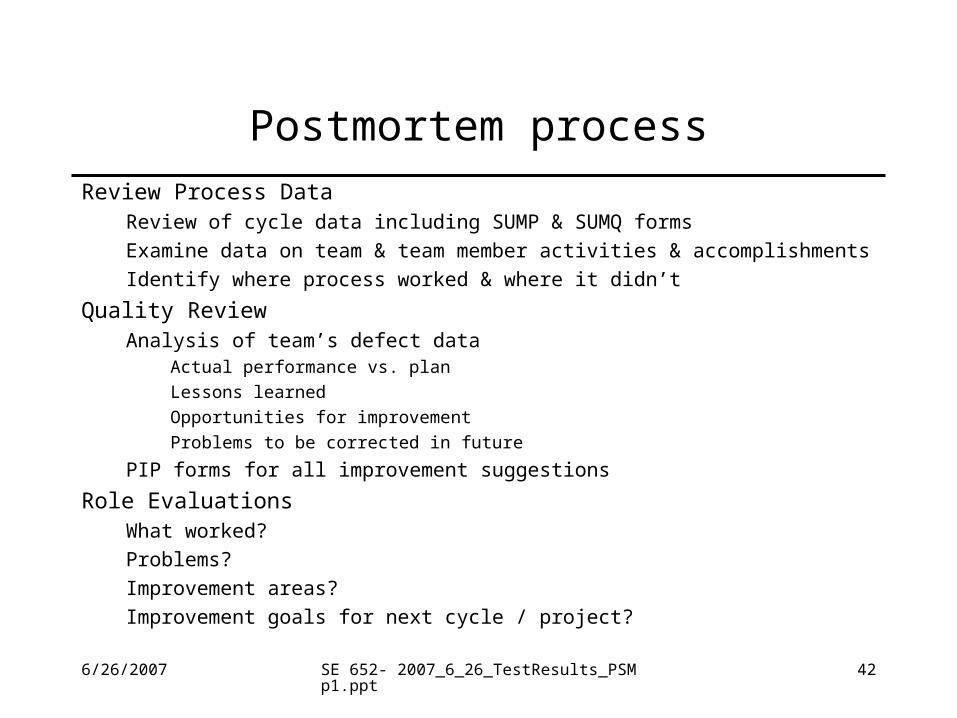
Postmortem process
Review Process DataReview of cycle data including SUMP & SUMQ forms
Examine data on team & team member activities & accomplishments
Identify where process worked & where it didn’t
Quality ReviewAnalysis of team’s defect data
Actual performance vs. plan
Lessons learned
Opportunities for improvement
Problems to be corrected in future
PIP forms for all improvement suggestions
Role EvaluationsWhat worked?
Problems?
Improvement areas?
Improvement goals for next cycle / project?

6/26/2007 SE 652- 2007_6_26_TestResults_PSMp1.ppt 43
Cycle Report
Table of contents
Summary
Role ReportsLeadership – leadership perspective
Motivational & commitment issues, meeting facilitation, req’d instructor support
DevelopmentEffectiveness of development strategy, design & implementation issues
PlanningTeam’s performance vs. plan, improvements to planning process
Quality / ProcessProcess discipline, adherence, documentation, PIPs & analysis, inspections
Cross-team system testing planning & execution
SupportFacilities, CM & Change Control, change activity data & change handling, ITL
Engineer Reports – individual assessments

6/26/2007 SE 652- 2007_6_26_TestResults_PSMp1.ppt 44
Role Evaluations & Peer Forms
Consider & fill out PEER forms
Ratings (1-5) on work, team & project performance, roles & team members
Additional role evaluations suggestions
Constructive feedback
Discuss behaviors or product, not person
Team leaders fill out TEAM EVALUATION form

6/26/2007 SE 652- 2007_6_26_TestResults_PSMp1.ppt 45
Cycle 1 Project Notebook Update
Updated Requirements & Design documents
Conceptual Design, SRS, SDS, System Test Plan, User Documentation*
Updated Process descriptions
Baseline processes, continuous process improvement, CM
Tracking forms
ITL, LOGD, Inspection forms, LOGTEST
Planning & actual performance
Team Task, Schedule, SUMP, SUMQ, SUMS, SUMTASK, CCR*

6/26/2007 SE 652- 2007_6_26_TestResults_PSMp1.ppt 46
Due July 10 Class
Cycle 1 Reports / Post-Mortem
Cycle 1 Results Presentation
Cycle 2 Project Plan
Cycle 2 Measurement Plan

Cycle 1 Audit


![Ppt1 [Edited]](https://static.fdocuments.in/doc/165x107/545438bfaf795978688b4ce8/ppt1-edited.jpg)