Measurement Uncertainty Arising From Sampling: A Guide To ...
Chapter 6 Test Borehole
6 - 13
6.1.6 Sampling, Measurement and Testing
1) Sampling
In the course of drilling at each borehole, the data of all formations encountered was logged while drilling and a record was made of all variations in the rate of penetration due to changes in geological formations. The following samples were also taken for the evaluation of the formation.
Sample Description
i) Drill cutting sample Weighing a minimum of 0.5 kg, of the strata penetrated was
collected every 1 meter as well as change of formation at the
1-meter interval.
ii) Water sample Samples of water was taken during 1) the drilling operation
when encountered the water strike and with safe hole wall
situation, and 2) pumping. The samples taken were analyzed
both water quality and isotope.
2) Measurement (Borehole Logging)
Before installation of the casing pipe, geophysical logs in the hole was carried out, to determine which aquifer or aquifers are to be screened. The items of geophysical logging adopted for the test boreholes were six items of 1) Natural Gamma Ray, 2) Spontaneous Potential, 3) Neutron, 4) Resistivity, 5) Temperature and 6) Caliper.
i) Natural Gamma Ray
The automated logger in which the cable can be raised and lowered mechanically was applied. The cable speed was regulated so that enough counts were recorded. Since the hole diameter effects the gamma ray measurements, the proper radiometric calibration of the gamma probe was taken.
ii) Spontaneous Potential
Spontaneous potential logs were made in conjunction with resistivity logs. The measurements were conducted in uncased boreholes, filled with drilling fluid by means of an electric cable connected to one terminal of a milli-volt meter and recorder. The other terminal of the instrument was connected to a ground terminal
Chapter 6 Test Borehole
6 - 14
at the surface placed in the mud pit. No external source of electric current was connected to this circuit.
iii) Neutron
The neutron logger was calibrated in API (American Petroleum Institute) test pits and then standardized frequently in the field by using an unvarying high-hydrogen environment. The depth of neutron penetration into a formation was determined and depends on the porosity, hole diameter, and spacing between the source and detector. The caliper arm was used to press the probe onto the side wall and was semi directional into the formation to minimize the effect of the borehole diameter. The output of the measurement is porosity (ΦD) directory.
iv) Resistivity (Short and Long Normal)
The two-electrode arrangement was applied to measure the Long (Rt: resistivity of uninvited zone) and Short (Rxo: resistivity of flushed zone) normal logs. The spacing of electrodes was set as greater than 64” (1,630 mm).
v) Temperature
A temperature log was obtained by lowering a temperature sensor down the water filled borehole at a slow but constant rate. No temperature measurements were taken immediately after drilling because the temperature equilibrium in the borehole has been disturbed.
vi) Caliper
The caliper log was carried out to sense the diameter of the borehole. The caliper used was an electro-mechanical device in which the angle of the caliper arm is measured by the resistance in a linear potentiometer.
3) Testing (Test Pumping)
Following the completion of the borehole development, test pumping consisting of following items was carried out.
Item of Test Description
i) Step Drawdown Test The test was basically done in 5 steps as round steps,
however, occasionally in a fewer steps. The duration of
each step was 60 to 120 minutes and measured.
Chapter 6 Test Borehole
6 - 15
ii) Constant discharge test The test was basically done in 72 hours or occasionally
longer or shorter in duration. The test was performed as
soon as the water in the well has recovered its static
water level after completions of the step drawdown test
iii) Time recovery test The test was always started immediately on completion
of the constant discharge test and was carried out for a
minimum period of 24 hours or occasionally for a longer
or shorter period.
6.1.7 Borehole Logging
Each borehole is discussed below in terms of its stratigraphy and geophysical response to that stratigraphy. The geological logs for each borehole together with geophysical logging were provided as shown as Appendix A-2. The section below comprises a summary description of the interpretation results at each location.
1) Location No. J-1
The Dwyka Group appears more resistive and denser than the overlying Auob Member. No dramatic increase in water conductivity is recognized indicating that the Nossob Member is not present. The gamma log confirms the division of the Auob into divisions A1 to A5. The grouping A1, A2-A4, A5 can be clearly distinguished in terms of clay content. A1 and A5 have lower gamma counts and higher porosities than the A2-A4 grouping. A3 can be distinguished from the more clay rich A2 and A4 on the basis of a lower gamma count and higher porosity but not to the same order as A1 and A5. A sharp gamma peak is observed within the A3 unit. A sharp increase in clay content and a porosity decrease is evidenced into the Rietmond Member. It appears as if the high gamma ray K clays are a diagnostic feature of the Lower Rietmond. The basal clay rich Lower Rietmond is overlain by an upward coarsening clay / siltstone unit, which in turn is overlain by a siltstone.
2) Location No. J-2
An atypical Nossob Member is observed. The clay content is relatively high with active resistivity and SP. A strong and relatively broad radiometric anomaly is seen close to the basement contact. Note this strong gamma peak was seen in the Auob Member in J1.
Chapter 6 Test Borehole
6 - 16
Water conductivities show a dramatic increase confirming a Nossob interpretation. A slight decrease in porosity, and relatively flat gamma and resistivity curves characterize the overlying Lower Mukarob shale. The Upper Mukarob is evidenced by noisier gamma and resistivity curves. The Auob is poorly developed and cannot be divided into units A1to A5. The high porosity and more resistive sandstone observed is possibly A1 or A5. The Rietmond is well developed and similar to that of J1. The Lower Rietmond shale is K clay rich, capped by an upward coarsening shale to siltstone unit, followed by a siltstone unit.
3) Location No. J-3
Clay rich, Nossob Member appears above the Dwyka Group The Dwyka Group is relatively well defined compared to J1 being more porous and arenaceous than the overlying Nossob. Within the Nossob three narrow (2-5m) highly porous sandstone units occur. The units contain a conductive ground water as evidenced by the significant increase in water conductivity and local resistivity anomalies. The top sandstone unit is considered the top of the Nossob Member. Clay rich, less porous, Mukarob Shale is observed. A distinction between Upper and Lower Mukarob can be made in terms of clay content and porosity. The Auob A1 unit is especially clear, characterized by porous sandstone together with a small increase in groundwater conductivity. The A2 Auob is a homogeneous, clay rich, less porous unit. A sudden increase in porosity appears to mark the A3 contact. A4 and A5 appear to be missing. No gamma spike is present in the Auob or Nossob. Clay poor, homogeneous, porous sandstone, indicates the Upper Rietmond. No K clay rich Lower and Upper Rietmond units are observed. The Kalahari Sequence appears K clay poor and porous. No basal clay layer is present. Resistivities are active and higher.
4) Location No. J-4
The Nossob Member appears less K clay rich than the above holes taking on a siltstone to sandstone character. Porosities are elevated. No dramatic increase in ground water conductivity is noted coming into the Nossob, but water conductivities are in any case high. The Mukarob seems to be better developed in this hole. The division into Upper and Lower Mukarob from the logging is not clear. A basal shale unit followed by two siltstone layers, capped by a further shale layer is observed. The Auob A1 to A5 can be distinguished on the basis of the porosity log. The gamma log is less clear than previously. Karoo dolerite above the Auob shows up as a denser, low K and low porosity lithology.
Chapter 6 Test Borehole
6 - 17
5) Location No. J-5
The Nossob Member is well developed with a basal siltstone and upper porous sandstone. The Nossob again contains conductive ground water. Typical K clay rich shale of the Lower Mukarob can be found above the Nossob. Porosity is down, but contained water is fresher and less conductive. The Upper Mukarob, a siltstone, appears to be slightly upward coarsening. The A1 Auob is evidenced by an abrupt increase in porosity, a decrease in K clay content and a SP shift. The distinction between the A2 and A3 Auob is subtle but based in the main on changes in porosity.
6) Location No. J-6
The Nossob is well developed made up of porous sandstone containing conductive water. K clay rich Lower Mukarob Shale follows above the Nossob. An upward coarsening Upper Mukarob Siltstone is present. The A1 Auob Member is made up of porous sandstone. A clearly defined SP and resistivity anomaly is seen at the base of the Auob indicating the point of ingress of ground water into the hole. The Auob units A2 to A5 are recognized by changes in porosity. The Kalahari Sequence is relatively monotonous consisting of porous low K clay material. A curios increase in density is apparent in the centre of the Kalahari section. The ground water conductivities confirm this hole within the “salt block”.
7) Location No. J-7
Dwyka Shale is seen at the bottom of the borehole. The Nossob is fairly narrow (10m) but is made up of porous sandstone and carries conductive water (700 mS/m). The overlying Lower Mukarob is made up of homogeneous, K clay rich, less porous shale. No Upper Mukarob appears to be present. The A1 Auob is seen as the first major increase in porosity. The remainder of the Auob is difficult to interpret, as there is relatively little change in porosity or gamma count. The hint of an increase in porosity is interpreted as A1. The presence of the Rietmond is speculative. Typical Kalahari is present.
8) Location No. J-8
The Dwyka Group is poorly represented at the base of the borehole. The Nossob is porous and carrying conductive water as are the rest of the formations in the borehole. The sandstone portion of the Nossob appears to show the ingress of conductive waters from the clear resistivity anomalies. The overlying Mukarob is K clay rich and less porous, as is usual. The Upper Mukarob is seen by its usual upward coarsening sequence. No A1 Auob Member can be clearly interpreted and units A1 to A4 are
Chapter 6 Test Borehole
6 - 18
lumped into a unit, which is less porous than is usual for the Auob. The unit appears to be upward coarsening. A strong radiometric anomaly is seen at the base of the Auob Mukarob contact. The A5 unit can be distinguished by elevated porosity. A radiometric anomaly is present at the base of the Kalahari Auob contact.
8) Location No. J-9
Hole conditions are poor as is evidence by the caliper log. The basal formation from the high porosities measured is interpreted as Auob. There is a strong drop in temperature at the bottom of the hole indicating ingress of ground water. A strong change in density is apparent when moving into the overlying basalts. The basalt resistivities are active. Weathered basalt has the expected density decrease.
6.1.8 Result of Drilling
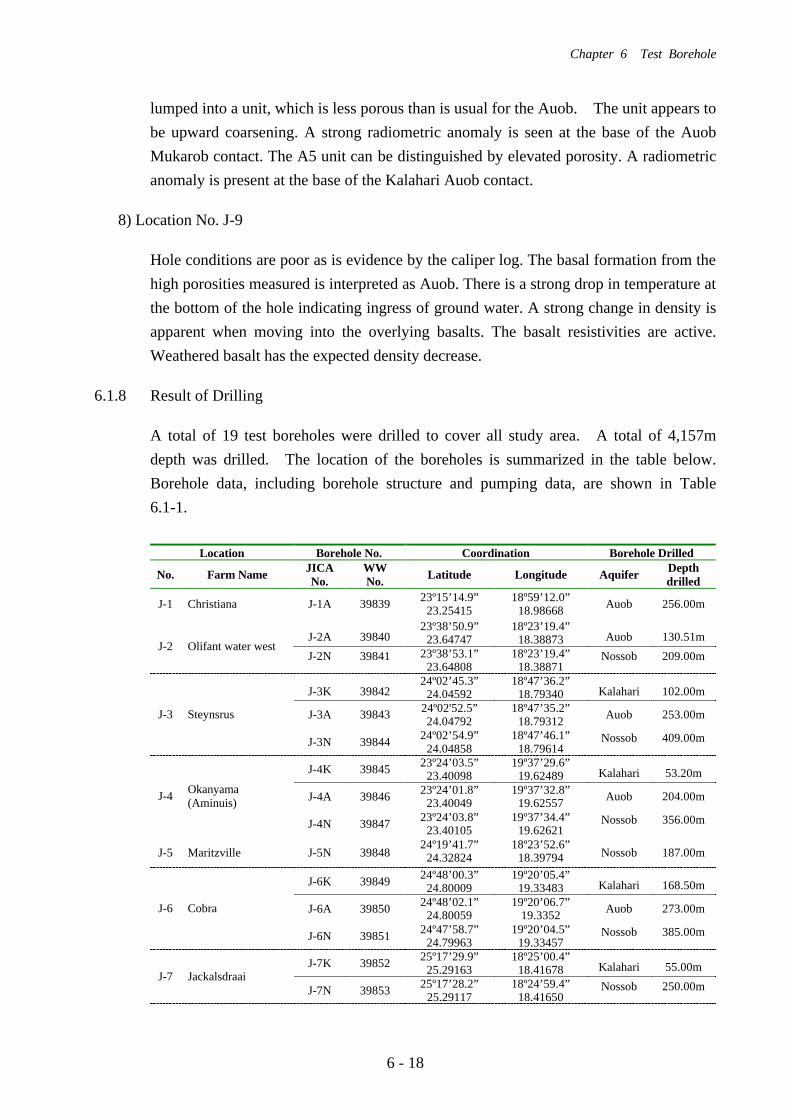
A total of 19 test boreholes were drilled to cover all study area. A total of 4,157m depth was drilled. The location of the boreholes is summarized in the table below. Borehole data, including borehole structure and pumping data, are shown in Table 6.1-1.
Location Borehole No. Coordination Borehole Drilled
No. Farm Name JICA No.
WW No. Latitude Longitude Aquifer Depth
drilled
J-1 Christiana J-1A 39839 23º15’14.9” 23.25415
18º59’12.0” 18.98668 Auob 256.00m
J-2A 39840 23º38’50.9”
23.64747 18º23’19.4”
18.38873 Auob 130.51m J-2 Olifant water west
J-2N 39841 23º38’53.1” 23.64808
18º23’19.4” 18.38871
Nossob 209.00m
J-3K 39842 24º02’45.3”
24.04592 18º47’36.2”
18.79340 Kalahari 102.00m
J-3A 39843 24º02'52.5” 24.04792
18º47’35.2” 18.79312 Auob 253.00m J-3 Steynsrus
J-3N 39844 24º02’54.9” 24.04858
18º47’46.1” 18.79614
Nossob 409.00m
J-4K 39845 23º24’03.5” 23.40098
19º37’29.6” 19.62489 Kalahari 53.20m
J-4A 39846 23º24’01.8” 23.40049
19º37’32.8” 19.62557 Auob 204.00m J-4 Okanyama
(Aminuis)
J-4N 39847 23º24’03.8” 23.40105
19º37’34.4” 19.62621
Nossob 356.00m
J-5 Maritzville J-5N 39848 24º19’41.7”
24.32824 18º23’52.6”
18.39794 Nossob 187.00m
J-6K 39849 24º48’00.3” 24.80009
19º20’05.4” 19.33483 Kalahari 168.50m
J-6A 39850 24º48’02.1” 24.80059
19º20’06.7” 19.3352 Auob 273.00m J-6 Cobra
J-6N 39851 24º47’58.7” 24.79963
19º20’04.5” 19.33457
Nossob 385.00m
J-7K 39852 25º17’29.9” 25.29163
18º25’00.4” 18.41678 Kalahari 55.00m
J-7 Jackalsdraai J-7N 39853 25º17’28.2”
25.29117 18º24’59.4”
18.41650 Nossob 250.00m
Chapter 6 Test Borehole
6 - 19
J-8K 39854 25º27’40.4” 25.46122
19º25’57.6” 19.43266 Kalahari 129.00m
J-8A 39855 25º27’42.3” 25.46174
19º26’01.4” 19.43373 Auob 250.00m J-8 Tweerivier
J-8N 39856 25º27’41.3” 25.46148
19º25’59.7” 19.43324
Nossob 346.00m
J-9 Klein Swart Modder J-9A 39857 24º00’06.5” 24.00182
18º12’55.0” 18.21529 Auob 141.50m
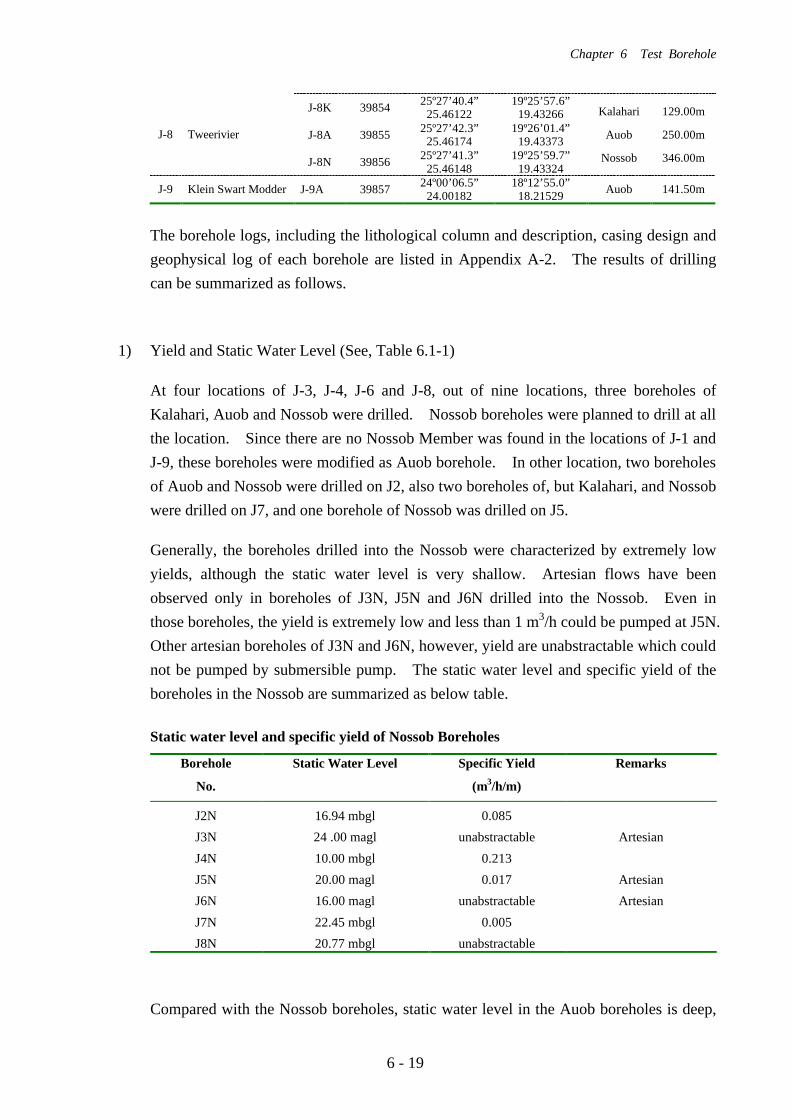
The borehole logs, including the lithological column and description, casing design and geophysical log of each borehole are listed in Appendix A-2. The results of drilling can be summarized as follows.
1) Yield and Static Water Level (See, Table 6.1-1)
At four locations of J-3, J-4, J-6 and J-8, out of nine locations, three boreholes of Kalahari, Auob and Nossob were drilled. Nossob boreholes were planned to drill at all the location. Since there are no Nossob Member was found in the locations of J-1 and J-9, these boreholes were modified as Auob borehole. In other location, two boreholes of Auob and Nossob were drilled on J2, also two boreholes of, but Kalahari, and Nossob were drilled on J7, and one borehole of Nossob was drilled on J5.
Generally, the boreholes drilled into the Nossob were characterized by extremely low yields, although the static water level is very shallow. Artesian flows have been observed only in boreholes of J3N, J5N and J6N drilled into the Nossob. Even in those boreholes, the yield is extremely low and less than 1 m3/h could be pumped at J5N. Other artesian boreholes of J3N and J6N, however, yield are unabstractable which could not be pumped by submersible pump. The static water level and specific yield of the boreholes in the Nossob are summarized as below table.
Static water level and specific yield of Nossob Boreholes
Borehole
No.
Static Water Level
Specific Yield
(m3/h/m)
Remarks
J2N 16.94 mbgl 0.085
J3N 24 .00 magl unabstractable Artesian
J4N 10.00 mbgl 0.213
J5N 20.00 magl 0.017 Artesian
J6N 16.00 magl unabstractable Artesian
J7N 22.45 mbgl 0.005
J8N 20.77 mbgl unabstractable
Compared with the Nossob boreholes, static water level in the Auob boreholes is deep,

Chapter 6 Test Borehole
6 - 20
especially in south of the study area of J6A and J8A. Specific yield of them is generally higher than that of the Nossob boreholes. Very high specific yield was observed on J4A and J9A, it is 4 m3/h/m and 15m3/h/m respectively. These boreholes are remarkable in the area, and indicate a high potential aquifer. J6A and J8A show very deep static water level and low yield. In these boreholes, screen pipes were installed only A1 bed, whereas other all boreholes have screen pipes at all Auob sequence. J2 shows also very low yield, although pipes were installed all Auob sequence. The static water level and specific yield of Auob boreholes are summarized as below table.
Static water level and specific yield of Auob Boreholes
Borehole
No.
Static Water Level
Specific Yield
(m3/h/m)
Remarks
J1A 57.49 mbgl 0.741 All Auob sequence
J2A 16.94 mbgl 0.089 All Auob sequence
J3A 15.77 mbgl 4.428 All Auob sequence
J4A 59.13 mbgl 0.965 All Auob sequence
J6A 104.41 mbgl 0.166 A1 bed only
J8A 172.32 mbgl unabstractable A1 bed only
J9A 2.23 mbgl 15.957 All Auob sequence
Kalahari boreholes show variety in it’s static water level and specific yield. The static water level and specific yield of Nossob boreholes are summarized as below table.
Static water level and specific yield of Auob Boreholes
Borehole
No.
Static Water Level
Specific Yield
(m3/h/m)
Remarks
J3K 19.35 1.50 Calcrete, Rietmond
J4K 45.1 0.018 Karoo Dolerite
Kalkland Basalt
J6K 101.98 0.145 Kalahari
J7K 10.04 0.761 Kalahari
J8K 60.31 0.061 Kalahari
2) Depth and Thickness of Each Formation (See, Table 6.1-2)
In the course of drilling at the each borehole, drill cutting samples were collected every
Chapter 6 Test Borehole
6 - 21
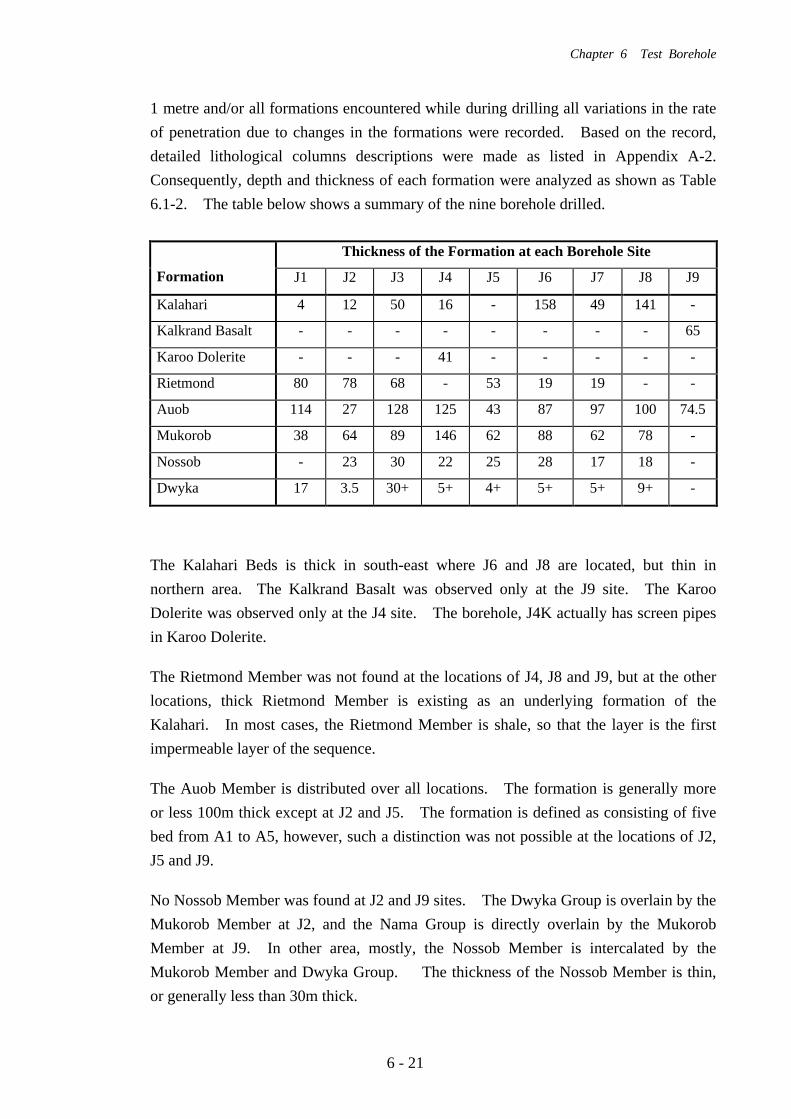
1 metre and/or all formations encountered while during drilling all variations in the rate of penetration due to changes in the formations were recorded. Based on the record, detailed lithological columns descriptions were made as listed in Appendix A-2. Consequently, depth and thickness of each formation were analyzed as shown as Table 6.1-2. The table below shows a summary of the nine borehole drilled.
Thickness of the Formation at each Borehole Site
Formation J1 J2 J3 J4 J5 J6 J7 J8 J9
Kalahari 4 12 50 16 - 158 49 141 -
Kalkrand Basalt - - - - - - - - 65
Karoo Dolerite - - - 41 - - - - -
Rietmond 80 78 68 - 53 19 19 - -
Auob 114 27 128 125 43 87 97 100 74.5
Mukorob 38 64 89 146 62 88 62 78 -
Nossob - 23 30 22 25 28 17 18 -
Dwyka 17 3.5 30+ 5+ 4+ 5+ 5+ 9+ -
The Kalahari Beds is thick in south-east where J6 and J8 are located, but thin in northern area. The Kalkrand Basalt was observed only at the J9 site. The Karoo Dolerite was observed only at the J4 site. The borehole, J4K actually has screen pipes in Karoo Dolerite.
The Rietmond Member was not found at the locations of J4, J8 and J9, but at the other locations, thick Rietmond Member is existing as an underlying formation of the Kalahari. In most cases, the Rietmond Member is shale, so that the layer is the first impermeable layer of the sequence.
The Auob Member is distributed over all locations. The formation is generally more or less 100m thick except at J2 and J5. The formation is defined as consisting of five bed from A1 to A5, however, such a distinction was not possible at the locations of J2, J5 and J9.
No Nossob Member was found at J2 and J9 sites. The Dwyka Group is overlain by the Mukorob Member at J2, and the Nama Group is directly overlain by the Mukorob Member at J9. In other area, mostly, the Nossob Member is intercalated by the Mukorob Member and Dwyka Group. The thickness of the Nossob Member is thin, or generally less than 30m thick.
Chapter 6 Test Borehole
6 - 22
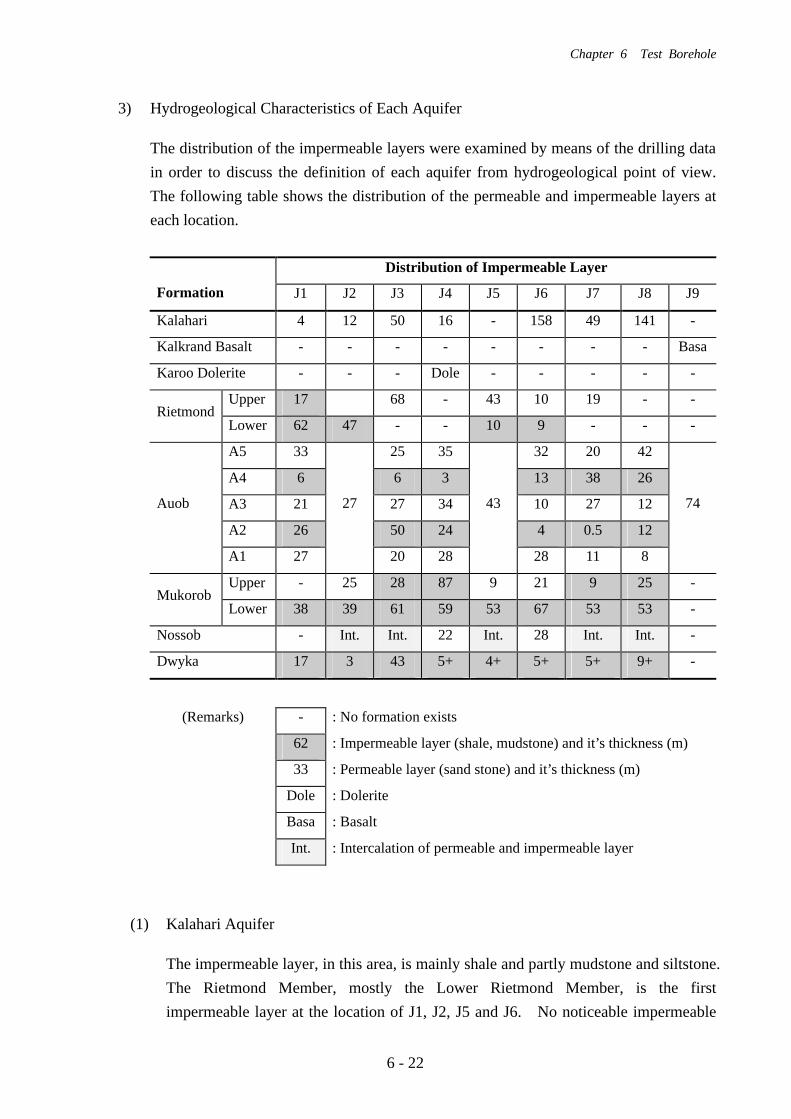
3) Hydrogeological Characteristics of Each Aquifer
The distribution of the impermeable layers were examined by means of the drilling data in order to discuss the definition of each aquifer from hydrogeological point of view. The following table shows the distribution of the permeable and impermeable layers at each location.
Distribution of Impermeable Layer
Formation J1 J2 J3 J4 J5 J6 J7 J8 J9
Kalahari 4 12 50 16 - 158 49 141 -
Kalkrand Basalt - - - - - - - - Basa
Karoo Dolerite - - - Dole - - - - -
Upper 17 68 - 43 10 19 - - Rietmond
Lower 62 47 - - 10 9 - - -
A5 33 25 35 32 20 42
A4 6 6 3 13 38 26
A3 21 27 34 10 27 12
A2 26 50 24 4 0.5 12
Auob
A1 27
27
20 28
43
28 11 8
74
Upper - 25 28 87 9 21 9 25 - Mukorob
Lower 38 39 61 59 53 67 53 53 -
Nossob - Int. Int. 22 Int. 28 Int. Int. -
Dwyka 17 3 43 5+ 4+ 5+ 5+ 9+ -
(Remarks) - : No formation exists
62 : Impermeable layer (shale, mudstone) and it’s thickness (m)
33 : Permeable layer (sand stone) and it’s thickness (m)
Dole : Dolerite
Basa : Basalt
Int. : Intercalation of permeable and impermeable layer
(1) Kalahari Aquifer
The impermeable layer, in this area, is mainly shale and partly mudstone and siltstone. The Rietmond Member, mostly the Lower Rietmond Member, is the first impermeable layer at the location of J1, J2, J5 and J6. No noticeable impermeable
Chapter 6 Test Borehole
6 - 23
layers were found between the Kalahari and Rietmond Member. At the location of J3, J4, J7, J8 and J9, moreover, A4 bed of the Auob Member is the first impermeable layer encountered. From the resistivity geophysical log, it is confirmed that the Kalahari Member is normally not saturated at most of sites, except at J6 and J8 where thick Kalahari Member is distributed. Further discussion is required in future stages of the project, however, to re-examine the definition of the Kalahari Aquifer.
(2) Auob Aquifer
The Auob Aquifer is found at all locations. The formation is generally more or less 100m thick, and consisting of five beds from A1 to A5, except, J2, J5 and J9. Among these beds, A4 and A2 are impermeable layers. The aquifer can be interpreted as comprising three permeable layers, and that are three different subaquifers compose the Auob Aquifer. At the sites, J2, J3, J4, J5, J7, J8 and J9, no impermeable layer was found between A5 and overlying formation, or between A1 and underlying formation. In order to re-examine the definition of the Auob Aquifer, further discussion will be required. It will be carried out during the works in Japan from the hydrogeological, hydrochemical and isotopic points of view.
(3) Nossob Aquifer
No Nossob Aquifer was found at the J2 and J9 sites. The aquifer is generally sandstone intercalated with shale, except at J4 and J6. The aquifer thickness is generally thin, and it is less than 30m. The aquifer is underlain by the impermeable Dwyka Group and overlain by also impermeable Mukorob Member. The Nossob Aquifer, therefore, can be interpreted as an individual aquifer of the area.
4) Water Samples, Taken from the Aquifers (See, Table 6.1-3)
Samples of groundwater were taken during pumping test. To obtain fresh groundwater samples, these samples are mainly taken at end of 72 hours constants discharge test. During drilling operation, moreover, when the water strike was encountered and if the hole wall situation allow to air lift the water, such samples were also collected. The samples taken were analyzed both chemical water quality and isotope analysis. Table 2.3-4 shows the details, such as the aquifer which water samples were taken, and items analyzed on each borehole. The table below shown is the summary of the samples taken from each borehole location. A total of 33 samples were collected and analysed.

Chapter 6 Test Borehole
6 - 24
Aquifer BH site Total Number. of
Water Samples
Collected
During drilling During test pumping
J1 2 A5 (1) Auob (1)
J2 3 upper Auob (1) Auob, Nossob (2)
J3 5 A5, A3 (2) Kalahari, Auob, Nossob (3)
J4 4 A5 (1) Kalahari, Auob, Nossob (3)
J5 3 upper Auob, lower Auob (2) Nossob (1)
J6 4 A5 (1) Kalahari, A1, Nossob (3)
J7 3 A3+A1 (1) Kalahari, Nossob (2)
J8 6 Kalahari, Kalahari+A5,
A3+A1 (3)
Kalahari, A1, Nossob (3)
J9 3 Kalahari, Kalahari+Auob (2) Auob (1)
Total 33 14 19
Note: Figures in ( ) show number of samples collected.
5) Result of Chemical and Isotope Analysis the Aquifers (See, Table 6.1-4, and 6.1-5)
The result of chemical analysis and isotope analysis are shown in Table 6.1-4 for the samples taken by the pumping test, and Table 6.1-5 for the samples taken during drilling operation.