6.1 Bioinformatics Databases and Tools - Introductionrshamir/algmb/archive/bioinfo_tools.pdf · 6.1...
31
Algorithms for Molecular Biology Fall Semester, 2001 Lecture 6: December ,28, 2001 Lecturer: Racheli Zakarin and Roded Sharan Scribe: Ofer Molad and Yuval Altman 1 6.1 Bioinformatics Databases and Tools - Introduction In recent years, biological databases have greatly developed, and became a part of the bi- ologist’s everyday toolbox (see, e.g., [4]). There are several reasons to search databases, for instance: 1. When obtaining a new DNA sequence, one needs to know whether it has already been deposited in the databanks fully or partially, or whether they contain any homologous sequences(sequences which are descended from a common ancestor). 2. Some of the databases contain annotation which has already been added to a specific sequence. Finding annotation for the searched sequence or its homologous sequences can facilitate its research. 3. Find similar non-coding DNA stretches in the database: for instance repeat elements or regulatory sequences. 4. Other uses for specific purpose, like locating false priming sites for a set of PCR oligonucleotides. 5. Search for homologous proteins - proteins similar in their sequence and therefore also in their presumed folding or structure or function. Topics covered in this lecture: 1. Primary sequence databases - Protein databases and nucleotide databases. Character- istics and specific examples. 2. Text based searching - Motivation. Tools for textual search. 3. Sequence based searching - Query types. FastA, Blast, SW. 4. Significance of scores - Analysis of scoring models for sequence alignment. 1 Based on scribe by Naomi Keren and Guy Kol, winter 2000, and on lecture slides by Dr. Racheli Kreisberg-Zakarin, fall 2001.
Transcript of 6.1 Bioinformatics Databases and Tools - Introductionrshamir/algmb/archive/bioinfo_tools.pdf · 6.1...

Algorithms for Molecular Biology Fall Semester, 2001
Lecture 6: December ,28, 2001Lecturer: Racheli Zakarin and Roded Sharan Scribe: Ofer Molad and Yuval Altman1
6.1 Bioinformatics Databases and Tools - Introduction
In recent years, biological databases have greatly developed, and became a part of the bi-ologist’s everyday toolbox (see, e.g., [4]). There are several reasons to search databases, forinstance:
1. When obtaining a new DNA sequence, one needs to know whether it has already beendeposited in the databanks fully or partially, or whether they contain any homologoussequences(sequences which are descended from a common ancestor).
2. Some of the databases contain annotation which has already been added to a specificsequence. Finding annotation for the searched sequence or its homologous sequencescan facilitate its research.
3. Find similar non-coding DNA stretches in the database: for instance repeat elementsor regulatory sequences.
4. Other uses for specific purpose, like locating false priming sites for a set of PCRoligonucleotides.
5. Search for homologous proteins - proteins similar in their sequence and therefore alsoin their presumed folding or structure or function.
Topics covered in this lecture:
1. Primary sequence databases - Protein databases and nucleotide databases. Character-istics and specific examples.
2. Text based searching - Motivation. Tools for textual search.
3. Sequence based searching - Query types. FastA, Blast, SW.
4. Significance of scores - Analysis of scoring models for sequence alignment.
1Based on scribe by Naomi Keren and Guy Kol, winter 2000, and on lecture slides by Dr. RacheliKreisberg-Zakarin, fall 2001.

2 Algorithms for Molecular Biology c©Tel Aviv Univ.
5. Multiple sequence alignments - Motivation. Techniques. Examining the ClustalW tool.
6. secondary databases - Databases of high level data representation. Examples.
6.2 Primary sequence databases
6.2.1 Introduction
In the early 1980’s, several primary database projects evolved in different parts of the world(see table 6.1). There are two main classes of databases: DNA (nucleotide) databases andprotein databases. The primary sequence databases have grown tremendously over the years.
DNA (nucleotide) ProteinEMBL UK PIR USGenBank US MIPS GermanyDDBJ Japan Swiss-Prot SwissCelera Celera TrEMBL Swiss
NRL 3D USGenPept US
Table 6.1: List of primary sequence databases and their locations.
Today they suffer from several problems, unpredicted in early years (when their sizes weremuch smaller):
• Databases are regulated by users rather than by a central body (except for Swiss-Prot).
• Only the owner of the data can change it.
• Sequences are not up to date.
• Large degree of redundancy in databases and between databases.
• Lack of standard for fields or annotation.
6.2.2 Protein Databases (Amino Acid Sequence)
PIR - International Protein Sequence Database)
PIR - The Protein Sequence Database [20] was developed in the early 1960’s. It is located atthe National Biomedical Research Foundation (NBRF). Since 1988 it has been maintainedby PIR-International (see [21]).
PIR currently contains 250,417 entries (Release 70.0, September 30, 2001). It is split intofour distinct sections, that differ in quality of the data and the level of annotation:

Primary sequence databases 3
PIR1 - fully classified and annotated entries.
PIR2 - preliminary entries, not thoroughly reviewed.
PIR3 - unverified entries, not reviewed.
PIR4 - conceptual translations.
PIR home page: [20]. For a sample PIR entry, see [23].
Swiss-Prot
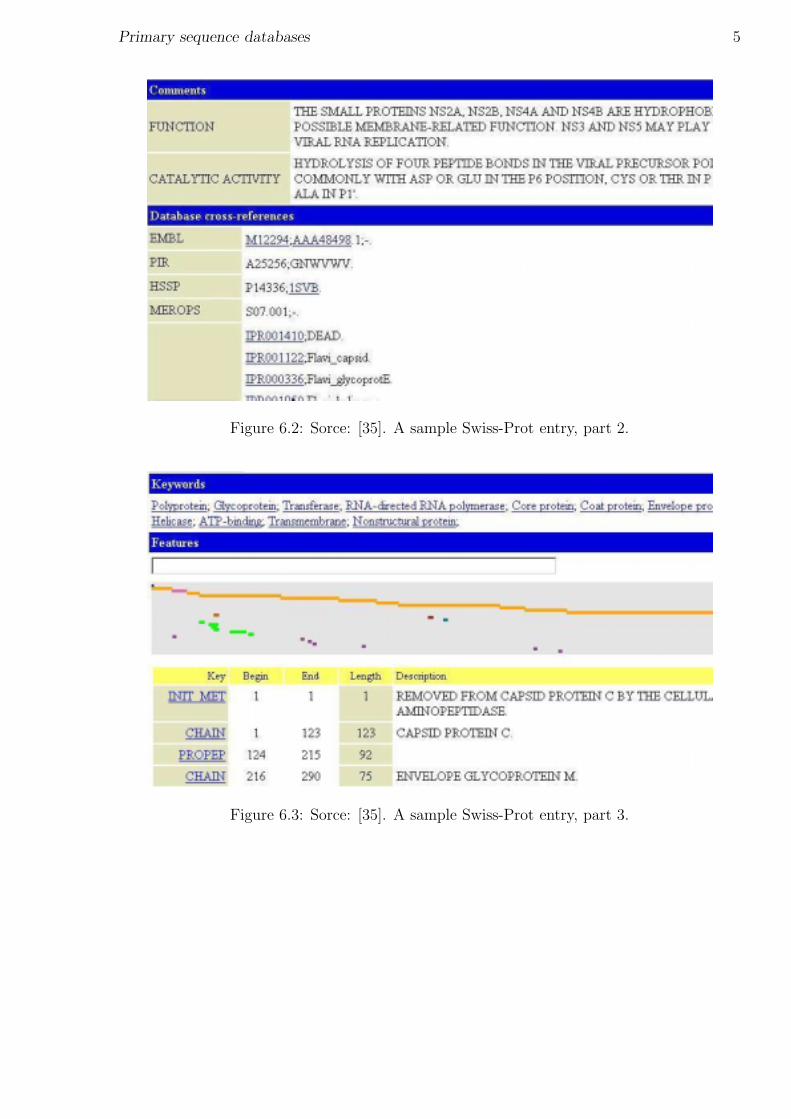
Swiss-Prot (home page: [35]) was established in 1986. It is maintained collaboratively bySIB (Swiss Institute of Bioinformatics) and EBI/EMBL. Provides high-level annotations,including description of protein function, structure of protein domains, post-translationalmodifications, variants, etc. It aims to be minimally redundant. Swiss-Prot is linked tomany other resources, including other sequence databases. For a sample entry, see figures6.1, 6.2, 6.3.
TrEMBL - Translated EMBL
Translated EMBL (home page: [36]) was created in 1996 as a computer annotated supple-ment to Swiss-Prot. It contains translations of all coding sequences in the EMBL nucleotidesequence database. SP-TrEMBL contains entries that will be incorporated into Swiss-ProtREM-TrEMBL contains entries that are not destined to be included in Swiss-Prot, (for exam-ple, T-cell receptors, patented sequences). The entries in REM-TrEMBL have no accessionnumber.
GenPept
GenPept is a supplement to the GenBank nucleotide sequence database. Its entries are trans-lation of coding regions in GenBank entries. They contain minimal annotation, primarilyextracted from the corresponding GenBank entries. For the complete annotations, one mustrefer to the GenBank entry or entries referenced by the accession number(s) in the GenPeptentry. For a sample GenPet entry, see [9].
NRL 3D
NRL 3D is produced and maintained by PIR. It contains sequences extracted from theProtein DataBank (PDB) (see [45]). The entries include secondary structure, active site,binding site and modified site annotations, details of experimental method, resolution, R-factor, etc. NRL 3D makes the sequence data in the PDB available for both text based and

4 Algorithms for Molecular Biology c©Tel Aviv Univ.
Figure 6.1: Sorce: [35]. A sample Swiss-Prot entry, part 1.
sequence-based searching. It also provides cross-reference information for use with the otherPIR Protein Sequence Databases. For NRL 3D information, and sample entry, see [22].
Summary of protein sequence databases
• PIR(1-4) - comprehensive, poor quality of annotation (even in PIR1).
• Swiss-Prot - poor sequence coverage, highly structured, excellent annotation.
• GenPept most comprehensive, poor quality of annotation.
• NRL 3D - least comprehensive but is directly relating to structural information.
When searching for a protein sequence, it is recommended to search all databases.
Primary sequence databases 5
Figure 6.2: Sorce: [35]. A sample Swiss-Prot entry, part 2.
Figure 6.3: Sorce: [35]. A sample Swiss-Prot entry, part 3.

6 Algorithms for Molecular Biology c©Tel Aviv Univ.
6.2.3 DNA Databases (Nucleotide Sequences)
The growth rate of DNA databases is much higher than that of the protein databases. This isbecause most of the DNA is not coding for proteins and because DNA sequencing is the mostprominent source of database entries. Figure 6.4 illustrates the semi-exponential growth ofDNA databases along the years.
Figure 6.4: Sorce: [29]. The DNA database growth.
The large DNA databases are: Genbank (US), EMBL (Europe - UK), DDBJ (Japan).These databases are quite similar regarding their contents and are updating one anotherperiodically. This was is a result of the International Nucleotide Sequence Database Collab-oration.
EMBL
EMBL is a DNA sequence database from European Bioinformatics Institute (EBI). See EBIhome page: [30]. EMBL includes sequences from direct submissions, from genome sequencingprojects, scientific literature and patent applications. Its growth is exponential, on 3.12.01 itcontained 15,386,184,380 bases in 14,370,773 records. EMBL supports several retrieval tools:SRS for text based retrieval and Blast and FastA for sequence based retrieval. See [31] formore information and for a sample EMBL entry. EMBL is divided into several divisions.

Primary sequence databases 7
The division differ by the amount of sequences and by the quality of the data. See figure 6.5for division statistics.
Figure 6.5: Sorce: [31]. EMBL divisions and number of bases in each division.
GenBank
GenBank is a DNA sequence database from National Center Biotechnology Information(NCBI). See NCBI home page: [38]). It incorporates sequences from publicly availablesources (direct submission and large-scale sequencing). Like EMBL it is also split intosmaller, discrete divisions (see table 6.2). This facilitates an efficient search. See [43] formore information and for a sample GenBank entry.
Genome databases of specific organisms
These are smaller databases that present an integrated view of a particular biological system.Here, sequence data is only the first level of abstraction; It contains other levels of biological

8 Algorithms for Molecular Biology c©Tel Aviv Univ.
Division Code DescriptionPRI primate sequencesROD rodent sequencesMAM other mammalian sequencesVRT other vertebrate sequencesINV invertebrate sequencesPLN plant, fungal, and algal sequencesBCT bacterial sequencesRNA structural RNA sequencesVRL viral sequencesPHG bacteriophage sequencesSYN synthetic sequencesUNA unannotated sequencesEST EST sequences (expressed sequence tags)PAT patent sequencesSTS STS sequences (sequence tagged sites)GSS GSS sequences (genome survey sequences)HTG HTGS sequences (high throughput genomic sequences)
Table 6.2: Source: [8]. GenBank divisions. The biggest division is the EST; Due to its rapidgrowth, it is divided into 23 pieces.
information. This leads to an overall understanding of the genome organization. An exampleis the Flybase, a comprehensive biological database of the Drosophila (see [18]).
Glossary
ESTs (Expressed Sequence Tags) - Short fragments of mRNA samples that are takenfrom a variety of tissues and organisms. These samples are amplified and sequenced.The sequencing is done in one read pass, therefore the ESTs are a non-accurate sourceof information. There are about 6 million sequenced ESTs (more than 1/3 cloned fromhuman) .
STSs (Sequence-Tagged Sites) - Short genomic samples that serve as genomic markers.
HTGS (High Throughput Genomic Sequences) - Sequences obtained in the course ofsequencing the whole genome. The records of this databases are classified accordingto their level of advancement towards sequence completion.Phase 0 - Single or few pass reads of a single clone (not contigs).Phase 1 - Unfinished, may be unordered, unoriented contigs, with gaps.

Text based searching 9
Phase 2 - Unfinished, ordered, oriented contigs, with or without gaps.Phase 3 - Finished, no gaps (with or without annotation).
6.3 Text based searching
6.3.1 How to Perform Database-Searching?
As the amount of biological relevant data is increasing so rapidly, knowing how to accessand search this information is essential. The two main ways of searching are:
Text based search - Searching the annotations. Examples: SRS, GCG’s Lookup, Entrez.
Sequence based search - Searching the sequence itself. Examples: Blast, FastA, SW.
6.3.2 Text based retrieval tools
The listed retrieval systems allow text searching in a multitude of molecular biology databaseand provide links to relevant information for entries that match the search criteria. Thesystems differ in the databases they search and the links they have to other information.
SRS (Sequence Retrieval System)
SRS had been developed at the EBI. It provides a homogeneous interface to over 80 biologicaldatabases (see SRS help at [25]). It includes databases of sequences, metabolic pathways,transcription factors, application results (like BLAST, SSEARCH, FASTA), protein 3-Dstructures, genomes, mappings, mutations, and locus specific mutations. For each of the 80available databases, there is a short description, including its last release. Before entering aquery, one selects one or more of the databases to search. It is possible to send the queryresults as a batch query to a sequence search tool. The SRS is highly recommended for use.SRS entrance page: [24].
Entrez
Entrez is a molecular biology database and retrieval system, developed by the NCBI (seeEntrez help at [42]). It is an entry point for exploring the NCBI’s integrated databases. TheEntrez is easy to use, but unlike SRS, the search is limited. It does not allow customizationwith an institutes preferred databases. Entrez entrance page: [41].

10 Algorithms for Molecular Biology c©Tel Aviv Univ.
6.4 Sequence Based Searching
DNA search versus Protein search
The straight forward technique to search a DNA sequence is to search it against DNAdatabases. However, it is possible to translate a coding DNA sequence into a protein se-quence, and then search it against protein databases. Let us compare the two techniques:
• A DNA sequence is a string of length n over an alphabet of size 4. Its protein translationis a string of length n/3 over an alphabet of size 20. Statistically, the expected numberof random matches in some arbitrary database is larger for a DNA sequence.
• DNA databases are much larger than protein databases, and they grow faster. Thisalso means more random hits.
• Translation of a DNA sequence to a protein sequence causes loss of information.
• Protein sequences are more biologically preserved than DNA sequences.
Bottom line: Translating DNA to a protein yields better search results. When possible (i.e.for a coding DNA sequence), it is the recommended technique.
Protein sequences are always searched against protein databases. Translating them toDNA is ambiguous and results in a large number of possible DNA sequences. The analysisin the previous paragraph also discourages translation to DNA.
Homology modeling
As stated, a primary goal of sequence search is to find sequences which are homologous tothe query sequence. Such a homologous sequence shares sequence similarity with the querysequence. The similarity is derived from common ancestry and conservation throughoutevolution. Homologous proteins are similar in their structure. This is the basis for homologymodeling structure determination through the structure of similar proteins.
Evaluating search tools
The main goal in searching is finding the relevant information and avoiding non relevantinformation. We therefore define:
Sensitivity - The ability to detect “true positive” matches . The most sensitive search findsall true matches, but might have lots of “false positives”.
Specificity - The ability to reject “false positive” matches. The most specific search willreturn only true matches, but might have lots of “false negatives”.

Sequence Based Searching 11
When one chooses which algorithm to use, there is a trade off between these two figures ofmerit. It is quiet trivial to create an algorithm which will optimize one of these properties.The problem is to create an algorithm that will perform well with respect to both of them.A second criteria for evaluating algorithm is its time performance.
We will examine three main search tools: FastA (better for nucleotides than for proteins),BLAST (better for proteins than for nucleotides) and SW-search (more sensitive than FastAor BLAST, but much slower).
6.4.1 FastA
FastA is a sequence comparison software that uses the method of Pearson and Lipman [6].The basic FastA algorithm assumes a query sequence and a database over the same alphabet.Practically, FastA is a family of programs, allowing also cross queries of DNA versus protein.The program variants are listed in table 6.3.
PROGRAM FUNCTION
fasta3 scan a protein or DNA sequence library for similar sequencesfastx/y3 compare a DNA sequence to a protein sequence database, comparing the
translated DNA sequence in forward and reverse frames.tfastx/y3 compares a protein to a translated DNA data bankfasts3 compares linked peptides to a protein databankfastf3 compares mixed peptides to a protein databank
Table 6.3: Source: [33]. Variants of the FastA algorithm. Note: fastx3 uses a simpler,faster algorithm for alignments that allows frameshifts only between codons; fasty3 is slowerbut produces better alignments with poor quality sequences because frameshifts are allowedwithin codons (source: [32]).
Under different circumstances it is favorable to use different programs:
• To identify an unknown protein sequence use either FastA3 or tFastX3.
• To identify structural DNA sequence: (repeated DNA, structural RNA) use FastA3,first with ktup = 6 and then with ktup = 3.
• To identify an EST use FastX3 (check whether the EST codes for a protein homologousto a known protein).
• Use ktup = 1 for oligonucleotides (length < 20).
FastA3 (Fastx3, etc.) is the current version of FastA. FastA is available directly viathe FastA3 server [28], or it can be accessed through one of the retrieval systems ,e.g., theGenWeb mirror site at the Weizmann Institute [16].

12 Algorithms for Molecular Biology c©Tel Aviv Univ.
Figure 6.6: Sorce: [28]. FastA query screen. A - Default gap opening penalty: −12 forproteins, −16 for DNA. Default gap extension penalty: −2 for proteins, −4 for DNA. B -Max number of scores and alignments is 100. C - The larger the word-length the less sensi-tive, but faster the search will be. D - Default matrix: Blosum50. Lower PAM and higherblosum detect close sequences. Higher PAM and lower blosum detect distant sequences.
Sequence Based Searching 13
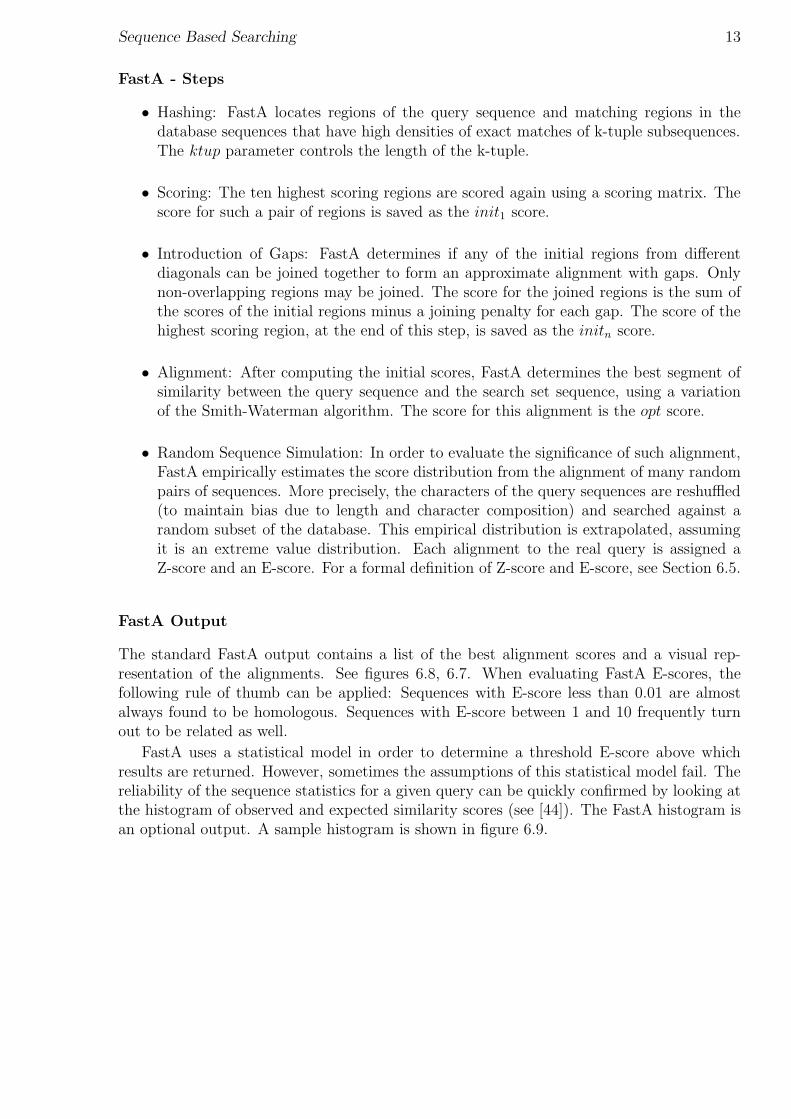
FastA - Steps
• Hashing: FastA locates regions of the query sequence and matching regions in thedatabase sequences that have high densities of exact matches of k-tuple subsequences.The ktup parameter controls the length of the k-tuple.
• Scoring: The ten highest scoring regions are scored again using a scoring matrix. Thescore for such a pair of regions is saved as the init1 score.
• Introduction of Gaps: FastA determines if any of the initial regions from differentdiagonals can be joined together to form an approximate alignment with gaps. Onlynon-overlapping regions may be joined. The score for the joined regions is the sum ofthe scores of the initial regions minus a joining penalty for each gap. The score of thehighest scoring region, at the end of this step, is saved as the initn score.
• Alignment: After computing the initial scores, FastA determines the best segment ofsimilarity between the query sequence and the search set sequence, using a variationof the Smith-Waterman algorithm. The score for this alignment is the opt score.
• Random Sequence Simulation: In order to evaluate the significance of such alignment,FastA empirically estimates the score distribution from the alignment of many randompairs of sequences. More precisely, the characters of the query sequences are reshuffled(to maintain bias due to length and character composition) and searched against arandom subset of the database. This empirical distribution is extrapolated, assumingit is an extreme value distribution. Each alignment to the real query is assigned aZ-score and an E-score. For a formal definition of Z-score and E-score, see Section 6.5.
FastA Output
The standard FastA output contains a list of the best alignment scores and a visual rep-resentation of the alignments. See figures 6.8, 6.7. When evaluating FastA E-scores, thefollowing rule of thumb can be applied: Sequences with E-score less than 0.01 are almostalways found to be homologous. Sequences with E-score between 1 and 10 frequently turnout to be related as well.
FastA uses a statistical model in order to determine a threshold E-score above whichresults are returned. However, sometimes the assumptions of this statistical model fail. Thereliability of the sequence statistics for a given query can be quickly confirmed by looking atthe histogram of observed and expected similarity scores (see [44]). The FastA histogram isan optional output. A sample histogram is shown in figure 6.9.

14 Algorithms for Molecular Biology c©Tel Aviv Univ.
Figure 6.7: Sorce: [28]. A sample FastA output: alignment scores. Column 1-3 detail thename and annotation of the record. Columns 4-7 are the FastA scores.
Figure 6.8: Sorce: [28]. A sample FastA output: alignment of the query sequence againstthe result sequences.

Sequence Based Searching 15
Figure 6.9: Source: [44]. Histogram of FASTA3 similarity scores - Results of search of aDrosophila class-theta glutathione transferase against the annotated PIR1 protein sequencedatabase. The initial histogram output is shown. The shaded section indicates the regionthat is most likely to show discrepancies between observed and expected number of scoreswhen the statistical model fails.

16 Algorithms for Molecular Biology c©Tel Aviv Univ.
6.4.2 BLAST - Basic Local Alignment Search Tool
Blast programs use a heuristic search algorithm. The programs use the statistical methodsof Karlin and Altschul [2]. BLAST programs were designed for fast database searching,with minimal sacrifice of sensitivity for distantly related sequences. The programs searchdatabases in a special compressed format. It is possible to use one’s private database withBLAST. To this it is required to convert it to the BLAST format. Direct pointer: TheBLAST at NCBI [39]. BLAST can also be run through one of the retrieval systems (recom-mended). For example: GeneWeb mirror site at the Weizmann Institute [16].
BLAST is a family of programs. Table 6.4 details the BLAST variants and their use.
Goal/Question Database BLAST Program
Is the query sequencerepresented in thedatabase?
Choose a current nucleic aciddatabase. Select from amongorganism-specific (e.g.: yeast), in-clusive (e.g., nonredundant), orspecialized set (e.g., dbEST, db-STS, GSS, HTG) databases.
blastn.
Are there homologs orevolutionary relativesof the query sequencein the database? Arethere proteins whosefunction is related tothe query sequence?
Choose a protein database if thequery is protein or DNA ex-pected to encode a protein be-cause amino acid searches aremore sensitive.
blastp for amino acid queries;blastx for translated nucleic acidqueries. Use tblastn or tblastxfor comparisons of an amino acidor translated nucleic acid queryversus a translated nucleic aciddatabase.
Table 6.4: Source: [40]. Variants of BLAST.
The BLAST program compares the query to each sequence in database using heuristicrules to speed up the pairwise comparison. It first creates sequence abstraction by listingexact and similar words. BLAST finds similar words between the query and each databasesequence. It then extends such words to obtain high-scoring sequence pairs (HSPs) (BLASTparlance for local ungapped alignments). BLAST calculates statistics analytically, are cal-culated statistically like in FastA.
The BLAST graphical output is similar to FastA output. A sample output screen isshown in figure 6.10.
6.4.3 The Smith-Waterman Tool
Smith-Waterman (SW) searching method compares the query to each sequence in the database.SW uses the full Smith-Waterman algorithm for pairwise comparisons [7]. It also uses search

Sequence Based Searching 17
Figure 6.10: Sorce: [39]. A sample BLAST output screen. There are three sections: 1.A graphical representation of the alignments. 2. Scores: for each result a line containingname, annotation and BLAST scores. 3. Alignment of the query sequence against the resultssequence.

18 Algorithms for Molecular Biology c©Tel Aviv Univ.
results to generate statistics. Since SW searching is exhaustive, it is the slowest method. Aspecial hardware + software (Bioccelerator) is used to accelerate the application. A Bioc-celerator can be found in the TAU bio-informatics department. Direct pointer: [26]. It alsocan be run through the Weizmann Institute site [16].
6.4.4 Comparison of the Programs
• Concept:SW and BLAST produce local alignments, while FastA is a global alignment tool.BLAST can report more than one HSP per database entry, while FastA reports onlyone segment(match).
• Speed:BLAST > FastA � SWBLAST (package) is a highly efficient search tool.
• Sensitivity:SW > FastA > BLAST (old version!)FastA is more sensitive, missing less homologous sequences on the average (but theopposite can also happen - if there are no identical residues conserved, but this isinfrequent). It also gives better separation between true hits and random hits.
• Statistics:BLAST calculates probabilities, and it sometimes fails entirely if some of the assump-tions used are invalid. FastA calculates significance ’on the fly’ from the given datasetwhich is more relevant but can be problematic if the dataset is small.
6.4.5 Tips for DB Searches
• Use the latest database version.
• Run BLAST first, then depending on your results run a finer tool (FastA, Ssearch,SW, Blocks, etc.).
• Whenever possible, use protein or translated nucleotide sequences.
• E < 0.05 is statistically significant, usually biologically interesting. Check also0.05 < E < 10 because you might find interesting hits.
• Pay attention to abnormal composition of the query sequence, since it usually causesbiased scoring.
• Split large query sequences (> 1000 for DNA, > 200 for protein).

Significance of Scores 19
• If the query has repeated segments, remove them and repeat the search.
6.5 Significance of Scores
6.5.1 The Problem
An important question that software bioinformatics tools are trying to answer is how mean-ingful an alignment score is. A user may submit different queries into different databases,and it is important to find a means to estimate the how “significant” an alignment scoreis, regardless of the specific query or the specific database. This section will discuss thedifferent Statistical Enumerators that the different tools that are used in order to estimatethis significance level. Most of this section is based on an article by Pagni and Jongeneel [5].
A practical application of these statistical enumerators is setting the score threshold forthe results that are displayed in sequence search engines. This threshold should include mostpositive results, while minimizing the number of false positives –alignments that are includedin the list of results, but have no biological basis. The easy case is when the distributionof the scores for true alignments is very different from the distribution of the scores foralignments of random sequences (figure 1). A more complex case is when the true alignmentscore distribution and the random alignment score distribution share a common area alongthe score axis (figure 2). In this case it is hard to distinguish real alignments from randomalignments. In this case, a means of determining the confidence level of the score is crucial.
In applications such as profile building or PSI-BLAST, the determination of accurateconfidence scores is crucial. These applications make automated iterative use of results, inorder to generate more results. This makes errors, such as false positives, disastrous for thosealgorithms.
6.5.2 Statistical Estimators
This section will define the different types of statistical estimators used in the analysis ofthe validity of an alignment score.
Z-score
The Z-score is an old, yet commonly used statistical estimator for the validity of statisticalresults, including alignment scores. It is defined by the number of standard deviationsthat separate an observed score from the average random score. In other words, it is thedifference between the observed score and the average random score, normalized by thestandard deviation of the distribution. A higher Z-score means that the score can be trustedwith a higher confidence level.

20 Algorithms for Molecular Biology c©Tel Aviv Univ.
Figure 6.11: Easy Case: Illustration of an easy case of estimating significance. The score ofreally related records are distributed away from random records and thus can easily identified.
Figure 6.12: Complex Case: Illustration of a complex case of estimating significance. Thedark area represents the number of random records (shuffeled query sequnce) that exceedthe query score. In this case the common area betweeb the random plot and the real plot islarge, which makes it hard to distinguish between the real and random ones.

Significance of Scores 21
E-value
The E-value is the most frequently used statistical estimator for the validity of alignmentscores. It is defined as the expected number of false positives with a score higher than theobserved score. This value is dependant, obviously, on the number of random alignments,determined by the size of the aligned sequences. A lower E-value indicates that the scorehas a higher confidence level.
P-value
Once we have calculated the E-value, E, for a certain score, we can go one step further.The P-value is the probability of the observed score – the probability that a certain scoreoccurred by chance. To find a formula for the P-value, let us define a random variable YE
as the number of random records achieving an E-value of E or better. This random variablehas a Poisson distribution with the parameter λ=E. The probability that no random eventshave a lower score then our score, i.e. that YE = 0, decreases exponentially with our score -s. Therefore, that probability that at least one random record achieved a better score thenour E-value can be computed using the following simple formula [1]:
P = 1 − e−E
Like the E-value, this value is dependent on the size of the database. A lower P-valuemeans that the score has a higher confidence level. This estimator is not widely used fordetermining the validity of sequence alignment scores.
6.5.3 A model for gap free alignments
This section will first discuss the distribution of a gap free alignment of two random se-quences. Then it will introduce the extreme value distribution, an alternative model for thedistribution of maximal alignment score of a query against a database. Then it will discussthe difference between this distribution and the normal distribution, and give a few notes onwhen each model is valid.
The gap free alignment problem
The gap free alignment process of a two short random sequences can be described as a ran-dom walk (figure 3). A positive score is given for each match, and a negative score is givenfor each mismatch. We assume in this model that the expectation of the score is negative,or else longer random alignments would receive better scores than shorter alignments. Theprobability that such a random walk will achieve a score higher than a threshold x, de-creases exponentially with x. Thus the maximal gap free alignment problem for two randomsequences produces a negative exponential distribution.

22 Algorithms for Molecular Biology c©Tel Aviv Univ.
Figure 6.13: Random walk: The score for a match is +2 and the punishment for a mismatchis -1, As shown,the expectancy for the whole walk is negative. The probability that the TopScore will be larger than X decreases exponentially with x.
The Extreme Value Distribution
We now attempt to predict the distribution of the local alignment scores of two long se-quences. The following analysis is based on the work of Karlin and Altschul. [3] We canthink of this score as a maximum of many local alignment scores of short sequences. i.e.we are looking for the distribution of the maximum of many decreasing exponential randomvariables.
Given a set of independent and identically distributed random variables x1,x2. . . with adistribution that decays fast for large values of the xi’s (such as the exponential distribution),the distribution of
Xn ≡ max{x1, ...., xn}
was defined by Gambel [bib] as the extreme value distribution:
P (Xn > x) = 1 − exp(−Ke−λx)
where K and λ are parameters.This distribution does not depend on the specifics of the distributions of the xi’s. The
major feature of this density is that it is skewed. Unlike the normal distribution, which issymmetrical, this distribution has a “steeper” left tail, and a smoother “right” tail. Thisright tail can be estimated by a decreasing exponential. This feature is very useful for ourpurposes, because we are interested in large scores, and this approximation is much moreeasily computed in real application where response time is crucial.

Significance of Scores 23
6.5.4 The Gapped Alignment Problem
The common problem of gapped alignment is much more difficult than the problem of thegap free alignment. The extreme value distribution, which is an analytic model from the gapfree alignment, can be used to some extent in some gapped alignments, but not in others.Unfortunately, there is no analytic model for gapped alignments, though some measurementshad been conducted on random databases. This measurements lead to some interestingresults. The results show that the Extreme Value distribution model can be applied tohigher gap penalties, while the normal distribution is better for lower gap penalties. In fact,we witness two distinct phases in our models. Lower gap penalties correspond with thenormal distribution, higher gap penalties with the Extreme Value distribution, and thereare almost no gap penalties in between.
6.5.5 Models Used in Popular Tools
BLASTN
This tool simply ignores the gap penalties in its E-value estimation. This allows it to relyheavily on the analytic model of the extreme value distribution. The parameters of thedistribution can be calculated analytically from the problem parameters. : Specifically, thelength of the sequences and the similarity matrix. After finding the distribution, BLASTNcalculates the bit score:
B =λS − ln K
ln 2
This score, unlike the raw score, is measured in standard units, and is independent ofthe distribution, and thus it is more instructive. Clearly, it is linear to the raw score. Sincethe E-scores are a decreasing exponential to the raw scores, the E-score is derived from thefollowing approximation, taking into consideration the length of the aligned sequences:
E = mn2−B
where m is the database length, n is the query length.
FASTA
Unlike BLASTN, which uses a statistical model with an extensive theory behind it, FASTAattempts to give good estimates for e-values using values of tens of thousands of random se-quences aligned during the course of the algorithm. The FASTA algorithm uses the followingsteps for the estimation:

24 Algorithms for Molecular Biology c©Tel Aviv Univ.
• Random alignment scores are collected through the course of the algorithm. This ispossible because FASTA has a heuristic, which produces alignment scores for pairs ofsequences very quickly. FASTA assumes that the searched database is large enough,so a heterogeneous sample of scores is collected.
• Scores are assigned into bins of a histogram based on the length of the sequencematched. The best scores are removed from each bin, so that possible “positive”scores will not be taken into account, since we are interested in finding the number ofexpected false positives above our score.
• The expected value of a random alignment against the database is calculated. Theexpected value is the result of a linear regression of the data against the logarithm ofthe length of the sequence.
• For each score alignment score for which FASTA needs an E-value, FASTA first cal-culates the Z-value. This is done using the standard deviation of the random scoresfrom the expected value of a random alignment with the same length of the analyzedalignment.
• The conversion of the Z-value into E-value follows the assumption that the distri-bution of the random scores is an Extreme Value Distribution. To get the E-value,FASTA multiplies the number of sequences in the database by the probability that suchsequence will have a value higher then our score. This probability can be directly cal-culated from the number of standard deviations separating our score from the averagescore.
6.6 Multiple sequence alignments
6.6.1 Introduction
Sometimes it is necessary to align a number of sequences, in order to identify regions ofhomology between them. From the Biologist point of view, this alignment is an importanttool in characterizing protein families, determining consensus sequences, finding secondaryand tertiary structure of new sequences, and construction of phylogenetic trees according tothe similarity level between within the aligned sequences.
There are two different approaches to multiple sequence alignment. The first – alignmentof similar sequences of nucleotides or amino acids, taking into account physio-chemical prop-erties and mutation data. The Second – alignment of sequences solely according to secondaryand tertiary structure. The resulting alignment can, understandably, differ greatly betweenthe two approaches.

Secondary Databases 25
6.6.2 Multiple Sequence Alignment Tools
ClustalW [27] is popular software for multiple sequence alignment. It can be used on eitherDNA or proteins. The output of ClustalW is a multiple alignment, shown graphically,and it can even construct phylogenetic trees according to the alignment. ClustalW createsalignments in a format called GCG. However, most alignment software and viewers usesanother format, the Fasta format. The program tofasta [10] converts files from GCG formatto fasta format.
The program JalView [15] is an excellent multiple alignment viewer. It uses colors todistinguish regions of homology from regions that are less similar.
6.7 Secondary Databases
There are various databases containing secondary structure information. Each has its ad-vantages and disadvantages, so it is advisable to try more than one database when searching.This section will show some popular databases.
6.7.1 Prosite
The Prosite database [37] is based on SwissPort and thus is very well annotated, but small.Characterization of protein families is done by the single most conserved motif observed ina multiple sequence alignment of known homologous. These conserved motifs usually relateto biological functions such as active sites or binding sites. The search in Prosite does notrequire an exact match in structure. Prosite enables searches using complex patterns. It ispossible to search textually using regular expressions for names of known proteins, etc. It isalso possible to scan a protein sequence using prosite for structural pattern matches. Thedatabase is well cross-linked to SwissProt and TrEMBL.
6.7.2 FingerPrints
Unlike Prosite, FingerPrints has an improved diagnostic reliability which is achieved by usingmore than one conserved structural motif to characterize a protein family. With FingerPrints,many motifs are encoded using ungapped and unweighed local alignments.
The input to FingerPrints is a small multiple alignment, which has some conserved motifs.These motifs are searched for in the database, and only sequences that match all the motifsare considered for further analysis. With the new alignment, the database is searched formore sequences until no further complete fingerprint matches can be identified. These finalaligned motifs constitute the refined fingerprint that is entered into the database.

26 Algorithms for Molecular Biology c©Tel Aviv Univ.
6.7.3 Blocks
Blocks [11] uses multiply aligned ungapped segments corresponding to the most highly con-served regions of proteins. Block Searcher [14] ,Get Blocks [13] and Block Maker [12] areaids to detection and verification of protein sequence homology. They compare a proteinor DNA sequence to a database of protein blocks, retrieve blocks, and create new blocks,respectively.
6.7.4 Profiles
The Profiles databases [19] uses the notion of profiles to achieve a good detection of distantsequence relationships. A profile is a scoring table with multiple alignment information forthe whole sequences, not just for conserved regions. Profiles are weighted to indicate:
• what types of residues are allowed at what positions.
• where insertions and deletions (INDELs) are allowed (not within core secondary struc-tures).
• where the most conserved regions are located.
Profiles provide a sensitive means of detecting distant sequence relationships, where onlya few residues are well conserved. The inherent complexity of profiles renders them to behighly potent discriminators.
The ISREC (Swiss Institute for Experimental Research) has created a compendium ofprofiles, allowing to find even distant homologous. Each of those profiles has separate dataand family annotations.
6.7.5 Pfam
Pfam [46] uses a different method for its database. High quality seed alignments are usedto create Hidden Markov Models to which sequences are aligned. Pfam has to classes ofalignments, according to their credibility:
• Pfam-a – Non-edited seed alignments which are deemed to be accurate.
• Pfam-b – Alignments derived by automatic clustering of the SwissPort database. Thesealignments are, of course, less reliable.

Secondary Databases 27
6.7.6 eMotif
eMotif [17], also known as identify, uses data from Blocks and FingePrints to generateconsensus expressions from the conserved regions of sequence alignments.eMotif adopts a “fuzzy” algorithm which allows certain amino acid alternations. This allowseMotif to find homologous sequences that other programs can not find, but it results in a lotof noise. This trade-off shows why it is important to use multiple programs when searchingfor information.
6.7.7 InterrPro
InterPro [34] is an interface to several secondary databases: ProSite, prints, ProDom andPfam. It has an intuitive interface both for text and sequence-based searches, and since itincorporates several databases, it is very recommended.

28 Algorithms for Molecular Biology c©Tel Aviv Univ.

Bibliography
[1] A.Dembo and S.Karlin. Strong limit theorems of empirical functionals for large ex-cedances of partial sums of i.i.d variables. Annuals of Probability, 19(4):1737–1755,1991.
[2] S. F. Altschul, W. Gish, W. Miller, E. W. Myers, and D. J. Lipman. Basic localalignment search tool. J. Mol. Biol, 215:403–410, 1990.
[3] S. Karlin and S. F. Altschul. Methods for assessing the statistical significance of molec-ular sequence features by using general scoring schemes. Proc. Natl. Acad. Sci. USA,87:2264–2268, 1990.
[4] F. Lewitter. Text-based database searching. Trends Guide to Bioinformatics, pages3–5, 1998.
[5] Pagni M. and Jongeneel CV. Making sense of score statistics for sequence alignments.Briefings in Bioinformatics, 2(1):51–67, 2001.
[6] R. W. Pearson and D. J. Lipman. Improved tools for biological sequence comparison.Proc. Natl. Acad. Sci. USA, 85:2444–2448, 1988.
[7] T. F. Smith and M. S. Waterman. Identification of common molecular subsequences.J. Mol. Biol., 147:195–197, 1981.
[8] ftp://genbank.sdsc.edu/pub/release.notes/gb107.release.notes.
[9] http://bioinfo.md.huji.ac.il/databases/genpept.html.
[10] http://bioinfo.tau.ac.il/GCG/html/unix/tofasta.html.
[11] http://blocks.fhcrc.org/.
[12] http://blocks.fhcrc.org/blockmkr/make_blocks.html.
[13] http://blocks.fhcrc.org/blocks-bin/getblock.sh.
29
30 BIBLIOGRAPHY
[14] http://blocks.fhcrc.org/blocks/blocks_search.html.
[15] http://circinus.ebi.ac.uk:6543/michele/jalview/help.html.
[16] http://dapsas1.weizmann.ac.il/bcd/bcd_parent/bcd_bioccel/bioccel.html.
[17] http://dna.Stanford.EDU/identify.
[18] http://flybase.bio.indiana.edu/.
[19] http://isrec.isb-sib.ch/software/PFSCAN_for_m.html.
[20] http://pir.georgetown.edu/.
[21] http://pir.georgetown.edu/pirwww/aboutpir/collaborate.html.
[22] http://pir.georgetown.edu/pirwww/dbinfo/nrl3d.html.
[23] http://pir.georgetown.edu/pirwww/dbinfo/sample-hahu.html.
[24] http://srs/ebi/ac/uk/.
[25] http://srs.ebi.ac.uk/srs6/man/mi_srswww.html.
[26] http://www2.ebi.ac.uk/bic_sw/.
[27] http://www2.ebi.ac.uk/clustalw.
[28] http://www2.ebi.ac.uk/fasta3/.
[29] http://www.dna.affrc.go.jp/htdocs/growth/index.html.
[30] http://www.ebi.ac.uk/.
[31] http://www.ebi.ac.uk/embl/.
[32] http://www.ebi.ac.uk/fasta33/fasta3x.txt.
[33] http://www.ebi.ac.uk/fasta3/help.html.
[34] http://www.ebi.ac.uk/interpro.
[35] http://www.ebi.ac.uk/swissprot/.
[36] http://www.ebi.ac.uk/swissprot/Information/information.html.
[37] http://www.expasy.ch/prosite.
BIBLIOGRAPHY 31
[38] http://www.ncbi.nlm.nih.gov/.
[39] http://www.ncbi.nlm.nih.gov/BLAST/.
[40] http://www.ncbi.nlm.nih.gov/Education/BLASTinfo/guide.html.
[41] http://www/ncbi.nlm.nih.gov/Entrez/.
[42] http://www/ncbi.nlm.nih.gov/Entrez/entrezhelp.html.
[43] http://www.ncbi.nlm.nih.gov/Genbank/GenbankOverview.html.
[44] http://www.people.virginia.edu/~wrp/papers/mmol98f.pdf.
[45] http://www.rcsb.org/pdb/.
[46] http://www.sanger.ac.uk/Software/Pfam.