6-Social Protection Index Technical Workshop - Some Indicators on Social Protection in OECD...
20
Willem Adema Senior Economist, Social Policy Division, OECD Some Indicators on Social Protection in OECD countries Inception Workshop on SPI Update, Asian Development Bank, Manila, 3-4 April 2014
Transcript of 6-Social Protection Index Technical Workshop - Some Indicators on Social Protection in OECD...
Willem AdemaSenior Economist, Social Policy Division, OECD
Some Indicators on Social Protection in OECD countries
Inception Workshop on SPI Update, Asian Development Bank,
Manila, 3-4 April 2014

This presentation discusses:
• Social protection trends,
• Pensions, past trends and projections
• Health expenditure, past trends recent developments
• Some indicators on the Welfare State and the crisis

Historical trends in public social protection spending across OECD countries
Public social spending, in percentage of GDP, 1960-2013
Source: OECD Social Expenditure database (SOCX, www.oecd.org/els/social/expenditure).

Public social cash transfers: pensions are the main spending item, often increasing in size
A. Cash pensions, old age and survivors
B. Income support to the working age
0
5
10
152009 Early 1990s
0
5
10
152009 Early 1990s
Source: OECD Social Expenditure database (SOCX, www.oecd.org/els/social/expenditure).
Social expenditure, cash transfers, in % of GDP, early 1990s and 2009

Populations are ageing and the old-age support ratio will halve in the OECD
Source: OECD (2011), Pensions at a Glance, OECD Publishing, Paris (www.oecd.org/els/social/pensions/PAG); United Nations, World Population Prospects - 2008 Revision.

Projections of public expenditure on pensions, 2010-2050
As a % of GDP
Source: OECD (2012), OECD Pensions Outlook 2012, OECD Publishing, www.oecd.org/daf/pensions/outlook.
GreeceFrance
GermanyOECD-28
NetherlandsSweden
United KingdomKorea
AustraliaUnited States
13.614.6
10.88.4
6.89.6
7.70.9
3.64.6
0 2 4 6 8 10 12 14 16
2010Difference 2010-2050
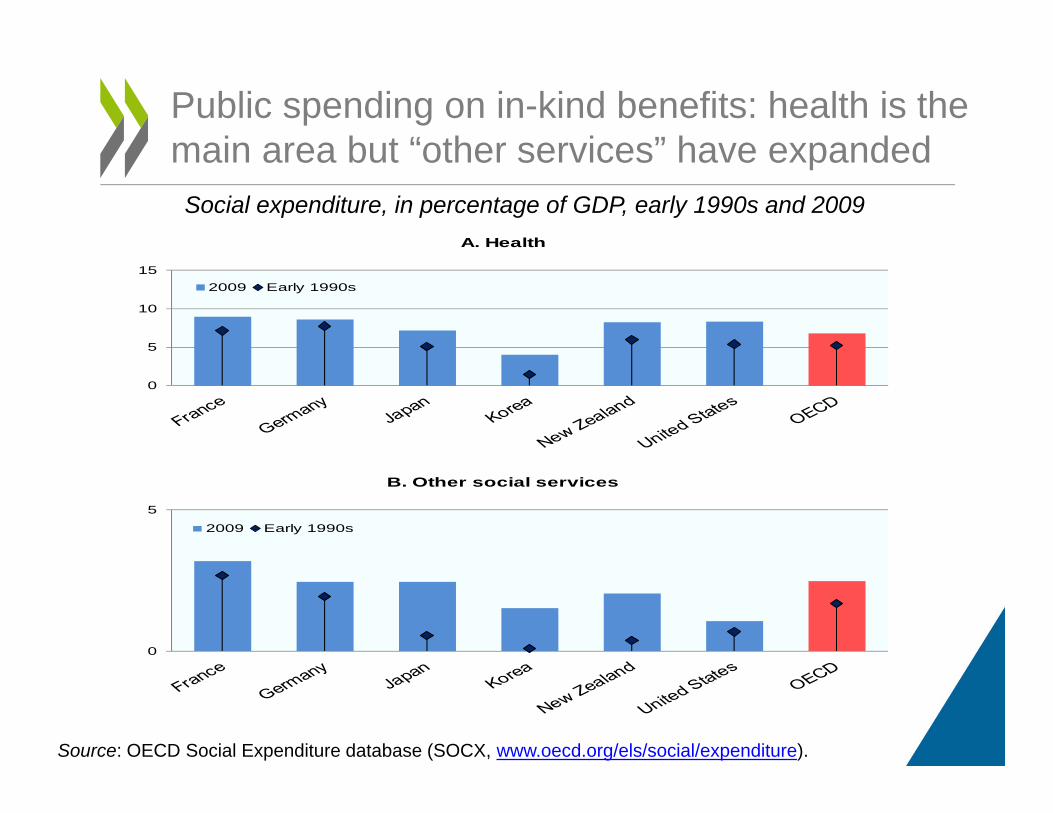
Public spending on in-kind benefits: health is the main area but “other services” have expanded
Source: OECD Social Expenditure database (SOCX, www.oecd.org/els/social/expenditure).
Social expenditure, in percentage of GDP, early 1990s and 2009A. Health
B. Other social services
0
5
10
152009 Early 1990s
0
5
2009 Early 1990s
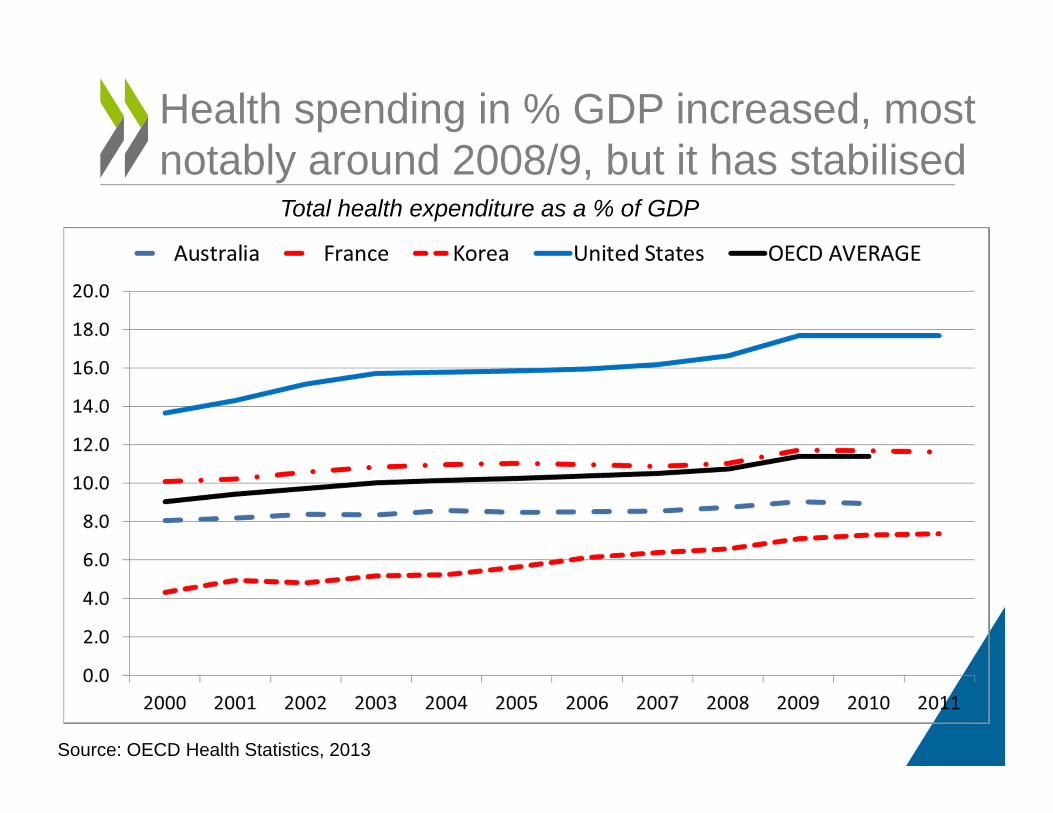
Health spending in % GDP increased, most notably around 2008/9, but it has stabilised
Total health expenditure as a % of GDP
Source: OECD Health Statistics, 2013

Health expenditure growth stalled in 2009, especially public health spending
Source OECD Health Statistics, 2013Source: OECD Health Statistics 2013
Real annual growth rates - average across the OECD

There has been some shift towards private financing….
Source: OECD Health Statistics 2013Source OECD Health Statistics, 2013Source: OECD Health Statistics 2013
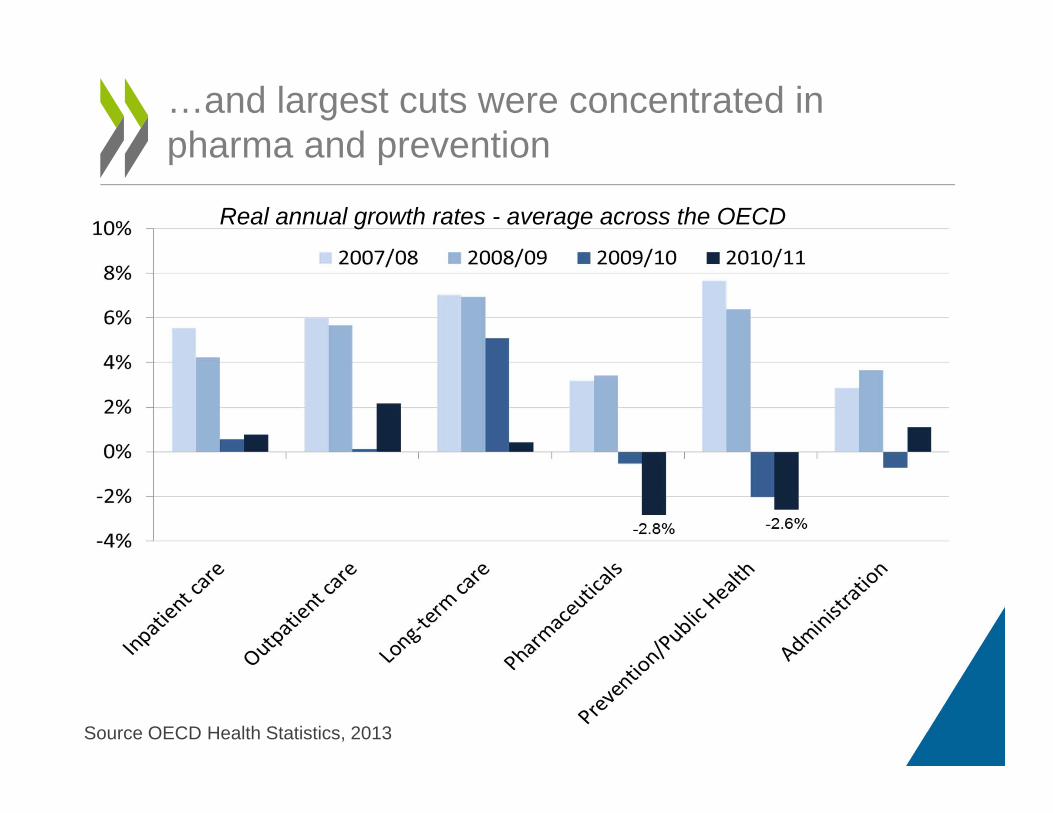
…and largest cuts were concentrated in pharma and prevention
Source OECD Health Statistics, 2013Source: OECD Health Statistics 2013
Real annual growth rates - average across the OECD
• Some indicators on the Welfare State and the crisis

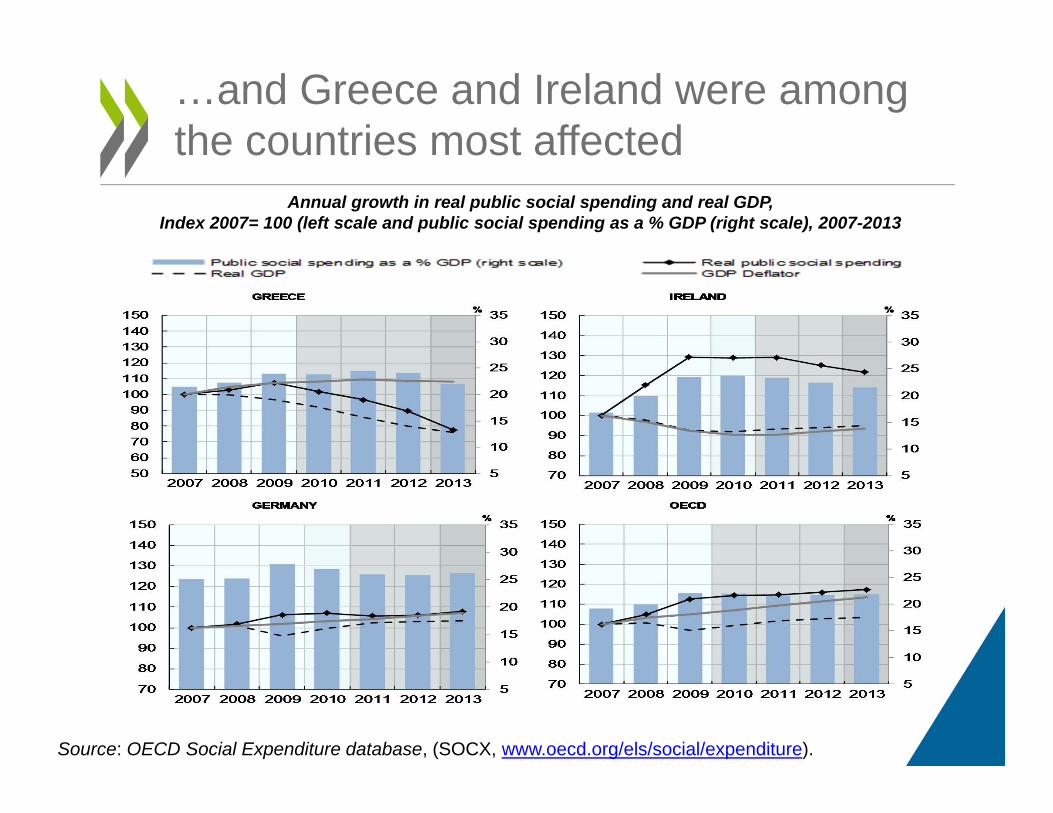
Annual growth in real public social spending and real GDP,Index 2007= 100 (left scale and public social spending as a % GDP (right scale), 2007-2013
Source: OECD Social Expenditure database, (SOCX, www.oecd.org/els/social/expenditure).
Australia France
Korea United States
5
10
15
20
25
30
35
70
80
90
100
110
120
130
140
150
2007 2008 2009 2010 2011 2012 2013
%Public social spending as a % GDP (right scale) Real public social spendingReal GDP GDP Deflator
5
10
15
20
25
30
35
70
80
90
100
110
120
130
140
150
2007 2008 2009 2010 2011 2012 2013
%
5
10
15
20
25
30
35
70
80
90
100
110
120
130
140
150
2007 2008 2009 2010 2011 2012 2013
%
5
10
15
20
25
30
35
70
80
90
100
110
120
130
140
150
2007 2008 2009 2010 2011 2012 2013
%
The impact of the crisis on social spending trends varies across countries…
Annual growth in real public social spending and real GDP,Index 2007= 100 (left scale and public social spending as a % GDP (right scale), 2007-2013
Source: OECD Social Expenditure database, (SOCX, www.oecd.org/els/social/expenditure).
…and Greece and Ireland were among the countries most affected

Family spending went up most in countries with income-tested child benefits
IrelandUnited KingdomFranceDenmarkSwedenGermanyAustraliaIsraelUnited StatesKorea
3.03.63.7
3.53.4
2.72.5
2.11.2
0.7
1.50.9
0.30.3
0.30.3
0.20.3
0.00.4
0 1 2 3 4 5
Public spending on family benefitsin percentage of GDP, 2007
Increase 2007-2010
Public spending on family benefits in percentage of GDP, 2010
Note: Public support accounted here only concerns public support that is exclusively for families (e.g. child payments and allowances, parental leave benefits and childcare support). Spending recorded in other social policy areas as health and housing support also assists families, but not exclusively, and is not included here. In Federal countries, as for example Canada, Switzerland and the United States, childcare spending by local governments is not necessarily reported to Federal governments. For these countries indicators underestimate the extent of public spending on childcare. Source: OECD Social Expenditure database, preliminary data (SOCX, www.oecd.org/els/social/expenditure).

The number of recipients of “primary out-of-work benefits” have increased during the crisis
Source: OECD, 2014, Society at a Glance, http://www.oecd.org/els/societyataglance.htm.
Panel B. Percentage point change between 2007 and 2010
Panel A. Participation: Number of recipients of cash transfers as a percentage of the 15-64 population
5.6
4.7
4.6
4.1
3.2
2.9
2.4
2.4
2.3
2.0
1.9
1.3
0.9
0.8
4.4
2.2
0123456
France
Spain
United States
Australia
Ireland
Portugal
Canada
Czech Republic
Netherlands
Sweden
New Zealand
Italy
Germany
Chile
Korea
Japan
Unemployment insurance Unemployment assistance-1 0 1 2 3 4
Unemployment insuranceUnemployment assistance

… As did the number of recipients of “secondary out-of-work benefits” in most countries
Source: OECD, 2014, Society at a Glance, http://www.oecd.org/els/societyataglance.htm.
Panel B. Percentage point change between 2007 and 2010
Panel A. Participation: Number of recipients of cash transfers as a percentage of the 15-64 population
8.7
6.4
4.2
0.8
1.4
1.1
8.9
2.1
0.6
2.3
2.3
5.1
3.4
2.1
1.9
3.0
1.5
2.1
2.6
3.7
3.3
0.1
0123456789101112
United StatesIrelandGermanySpainNew ZealandAustraliaSwedenFrancePortugalCzech RepublicNetherlandsJapanChileItaly
Unemployment assistance Social assistance Lone parents
-2 -1 0 1 2 3 4 5 6 7 8
Unemployment assistanceSocial assistanceLone parents

Fiscal space for greater social investment is narrowing in countries with high unemployment
Source: OECD, 2014, Society at a Glance, http://www.oecd.org/els/societyataglance.htm.
Notes: See notes to Figure 9. Averages for 2007/8 and 2011/12 are used as the timing of the downturn and the beginning of any fiscal consolidation efforts varied across countries.“Consolidation effort”: change in underlying primary government balance, percentage points of GDP.

Concluding remarks
•Social spending‐to‐GDP ratios have increased with the outbreak of the crisis, without marked decline so far.
•Pensions and health expenditure trends have contributed to a structural upward increase in social spending over time. However,
– Pension reform will mitigate the upward pressure on social spending due to population ageing
– Cuts in government health spending have contributed to almost all OECD countries experiencing a fall ion health spending growth since 2009
–All sectors experienced significant reductions; especially pharmaceuticals and prevention
•Fiscal space for greater social investment is narrowing in countries that saw a steep rise in employment during the crisis.
Thank you and further information
– OECD, 2014, Society at a Glance, http://www.oecd.org/els/societyataglance.htm
– The OECD Social Expenditure database is accessible via www.oecd.org/els/social/expenditure
– OECD Social, Employment and Migration Working Papers, No. 124: “Is the European Welfare State Really More Expensive? Indicators on Social Spending, 1980‐2012; and a Manual to the OECD Social Expenditure Database (SOCX)”. http://www.oecd.org/els/listofsocialemploymentandmigrationworkingpapers.htm– OECD Health Policies and Datahttp://www.oecd.org/health/health‐systems/healthstatistics.htm– To come the OECD SOCR Recipiency database
– OECD Work on Income Distribution and Poverty http://www.oecd.org/social/inequality.htm