6 Sigma Projects Presentation
31
SIX SIGMA OVERVIEW
-
Upload
vidit-garg -
Category
Documents
-
view
224 -
download
0
Transcript of 6 Sigma Projects Presentation

8/10/2019 6 Sigma Projects Presentation
http://slidepdf.com/reader/full/6-sigma-projects-presentation 1/31
SIX SIGMAOVERVIEW

8/10/2019 6 Sigma Projects Presentation
http://slidepdf.com/reader/full/6-sigma-projects-presentation 2/31
Six Sigma
“Six Sigma” refers to tools, processes andcultures made famous by Motorola and
General Electric in the 1980s and are aimedat reducing variability and defects.

8/10/2019 6 Sigma Projects Presentation
http://slidepdf.com/reader/full/6-sigma-projects-presentation 3/31
Six Sigma Origins
Motorola deployed Six Sigma Methodology in
80’s
In1981, Motorola set out to improve thequality of their products and services tenfold.
In 1988, accepted Malcolm Baldrige National
Quality Award, and began the Six SigmaQuality movement.
8/10/2019 6 Sigma Projects Presentation
http://slidepdf.com/reader/full/6-sigma-projects-presentation 4/31
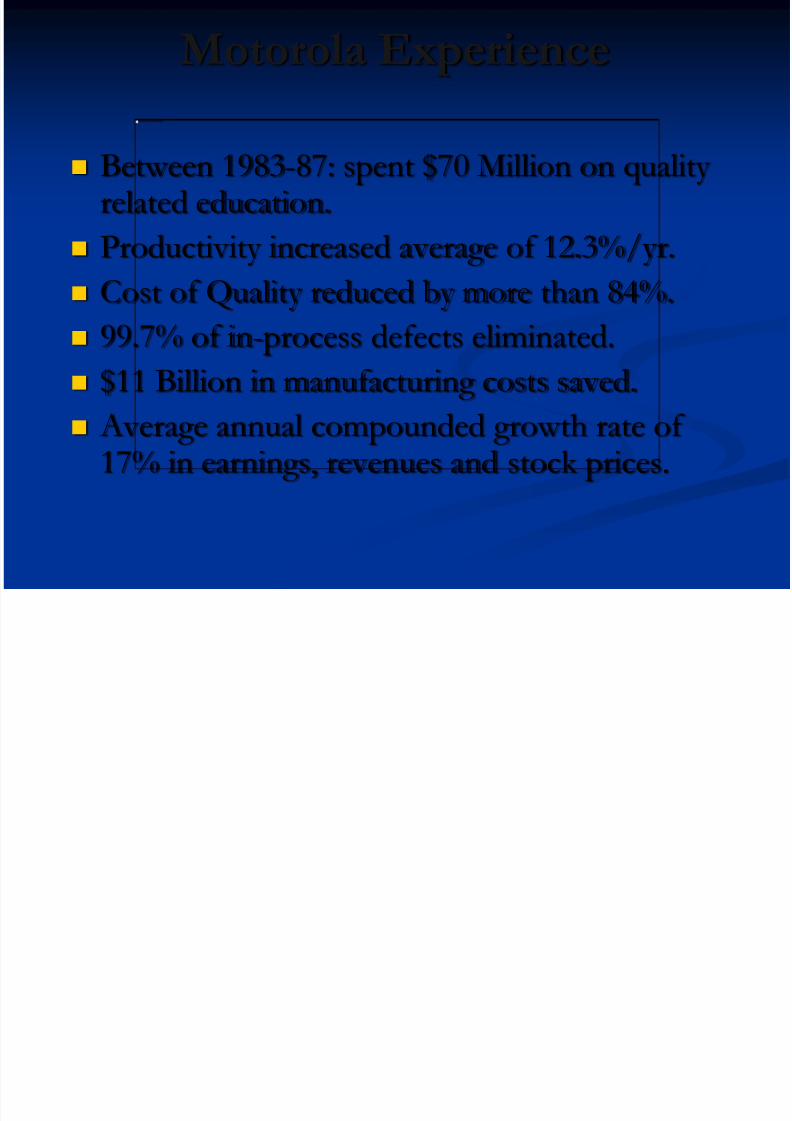
Motorola Experience
Between 1983-87: spent $70 Million on qualityrelated education.
Productivity increased average of 12.3%/yr.
Cost of Quality reduced by more than 84%.
99.7% of in-process defects eliminated.
$11 Billion in manufacturing costs saved.
Average annual compounded growth rate of17% in earnings, revenues and stock prices.

8/10/2019 6 Sigma Projects Presentation
http://slidepdf.com/reader/full/6-sigma-projects-presentation 5/31
Six Sigma Applications
Manufacturing , Service, Chemical, Financial..
High or low volume.
Thousands, Millions or Billions in Revenue.
Even Non-Profit Organizations.

8/10/2019 6 Sigma Projects Presentation
http://slidepdf.com/reader/full/6-sigma-projects-presentation 6/31
8/10/2019 6 Sigma Projects Presentation
http://slidepdf.com/reader/full/6-sigma-projects-presentation 7/31
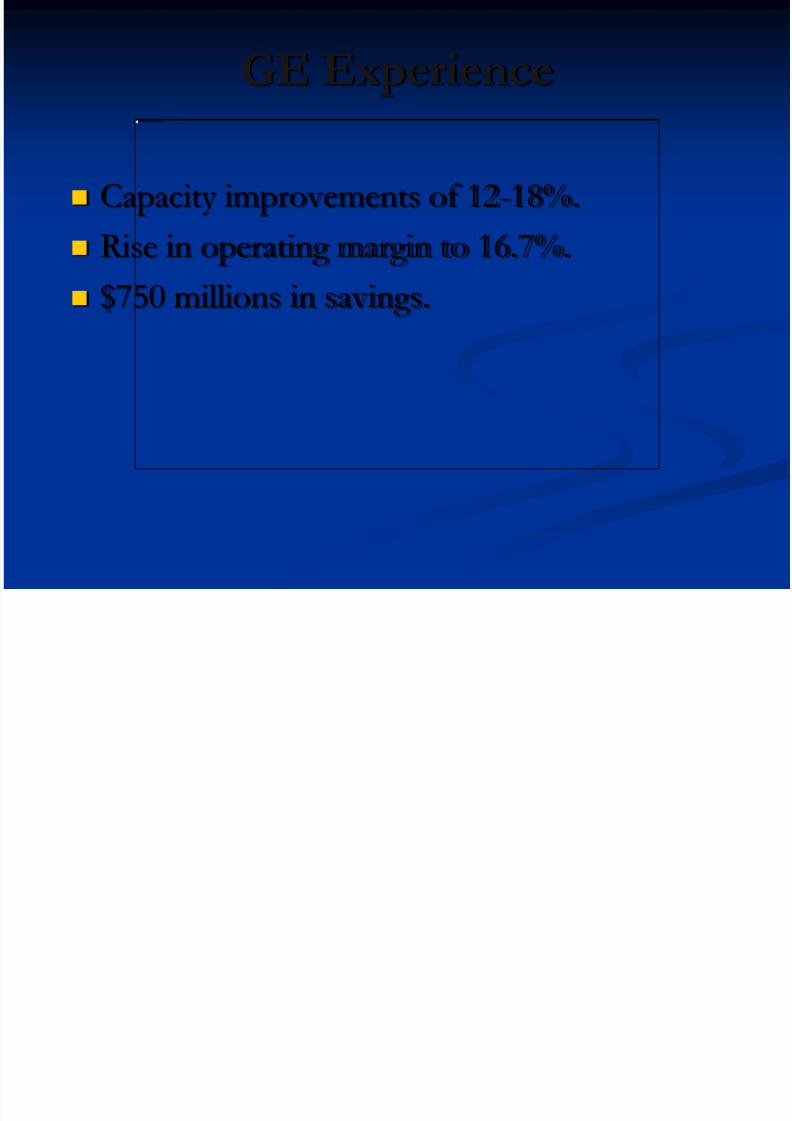
GE Experience
Capacity improvements of 12-18%.
Rise in operating margin to 16.7%.
$750 millions in savings.
8/10/2019 6 Sigma Projects Presentation
http://slidepdf.com/reader/full/6-sigma-projects-presentation 8/31
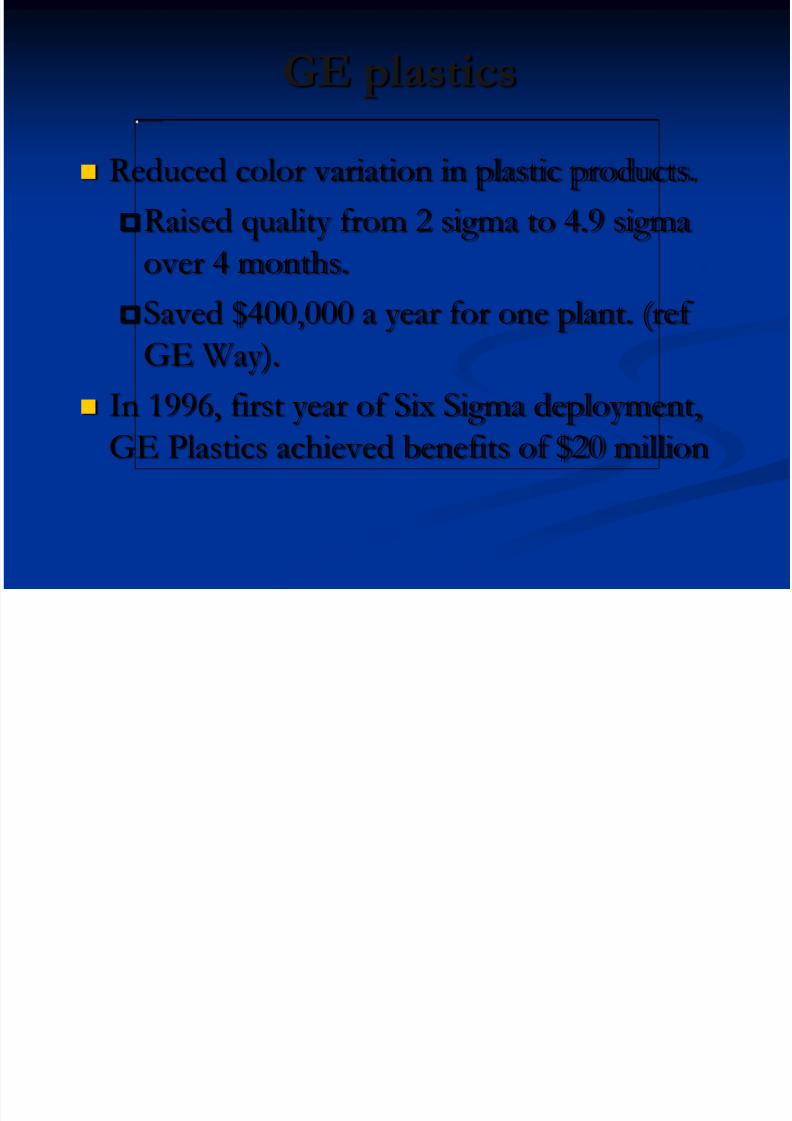
GE plastics
Reduced color variation in plastic products.
Raised quality from 2 sigma to 4.9 sigma
over 4 months.Saved $400,000 a year for one plant. (ref
GE Way).
In 1996, first year of Six Sigma deployment,GE Plastics achieved benefits of $20 million

8/10/2019 6 Sigma Projects Presentation
http://slidepdf.com/reader/full/6-sigma-projects-presentation 9/31

8/10/2019 6 Sigma Projects Presentation
http://slidepdf.com/reader/full/6-sigma-projects-presentation 10/31
Other Six Sigma Industry
Leaders
Boeing, IBM, Bombardier, Asea BrownBoveri, DuPont, Kodak, Compaq and Texas
Instruments. GMAC Mortgage, Citibank, JP Morgan and
Cendant Mortgage.

8/10/2019 6 Sigma Projects Presentation
http://slidepdf.com/reader/full/6-sigma-projects-presentation 11/31
Integral Management and QualitySolutions 11
Integral MQS Achievements
Sample of Six Sigma Projects
Implemented
8/10/2019 6 Sigma Projects Presentation
http://slidepdf.com/reader/full/6-sigma-projects-presentation 12/31
Integral Management and QualitySolutions 12
Project 1:
Optimization of Calcium
Addition
P j 1
8/10/2019 6 Sigma Projects Presentation
http://slidepdf.com/reader/full/6-sigma-projects-presentation 13/31
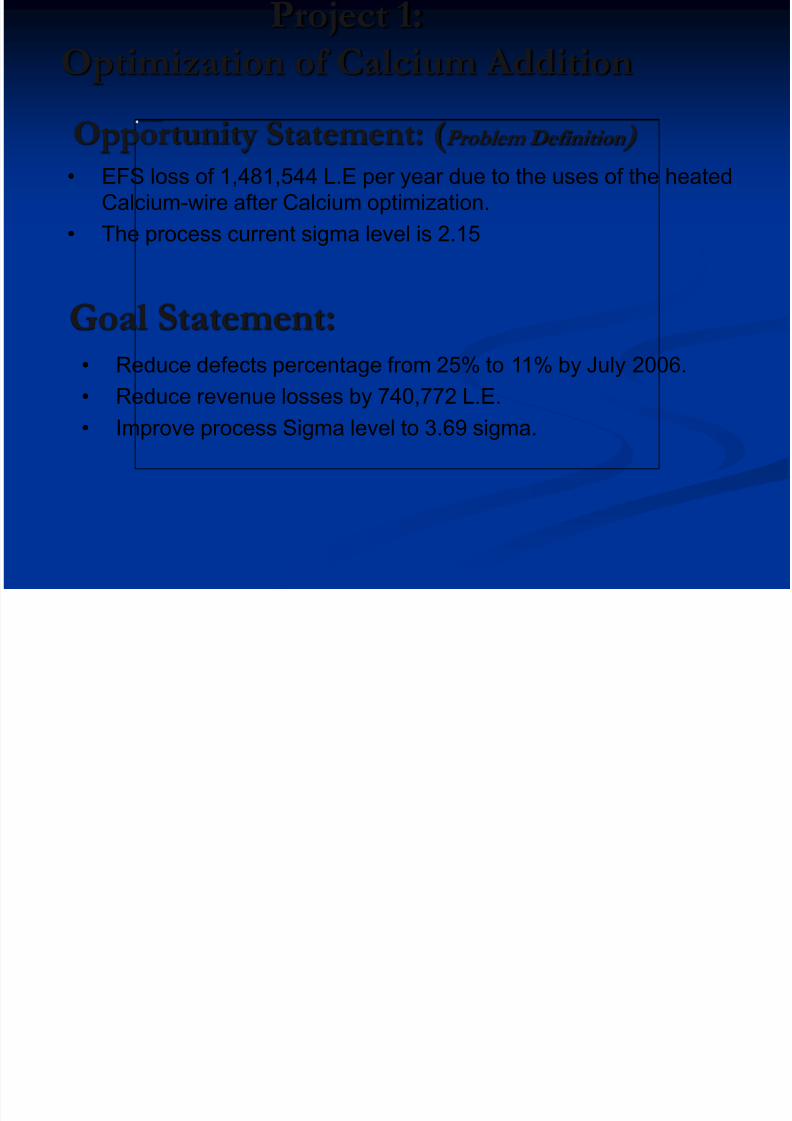
Project 1:
Optimization of Calcium Addition
• EFS loss of 1,481,544 L.E per year due to the uses of the heated
Calcium-wire after Calcium optimization.
• The process current sigma level is 2.15
Opportunity Statement: (Problem Definition )
• Reduce defects percentage from 25% to 11% by July 2006.
• Reduce revenue losses by 740,772 L.E.
• Improve process Sigma level to 3.69 sigma.
Goal Statement:

8/10/2019 6 Sigma Projects Presentation
http://slidepdf.com/reader/full/6-sigma-projects-presentation 14/31
Integral Management and QualitySolutions 14
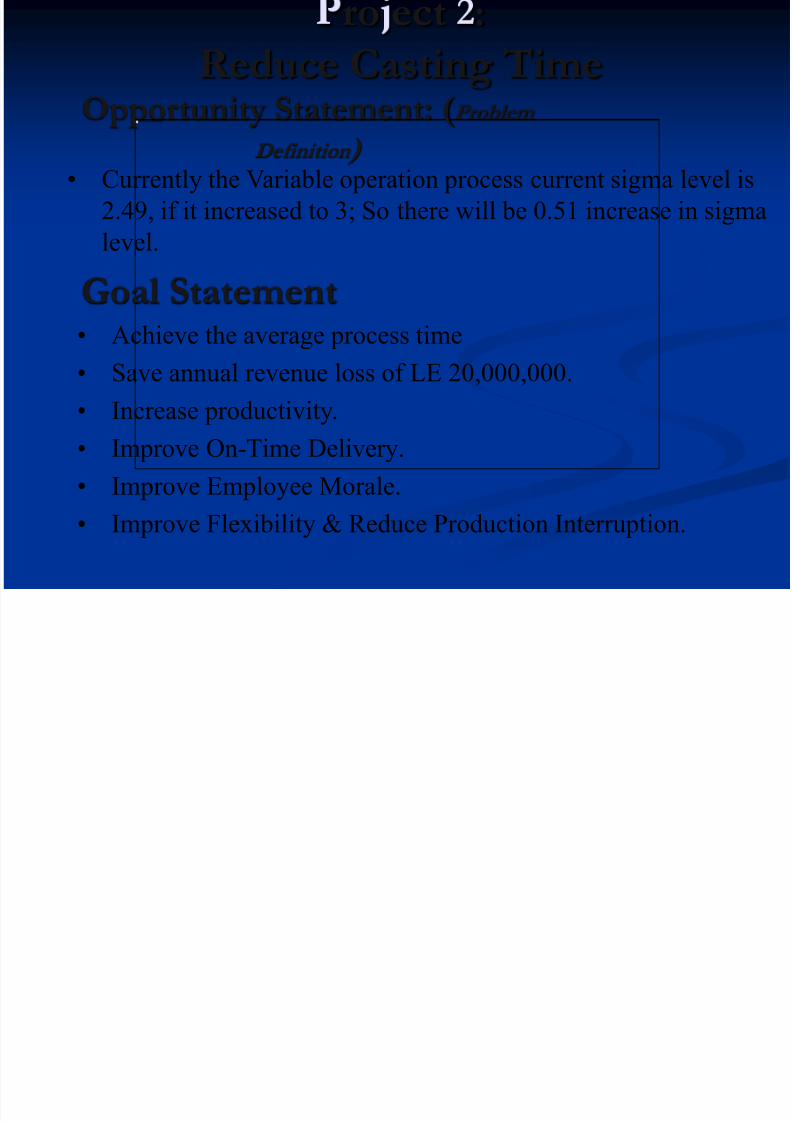
Project 2:
Reduce Casting Time
8/10/2019 6 Sigma Projects Presentation
http://slidepdf.com/reader/full/6-sigma-projects-presentation 15/31
ro ect :
Reduce Casting Time
• Achieve the average process time
• Save annual revenue loss of LE 20,000,000.
•Increase productivity.
• Improve On-Time Delivery.
• Improve Employee Morale.
• Improve Flexibility & Reduce Production Interruption.
• Currently the Variable operation process current sigma level is
2.49, if it increased to 3; So there will be 0.51 increase in sigma
level.
Opportunity Statement: (Problem
Definition )
Goal Statement
8/10/2019 6 Sigma Projects Presentation
http://slidepdf.com/reader/full/6-sigma-projects-presentation 16/31
Integral Management and QualitySolutions 16
Project 3: Width DropDefect
(Project Charter)

8/10/2019 6 Sigma Projects Presentation
http://slidepdf.com/reader/full/6-sigma-projects-presentation 17/31
Project 3: (Project Charter)
Width Drop Defect
Business Case:
The Width Drop defect beside causing an annual
revenue loss of 6,704,422.50 L.E., it causes rework
and production disturbance and it might cause adelay in finished product delivery. By reducing this
defect, the company will improve its financial
performance, increase productivity and deliver
finished product on time.
Opportunity Statement:
Currently, in EFS, there are 0.62% defective
Coils due to width drop after the hot strip
Mill process. This represents a revenue lossof 6,704,422.50 L.E. per year. The process
current sigma level is 3.76
Project Goal :
Reduce the cost of width drop defect by 6,033,979 LEImprove process Sigma level from 3.76 to 4.54 sigma.
Improve Delivery on time.
Reduce production interruption.
Improve employee morale.
Increase Customer satisfaction.
Project Scope:
HSM Operation Process:1. HSM: Start with slabs and ends with Hot
Rolled Coils (HRC).
2. The Project scope is to control the widthdrop which occurred in the Hot Strip Mill.
Time Schedule & Project Plan: Activity From To
Define Phase 15/01/2006 15/02/2006
Measure Phase 15/02/2006 30/04/2006
Analyze Phase 01/05/2006 15/05/2006
Improve Phase 15/05/2006 30/06/2006
Control Phase 01/07/2006 10/07/2006
Team Selection:Dr.Gamal Megahed Sponsor TD Manager
Nabil Douban Black Belt
Ahmed Nabil Adhoc Financial Manager
Usama Ahmed Member HSM Process Engineer
Mohammed Awad Member HSM Production Eng.
Mohammed Ibrahim Member Quality Control Eng.
Ahmed Attala Member Automation Engineer
Niraj Singh Member SKP in Charge

8/10/2019 6 Sigma Projects Presentation
http://slidepdf.com/reader/full/6-sigma-projects-presentation 18/31
Integral Management and QualitySolutions 18
Improve Sales Order cycle and
Scrap Products Due To Expiry

8/10/2019 6 Sigma Projects Presentation
http://slidepdf.com/reader/full/6-sigma-projects-presentation 19/31
1- Definition of key terms Return Goods: The Returned Products which is stayed on the customer shelf until
expiration or any kind of defect. Returns Invoices: The invoices which are totally returned, the customer did not accept any
of it’s contents.
Partial R. Invoices: The invoices which are partially returned, the customer accepted someof it’s contents and returned the others.
Contract : Local or exportation tenders.
Sales : The Net sales (Total Sales – Returns)
Sale order cycle: From Salesman visits schedule, physical visit, order taking,order follow-up, order delivery to on shelf products follow-up
Scrap : The Executed Finished Products
Scrape due to expiry date: The scraped products due to exceeding theexpiration date at the customer place.
Rework : The needed work on returned products to reuse them Customers: Pharmacies, Distributors, and others like hospitals, Health
insurance, …Etc.
8/10/2019 6 Sigma Projects Presentation
http://slidepdf.com/reader/full/6-sigma-projects-presentation 20/31
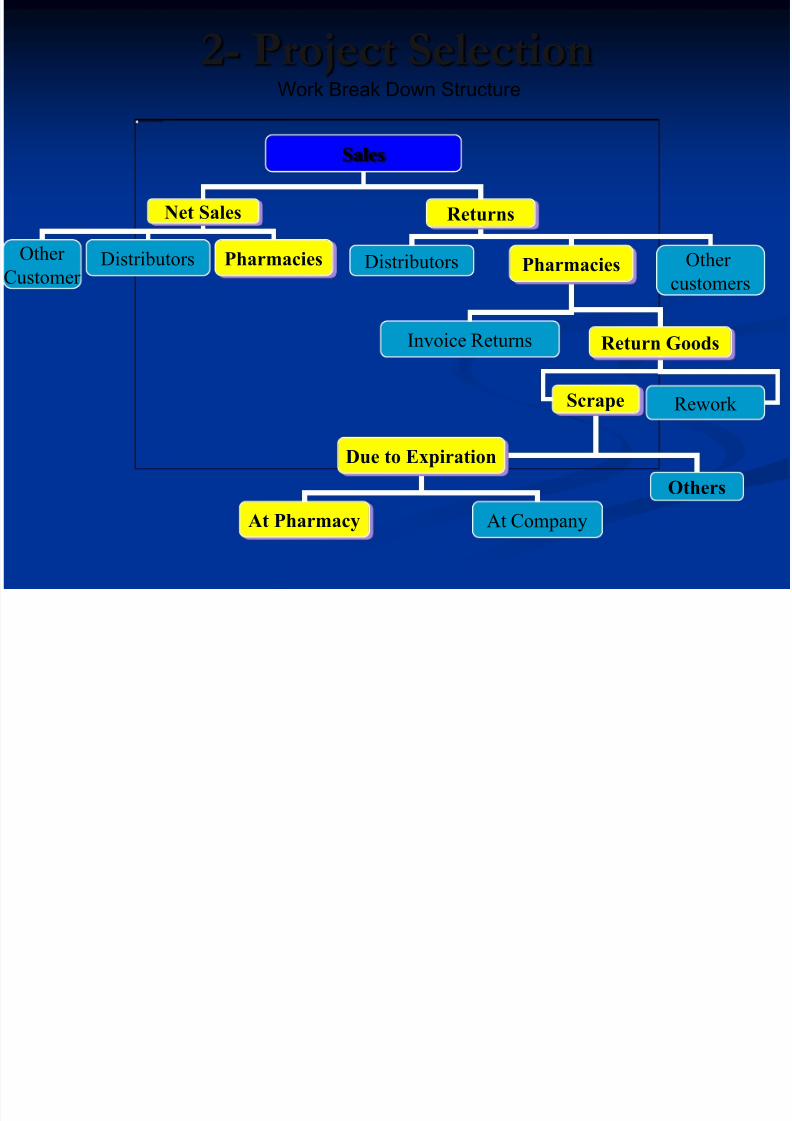
2- Project Selection
Sales
Net Sales Returns
Distributors Pharmacies Distributors Pharmacies
Invoice Returns Return Goods
Rework Scrape
Due to Expiration
Others
At CompanyAt Pharmacy
Other
customers
Other
Customer
Work Break Down Structure
8/10/2019 6 Sigma Projects Presentation
http://slidepdf.com/reader/full/6-sigma-projects-presentation 21/31
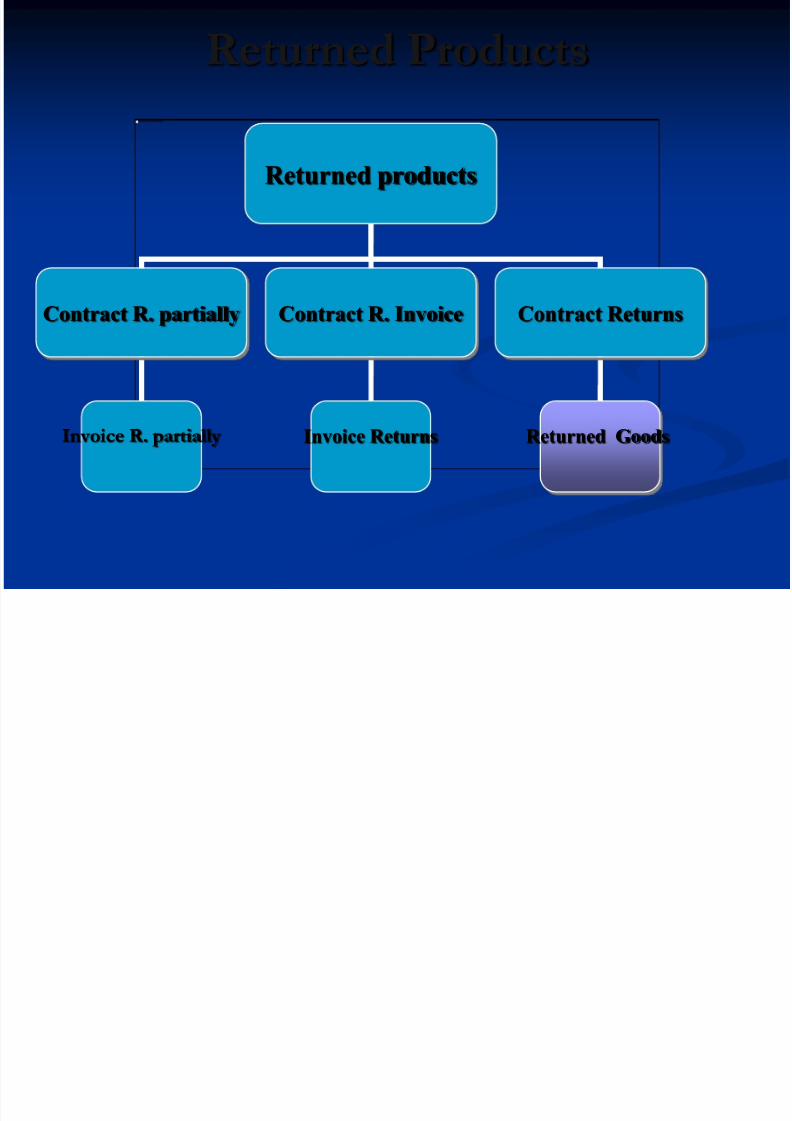
Returned Products
Returned products
Contract R. partially Contract R. Invoice Contract Returns
Invoice R. partially Invoice Returns Returned Goods

8/10/2019 6 Sigma Projects Presentation
http://slidepdf.com/reader/full/6-sigma-projects-presentation 22/31
Why is this so important?
6.0%2.0%
92.0%
Category
Net Sales
Samples
Returns
Sales Transaction % 2006
The Total returns represent 6 % from The Total Sales
while the samples represent 2 %
8/10/2019 6 Sigma Projects Presentation
http://slidepdf.com/reader/full/6-sigma-projects-presentation 23/31
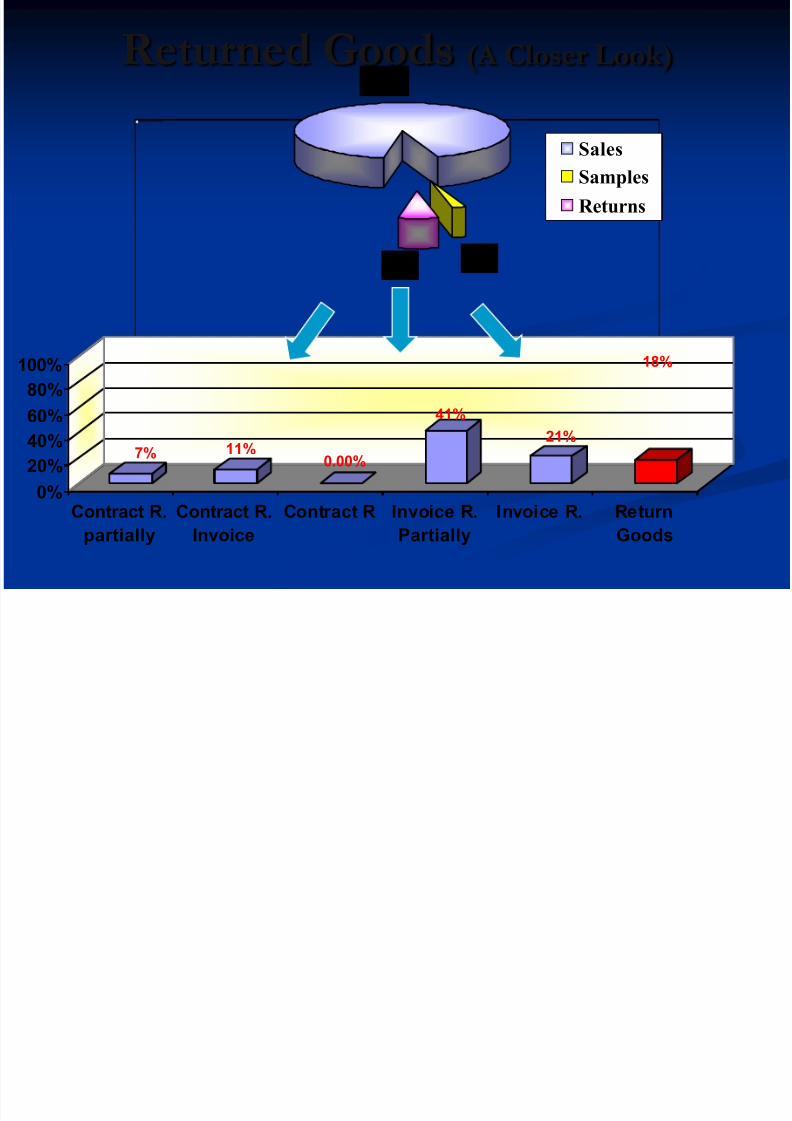
Returned Goods (A Closer Look)
7% 11%0.00%
41%21%
18%
0%
20%
40%60%
80%
100%
Contract R.
partially
Contract R.
Invoice
Contract R Invoice R.
Partially
Invoice R. Return
Goods
92%
6%
2%
Sales
Samples
Returns

8/10/2019 6 Sigma Projects Presentation
http://slidepdf.com/reader/full/6-sigma-projects-presentation 24/31
Facts
C o
u n t
P e r c e n t
Customer TypeCount
56.8 99.2 100.0
1221801 910889 16881
Percent 56.8 42.4 0.8
Cum %
OtherDistributersPharmacies
2000000
1500000
1000000
500000
0
100
80
60
40
20
0
Pareto Chart of Customer Type ( Returned Goods Units 2004 - 2006)
Almost 57% of Returned goods are from the
pharmacies
8/10/2019 6 Sigma Projects Presentation
http://slidepdf.com/reader/full/6-sigma-projects-presentation 25/31
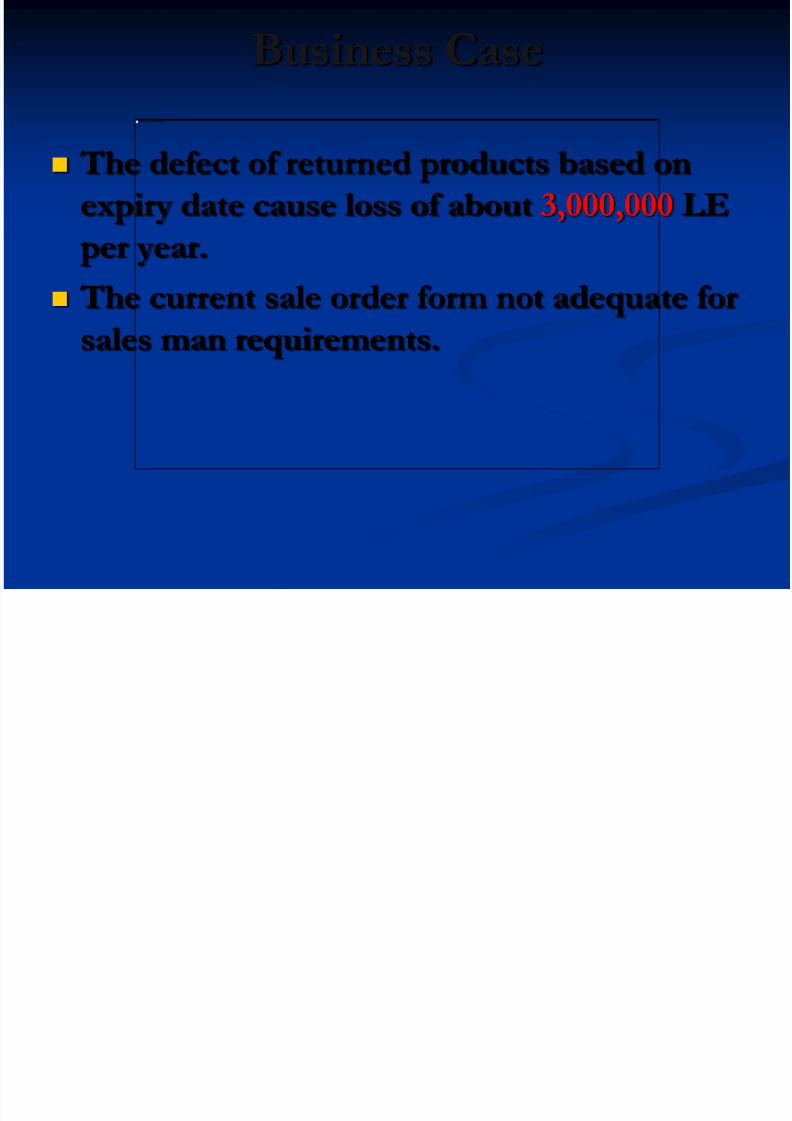
Business Case
The defect of returned products based on
expiry date cause loss of about 3,000,000 LE
per year.
The current sale order form not adequate for
sales man requirements.
8/10/2019 6 Sigma Projects Presentation
http://slidepdf.com/reader/full/6-sigma-projects-presentation 26/31
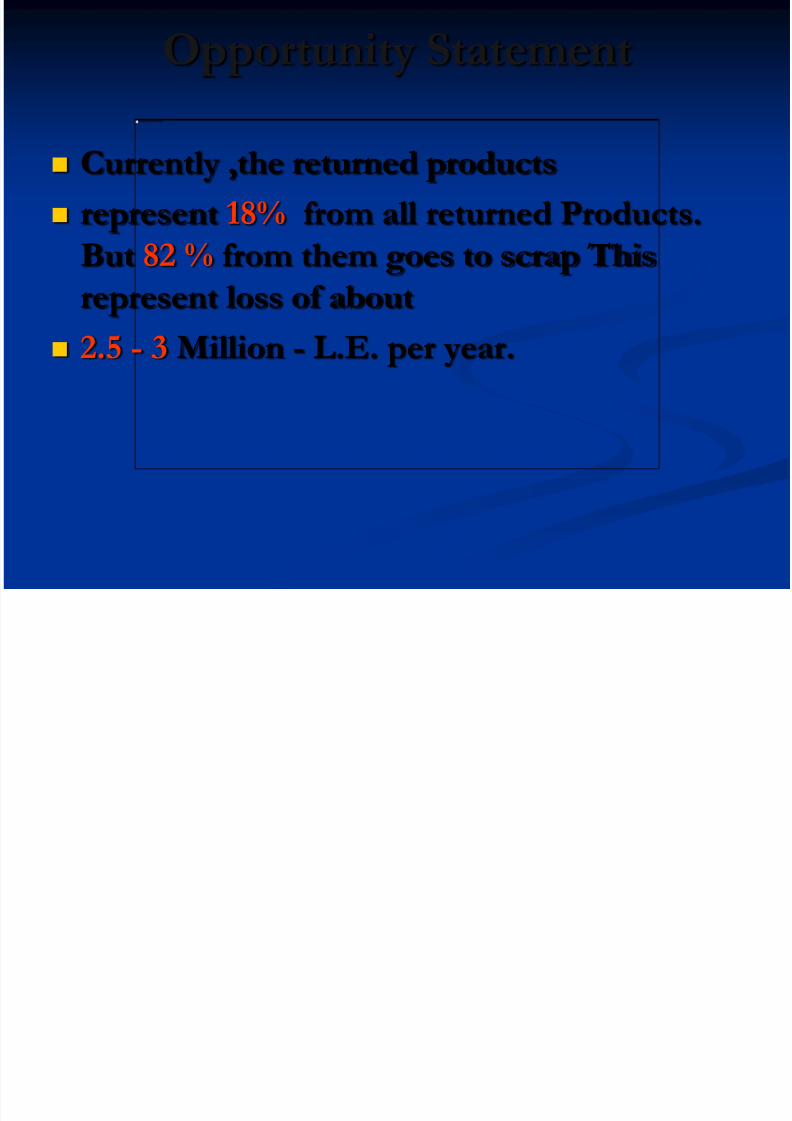
Opportunity Statement
Currently ,the returned products
represent 18% from all returned Products.
But 82 % from them goes to scrap This
represent loss of about
2.5 - 3 Million - L.E. per year.
8/10/2019 6 Sigma Projects Presentation
http://slidepdf.com/reader/full/6-sigma-projects-presentation 27/31
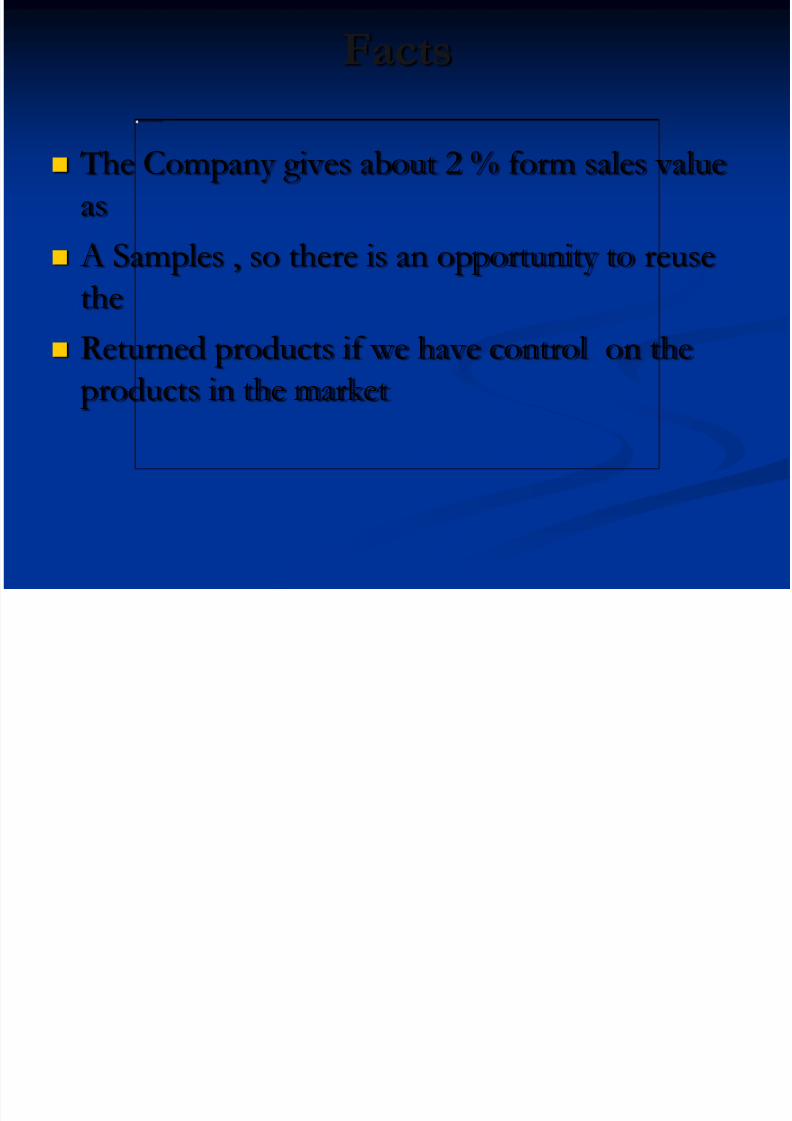
Facts
The Company gives about 2 % form sales valueas
A Samples , so there is an opportunity to reusethe
Returned products if we have control on theproducts in the market
8/10/2019 6 Sigma Projects Presentation
http://slidepdf.com/reader/full/6-sigma-projects-presentation 28/31
Project Scope
The Sales Cycle From Getting the
Customer Order until The
Expired product Execution

8/10/2019 6 Sigma Projects Presentation
http://slidepdf.com/reader/full/6-sigma-projects-presentation 29/31
Project Objectives
1- Reduce the Expired products by
1,000,000 L.E. per year.
2- Improve process sigma level from 0.6 to 1.6 Sigma.
3- Improve the return cycle.
4- Improve Sales order cycle 5- Increase the customer satisfaction.
8/10/2019 6 Sigma Projects Presentation
http://slidepdf.com/reader/full/6-sigma-projects-presentation 30/31
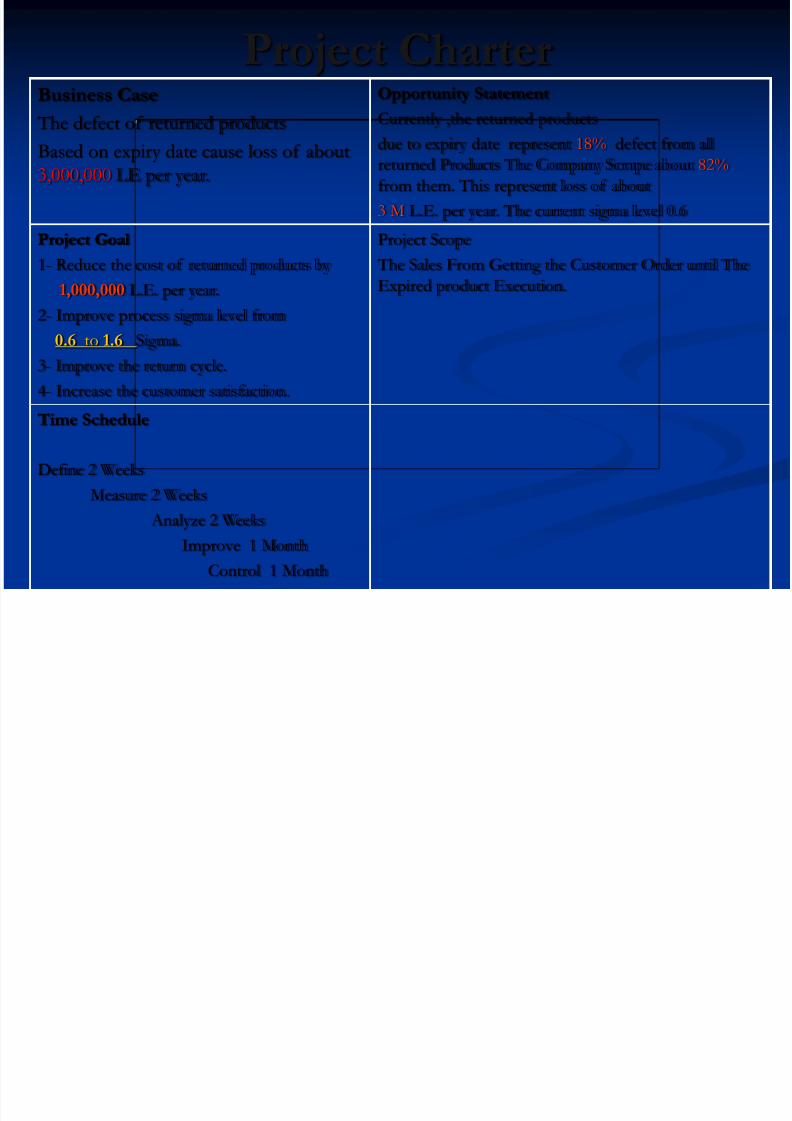
Project CharterBusiness Case
The defect of returned products
Based on expiry date cause loss of about3,000,000 LE per year.
Opportunity Statement
Currently ,the returned products
due to expiry date represent 18% defect from allreturned Products The Company Scrape about 82%
from them. This represent loss of about
3 M L.E. per year. The current sigma level 0.6
Project Goal
1- Reduce the cost of returned products by
1,000,000 L.E. per year.
2- Improve process sigma level from
0.6 to 1.6 Sigma.
3- Improve the return cycle.
4- Increase the customer satisfaction.
Project Scope
The Sales From Getting the Customer Order until The
Expired product Execution.
Time Schedule
Define 2 Weeks
Measure 2 Weeks
Analyze 2 Weeks
Improve 1 Month
Control 1 Month

8/10/2019 6 Sigma Projects Presentation
http://slidepdf.com/reader/full/6-sigma-projects-presentation 31/31
Integral Management and QualitySolutions 31
Thank You