6. REFERENCES - Welcome to Unika Repository - …repository.unika.ac.id/1621/7/09.70.0055 Maria...
54
44 6. REFERENCES Alan Warde „Consumption and the theory of practice‟, Journal of Consumer Culture, 5(2) (2005) 131-54. CODEX 288-1976. Codex Standard for Cream and Prepared Creams. Formerly CODEX STAN A-9-1976. Adopted in 1976. Revision 2003, 2008. Amendment 2010. D. Kilcast et al, 2000. The stability and shelf-life of food.Woodhead Publishing Limited. Boston. England. Page 3-7. Flour Fortification Initiative (FFI) Organization. 2008. Premix Best Practices. USA. Herawati, 2008. Shelf-life determination of food product. Penentuan Umur Simpan Pada Produk Pangan. Ungaran.3-7. Ihara K., Habara K., Ozaki Y., Nakamura K., Ochi H., Saito H., Asaoka H., Uozumi M., Ichihashi N. and Iwatsuki K. (2010). Influence of whipping temperature on the whipping properties and rheological characteristics of whipped cream. Journal of Dairy Science, 93,7, 2887-2895. Jakubczyk E. and Niranjan K. (2006).Transient development of whipped cream properties. Journal of Food engineering, 77, 79-83. Kusnandar, 2008.Aplikasi program komputer sebagai alat bantu penentuan umur simpan produk pangan : metode Arrhenius. Pelatihan pendugaan waktu kadaluwarsa (shelflife) Bahan dan Produk Pangan. Bogor, 1-2 Desember 2004. Pusat Studi Pangan dan Gizi, Institut Pertanian Bogor. Lakshmi, J. 2012. Bakery and Confectionary Products. Acharya N. G. Ranga Agricultural University. Bapatla, India. McCance and Widdowson, 2002. The Nutritional Composition of Dairy products. The Dairy Council. Cambridge: Royal Society of Chemistry. Nau (2005). A good value of R-squared. Course Online-Decision 411 Forecasting. http://people.duke.edu/~rnau/411home.htm . Accessed at September 9 th , 2013. Plasch, G. 2007. Premix and Complete Mixes. Page 287-295. Precision Weighing Balance, 2011. The use of moisture balance. http:// balance. balances. com/ scales/1128/ . Accessed at October 18 th , 2013. Robert L. Worden (eds.). Indonesia: A Country Study. 5th ed. Washington, D.C.: Library of Congress, 1993. Robertson (1993).Pasteurisation and homogenization.Cream Processing Manual (ed. J. Rothwell),2ndedn., pp. 26–33, The Society of Dairy Technology, Cambridge.
Transcript of 6. REFERENCES - Welcome to Unika Repository - …repository.unika.ac.id/1621/7/09.70.0055 Maria...
44
6. REFERENCES
Alan Warde „Consumption and the theory of practice‟, Journal of Consumer Culture, 5(2)
(2005) 131-54.
CODEX 288-1976. Codex Standard for Cream and Prepared Creams. Formerly CODEX
STAN A-9-1976. Adopted in 1976. Revision 2003, 2008. Amendment 2010.
D. Kilcast et al, 2000. The stability and shelf-life of food.Woodhead Publishing Limited.
Boston. England. Page 3-7.
Flour Fortification Initiative (FFI) Organization. 2008. Premix Best Practices. USA.
Herawati, 2008. Shelf-life determination of food product. Penentuan Umur Simpan Pada
Produk Pangan. Ungaran.3-7.
Ihara K., Habara K., Ozaki Y., Nakamura K., Ochi H., Saito H., Asaoka H., Uozumi M.,
Ichihashi N. and Iwatsuki K. (2010). Influence of whipping temperature on the whipping
properties and rheological characteristics of whipped cream. Journal of Dairy Science, 93,7,
2887-2895.
Jakubczyk E. and Niranjan K. (2006).Transient development of whipped cream properties.
Journal of Food engineering, 77, 79-83.
Kusnandar, 2008.Aplikasi program komputer sebagai alat bantu penentuan umur simpan
produk pangan : metode Arrhenius. Pelatihan pendugaan waktu kadaluwarsa (shelflife)
Bahan dan Produk Pangan. Bogor, 1-2 Desember 2004. Pusat Studi Pangan dan Gizi, Institut
Pertanian Bogor.
Lakshmi, J. 2012. Bakery and Confectionary Products. Acharya N. G. Ranga Agricultural
University. Bapatla, India.
McCance and Widdowson, 2002. The Nutritional Composition of Dairy products. The Dairy
Council. Cambridge: Royal Society of Chemistry.
Nau (2005). A good value of R-squared. Course Online-Decision 411 Forecasting.
http://people.duke.edu/~rnau/411home.htm. Accessed at September 9th
, 2013.
Plasch, G. 2007. Premix and Complete Mixes. Page 287-295.
Precision Weighing Balance, 2011. The use of moisture balance. http:// balance. balances.
com/ scales/1128/. Accessed at October 18th
, 2013.
Robert L. Worden (eds.). Indonesia: A Country Study. 5th ed. Washington, D.C.: Library of
Congress, 1993.
Robertson (1993).Pasteurisation and homogenization.Cream Processing Manual (ed. J.
Rothwell),2ndedn., pp. 26–33, The Society of Dairy Technology, Cambridge.

45
Rotronic Instrument,_____. Rotronic Hygopalm Manual Instructions. http://
www.rotronic.co.uk/ hygropalm23-aw-hp23-aw.html. Accessed at October 18th
, 2013.
Segall K.I. and Goff H.D. (2002). Secondary adsorption of milk proteins from the
continuous phase to the oil–water interface in dairy emulsions.International Dairy Journal,
12, 889–897.
Shamsi K., Che Man Y.B., Yusoff M.S.A. and Jinap S. (2002).A comparative study of dairy
whipping cream and palm oil-based whipping cream in terms of fatty acids. Composition
and foam stability. JAOCS, 79, nr. 6. Lampert,1975
Smith et. al., 1999. Whipped Cream Structure. Food Science University of Guelph. Canada.
Templeton H.L. and Sommer H.H. (1932).Studies of whipping cream.Dairy compartment,
College of Agriculture, Madison, Wisconsin, USA.
Tamime, A. Y., 2009. Dairy Fats and Related Products. Society of Dairy Technology. UK.
Page 66-72 (Chapter 4-Whipping Cream).
van Lent K., Vanlerberghe B., Van Oostveldt P., Thas O. and Van der Meeren P. (2008).
Determination of water droplet size distribution in butter: Pulsed field gradient NMR in
comparison with confocal scanning laser microscopy. International Dairy Journal, 18, 12–
22.
Vermeir, Lien. 2011. Formulation and characterization aspects of low fat whipping cream by
Water/Oil/Water technology. Belgia.
Walstra P., et al., 2008. Dairy Science and Technology Second Edition. USA.
Weldon. 2012. Complete Moisture Analysis Seminar. AquaLab-Decagon. Washington.
Zhao Q., Zhao M., Wang J., Wang C. and Yang B. (2008). Effects of sodium caseinate and
whey proteins on whipping properties and texture characteristics of whipped cream. Journal
of Food Process Engineering, 31, 671–683.
46
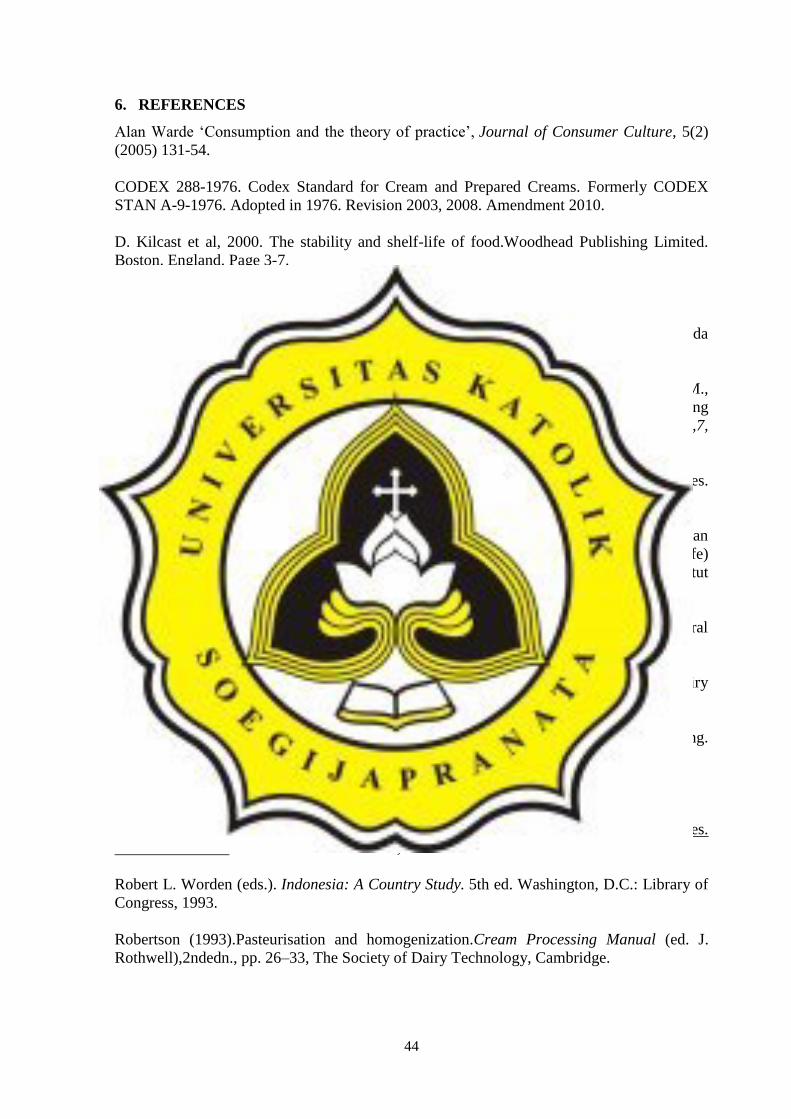
7. APPENDICES
7.1. Linear equation of whipping cream premix shelf-life during storage
7.1.1. Moisture content
(A) (B)
(C) (D)
(E) (F)
Figure 18 The linear equation of whipping cream premix during storage based on moisture content variable at
(A) Order 0 Temp. 21°C, (B) Order 1 Temp. 21°C, (C) Order 0 Temp. 27°C, (D) Order 1 Temp. 27°C, (E)
Order 0 Temp. 37°C, (F) Order 1 Temp. 37°C.
y = 0.004x + 1.386R² = 0.943
0
0.5
1
1.5
2
0 50 100
Mo
istu
re c
on
ten
t (%
)
StorageTime (Days)
y = 0.002x + 0.331R² = 0.951
0
0.1
0.2
0.3
0.4
0.5
0.6
0 50 100
Mo
istu
re c
on
ten
t (%
)
StorageTime (Days)
y = 0.008x + 1.371R² = 0.935
0
0.5
1
1.5
2
2.5
0 50 100
Mo
istu
re c
on
ten
t (%
)
StorageTime (Days)
y = 0.004x + 0.332R² = 0.954
0
0.1
0.2
0.3
0.4
0.5
0.6
0.7
0.8
0 50 100
Mo
istu
re c
on
ten
t (%
)
StorageTime (Days)
y = 0.007x + 1.424R² = 0.779
0
0.5
1
1.5
2
0 20 40 60
Mo
istu
re c
on
ten
t (%
)
StorageTime (Days)
y = 0.002x + 0.354R² = 0.783
0
0.1
0.2
0.3
0.4
0.5
0.6
0 50 100
Mo
istu
re c
on
ten
t (%
)
StorageTime (Days)
47
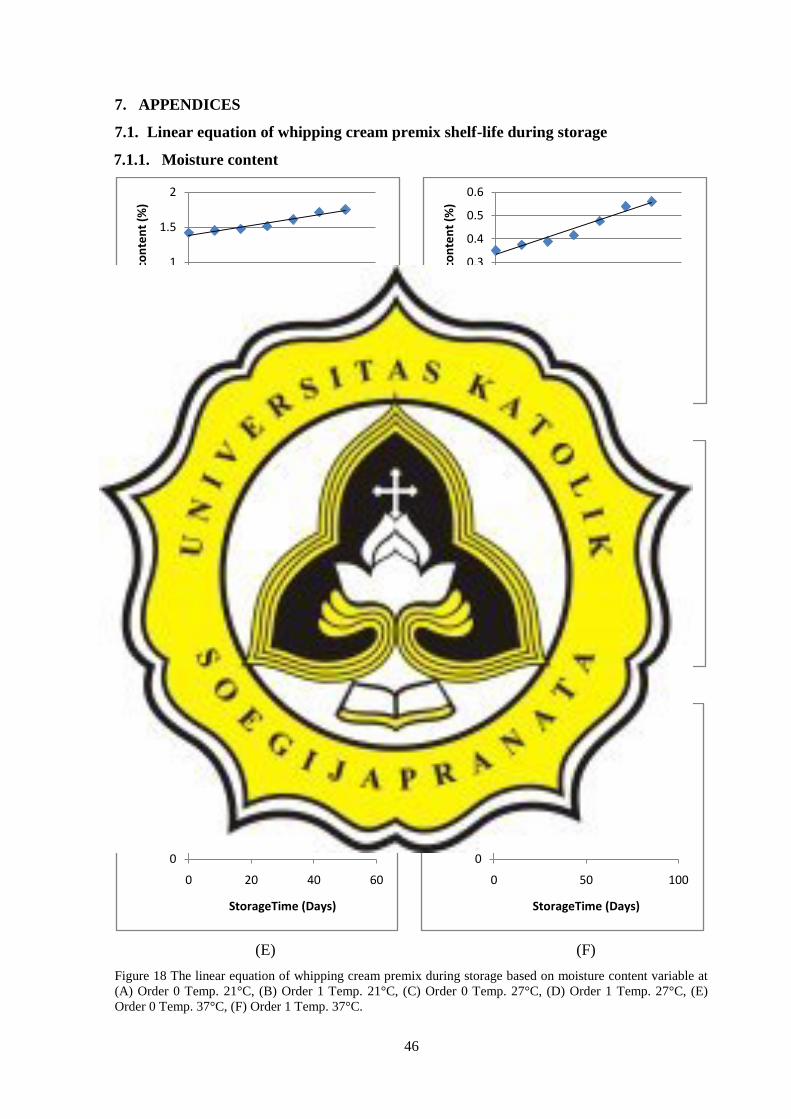
7.1.2. Water Activity
(A) (B)
(C) (D)
(E) (F)
Figure 19 The linear equation of whipping cream premix during storage based on water activity variable at (A)
Order 0 Temp. 21°C, (B) Order 1 Temp. 21°C, (C) Order 0 Temp. 27°C, (D) Order 1 Temp. 27°C, (E) Order 0
Temp. 37°C, (F) Order 1 Temp. 37°C.
y = 0.002x + 0.354R² = 0.972
0
0.1
0.2
0.3
0.4
0.5
0.6
0 50 100
ln k
1/T
y = 0.004x - 1.022R² = 0.977
-1.2
-1
-0.8
-0.6
-0.4
-0.2
0
0 50 100
ln k
1/T
y = 0.002x + 0.390R² = 0.962
0
0.1
0.2
0.3
0.4
0.5
0.6
0.7
0 50 100
ln k
1/T
y = 0.005x - 0.930R² = 0.935
-1.2
-1
-0.8
-0.6
-0.4
-0.2
0
0 50 100
ln k
1/T
y = 0.005x + 0.393R² = 0.948
0
0.1
0.2
0.3
0.4
0.5
0.6
0.7
0 20 40 60
ln k
1/T
y = 0.011x - 0.926R² = 0.920
-1.2
-1
-0.8
-0.6
-0.4
-0.2
0
0 20 40 60
ln k
1/T
48
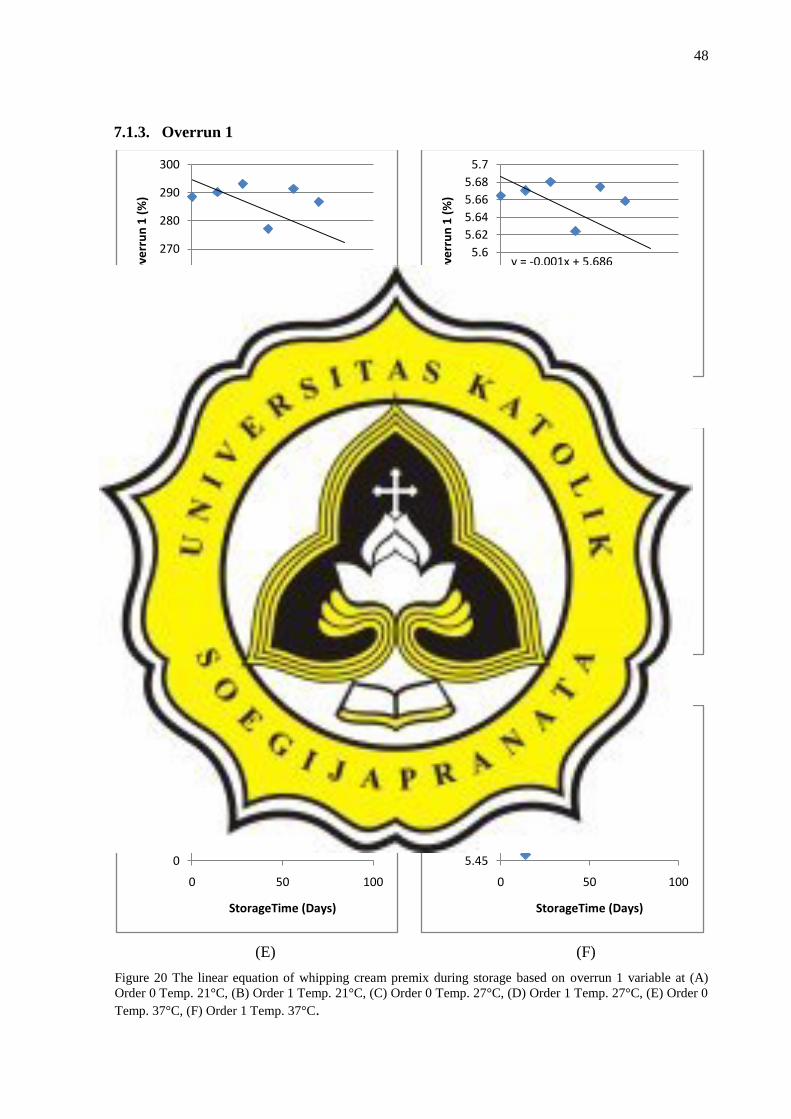
7.1.3. Overrun 1
(A) (B)
(C) (D)
(E) (F)
Figure 20 The linear equation of whipping cream premix during storage based on overrun 1 variable at (A)
Order 0 Temp. 21°C, (B) Order 1 Temp. 21°C, (C) Order 0 Temp. 27°C, (D) Order 1 Temp. 27°C, (E) Order 0
Temp. 37°C, (F) Order 1 Temp. 37°C.
y = -0.267x + 294.6R² = 0.389
250
260
270
280
290
300
0 50 100
Ove
rru
n 1
(%
)
StorageTime (Days)
y = -0.001x + 5.686R² = 0.391
5.54
5.56
5.58
5.6
5.62
5.64
5.66
5.68
5.7
0 50 100
Ove
rru
n 1
(%
)
StorageTime (Days)
y = -0.310x + 291.7R² = 0.596
250
260
270
280
290
300
0 50 100
Ove
rru
n 1
(%
)
StorageTime (Days)
y = -0.001x + 5.677R² = 0.588
5.525.545.565.58
5.65.625.645.665.68
5.7
0 50 100
Ove
rru
n 1
(%
)
StorageTime (Days)
y = -0.076x + 264R² = 0.019
0
50
100
150
200
250
300
350
0 50 100
Ove
rru
n 1
(%
)
StorageTime (Days)
y = -0.000x + 5.571R² = 0.012
5.45
5.5
5.55
5.6
5.65
5.7
0 50 100
Ove
rru
n 1
(%
)
StorageTime (Days)
49
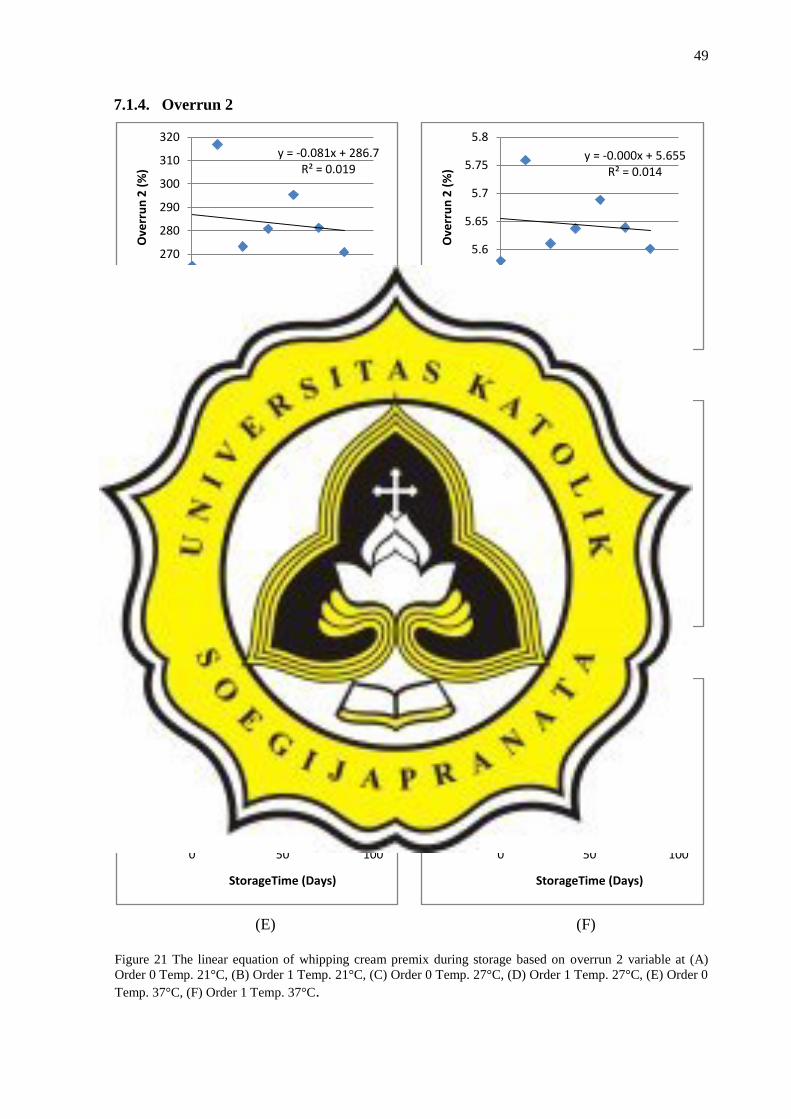
7.1.4. Overrun 2
(A) (B)
(C) (D)
(E) (F)
Figure 21 The linear equation of whipping cream premix during storage based on overrun 2 variable at (A)
Order 0 Temp. 21°C, (B) Order 1 Temp. 21°C, (C) Order 0 Temp. 27°C, (D) Order 1 Temp. 27°C, (E) Order 0
Temp. 37°C, (F) Order 1 Temp. 37°C.
y = -0.081x + 286.7R² = 0.019
260
270
280
290
300
310
320
0 50 100
Ove
rru
n 2
(%
)
StorageTime (Days)
y = -0.000x + 5.655R² = 0.014
5.55
5.6
5.65
5.7
5.75
5.8
0 50 100
Ove
rru
n 2
(%
)
StorageTime (Days)
y = 0.033x + 265.9R² = 0.008
250
255
260
265
270
275
280
285
0 50 100
Ove
rru
n 2
(%
)
StorageTime (Days)
y = 0.000x + 5.582R² = 0.007
5.52
5.54
5.56
5.58
5.6
5.62
5.64
5.66
0 50 100
Ove
rru
n 2
(%
)
StorageTime (Days)
y = 0.230x + 252.4R² = 0.257
230
240
250
260
270
280
290
0 50 100
Ove
rru
n 2
(%
)
StorageTime (Days)
y = 0.000x + 5.530R² = 0.255
5.45
5.5
5.55
5.6
5.65
0 50 100
Ove
rru
n 2
(%
)
StorageTime (Days)
50
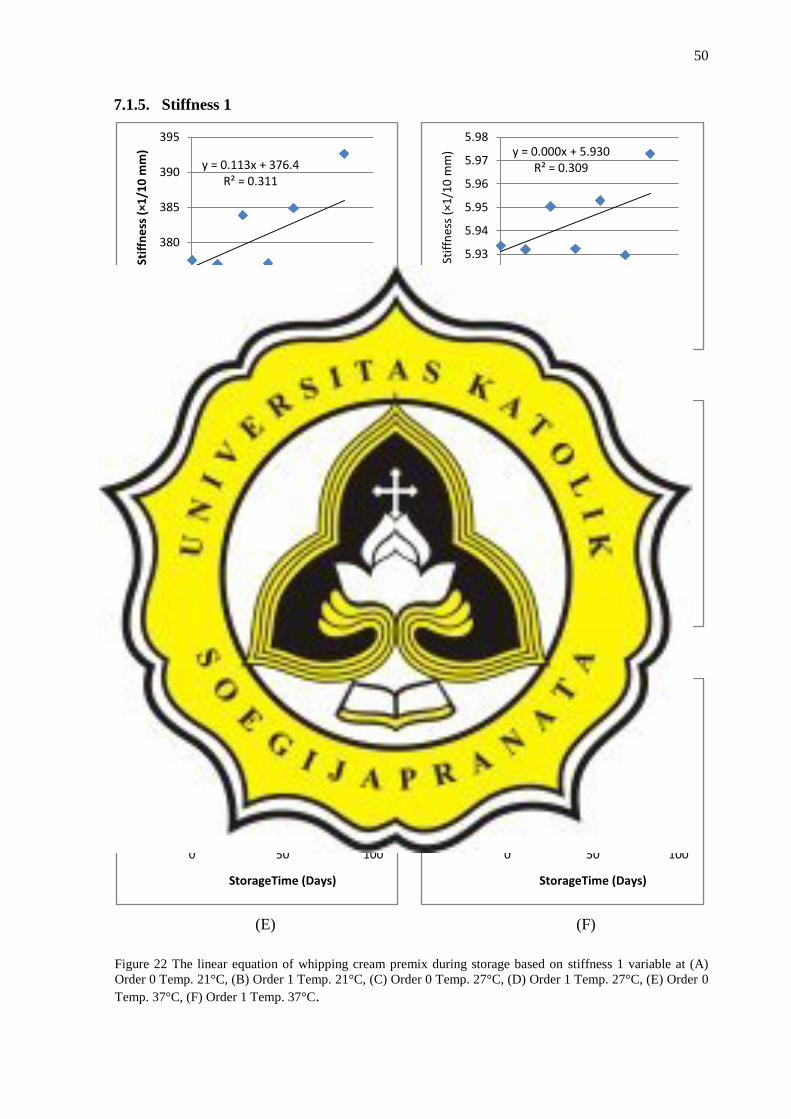
7.1.5. Stiffness 1
(A) (B)
(C) (D)
(E) (F)
Figure 22 The linear equation of whipping cream premix during storage based on stiffness 1 variable at (A)
Order 0 Temp. 21°C, (B) Order 1 Temp. 21°C, (C) Order 0 Temp. 27°C, (D) Order 1 Temp. 27°C, (E) Order 0
Temp. 37°C, (F) Order 1 Temp. 37°C.
y = 0.113x + 376.4R² = 0.311
375
380
385
390
395
0 50 100
Stif
fne
ss (
×1/1
0 m
m)
StorageTime (Days)
y = 0.000x + 5.930R² = 0.309
5.92
5.93
5.94
5.95
5.96
5.97
5.98
0 50 100
Stif
fnes
s (×
1/1
0 m
m)
StorageTime (Days)
y = 0.108x + 375.0R² = 0.183
370
375
380
385
390
395
0 50 100
Stif
fnes
s (×
1/1
0 m
m)
StorageTime (Days)
y = 0.000x + 5.927R² = 0.180
5.91
5.92
5.93
5.94
5.95
5.96
5.97
5.98
0 50 100
Stif
fnes
s (×
1/1
0 m
m)
StorageTime (Days)
y = 0.125x + 376.4R² = 0.853
374
376
378
380
382
384
386
388
390
0 50 100
Stif
fnes
s (×
1/1
0 m
m)
StorageTime (Days)
y = 0.000x + 5.930R² = 0.855
5.925
5.93
5.935
5.94
5.945
5.95
5.955
5.96
5.965
0 50 100
Stif
fnes
s (×
1/1
0 m
m)
StorageTime (Days)
51
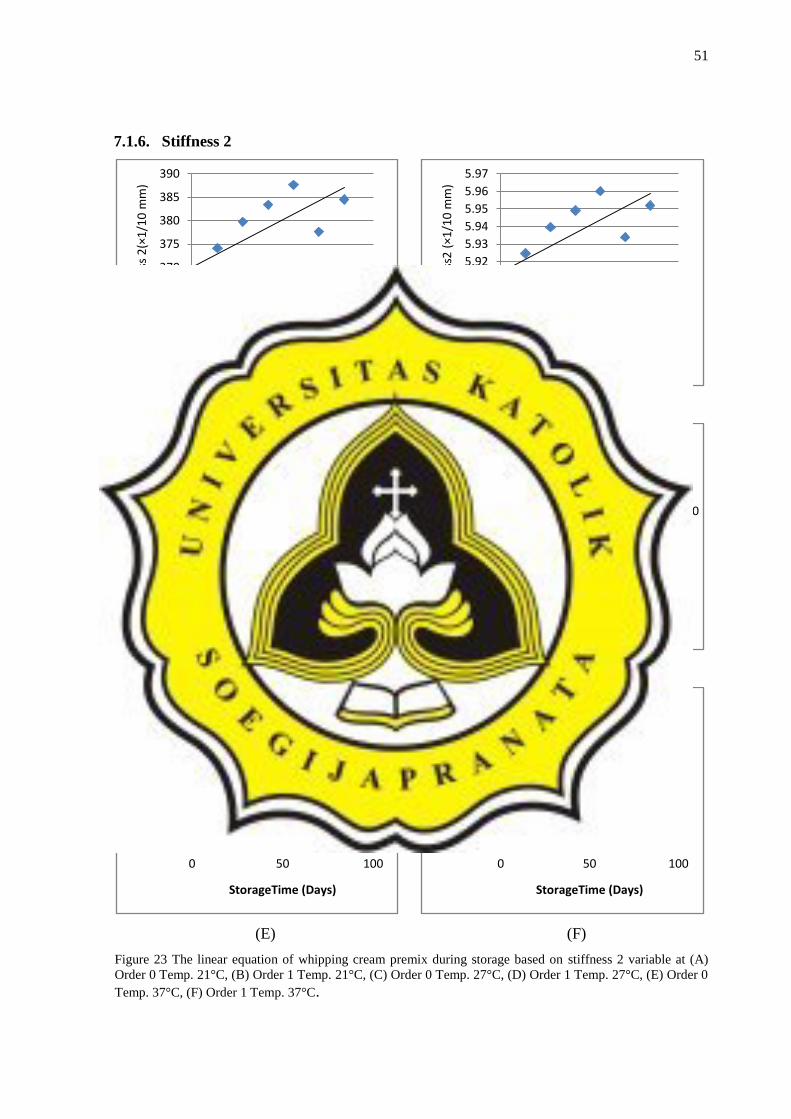
7.1.6. Stiffness 2
(A) (B)
(C) (D)
(E) (F)
Figure 23 The linear equation of whipping cream premix during storage based on stiffness 2 variable at (A)
Order 0 Temp. 21°C, (B) Order 1 Temp. 21°C, (C) Order 0 Temp. 27°C, (D) Order 1 Temp. 27°C, (E) Order 0
Temp. 37°C, (F) Order 1 Temp. 37°C.
y = 0.202x + 370.0R² = 0.556
360
365
370
375
380
385
390
0 50 100
Stif
fnes
s 2
(×1
/10
mm
)
StorageTime (Days)
y = 0.000x + 5.913R² = 0.556
5.89
5.9
5.91
5.92
5.93
5.94
5.95
5.96
5.97
0 50 100
Stif
fnes
s2 (
×1/1
0 m
m)
StorageTime (Days)
y = 0.107x + 368.7R² = 0.151
360
365
370
375
380
385
390
0 50 100
Stif
fnes
s 2
(×1
/10
mm
)
StorageTime (Days)
y = 0.000x + 5.910R² = 0.151
5.89
5.9
5.91
5.92
5.93
5.94
5.95
5.96
0 50 100
Stif
fnes
s2 (
×1/1
0 m
m)
StorageTime (Days)
y = 0.151x + 362.4R² = 0.406
355
360
365
370
375
380
385
0 50 100
Stif
fnes
s2 (
×1/1
0 m
m)
StorageTime (Days)
y = 0.000x + 5.893R² = 0.402
5.88
5.89
5.9
5.91
5.92
5.93
5.94
5.95
0 50 100
Stif
fnes
s2 (
×1/1
0 m
m)
StorageTime (Days)

52
7.2. Calculation of whipping cream premix shelf-life at room temperature (25°C/
298°K)
7.2.1. Based on Moisture Content Variable
y = -3.591x + 6,172
ln k = -3.591 (1/T) + 6,172
ln k = -3.591 (1/298) + 6,172
ln k = -5,8783
k = 0,0028
Therefore the shelf-life of whipping cream based on its moisture content (order 1) is:
ts = lnQ o−lnQ e
𝑘 =
1.42 − ln 3
0.0028 = 267,18 days
7.2.2. Based on Water Activity Variable
y = -5.507x + 12,5
y = -5.507 (1/T) + 12,5
y = -5.507 (1/298) + 12,5
y = -5,979 => ln k
k = 0,00253
Therefore the shelf-life of whipping cream based on its water activity (order 0) is:
ts = Qo−Qe
𝑘 =
0,367 − 1
0,00253 = 250,28 days
53
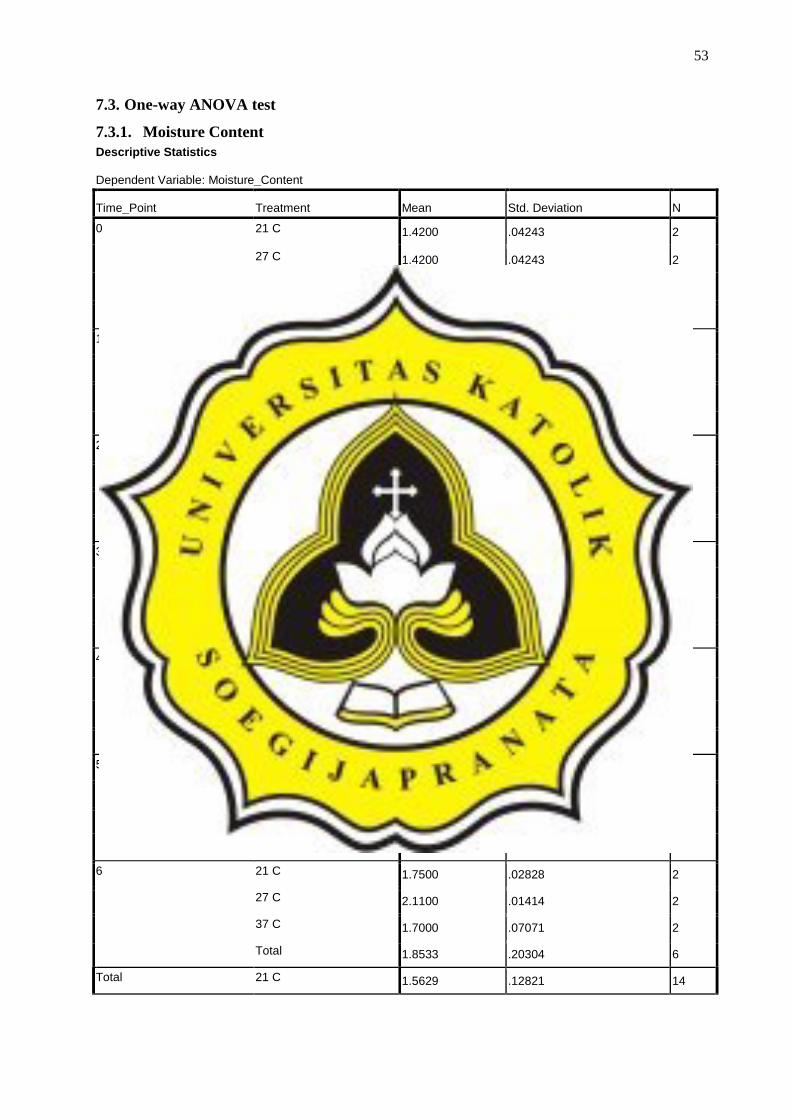
7.3. One-way ANOVA test
7.3.1. Moisture Content
Descriptive Statistics
Dependent Variable: Moisture_Content
Time_Point Treatment Mean Std. Deviation N
0 21 C 1.4200 .04243 2
27 C 1.4200 .04243 2
37 C 1.4200 .04243 2
Total 1.4200 .03286 6
1 21 C 1.4550 .03536 2
27 C 1.5100 .02828 2
37 C 1.4150 .07778 2
Total 1.4600 .05865 6
2 21 C 1.4750 .03536 2
27 C 1.5950 .00707 2
37 C 1.5900 .07071 2
Total 1.5533 .07033 6
3 21 C 1.5150 .02121 2
27 C 1.6300 .02828 2
37 C 1.5600 .05657 2
Total 1.5683 .05981 6
4 21 C 1.6100 .02828 2
27 C 1.7400 .01414 2
37 C 1.7500 .09899 2
Total 1.7000 .08390 6
5 21 C 1.7150 .04950 2
27 C 2.0150 .04950 2
37 C 1.6700 .08485 2
Total 1.8000 .17481 6
6 21 C 1.7500 .02828 2
27 C 2.1100 .01414 2
37 C 1.7000 .07071 2
Total 1.8533 .20304 6
Total 21 C 1.5629 .12821 14

54
27 C 1.7171 .24821 14
37 C 1.5864 .13782 14
Total 1.6221 .18838 42
Moisture_Content_21C
Duncan
Storage_Time N
Subset for alpha = 0.05
1 2 3 4
day 0 2 1.4200
day 14 2 1.4550 1.4550
day 28 2 1.4750 1.4750
day 42 2 1.5150
day 56 2 1.6100
day 70 2 1.7150
day 84 2 1.7500
Sig. .179 .147 1.000 .356
Means for groups in homogeneous subsets are displayed.
Moisture_Content_27C
Duncan
Storage_Time N
Subset for alpha = 0.05
1 2 3 4 5 6
day 0 2 1.4200
day 14 2 1.5100
day 28 2 1.5950
day 42 2 1.6300
day 56 2 1.7400
day 70 2 2.0150
day 84 2 2.1100
Sig. 1.000 1.000 .282 1.000 1.000 1.000
Means for groups in homogeneous subsets are displayed.
55
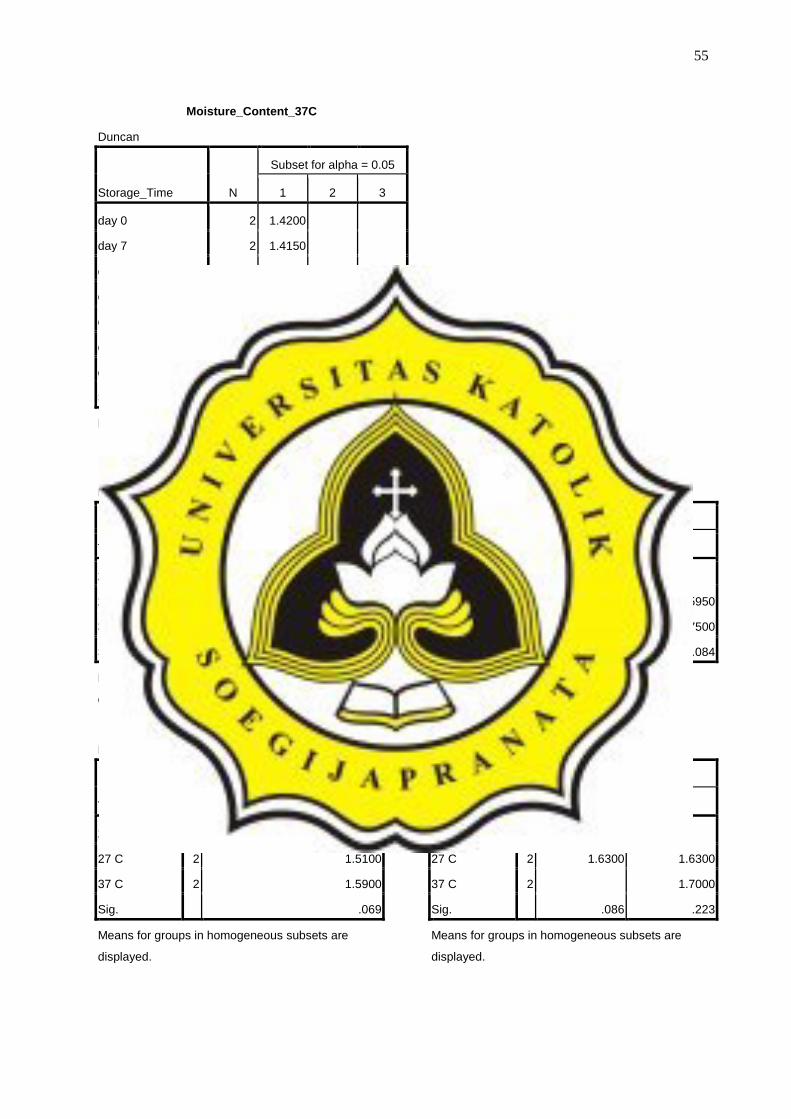
Moisture_Content_37C
Duncan
Storage_Time N
Subset for alpha = 0.05
1 2 3
day 0 2 1.4200
day 7 2 1.4150
day 14 2 1.5900 1.5900 1.5900
day 21 2 1.5600 1.5600
day 28 2 1.7500
day 35 2 1.6700 1.6700
day 42 2 1.7000 1.7000
Sig. .060 .116 .080
Means for groups in homogeneous subsets are displayed.
Moisture_Content_Day_0
Duncan
Treatment N
Subset for alpha = 0.05
1
21 C 2 1.4200
27 C 2 1.4200
37 C 2 1.4200
Sig. 1.000
Means for groups in homogeneous subsets are
displayed.
Moisture_Content_Day_14
Duncan
Treatment N
Subset for alpha = 0.05
1
21 C 2 1.4550
27 C 2 1.5100
37 C 2 1.5900
Sig. .069
Means for groups in homogeneous subsets are
displayed.
Moisture_Content_Day_28
Duncan
Treatment N
Subset for alpha = 0.05
1 2
21 C 2 1.4750
27 C 2 1.5950 1.5950
37 C 2 1.7500
Sig. .143 .084
Means for groups in homogeneous subsets are
displayed.
Moisture_Content_Day_42
Duncan
Treatment N
Subset for alpha = 0.05
1 2
21 C 2 1.5150
27 C 2 1.6300 1.6300
37 C 2 1.7000
Sig. .086 .223
Means for groups in homogeneous subsets are
displayed.

56
7.3.2. Water Activity
Descriptive Statistics
Dependent Variable:Water_Activity
Time_Point Treatment Mean Std. Deviation N
0 21 C .3670 .00849 2
27 C .3670 .00849 2
37 C .3670 .00849 2
Total .3670 .00657 6
1 21 C .3875 .00495 2
27 C .4485 .02192 2
37 C .4450 .03536 2
Total .4270 .03591 6
2 21 C .3945 .00212 2
27 C .4715 .02616 2
37 C .4725 .02051 2
Total .4462 .04271 6
3 21 C .4355 .01202 2
27 C .4930 .01556 2
37 C .5150 .04525 2
Total .4812 .04284 6
4 21 C .4815 .00778 2
27 C .5490 .06081 2
37 C .5665 .00212 2
Total .5323 .04862 6
5 21 C .5075 .01909 2
27 C .5760 .02546 2
37 C .5895 .01344 2
Total .5577 .04225 6
6 21 C .5375 .00495 2
27 C .5970 .00990 2
37 C .5935 .00778 2
Total .5760 .03047 6
Total 21 C .4444 .06345 14
27 C .5003 .08014 14
37 C .5070 .08278 14
Total .4839 .07932 42

57
Water_Activity_21C
Duncan
Storage_Time N
Subset for alpha = 0.05
1 2 3 4 5 6
day 0 2 .36700
day 14 2 .38750 .38750
day 28 2 .39450
day 42 2 .43550
day 56 2 .48150
day 70 2 .50750
day 84 2 .53750
Sig. .079 .505 1.000 1.000 1.000 1.000
Means for groups in homogeneous subsets are displayed.
Water_Activity_27C
Duncan
Storage_Time N
Subset for alpha = 0.05
1 2 3 4
day 0 2 .36700
day 14 2 .44850
day 28 2 .47150
day 42 2 .49300 .49300
day 56 2 .54900 .54900
day 70 2 .57600
day 84 2 .59700
Sig. 1.000 .184 .096 .156
Means for groups in homogeneous subsets are displayed.

58
Water_Activity_37C
Duncan
Storage_Time N
Subset for alpha = 0.05
1 2 3 4 5
day 0 2 .36700
day 7 2 .44500
day 14 2 .47250 .47250
day 21 2 .51500 .51500
day 28 2 .56650 .56650
day 35 2 .58950
day 42 2 .59350
Sig. 1.000 .290 .120 .069 .315
Means for groups in homogeneous subsets are displayed.
Water_Activity_Day_0
Duncan
Treatment N
Subset for alpha = 0.05
1
21 C 2 .36700
27 C 2 .36700
37 C 2 .36700
Sig. 1.000
Means for groups in homogeneous subsets are
displayed.
Water_Activity_Day_14
Duncan
Treatment N
Subset for alpha = 0.05
1 2
21 C 2 .38750
27 C 2 .44850
37 C 2 .47250
Sig. 1.000 .265
Means for groups in homogeneous subsets are
displayed.
Water_Activity_Day_28
Duncan
Treatment N
Subset for alpha = 0.05
1 2 3
21 C 2 .39450
27 C 2 .47150
37 C 2 .56650
Sig. 1.000 1.000 1.000
Means for groups in homogeneous subsets are
displayed.
Water_Activity_Day_42
Duncan
Treatment N
Subset for alpha = 0.05
1 2 3
21 C 2 .43550
27 C 2 .49300
37 C 2 .59350
Sig. 1.000 1.000 1.000
Means for groups in homogeneous subsets are
displayed.

59
7.3.3. Overrun 1
Descriptive Statistics
Dependent Variable:Overrun_1
Time_Point Treatment Mean Std. Deviation N
0 21 C 288.5000 4.94975 2
27 C 288.5000 4.94975 2
37 C 288.5000 4.94975 2
Total 288.5000 3.83406 6
1 21 C 290.2500 22.98097 2
27 C 281.1250 7.95495 2
37 C 235.5000 21.92031 2
Total 268.9583 30.04514 6
2 21 C 293.1250 13.61181 2
27 C 289.8750 2.29810 2
37 C 263.0000 4.24264 2
Total 282.0000 16.13769 6
3 21 C 277.1250 6.18718 2
27 C 280.8750 1.23744 2
37 C 251.3750 1.94454 2
Total 269.7917 14.66409 6
4 21 C 291.3750 5.83363 2
27 C 278.6250 1.94454 2
37 C 260.1250 4.06586 2
Total 276.7083 14.43556 6
5 21 C 286.7500 1.06066 2
27 C 279.0000 4.94975 2
37 C 271.3750 1.23744 2
Total 279.0417 7.26019 6
6 21 C 256.5000 4.59619 2
27 C 253.1250 4.77297 2
37 C 255.5000 4.24264 2
Total 255.0417 3.84518 6
Total 21 C 283.3750 14.78849 14
27 C 278.7321 12.14356 14
37 C 260.7679 17.19947 14
Total 274.2917 17.52871 42

60
Overrun_1_21C
Duncan
Storage_Time N
Subset for alpha = 0.05
1 2
day 0 2 288.5000
day 14 8 290.2500
day 28 8 293.1250
day 42 8 277.1250 277.1250
day 56 8 291.3750
day 70 8 286.7500
day 84 8 256.5000
Sig. .088 .244
Means for groups in homogeneous subsets are displayed.
Overrun_1_27C
Duncan
Storage_Time N
Subset for alpha = 0.05
1 2
day 0 2 288.5000
day 14 8 281.1250
day 28 8 289.8750
day 42 8 280.8750
day 56 8 278.6250
day 70 8 279.0000
day 84 8 253.1250
Sig. 1.000 .183
Means for groups in homogeneous subsets are displayed.
61
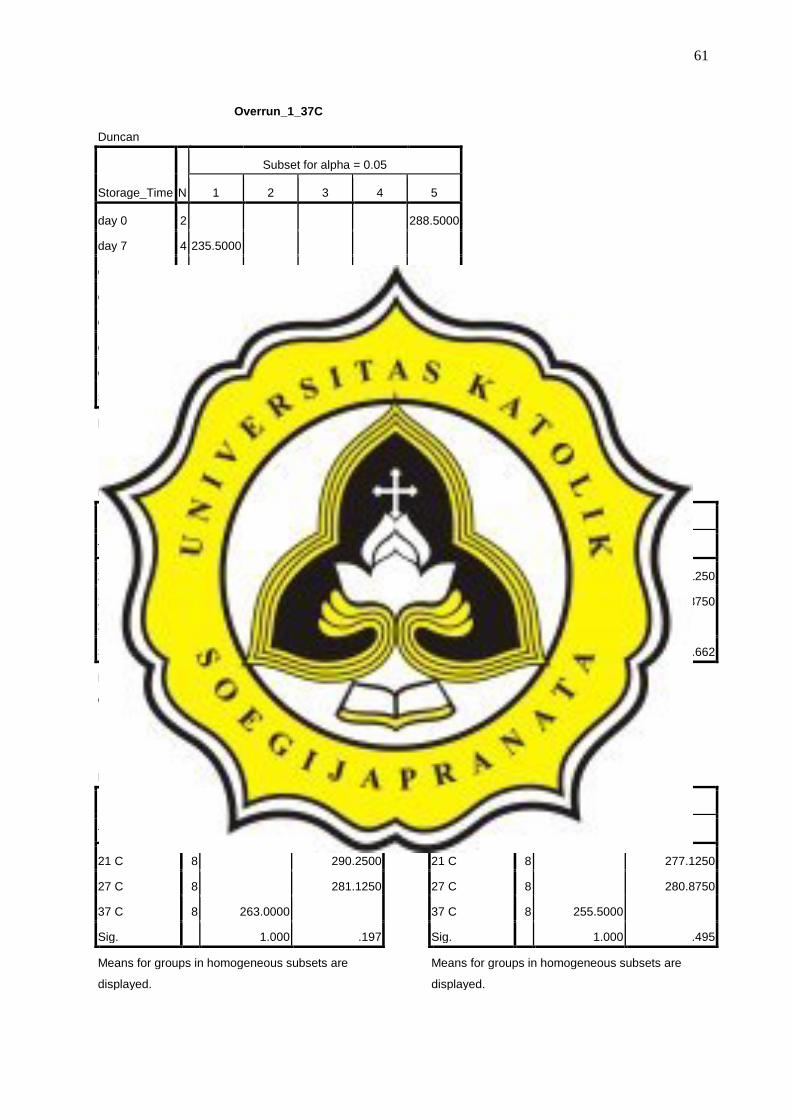
Overrun_1_37C
Duncan
Storage_Time N
Subset for alpha = 0.05
1 2 3 4 5
day 0 2 288.5000
day 7 4 235.5000
day 14 8 263.0000 263.0000
day 21 8 251.3750
day 28 8 260.1250 260.1250
day 35 8 271.3750
day 42 8 255.5000 255.5000
Sig. 1.000 .097 .154 .094 1.000
Means for groups in homogeneous subsets are displayed.
Overrun_1_Day_0
Duncan
Treatment N
Subset for alpha = 0.05
1
21 C 2 288.5000
27 C 2 288.5000
37 C 2 288.5000
Sig. 1.000
Means for groups in homogeneous subsets are
displayed.
Overrun_1_Day_14
Duncan
Treatment N
Subset for alpha = 0.05
1 2
21 C 8 290.2500
27 C 8 281.1250
37 C 8 263.0000
Sig. 1.000 .197
Means for groups in homogeneous subsets are
displayed.
Overrun_1_Day_28
Duncan
Treatment N
Subset for alpha = 0.05
1 2
21 C 8 293.1250
27 C 8 289.8750
37 C 8 260.1250
Sig. 1.000 .662
Means for groups in homogeneous subsets are
displayed.
Overrun_1_Day_42
Duncan
Treatment N
Subset for alpha = 0.05
1 2
21 C 8 277.1250
27 C 8 280.8750
37 C 8 255.5000
Sig. 1.000 .495
Means for groups in homogeneous subsets are
displayed.

62
7.3.4. Overrun 2
Descriptive Statistics
Dependent Variable:Overrun_2
Time_Point Treatment Mean Std. Deviation N
0 21 C 265.0000 .00000 2
27 C 265.0000 .00000 2
37 C 265.0000 .00000 2
Total 265.0000 .00000 6
1 21 C 316.8750 12.90470 2
27 C 259.8750 25.98617 2
37 C 238.5000 12.02082 2
Total 271.7500 38.86386 6
2 21 C 273.2500 9.89949 2
27 C 258.2500 14.14214 2
37 C 257.1250 4.06586 2
Total 262.8750 11.30238 6
3 21 C 280.7500 1.06066 2
27 C 281.5000 9.89949 2
37 C 276.6250 29.52171 2
Total 279.6250 14.12953 6
4 21 C 295.3750 13.25825 2
27 C 281.6250 12.90470 2
37 C 254.8750 1.23744 2
Total 277.2917 20.20112 6
5 21 C 281.2500 15.20280 2
27 C 270.7500 20.15254 2
37 C 264.5000 8.48528 2
Total 272.1667 14.11264 6
6 21 C 270.7500 31.46625 2
27 C 254.3750 17.14734 2
37 C 278.5000 4.59619 2
Total 267.8750 19.55553 6
Total 21 C 283.3214 20.41314 14
27 C 267.3393 15.92338 14
37 C 262.1607 16.13215 14
Total 270.9405 19.44550 42

63
Overrun_2_21C
Duncan
Storage_Time N
Subset for alpha = 0.05
1 2 3
day 0 2 265.0000
day 14 8 316.8750
day 28 8 273.2500 273.2500
day 42 8 280.7500 280.7500
day 56 8 295.3750 295.3750
day 70 8 281.2500 281.2500
day 84 8 270.7500 270.7500
Sig. .264 .091 .099
Means for groups in homogeneous subsets are displayed.
Overrun_2_27C
Duncan
Storage_Time N
Subset for alpha = 0.05
1
day 0 2 265.0000
day 14 8 259.8750
day 28 8 258.2500
day 42 8 281.5000
day 56 8 281.6250
day 70 8 270.7500
day 84 8 254.3750
Sig. .066
Means for groups in homogeneous subsets are displayed.
64
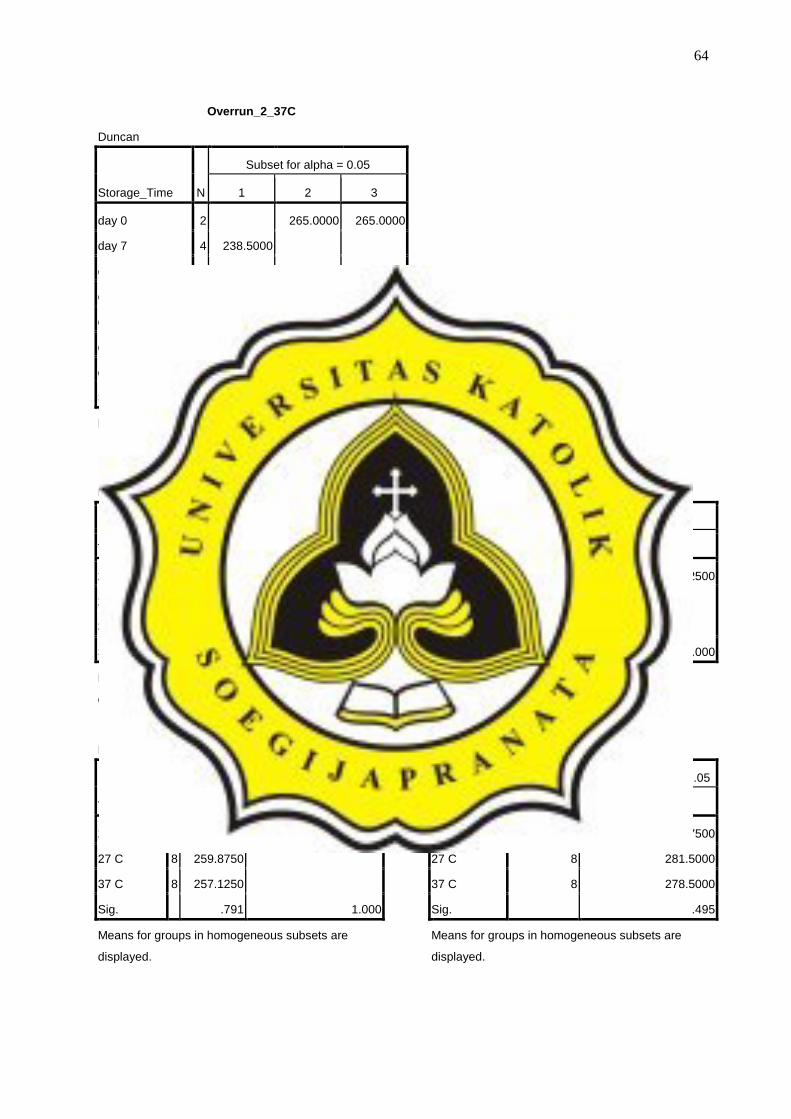
Overrun_2_37C
Duncan
Storage_Time N
Subset for alpha = 0.05
1 2 3
day 0 2 265.0000 265.0000
day 7 4 238.5000
day 14 8 257.1250
day 21 8 276.6250
day 28 8 254.8750
day 35 8 264.5000 264.5000
day 42 8 278.5000
Sig. 1.000 .251 .113
Means for groups in homogeneous subsets are displayed.
Overrun_2_Day_0
Duncan
Treatment N
Subset for alpha = 0.05
1
21 C 2 264.5000
27 C 2 264.5000
37 C 2 264.5000
Sig. 1.000
Means for groups in homogeneous subsets are
displayed.
Overrun_2_Day_14
Duncan
Treatment N
Subset for alpha = 0.05
1 2
21 C 8 316.8750
27 C 8 259.8750
37 C 8 257.1250
Sig. .791 1.000
Means for groups in homogeneous subsets are
displayed.
Overrun_2_Day_28
Duncan
Treatment N
Subset for alpha = 0.05
1 2
21 C 8 273.2500
27 C 8 258.2500
37 C 8 254.8750
Sig. .580 1.000
Means for groups in homogeneous subsets are
displayed.
Overrun_2_Day_42
Duncan
Treatment N
Subset for alpha = 0.05
1
21 C 8 280.7500
27 C 8 281.5000
37 C 8 278.5000
Sig. .495
Means for groups in homogeneous subsets are
displayed.

65
7.3.5. Stiffness 1
Descriptive Statistics
Dependent Variable:Stiffness_1
Time_Point Treatment Mean Std. Deviation N
0 21 C 377.5000 3.53553 2
27 C 377.5000 3.53553 2
37 C 377.5000 3.53553 2
Total 377.5000 2.73861 6
1 21 C 376.8750 4.06586 2
27 C 377.6250 1.23744 2
37 C 378.7500 3.18198 2
Total 377.7500 2.51992 6
2 21 C 383.8750 1.23744 2
27 C 372.1250 .17678 2
37 C 379.1250 4.06586 2
Total 378.3750 5.61861 6
3 21 C 377.0000 2.12132 2
27 C 378.0000 3.53553 2
37 C 379.5000 3.18198 2
Total 378.1667 2.58683 6
4 21 C 384.8750 9.36916 2
27 C 391.1250 .17678 2
37 C 382.2500 6.36396 2
Total 386.0833 6.50320 6
5 21 C 376.0000 6.36396 2
27 C 371.8750 .88388 2
37 C 387.7500 2.47487 2
Total 378.5417 7.98501 6
6 21 C 392.6250 .53033 2
27 C 389.1250 7.60140 2
37 C 386.8750 4.41942 2
Total 389.5417 4.71544 6
Total 21 C 381.2500 6.90666 14
27 C 379.6250 7.77122 14
37 C 381.6786 4.94919 14
Total 380.8512 6.54535 42

66
Stiffness_1_21C
Duncan
Storage_Time N
Subset for alpha = 0.05
1 2
day 0 2 377.5000
day 14 8 376.8750
day 28 8 383.8750 383.8750
day 42 8 377.0000
day 56 8 384.8750 384.8750
day 70 8 376.0000
day 84 8 392.6250
Sig. .144 .121
Means for groups in homogeneous subsets are displayed.
Stiffness_1_27C
Duncan
Storage_Time N
Subset for alpha = 0.05
1 2
day 0 2 377.5000
day 14 8 377.6250
day 28 8 372.1250
day 42 8 378.0000
day 56 8 391.1250
day 70 8 371.8750
day 84 8 389.1250
Sig. .108 .552
Means for groups in homogeneous subsets are displayed.

67
Stiffness_1_37C
Duncan
Storage_Time N
Subset for alpha = 0.05
1
day 0 2 377.5000
day 7 4 378.7500
day 14 8 379.1250
day 21 8 379.5000
day 28 8 382.2500
day 35 8 387.7500
day 42 8 386.8750
Sig. .061
Means for groups in homogeneous subsets are displayed.
Stiffness_1_Day_0
Duncan
Treatment N
Subset for alpha = 0.05
1
21 C 2 377.5000
27 C 2 377.5000
37 C 2 377.5000
Sig. 1.000
Means for groups in homogeneous subsets are
displayed.
Stiffness_1_Day_14
Duncan
Treatment N
Subset for alpha = 0.05
1
21 C 8 376.8750
27 C 8 377.6250
37 C 8 379.1250
Sig. .721
Means for groups in homogeneous subsets are
displayed.
Stiffness_1_Day_28
Duncan
Treatment N
Subset for alpha = 0.05
1 2
21 C 8 383.8750
27 C 8 372.1250
37 C 8 382.2500
Sig. 1.000 .575
Means for groups in homogeneous subsets are
displayed.
Stiffness_1_Day_42
Duncan
Treatment N
Subset for alpha = 0.05
1 2
21 C 8 377.0000
27 C 8 378.0000
37 C 8 386.8750
Sig. .723 1.000
Means for groups in homogeneous subsets are
displayed.

68
7.3.6. Stiffness 2
Descriptive Statistics
Dependent Variable:Stiffness_2
Time_Point Treatment Mean Std. Deviation N
0 21 C 363.0000 4.24264 2
27 C 363.0000 4.24264 2
37 C 363.0000 4.24264 2
Total 363.0000 3.28634 6
1 21 C 374.1250 3.35876 2
27 C 367.1250 1.59099 2
37 C 363.7500 8.13173 2
Total 368.3333 6.19610 6
2 21 C 379.7500 2.82843 2
27 C 375.2500 9.54594 2
37 C 372.7500 2.82843 2
Total 375.9167 5.61174 6
3 21 C 383.3750 6.54074 2
27 C 377.1250 3.71231 2
37 C 368.1250 4.06586 2
Total 376.2083 7.85082 6
4 21 C 387.6250 5.83363 2
27 C 386.3750 5.12652 2
37 C 360.0000 2.47487 2
Total 378.0000 14.42221 6
5 21 C 377.6250 5.12652 2
27 C 378.7500 .70711 2
37 C 374.0000 13.78858 2
Total 376.7917 6.95057 6
6 21 C 384.5000 6.71751 2
27 C 365.6250 10.78338 2
37 C 380.2500 3.18198 2
Total 376.7917 10.61769 6
Total 21 C 378.5714 8.74831 14
27 C 373.3214 9.25256 14
37 C 368.8393 8.48789 14
Total 373.5774 9.51098 42

69
Stiffness_2_21C
Duncan
Storage_Time N
Subset for alpha = 0.05
1 2 3
day 0 2 363.0000
day 14 8 374.1250
day 28 8 379.7500 379.7500
day 42 8 383.3750 383.3750
day 56 8 387.6250
day 70 8 377.6250 377.6250
day 84 8 384.5000 384.5000
Sig. 1.000 .064 .075
Means for groups in homogeneous subsets are displayed.
Stiffness_2_27C
Duncan
Storage_Time N
Subset for alpha = 0.05
1 2
day 0 2 363.0000
day 14 8 367.1250
day 28 8 375.2500 375.2500
day 42 8 377.1250 377.1250
day 56 8 386.3750
day 70 8 378.7500 378.7500
day 84 8 365.6250
Sig. .053 .155
Means for groups in homogeneous subsets are displayed.
70
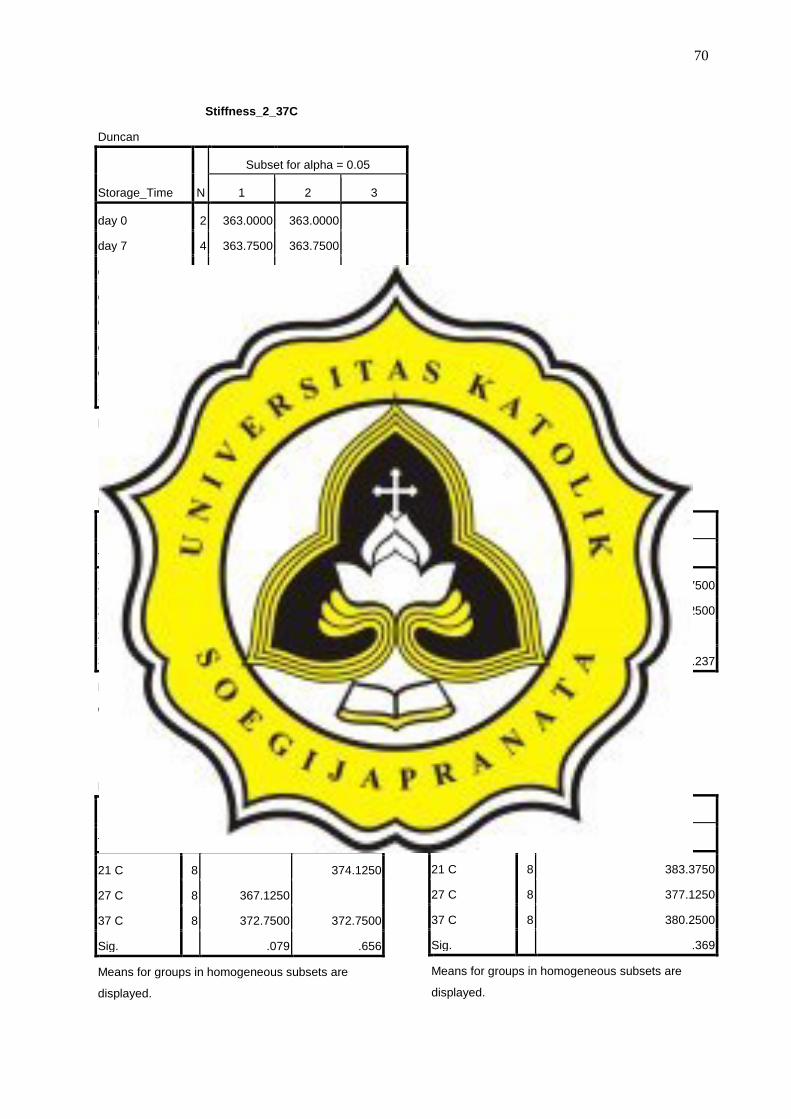
Stiffness_2_37C
Duncan
Storage_Time N
Subset for alpha = 0.05
1 2 3
day 0 2 363.0000 363.0000
day 7 4 363.7500 363.7500
day 14 8 372.7500 372.7500
day 21 8 368.1250 368.1250
day 28 8 360.0000
day 35 8 374.0000 374.0000
day 42 8 380.2500
Sig. .187 .081 .207
Means for groups in homogeneous subsets are displayed.
Stiffness_2_Day_0
Duncan
Treatment N
Subset for alpha = 0.05
1
21 C 2 363.0000
27 C 2 363.0000
37 C 2 363.0000
Sig. 1.000
Means for groups in homogeneous subsets are
displayed.
Stiffness_2_Day_14
Duncan
Treatment N
Subset for alpha = 0.05
1 2
21 C 8 374.1250
27 C 8 367.1250
37 C 8 372.7500 372.7500
Sig. .079 .656
Means for groups in homogeneous subsets are
displayed.
Stiffness_2_Day_28
Duncan
Treatment N
Subset for alpha = 0.05
1 2
21 C 8 379.7500
27 C 8 375.2500
37 C 8 360.0000
Sig. 1.000 .237
Means for groups in homogeneous subsets are
displayed.
Stiffness_2_Day_42
Duncan
Treatment N
Subset for alpha = 0.05
1
21 C 8 383.3750
27 C 8 377.1250
37 C 8 380.2500
Sig. .369
Means for groups in homogeneous subsets are
displayed.

71
7.4. Normality data test
7.4.1. Temperature treatment
Tests of Normality
Treatment
Kolmogorov-Smirnova Shapiro-Wilk
Statistic df Sig. Statistic df Sig.
Moisture_Content 21 C .188 14 .194 .914 14 .179
27 C .178 14 .200* .898 14 .105
37 C .111 14 .200* .978 14 .959
Water_Activity 21 C .206 14 .111 .909 14 .151
27 C .154 14 .200* .929 14 .292
37 C .187 14 .200* .898 14 .105
Overrun_1 21 C .164 14 .200* .955 14 .642
27 C .252 14 .016 .841 14 .017
37 C .194 14 .160 .936 14 .366
Overrun_2 21 C .113 14 .200* .973 14 .915
27 C .156 14 .200* .949 14 .544
37 C .164 14 .200* .960 14 .719
Stiffness_1 21 C .186 14 .200* .914 14 .180
27 C .169 14 .200* .880 14 .058
37 C .143 14 .200* .938 14 .388
Stiffness_2 21 C .121 14 .200* .967 14 .839
27 C .131 14 .200* .971 14 .886
37 C .131 14 .200* .939 14 .408
a. Lilliefors Significance Correction
*. This is a lower bound of the true significance.

72
7.5. Correlation test
Correlations
Moisture_ Content
Water_ Activity Overrun_1 Overrun_2 Stiffness_1 Stiffness_2
Moisture_Content Pearson Correlation 1 .812** -.292 -.077 .300 .185
Sig. (2-tailed) .000 .060 .629 .054 .242
N 42 42 42 42 42 42
Water_Activity Pearson Correlation .812** 1 -.468
** -.099 .431
** .260
Sig. (2-tailed) .000 .002 .534 .004 .096
N 42 42 42 42 42 42
Overrun_1 Pearson Correlation -.292 -.468** 1 .467
** -.327
* .193
Sig. (2-tailed) .060 .002 .002 .034 .222
N 42 42 42 42 42 42
Overrun_2 Pearson Correlation -.077 -.099 .467** 1 .021 .525
**
Sig. (2-tailed) .629 .534 .002 .897 .000
N 42 42 42 42 42 42
Stiffness_1 Pearson Correlation .300 .431** -.327
* .021 1 .286
Sig. (2-tailed) .054 .004 .034 .897 .066
N 42 42 42 42 42 42
Stiffness_2 Pearson Correlation .185 .260 .193 .525** .286 1
Sig. (2-tailed) .242 .096 .222 .000 .066
N 42 42 42 42 42 42
**. Correlation is significant at the 0.01 level (2-tailed).
*. Correlation is significant at the 0.05 level (2-tailed).

73
7.6. Overrun Table
7.6.1. Cup Code 1532

74
7.6.2. Cup Code 1535

75
7.6.3. Cup Code 1536

76
7.6.4. Cup Code 1537

77
7.7. Decoration properties photos
7.7.1. Whipped cream premix stored at 21°C from various storage times
7.7.1.1. Week 0
Figure 24 Photos of decoration properties changes of applied whipped cream (number of cracking and its size) from 5 different angles. Observed on Day 1 and Day 4.

78
7.7.1.2. Week 2
Figure 25 Photos of decoration properties changes of applied whipped cream (number of cracking and its size) from 5 different angles. Observed in 6 days.

79
7.7.1.3. Week 4
Figure 26 Photos of decoration properties changes of applied whipped cream (number of cracking and its size) from 5 different angles. Observed in 5 days.

80
7.7.1.4. Week 6
Figure 27 Photos of decoration properties changes of applied whipped cream (number of cracking and its size) from 5 different angles. Observed in 5 days.

81
7.7.1.5. Week 8
Figure 28 Photos of decoration properties changes of applied whipped cream (number of cracking and its size) from 5 different angles. Observed in 6 days.

82
7.7.1.6. Week 10
Figure 29 Photos of decoration properties changes of applied whipped cream (number of cracking and its size) from 5 different angles. Observed on day 0, 1, 3 and 4.

83
7.7.1.7. Week 12
Figure 30 Photos of decoration properties changes of applied whipped cream (number of cracking and its size) from 5 different angles. Observed on day 1-5.

84
7.7.2. Whipped cream premix stored at 27°C from various storage times
7.7.2.1. Week 0
Figure 31 Photos of decoration properties changes of applied whipped cream (number of cracking and its size) from 5 different angles. Observed on day 1 and 4.

85
7.7.2.2. Week 2
Figure 32 Photos of decoration properties changes of applied whipped cream (number of cracking and its size) from 5 different angles. Observed in 6 days.

86
7.7.2.3. Week 4
Figure 33 Photos of decoration properties changes of applied whipped cream (number of cracking and its size) from 5 different angles. Observed in 6 days.

87
7.7.2.4. Week 6
Figure 34 Photos of decoration properties changes of applied whipped cream (number of cracking and its size) from 5 different angles. Observed in 5 days.

88
7.7.2.5. Week 8
Figure 35 Photos of decoration properties changes of applied whipped cream (number of cracking and its size) from 5 different angles. Observed in 6 days.

89
7.7.2.6. Week 10
Figure 36 Photos of decoration properties changes of applied whipped cream (number of cracking and its size) from 5 different angles. Observed on day 0, 1, 3, 4.

90
7.7.2.7. Week 12
Figure 37 Photos of decoration properties changes of applied whipped cream (number of cracking and its size) from 5 different angles. Observed on day 1-5.

91
7.7.3. Whipped cream premix stored at 37°C from various storage time
7.7.3.1. Week 0
Figure 38 Photos of decoration properties changes of applied whipped cream (number of cracking and its size) from 5 different angles. Observed on day 1 and 4.

92
7.7.3.2. Week 1
Figure 39 Photos of decoration properties changes of applied whipped cream (number of cracking and its size) from 5 different angles. Observed in 6 days.

93
7.7.3.3. Week 2
Figure 40 Photos of decoration properties changes of applied whipped cream (number of cracking and its size) from 5 different angles. Observed on day 1-5.

94
7.7.3.4. Week 3
Figure 41 Photos of decoration properties changes of applied whipped cream (number of cracking and its size) from 5 different angles. Observed on day 0, 1, 3, 4, 5.

95
7.7.3.5. Week 4
Figure 42 Photos of decoration properties changes of applied whipped cream (number of cracking and its size) from 5 different angles. Observed in 6 days.

96
7.7.3.6. Week 5
Figure 43 Photos of decoration properties changes of applied whipped cream (number of cracking and its size) from 5 different angles. Observed in 6 days.

73
7.7.3.7. Week 6
Figure 44 Photos of decoration properties changes of applied whipped cream (number of cracking and its size) from 5 different angles. Observed in 5 days.
97