6. Real-time (Intra-Zonal) Congestion - California ISO · Department of Market Monitoring –...
15
Department of Market Monitoring – California ISO April 2006 6. Real-time (Intra-Zonal) Congestion 6.1 Introduction/Background Real-time congestion occurs when scheduled power flows overload the transfer capability of grid facilities. The CAISO’s day-ahead and hour-ahead congestion management system has established congestion zones that it models in order to measure and manage congestion. Real- time congestion results from a combination of economic factors and the fact that the CAISO only manages zonal congestion in the Day Ahead and Hour Ahead Markets. Scheduling Coordinators (SCs) submit day-ahead/hour-ahead generation schedules to the CAISO. Due to differences in the price and availability of power in different locations, these schedules vary daily and, collectively, may exceed the transfer capability of grid facilities within the congestion zones. However, the CAISO’s congestion management system measures and manages congestion only between zones, not within zones. This allows SCs, collectively, to submit day-ahead/hour-ahead schedules calling for transmission within a zone that is not physically feasible. This creates the need for CAISO operators to have to manage intra-zonal congestion in real-time. Managing large amounts of intra-zonal congestion in real-time creates operational and reliability challenges and can result in significant costs. Intra-zonal congestion costs are comprised of three components: 1. Minimum Load Cost Compensation (MLCC). 1 These costs result from generating units that are committed to operate on a day-ahead basis under the provisions of the Must- Offer Obligation in order to mitigate anticipated intra-zonal congestion. 2 2. Costs from Reliability Must Run (RMR) real-time dispatches that are the first response to intra-zonal congestion. 3. Costs of Out-of-Sequence (OOS) dispatches. Intra-zonal congestion most frequently occurs in load pockets, or areas where load is concentrated with insufficient transmission to allow access to competitively priced energy. In some cases, the CAISO must also decrement generation outside the load pocket to balance the incremental generation dispatched within. Intra-zonal congestion can also occur due to generation pockets in which generation is clustered together, with insufficient transmission to allow the energy to flow out of the pocket area. In both cases, the absence of sufficient transmission access to an area means that the CAISO has to resolve the problem locally, either by incrementing generation within a load pocket or by decrementing it in a generation pocket. Typically, there is very limited competition within load or generation pockets, since the bulk of generation within such pockets is owned by just one or two suppliers. As a result, intra-zonal congestion is closely intertwined with the issue of locational market power. Methods to resolve intra-zonal congestion are designed to limit the ability of suppliers to exercise locational market power. The CAISO’s current method for dealing with incremental intra-zonal congestion involves a combination of steps and operating procedures. On a day-ahead basis, the CAISO often 1 MLCC payments are cost-based and are calculated as variable cost for providing the minimum load energy plus a $6/MWh O&M adder. 2 Pursuant to Amendment 60, MLCC costs are categorized into three categories (system, zonal and local), which reflect the primary reason the unit was denied a must-offer waiver. Both zonal and local MLCC costs are included as the MLCC component of intra-zonal costs. Annual Report on Market Issues and Performance 6-1
Transcript of 6. Real-time (Intra-Zonal) Congestion - California ISO · Department of Market Monitoring –...

Department of Market Monitoring – California ISO April 2006
6. Real-time (Intra-Zonal) Congestion
6.1 Introduction/Background
Real-time congestion occurs when scheduled power flows overload the transfer capability of grid facilities. The CAISO’s day-ahead and hour-ahead congestion management system has established congestion zones that it models in order to measure and manage congestion. Real-time congestion results from a combination of economic factors and the fact that the CAISO only manages zonal congestion in the Day Ahead and Hour Ahead Markets.
Scheduling Coordinators (SCs) submit day-ahead/hour-ahead generation schedules to the CAISO. Due to differences in the price and availability of power in different locations, these schedules vary daily and, collectively, may exceed the transfer capability of grid facilities within the congestion zones. However, the CAISO’s congestion management system measures and manages congestion only between zones, not within zones. This allows SCs, collectively, to submit day-ahead/hour-ahead schedules calling for transmission within a zone that is not physically feasible. This creates the need for CAISO operators to have to manage intra-zonal congestion in real-time. Managing large amounts of intra-zonal congestion in real-time creates operational and reliability challenges and can result in significant costs.
Intra-zonal congestion costs are comprised of three components:
1. Minimum Load Cost Compensation (MLCC).1 These costs result from generating units that are committed to operate on a day-ahead basis under the provisions of the Must-Offer Obligation in order to mitigate anticipated intra-zonal congestion.2
2. Costs from Reliability Must Run (RMR) real-time dispatches that are the first response to intra-zonal congestion.
3. Costs of Out-of-Sequence (OOS) dispatches.
Intra-zonal congestion most frequently occurs in load pockets, or areas where load is concentrated with insufficient transmission to allow access to competitively priced energy. In some cases, the CAISO must also decrement generation outside the load pocket to balance the incremental generation dispatched within. Intra-zonal congestion can also occur due to generation pockets in which generation is clustered together, with insufficient transmission to allow the energy to flow out of the pocket area. In both cases, the absence of sufficient transmission access to an area means that the CAISO has to resolve the problem locally, either by incrementing generation within a load pocket or by decrementing it in a generation pocket. Typically, there is very limited competition within load or generation pockets, since the bulk of generation within such pockets is owned by just one or two suppliers. As a result, intra-zonal congestion is closely intertwined with the issue of locational market power. Methods to resolve intra-zonal congestion are designed to limit the ability of suppliers to exercise locational market power.
The CAISO’s current method for dealing with incremental intra-zonal congestion involves a combination of steps and operating procedures. On a day-ahead basis, the CAISO often 1 MLCC payments are cost-based and are calculated as variable cost for providing the minimum load energy plus a
$6/MWh O&M adder. 2 Pursuant to Amendment 60, MLCC costs are categorized into three categories (system, zonal and local), which
reflect the primary reason the unit was denied a must-offer waiver. Both zonal and local MLCC costs are included as the MLCC component of intra-zonal costs.
Annual Report on Market Issues and Performance 6-1

Department of Market Monitoring – California ISO April 2006
constrains long-start thermal units through the must-offer waiver (MOW) process in return for minimum load cost payments. This is the means to mitigate intra-zonal congestion that may be anticipated based upon day-ahead schedules submitted by market participants. Units required to operate under the MOW process are typically dispatched at minimum load levels. They are then required to bid all unloaded capacity into the CAISO real-time market.3 In real-time, the CAISO dispatches real-time energy bids in merit order (based on bid price) in order to balance overall system or zonal loads and generation. If dispatch of in-sequence bids does not resolve intra-zonal congestion in real-time, the CAISO can mitigate intra-zonal congestion in three ways:
• First, the CAISO may dispatch available RMR capacity to mitigate congestion;
• Second, should energy from RMR units be insufficient, the CAISO may dispatch other units by calling real-time energy bids OOS;4
• Finally, if insufficient market bids exist to mitigate intra-zonal congestion, the CAISO may call units Out-Of-Market (OOM).
Units incremented OOS to mitigate intra-zonal congestion are paid the higher of their bid price or the zonal market clearing price. They do not set the real-time market clearing price. Units decremented OOS to mitigate intra-zonal congestion are charged the lower of their decremental reference price or the zonal market-clearing price. They also do not set the real-time market clearing price. Inter-tie bids taken OOS are settled on an as-bid basis.
In addition, OOS bids are subject to local market power mitigation. Specifically, incremental OOS dispatches are subject to a conduct test where accepted OOS bids priced greater than the minimum of $50 or 200 percent above interval MCP are mitigated to their reference price for that OOS dispatch and are settled at the greater of mitigated bid price or the interval MCP. To the extent decremental bids are dispatched OOS for intra-zonal congestion, such dispatches will be based on decremental reference levels provided by an independent entity (Potomac Economics) rather than market bids.
6.2 Major Points of Intra-Zonal Congestion
Most of the major points of intra-zonal congestion in 2005 were located in the CAISO’s southern congestion zone (SP15). Three new major points of intra-zonal congestion in 2005 were South of Pastoria, South of Magunden, and Cortina/North Geyser. Figure 6.1 shows the approximate location of each of these points in the CAISO Control Area.
3 Available thermal units within the CAISO Control Area are subject to the Must-Offer-Obligation (MOO) whereby
incremental energy bids are automatically inserted for them if they fail to do so themselves. There is no MOO for decremental energy bids.
4 The term “out-of-sequence” refers to the fact that such dispatches require the CAISO, when incrementing (or decrementing) generation, to bypass lower (or higher) priced, in-sequence, real-time bids to find a unit whose grid location enables it to mitigate a particular intra-zonal congestion problem.
6-2 Annual Report on Market Issues and Performance

Department of Market Monitoring – California ISO April 2006
Figure 6.1 Major Points of Intra-Zonal Congestion in 2005
Sylmar
GenerationSubstation
Vincent
Midway
Los Banos
Gates
NP15
SP15
ZP26
ImperialValley
Devers
Palo VerdeBranch Group
Path 26
Path 15
Major points of intra-zonal congestion
GeysersCortina
MagundenPastoria
Lugo
Miguel
Figure 6.2 shows the percentages of total (OOS) redispatch cost5 for each of the major intra-zonal congestion points. A description of each of these major intra-zonal constraints is provided below.
5 The redispatch cost for units with incremented OOS dispatches that are not mitigated under the local market
mitigation procedures is calculated as the higher of the unit’s bid price minus the zonal market-clearing price or zero. For incremental OOS dispatches that are mitigated under the local market power mitigation procedures, the redispatch cost will be based on the same formula except that the unit’s incremental reference price will be used in place of its market bid. The redispatch costs for decremental intra-zonal congestion is calculated as the higher of zero or the zonal market-clearing prices minus the unit’s decremental reference level.
Annual Report on Market Issues and Performance 6-3

Department of Market Monitoring – California ISO April 2006
Figure 6.2 Real-time Intra-Zonal OOS Redispatch Costs by Reason
40%
21%13%
7%
8%11% Miguel
South of PastoriaCortina/North GeyserSouth of MagundenSouth of LugoOther
Miguel. Intra-zonal congestion costs associated with the Miguel area decreased in 2005 compared to 2004. The decrease in congestion cost on the Miguel substation close to San Diego is attributable largely to the upgrade of the new Miguel #2 230 kV line, which was on line in June 2005. The upgrade resulted in the congestion cost in this area steadily going down from Spring 2005 through Summer 2005. Prior to the upgrade, intra-zonal congestion was frequent and significant due to the addition of three new generation units in northern Mexico in 2003 comprising about 1,070 MW of capacity. These units are connected to the CAISO system at the Imperial Valley substation. When combined with imported energy on the Palo Verde Inter-tie, this additional generation has frequently created congestion at the Miguel substation. To mitigate congestion at Miguel, the CAISO must increment resources in the San Diego area, and must decrement generation in northern Mexico east of Miguel and/or decrement imports on the Palo Verde tie point with Arizona. The cost in January 2005 (prior to the upgrade) was $3.6 million, whereas in August 2005 intra-zonal congestion management costs were less than $0.2 million. However, the largest single component of OOS redispatch costs is attributable to intra-zonal congestion at Miguel, with 40 percent of total OOS redispatch cost. While the upgrades did appear to decrease redispatch costs resulting from real-time congestion management at Miguel in the first half of the year, those costs began increasing again during the second half of the year, peaking at $3 million in December. South of Pastoria/South of Magunden. Since Pastoria Energy Facility’s combined cycle unit started its operation in February 2005 with an initial maximum capacity of 255 MW that was gradually increased to a maximum capacity of 750 MW in July 2005, the transmission lines in South of Pastoria (Pastoria – Pardee 230 kV line, Pastoria – Bailey – Pardee 230 kV line, and Pastoria – Warne – Pardee 230 kV line) and two 230 kV lines from Magunden to Antelope are inadequate to handle the output from the new generator and output from the Big Creek hydroelectric facility. As a consequence, the CAISO has been mitigating the intra-zonal congestion in this area during the second half of 2005. Monthly redispatch costs to mitigate this intra-zonal congestion has varied from $1 million to $2 million dollars starting from September 2005. The recent projects by SCE to reconductor the Pastoria/Pardee line and the Pastoria/Bailey line will relieve the severity of congestion in future. The reconductoring work of these two lines is expected to be finished in March 2006 and June 2006, respectively.
Cortina/North Geysers. The Cortina/North Geysers area experienced significant congestion in Spring 2005, when a major upgrade in the transmission system was in full construction. The upgrades included: Cortina 420 MVA 230/60kV Transformer Bank #4, Cortina – Eagle Rock/
6-4 Annual Report on Market Issues and Performance
Department of Market Monitoring – California ISO April 2006
Eagle Rock – Red Bud 115 kV Line Swap, Mendocino 200 MVA 115/60kV Transformer Bank and Mendocino 75 MVAR 115kV Capacitor Bank. The area voltage stability margin and thermal overload were improved upon the completion of these upgrades in Fall 2005. The congestion cost was greatly reduced to insignificant numbers.
South of Lugo. The total OOS redispatch cost of mitigating South of Lugo congestion in 2005 was a little less than $3 million. SCE added equipment that allowed the CAISO to boost the rated capacity of the grid in the Victorville/Norco/Ontario area by 500 MW. The upgrade reduces congestion and supplies more electricity to the Los Angeles Basin. However, the South of Lugo area still remains one of the most constrained areas in the CAISO system. Mitigation costs approached $1 million in November 2005 due to line outages.
6.3 Intra-Zonal Congestion Costs
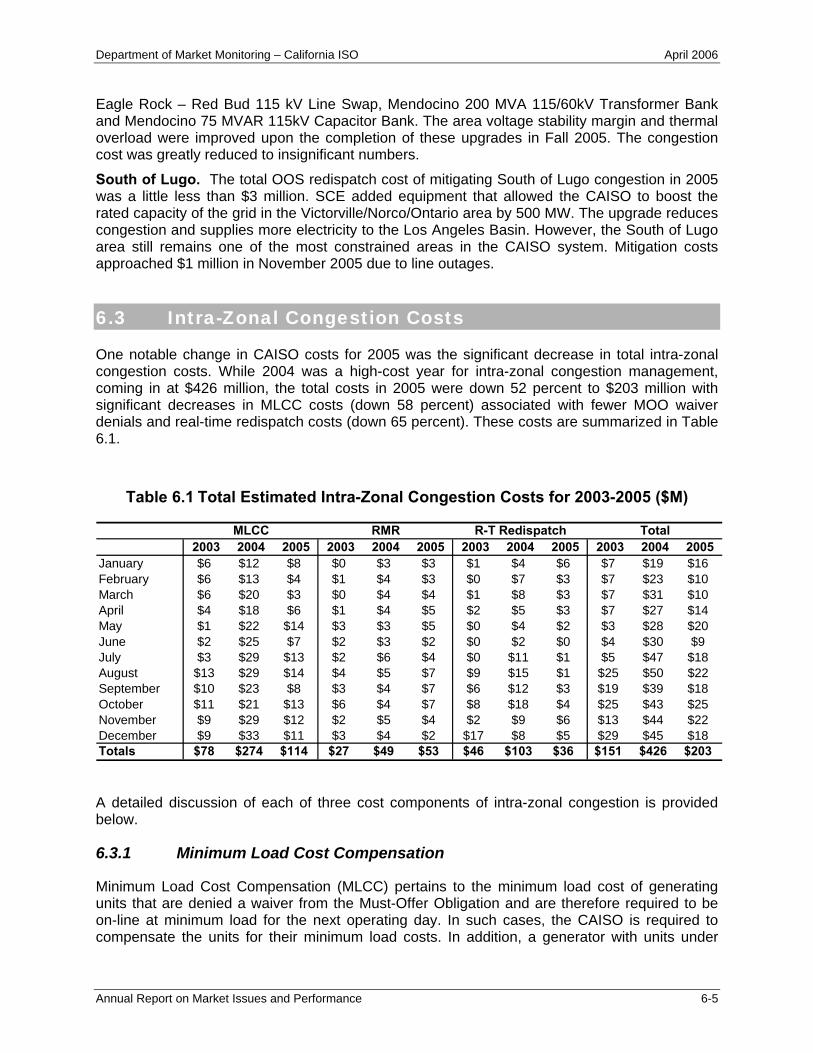
One notable change in CAISO costs for 2005 was the significant decrease in total intra-zonal congestion costs. While 2004 was a high-cost year for intra-zonal congestion management, coming in at $426 million, the total costs in 2005 were down 52 percent to $203 million with significant decreases in MLCC costs (down 58 percent) associated with fewer MOO waiver denials and real-time redispatch costs (down 65 percent). These costs are summarized in Table 6.1.
Table 6.1 Total Estimated Intra-Zonal Congestion Costs for 2003-2005 ($M)
2003 2004 2005 2003 2004 2005 2003 2004 2005 2003 2004 2005January $6 $12 $8 $0 $3 $3 $1 $4 $6 $7 $19 $16February $6 $13 $4 $1 $4 $3 $0 $7 $3 $7 $23 $10March $6 $20 $3 $0 $4 $4 $1 $8 $3 $7 $31 $10April $4 $18 $6 $1 $4 $5 $2 $5 $3 $7 $27 $14May $1 $22 $14 $3 $3 $5 $0 $4 $2 $3 $28 $20June $2 $25 $7 $2 $3 $2 $0 $2 $0 $4 $30 $9July $3 $29 $13 $2 $6 $4 $0 $11 $1 $5 $47 $18August $13 $29 $14 $4 $5 $7 $9 $15 $1 $25 $50 $22September $10 $23 $8 $3 $4 $7 $6 $12 $3 $19 $39 $18October $11 $21 $13 $6 $4 $7 $8 $18 $4 $25 $43 $25November $9 $29 $12 $2 $5 $4 $2 $9 $6 $13 $44 $22December $9 $33 $11 $3 $4 $2 $17 $8 $5 $29 $45 $18Totals $78 $274 $114 $27 $49 $53 $46 $103 $36 $151 $426 $203
MLCC RMR R-T Redispatch Total
A detailed discussion of each of three cost components of intra-zonal congestion is provided below.
6.3.1 Minimum Load Cost Compensation
Minimum Load Cost Compensation (MLCC) pertains to the minimum load cost of generating units that are denied a waiver from the Must-Offer Obligation and are therefore required to be on-line at minimum load for the next operating day. In such cases, the CAISO is required to compensate the units for their minimum load costs. In addition, a generator with units under
Annual Report on Market Issues and Performance 6-5
Department of Market Monitoring – California ISO April 2006
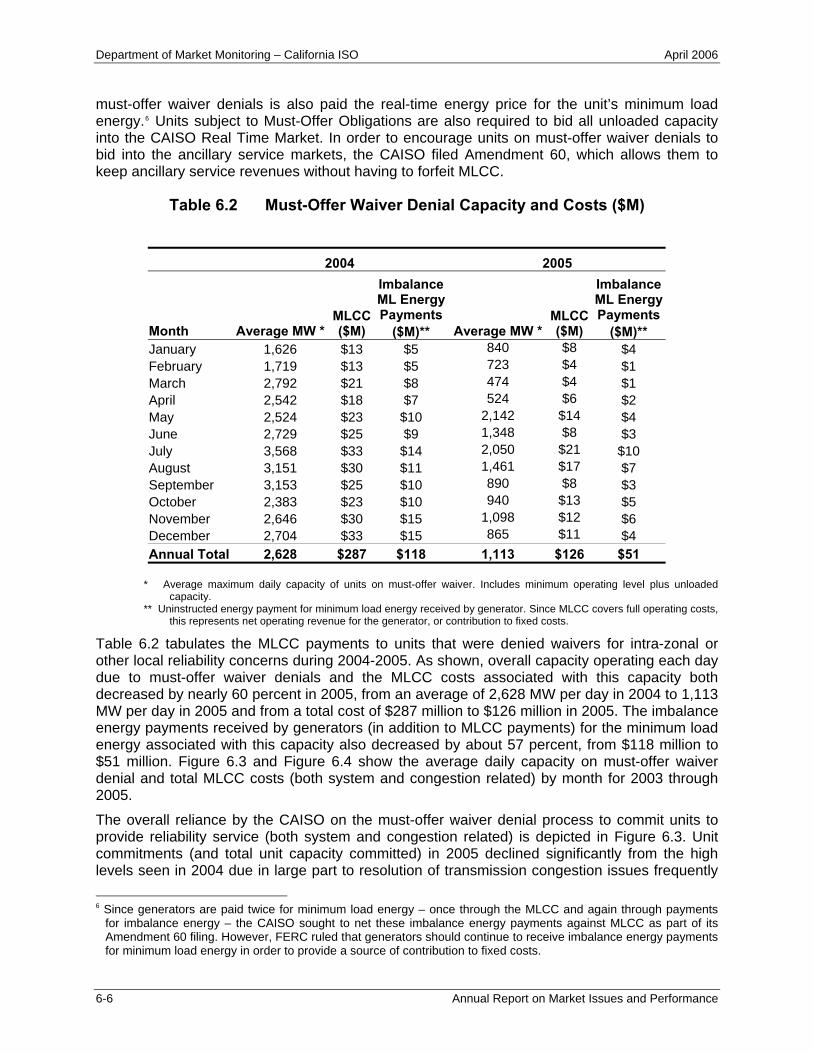
must-offer waiver denials is also paid the real-time energy price for the unit’s minimum load energy.6 Units subject to Must-Offer Obligations are also required to bid all unloaded capacity into the CAISO Real Time Market. In order to encourage units on must-offer waiver denials to bid into the ancillary service markets, the CAISO filed Amendment 60, which allows them to keep ancillary service revenues without having to forfeit MLCC.
Table 6.2 Must-Offer Waiver Denial Capacity and Costs ($M)
2004 2005
Imbalance ML Energy Payments
Imbalance ML Energy Payments
Month Average MW * MLCC ($M) ($M)** Average MW *
MLCC ($M) ($M)**
January 1,626 $13 $5 840 $8 $4 February 1,719 $13 $5 723 $4 $1 March 2,792 $21 $8 474 $4 $1 April 2,542 $18 $7 524 $6 $2 May 2,524 $23 $10 2,142 $14 $4 June 2,729 $25 $9 1,348 $8 $3 July 3,568 $33 $14 2,050 $21 $10 August 3,151 $30 $11 1,461 $17 $7 September 3,153 $25 $10 890 $8 $3 October 2,383 $23 $10 940 $13 $5 November 2,646 $30 $15 1,098 $12 $6 December 2,704 $33 $15 865 $11 $4 Annual Total 2,628 $287 $118 1,113 $126 $51
* Average maximum daily capacity of units on must-offer waiver. Includes minimum operating level plus unloaded capacity.
** Uninstructed energy payment for minimum load energy received by generator. Since MLCC covers full operating costs, this represents net operating revenue for the generator, or contribution to fixed costs.
Table 6.2 tabulates the MLCC payments to units that were denied waivers for intra-zonal or other local reliability concerns during 2004-2005. As shown, overall capacity operating each day due to must-offer waiver denials and the MLCC costs associated with this capacity both decreased by nearly 60 percent in 2005, from an average of 2,628 MW per day in 2004 to 1,113 MW per day in 2005 and from a total cost of $287 million to $126 million in 2005. The imbalance energy payments received by generators (in addition to MLCC payments) for the minimum load energy associated with this capacity also decreased by about 57 percent, from $118 million to $51 million. Figure 6.3 and Figure 6.4 show the average daily capacity on must-offer waiver denial and total MLCC costs (both system and congestion related) by month for 2003 through 2005.
The overall reliance by the CAISO on the must-offer waiver denial process to commit units to provide reliability service (both system and congestion related) is depicted in Figure 6.3. Unit commitments (and total unit capacity committed) in 2005 declined significantly from the high levels seen in 2004 due in large part to resolution of transmission congestion issues frequently 6 Since generators are paid twice for minimum load energy – once through the MLCC and again through payments
for imbalance energy – the CAISO sought to net these imbalance energy payments against MLCC as part of its Amendment 60 filing. However, FERC ruled that generators should continue to receive imbalance energy payments for minimum load energy in order to provide a source of contribution to fixed costs.
6-6 Annual Report on Market Issues and Performance

Department of Market Monitoring – California ISO April 2006
experienced at Sylmar and an increase of 500 MW in the SCIT limit that was implemented in January 2005. Both of these factors resulted in a significant decrease in additional unit commitments in SP15. The congestion issue at Sylmar was resolved late in 2004, when the new 230/220 kV, 900 MVA bank was finished at the Sylmar station. This upgrade increased the Path 41 rating from 800 MVA to 1600 MVA, relieving the requirement to commit units out-of-market to provide reliability support in this area. Figure 6.3 also highlights the high non-market unit commitment requirements in 2003. These were driven in large part by several transmission outages (specifically, Sylmar bank, Lugo substation, and the PDCI line outages) and extended generation outages that contributed to inertia deficiencies on the SCIT.
Figure 6.3 Average Daily Capacity on Must-Offer Waiver Denial for All Reasons (Local, Zonal, and System) (2003-2005)
0500
1,0001,5002,0002,5003,0003,5004,000
Jan Feb Mar Apr May Jun Jul Aug Sep Oct Nov Dec
Avg.
Dai
ly C
apac
ity o
f Uni
t on
Mus
t-Offe
r Wai
ver D
enia
l 200320042005
Annual Report on Market Issues and Performance 6-7

Department of Market Monitoring – California ISO April 2006
Figure 6.4 Total Monthly Minimum Load Compensation Costs for All Reasons (Local, Zonal, and System) (2003-2005)
$0
$5
$10
$15
$20
$25
$30
$35
Jan Feb Mar Apr May Jun Jul Aug Sep Oct Nov Dec
MLC
C ($
M)
200320042005
Table 6.3 Minimum Load Cost Compensation (MLCC) by Reason - 2004 (June-December) and 2005
Reason
Amendment 60 Cost Allocation
Category MLCC % of Total MLCC % of Total 2004 (June - Dec)* 2005 South of Lugo Local $59.6 31% $42.8 34% SCIT Zonal $64.6 34% $22.6 18% Capacity – SP15 Zonal $0.0 0% $14.4 11% Capacity - System System $16.0 8% $13.6 11% SONGS (OUTAGE) Local $0.0 0% $8.9 7% Devers-Palo Verde Zonal $0.0 0% $3.7 3% Sylmar Local $27.3 14% $2.4 2% Serrano (LA Basin) Local $8.1 4% $0.0 0% Path 26 Local $0.0 0% $2.3 2% Victorville-Lugo Zonal $5.0 3% $0.0 0% Other Local / Zonal $10.0 5% $16.0 13% Total $190.6 100% $126.7 100% * Data on specific reasons for must-offer waiver denials are not available prior to June, 2004.
Table 6.3 summarizes MLCC costs based on cost allocation categories under Amendment 60 and provides more detailed descriptions of the specific reasons. One significant reduction of MLCC from 2004 to 2005 is due to improvement of congestion in the vicinity of Sylmar substation, decreasing the MLCC cost from $27 million in 2004 (June-December) to $2 million in
6-8 Annual Report on Market Issues and Performance

Department of Market Monitoring – California ISO April 2006
2005. The improvement in the Sylmar substation also relieved transmission constraints in SCIT, which dramatically reduced MLCC costs in SCIT from $65 million in 2004 (June-December) to $23 million in 2005. Although South of Lugo was on top of the list in 2005 with $43 million, it still decreased by $13 million from 2004 (June-December).
6.3.2 Reliability Must Run Costs
To mitigate local market power and to ensure that local reliability requirements are met, California’s current market design relies upon RMR contracts with units located at known congested locations on the transmission grid. Through an annual planning process, the CAISO designates specific generating units as RMR units, based on the potential need for these units to be on-line and/or generate at sufficient levels to provide voltage support, adequate local generation in the event of system contingencies, and meet other system requirements related to local reliability. RMR contracts provide a mechanism for compensating unit owners for the costs of operating when units are needed for local reliability but may not be economical to operate based on overall energy and ancillary service market prices. RMR units are either pre-dispatched for local reliability needs (prior to real-time), or incremented in real-time either for local reliability or for intra-zonal congestion. RMR units cannot be pre-dispatched for intra-zonal congestion.
All RMR units receive two basic forms of compensation: (1) a Fixed Option Payment (FOP) that provides a contribution to each unit’s fixed costs, and (2) a variable cost payment for energy provided under the RMR contract option, which is paid as the difference (if any) between the unit’s variable operating costs and market revenues received for energy provided in response to an RMR requirement.7
Table 6.4 shows total fixed and variable RMR costs by month in 2005, and further divides variable cost payments into costs associated with pre-dispatched RMR energy for local reliability and additional real-time RMR energy dispatches for any remaining intra-zonal congestion.8 Generators providing energy in response to a real-time RMR dispatch are paid based on their variable operating costs, with the responsible Transmission Owner (TO) receiving a credit back for the value of this energy at the real-time price. Thus, the net cost of real-time RMR dispatches for intra-zonal congestion or other local reliability requirements is equal to the difference between the RMR unit’s variable operating cost and the real-time price of energy. Table 6.5 shows a breakdown of RMR costs between the three Investor-Owned Utilities’ (IOU) service territories.
7 Units under Condition 1 of the RMR contract are free to select the “Market Option” when receiving an RMR dispatch
on a day-ahead or hour-ahead basis, in which case they keep all revenues from sales of this energy and do not receive any re-imbursement for variable operating costs.
8 Since selection of RMR units and pre-dispatch of RMR units is based on local reliability requirements, these costs are not specifically associated with intra-zonal congestion. While annual designation RMR units and pre-dispatch of RMR units to meet local area reliability requirements may reduce intra-zonal congestion in real-time, these costs would be incurred even if intra-zonal congestion did not occur in real-time. Thus, it is more appropriate to exclude costs associated with the FOP and pre-dispatch of RMR units from intra-zonal congestion costs.
Annual Report on Market Issues and Performance 6-9

Department of Market Monitoring – California ISO April 2006
Table 6.4 RMR Contract Energy and Costs (2005)
Month Pre-dispatch Energy (GWh)*
Real-time Energy (GWh)*
Fixed Option Payments
($M) Net Pre-dispatch
Costs ($M) Net Real-
time Costs ($M)
Total RMR Costs ($M)
January 703 96 $28 $12 $3 $42 February 601 91 $20 $14 $3 $38 March 562 106 $21 $14 $4 $40 April 593 110 $22 $18 $5 $45 May 576 80 $19 $17 $5 $42 June 464 46 $20 $13 $2 $35 July 408 157 $21 $9 $4 $35 August 358 195 $24 $13 $7 $44 September 263 111 $22 $15 $7 $44 October 280 126 $21 $16 $7 $45 November 240 128 $19 $9 $4 $32 December 113 63 $11 $6 $2 $20 2005 Total 5,160 1,308 $250 $156 $53 $460 % ∆ from 2004 -65% -51% -31% -34% 8% -29%
* Includes RMR energy provided under Contract Option only, excluding energy provided under Market Option of the contract.
Table 6.5 RMR Contract Energy and Costs for Major Transmission Owners (2005)
Owner Pre-dispatch Energy (GWh)*
Real-time Energy* (GWh)
Fixed Option
Payments ($M)
Net Pre-dispatch
Costs ($M)
Net Real-time Costs
($M) Total RMR Costs ($M)
2004 2005 2004 2005 2004 2005 2004 2005 2004 2005 2004 2005
PG&E 8,537 2,125 1,325 523 $264 $123 $125 $66 $29 $31 $418 $220 SDG&E 4,917 2,378 1,146 693 $80 $94 $75 $61 $18 $19 $173 $173 SCE 1,272 657 200 84 $15 $29 $36 $30 $2 $3 $53 $62 Total 14,726 5,160 2,671 1,300 $359 $246 $236 $157 $49 $53 $644 $455
* Includes RMR energy provided under Contract Option only, excluding energy provided under Market Option of the contract.
Total RMR costs decreased from about $644 million in 2004 to $455 million in 2005, as shown in Table 6.5 and Figure 6.5. The decrease in costs is due to a combination of three major factors:
• First, the portion of RMR capacity selecting Condition 2 of the pro forma RMR contract decreased significantly. As shown in Figure 6.6, the amount of thermal generation under Condition 2 ranged from about 3,000 to 4,000 MW in 2004, but dropped to about 2,000 MW in 2005. Since units receive higher fixed option payments when under Condition 2 compared to the fixed payments received if they select Condition 1, the reduction in capacity under Condition 2 created a significant decrease in fixed option payments. As
6-10 Annual Report on Market Issues and Performance

Department of Market Monitoring – California ISO April 2006
shown in Figure 6.5, overall fixed option payments for RMR units dropped from about $359 million in 2004 to about $246 million in 2005. The drop in units selecting Condition 2 of the RMR contract may be attributed to increasing profitability for sales in bilateral and spot markets, which allows owners to earn market revenues from RMR units. RMR contract data indicate that the trend toward decreasing capacity under Condition 2 of the contract is continuing in 2006, which may provide further indications of increasing profitability for sales in bilateral and spot markets.
• Second, the amount of energy dispatched from RMR units – or the minimum reliability requirements at which RMR units are required to operate – dropped significantly in 2005. As shown in Figure 6.7, total RMR energy requirements issued to thermal units dropped from about 15,000 GWh in 2004 to about 9,500 GWh in 2005. As shown in Table 6.5, the decrease in RMR energy dispatches was due to a drop in reliability requirements issued on a forward (pre-dispatch) basis as well as real-time RMR energy dispatches. This resulted in a decline in Net Pre-dispatch Energy Costs from $236 million in 2004 to $157 million in 2005. However, the net real-time dispatch costs of RMR increased slightly in 2005 ($53 million versus $49 million in 2004). This increase is substantially attributable to the increase in natural gas prices during 2005.
• Finally, a significantly larger portion of RMR energy dispatches were provided under the Market Option of the contract rather than the Contract Option. Under the Market Option, the RMR unit owner keeps all market revenues from energy generated while meeting an RMR reliability requirement, and no additional variable cost payment is made in the event that market revenues are less than the unit’s variable operating cost. As shown in Figure 6.7, about 29 percent of RMR energy dispatches issued to thermal units in 2005 were met through the Market Option, compared to only about 10 percent in 2004. As described above, the increase in the portion of RMR energy provided under the Market Option may be attributed to increasing profitability of sales in bilateral and spot markets.
Figure 6.5 Total RMR Costs (2004-2005)
$236 M
$157 M
$49 M
$53 M
$246 M$359 M
$0
$100
$200
$300
$400
$500
$600
$700
2004 2005
Annu
al R
MR
Cost
s (M
illio
ns)
Net Real Time Dispatch Costs
Net Pre-dispatch Energy CostsFixed Option Paymants
Annual Report on Market Issues and Performance 6-11

Department of Market Monitoring – California ISO April 2006
Figure 6.6 RMR Capacity by Resource and Contract Type (2004-2005)
-
2,000
4,000
6,000
8,000
10,000
12,000
14,000
Q1 2004 Q2 2004 Q3 2004 Q4 2004 Q1 2005 Q2 2005 Q3 2005 Q4 2005
Tota
l RM
R (A
ppro
xim
ate
MW
)
Hydro
Thermal - Condition 1Thermal - Condition 2
Figure 6.7 RMR Dispatch Volumes – Thermal Units (2004-2005)
0
2,000
4,000
6,000
8,000
10,000
12,000
14,000
16,000
2004 2005
RM
R Di
spat
ches
- Th
erm
al U
nits
(GW
h) Market Option
Contract Option
6-12 Annual Report on Market Issues and Performance

Department of Market Monitoring – California ISO April 2006
The bulk of the decrease in RMR energy dispatches occurred in Pacific Gas and Electric’s (PG&E) service territory, where annual pre-dispatched RMR energy provided under the Contract Option decreased from 8,537 GWh to 2,125 GWh and annual real-time RMR energy decreased from 1,325 GWh to 523 GWh (Table 6.5). Much of this decrease is attributable to substantial reductions in dispatches from various Bay Area RMR contract facilities in 2005. These facilities were dispatched for congestion at the PG&E Ravenswood substation and along the San Mateo – Ravenswood 230 kV transmission line. However, substantial transmission upgrades around the Bay Area have reduced local reliability energy requirements, and consequently energy dispatches under RMR contract, in the PG&E service territory.
Within the SCE service territory, annual RMR energy dispatches in SCE’s service territory decreased from 4,917 GWh to 2,378 GWh in the pre-dispatch timeframe, and from 1,146 GWh to 693 GWh in real-time (Table 6.5), due to less mitigation for Orange County flows and compliance with the Southern California Import Nomogram.
Within the SDG&E service territory, annual RMR energy dispatches provided under the Contract Option declined from 4,917 GWh in 2004 to 2,378 GWh in 2005 in the pre-dispatch timeframe, and from 1,146 GWh in 2004 to 693 GWh in 2005 in real-time. This reduction in RMR energy dispatches may be substantially attributed to two conditions. First, substantial quantities of RMR energy were dispatched while San Onofre Nuclear Generating Station 3 was on refueling outage. Originally SONGS 3 was planned to be out from September 27 to November 11, 2004, but was subsequently extended through to December 29, 2004. The shutdown of SONGS 3 imposed substantial local constraints and exacerbated local congestion around Miguel, and its return decreased the need for RMR energy to compensate for the outage. Second, transmission upgrades went into place at Miguel, including an additional 230kV to 500kV transformer on October 31, 2004, and the Miguel-Mission #2 230kV line went into service on June 6, 2005. With these two transmission upgrades, the need for RMR energy within the San Diego area declined dramatically between 2004 and 2005.
6.3.3 Out-Of-Sequence (OOS) Costs9
The costs of Out-Of-Sequence (OOS) dispatches for mitigating real-time intra-zonal congestion is measured in terms of the redispatch cost, which is the incremental cost incurred from having to dispatch some resources up and other resources down to alleviate the congestion. For incremental energy bids dispatched OOS, the redispatch cost is based on the bid price paid for OOS energy less the market clearing price. For decremental energy bids dispatched OOS, the redispatch cost is based on the market clearing price for incremental energy less the reference price for decremental energy.
As shown in Table 6.6, gross payments for incremental OOS energy dispatches during 2005 totaled $9 million, which is a 90 percent reduction from the 2004 gross payment of $92 million. The net cost of these dispatches to Load Serving Entities (redispatch costs) was just above $3 million in 2005, compared to $40.6 million in 2004. In all, the CAISO procured 117,643 MWh of incremental OOS energy at an average price of $78/MWh. The average cost for 2004 was $67/MWh; the increase in price is mainly attributable to the increase in the price of gas from 2004 to 2005. The average net cost was $28.05, which was down from $29.44 for 2004. For incremental OOS dispatch, the largest drop in redispatch costs results from less mitigation
9 Intra-zonal congestion has traditionally been resolved by OOS calls. However, due to the absence of an obligation
to insert decremental bids, as well as the workings of the Amendment 50 reference levels, some of these dispatches are tagged out-of-market (OOM). Whether the dispatches are OOS or OOM, the salient feature is that they are all for intra-zonal congestion. Within this document, any references to OOS calls will always include some OOM calls where those OOM calls are for intra-zonal congestion.
Annual Report on Market Issues and Performance 6-13

Department of Market Monitoring – California ISO April 2006
occurring at the Sylmar substation. This is likely the result of the bank upgrade performed at Sylmar and completed in late 2004, where the new 230/220 kV, 900 MVA bank was completed which increased the Path 41 rating from 800 MVA to 1600 MVA. In addition, converters 1 & 2 were rebuilt in January 2005 increasing the capacity to 3100 MW. These redispatch costs dropped from $25 million in 2004 down to $0.1 million in 2005. Similarly, redispatch costs for real-time congestion management at SCIT dropped significantly in 2005. This is likely due to the 500 MW increase in the SCIT limit that went into effect in January 2005. Table 6.7 indicates that the decremental OOS energy cost in 2005 was down to $31.4 million, or about half of the 2004 cost. The new line installed at Miguel alone created savings of $21 million in redispatch costs. The new Miguel #2 230 kV line went online in January 2005. The upgrade resulted in significantly reduced congestion cost at Miguel, while the same seasonal pattern of low congestion costs for April-September was observed. Prior to the upgrade, intra-zonal congestion was frequent and significant due to the addition of three new generation units in northern Mexico in 2003 comprising about 1,070 MW of capacity. For comparison, the average of cost for decremental energy was $38.24 per MWh in 2005, consistent with decremental energy price levels seen in 2004. The remainder of the decline in decremental OOS redispatch costs can be primarily attributed to less real-time intra-zonal congestion management at SCIT, South of Lugo, and Sylmar.
6-14 Annual Report on Market Issues and Performance

Department of Market Monitoring – California ISO April 2006
Table 6.6 Incremental OOS Congestion Costs 2005
Average MWh Gross Cost
Redispatch Premium
Mitigation Savings Price
Average Net Cost
Jan 17,976 $1,172,257 $287,944 $1,079 $65.21 $16.02 Feb 8,954 $503,480 $227,984 $1,743 $56.23 $25.46 Mar 7,303 $433,774 $168,586 $4,871 $59.39 $23.08 Apr 749 $53,304 $8,837 $0 $71.20 $11.80 May 25,707 $1,615,580 $1,112,935 $61 $62.85 $43.29 Jun 3,511 $234,260 $32,953 $0 $66.71 $9.38 July 12,664 $1,068,629 $322,965 $42,795 $84.38 $25.50 Aug 7,232 $687,072 $142,363 $6,541 $95.01 $19.69 Sep 17,158 $1,859,198 $569,430 $450 $108.36 $33.19 Oct 937 $104,374 $22,752 $0 $111.43 $24.29 Nov 13,529 $1,282,651 $333,812 $0 $94.81 $24.67 Dec 1,924 $241,787 $69,103 $0 $125.66 $35.91
2005 Total 117,643 9,256,365 3,299,664 57,540 $78.68 $28.05 %Δ from 2004 -91% -90% -92% n/a 17% -5%
Table 6.7 Decremental OOS Congestion Costs 2005
Average MWh Gross Cost
Redispatch Premium OOS Price
Average Net Cost
Jan 229,918 -$7,017,664 $5,281,048 $30.52 $22.97 Feb 215,504 -$5,834,760 $3,084,988 $27.07 $14.32 Mar 154,799 -$3,478,599 $2,861,021 $22.47 $18.48 Apr 137,077 -$3,820,274 $3,031,146 $27.87 $22.11 May 17,549 -$375,115 $341,108 $21.38 $19.44 Jun 3,279 -$113,640 $41,393 $34.66 $12.62 July 11,614 -$487,712 $251,089 $41.99 $21.62 Aug 52,801 -$2,434,458 $1,166,405 $46.11 $22.09 Sep 55,284 -$2,739,109 $2,637,278 $49.55 $47.70 Oct 105,896 -$6,311,372 $3,865,824 $59.60 $36.51 Nov 161,973 -$7,233,787 $4,817,115 $44.66 $29.74 Dec 145,431 -$9,529,564 $3,982,617 $65.53 $27.38
2005 Total 1,291,124 -$49,376,054 $31,361,031 $38.24 $24.29 %Δ from 2004 -52% -53% -50% -2% 4%
Annual Report on Market Issues and Performance 6-15