6 March 2019 For personal use only - Australian Securities Exchange · 06-03-2019 · REMX® SLX®...
35
VanEck Investments Limited ABN 22 146 596 116, AFSL 416755 Aurora Place, Level 4 88 Phillip Street, Sydney NSW 2000 www.vaneck.com.au VanEck Investments Limited is a member of the VanEck group headquartered in New York 6 March 2019 ASX Limited Market Announcements Office ASX CODE: GDX VANECK VECTORS GOLD MINERS ETF US ANNUAL REPORT – FOR PERIOD ENDED 31 DECEMBER 2018 VanEck Investments Limited makes this announcement on behalf of VanEck Vectors ETF Trust. Attached is the annual report United States (US) exchange traded funds including GDX, which has been issued by VanEck Vectors ETF Trust. Information in the report not relating to GDX, where possible, has been redacted or deleted. Financial information in the report is in US dollars, unless otherwise stated. For more information: • Call 1300 68 38 37 • Go to vaneck.com.au IMPORTANT NOTICE: Issued by VanEck Investments Limited ABN 22 146 596 116 AFSL 416755 (‘VanEck’). VanEck is a wholly owned subsidiary of Van Eck Associates Corporation based in New York, United States. VanEck Vectors ETF Trust ARBN 604 339 808 (‘the Trust’) is the issuer of shares in the US domiciled VanEck Vectors ETFs (‘US Funds’). The Trust and the US Funds are regulated by US laws which differ from Australian laws. Trading in the US Funds’ shares on ASX will be settled by CHESS Depositary Interests (‘CDIs’) which are also issued by the Trust. The Trust is organised in the State of Delaware, US. Liability of investors is limited. Van Eck Associates serves as the investment advisor to the US Funds. VanEck, on behalf of the Trust, is the authorised intermediary for the offering of CDIs over the US Funds’ shares and issuer in respect of the CDIs and corresponding Fund Shares traded on ASX. This information contains general advice only about financial products and is not personal advice. It does not take into account any person’s individual objectives, financial situation or needs. Investing in international markets has specific risks that are in addition to the typical risks associated with investing in the Australian market. These include currency/foreign exchange fluctuations, ASX trading time differences and changes in foreign laws and tax regulations. Before making an investment decision in relation to a US Fund you should read the PDS and with the assistance of a financial adviser consider if it is appropriate for your circumstances. The PDS is available at www.vaneck.com.au or by calling 1300 68 38 37. Past performance is not a reliable indicator of current or future performance. No member of the VanEck group of companies or the Trust gives any guarantee or assurance as to the repayment of capital, the performance, or any particular rate of return from the US Funds. Tax consequences of dividend distributions may vary based on individual circumstances. Investors should seek their own independent tax advice based on their individual circumstances. For personal use only
Transcript of 6 March 2019 For personal use only - Australian Securities Exchange · 06-03-2019 · REMX® SLX®...

VanEck Investments Limited ABN 22 146 596 116, AFSL 416755
Aurora Place, Level 4 88 Phillip Street, Sydney NSW 2000
www.vaneck.com.au
VanEck Investments Limited is a member of the VanEck group headquartered in New York
6 March 2019
ASX Limited
Market Announcements Office
ASX CODE: GDX
VANECK VECTORS GOLD MINERS ETF
US ANNUAL REPORT – FOR PERIOD ENDED 31 DECEMBER 2018
VanEck Investments Limited makes this announcement on behalf of VanEck Vectors ETF Trust.
Attached is the annual report United States (US) exchange traded funds including GDX, which has been issued by VanEck Vectors ETF Trust.
Information in the report not relating to GDX, where possible, has been redacted or deleted.
Financial information in the report is in US dollars, unless otherwise stated.
For more information:
• Call 1300 68 38 37 • Go to vaneck.com.au
IMPORTANT NOTICE: Issued by VanEck Investments Limited ABN 22 146 596 116 AFSL 416755 (‘VanEck’). VanEck is a wholly owned subsidiary of Van Eck Associates Corporation based in New York, United States. VanEck Vectors ETF Trust ARBN 604 339 808 (‘the Trust’) is the issuer of shares in the US domiciled VanEck Vectors ETFs (‘US Funds’). The Trust and the US Funds are regulated by US laws which differ from Australian laws. Trading in the US Funds’ shares on ASX will be settled by CHESS Depositary Interests (‘CDIs’) which are also issued by the Trust. The Trust is organised in the State of Delaware, US. Liability of investors is limited. Van Eck Associates serves as the investment advisor to the US Funds. VanEck, on behalf of the Trust, is the authorised intermediary for the offering of CDIs over the US Funds’ shares and issuer in respect of the CDIs and corresponding Fund Shares traded on ASX.
This information contains general advice only about financial products and is not personal advice. It does not take into account any person’s individual objectives, financial situation or needs. Investing in international markets has specific risks that are in addition to the typical risks associated with investing in the Australian market. These include currency/foreign exchange fluctuations, ASX trading time differences and changes in foreign laws and tax regulations. Before making an investment decision in relation to a US Fund you should read the PDS and with the assistance of a financial adviser consider if it is appropriate for your circumstances. The PDS is available at www.vaneck.com.au or by calling 1300 68 38 37.
Past performance is not a reliable indicator of current or future performance. No member of the VanEck group of companies or the Trust gives any guarantee or assurance as to the repayment of capital, the performance, or any particular rate of return from the US Funds. Tax consequences of dividend distributions may vary based on individual circumstances. Investors should seek their own independent tax advice based on their individual circumstances.
For
per
sona
l use
onl
y
ANNUAL REPORTDecember 31, 2018
MOO®
KOL®
GEX®
GDX®
GDXJ®
HAP®
CRAK®
OIH®
REMX®
SLX®
FRAK®
VANECK VECTORS®
Agribusiness ETFCoal ETFGlobal Alternative Energy ETF Gold Miners ETFJunior Gold Miners ETF Natural Resources ETFOil Refiners ETFOil Services ETFRare Earth/Strategic Metals ETF Steel ETFUnconventional Oil & Gas ETF Uranium+Nuclear Energy ETF NLR®
800.826.2333 vaneck.com
92629_01_Van Eck_FM_AR.qxp 2/22/19 9:40 PM Page COV1
For
per
sona
l use
onl
y
tbethe
Text Box
tbethe
Text Box

President’s Letter 1 Management Discussion 2 Performance Comparison Agribusiness ETF 5 Coal ETF 6 Global Alternative Energy ETF 7 Gold Miners ETF 8 Junior Gold Miners ETF 9 Natural Resources ETF 10 Oil Refiners ETF 11 Oil Services ETF 12 Rare Earth/Strategic Metals ETF 13 Steel ETF 14 Unconventional Oil & Gas ETF 15 Uranium+Nuclear Energy ETF 16 About Fund Performance 17 Explanation of Expenses 18 Schedule of Investments Agribusiness ETF 20 Coal ETF 23 Global Alternative Energy ETF 25 Gold Miners ETF 27 Junior Gold Miners ETF 31 Natural Resources ETF 35 Oil Refiners ETF 41 Oil Services ETF 43 Rare Earth/Strategic Metals ETF 45 Steel ETF 47 Unconventional Oil & Gas ETF 49 Uranium+Nuclear Energy ETF 51 Statements of Assets and Liabilities 54 Statements of Operations 56 Statements of Changes in Net Assets 58 Financial Highlights Agribusiness ETF 63 Coal ETF 63 Global Alternative Energy ETF 64 Gold Miners ETF 64 Junior Gold Miners ETF 65 Natural Resources ETF 65 Oil Refiners ETF 66 Oil Services ETF 66 Rare Earth/Strategic Metals ETF 67 Steel ETF 67 Unconventional Oil & Gas ETF 68 Uranium+Nuclear Energy ETF 68 Notes to Financial Statements 69 Report of Independent Registered Public Accounting Firm 78 Tax Information 80 Board of Trustees and Officers 81
Certain information contained in this management discussion represents the opinion of the investment adviser which may change at any time. This in-formation is not intended to be a forecast of future events, a guarantee of future results or investment advice. Current market conditions may not continue.The information contained herein regarding each index has been provided by the relevant index provider. Also, unless otherwise specifically noted, anydiscussion of the Funds’ holdings, the Funds’ performance, and the views of the investment adviser are as of December 31, 2018.
92629_01_Van Eck_FM_AR.qxp 2/22/19 9:40 PM Page COV2
For
per
sona
l use
onl
y
tbethe
Text Box
tbethe
Text Box
tbethe
Text Box
tbethe
Text Box
tbethe
Text Box
tbethe
Text Box

1
Dear Shareholders:
We are pleased to present this annual report, which affords us the opportunity to provide both a brief review ofthe economic backdrop for the last 12 months and our outlook for 2019.
Review of 2018
As we wrote in our Market Insights research, which can be found at www.vaneck.com/blogs/market-insights/,we began 2018 by noting that global growth had gone from “ticking up” to “firmly in place” and that, whilecentral banks were tightening, Europe remained “two years” behind the U.S. in this trend and had a trickier task.Further, our base case was for 10-year interest rates to rise to 3.5% with the curve not inverting. In its thirdlongest bull market ever, we remained bullish on U.S. equities in the short-term, but were prepared for acorrection. Finally, we believed that investors should not be underweight commodities as global growth wassupporting the bullish “grind” trade narrative from supply cutbacks.
The big shock to this growth story came with concerns about European and Chinese growth in the summer of2018. These, together with both unstable politics and weaker bank balance sheets, became obstacles tomonetary policy normalization. This resulted in U.S. dollar strength and emerging markets equity weakness. Inaddition, rather than continuing to “grind” higher, commodities were hit by China worries and other factors andhad a disappointing year.
2019 Outlook
Looking forward, three of our macro views for 2019 are that: 1) developed markets central banks are tightening,we believe that Europe continues to be “two years” behind the U.S. in this trend. It will remain a slow processand may well be slower than the U.S.; 2) the pace of U.S. Federal Reserve interest rate hikes slows, with apossible pause to hikes in the next 12 months; and, 3) China’s central bank is stimulating and harder-to-stimulate lending to private companies and financial reform continues. However, the government-the centralbank supported by fiscal and other steps-wins in stimulating.
Our market views for the year include: 1) the withdrawal of liquidity will extend to credit and equities, which mayresult in a bumpier ride for many asset classes; 2) gold should benefit if rate hikes stop; commodities shouldbenefit if China resurgence offsets developed world slowdown; and, 3) emerging markets should benefit on arelative basis if China stimulus works.
To keep you informed on an ongoing basis, we encourage you to stay in touch with us through the videos, emailsubscriptions, and research blogs available on our website, www.vaneck.com. Should you have any questionsregarding fund performance, please contact us at 800.826.2333 or visit our website.
We sincerely thank you for investing in VanEck’s investment strategies. On the following pages, you will findperformance discussions and financial statements for each of the funds for the twelve month period endedDecember 31, 2018. As always, we value your continued confidence in us and look forward to helping you meetyour investment goals in the future.
Jan F. van EckTrustee and PresidentVanEck Vectors ETF Trust
January 11, 2019
Investing involves substantial risk and high volatility, including possible loss of principal. An investor should consider the investment objective,risks, charges and expenses of the Funds carefully before investing. To obtain a prospectus and summary prospectus, which contain this andother information, call 800.826.2333 or visit vaneck.com. Please read the prospectus and summary prospectus carefully before investing.
VANECK VECTORS ETFs December 31, 2018 (unaudited)
92629_01_Van Eck_FM_AR.qxp 2/22/19 9:40 PM Page 1
For
per
sona
l use
onl
y

Management Discussion (unaudited)
AgribusinessDuring 2018, agribusiness stocks essentially moved sideways, without any major ups or downs, until early-December. Thereafter they declined precipitously, before a brief recovery in the final week of the year. The Fundfinished the year returning -5.76% for the 12 month period. The primary drivers of negative performance werecompanies in the industrial sector and, in particular, those in the machinery segment. While companies in thehealthcare and consumer discretionary sectors contributed positively to returns, their contribution was notsufficient to outweigh the negative performances of not only the industrial sector, but also the materials andconsumer staples sectors. The greatest negative returns came from companies in Japan and the UnitedKingdom, while the greatest positive returns came from those in Norway and Singapore.
CoalFollowing a lackluster first six months in 2018, after the end of June the performance of coal stocks declinedslowly through mid-November. Thereafter they experienced a significant decline, with the Fund returning -15.97%for the period under review.
Although U.S. coal exports of 87 million short tons (MMst)1 for the first nine months of the year were up 26%over the same period in 2017, in mid-December the U.S. Energy Information Administration (EIA) expected U.S.coal production would total 762 MMst in 2018 (down 2% from 2017) and 742 MMst in 2019 (down 3% from2018). It also expected total coal consumption in the U.S. in 2018 to be down 2.80% from 2017 and, in theelectric power sector specifically, down 3.10%.2
While the long-term benefits of any of the current U.S. Administration’s initiatives to provide support for thedomestic coal industry remain debatable, over 2018 demonstrable benefits for coal stocks, not least in the U.S.,appeared few. However, coal continues to supply a third of all energy used globally and accounts for 38% ofelectricity generation, in addition to playing a crucial role in industries such as iron and steel.3 China was thesingle largest negative contributor to returns, followed by Indonesia and the U.S. No country contributedpositively to performance.
Global Alternative EnergyThe performance of global alternative energy stocks during the 12 month period was disappointing, with theFund recording a negative return of 9.02%. Companies in the information technology sector detracted by far themost from performance, those in the utilities sector were the only positive contributors to performance. The U.S.and China were by far the worst performing countries with negative performance far outweighing the positiveperformance of Denmark, Austria, Sweden, and Spain.
Gold MinersBoth major gold miners and their junior peers had a roller coaster year. Despite fitful recoveries in the last threeto four months of the year, neither recovered from the severe sell-off groups experienced through July and thefirst half of August. In addition, over the 12 month period, the price of gold fell 1.58%4 (on the back of a strongerU.S. dollar and rising U.S. interest rates). The larger gold miners (VanEck Vectors Gold Miners ETF) posted anegative return of 8.92%; junior gold miners (VanEck Vectors Junior Gold Miners ETF) posted a negative returnof 11.58% for the period.
Among the larger mining stocks, Canadian companies, with the largest average country weighting, detracted themost from performance. Companies in Australia contributed the most to performance.
The situation was similar among the juniors, with Australia the strongest contributor, followed by South Africa.Canada detracted by far the most from performance.
2
VANECK VECTORS ETFs(continued)
92629_01_Van Eck_FM_AR.qxp 2/22/19 9:40 PM Page 2
For
per
sona
l use
onl
y
tbethe
Text Box
tbethe
Text Box
tbethe
Text Box
tbethe
Text Box
8
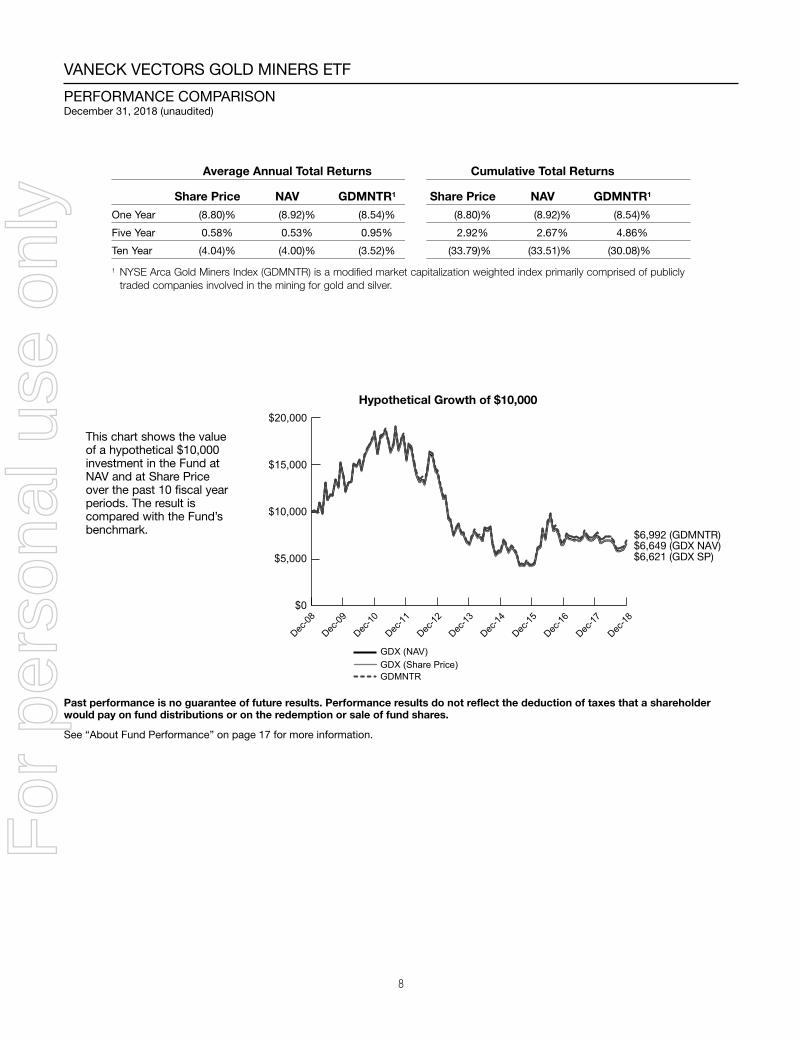
VANECK VECTORS GOLD MINERS ETF
PERFORMANCE COMPARISONDecember 31, 2018 (unaudited)
Average Annual Total Returns Cumulative Total Returns
Share Price NAV GDMNTR1 Share Price NAV GDMNTR1
One Year (8.80)% (8.92)% (8.54)% (8.80)% (8.92)% (8.54)%
Five Year 0.58% 0.53% 0.95% 2.92% 2.67% 4.86%
Ten Year (4.04)% (4.00)% (3.52)% (33.79)% (33.51)% (30.08)%
1 NYSE Arca Gold Miners Index (GDMNTR) is a modified market capitalization weighted index primarily comprised of publiclytraded companies involved in the mining for gold and silver.
This chart shows the valueof a hypothetical $10,000investment in the Fund atNAV and at Share Priceover the past 10 fiscal yearperiods. The result iscompared with the Fund’sbenchmark.
$6,621 (GDX SP)
$6,992 (GDMNTR)$6,649 (GDX NAV)
Hypothetical Growth of $10,000
$0
$5,000
$10,000
$15,000
$20,000
GDX (NAV)
GDX (Share Price)GDMNTR
Dec-0
8
Dec-1
6
Dec-1
8
Dec-1
7
Dec-1
5
Dec-1
4
Dec-1
3
Dec-1
2
Dec-1
1
Dec-1
0
Dec-0
9
Past performance is no guarantee of future results. Performance results do not reflect the deduction of taxes that a shareholderwould pay on fund distributions or on the redemption or sale of fund shares.
See “About Fund Performance” on page 17 for more information.
92629_01_Van Eck_FM_AR.qxp 2/22/19 9:40 PM Page 8
For
per
sona
l use
onl
y

17
The price used to calculate market return (Share Price) is determined by using the closing price listed on its primary listing exchange. Sincethe shares of each Fund did not trade in the secondary market until after each Fund’s commencement, for the period from commencementto the first day of secondary market trading in shares of each Fund, the NAV of each Fund is used as a proxy for the secondary markettrading price to calculate market returns.
The performance data quoted represents past performance. Past performance is not a guarantee of future results. Performanceinformation for certain Funds reflect temporary waivers of expenses and/or fees. Had these Funds incurred all expenses, investment returnswould have been reduced. These returns do not reflect the deduction of taxes that a shareholder would pay on Fund dividends anddistributions or the sale of Fund shares.
Investment return and value of the shares of each Fund will fluctuate so that an investor’s shares, when sold, may be worth more orless than their original cost. Performance may be lower or higher than performance data quoted. Fund returns reflect reinvestmentof dividends and capital gains distributions. Performance current to the most recent month-end is available by calling 800.826.2333or by visiting vaneck.com.
Fund shares are not individually redeemable and will be issued and redeemed at their NAV only through certain authorized broker-dealers inlarge, specified blocks of shares called “creation units” and otherwise can be bought and sold only through exchange trading. Shares maytrade at a premium or discount to their NAV in the secondary market.
The net asset value (NAV) of each VanEck Vectors exchange-traded fund (ETF) is determined at the close of each business day, andrepresents the dollar value of one share of each fund; it is calculated by taking the total assets of each fund, subtracting total liabilities, anddividing by the total number of shares outstanding. The NAVs are not necessarily the same as each ETF’s intraday trading value. VanEckVectors ETF investors should not expect to buy or sell fund shares at NAV.
All indices are unmanaged and include the reinvestment of all dividends, but do not reflect the payment of transaction costs, advisory feesor expenses that are associated with an investment in the Fund. Certain indices may take into account withholding taxes. An index’sperformance is not illustrative of the Fund’s performance. Indices are not securities in which investments can be made.
The Gold Miners Index and Steel Index are published by ICE Data Indices, LLC (ICE Data). The Agribusiness Index, Coal Index, Junior GoldMiners Index, Oil & Gas Index, Oil Refiners Index, Oil Services Index, Rare Earth/Strategic Metals Index and Uranium & Nuclear Energy Indexare published by MV Index Solutions GmbH (MVIS®), which is a wholly owned subsidiary of the Adviser, Van Eck Associates Corporation.The Natural Resources Index is published by S-Network Global Indexes, LLC (S-Network). The Ardour Global Index is published by ArdourGlobal IndexesSM, LLC (Ardour).
ICE Data, MVIS, S-Network, and Ardour are referred to herein as the “Index Providers”. The Index Providers do not sponsor, endorse, orpromote the Funds and bear no liability with respect to the Funds or any security.
Premium/discount information regarding how often the closing trading price of the Shares of each Fund were above (i.e., at a premium) orbelow (i.e., at a discount) the NAV of the Fund for each of the four previous calendar quarters and the immediately preceding five years (ifapplicable) can be found at vaneck.com.
17
VANECK VECTORS ETF TRUST
ABOUT FUND PERFORMANCE(unaudited)
92629_01_Van Eck_FM_AR.qxp 2/22/19 9:40 PM Page 17
For
per
sona
l use
onl
y
jgil
Highlight
jgil
Highlight
tbethe
Text Box
tbethe
Text Box
tbethe
Text Box
Hypothetical $1,000 investment at beginning of periodAs a shareholder of a Fund, you incur operating expenses, including management fees and other Fund expenses. Thisdisclosure is intended to help you understand the ongoing costs (in dollars) of investing in your Fund and to comparethese costs with the ongoing costs of investing in other mutual funds.
The disclosure is based on an investment of $1,000 invested at the beginning of the period and held for the entireperiod, July 1, 2018 to December 31, 2018.
Actual ExpensesThe first line in the table below provides information about account values and actual expenses. You may use theinformation in this line, together with the amount you invested, to estimate the expenses that you paid over the period.Simply divide your account value by $1,000 (for example, an $8,600 account value divided by $1,000 = 8.6), thenmultiply the result by the number in the first line under the heading entitled “Expenses Paid During the Period.”
Hypothetical Example for Comparison PurposesThe second line in the table below provides information about hypothetical account values and hypothetical expensesbased on the Fund’s actual expense ratio and an assumed rate of return of 5% per year before expenses, which is notthe Fund’s actual return. The hypothetical account values and expenses may not be used to estimate the actual endingaccount balance or expenses you paid for the period. You may use this information to compare the ongoing costs ofinvesting in your Fund and other funds. To do so, compare this 5% hypothetical example with the 5% hypotheticalexamples that appear in the shareholder reports of other funds.
Please note that the expenses shown in the table are meant to highlight your ongoing costs only and do not reflect anytransactional costs, such as brokerage commissions paid on purchases and sales. Therefore, the second line of thetable is useful in comparing ongoing costs only, and will not help you determine the relative costs of owning differentfunds. In addition, if these transactional costs were included, your costs would have been higher.
18
VANECK VECTORS ETF TRUST
EXPLANATION OF EXPENSES(unaudited)
92629_02_Van Eck_SOI_AR.qxp 2/22/19 9:40 PM Page 18
For
per
sona
l use
onl
y

19
Beginning Ending Annualized Expenses Paid Account Account Expense During the Period* Value Value Ratio July 1, 2018- July 1, 2018 December 31, 2018 During Period December 31, 2018
Agribusiness ETF Actual $1,000.00 $ 934.10 0.55% $2.68 Hypothetical** $1,000.00 $1,022.43 0.55% $2.80Coal ETF Actual $1,000.00 $ 853.90 0.60% $2.80 Hypothetical** $1,000.00 $1,022.18 0.60% $3.06Global Alternative Energy ETF Actual $1,000.00 $ 954.40 0.63% $3.10 Hypothetical** $1,000.00 $1,022.03 0.63% $3.21Gold Miners ETF Actual $1,000.00 $ 950.80 0.52% $2.56 Hypothetical** $1,000.00 $1,022.58 0.52% $2.65Junior Gold Miners ETF Actual $1,000.00 $ 926.10 0.54% $2.62 Hypothetical** $1,000.00 $1,022.48 0.54% $2.75Natural Resources ETF Actual $1,000.00 $ 894.80 0.50% $2.39 Hypothetical** $1,000.00 $1,022.68 0.50% $2.55Oil Refiners ETF Actual $1,000.00 $ 870.90 0.60% $2.83 Hypothetical** $1,000.00 $1,022.18 0.60% $3.06Oil Services ETF Actual $1,000.00 $ 545.30 0.35% $1.36 Hypothetical** $1,000.00 $1,023.44 0.35% $1.79Rare Earth/Strategic Metals ETF Actual $1,000.00 $ 656.20 0.60% $2.50 Hypothetical** $1,000.00 $1,022.18 0.60% $3.06Steel ETF Actual $1,000.00 $ 818.00 0.56% $2.57 Hypothetical** $1,000.00 $1,022.38 0.56% $2.85Unconventional Oil & Gas ETF Actual $1,000.00 $ 632.50 0.54% $2.22 Hypothetical** $1,000.00 $1,022.48 0.54% $2.75Uranium+Nuclear Energy ETF Actual $1,000.00 $1,012.70 0.60% $3.04 Hypothetical** $1,000.00 $1,022.18 0.60% $3.06* Expenses are equal to the Fund’s annualized expense ratio (for the six months ended December 31, 2018) multiplied by the average
account value over the period, multiplied by the number of days in the most recent fiscal half year divided by the number of days in thefiscal year (to reflect the one-half year period).
** Assumes annual return of 5% before expenses
92629_02_Van Eck_SOI_AR.qxp 2/22/19 9:40 PM Page 19
For
per
sona
l use
onl
y
tbethe
Text Box
tbethe
Text Box

27
COMMON STOCKS: 100.0%
Australia: 16.8% 120,286,941 Evolution Mining Ltd. ‡ # $ 312,760,951 39,299,695 Newcrest Mining Ltd. ‡ # 603,699,623 45,324,067 Northern Star Resources Ltd. ‡ # 295,708,750 43,837,323 OceanaGold Corp. (CAD) ‡ 159,840,290 35,956,140 Regis Resources Ltd. ‡ # 122,392,528 53,691,820 Resolute Mining Ltd. ‡ † # 43,706,450 58,140,172 Saracen Mineral Holdings Ltd. ‡ * † # 120,142,275 37,161,314 St. Barbara Ltd. ‡ † # 123,029,927
1,781,280,794Canada: 50.2% 12,874,696 Agnico-Eagle Mines Ltd. (USD) ‡ † 520,137,718 27,629,129 Alamos Gold, Inc. (USD) ‡ † 99,464,864 70,142,701 B2Gold Corp. (USD) ‡ * † 204,816,687 59,727,735 Barrick Gold Corp. (USD) ‡ † 808,713,532 20,692,375 Centerra Gold, Inc. ‡ * 88,781,167 12,399,402 Detour Gold Corp. ‡ * 104,674,993 11,255,756 Eldorado Gold Corp. (USD) ‡ * 32,416,577 13,720,241 First Majestic Silver Corp. (USD) ‡ * † 80,812,220 11,330,731 Fortuna Silver Mines, Inc. ‡ * 41,480,198 9,533,341 Franco-Nevada Corp. (USD) ‡ 668,954,538 49,188,793 Goldcorp, Inc. (USD) ‡ 482,050,171 33,069,906 IAMGOLD Corp. (USD) ‡ * 121,697,254 88,223,320 Kinross Gold Corp. (USD) ‡ * 285,843,557 14,874,524 Kirkland Lake Gold Ltd. ‡ 387,709,075 23,906,522 McEwen Mining, Inc. (USD) ‡ † 43,509,870 40,788,412 New Gold, Inc. (USD) ‡ * 30,868,670 11,086,272 Osisko Gold Royalties Ltd. (USD) ‡ † 97,337,468 10,867,096 Pan American Silver Corp. (USD) ‡ 158,659,602 13,003,699 Pretium Resources, Inc. (USD) ‡ * † 109,881,257 12,944,715 Sandstorm Gold Ltd. (USD) ‡ * † 59,675,136 23,079,470 Semafo, Inc. ‡ * † 49,849,492 8,523,236 SSR Mining, Inc. (USD) ‡ * 103,045,923 5,628,309 Torex Gold Resources, Inc. ‡ * 53,530,337 26,374,806 Wheaton Precious Metals
Corp. (USD) ‡ † 515,099,961 67,256,676 Yamana Gold, Inc. (USD) ‡ † 158,725,755
5,307,736,022China / Hong Kong: 2.2% 74,377,000 Zhaojin Mining Industry Co. Ltd. ‡ # 75,479,429 406,580,000 Zijin Mining Group Ltd. ‡ # 154,103,290
229,582,719Monaco: 1.2% 7,635,686 Endeavour Mining Corp. (CAD) ‡ * 124,894,732
Peru: 3.0% 19,483,985 Cia de Minas Buenaventura SA (ADR) ‡ 316,030,237
South Africa: 6.0% 29,236,114 AngloGold Ashanti Ltd. (ADR) ‡ 366,913,231 58,229,560 Gold Fields Ltd. (ADR) ‡ 204,968,051 37,724,389 Harmony Gold Mining Co. Ltd. (USD) ‡ * 67,526,656
639,407,938
United Kingdom: 5.8% 81,845,767 Cenatamin Plc ‡ # $ 113,792,339 5,827,529 Randgold Resources Ltd. (ADR) ‡ # 498,159,398
611,951,737United States: 14.8% 14,407,832 Coeur Mining, Inc. ‡ * 64,403,009 34,036,095 Hecla Mining Co. ‡ † 80,325,184 27,248,002 Newmont Mining Corp. ‡ 944,143,269 4,643,249 Royal Gold, Inc. ‡ 397,694,277 22,207,850 Tahoe Resources, Inc. ‡ * 81,058,653
1,567,624,392Total Common Stocks(Cost: $11,432,117,373) 10,578,508,571
Principal Amount
SHORT-TERM INVESTMENTS HELD AS COLLATERAL FOR SECURITIES ON LOAN: 2.5%
Repurchase Agreements: 2.5% $61,779,923 Repurchase agreement dated
12/31/18 with Citigroup Global Markets, Inc., 3.02%, due 1/2/19, proceeds $61,790,288; (collateralized by various U.S. government and agency obligations, 2.50% to 8.00%, due 1/25/19 to 7/15/60, valued at $63,015,522 including accrued interest) 61,779,923
14,480,800 Repurchase agreement dated 12/31/18 with Credit Agricole CIB, 3.00%, due 1/2/19, proceeds $14,483,213; (collateralized by various U.S. government and agency obligations, 4.00% to 4.50%, due 6/20/48 to 8/1/48, valued at $14,770,416 including accrued interest) 14,480,800
63,098,939 Repurchase agreement dated 12/31/18 with Daiwa Capital Markets America, Inc., 3.05%, due 1/2/19, proceeds $63,109,631; (collateralized by various U.S. government and agency obligations, 2.00% to 6.50%, due 1/25/19 to 2/1/49, valued at $64,360,918 including accrued interest) 63,098,939
63,098,939 Repurchase agreement dated 12/31/18 with Merrill Lynch, Pierce, Fenner & Smith, Inc., 3.00%, due 1/2/19, proceeds $63,109,455; (collateralized by various U.S. government and agency obligations, 2.73% to 5.50%, due 1/1/34 to 1/1/49, valued at $64,360,918 including accrued interest) 63,098,939
See Notes to Financial Statements
Number of Shares Value
Number of Shares Value
VANECK VECTORS GOLD MINERS ETF
SCHEDULE OF INVESTMENTSDecember 31, 2018
92629_02_Van Eck_SOI_AR.qxp 2/22/19 9:40 PM Page 27
For
per
sona
l use
onl
y

28
$63,098,939 Repurchase agreement dated 12/31/18 with Nomura Securities International, Inc., 3.00%, due 1/2/19, proceeds $63,109,455; (collateralized by various U.S. government and agency obligations, 0.00% to 7.50%, due 1/3/19 to 11/20/68, valued at $64,360,918 including
accrued interest) $ 63,098,939
Total Short-Term Investments Held as Collateral for Securities on Loan(Cost: $265,557,540) 265,557,540
Total Investments: 102.5%(Cost: $11,697,674,913) 10,844,066,111
Liabilities in excess of other assets: (2.5)% (268,379,318)
NET ASSETS: 100.0% $10,575,686,793
See Notes to Financial Statements
Principal Amount Value
VANECK VECTORS GOLD MINERS ETF
SCHEDULE OF INVESTMENTS(continued)
Definitions:ADR American Depositary ReceiptCAD Canadian DollarUSD United States Dollar
Footnotes:‡ Affiliated issuer–as defined under the Investment Company Act of 1940.* Non-income producing† Security fully or partially on loan. Total market value of securities on loan is $261,227,376.# Security has been valued in good faith pursuant to guidelines established by the Board of Trustees. The aggregate value of fair valued
securities is $2,462,974,960 which represents 23.3% of net assets.
Summary of Investments by SectorExcluding Collateral for Securities Loaned % of Investments Value_________________________________________ __________________ ____________Gold 91.1% $ 9,637,728,397Silver 8.9 940,780,174 _________ _______________________________ 100.0% $10,578,508,571 _________ _______________________________ _________ _______________________________
92629_02_Van Eck_SOI_AR.qxp 2/22/19 9:40 PM Page 28
For
per
sona
l use
onl
y

29
A summary of the Fund’s transactions in securities of affiliates for the year ended December 31, 2018 is set forth below:
Net Change in Unrealized Value Sales Realized Gain Dividend Appreciation ValueAffiliates 12/31/17 Purchases Proceeds (Loss) Income (Depreciation) 12/31/18_________ ________ __________ __________ ____________ ________ _____________ ________Agnico-Eagle Mines Ltd. $ —(a) $ 400,725,733 $ (225,062,400) $ (9,599,507) $ 4,674,447 $ (22,262,306) $ 520,137,718Alamos Gold, Inc. —(a) 95,860,292 (34,651,210) (7,795,292) 275,598 (32,477,292) 99,464,864AngloGold Ashanti Ltd. —(a) 202,680,946 (93,861,370) (31,705,153) 1,078,478 100,718,151 366,913,231B2Gold Corp. —(a) 133,092,513 (64,773,898) (1,044,922) — 147,324 204,816,687Barrick Gold Corp. —(a) 626,863,795 (405,491,430) (103,609,420) 10,461,465 123,873,009 808,713,532Cenatamin Plc —(a) 93,534,826 (52,083,173) (1,147,714) 6,969,248 (37,875,898) 113,792,339Centerra Gold, Inc. —(a) 69,761,586 (36,321,264) (4,034,079) — (8,438,644) 88,781,167Cia de Minas Buenaventura SA —(a) 204,828,564 (99,433,095) 3,005,484 1,336,010 32,317,500 316,030,237Coeur Mining, Inc. —(a) 66,830,393 (33,093,692) (10,335,610) — (22,061,060) 64,403,009Detour Gold Corp. —(a) 77,296,562 (41,349,985) (18,638,618) — (5,975,517) 104,674,993Eldorado Gold Corp. —(a) 37,695,436 (20,105,553) (55,954,331) — 19,351,590 32,416,577Endeavour Mining Corp. —(a) 91,665,701 (44,915,018) (518,269) — (19,402,855) 124,894,732Evolution Mining Ltd. —(a) 202,766,001 (94,180,051) 10,002,931 5,254,495 35,946,290 312,760,951First Majestic Silver Corp. —(a) 58,253,993 (20,819,925) (3,332,350) — (3,874,202) 80,812,220Fortuna Silver Mines, Inc. —(a) 37,622,774 (19,478,623) (2,126,969) — (12,352,364) 41,480,198Franco-Nevada Corp. —(a) 569,151,982 (346,617,472) (6,261,821) 8,065,878 (45,662,091) 668,954,538Gold Fields Ltd. —(a) 144,917,746 (69,124,918) (19,548,667) 2,363,175 (11,285,040) 204,968,051Goldcorp, Inc. —(a) 462,843,733 (231,145,049) (119,892,647) 3,189,711 (2,522,676) 482,050,171Harmony Gold Mining Co. Ltd. —(a) 46,160,517 (16,906,181) (2,913,305) — 3,518,411 67,526,656Hecla Mining Co. —(a) 73,996,646 (28,341,934) (4,073,703) 221,312 (33,007,628) 80,325,184IAMGOLD Corp. —(a) 113,762,462 (56,350,214) (808,049) — (57,621,624) 121,697,254Kinross Gold Corp. —(a) 215,693,967 (109,405,384) (26,703,944) — (37,745,577) 285,843,557Kirkland Lake Gold Ltd. —(a) 217,327,383 (90,544,965) 30,036,178 1,100,799 86,706,047 387,709,075McEwen Mining, Inc. —(a) 35,070,272 (16,929,120) (4,571,792) 160,763 (4,446,667) 43,509,870New Gold, Inc. —(a) 46,119,528 (26,808,667) (27,811,749) — (46,396,442) 30,868,670Newcrest Mining Ltd. —(a) 522,933,081 (318,953,942) (9,788,235) 6,561,633 (49,799,408) 603,699,623Newmont Mining Corp. —(a) 837,240,099 (519,221,954) 3,482,802 13,584,171 (49,845,785) 944,143,269Northern Star Resources Ltd. —(a) 180,435,305 (79,727,514) 22,273,512 2,284,927 42,334,961 295,708,750OceanaGold Corp. —(a) 91,043,811 (43,194,730) (1,518,392) 1,021,761 41,694,718 159,840,290Osisko Gold Royalties Ltd. —(a) 71,511,386 (35,656,641) (8,315,435) 1,323,451 (12,390,853) 97,337,468Pan American Silver Corp. —(a) 122,993,392 (61,106,231) (2,565,096) 1,120,060 (8,612,826) 158,659,602Pretium Resources, Inc. —(a) 72,079,126 (36,037,995) (4,103,250) — (15,758,967) 109,881,257Randgold Resources Ltd. —(a) 328,444,079 (137,396,892) (15,789,453) 8,460,277 (15,940,570) 498,159,398Regis Resources Ltd. —(a) 86,854,043 (41,807,883) 10,459,952 3,277,003 (9,416,715) 122,392,528Resolute Mining Ltd. —(a) 34,426,970 (16,732,252) (4,633,362) 652,862 876,961 43,706,450Royal Gold, Inc. —(a) 280,578,697 (135,875,402) 5,062,671 3,276,098 4,866,332 397,694,277Sandstorm Gold Ltd. —(a) 41,159,158 (19,860,216) (2,237,465) — (612,149) 59,675,136Saracen Mineral Holdings Ltd. —(a) 66,467,070 (29,115,680) 3,980,672 — 30,125,134 120,142,275Semafo, Inc. —(a) 42,484,318 (21,839,586) (3,091,278) — (9,631,370) 49,849,492SSR Mining, Inc. —(a) 62,269,276 (27,979,199) (1,514,913) — 22,661,842 103,045,923St. Barbara Ltd. —(a) 85,455,500 (36,390,147) 6,994,094 2,561,647 (277,848) 123,029,927Tahoe Resources, Inc. —(a) 65,662,943 (32,400,510) (32,776,175) — 12,710,894 81,058,653Torex Gold Resources, Inc. —(a) 33,294,658 (16,567,080) (7,846,648) — 10,234,782 53,530,337Wheaton Precious Metals Corp. —(a) 310,791,235 (121,959,012) (580,803) 7,343,684 (41,232,070) 515,099,961Yamana Gold, Inc. —(a) 132,528,400 (65,875,879) (28,043,951) 1,062,047 (13,889,152) 158,725,755Zhaojin Mining Industry Co. Ltd. —(a) 45,084,246 (20,516,923) (2,278,844) 424,268 16,426,118 75,479,429Zijin Mining Group Ltd. —(a) 117,258,317 (61,547,332) 5,744,307 3,424,658 (5,377,721) 154,103,290 __________ ___________________________ ____________________________ _________________________ ________________________ _________________________ ______________________________ $ — $7,955,518,461 $(4,157,557,591) $(486,468,608) $101,529,926 $ (51,683,253) $10,578,508,571 __________ ___________________________ ____________________________ _________________________ ________________________ _________________________ ______________________________ __________ ___________________________ ____________________________ _________________________ ________________________ _________________________ ______________________________
(a) Security held by the Fund, however not classified as an affiliate at the beginning of the reporting period.
See Notes to Financial Statements
92629_02_Van Eck_SOI_AR.qxp 2/22/19 9:40 PM Page 29
For
per
sona
l use
onl
y

30
The summary of inputs used to value the Fund’s investments as of December 31, 2018 is as follows:
Level 2 Level 3 Level 1 Significant Significant Quoted Observable Unobservable Prices Inputs Inputs Value _______________ ____________ ______________ __________________Common Stocks Australia $ 159,840,290 $1,621,440,504 $ — $ 1,781,280,794 Canada 5,307,736,022 — — 5,307,736,022 China / Hong Kong — 229,582,719 — 229,582,719 Monaco 124,894,732 — — 124,894,732 Peru 316,030,237 — — 316,030,237 South Africa 639,407,938 — — 639,407,938 United Kingdom — 611,951,737 — 611,951,737 United States 1,567,624,392 — — 1,567,624,392Repurchase Agreements — 265,557,540 — 265,557,540 ___________________________ ___________________________ ___________________ _____________________________Total $8,115,533,611 $2,728,532,500 $ — $10,844,066,111 ___________________________ ___________________________ ___________________ _____________________________ ___________________________ ___________________________ ___________________ _____________________________
See Notes to Financial Statements
VANECK VECTORS GOLD MINERS ETF
SCHEDULE OF INVESTMENTS(continued)
92629_02_Van Eck_SOI_AR.qxp 2/22/19 9:40 PM Page 30
For
per
sona
l use
onl
y

54See Notes to Financial Statements
Junior N R U U Agribusiness Coal Global Alternative Gold Miners Gold Miners R O O S O E ETF ETF Energy ETF ETF ETF E E E E S E E _____________ ____________ ______________ _____________ _____________ _ _ _ _ _ _
Assets:Investments, at value (1) Unaffiliated issuers (2) . . . . . . . . . . . . . . . . . . . . . . . . $ 757,998,638 $ 55,041,632 $ 78,947,173 $ — $1,010,534,891 Affiliated issuers (3) . . . . . . . . . . . . . . . . . . . . . . . . . . — — — 10,578,508,571 3,263,266,324 Short-term investments held as collateral for securities loaned (4) . . . . . . . . . . . . . . . . . . . . . . . . . 41,197,255 1,461,143 4,216,046 265,557,540 176,292,520 Cash . . . . . . . . . . . . . . . . . . . . . . . . . . . . . . . . . . . . . . . . — 21,911 — — — 1 Cash denominated in foreign currency, at value (5) . . . . . 555,390 1,014,187 32,460 — — 9 Receivables: Investment securities sold. . . . . . . . . . . . . . . . . . . . . 2,219,363 11,082 — — — 3 Shares sold. . . . . . . . . . . . . . . . . . . . . . . . . . . . . . . . 36,351 — — 1,871 13,398 Due from Adviser . . . . . . . . . . . . . . . . . . . . . . . . . . . — — — — — 1 Dividends and interest. . . . . . . . . . . . . . . . . . . . . . . . 1,963,755 72,556 116,537 4,831,514 1,868,135 Prepaid expenses . . . . . . . . . . . . . . . . . . . . . . . . . . . . . . 8,748 1,000 854 115,445 61,122 ____________________________ ________________________ ________________________ ______________________________ ___________________________ _ _ _ _ _ Total assets . . . . . . . . . . . . . . . . . . . . . . . . . . . 803,979,500 57,623,511 83,313,070 10,849,014,941 4,452,036,390 ____________________________ ________________________ ________________________ ______________________________ ___________________________ _ _ _ _ _
Liabilities:Payables: Investment securities purchased . . . . . . . . . . . . . . . . 4,616,370 944,014 — — — 2 Collateral for securities loaned . . . . . . . . . . . . . . . . . 41,197,255 1,461,143 4,216,046 265,557,540 176,292,520 Line of credit . . . . . . . . . . . . . . . . . . . . . . . . . . . . . . . — — — 2,157,036 — 2 Shares redeemed . . . . . . . . . . . . . . . . . . . . . . . . . . . — — — 1,579 — — — — — — — — Due to Adviser . . . . . . . . . . . . . . . . . . . . . . . . . . . . . 318,134 21,599 32,786 4,147,171 1,730,217 Due to custodian . . . . . . . . . . . . . . . . . . . . . . . . . . . 438,413 — — 29,282 415 Deferred Trustee fees. . . . . . . . . . . . . . . . . . . . . . . . . . . . 410,785 19,976 10,510 763,672 173,566 Accrued expenses. . . . . . . . . . . . . . . . . . . . . . . . . . . . . . 282,431 93,139 77,982 671,868 444,488 ____________________________ ________________________ ________________________ ______________________________ ___________________________ _ _ _ _ _ Total liabilities . . . . . . . . . . . . . . . . . . . . . . . . . 47,263,388 2,539,871 4,337,324 273,328,148 178,641,206 ____________________________ ________________________ ________________________ ______________________________ ___________________________ _ _ _ _ _ NET ASSETS . . . . . . . . . . . . . . . . . . . . . . . . . . . . . . . . . $ 756,716,112 $ 55,083,640 $ 78,975,746 $ 10,575,686,793 $4,273,395,184 ____________________________ ________________________ ________________________ ______________________________ ___________________________ _ _ _ _ _ ____________________________ ________________________ ________________________ ______________________________ ___________________________ _ _ _ _ _ Shares outstanding . . . . . . . . . . . . . . . . . . . . . . . . . . . . . 13,250,000 4,350,000 1,433,298 501,852,500 141,937,446 ____________________________ ________________________ ________________________ ______________________________ ___________________________ _ _ _ _ _ ____________________________ ________________________ ________________________ ______________________________ ___________________________ _ _ _ _ _ Net asset value, redemption and offering price per share . . . . . . . . . . . . . . . . . . . $ 57.11 $ 12.66 $ 55.10 $ 21.07 $ 30.11 ____________________________ ________________________ ________________________ ______________________________ ___________________________ _ _ _ _ _ ____________________________ ________________________ ________________________ ______________________________ ___________________________ _ _ _ _ _
Net assets consist of: Aggregate paid in capital . . . . . . . . . . . . . . . . . . . . . $1,464,728,891 $ 374,902,299 $ 168,653,646 $ 21,208,906,973 $9,189,373,351 Total distributable earnings (loss). . . . . . . . . . . . . . . . (708,012,779) (319,818,659) (89,677,900) (10,633,220,180) (4,915,978,167) ____________________________ ________________________ ________________________ ______________________________ ___________________________ _ _ _ _ _ $ 756,716,112 $ 55,083,640 $ 78,975,746 $ 10,575,686,793 $4,273,395,184 ____________________________ ________________________ ________________________ ______________________________ ___________________________ _ _ _ _ _ ____________________________ ________________________ ________________________ ______________________________ ___________________________ _ _ _ _ _ (1) Value of securities on loan . . . . . . . . . . . . . . . . . . . . . $ 37,911,477 $ 1,365,099 $ 4,018,680 $ 261,227,376 $ 171,948,320 ____________________________ ________________________ ________________________ ______________________________ ___________________________ _ _ _ _ _ ____________________________ ________________________ ________________________ ______________________________ ___________________________ _ _ _ _ _ (2) Cost of investments – Unaffiliated issuers . . . . . . . . . $ 769,843,903 $ 67,882,822 $ 71,253,653 $ — $1,248,830,207 ____________________________ ________________________ ________________________ ______________________________ ___________________________ _ _ _ _ _ ____________________________ ________________________ ________________________ ______________________________ ___________________________ _ _ _ _ _ (3) Cost of investments – Affiliated issuers . . . . . . . . . . . $ — $ — $ — $ 11,432,117,373 $3,379,652,506 ____________________________ ________________________ ________________________ ______________________________ ___________________________ _ _ _ _ _ ____________________________ ________________________ ________________________ ______________________________ ___________________________ _ _ _ _ _ (4) Cost of short-term investments held as collateral for securities loaned . . . . . . . . . . . . . . . . . . . . . . $ 41,197,255 $ 1,461,143 $ 4,216,046 $ 265,557,540 $ 176,292,520 ____________________________ ________________________ ________________________ ______________________________ ___________________________ _ _ _ _ _ ____________________________ ________________________ ________________________ ______________________________ ___________________________ _ _ _ _ _ (5) Cost of cash denominated in foreign currency . . . . . $ 555,649 $ 1,012,261 $ 31,790 $ — $ — $ 9 ____________________________ ________________________ ________________________ ______________________________ ___________________________ _ _ _ _ _ ____________________________ ________________________ ________________________ ______________________________ ___________________________ _ _ _ _ _
VANECK VECTORS ETF TRUST
STATEMENTS OF ASSETS AND LIABILITIESDecember 31, 2018
92629_03_Van Eck_Fins_AR.qxp 2/25/19 5:23 PM Page 54
For
per
sona
l use
onl
y
tbethe
Text Box
tbethe
Text Box
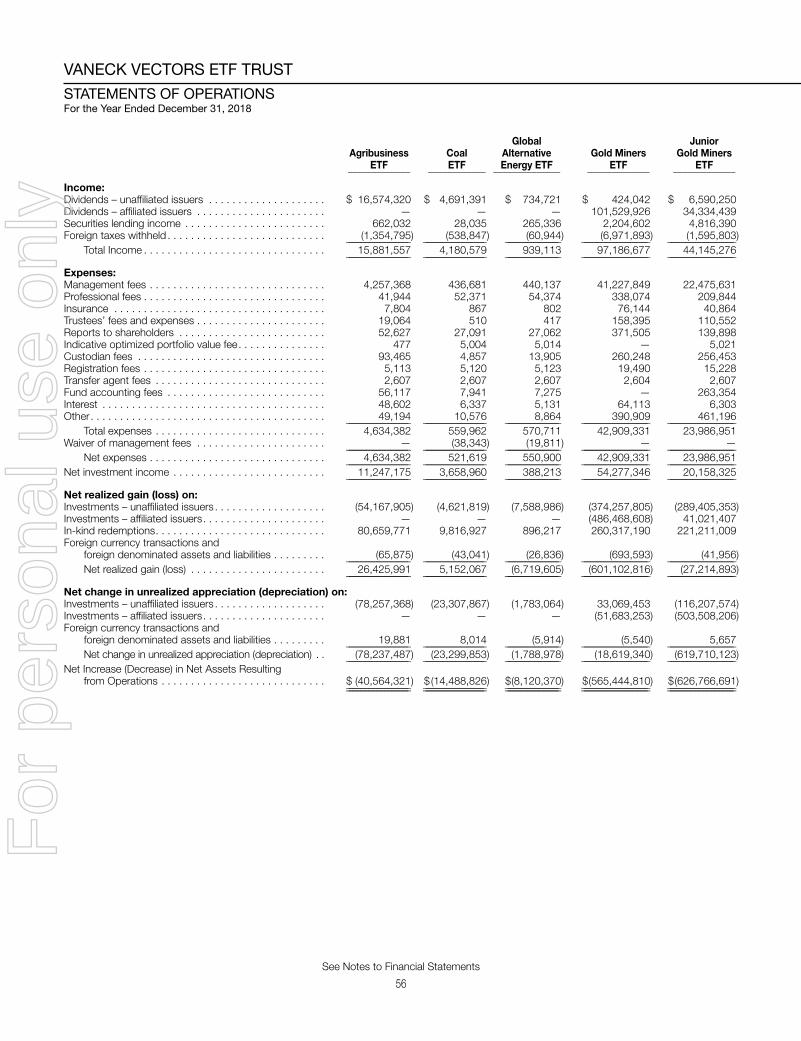
Global Junior N R U U Agribusiness Coal Alternative Gold Miners Gold Miners R O O S O E ETF ETF Energy ETF ETF ETF E E E E S E E _____________ ____________ ______________ _____________ _____________ _ _ _ _ _ _ _
Income:Dividends – unaffiliated issuers . . . . . . . . . . . . . . . . . . . . $ 16,574,320 $ 4,691,391 $ 734,721 $ 424,042 $ 6,590,250 Dividends – affiliated issuers . . . . . . . . . . . . . . . . . . . . . . — — — 101,529,926 34,334,439 Securities lending income . . . . . . . . . . . . . . . . . . . . . . . . 662,032 28,035 265,336 2,204,602 4,816,390 Foreign taxes withheld . . . . . . . . . . . . . . . . . . . . . . . . . . . (1,354,795) (538,847) (60,944) (6,971,893) (1,595,803) _______________________ _______________________ _____________________ _________________________ _________________________ _ _ _ Total Income . . . . . . . . . . . . . . . . . . . . . . . . . . . . . . . 15,881,557 4,180,579 939,113 97,186,677 44,145,276 _______________________ _______________________ _____________________ _________________________ _________________________ _ _ _
Expenses:Management fees . . . . . . . . . . . . . . . . . . . . . . . . . . . . . . 4,257,368 436,681 440,137 41,227,849 22,475,631 Professional fees . . . . . . . . . . . . . . . . . . . . . . . . . . . . . . . 41,944 52,371 54,374 338,074 209,844 Insurance . . . . . . . . . . . . . . . . . . . . . . . . . . . . . . . . . . . . 7,804 867 802 76,144 40,864 Trustees’ fees and expenses . . . . . . . . . . . . . . . . . . . . . . 19,064 510 417 158,395 110,552 Reports to shareholders . . . . . . . . . . . . . . . . . . . . . . . . . 52,627 27,091 27,062 371,505 139,898 Indicative optimized portfolio value fee. . . . . . . . . . . . . . . 477 5,004 5,014 — 5,021 Custodian fees . . . . . . . . . . . . . . . . . . . . . . . . . . . . . . . . 93,465 4,857 13,905 260,248 256,453 Registration fees . . . . . . . . . . . . . . . . . . . . . . . . . . . . . . . 5,113 5,120 5,123 19,490 15,228 Transfer agent fees . . . . . . . . . . . . . . . . . . . . . . . . . . . . . 2,607 2,607 2,607 2,604 2,607 Fund accounting fees . . . . . . . . . . . . . . . . . . . . . . . . . . . 56,117 7,941 7,275 — 263,354 Interest . . . . . . . . . . . . . . . . . . . . . . . . . . . . . . . . . . . . . . 48,602 6,337 5,131 64,113 6,303 Other. . . . . . . . . . . . . . . . . . . . . . . . . . . . . . . . . . . . . . . . 49,194 10,576 8,864 390,909 461,196 _______________________ _______________________ _____________________ _________________________ _________________________ _ _ _ Total expenses . . . . . . . . . . . . . . . . . . . . . . . . . . . . . 4,634,382 559,962 570,711 42,909,331 23,986,951 Waiver of management fees . . . . . . . . . . . . . . . . . . . . . . — (38,343) (19,811) — — ( _______________________ _______________________ _____________________ _________________________ _________________________ _ _ _ Net expenses . . . . . . . . . . . . . . . . . . . . . . . . . . . . . . 4,634,382 521,619 550,900 42,909,331 23,986,951 _______________________ _______________________ _____________________ _________________________ _________________________ _ _ _ Net investment income . . . . . . . . . . . . . . . . . . . . . . . . . . 11,247,175 3,658,960 388,213 54,277,346 20,158,325 _______________________ _______________________ _____________________ _________________________ _________________________ _ _ _
Net realized gain (loss) on:Investments – unaffiliated issuers . . . . . . . . . . . . . . . . . . . (54,167,905) (4,621,819) (7,588,986) (374,257,805) (289,405,353) Investments – affiliated issuers. . . . . . . . . . . . . . . . . . . . . — — — (486,468,608) 41,021,407 In-kind redemptions. . . . . . . . . . . . . . . . . . . . . . . . . . . . . 80,659,771 9,816,927 896,217 260,317,190 221,211,009 Foreign currency transactions and foreign denominated assets and liabilities . . . . . . . . . (65,875) (43,041) (26,836) (693,593) (41,956) _______________________ _______________________ _____________________ _________________________ _________________________ _ _ _ Net realized gain (loss) . . . . . . . . . . . . . . . . . . . . . . . 26,425,991 5,152,067 (6,719,605) (601,102,816) (27,214,893) _______________________ _______________________ _____________________ _________________________ _________________________ _ _ _
Net change in unrealized appreciation (depreciation) on:Investments – unaffiliated issuers . . . . . . . . . . . . . . . . . . . (78,257,368) (23,307,867) (1,783,064) 33,069,453 (116,207,574) Investments – affiliated issuers. . . . . . . . . . . . . . . . . . . . . — — — (51,683,253) (503,508,206) Foreign currency transactions and foreign denominated assets and liabilities . . . . . . . . . 19,881 8,014 (5,914) (5,540) 5,657 _______________________ _______________________ _____________________ _________________________ _________________________ _ _ _ Net change in unrealized appreciation (depreciation) . . (78,237,487) (23,299,853) (1,788,978) (18,619,340) (619,710,123) _______________________ _______________________ _____________________ _________________________ _________________________ _ _ _ Net Increase (Decrease) in Net Assets Resulting from Operations . . . . . . . . . . . . . . . . . . . . . . . . . . . . $ (40,564,321) $(14,488,826) $(8,120,370) $(565,444,810) $(626,766,691) _______________________ _______________________ _____________________ _________________________ _________________________ _ _ _ _______________________ _______________________ _____________________ _________________________ _________________________ _ _ _
VANECK VECTORS ETF TRUST
STATEMENTS OF OPERATIONSFor the Year Ended December 31, 2018
56See Notes to Financial Statements
92629_03_Van Eck_Fins_AR.qxp 2/22/19 9:41 PM Page 56
For
per
sona
l use
onl
y
tbethe
Text Box
tbethe
Text Box

59See Notes to Financial Statements
A C Global Alternative Energy ETF Gold Miners ETF Junior Gold Miners ETF _ ________________________________ _________________________________ ___________________________________ F F F F For the Year For the Year For the Year For the Year For the Year For the Year E E E E Ended Ended Ended Ended Ended Ended D D D December 31, December 31, December 31, December 31, December 31, December 31, 2 2 2 2 2018 2017 2018 2017 2018 2017 _ _ _ _____________ _____________ ______________ ______________ ________________ ______________
$ 1 $ 388,213 $ 1,494,996 $ 54,277,346 $ 38,772,198 $ 20,158,325 $ 6,745,774 2 (6,719,605) (1,608,236) (601,102,816) 291,402,819 (27,214,893) (402,589,274) ( (1,788,978) 14,397,204 (18,619,340) 614,074,975 (619,710,123) 430,588,830 _ _ _______________________ ______________________ _____________________________ _____________________________ ___________________________ ___________________________ ( (8,120,370) 14,283,964 (565,444,810) 944,249,992 (626,766,691) 34,745,330 _ _ _______________________ ______________________ _____________________________ _____________________________ ___________________________ ___________________________
( (499,871) (1,099,340) (51,959,513) (61,169,240) (19,534,693) (1,476,062) _ _ _______________________ ______________________ _____________________________ _____________________________ ___________________________ ___________________________
2 2,944,806 11,928,638 5,960,338,004 4,444,326,017 1,806,805,925 3,071,722,395 ( (2,699,948) (2,720,340) (2,341,832,008) (7,437,833,489) (1,521,604,784) (1,924,829,152) _ _ _______________________ ______________________ _____________________________ _____________________________ ___________________________ ___________________________ ( 244,858 9,208,298 3,618,505,996 (2,993,507,472) 285,201,141 1,146,893,243 _ _ _______________________ ______________________ _____________________________ _____________________________ ___________________________ ___________________________
( (8,375,383) 22,392,922 3,001,101,673 (2,110,426,720) (361,100,243) 1,180,162,511 8 87,351,129 64,958,207 7,574,585,120 9,685,011,840 4,634,495,427 3,454,332,916 _ _ _______________________ ______________________ _____________________________ _____________________________ ___________________________ ___________________________ $ 7 $ 78,975,746 $ 87,351,129 $10,575,686,793 $ 7,574,585,120 $4,273,395,184 $4,634,495,427 _ _ _______________________ ______________________ _____________________________ _____________________________ ___________________________ ___________________________ _ _ _______________________ ______________________ _____________________________ _____________________________ ___________________________ ___________________________
4 50,000 200,000 284,350,000 191,600,000 57,450,000 84,550,000 ( (50,000) (50,000) (108,250,000) (328,750,000) (51,000,000) (57,950,000) _ _ _______________________ ______________________ _____________________________ _____________________________ ___________________________ ___________________________
( — 150,000 176,100,000 (137,150,000) 6,450,000 26,600,000 _ _ _______________________ ______________________ _____________________________ _____________________________ ___________________________ ___________________________ _ _ _______________________ ______________________ _____________________________ _____________________________ ___________________________ ___________________________
92629_03_Van Eck_Fins_AR.qxp 2/22/19 9:41 PM Page 59
For
per
sona
l use
onl
y
tbethe
Text Box
tbethe
Text Box

64See Notes to Financial Statements
VANECK VECTORS ETF TRUST
FINANCIAL HIGHLIGHTSFor a share outstanding throughout each year:
Global Alternative Energy ETF __________________________________________________________________ For the Year Ended December 31, __________________________________________________________________ 2018 2017 2016 2015 2014 _____________ _____________ _____________ _____________ _____________
Net asset value, beginning of year . . . . . . . . . . . . . . . . . $60.94 $50.62 $54.57 $54.09 $55.90 ____________ ____________ ____________ ____________ ____________Income from investment operations: Net investment income . . . . . . . . . . . . . . . . . . . . . . 0.26(a) 1.12(a) 1.38 0.46 0.12 Net realized and unrealized gain (loss) on investments . . . . . . . . . . . . . . . . . . . . . . . . . . (5.76) 9.97 (4.26) 0.33 (1.82) ____________ ____________ ____________ ____________ ____________Total from investment operations . . . . . . . . . . . . . . . . . . (5.50) 11.09 (2.88) 0.79 (1.70) ____________ ____________ ____________ ____________ ____________Less: Dividends from net investment income . . . . . . . . . . (0.34) (0.77) (1.07) (0.31) (0.11) ____________ ____________ ____________ ____________ ____________Net asset value, end of year . . . . . . . . . . . . . . . . . . . . . . $55.10 $60.94 $50.62 $54.57 $54.09 ____________ ____________ ____________ ____________ ____________ ____________ ____________ ____________ ____________ ____________Total return (b) . . . . . . . . . . . . . . . . . . . . . . . . . . . . . . . . (9.02)% 21.90% (5.26)% 1.45% (3.04)%
Ratios/Supplemental DataNet assets, end of year (000’s) . . . . . . . . . . . . . . . . . . . . $78,976 $87,351 $64,958 $91,857 $82,937Ratio of gross expenses to average net assets . . . . . . . . 0.65% 0.67% 0.64% 0.62% 0.64%Ratio of net expenses to average net assets . . . . . . . . . 0.63% 0.63% 0.62% 0.62% 0.62%Ratio of net expenses to average net assetsexcluding interest expense . . . . . . . . . . . . . . . . . . . . . 0.62% 0.62% 0.62% 0.62% 0.62%
Ratio of net investment income to average net assets . . 0.44% 1.94% 2.04% 0.88% 0.18%Portfolio turnover rate (c) . . . . . . . . . . . . . . . . . . . . . . . . 31% 21% 32% 27% 31%
Gold Miners ETF __________________________________________________________________ For the Year Ended December 31, __________________________________________________________________ 2018 2017 2016 2015 2014 _____________ _____________ _____________ _____________ _____________
Net asset value, beginning of year . . . . . . . . . . . . . . . . . $23.25 $20.92 $13.72 $18.43 $21.16 ____________ ____________ ____________ ____________ ____________Income from investment operations: Net investment income . . . . . . . . . . . . . . . . . . . . . . 0.14(a) 0.10(a) 0.03 0.12 0.12 Net realized and unrealized gain (loss) on investments . . . . . . . . . . . . . . . . . . . . . . . . . . (2.21) 2.41 7.23 (4.71) (2.73) ____________ ____________ ____________ ____________ ____________Total from investment operations . . . . . . . . . . . . . . . . . . (2.07) 2.51 7.26 (4.59) (2.61) ____________ ____________ ____________ ____________ ____________Less: Dividends from net investment income . . . . . . . . . . (0.11) (0.18) (0.06) (0.12) (0.12) ____________ ____________ ____________ ____________ ____________Net asset value, end of year . . . . . . . . . . . . . . . . . . . . . . $21.07 $23.25 $20.92 $13.72 $18.43 ____________ ____________ ____________ ____________ ____________ ____________ ____________ ____________ ____________ ____________Total return (b) . . . . . . . . . . . . . . . . . . . . . . . . . . . . . . . . (8.92)% 11.99% 52.91% (24.93)% (12.31)%
Ratios/Supplemental DataNet assets, end of year (000’s) . . . . . . . . . . . . . . . . . . . . $10,575,687 $7,574,585 $9,685,012 $4,316,718 $5,495,447Ratio of gross expenses to average net assets . . . . . . . . 0.52% 0.53% 0.51% 0.52% 0.53%Ratio of net expenses to average net assets . . . . . . . . . 0.52% 0.53% 0.51% 0.52% 0.53%Ratio of net expenses to average net assetsexcluding interest expense . . . . . . . . . . . . . . . . . . . . . 0.52% 0.53% 0.51% 0.52% 0.53%
Ratio of net investment income to average net assets . . 0.66% 0.42% 0.21% 0.66% 0.52%Portfolio turnover rate (c) . . . . . . . . . . . . . . . . . . . . . . . . 15% 12% 26% 24% 18%
(a) Calculated based upon average shares outstanding(b) Total return is calculated assuming an initial investment made at the net asset value at the beginning of year, reinvestment of any dividends
and distributions at net asset value on the dividend/distributions payment date and a redemption at the net asset value on the last day of theyear. The return does not reflect the deduction of taxes that a shareholder would pay on Fund dividends/distributions or the redemption ofFund shares.
(c) Portfolio turnover rates exclude securities received or delivered as a result of processing in-kind capital share transactions.
92629_03_Van Eck_Fins_AR.qxp 2/22/19 9:41 PM Page 64
For
per
sona
l use
onl
y
tbethe
Text Box

69
Note 1—Fund Organization—VanEck Vectors ETF Trust (the “Trust”) is registered under the Investment Company Actof 1940, as amended, as an open-end management investment company. The Trust was incorporated in Delaware asa statutory trust on March 15, 2001. The Trust operates as a series fund, and as of December 31, 2018, offers fifty-eight investment portfolios, each of which represents a separate series of the Trust.
These financial statements relate only to the following investment portfolios: Agribusiness ETF, Coal ETF, GlobalAlternative Energy ETF, Gold Miners ETF, Junior Gold Miners ETF, Natural Resources ETF, Oil Refiners ETF, Oil ServicesETF, Rare Earth/Strategic Metals ETF, Steel ETF, Unconventional Oil & Gas ETF and Uranium+Nuclear Energy ETF (eacha “Fund” and, together, the “Funds”). Each Fund was created to provide investors with the opportunity to purchase asecurity representing a proportionate undivided interest in a portfolio of securities consisting of substantially all of thecommon stocks in substantially the same weighting, in an index sponsored, licensed or managed by ICE Data Indices,LLC, Ardour Global Indexes, LLC, S-Network Global Indexes, LLC and MV Index Solutions GmbH (“MVIS”), a whollyowned subsidiary of Van Eck Associates Corporation (the “Adviser”).
The Funds’ respective Indices are presented below:
Fund Index_____ ______
Agribusiness ETF MVIS® Global Agribusiness Index*Coal ETF MVIS® Global Coal Index*Global Alternative Energy ETF Ardour Global IndexSM (Extra Liquid)Gold Miners ETF NYSE Arca Gold Miners Index***Junior Gold Miners ETF MVIS® Global Junior Gold Miners Index*Natural Resources ETF VanEck® Natural Resources Index**Oil Refiners ETF MVIS® Global Oil Refiners Index*Oil Services ETF MVIS® US Listed Oil Services 25 Index*Rare Earth/Strategic Metals ETF MVIS® Global Rare Earth/Strategic Metals Index*Steel ETF NYSE Arca Steel Index***Unconventional Oil & Gas ETF MVIS® Global Unconventional Oil & Gas Index*Uranium+Nuclear Energy ETF MVIS® Global Uranium & Nuclear Energy Index*
* Published by MVIS.** Published by S-Network Global Indexes, LLC*** Published by ICE Data Indices, LLC
Note 2—Significant Accounting Policies—The preparation of financial statements in conformity with U.S. generallyaccepted accounting principles (“GAAP”) requires management to make estimates and assumptions that affect thereported amounts and disclosures in the financial statements. Actual results could differ from those estimates.
The Funds are investment companies and are following accounting and reporting requirements of AccountingStandards Codification (“ASC”) 946 Financial Services—Investment Companies.
The following is a summary of significant accounting policies followed by the Funds.
A. Security Valuation—The Funds value their investments in securities and other assets and liabilities at fair valuedaily. Fair value is the price that would be received to sell an asset or paid to transfer a liability in an orderlytransaction between market participants on the measurement date. Securities traded on national exchanges ortraded on the NASDAQ National Market System are valued at the last sales price as reported at the close of eachbusiness day. Securities traded on the NASDAQ Stock Market are valued at the NASDAQ official closing price.Over-the-counter securities not included in the NASDAQ National Market System and listed securities for which nosale was reported are valued at the mean of the bid and ask prices. To the extent these securities are actively tradedthey are categorized as Level 1 in the fair value hierarchy (described below). Certain foreign securities, whose valuesmay be affected by market direction or events occurring before the Funds’ pricing time (4:00 p.m. Eastern StandardTime) but after the last close of the securities’ primary market, are fair valued using a pricing service and arecategorized as Level 2 in the fair value hierarchy. The pricing service, using methods approved by the Board ofTrustees, considers the correlation of the trading patterns of the foreign security to intraday trading in the U.S.markets, based on indices of domestic securities and other appropriate indicators such as prices of relevant ADR’sand futures contracts. The Funds may also fair value securities in other situations, such as, when a particular foreignmarket is closed but the Fund is open. Short-term debt securities with sixty days or less to maturity are valued at
VANECK VECTORS ETF TRUST
NOTES TO FINANCIAL STATEMENTSDecember 31, 2018
92629_04_Van Eck_Notes_AR.qxp 2/22/19 9:41 PM Page 69
For
per
sona
l use
onl
y
tbethe
Text Box
tbethe
Text Box
tbethe
Text Box
tbethe
Text Box
tbethe
Text Box
tbethe
Text Box

amortized cost, which with accrued interest approximates fair value. Money market fund investments are valued atnet asset value and are considered to be Level 1 in the fair value hierarchy. The Pricing Committee of the Adviserprovides oversight of the Funds’ valuation policies and procedures, which are approved by the Funds’ Board ofTrustees. Among other things, these procedures allow the Funds to utilize independent pricing services, quotationsfrom securities dealers, and other market sources to determine fair value. The Pricing Committee convenes regularlyto review the fair value of financial instruments or other assets. If market quotations for a security or other asset arenot readily available, or if the Adviser believes it does not otherwise reflect the fair value of a security or asset, thesecurity or asset will be fair valued by the Pricing Committee in accordance with the Funds’ valuation policies andprocedures. The Pricing Committee employs various methods for calibrating the valuation approaches utilized todetermine fair value, including a regular review of key inputs and assumptions, periodic comparisons to valuationsprovided by other independent pricing services, transactional back-testing and disposition analysis.
Certain factors such as economic conditions, political events, market trends, the nature of and duration of anyrestrictions on disposition, trading in similar securities of the issuer or comparable issuers and other security specificinformation are used to determine the fair value of these securities. Depending on the relative significance ofvaluation inputs, these securities may be classified either as Level 2 or Level 3 in the fair value hierarchy. The pricewhich the Funds may realize upon sale of an investment may differ materially from the value presented in theSchedules of Investments.
The Funds utilize various methods to measure the fair value of their investments on a recurring basis, which includesa hierarchy that prioritizes inputs to valuation methods used to measure fair value. The fair value hierarchy giveshighest priority to unadjusted quoted prices in active markets for identical assets and liabilities (Level 1measurements) and the lowest priority to unobservable inputs (Level 3 measurements). The inputs or methodologiesused for valuing securities are not necessarily an indication of the risk associated with investing in those securities.The three levels of the fair value hierarchy are described below:
Level 1 — Quoted prices in active markets for identical securities.
Level 2 — Significant observable inputs (including quoted prices for similar securities, interest rates, prepaymentspeeds, credit risk, etc.).
Level 3 — Significant unobservable inputs (including each Fund’s own assumptions in determining the fair value ofinvestments).
A summary of the inputs and the levels used to value the Funds’ investments are located in the Schedules ofInvestments. Additionally, tables that reconcile the valuation of the Funds’ Level 3 investments and that presentadditional information about valuation methodologies and unobservable inputs, if applicable, are located in theSchedules of Investments.
B. Federal Income Taxes—It is each Fund’s policy to comply with the provisions of the Internal Revenue Codeapplicable to regulated investment companies and to distribute all of its taxable income to its shareholders.Therefore, no federal income tax provision is required.
C. Dividends and Distributions to Shareholders—Dividends to shareholders from net investment income anddistributions from net realized capital gains, if any, are declared and paid annually by each Fund. Income dividendsand capital gain distributions are determined in accordance with U.S. income tax regulations, which may differ fromsuch amounts determined in accordance with GAAP.
Effective in the current reporting period, it is no longer required to separately present distributions from netinvestment income and distributions from net realized capital gains. Additionally, undistributed net investmentincome (loss) included in net assets is no longer disclosed separately in the Statement of Changes in Net Assets.The December 31, 2017 sources of distributions and undistributed net investment income (loss) were as follows:
70
VANECK VECTORS ETF TRUST
NOTES TO FINANCIAL STATEMENTS(continued)
92629_04_Van Eck_Notes_AR.qxp 2/22/19 9:41 PM Page 70
For
per
sona
l use
onl
y

71
Distributions to shareholders: __________________________________________________ Undistributed Dividends from net Distributions from net investment investment income net realized capital gains income (loss) __________________ ________________________ ______________Agribusiness ETF $12,243,400 $ — $ (384,443)Coal ETF 3,597,300 — 25,514Global Alternative Energy ETF 1,099,340 — 839,783Gold Miners ETF 61,169,240 — (14,447,924)Junior Gold Miners ETF 1,476,062 — (40,872,904)Natural Resources ETF 2,100,000 — 22,101Oil Refiners ETF 130,544 27,306 (31)Oil Services ETF 39,297,465 — 418,357Rare Earth/Strategic Metals ETF 4,502,217 — 831,909Steel ETF 3,688,050 — 54,784Unconventional Oil & Gas ETF 500,500 — (39,355)Uranium+Nuclear Energy ETF 1,349,717 — 762,065
D. Currency Translation—Assets and liabilities denominated in foreign currencies and commitments under foreigncurrency contracts are translated into U.S. dollars at the closing prices of such currencies each business day asquoted by one or more sources. Purchases and sales of investments are translated at the exchange rates prevailingwhen such investments are acquired or sold. Foreign denominated income and expenses are translated at theexchange rates prevailing when accrued. The portion of realized and unrealized gains and losses on investments thatresult from fluctuations in foreign currency exchange rates is not separately disclosed in the financial statements.Such amounts are included with the net realized and unrealized gains and losses on investment securities in theStatement of Operations. Recognized gains or losses attributable to foreign currency fluctuations on foreign currencydenominated assets, other than investments, and liabilities are recorded as net realized gain (loss) on foreign currencytransactions and foreign denominated assets and liabilities in the Statements of Operations.
E. Restricted Securities—The Funds may invest in securities that are subject to legal or contractual restrictions onresale. These securities generally may be resold in transactions exempt from registration or to the public if thesecurities are registered. Disposal of these securities may involve time-consuming negotiations and expense, andprompt sale at an acceptable price may be difficult. Information regarding restricted securities, if any, is included atthe end of each Fund’s Schedule of Investments.
F. Repurchase Agreements—The Funds may enter into repurchase agreements with financial institutions, deemed tobe creditworthy by the Adviser, to generate income from their excess cash balances and to invest securities lendingcash collateral. A repurchase agreement is an agreement under which a Fund acquires securities from a seller,subject to resale to the seller at an agreed upon price and date. A Fund, through its custodian/securities lendingagent, takes possession of securities collateralizing the repurchase agreement. Pursuant to the terms of therepurchase agreement, such securities must have an aggregate market value greater than or equal to the terms ofthe repurchase price plus accrued interest at all times. If the value of the underlying securities falls below the value ofthe repurchase price plus accrued interest, the Funds will require the seller to deposit additional collateral by the nextbusiness day. If the request for additional collateral is not met, or the seller defaults on its repurchase obligation, theFunds maintain their right to sell the underlying securities at market value and may claim any resulting loss againstthe seller. Repurchase agreements held as of December 31, 2018 are reflected in the Schedules of Investments.
G. Offsetting Assets and Liabilities—In the ordinary course of business, the Funds enter into transactions subjectto enforceable master netting or other similar agreements. Generally, the right of setoff in those agreements allowsthe Funds to set off any exposure to a specific counterparty with any collateral received or delivered to thatcounterparty based on the terms of the agreements. The Funds may pledge or receive cash and/or securities ascollateral for derivative instruments, securities lending and repurchase agreements. For financial reporting purposes,the Funds present securities lending and repurchase agreement assets and liabilities on a gross basis in theStatements of Assets and Liabilities. Collateral held at December 31, 2018 is presented in the Schedules ofInvestments. Refer to related disclosures in Note 2F (Repurchase Agreements) and Note 9 (Securities Lending).
92629_04_Van Eck_Notes_AR.qxp 2/22/19 9:41 PM Page 71
For
per
sona
l use
onl
y
tbethe
Text Box
tbethe
Text Box
H. Components of Capital—Effective with the current reporting period, Net unrealized appreciation (depreciation),Undistributed net investment income (loss), and Accumulated net realized gain (loss) are aggregated and disclosedas Total distributable earnings (loss) in the Statement of Assets and Liabilities.
I. Other—Security transactions are accounted for on trade date. Realized gains and losses are determined based onthe specific identification method. Dividend income is recorded on the ex-dividend date except that certaindividends from foreign securities are recognized upon notification of the ex-dividend date. Interest income, includingamortization of premiums and discounts, is accrued as earned.
In the normal course of business, the Funds enter into contracts that contain a variety of general indemnifications.The Funds’ maximum exposure under these agreements is unknown as this would involve future claims that maybe made against the Funds that have not yet occurred. However, the Adviser believes the risk of loss under thesearrangements to be remote.
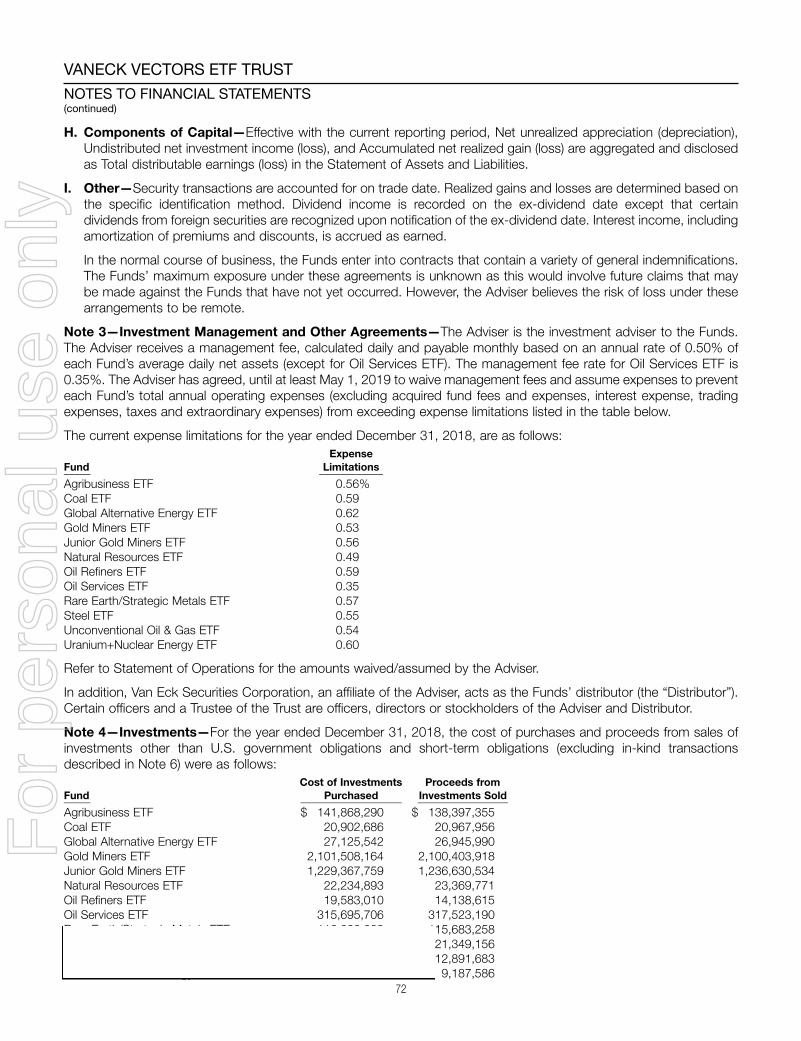
Note 3—Investment Management and Other Agreements—The Adviser is the investment adviser to the Funds.The Adviser receives a management fee, calculated daily and payable monthly based on an annual rate of 0.50% ofeach Fund’s average daily net assets (except for Oil Services ETF). The management fee rate for Oil Services ETF is0.35%. The Adviser has agreed, until at least May 1, 2019 to waive management fees and assume expenses to preventeach Fund’s total annual operating expenses (excluding acquired fund fees and expenses, interest expense, tradingexpenses, taxes and extraordinary expenses) from exceeding expense limitations listed in the table below.
The current expense limitations for the year ended December 31, 2018, are as follows: ExpenseFund Limitations_____ ____________Agribusiness ETF 0.56%Coal ETF 0.59Global Alternative Energy ETF 0.62Gold Miners ETF 0.53Junior Gold Miners ETF 0.56Natural Resources ETF 0.49Oil Refiners ETF 0.59Oil Services ETF 0.35Rare Earth/Strategic Metals ETF 0.57Steel ETF 0.55Unconventional Oil & Gas ETF 0.54Uranium+Nuclear Energy ETF 0.60
Refer to Statement of Operations for the amounts waived/assumed by the Adviser.
In addition, Van Eck Securities Corporation, an affiliate of the Adviser, acts as the Funds’ distributor (the “Distributor”).Certain officers and a Trustee of the Trust are officers, directors or stockholders of the Adviser and Distributor.
Note 4—Investments—For the year ended December 31, 2018, the cost of purchases and proceeds from sales ofinvestments other than U.S. government obligations and short-term obligations (excluding in-kind transactionsdescribed in Note 6) were as follows: Cost of Investments Proceeds from Fund Purchased Investments Sold_____ ___________________ _________________Agribusiness ETF $ 141,868,290 $ 138,397,355Coal ETF 20,902,686 20,967,956Global Alternative Energy ETF 27,125,542 26,945,990Gold Miners ETF 2,101,508,164 2,100,403,918Junior Gold Miners ETF 1,229,367,759 1,236,630,534Natural Resources ETF 22,234,893 23,369,771Oil Refiners ETF 19,583,010 14,138,615Oil Services ETF 315,695,706 317,523,190Rare Earth/Strategic Metals ETF 116,390,008 115,683,258Steel ETF 19,878,011 21,349,156Unconventional Oil & Gas ETF 13,049,039 12,891,683Uranium+Nuclear Energy ETF 8,864,004 9,187,586
72
VANECK VECTORS ETF TRUST
NOTES TO FINANCIAL STATEMENTS(continued)
92629_04_Van Eck_Notes_AR.qxp 2/22/19 9:41 PM Page 72
For
per
sona
l use
onl
y
tbethe
Text Box
tbethe
Text Box
tbethe
Text Box
tbethe
Text Box

73
Note 5—Income Taxes—As of December 31, 2018, for Federal income tax purposes, the identified cost, grossunrealized appreciation, gross unrealized depreciation, and net unrealized appreciation (depreciation) of investmentsowned were as follows: Tax Gross Gross Net Unrealized Cost of Unrealized Unrealized Appreciation Fund Investments Appreciation (Depreciation) (Depreciation)_____ _________________ ________________ ________________ _________________Agribusiness ETF $ 826,754,755 $ 91,286,940 $ (118,845,802) $ (27,558,862)Coal ETF 70,771,913 1,086,916 (15,356,054) (14,269,138)Global Alternative Energy ETF 75,200,521 16,271,571 (8,308,873) 7,962,698 Gold Miners ETF 11,725,627,190 513,058,393 (1,394,619,472) (881,561,079)Junior Gold Miners ETF 4,890,182,852 395,191,136 (835,280,253) (440,089,117)Natural Resources ETF 84,415,690 4,661,811 (9,023,223) (4,361,412)Oil Refiners ETF 58,084,670 704,030 (10,317,114) (9,613,084)Oil Services ETF 2,451,761,477 — (1,358,633,638) (1,358,633,638)Rare Earth/Strategic Materials ETF 165,711,713 2,295,829 (55,746,255) (53,450,426)Steel ETF 88,032,319 37,703 (18,782,900) (18,745,197)Unconventional Oil & Gas ETF 53,187,263 — (21,896,116) (21,896,116)Uranium+Nuclear Energy ETF 26,503,911 2,703,652 (2,206,600) 497,052
At December 31, 2018, the components of distributable earnings (loss) on a tax basis, for each Fund, were as follows: Qualified Late Year Undistributed Accumulated Losses and Other Unrealized Total Ordinary Capital Post-October Temporary Appreciation DistributableFund Income Losses Capital Losses* Differences (Depreciation) Earnings (Loss)__________ __________________________ __________________________________ ______________________________ __________________________ __________________________________ ______________________________Agribusiness ETF $ 544,793 $ (680,583,701) $ — $(410,786) $ (27,563,085) $ (708,012,779)Coal ETF 31,809 (305,569,449) — (19,976) (14,261,043) (319,818,659)Global Alternative Energy ETF — (97,610,001) (21,385) (10,510) 7,963,996 (89,677,900)Gold Miners ETF 4,507,924 (9,755,402,156) — (763,672) (881,562,276) (10,633,220,180)Junior Gold Miners ETF 7,164,958** (4,482,888,695) — (173,566) (440,080,864) (4,915,978,167)Natural Resources ETF 9,684 (39,804,739) — (10,597) (4,362,409) (44,168,061)Oil Refiners ETF 16,643 — (1,349,738) (157) (9,612,491) (10,945,743)Oil Services ETF 103,005 (215,264,490) — (128,314) (1,358,633,638) (1,573,923,437)Rare Earth/Strategic
Materials ETF 1,370,842 (262,281,444) — (12,470) (53,446,714) (314,369,786)Steel ETF 83,510 (131,674,347) — (15,409) (18,745,198) (150,351,444)Unconventional Oil & Gas ETF 61,559 (41,741,869) — (2,989) (21,896,329) (63,579,628)Uranium+Nuclear Energy ETF 490,354 (81,911,751) — (9,940) 497,785 (80,933,552)
* Qualified late year losses and post-October capital losses incurred after October 31, 2018 are deemed to arise on January 1, 2019.** Recent tax regulations issued under certain provisions of the Tax Cuts and Job’s Act (the “Act”) require that certain undistributed earnings of for-
eign corporations be recognized as income by U.S. owners with significant interests in those foreign corporations. Junior Gold Miners ETF ownedrelevant percentages of certain foreign corporations in its portfolio during the periods affected by the Act’s provisions. These provisions resulted inan increase to distributable ordinary income of $10,699,816.
The tax character of dividends paid to shareholders during the years ended December 31, 2018 and December 31,2017 were as follows: 2018 Dividends 2017 Dividends ________________ ___________________________________ Ordinary Ordinary Long-TermFund Income* Income* Capital Gains_____ ______________ ______________ ______________Agribusiness ETF $12,001,800 $12,243,400 $ —Coal ETF 3,625,600 3,597,300 —Global Alternative Energy ETF 499,871 1,099,340 —Gold Miners ETF 51,959,513 61,169,240 —Junior Gold Miners ETF 19,534,693 1,476,062 —Natural Resources ETF 2,159,650 2,100,000 —Oil Refiners ETF 1,170,000 130,544 27,306 Oil Services ETF 21,321,948 39,297,465 —Rare Earth/Strategic Materials ETF 11,500,061 4,502,217 —Steel ETF 3,600,300 3,688,050 —Unconventional Oil & Gas ETF 426,800 500,500 —Uranium+Nuclear Energy ETF 1,000,200 1,349,717 —
* Includes short-term capital gains (if any).
92629_04_Van Eck_Notes_AR.qxp 2/22/19 9:41 PM Page 73
For
per
sona
l use
onl
y
tbethe
Text Box
tbethe
Text Box
tbethe
Text Box
tbethe
Text Box
tbethe
Text Box
tbethe
Text Box

At December 31, 2018, the Funds had capital loss carryforwards available to offset future capital gains, as follow:
Short-Term Long-Term Capital Losses Capital LossesFund with No Expiration with No Expiration Total_____ _________________ ________________ ________________Agribusiness ETF $ (178,974,364) $ (501,609,337) $ (680,583,701)Coal ETF (23,645,586) (281,923,863) (305,569,449)Global Alternative Energy ETF (4,812,502) (92,797,499) (97,610,001)Gold Miners ETF (1,328,717,435) (8,426,684,721) (9,755,402,156)Junior Gold Miners ETF (1,611,478,906) (2,871,409,789) (4,482,888,695)Natural Resources ETF (2,894,228) (36,910,511) (39,804,739)Oil Refiners ETF — — —Oil Services ETF (65,420,955) (149,843,535) (215,264,490)Rare Earth/Strategic Materials ETF (69,312,136) (192,969,308) (262,281,444)Steel ETF (7,198,907) (124,475,440) (131,674,347)Unconventional Oil & Gas ETF (6,808,108) (34,933,761) (41,741,869)Uranium+Nuclear Energy ETF (13,913,162) (67,998,589) (81,911,751)
During the year ended December 31, 2018, $85,630,099, $18,822,843, $34,193,213, $1,784,159, $540,880,$21,020,656, and $41,593,262 of Agribusiness ETF, Coal ETF, Global Alternative Energy ETF, Gold Miners ETF, NaturalResources ETF, Steel ETF, and Uranium+Nuclear Energy ETF’s capital loss carryovers available from prior years expiredunutilized.
During the year ended December 31, 2018, as a result of permanent book to tax differences, primarily due to theexpiration of capital loss carryforwards, deemed distributions attributable to the redemption of shares and the taxtreatment of gains/losses from securities redeemed in-kind, the Funds incurred differences that affected distributableearnings and aggregate paid in capital by the amounts in the table below. Net assets were not affected by thesereclassifications. Increase (Decrease) Increase (Decrease) in Distributable in Aggregate Fund Earnings Paid in Capital_____ ___________________ ___________________Agribusiness ETF $ 6,212,776 $ (6,212,776)Coal ETF 9,499,879 (9,499,879)Global Alternative Energy ETF 33,296,996 (33,296,996)Gold Miners ETF (257,222,502) 257,222,502 Junior Gold Miners ETF (197,215,284) 197,215,284 Natural Resources ETF (5,534,654) 5,534,654 Oil Refiners ETF (3,740,712) 3,740,712 Oil Services ETF (29,625,502) 29,625,502 Rare Earth/Strategic Materials ETF (8,574,172) 8,574,172 Steel ETF 951,366 (951,366)Unconventional Oil & Gas ETF 4,873,418 (4,873,418)Uranium+Nuclear Energy ETF 41,048,086 (41,048,086)
The Funds recognize the tax benefits of uncertain tax positions only where the position is “more-likely-than-not” to besustained assuming examination by applicable tax authorities. Management has analyzed the Funds’ tax positions, andhas concluded that no liability for unrecognized tax benefits should be recorded related to uncertain tax positions takenon return filings for all open tax years. The Funds do not have exposure for additional years that might still be open incertain foreign jurisdictions. Therefore, no provision for income tax is required in the Funds’ financial statements.However, the Funds are subject to foreign taxes on the appreciation in value of certain investments. The Funds providefor such taxes on both realized and unrealized appreciation.
The Funds recognize interest and penalties, if any, related to uncertain tax positions as income tax expense in theStatements of Operations. During the year ended December 31, 2018, the Funds did not incur any interest or penalties.
Note 6—Capital Share Transactions—As of December 31, 2018, there were an unlimited number of capital sharesof beneficial interest authorized by the Trust with no par value. Fund shares are not individually redeemable and areissued and redeemed at their net asset value per share only through certain authorized broker-dealers (“AuthorizedParticipants”) in blocks of shares (“Creation Units”), consisting of 50,000 shares, or multiples thereof.
74
VANECK VECTORS ETF TRUST
NOTES TO FINANCIAL STATEMENTS(continued)
92629_04_Van Eck_Notes_AR.qxp 2/22/19 9:41 PM Page 74
For
per
sona
l use
onl
y
tbethe
Text Box
tbethe
Text Box
tbethe
Text Box
tbethe
Text Box
tbethe
Text Box
tbethe
Text Box
tbethe
Text Box
tbethe
Text Box
tbethe
Text Box

75
The consideration for the purchase or redemption of Creation Units of the Funds generally consists of the in-kindcontribution or distribution of securities constituting the Funds’ underlying index (“Deposit Securities”) plus a balancingcash component to equate the transaction to the net asset value per share of the Fund on the transaction date. Cashmay also be substituted in an amount equivalent to the value of certain Deposit Securities, generally as a result ofmarket circumstances, or when the securities are not available in sufficient quantity for delivery, or are not eligible fortrading by the Authorized Participant. The Funds may issue Creation Units in advance of receipt of Deposit Securitiessubject to various conditions, including a requirement to maintain on deposit at the Custodian for the benefit of theFunds, collateral consisting of cash in the form of U.S. dollars at least equal to 115% of the daily marked to marketvalue of the missing Deposit Securities.
Authorized Participants purchasing and redeeming Creation Units may pay transaction fees directly to The Bank of NewYork Mellon. In addition, the Funds may impose certain variable fees for creations and redemptions with respect totransactions in Creation Units for cash, or on transactions effected outside the clearing process, which are treated asincreases in capital. These variable fees, if any, are reflected in share transactions in the Statements of Changes in NetAssets.
For the year ended December 31, 2018, the Funds had in-kind contributions and redemptions as follows:
Fund In-Kind Contributions In-Kind Redemptions_____ ____________________ ____________________Agribusiness ETF $ 235,872,547 $ 284,588,681Coal ETF 37,855,779 65,912,754Global Alternative Energy ETF 2,945,462 2,716,030Gold Miners ETF 5,960,694,976 2,339,543,369Junior Gold Miners ETF 1,807,379,544 1,518,222,320Natural Resources ETF 19,700,198 33,621,829Oil Refiners ETF 62,885,607 21,050,150Oil Services ETF 3,577,437,014 3,508,243,532Rare Earth/Strategic Metals ETF 67,268,854 44,193,782Steel ETF 69,668,759 139,412,454Unconventional Oil & Gas ETF 19,197,623 34,544,090Uranium+Nuclear Energy ETF — 2,590,682
This table represent the accumulation of each Fund’s daily net in-kind shareholder transactions including rebalancingactivity, while the Statements of Changes in Net Assets reflect shareholder transactions including any cash componentof the transactions.
Note 7—Principal Risks—The investment objective of each Fund is to seek investment results that correspondgenerally to the price and yield performance, before fees and expenses, of its underlying index, as indicated in the nameof each Fund. The Adviser uses a “passive” or index approach to achieve each Fund’s investment objective by investingin a portfolio of securities that generally replicates the Funds’ index. Each of the Funds (except for Natural ResourcesETF) is classified as a non-diversified fund under the 1940 Act. Non-diversified funds generally hold securities of fewerissuers than diversified funds and may be more susceptible to the risks associated with these particular issuers, or toa single economic, political or regulatory occurrence affecting these issuers. The Funds may purchase securities onforeign exchanges. Securities of foreign issuers involve special risks and considerations not typically associated withinvesting in U.S. issuers. These risks include devaluation of currencies, currency controls, less reliable information aboutissuers, different securities transaction clearance and settlement practices, future adverse political and economicdevelopments and local/regional conflicts. These risks are heightened for investments in emerging market countries.Moreover, securities of many foreign issuers and their markets may be less liquid and their prices more volatile thanthose of comparable U.S. issuers.
As a result of events involving Ukraine and the Russian Federation, the United States and the European Union haveimposed sanctions on certain Russian individuals and companies. These sanctions do not currently impact the Funds.Additional economic sanctions may be imposed or other actions may be taken that may adversely affect the value andliquidity of the Russian-related issuers held by the Funds.
At December 31, 2018, the Adviser owned 2,500 shares of Gold Miners ETF.
A more complete description of risks is included in each Fund’s Prospectus and Statement of Additional Information.
92629_04_Van Eck_Notes_AR.qxp 2/22/19 9:41 PM Page 75
For
per
sona
l use
onl
y
tbethe
Text Box
tbethe
Text Box
tbethe
Text Box

Note 8—Trustee Deferred Compensation Plan—The Trust has a Deferred Compensation Plan (the “Plan”) forTrustees under which the Trustees can elect to defer receipt of their trustee fees until retirement, disability or terminationfrom the Board of Trustees. The fees otherwise payable to the participating Trustees are deemed invested in shares ofthe Funds as directed by the Trustees.
The expense for the Plan is included in “Trustees’ fees and expenses” in the Statements of Operations. The liability forthe Plan is shown as “Deferred Trustee fees” in the Statements of Assets and Liabilities.
Note 9—Securities Lending—To generate additional income, each of the Funds may lend its securities pursuant to asecurities lending agreement with The Bank of New York Mellon, the securities lending agent and also the Funds’custodian. Each Fund may lend up to 33% of its investments requiring that the loan be continuously collateralized by cash,U.S. government or U.S. government agency securities, shares of an investment trust or mutual fund, or any combinationof cash and such securities at all times equal to at least 102% (105% for foreign securities) of the market value plusaccrued interest on the securities loaned. Daily market fluctuations could cause the value of loaned securities to be moreor less than the value of the collateral received. When this occurs, the collateral is adjusted and settled on the nextbusiness day. During the term of the loan, the Funds will continue to receive any dividends, interest or amounts equivalentthereto, on the securities loaned while receiving a fee from the borrower and/or earning interest on the investment of thecash collateral. Such fees and interest are shared with the securities lending agent under the terms of the securities lendingagreement. The Funds may pay reasonable finders’, administrative and custodial fees in connection with a loan of itssecurities. Securities lending income is disclosed as such in the Statements of Operations. The collateral for securitiesloaned is recognized in the Schedules of Investments and the Statements of Assets and Liabilities. The cash collateral ismaintained on the Funds’ behalf by the lending agent and is invested in repurchase agreements collateralized byobligations of the U.S. Treasury and/or Government Agencies. Loans are subject to termination at the option of theborrower or the Funds. Upon termination of the loan, the borrower will return to the lender securities identical to thesecurities loaned. The Funds bear the risk of delay in recovery of, or even loss of rights in, the securities loaned shouldthe borrower of the securities fail financially. The value of loaned securities and related collateral at December 31, 2018are presented on a gross basis in the Schedules of Investments and Statements of Assets and Liabilities.
The following table presents the amount of repurchase agreements held as collateral by type of security on loan as ofDecember 31, 2018:
Gross Amount of Recognized Liabilities for Securities Loaned in the Statements of Assets and Liabilities* _________________________Fund Equity Securities_____ _________________________Agribusiness ETF $ 41,197,255Coal ETF 1,461,143Global Alternative Energy ETF 4,216,046Gold Miners ETF 265,557,540Junior Gold Miners ETF 176,292,250Natural Resources ETF 2,762,110Oil Refiners ETF 35,244Oil Services ETF 48,348,561Rare Earth/Strategic Metals ETF 19,837,412Steel ETF 11,479,564Unconventional Oil & Gas ETF 1,213,660Uranium+Nuclear Energy ETF 1,355,842
* Remaining contractual maturity of the agreements: overnight and continuous
Note 10—Bank Line of Credit—The Funds may participate in a $200 million committed credit facility (the “Facility”)to be utilized for temporary financing until the settlement of sales or purchases of portfolio securities, the repurchase orredemption of shares of the Funds at the request of the shareholders and other temporary or emergency purposes.The Funds have agreed to pay commitment fees, pro rata, based on the unused but available balance. Interest ischarged to the Funds at rates based on prevailing market rates in effect at the time of borrowings. During the yearended December 31, 2018, the following Funds borrowed under this Facility:
76
VANECK VECTORS ETF TRUST
NOTES TO FINANCIAL STATEMENTS(continued)
92629_04_Van Eck_Notes_AR.qxp 2/22/19 9:41 PM Page 76
For
per
sona
l use
onl
y
tbethe
Text Box
tbethe
Text Box

77
Outstanding Loan Days Average Daily Average Balance as ofFund Outstanding Loan Balance Interest Rate December 31, 2018_____ ______________ _______________ ______________ ___________________Agribusiness ETF 307 $1,729,586 3.24% $ —Coal ETF 223 284,793 3.24 —Global Alternative Energy ETF 261 194,630 3.34 —Gold Miners ETF 171 4,173,284 3.11 2,157,036Junior Gold Miners ETF 24 2,739,012 3.06 —Natural Resources ETF 354 381,238 3.23 213,026Oil Refiners ETF 179 190,474 3.39 —Oil Services ETF 277 2,571,862 3.18 2,130,257Rare Earth/Strategic Metals ETF 230 1,325,237 3.32 418,101Steel ETF 224 324,387 3.08 —Unconventional Oil & Gas ETF 1 109,140 3.33 —Uranium+Nuclear Energy ETF 10 181,491 3.32 —
Note 11—Custodian Fees—The Funds have entered into an expense offset agreement with the custodian whereinthey receive a credit toward the reduction of custodian fees whenever there are uninvested cash balances. The Fundscould have invested their cash balances elsewhere if they had not agreed to a reduction in fees under the expenseoffset agreement with the custodian. For the year ended December 31, 2018, there were offsets to custodian fees andthese amounts are reflected in custody expense in the Statements of Operations.
Note 12—Recent Accounting Pronouncements—The Funds early adopted certain provisions of AccountingStandards Update No. 2018-13 Disclosure Framework—Changes to the Disclosure Requirements for Fair ValueMeasurement (“ASU 2018-13”) that eliminate and modify certain disclosure requirements for fair value measurements.The adoption of certain provisions of the ASU 2018-13 had no material effect on financial statements and relateddisclosures. Management is currently evaluating the potential impact of additional requirements, not yet adopted, of theASU 2018-13 to financial statements. Public companies will be required to disclose the range and weighted averageused to develop significant unobservable inputs for Level 3 fair value measurements. ASU 2018-13 is effective for fiscalyears beginning after December 15, 2019 and for interim periods within those fiscal years.
On August 17, 2018, the SEC adopted amendments to Regulation S-X. These changes are effective for periods afterNovember 5, 2018. The updates to Registered Investment Companies were mainly focused on simplifying thepresentation of distributable earnings by eliminating the need to present the components of distributable earnings ona book basis in the Statement of Assets & Liabilities. The update also impacted the presentation of undistributed netinvestment income and distribution to shareholders on the Statement of Changes in Net Assets. The amountspresented in the current Statement of Changes in Net Assets represent the aggregated total distributions of netinvestment income and realized capital gains, except for distributions classified as return of capital which are stillpresented separately
Note 13—Subsequent Event Review—The Funds have evaluated subsequent events and transactions for potentialrecognition or disclosure through the date the financial statements were issued.
92629_04_Van Eck_Notes_AR.qxp 2/22/19 9:41 PM Page 77
For
per
sona
l use
onl
y
tbethe
Text Box
tbethe
Text Box
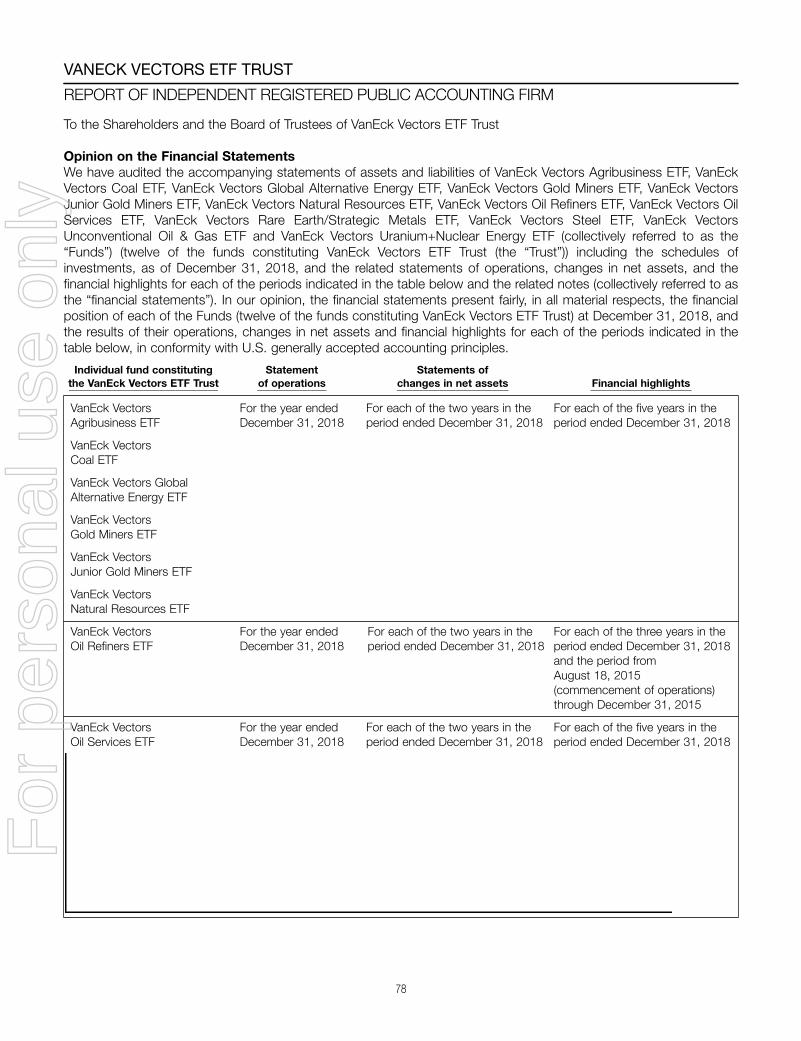
78
VANECK VECTORS ETF TRUST
REPORT OF INDEPENDENT REGISTERED PUBLIC ACCOUNTING FIRM
To the Shareholders and the Board of Trustees of VanEck Vectors ETF Trust
Opinion on the Financial Statements
We have audited the accompanying statements of assets and liabilities of VanEck Vectors Agribusiness ETF, VanEckVectors Coal ETF, VanEck Vectors Global Alternative Energy ETF, VanEck Vectors Gold Miners ETF, VanEck VectorsJunior Gold Miners ETF, VanEck Vectors Natural Resources ETF, VanEck Vectors Oil Refiners ETF, VanEck Vectors OilServices ETF, VanEck Vectors Rare Earth/Strategic Metals ETF, VanEck Vectors Steel ETF, VanEck VectorsUnconventional Oil & Gas ETF and VanEck Vectors Uranium+Nuclear Energy ETF (collectively referred to as the“Funds”) (twelve of the funds constituting VanEck Vectors ETF Trust (the “Trust”)) including the schedules ofinvestments, as of December 31, 2018, and the related statements of operations, changes in net assets, and thefinancial highlights for each of the periods indicated in the table below and the related notes (collectively referred to asthe “financial statements”). In our opinion, the financial statements present fairly, in all material respects, the financialposition of each of the Funds (twelve of the funds constituting VanEck Vectors ETF Trust) at December 31, 2018, andthe results of their operations, changes in net assets and financial highlights for each of the periods indicated in thetable below, in conformity with U.S. generally accepted accounting principles.
Individual fund constituting Statement Statements of the VanEck Vectors ETF Trust of operations changes in net assets Financial highlights ____________________________ _____________ _____________________ ___________________
VanEck Vectors For the year ended For each of the two years in the For each of the five years in the Agribusiness ETF December 31, 2018 period ended December 31, 2018 period ended December 31, 2018
VanEck Vectors Coal ETF
VanEck Vectors Global Alternative Energy ETF
VanEck Vectors Gold Miners ETF
VanEck Vectors Junior Gold Miners ETF
VanEck Vectors Natural Resources ETF
VanEck Vectors For the year ended For each of the two years in the For each of the three years in the Oil Refiners ETF December 31, 2018 period ended December 31, 2018 period ended December 31, 2018 and the period from August 18, 2015 (commencement of operations) through December 31, 2015
VanEck Vectors For the year ended For each of the two years in the For each of the five years in the Oil Services ETF December 31, 2018 period ended December 31, 2018 period ended December 31, 2018
VanEck Vectors Rare Earth/Strategic Metals ETF
VanEck Vectors Steel ETF
VanEck Vectors Unconventional Oil & Gas ETF
VanEck Vectors Uranium+Nuclear Energy ETF
92629_04_Van Eck_Notes_AR.qxp 2/22/19 9:41 PM Page 78
For
per
sona
l use
onl
y
tbethe
Text Box
tbethe
Text Box
tbethe
Text Box
tbethe
Text Box
tbethe
Text Box
tbethe
Text Box
tbethe
Text Box
tbethe
Text Box
tbethe
Text Box
tbethe
Text Box
tbethe
Text Box

79
To the Shareholders and the Board of Trustees of VanEck Vectors ETF Trust
Opinion on the Financial StatementsWe have audited the accompanying statements of assets and liabilities of VanEck Vectors Agribusiness ETF, VanEckVectors Coal ETF, VanEck Vectors Global Alternative Energy ETF, VanEck Vectors Gold Miners ETF, VanEck VectorsJunior Gold Miners ETF, VanEck Vectors Natural Resources ETF, VanEck Vectors Oil Refiners ETF, VanEck Vectors OilServices ETF, VanEck Vectors Rare Earth/Strategic Metals ETF, VanEck Vectors Steel ETF, VanEck VectorsUnconventional Oil & Gas ETF and VanEck Vectors Uranium+Nuclear Energy ETF (collectively referred to as the“Funds”) (twelve of the funds constituting VanEck Vectors ETF Trust (the “Trust”)) including the schedules ofinvestments, as of December 31, 2017, and the related statements of operations, and changes in net assets, and thefinancial highlights for each of the periods indicated in the table below and the related notes (collectively referred to asthe “financial statements”). In our opinion, the financial statements present fairly, in all material respects, the financialposition of each of the funds (twelve of the funds constituting VanEck Vectors ETF Trust) at December 31, 2017, andthe results of their operations, changes in net assets and financial highlights for each of the periods indicated in thetable below, in conformity with U.S. generally accepted accounting principles.
Individual fund constituting Statement Statements of the VanEck Vectors ETF Trust of operations changes in net assets Financial highlights ____________________________ _____________ _____________________ ___________________
VanEck Vectors For the year ended For each of the two years in the For each of the five years in the Agribusiness ETF December 31, 2017 period ended December 31, 2017 period ended December 31, 2017
VanEck Vectors Coal ETF
VanEck Vectors Global Alternative Energy ETF
VanEck Vectors Gold Miners ETF
VanEck Vectors Junior Gold Miners ETF
VanEck Vectors Natural Resources ETF
VanEck Vectors Oil Services ETF
VanEck Vectors For the year ended For each of the two years in the For each of the two years in the Oil Refiners ETF December 31, 2017 period ended December 31, 2017 period ended December 31, 2017 and the period from August 18, 2015 (commencement of operations) through December 31, 2015
VanEck Vectors For the year ended For each of the two years in the For each of the five years in the Rare Earth/Strategic December 31, 2017 period ended December 31, 2017 period ended December 31, 2017 Metals ETF
VanEck Vectors Steel ETF
VanEck Vectors Unconventional Oil & Gas ETF
VanEck Vectors Uranium+Nuclear Energy ETF
Basis for Opinion
These financial statements are the responsibility of the Trust’s management. Our responsibility is to express an opinionon each of the Funds’ financial statements based on our audits. We are a public accounting firm registered with thePublic Company Accounting Oversight Board (United States) (“PCAOB”) and are required to be independent withrespect to the Trust in accordance with the U.S. federal securities laws and the applicable rules and regulations of theSecurities and Exchange Commission and the PCAOB.
We conducted our audits in accordance with the standards of the PCAOB. Those standards require that we plan andperform the audit to obtain reasonable assurance about whether the financial statements are free of materialmisstatement, whether due to error or fraud. The Trust is not required to have, nor were we engaged to perform, anaudit of the Trust’s internal control over financial reporting. As part of our audits, we are required to obtain anunderstanding of internal control over financial reporting, but not for the purpose of expressing an opinion on theeffectiveness of the Trust’s internal control over financial reporting. Accordingly, we express no such opinion.
Our audits included performing procedures to assess the risks of material misstatement of the financial statements,whether due to error or fraud, and performing procedures that respond to those risks. Such procedures includedexamining, on a test basis, evidence regarding the amounts and disclosures in the financial statements. Our proceduresincluded confirmation of securities owned as of December 31, 2018, by correspondence with the custodian andbrokers. Our audits also included evaluating the accounting principles used and significant estimates made bymanagement, as well as evaluating the overall presentation of the financial statements. We believe that our auditsprovide a reasonable basis for our opinion.
We have served as the auditor of one or more of the VanEck investment companies since 1999.
New York, NYFebruary 25, 2019
92629_04_Van Eck_Notes_AR.qxp 2/22/19 9:41 PM Page 79
For
per
sona
l use
onl
y

80
VANECK VECTORS ETF TRUST
TAX INFORMATION(unaudited)
The following information is provided with respect to the distributions paid during the taxable year ended December 31, 2018:
Global Junior Natural Agribusiness Alternative Gold Gold Resources ETF Coal ETF Energy ETF Miners ETF Miners ETF ETF ___________ ___________ ___________ ___________ ___________ ______________Record Date 12/21/2018 12/21/2018 12/21/2018 12/21/2018 12/21/2018 12/21/2018Ex Date 12/20/2018 12/20/2018 12/20/2018 12/20/2018 12/20/2018 12/20/2018Payable Date 12/27/2018 12/27/2018 12/27/2018 12/27/2018 12/27/2018 12/27/2018Total Distribution Paid Per Share $0.964000 $0.824000 $0.337000 $0.105000 $0.136000 $0.919000 Ordinary Income Per Share $0.964000 $0.824000 $0.337000 $0.105000 $0.136000 $0.919000
Ordinary Income:Qualified Dividend Income for Individuals 93.12% 78.94%* 77.61% 99.47%* 100.00%* 94.67%* __________ __________ __________ __________ __________ __________Dividends Qualifying for the Dividends Received Deduction for Corporations 48.07% 3.52%* 47.98% 21.27%* 1.77%* 45.84%* __________ __________ __________ __________ __________ __________ __________ __________ __________ __________ __________ __________
Foreign Source Income — 69.27%* — 74.31%* 84.62%* 56.07%* __________ __________ __________ __________ __________ __________ __________ __________ __________ __________ __________ __________Foreign Taxes Paid Per Share — $0.100836** — $0.012396** $0.010913** $0.069003** __________ __________ __________ __________ __________ __________ __________ __________ __________ __________ __________ __________
Rare Earth/ Uranium+ Oil Refiners Oil Services Strategic Unconventional Nuclear ETF ETF Metals ETF Steel ETF Oil & Gas ETF Energy ETF ___________ ___________ ___________ ___________ ___________ ______________Record Date 12/21/2018 12/21/2018 12/21/2018 12/21/2018 12/21/2018 12/21/2018Ex Date 12/20/2018 12/20/2018 12/20/2018 12/20/2018 12/20/2018 12/20/2018Payable Date 12/27/2018 12/27/2018 12/27/2018 12/27/2018 12/27/2018 12/27/2018Total Distribution Paid Per Share $0.517000 $0.299000 $1.685000 $2.182000 $0.088000 $1.936000 Ordinary Income Per Share $0.517000 $0.299000 $1.685000 $2.182000 $0.088000 $1.936000
Ordinary Income:Qualified Dividend Income for Individuals 96.53%* 43.87% 7.51%* 84.06%* 100.00% 100.00% __________ __________ __________ __________ __________ __________Dividends Qualifying for the Dividends Received Deduction for Corporations 33.78%* 31.55% — 16.38%* 100.00% 77.78% __________ __________ __________ __________ __________ __________ __________ __________ __________ __________ __________ __________
Foreign Source Income 66.62%* — 7.78%* 55.65%* — — __________ __________ __________ __________ __________ __________ __________ __________ __________ __________ __________ __________Foreign Taxes Paid Per Share $0.086068** — $0.025418** 0.011812** — — __________ __________ __________ __________ __________ __________ __________ __________ __________ __________ __________ __________Qualified Short-Term Capital Gains *** $0.133000 — — — — — __________ __________ __________ __________ __________ __________ __________ __________ __________ __________ __________ __________
* Expressed as a percentage of the ordinary income distribution grossed up for foreign taxes.
** The foreign taxes paid represent taxes incurred by the Fund on income received by the Fund from foreign sources. Foreign taxes paid may beincluded in taxable income with an offsetting deduction from gross income or may be taken as a credit for taxes paid to foreign governments.
*** This distribution represents Qualified Short-Term Capital Gains (“QSTG”) which may be exempt from United States withholding tax when dis-tributed to non-U.S. shareholders with proper documentation.
Please consult your tax advisor for proper treatment of this information.
92629_04_Van Eck_Notes_AR.qxp 2/22/19 9:41 PM Page 80
For
per
sona
l use
onl
y
tbethe
Text Box
tbethe
Text Box
tbethe
Text Box

81
Number of Term of Portfolios Position(s) Office2 and in Fund Name, Address1 Held with Length of Principal Occupation(s) Complex3 Other Directorships Held and Year of Birth the Trust Time Served During Past Five Years Overseen By Trustee During Past Five Years
Independent Trustees:
David H. Chow, Chairman Since 2008 Founder and CEO, DanCourt 58 Director, Forward Management LLC 1957*† Trustee Since 2006 Management LLC (financial/ and Audit Committee Chairman, May strategy consulting firm and 2008 to June 2015; Trustee, Berea Registered Investment Adviser), College of Kentucky, May 2009 to March 1999 to present. present and currently Chairman of the
Investment Committee; Member of theGoverning Council of the IndependentDirectors Council, October 2012 topresent; President, July 2013 to June2015, and Board Member of the CFASociety of Stamford, July 2009 topresent; Trustee, MainStay FundComplex,4 January 2016 to presentand currently Chairman of the Riskand Compliance Committee.
R. Alastair Short, Trustee Since 2006 President, Apex Capital Corporation 69 Chairman and Independent Director, 1953*† (personal investment vehicle), EULAV Asset Management, January January 1988 to present. 2011 to present; Independent Director,
Tremont offshore funds, June 2009 topresent; Director, Kenyon Review.
Peter J. Trustee Since 2012 Lead Partner, North America 58 Board Member, Special Olympics, Sidebottom, Banking and Capital Markets New Jersey, November 2011 to 1962*† Strategy, Accenture, May 2017 September 2013; Director, The to present; Partner, PWC/Strategy Charlotte Research Institute, & Financial Services Advisory, December 2000 to 2009; Board February 2015 to March 2017; Member, Social Capital Institute, Founder and Board Member, University of North Carolina Charlotte, AspenWoods Risk Solutions, November 2004 to January 2012; September 2013 to February 2016; Board Member, NJ-CAN, July 2014 Independent consultant, June 2013 to 2016.
to February 2015; Partner, Bain &Company (management consultingfirm), April 2012 to December 2013;Executive Vice President and SeniorOperating Committee Member, TDAmeritrade (on-line brokerage firm),February 2009 to January 2012.
Richard D. Trustee Since 2006 Director, President and CEO, 69 Director, Food and Friends, Inc., 2013Stamberger, SmartBrief, Inc. (media company). to present.1959*†
Interested Trustee:
Jan F. van Eck, Trustee, Trustee Director, President, Chief Executive 58 Director, National Committee on 19635 President (Since 2006); Officer and Owner of the Adviser; US-China Relations. and Chief President and Director, President and Chief Executive Chief Executive Executive Officer, Van Eck Securities Officer Officer (Since Corporation (“VESC”); Director, 2009) President and Chief Executive
Officer, Van Eck Absolute ReturnAdvisers Corporation (“VEARA”).
1 The address for each Trustee is 666 Third Avenue, 9th Floor, New York, New York 10017.2 Each Trustee serves until resignation, death, retirement or removal. Officers are elected yearly by the Trustees.3 The Fund Complex consists of the VanEck Funds, VanEck VIP Trust and the Trust.4 The MainStay Fund Complex consists of MainStay Funds, MainStay Funds Trust, MainStay VP Funds Trust and MainStay MacKay Defined
Term Municipal Opportunities Fund.5 “Interested person” of the Trust within the meaning of the 1940 Act. Mr. van Eck is an officer of the Adviser.* Member of the Audit Committee.† Member of the Nominating and Corporate Governance Committee.
VANECK VECTORS ETF TRUST
BOARD OF TRUSTEES AND OFFICERSDecember 31, 2018 (unaudited)
92629_04_Van Eck_Notes_AR.qxp 2/22/19 9:41 PM Page 81
For
per
sona
l use
onl
y

82
Officer’s Name, Position(s) Term of Office2
Address1 and Held with and Length ofYear of Birth the Trust Time Served Principal Occupation(s) During The Past Five Years
Matthew A. Babinsky, Assistant Vice Since 2016 Assistant Vice President, Assistant General Counsel and Assistant 1983 President and Secretary of the Adviser, VESC and VEARA (since 2016); Associate, Assistant Clifford Chance US LLP (October 2011 to April 2016); Officer of other Secretary investment companies advised by the Adviser.
Russell G. Brennan, Assistant Vice Since 2008 Assistant Vice President of the Adviser (since 2008); Manager (Portfolio 1964 President and Administration) of the Adviser, September 2005 to October 2008; Officer Assistant of other investment companies advised by the Adviser. Treasurer
Charles T. Cameron, Vice President Since 2006 Director of Trading (since 1995) and Portfolio Manager (since 1997) 1960 for the Adviser; Officer of other investment companies advised by the
Adviser.
John J. Crimmins, Vice President, Vice President, Chief Vice President of Portfolio Administration of the Adviser, June 2009 to 1957 Treasurer, Chief Financial Officer and present; Officer of other investment companies advised by the Adviser. Financial Officer Principal Accounting and Principal Officer (Since 2012); Accounting Treasurer (Since 2009)
Eduardo Escario, Vice President Since 2012 Regional Director, Business Development/Sales for Southern Europe and 1975 South America of the Adviser (since July 2008); Regional Director (Spain,
Portugal, South America and Africa) of Dow Jones Indexes and STOXXLtd. (May 2001 to July 2008).
Henry Glynn, Assistant Vice Since February 2018 Head of ETF Capital Markets Europe of Van Eck Switzerland AG (since 1983 President 2017); member of the Capital Markets team at Vanguard Group
(September 2013 to October 2016).
F. Michael Gozzillo, Chief Compliance Since January 2018 Vice President and Chief Compliance Officer of the Adviser and VEARA 1965 Officer (since January 2018); Chief Compliance Officer of VESC (since October
2018); Chief Compliance Officer, City National Rochdale, LLC and CityNational Rochdale Funds (December 2012 to January 2018); Officer ofother investment companies advised by the Adviser.
Nicholas Jackson, Assistant Vice Since February 2018 Vice President, Business Development of VanEck Australia Pty Ltd. 1974 President (since August 2013); Business Development Manager NSW, Leveraged
Equities Limited (October 2006 to July 2013).
Susan C. Lashley, Vice President Since 2006 Vice President of the Adviser and VESC; Officer of other investment 1955 companies advised by the Adviser.
Laura I. Martínez, Vice President Vice President Vice President (since 2016), Associate General Counsel and Assistant 1980 and Assistant (Since 2016) and Secretary (since 2008) and Assistant Vice President (2008 to 2016) of Secretary Assistant Secretary the Adviser, VESC and VEARA; Officer of other investment companies Since 2008) advised by the Adviser.
Matthew McKinnon, Assistant Vice Since February 2018 Head of Business Development of Asia Pacific of VanEck Australia Pty 1970 President Ltd. (since February 2018) and Director, Intermediaries and Institutions
(July 2013 to February 2018) of VanEck Australia Pty Ltd.; GeneralManager, Retail Sales, Equities at Perpetual Limited (December 2006to May 2012).
Arian Neiron, Vice President Since February 2018 Managing Director and Head of Asia Pacific of VanEck Australia Pty Ltd. 1979 (since September 2012).
James Parker, Assistant Since June 2014 Assistant Vice President (since May 2017) and Manager - Portfolio 1969 Treasurer Administration (June 2010 - May 2017) of the Adviser.
Adam Phillips, Vice President Since February 2018 VanEck Vectors ETFs’ Chief Operating Officer of the Adviser (since 2012).1970
Philipp Schlegel, Vice President Since 2016 Managing Director of Van Eck Switzerland AG (since 2010).1974
Jonathan R. Simon, Senior Vice Senior Vice President Senior Vice President (since 2016), General Counsel and Secretary 1974 President, (Since 2016) and (since 2014) and Vice President (2006 to 2016) of the Adviser, VESC and Secretary Secretary and Chief VEARA; Officer of other investment companies advised by the Adviser. and Chief Legal Officer Legal Officer (Since 2014)
1 The address for each Officer is 666 Third Avenue, 9th Floor, New York, New York 10017.2 Officers are elected yearly by the Trustees.
VANECK VECTORS ETF TRUST
BOARD OF TRUSTEES AND OFFICERSDecember 31, 2018 (unaudited) (continued)
92629_04_Van Eck_Notes_AR.qxp 2/22/19 9:41 PM Page 82
For
per
sona
l use
onl
y

[This Page Intentionally Left Blank.]
92629_04_Van Eck_Notes_AR.qxp 2/22/19 9:41 PM Page 83
For
per
sona
l use
onl
y

[This Page Intentionally Left Blank.]
92629_04_Van Eck_Notes_AR.qxp 2/22/19 9:41 PM Page 84
For
per
sona
l use
onl
y

92629_04_Van Eck_Notes_AR.qxp 2/22/19 9:41 PM Page IBC1
For
per
sona
l use
onl
y
This report is intended for the Funds’ shareholders. It may not be distributed to prospective investors unless it is preceded or accompanied
by a VanEck Vectors ETF Trust (the “Trust”) prospectus and summary prospectus, which includes more complete information. Investing
involves substantial risk and high volatility, including possible loss of principal. An investor should consider the investment objective, risks,
charges and expenses of the Fund carefully before investing. To obtain a prospectus and summary prospectus, which contains this and other
information, call 800.826.2333 or visit vaneck.com. Please read the prospectus and summary prospectus carefully before investing.
Additional information about the Trust’s Board of Trustees/Officers and a description of the policies and procedures the Trust uses to
determine how to vote proxies relating to portfolio securities are provided in the Statement of Additional Information. The Statement of
Additional Information and information regarding how the Trust voted proxies relating to portfolio securities during the most recent twelve
month period ending June 30 is available, without charge, by calling 800.826.2333, or by visiting vaneck.com, or on the Securities and
Exchange Commission’s website at http://www.sec.gov.
The Trust files its complete schedule of portfolio holdings with the Securities and Exchange Commission for the first and third quarters of
each fiscal year on Form N-Q. The Trust’s Form N-Qs are available on the Commission’s website at http://www.sec.gov and may be reviewed
and copied at the Commission’s Public Reference Room in Washington, D.C. Information on the operation of the Public Reference Room may
be obtained by calling 202.942.8090. The Funds’ complete schedules of portfolio holdings are also available by calling 800.826.2333
or by visiting vaneck.com.
Investment Adviser: Van Eck Associates CorporationDistributor: Van Eck Securities Corporation 666 Third Avenue, New York, NY 10017 vaneck.comAccount Assistance: 800.826.2333 HAAR
92629_04_Van Eck_Notes_AR.qxp 2/22/19 9:41 PM Page BC1
For
per
sona
l use
onl
y