6 June 2019 10 June 2021 CMC MARKETS PLC Final results …
41
1 6 June 2019 10 June 2021 CMC MARKETS PLC Final results for the year ended 31 March 2021 Net operating income up 63% to £409.8 million Record performance, with continued investment in technology supporting sustainable growth Year ended 31 March £ million (unless otherwise stated) 2021 2020 Change % Net operating income 409.8 252.0 63% Profit before tax 224.0 98.7 127% Earnings per share (pence) 61.5 30.1 104% Ordinary dividend per share (pence) 30.6 15.0 104% CFD gross client income 335.3 240.6 39% CFD net trading revenue 349.2 214.5 63% CFD active clients (numbers) 76,591 57,202 34% CFD revenue per active client (£) 4,560 3,750 22% Stockbroking active clients (numbers) 232,053 181,630 28% Stockbroking net trading revenue 54.8 31.8 72% Notes: - Net operating income represents total revenue net of introducing partners commissions and levies - CFD gross client income represents spreads, financing and commissions charged to clients (client transaction costs) - CFD net trading revenue represents CFD and spread bet gross client income net of rebates, levies and risk management gains or losses - CFD and stockbroking active clients represent those individual clients who have traded with or held a CFD or spread bet position with CMC Markets or traded on the stockbroking platform on at least one occasion during the twelve-month period - CFD revenue per active client represents total trading revenue from CFD and spread bet active clients after deducting rebates and levies Highlights • Net operating income increased to £409.8 million, up £157.8 million (63%). • CFD revenue per active client up 22% to £4,560, driven by improved CFD client income retention. • CFD active clients increased by 19,389 (34%) driven by our ongoing focus on high value, sophisticated, experienced global clients, and increased levels of interest in the financial markets from a new wave of clients. • Stockbroking net trading revenue up 72% to £54.8m driven by higher client numbers (up 28%) and the increasing appeal of the international shares offering. • Continued to offer clients highly resilient and performant platforms, which allowed clients to trade, and new clients to onboard, throughout periods of extremely high trading volumes and market volatility. • Investment continued in proprietary technology platforms to diversify the offering, with new Dynamic Trading and Spot FX offerings launched in May and June 2021 respectively, along with a native mobile app for Stockbroking in March 2021. • Operating expenses increased by 22% to £184.0 million, predominantly due to higher personnel costs as a result of recruitment to support ongoing strategic initiatives, increased marketing costs to capitalise on market opportunities, and trading related variable costs. • Profit before tax up 127% to £224.0 million (2020: £98.7 million). • Regulatory total capital ratio of 20.5% and net available liquidity of £210.6 million
Transcript of 6 June 2019 10 June 2021 CMC MARKETS PLC Final results …

1
6 June 2019
10 June 2021
CMC MARKETS PLC
Final results for the year ended 31 March 2021
Net operating income up 63% to £409.8 million
Record performance, with continued investment in technology supporting sustainable growth
Year ended 31 March £ million (unless otherwise stated)
2021 2020 Change %
Net operating income 409.8 252.0 63%
Profit before tax 224.0 98.7 127%
Earnings per share (pence) 61.5 30.1 104%
Ordinary dividend per share (pence) 30.6 15.0 104%
CFD gross client income 335.3 240.6 39%
CFD net trading revenue 349.2 214.5 63%
CFD active clients (numbers) 76,591 57,202 34%
CFD revenue per active client (£) 4,560 3,750 22%
Stockbroking active clients (numbers) 232,053 181,630 28%
Stockbroking net trading revenue 54.8 31.8 72%
Notes: - Net operating income represents total revenue net of introducing partners commissions and levies - CFD gross client income represents spreads, financing and commissions charged to clients (client transaction costs) - CFD net trading revenue represents CFD and spread bet gross client income net of rebates, levies and risk management gains or losses
- CFD and stockbroking active clients represent those individual clients who have traded with or held a CFD or spread bet position with CMC Markets or traded on the stockbroking platform on at least one occasion during the twelve-month period
- CFD revenue per active client represents total trading revenue from CFD and spread bet active clients after deducting rebates and levies
Highlights
• Net operating income increased to £409.8 million, up £157.8 million (63%).
• CFD revenue per active client up 22% to £4,560, driven by improved CFD client income retention.
• CFD active clients increased by 19,389 (34%) driven by our ongoing focus on high value, sophisticated,
experienced global clients, and increased levels of interest in the financial markets from a new wave of
clients.
• Stockbroking net trading revenue up 72% to £54.8m driven by higher client numbers (up 28%) and the
increasing appeal of the international shares offering.
• Continued to offer clients highly resilient and performant platforms, which allowed clients to trade, and new
clients to onboard, throughout periods of extremely high trading volumes and market volatility.
• Investment continued in proprietary technology platforms to diversify the offering, with new Dynamic Trading
and Spot FX offerings launched in May and June 2021 respectively, along with a native mobile app for
Stockbroking in March 2021.
• Operating expenses increased by 22% to £184.0 million, predominantly due to higher personnel costs as a
result of recruitment to support ongoing strategic initiatives, increased marketing costs to capitalise on market
opportunities, and trading related variable costs.
• Profit before tax up 127% to £224.0 million (2020: £98.7 million).
• Regulatory total capital ratio of 20.5% and net available liquidity of £210.6 million

2
Outlook and dividend
• The Group believes that existing active client levels are likely to be sustainable as the characteristics of
clients onboarded during the year are comparable to our current high value client base, with longevity and
trading activity at similar levels to prior cohorts.
• The monthly active client base has remained strong at the start of 2022 representing ongoing trading
appetite, however client trading activity has moderated from prior elevated levels. Nevertheless, the Group
continues to have confidence in the robust underlying performance of the business and in conjunction with
further progress on its strategic initiatives, looks forward to continuing to generate long term business growth
and value. As a result, the Board remains confident in achieving net operating income in excess of £330
million for 2022.
• The Group’s significant investment in technology development, including the build of a non-leveraged trading
platform for UK clients, is expected to lead to a moderate increase in operating costs in the coming financial
year.
• Final dividend of 21.43 pence per share (total dividend of 30.63 pence per share), in line with the dividend
policy. The Board remains committed to paying a total dividend of 50% of profit after tax, balancing investing
in long-term success and providing shareholders with superior returns.
Lord Cruddas, Chief Executive Officer commented:
“I am delighted with our record performance, which vindicates our strategy of continuing focus on high value clients
and technology investment. I am tremendously proud of the resilience, flexibility and capability displayed by all of my
colleagues at CMC and would like to personally thank them all for the commitment and passion with which they
continue to deliver high levels of service to our clients.
The performance in 2021, building on a strong performance in 2020, is a result of the Group’s unwavering focus on
our strategic initiatives. This has delivered increased diversification of Group revenues and improved CFD client
income retention. Active client numbers have also increased substantially, primarily as a result of COVID-19 related
volatility and heightened levels of interest in the financial markets, but our strategy allows us to attract and retain
these new clients. The growing contribution of B2B revenues is also particularly pleasing and will continue to be an
important part of our strategy going forward.
During the period we continued to recruit new staff and we did not request to participate in any Government financial
support schemes. Our Digital Transformation Programme, led by our new Chief Technology Officer, Brendan Foxen,
was initiated during the year and has started to make fantastic progress with the first ‘lighthouse’ project, our Dynamic
Trading product, having launched in May 2021.
CMC continues to provide clients with market leading trading platforms and client service, even during periods of
extreme volatility and trading activity, holding true to our values. This technological excellence provides the Group
with a solid foundation on which to serve current and future clients, along with the expertise to continue to invest in
new products that will deliver sustainable growth.”
3
Analyst and Investor Presentation
A presentation will be held for equity analysts and investors today at 10.00 a.m. (BST), note questions will only be
taken over the conference call line.
A live audio webcast of the presentation will be available via the following link:
https://webcasts.cmcmarkets.com/results/2021fullyear
Alternatively, you can dial into the presentation by registering via the following link:
https://webcasts.cmcmarkets.com/results/2021fullyear/vip_connect
Annual Report and Financial Statements
A copy of the CMC Markets plc (the “Company”) Annual Report and Financial Statements for the year ending 31
March 2021 (the “2021 Annual Report and Financial Statements”) is available within the Investor Relations section
of the Company website http://www.cmcmarkets.com/group/results/annual-reports
Pursuant to Listing Rule 9.6.1 the Company has submitted the 2021 Annual Report and Financial Statements to the
National Storage Mechanism and will shortly be available for inspection at:
https://data.fca.org.uk/#/nsm/nationalstoragemechanism
In compliance with The Disclosure and Transparency Rules (DTR) 6.3.5, the information in the document below is
extracted from the Company’s 2021 Annual Report and Financial Statements. This material is not a substitute for
reading the 2021 Annual Report and Financial Statements in full and any page numbers and cross references in the
extracted information below refer to page numbers and cross-references in the 2021 Annual Report and Financial
Statements.
Forthcoming announcement dates
Thursday 29 July 2021
Thursday 7 October 2021
Q1 2021 trading update
H1 2021 pre-close trading update
Enquiries
CMC Markets Plc
Euan Marshall, Chief Financial Officer [email protected]
Media enquiries
Camarco
Geoffrey Pelham-Lane / Jennifer Renwick Tel: 020 3757 4994
Notes to Editors
CMC Markets plc ("CMC"), whose shares are listed on the London Stock Exchange under the ticker CMCX
(LEI: 213800VB75KAZBFH5U07), was established in 1989 and is now one of the world's leading online financial
trading businesses. The company serves retail and institutional clients through regulated offices and branches in 12
countries, with a significant presence in the UK, Australia, Germany and Singapore. The Group offers an award-
winning, online and mobile trading platform, enabling clients to trade over 10,000 financial instruments across shares,
indices, foreign currencies, commodities and treasuries through contracts for difference ("CFDs") and financial
spread bets (in the UK and Ireland only). Clients can also place financial binary bets through Countdowns and, in
Australia, access stockbroking services. More information is available at http://www.cmcmarkets.com/group/
Forward Looking Statements
This announcement and Appendix may include statements that are forward looking in nature. Forward looking
statements involve known and unknown risks, assumptions, uncertainties and other factors which may cause the
actual results, performance or achievements of the Group to be materially different from any future results,
performance or achievements expressed or implied by such forward looking statements. Except as required by the
Listing Rules and applicable law, the Group undertakes no obligation to update, revise or change any forward looking
statements to reflect events or developments occurring after the date such statements are published.

4
CHAIRMAN’S STATEMENT
2021 has been an excellent year for the Group, building on the momentum gained in 2020. Our strategic investments
in technology, client service, professional and institutional clients and income diversification through new products
has led to further improvements in the Group’s financial performance in 2021. This provides the Group a strong base
from which we can focus on innovation, and agile and responsive technology development.
The Group’s ongoing focus on medium to long-term value generation continues to be successful. In particular, the
Australian stockbroking and the institutional B2B businesses provided further diversification in addition to ongoing
strong growth in the core retail B2C business. This is complemented by a roadmap of strategic innovation that the
Board is confident will generate further value over the coming years.
The Board’s clear vision of the Group’s purpose, values and strategy, supported by its culture and engagement with
staff, has enabled CMC to build a robust yet agile business. This, combined with an ambitious technology
transformation programme that will enable and facilitate quick and robust development of new products and services,
provides an excellent platform for the Group to grow.
The COVID-19 pandemic continued to increase in effect and disruption throughout the financial year, with our staff
showing incredible resilience and flexibility when faced with travel and work restrictions. The Group did not require
nor seek any assistance from the various government COVID-19 support schemes. No staff were furloughed. Staff
were able to work effectively from home and the Group provided assistance for them to be able to do so.
The Group has continued to perform extremely well during the pandemic, with client services and platform availability
remaining largely unaffected throughout. Global markets have been volatile, and this has benefitted the Group,
driving new client acquisition and higher-than-normal levels of trading. I would like to thank staff for the dedication
and resilience they have shown during this difficult time. It is that commitment to delivery that gives me great
confidence in the future success of the Group.
Results and dividend
The Group’s financial performance has been extremely strong throughout the financial year with net operating income
increasing 63% to £409.8 million. This has resulted in a consecutive year of record profits after tax of £178.1 million.
The Board recommends a final dividend payment of 21.43 pence per share, which results in a total dividend payment
of 50% of profit after tax.
Regulation
The Australian Securities and Investments Commission (“ASIC”) announced new regulatory measures in October
2020 that came into effect on 29 March 2021. We are supportive of the regulatory change, as we have always
operated to the highest standards, and our experience with the European Securities and Markets Authority (“ESMA”)
measures show that they are, in the medium to long term, positive for CMC.
We are glad that the regulatory conditions are now more harmonised globally and that we can continue to focus on
growing our business in an industry where regulatory arbitrage is being reduced.
Board and governance
As set out in more detail on page 48 in the Annual Report and Financial Statements, the Board conducted an internal
governance review during the financial year which resulted in the appointment of the external governance adviser
Independent Audit in January 2021. Their review and implementation of recommendations are still ongoing and I look
forward to reporting fully on it in next year’s report. We will also further develop our governance and control
arrangements over the coming years, to support the Group in achieving our diverse and ambitious strategic
objectives.
It was also decided at the end of the financial year, as part of the governance review, that with effect from the start
of the new financial year, Clare Salmon would relinquish her Chairmanship of the Remuneration Committee and take
on the Chairmanship of the Group Risk Committee and Sarah Ing would relinquish her Chairmanship of the Group
Risk Committee and take on the Chairmanship of the Remuneration Committee. I am very grateful for their sterling
efforts with their respective committees over the last three and a half years.

5
People and stakeholders
Our staff are our greatest asset and their work on delivering against our strategic initiatives has driven an excellent
performance across the business. On behalf of the Board, I would like to thank them all for their considerable
contribution.
The Board remained committed to improving both the engagement and motivation of the workforce throughout the
year, and I am pleased to advise that our pulse survey towards the end of the year has shown further improvements
on the already greatly improved survey last year. More details of what we have been doing are presented in the
People and Sustainability section of the report.
Outlook
Global financial markets continued to be volatile throughout the year as a result of the COVID-19 pandemic. This has
resulted in the Group benefitting from new clients and ongoing higher levels of client trading activity than would
ordinarily be expected. I am confident that, as the markets and people’s lives return to more normalised conditions,
the Group’s focus on its strategic initiatives will continue to deliver revenue diversification and profitable growth for
the Group.
Costs remain well controlled, although the Board recognises that continued investment is key to ensuring that the
Group continues to offer market-leading technology platforms and client service.
We look forward to the year and remain committed to our mission to “make financial markets truly accessible to
investors” and I strongly believe that our recent and future technology and product investment will help us deliver
this.
James Richards Chairman 9 June 2021
6
CEO REPORT
This year saw a significant increase in trading activity globally which provided a supportive backdrop for all of our
businesses. It also presented challenges and I have been delighted with the resilience of our trading platforms as
well as the performance of our risk management system during these periods of extreme volatility and activity,
highlighting the quality of our technology and people.
The outstanding performance in 2021 supports our long-term strategy of investing in our technology. We have
continued to acquire and retain high value, premium clients, who will trade with us for the long term. We also continue
to deliver on our other strategic initiatives, driving revenue diversification through very strong growth in our non-
leveraged business. However, success this year cannot simply be measured by record profits alone; our market risk
management continues to be highly successful, whilst we have continued to make significant investments in and
improvements to our technology capability, all of which are building solid foundations for ongoing success and value
creation in the future.
COVID-19
The current year has been marked by the continuation, and escalation, of the COVID-19 pandemic and my thoughts
remain with all those impacted. Throughout the year our immediate priorities have continued to be protecting the
health, safety and wellbeing of our people and supporting our clients. Our CFD trading platform has remained resilient
during multiple periods of extremely high levels of trading activity, achieving 99.95% uptime while trade volumes1
increased 50% year on year. This is further evidence that our continuous focus on, and investment in, technology
and infrastructure provide platform stability and scalability. Once again, I am impressed by the dedication our teams
have shown in preventing client disruption while working in unprecedented circumstances and would therefore like
to thank all of my colleagues for their continued hard work during these tough times.
1 Average trades per day on CFD platform 2021 vs 2020
Investment in technology
The Group has continued to invest in technology throughout the year and has significantly scaled up the breadth and
capability of the technology function. We hired a new Chief Technology Officer (“CTO”), Brendan Foxen, who has
set up an ambitious Digital Transformation Programme that will deliver a wide range of benefits, including faster time
to market for new products and deeper client engagement. Our commitment to this programme is displayed by the
Group hiring 60 additional technology staff throughout the year.
We have also delivered a number of new products during the year, including FX Spot and Dynamic Trading, released
native apps for our stockbroking clients and co-located our data centres to reduce latency for both CMC and our
clients.
I am excited by the pipeline of technological innovations and new products that we have planned for the years ahead,
more details of which I hope to share in due course.
Growth in non-leveraged business
The primary area of non-leveraged business is our stockbroking operation in Australia, which is free of market risk
management, as trade execution occurs directly with the exchange and physical settlement is funded from the client’s
linked bank account. Additionally, our white label stockbroking business (with various banks and brokers) poses less
risk and cost to the Group, given client acquisition is the responsibility of the partner. I strongly believe that the ANZ
Bank white label agreement is our first true technology deal, as it is a purely technological transaction without risk
management and onboarding of clients.
Non-leveraged trading is also the fastest growing client acquisition area of the business; we opened over two times
more non-leveraged client accounts in Australia than leveraged business across the whole Group during the year.
As the Group continues to secure these transactions through technology, we continue to diversify the business
through increasing non-leveraged revenue streams. In addition, within the next year, we will also be developing
additional non-leveraged platforms targeting the investment community. We will provide detail about this later in the
year as we continue the journey through the build process, but we are effectively leveraging off our existing platform
technology in order to diversify into other markets and target more non-leveraged business. We are able to diversify
this way because of the technology we have built and we are constantly looking at ways to enhance the platform
technology to launch new products and services.

7
Market risk management
Market risk management within CMC Markets is automated and managed by our Trade and Risk Data Intelligence
System (“TARDIS”). We employ more quantitative analysts and data scientists than we do dealers.
TARDIS was developed in-house as a complete front-to-end architecture and our ongoing investment in technology,
combined with our significant trade flows, means we are able to maintain liquidity and platform stability to meet the
needs of our clients, especially during volatile market conditions.
TARDIS also allows us to manage institutional trade flows as a liquidity provider and to fulfil the role of a non-bank
liquidity provider, offering counterparties access to more than 10,000 different assets, with price construction and
market depth supported from our natural internal flow. Continued focus and evolution of our quantitative and data
science analytics such as mark out curves, internalisation horizons and static position modelling have optimised the
balance of systematic internalisation with automated externalisation per product to maximise client income retention.
Overall, our robust market risk management framework has helped us achieve consistently high client income
retention in all four half year periods since we launched TARDIS in late 2019 – never lower than 82% for a half year
period, with an average of 96% over the last two years.
The Group saw client income retention of 104% during the year. This arose as CMC’s exposure to our clients’
significant positive equity market returns was matched with largely complete hedging of the static risk during the
period. The profitable net hedge position resulted from the internalisation of a proportion of certain highly liquid
instruments during periods of high volatility. Our clients maintain long and short positions across various assets and
durations in order to generate net returns, while CMC makes decisions on hedging and internalisation based on
individual asset dynamics and their impact on the overall exposure of the firm. As such, certain market conditions
can result in CMC’s hedging activity producing positive hedge profits at the same time as positive client market
returns.
Financial performance
Revenue growth has been exceptional across our leveraged retail (“B2C”) CFD and non-leveraged stockbroking
businesses, with the leveraged institutional (“B2B”) business also continuing to grow. The CFD business has seen
exceptional client income (client transaction fees) growth as our ongoing focus on high value, sophisticated,
experienced clients, and increased levels of interest in the financial markets from a new wave of clients, have resulted
in a step change in client numbers (up 34% to 76,591).
Our new client cohort exhibits similar characteristics to our pre-COVID-19 cohorts and early signs are that retention
rates are similar to historical averages, giving us confidence that this new cohort should remain with the Group for
the medium term and giving us a permanent and sustainable upwards movement in the active client base.
Client income retention also remained strong, with our data-driven approach to risk management (TARDIS), which I
described earlier, continuing to deliver excellent results. The stockbroking business continued to grow and
contributed a material level of revenue and profitability for the Group. Overall, Group net operating income increased
63% to £409.8 million.
The Group’s cost base excluding variable remuneration increased by 22% to £167.8 million during the year, mainly
as a result of the significant investments in people and technology, increased marketing spend to attract new clients
and higher variable costs related to increased client trading activity.
Variable remuneration increased by £2.2 million to £16.2 million as a result of higher headcount and ongoing strong
financial performance. Overall, total costs increased by 21% to £185.8 million.
As a result of the strong revenue performance and operating leverage in the business, profit before tax at £224.0
million was £125.3 million higher than the previous year and results in a proposed final dividend per share of 21.43
pence, being 50% of profit after tax in line with our dividend policy.
As well as the continued significant improvement in profitability, the underlying fundamentals of the business remain
strong. CFD active clients for the year were up 34% to 76,591, and we continue to target and retain higher value,
sophisticated clients in order to grow client income. Levels of client money, which is an indicator of future trading
potential, increased significantly, up 62% on the prior year. The benefits of the ANZ Bank white label stockbroking
partnership and the further expansion of the international shares offering in our stockbroking business have also
8
contributed significantly towards our growth, with stockbroking active clients increasing 28% to 232,053. Of this
increase, stockbroking B2C clients increased 47% to 46,375, with B2B increasing by 24% to 185,678.
The balance sheet continues to reflect the strong financial position of the Group. At the end of the year, the Group’s
net available liquidity was £210.6 million and the regulatory capital ratio was 20.5%.
Strategic update
It has always been my focus to invest in technology which sets us apart from other providers and enables us to scale,
adapt and develop our offerings. To date we have built an industry-leading platform which enables us to continue to
win business in a highly competitive sector.
In 2019, we refined our strategic priorities, to focus on our established markets, our institutional offering, and how we
optimise our client journey. The implementation of this strategy has delivered significant value throughout the financial
year. More details are provided below.
Established markets
Our established markets consist of the UK, Germany and Australia, geographies where we still see good
opportunities for growth and appetite for our offering.
Our UK region displayed strong growth in the year, with record increase in active clients of 45% to 20,077, with the
launch of Dynamic Trading in May 2021 and Spot FX in June 2021 responding directly to client requests and
positioning the Group for further growth.
In Germany, the Group saw a record increase in active clients, resulting in strong growth.
Our Australian business continues to perform very well with CFD net trading revenue during the year rising to £100.3
million, which now accounts for 29% of CFD net trading revenue for the Group. The Group is well prepared for, and
welcoming of, the ASIC measures and we do not believe they will have a material impact on revenue in the medium
term. The stockbroking business also continues to display strong growth.
Optimising our client journey
Throughout the year we have continued to make improvements to our client journey with a focus on user experience
and client conversion rates, and the acquisition of higher value clients. The client onboarding process has become
more efficient, even during large spikes in client applications driven by market volatility.
We remain focused on providing both our retail and institutional clients with best-in-class platforms that deliver an
intuitive and personalised experience, enabling them to efficiently achieve their trading goals.
Institutional offering
The institutional business has continued to grow in the past 12 months, with significant milestones in our strategic
road map being achieved. We launched our Spot FX product in June 2021, completed the co-location of our pricing
and risk engines to reduce latency for our clients, and became a signatory to the FX Global Code. Our stockbroking
business now delivers share trading platforms for two tier one banks and three of the largest tier two banks in the
Australian domestic market, which is a testament to our long-term focus on technology, product and service. In 2021,
we have retained our ranking as the second largest retail stockbroker in Australia.
This year has also seen the business pivot to an institutional first approach, where we build for our most sophisticated
audience and therefore also bolster our retail client proposition. Throughout the period we have invested in our
technology and personnel. This investment, combined with our ambitious product road map, positions us well to
further attract business from institutional clients including banks and hedge funds as we progress into 2022.
Regulation
The Group is, and has always been, supportive of regulatory enhancement which make sure all providers operate to
the highest standards, ensuring fair client outcomes.
The Australian regulator, ASIC, announced new regulatory measures in October 2020 that came into effect from 29
March 2021. These measures are aimed at, and affect, CFDs for retail clients onboarded into our Australian entity,
which represents 29% of 2021 CFD net trading revenue. Before the effective date, the Group was already compliant
with the majority of announced measures, and the client margin requirements are in line with those implemented by
ESMA.
9
We are supportive of these changes and, given the Group’s focus on acquiring and retaining high quality, experienced
clients, a large proportion of Australian CFD net revenue is generated by clients eligible to qualify as wholesale
clients, meaning they are not impacted by the changes. With the lifting of regulatory uncertainty in our core markets,
we can continue to focus on driving the business forward in an industry with more closely harmonised regulations.
In addition, in the UK, the FCA imposed a ban on the sale of instruments, such as CFDs, with prices linked to
cryptocurrencies to retail clients from 6 January 2021. This contributed less than 1% of the Group’s CFD net trading
revenue in the financial year. We continue to offer the products to clients outside of the UK and to our professional
and institutional clients in the UK.
Brexit
On 31 December 2020 the UK’s transitional agreement with the European Union (“EU”) ended. This resulted in the
UK no longer having specific MiFID passporting rights to offer financial services to EEA clients. Given the uncertainty
regarding the inclusion of financial services in any future trade agreement between the UK and EU, in advance of
the end of the transitional agreement the Group transferred all European branches to our German subsidiary and all
EEA resident clients started to be onboarded into this subsidiary.
The Group’s headquarters will remain in the UK.
People
Our people are crucial to our success and throughout the year I have been consistently impressed by their hard work
and commitment. Despite the challenges of remote working, our people have shown passion and dedication to the
success of the Group, which is demonstrated in this year’s financial results.
The Board is keen to do more to improve staff engagement. As a result of feedback from Group-wide engagement
surveys conducted twice yearly since 2019, a number of initiatives have been implemented to enhance employee
engagement such as improvements to our flexible working, annual leave and charitable giving polices and an
increased emphasis on learning and career development. I am happy this work has resulted in an improvement to a
number of measures of employee engagement.
On behalf of the Board, I would like to thank all of my colleagues for their continued dedication and hard work and
look forward to improving engagement across the Group on an ongoing basis.
Clients
Our clients continue to be at the heart of everything we do, and their input is intrinsic to improving our business
processes across product development, marketing and client services as we tailor new developments and target
improvements. In Q1 2022, following engagement with our clients, we implemented FX spot and Dynamic Trading.
We have invested in user experience research capacity to facilitate this and ensure our customer needs are
championed across the business. We believe this will enable us to build and distribute better products that delight
our clients and positively drive client retention and lifetime value.
Dividend
The Board recommends a final dividend payment of £62.3 million. This is 21.43 pence per share (2020: 12.18 pence),
resulting in a total dividend payment for the year of 30.63 pence per share (2020: 15.03 pence). This represents a
payment of 50% of profit after tax, in line with policy. The Board believes that this is an appropriate payment for the
year after considering both the Group’s capital and liquidity position and forecast requirements in the year ahead to
support business growth.
House of Lords
I was greatly honoured and proud to be elevated to the House of Lords by Prime Minister Boris Johnson earlier in
the year. I am a Conservative Peer and I was introduced to the House of Lords on 2 February 2021 as Lord Cruddas
of Shoreditch: I was born and bred in the area, so it was an easy choice to select this title.
I have made it clear to my colleagues and investors that my role in the House of Lords will not affect my work at CMC
Markets. My focus will remain as full time CEO and will be for the foreseeable future and many years to come.

10
Outlook
Our strong performance in 2021, following similarly impressive growth in 2020, gives the Group the opportunity to
further invest significantly in products and services that will continue to bring diversified growth. This investment
enhances our best-in-class technology that not only makes us operationally resilient, but importantly also provides
our clients with a high-quality service. We are well placed as an attractive choice for a wide array of clients and
partners around the world, who benefit from our in-house capability, track record of stability and delivery, and strong
team expertise throughout the business.
It is especially pleasing that we are now winning more non-leveraged business through technology and partnership
agreements, demonstrating our ability to move successfully into adjacent markets.
I am confident that the Group’s underlying growth in recent years will ensure our growth trajectory continues,
especially as we focus on more technology development and transactions and take on more non-leveraged business.
We have some exciting plans that will further expand this business, which I hope to share later in the year as we get
near to launch.
I strongly believe that, through continuing to invest in our technology, focusing on our strategic initiatives, capitalising
on market opportunities as they arise and building engagement across all of our stakeholder groups, the Group will
be in the best possible position for success in the next financial year and beyond.
Lord Cruddas Chief Executive Officer 9 June 2021

11
FINANCIAL REVIEW
Summary income statement
£m 2021 2020 Change Change %
Net operating income 409.8 252.0 157.8 63%
Operating expenses (184.0) (151.3) (32.7) (22%)
Operating profit 225.8 100.7 125.1 124%
Finance costs (1.8) (2.0) 0.2 14%
Profit before taxation 224.0 98.7 125.3 127%
PBT margin1 54.7% 39.2% 15.5% —
Profit after tax 178.1 86.9 91.2 105%
Pence 2021 2020 Change Change %
Basic EPS 61.5 30.1 31.4 104%
Ordinary dividend per share2 30.6 15.0 15.6 104%
1Statutory profit before tax as a percentage of net operating income. 2Ordinary dividends paid/proposed relating to the financial year
Summary
Net operating income for the year increased by £157.8 million (63%) to £409.8 million, primarily driven by higher
gross client income in our CFD business as a result of significantly increased active clients in addition to higher client
income retention resulting from the strength of the risk management strategy. The stockbroking business also went
from strength to strength, with elevated market volatility throughout the year acting as a call to action for new clients
to onboard onto the platform and for existing clients to increase their trading activity.
CFD active client numbers increased by 19,389 (34%) to 76,591. This had a number of drivers, including high market
volatility throughout much of the year and higher marketing spend, which encouraged dormant clients to reactivate
and new clients to onboard onto our platform. Early indications are that clients onboarded during the year have
characteristics comparable to our current high value client base, with longevity and trading activity at similar levels to
prior cohorts.
The increase in CFD net trading revenue has resulted in revenue per active client (“RPC”) increasing by £810 (22%)
to £4,560.
Gross CFD client income increased by £94.7 million (39%) to £335.3 million, with increased client numbers and
heightened trading as a result of market volatility being the main drivers.
Total operating expenses have increased by £32.7 million (22%) to £184.0 million, with the main drivers being higher
personnel costs largely as a result of the recruitment of personnel to support ongoing strategic initiatives, increased
marketing costs to capitalise on market opportunities, and trading related variable costs such as bank charges and
market data costs.
Profit before tax increased to £224.0 million from £98.7 million and PBT margin increased to 54.7% from 39.2%,
reflecting the high level of operational gearing in the business.

12
Net operating income overview
£m 2021 2020 Change %
CFD and spread bet net trading revenue 349.2 214.5 63%
Stockbroking net trading revenue (excl. interest income) 54.8 31.8 72%
Net trading revenue1 404.0 246.3 64%
Interest income 0.7 3.3 (78%)
Other operating income 5.1 2.4 113%
Net operating income 409.8 252.0 63%
1 CFD and spread bet gross client income net of rebates, levies and risk management gains or losses and stockbroking revenue net of rebates.
B2B and B2C net trading revenue
£m 2021 2020 Change %
B2C B2B Total B2C B2B Total B2C B2B Total
CFD and spread bet net trading revenue 307.3 41.9 349.2 186.8 27.7 214.5 65% 51% 63%
Stockbroking net trading revenue 10.4 44.4 54.8 5.8 26.0 31.8 80% 70% 72%
Net trading revenue 317.7 86.3 404.0 192.6 53.7 246.3 65% 61% 64%
The improved performance of the Group was reflected within both our B2C and B2B businesses, with year-on-year
increases in net trading revenue of 65% and 61% respectively. The CFD and stockbroking businesses both saw
strong growth within B2C and B2B demonstrating the performance of all areas in the business.
Regional performance overview: CFD and spread bet
2021 2020 Change %
Net trading revenue
£m
Gross client
income £m1
Active Clients
RPC £
Net trading revenue
£m
Gross client
income £m1
Active Clients
RPC £
Net trading revenue
Gross client
income1
Active Clients
RPCRPC
UK 122.0 123.2 20,077 6,078 67.1 86.4 13,883 4,835 82% 42% 45% 26%
Europe 64.8 53.7 20,280 3,197 43.5 43.6 18,347 2,370 49% 23% 11% 35%
UK & Europe 186.8 176.9 40,357 4,630 110.6 130.0 32,230 3,432 69% 36% 25% 35%
APAC & Canada 162.4 158.4 36,234 4,481 103.9 110.6 24,972 4,160 56% 43% 45% 8%
Total 349.2 335.3 76,591 4,560 214.5 240.6 57,202 3,750 63% 39% 34% 22%
1Spreads, financing and commissions on CFD client trades.
UK and Europe
Gross client income grew by £46.9 million (36%) and RPC increased by £1,198 (35%), with active clients increasing
by 25%.
UK
The number of active clients in the region increased by 45% to 20,077 (2020: 13,883), in turn driving gross client
income growth of 42% against the prior year to £123.2 million (2020: £86.4 million). The increases were
predominantly driven by the retail business.

13
Europe
Europe comprises offices in Austria, Germany, Norway, Poland and Spain. Gross client income increased 23% to
£53.7 million (2020: £43.6 million) driven by strong growth in the Germany and Poland offices. RPC also grew
significantly by 35% to £3,197 (2020: £2,370). The number of active clients increased 11% to 20,280 (2020: 18,347).
APAC & Canada
Our APAC & Canada business services clients from our Sydney, Auckland, Singapore, Toronto and Shanghai offices
along with other regions where we have no physical presence. Gross client income increased by 43% to £158.4
million (2020: £110.6 million), primarily driven by increased active clients and heightened market activity throughout
the year. Active clients were up 45% to 36,234 (2020: 24,972), with strong increases across the region.
Stockbroking
The non-leveraged Australian stockbroking business continued to grow significantly during the year, with revenue
increasing 72% to £54.8 million (2020: £31.8 million) driven by a combination of higher client trading activity driven
by market volatility and increased FX revenue from international shares trading following the introduction of our zero
brokerage offering in September 2020. Active clients continued to increase, up 28% to 232,053 (2020: 181,630) with
AUM also increasing substantially to AUD$69.4 billion (2020: AUD$46.7 billion).
Interest income
Global interest rates have remained at historically low levels, with interest income decreasing accordingly, down 78%
to £0.7 million (2020: £3.3 million). The majority of the Group’s interest income is earned through our segregated
client deposits in our UK, Australia, New Zealand and stockbroking subsidiaries.
Expenses
Total costs increased by £32.5 million (21%) to £185.8 million.
£m 2021 2020202
02020 Change %
Net staff costs – fixed (excluding variable remuneration) 62.5 53.8 (16%)
IT costs 26.2 21.5 (22%)
Marketing costs 24.6 14.9 (65%)
Sales-related costs 5.8 3.2 (83%)
Premises costs 3.8 3.1 (22%)
Legal and professional fees 7.2 5.2 (40%)
Regulatory fees 5.0 5.2 3%
Depreciation and amortisation 11.2 11.0 (3%)
Irrecoverable sales tax 6.5 5.1 (29%)
Other 15.0 14.3 (4%)
Operating expenses excluding variable remuneration 167.8 137.3 (22%)
Variable remuneration 16.2 14.0 (16%)
Operating expenses including variable remuneration 184.0 151.3 (22%)
Interest 1.8 2.0 (14%)
Total costs 185.8 153.3 (21%)

14
Net staff costs
Net staff costs including variable remuneration increased £10.9 million (16%) to £78.7 million following significant
investment across the business, particularly within technology, marketing and product functions, to support the
delivery of strategic projects. Variable remuneration increased due to higher headcount within 2021 resulting in higher
performance-related pay.
£m 2021 2020 Change %
Wages and salaries 64.4 51.7 (24%)
Performance related pay 13.7 11.7 (17%)
Share-based payments 2.5 2.3 (7%)
Total employee costs 80.6 65.7 (23%)
Contract staff costs 3.2 3.1 5%
Net capitalisation (5.1) (1.0) 428%
Net staff costs 78.7 67.8 (16%)
Marketing costs
Marketing costs have increased by £9.7 million (65%) to £24.6 million as the Group capitalised on market
opportunities as they arose throughout the year, whilst ensuring that spend was targeted through the most efficient
channels to acquire high value clients. The success of this targeted approach is borne out through the increases in
both active clients and revenue per active client.
IT costs
IT costs increased £4.7 million (22%) to £26.2 million, with increases due to higher market data costs throughout the
year as a result of increased client activity and increased software maintenance.
Other expenses
Sales-related costs increased by £2.6 million (83%) as a result of provisions and payments made during the year for
client compensation in addition to stockbroking variable sales related costs.
Legal and professional fees increased £2.0 million (40%) primarily driven by external audit fee increases and external
consultants engaged as part of the Group’s preparations for Brexit.
Premises costs increased £0.7 million (22%) due to the rental of additional office space within London to facilitate
the growth in headcount and to maintain social distancing requirements, during the year.
Other costs increased due to a number of factors, with the main drivers being volume driven increases in both bank
charges as a result of higher client payment volumes, and bad debt charges.
Taxation
The effective tax rate for the year was 20% (2020: 12%). The increase mainly resulted from the recognition of
additional Australian tax credits in 2020 which did not recur in 2021. It is anticipated that the Group’s effective tax
rate is likely to remain at a similar level in 2022.
Profit after tax for the year
The increase in profit after tax for the year of £91.2 million (105%) was due to higher net operating income and the
operational gearing in the business.
Dividend
Dividends of £62.1 million were paid during the year (2020: £10.2 million), with £35.4 million relating to a final dividend
for the prior year paid in September 2020, and a £26.7 million interim dividend paid in December 2020 relating to
current year performance. The Group has proposed a final ordinary dividend of 21.43 pence per share (2020: 12.18
pence per share).

15
Non-Statutory Summary Group Balance Sheet
£m -Statutory Summary Group Balance Sheet 2021 2020
Intangible assets 10.3 4.6
Property, plant and equipment 14.8 14.6
Net lease liability (4.0) (5.7)
Fixed Assets 21.1 13.5
Cash and cash equivalents 118.9 84.3
Amount due from brokers 253.9 134.3
Financial investments 28.1 25.4
Liquid Assets 400.9 244.0
Net derivative financial instruments 0.2 3.0
Title transfer funds (30.7) (8.7)
Own Funds 370.4 238.3
Working Capital 2.6 16.0
Tax receivable 1.7 0.8
Deferred tax net asset 4.7 14.3
Net Assets 400.5 282.9
The table above is a non-statutory view of the Group balance sheet and line names don't necessarily have their statutory
meanings.
Fixed assets
The Group dedicated a significant amount of internal resource to the development of new products and functionality
in 2021, with Dynamic Trading, FX Spot and the native iOS stockbroking mobile application being the primary focus.
This, in addition to software purchases, resulted in an increase of £8.0 million in intangible assets, offset by of
amortisation during the year.
Net lease liability decreased by £1.7m million during the year due to the net length of lease contracts being lower at
the end of 2021 than prior year.
Own funds
Cash and cash equivalents have increased significantly during the year as a result of the Group’s operating
performance.
Amounts due from brokers relate to cash held at brokers either for initial margin or balances in excess of this for cash
management purposes. The elevated client trading exposures throughout the year, particularly in equities, resulted
in increases in holdings at brokers for hedging purposes.
Financial investments mainly relate to eligible assets held by the Group as a liquid asset buffer (“LAB”), per Financial
Conduct Authority (“FCA”) requirements.
Title transfer funds increased by £22.0 million, reflecting the high levels of account funding by a small population of
mainly institutional clients.

16
Working capital
The decrease year on year is primarily as a result of the increased market volatility in Q4 of the prior year, which
significantly increased the value of the stockbroking receivables yet to settle at the prior year end.
Tax receivable
Taxes receivable increased by £0.9 million as a result of overpayments of corporation and service taxes in a number
of Group entities.
Deferred tax net asset
Deferred tax assets decreased during the year due to utilisation of Australian tax credits.
Regulatory capital resources
For the year under review, the Group was supervised on a consolidated basis by the FCA. The Group maintained a
capital surplus over the regulatory requirement at all times.
The Group’s total capital resources increased to £327.9 million (2020: £236.7 million) with retained earnings for the
year being partly offset by the interim and proposed final dividend distribution.
At 31 March 2021 the Group had a total capital ratio of 20.5% (2020: 23.3%). The decrease in the total capital ratio
resulted from a higher total risk exposure; this was driven mainly by an increase in market risk capital requirement,
partially offset by an increase in total capital resources. The following table summarises the Group’s capital adequacy
position at the year end. The Group’s approach to capital management is described in note 30 to the Financial
Statements.
2021 2020
Total capital resources (£m)1 327.9 236.7
Total risk exposure (£m)2 1,595.5 1,017.9
Total capital ratio (%) 20.5% 23.3%
1Total audited capital resources as at the end of the financial period, less proposed dividends, intangibles and deferred tax assets. 2Calculated in accordance with article 92(3) of the CRR.
On 16 April 2019, the European Parliament adopted a new legislative package: the Investment Firm Regulation and
Directive (“IFR/IFD”), that will become directly applicable in Member States on 26 June 2021. This framework will
alter the licensing basis, capital and remuneration requirements and governance and transparency provisions for a
wide range of non-bank financial institutions. The UK played an instrumental role in the introduction of IFR/IFD at EU
level, negotiated them as a Member State, and is supportive of their respective intended outcomes. In light of the
UK’s departure from the EU, HM Treasury has introduced the Investment Firm Prudential regime (“IFPR”) that has
been designed to achieve similar intended outcomes as those in IFR / IFD albeit tailored where necessary to reflect
the structure of the UK market and how it operates. The IFPR is expected to enter into force on 1 January 2022 and
will be regulated by the FCA. It is not envisaged that these changes will lead to higher capital requirements for the
Group.
The Group and its UK subsidiaries will fall into scope of the IFPR, with the Group’s German subsidiary, CMC Markets
Germany GmbH, subject to the provisions of IFR/IFD. This will ultimately end the Group’s requirement to
comply with the existing and incoming CRD/CRR rules in favour of the new regimes.
Liquidity
The Group has access to the following sources of liquidity that make up total available liquidity:
• Own funds: The primary source of liquidity for the Group. It represents the funds that the business has
generated historically, including any unrealised gains/losses on open hedging positions. All cash held on
behalf of segregated clients is excluded. Own funds consist mainly of cash and cash equivalents. They also
include investments in UK government securities, of which the majority are held to meet the Group’s LAB as
set by the FCA. These UK government securities are FCA Prudential sourcebook for Banks, Building
Societies and Investment Firms (“BIPRU”) 12.7 eligible securities and are available to meet liabilities which
fall due in periods of stress.

17
• Title transfer funds (“TTFs”): This represents funds received from professional clients and eligible
counterparties (as defined in the FCA Handbook) that are held under a title transfer collateral agreement
(“TTCA”), a means by which a professional client or eligible counterparty may agree that full ownership of
such funds is unconditionally transferred to the Group. The Group does not require clients to sign a TTCA in
order to be treated as a professional client and as a result their funds remain segregated. The Group
considers these funds as an ancillary source of liquidity and places no reliance on them for its stability.
• Available committed facility (off-balance sheet liquidity): The Group has access to a facility of up to
£55.0 million (2020: £40.0 million) in order to fund any potential fluctuations in margins required to be
posted at brokers to support the risk management strategy. The facility consists of a one-year term facility
of £27.5 million (2020: £20.0 million) and a three-year term facility of £27.5 million (2020: £20.0 million).
The maximum amount of the facility available at any one time is dependent upon the initial margin
requirements at brokers and margin received from clients. There was no drawdown on the facility at 31
March 2021 (2020: £nil).
The Group’s use of total available liquidity resources consists of:
• Blocked cash Amounts held to meet the requirements of local regulators and exchanges, in addition to
amounts held at overseas subsidiaries in excess of local segregated client requirements to meet potential
future client requirements.
• Initial margin requirement at broker The total GBP equivalent initial margin required by prime brokers to
cover the Group’s hedge derivative and cryptocurrency positions.
At 31 March 2021, the Group held cash balances of £118.9 million (2020: £84.3 million). In addition, £549.4 million
(2020: £339.8 million) was held in segregated client money accounts for clients. The movement in Group cash and
cash equivalents is set out in the Consolidated Statement of Cash Flows.
Own funds have increased to £370.4 million (2020: £238.3 million). Own funds include short-term financial
investments, amounts due from brokers and amounts receivable/payable on the Group’s derivative financial
instruments. For more details refer to note 29 of the Financial Statements.
The increase is predominantly due to own funds generated from operating activities.
£m 2021 2020
Own funds 370.4 238.3
Title transfer funds 30.7 8.7
Available committed facility 55.0 21.3
Total available liquidity 456.1 268.3
Less: blocked cash (75.4) (40.2)
Less: initial margin requirement at broker (170.1) (39.0)
Net available liquidity 210.6 189.1
Of which: held as LAB 28.1 25.4
Client money
Total segregated CFD client money held by the Group was £549.4 million at 31 March 2021 (2020: £339.8 million).
Client money represents the capacity for our clients to trade and offers an underlying indication of the health of our
client base.
Client money governance
The Group segregates all money held by it on behalf of clients excluding a small number of large clients which have
entered a TTCA with the firm. This is in accordance with or exceeding applicable client money regulations in countries
in which it operates. The majority of client money requirements fall under the Client Assets Sourcebook (“CASS”)
rules of the FCA in the UK, BaFin in Germany and ASIC in Australia. All segregated client funds are held in dedicated
client money bank accounts with major banks that meet strict internal criteria and are held separately from the Group’s
own money.

18
The Group has comprehensive client money processes and procedures in place to ensure client money is identified
and protected at the earliest possible point after receipt as well as governance structures which ensure such activities
are effective in protecting client money. The Group’s governance structure is explained further on pages 48 to 53 of
the 2021 Annual Report and Financial Statements.
Euan Marshall Chief Financial Officer 9 June 2021

19
PRINCIPAL RISKS
The Group’s business activities naturally expose it to strategic, financial and operational risks inherent in the nature
of the business it undertakes and the financial, market and regulatory environments in which it operates. The Group
recognises the importance of understanding and managing these risks and that it cannot place a cap or limit on all
of the risks to which the Group is exposed. However, effective risk management ensures that risks are managed to
an acceptable level. The Board, through its Group Risk Committee, is ultimately responsible for the implementation
of an appropriate risk strategy, which has been achieved using an integrated Risk Management Framework. The
main areas covered by the Risk Management Framework are:
• identifying, evaluating and monitoring of the principal risks to which the Group is exposed;
• setting the risk appetite of the Board in order to achieve its strategic objectives; and
• establishing and maintaining governance, policies, systems and controls to ensure the Group is operating
within the stated risk appetite.
The Board has put in place a governance structure which is appropriate for the operations of an online retail financial
services group and is aligned to the delivery of the Group’s strategic objectives. The structure is regularly reviewed
and monitored and any changes are subject to Board approval. Furthermore, management regularly considers
updates to the processes and procedures to embed good corporate governance throughout the Group. As part of
the Group Risk Management Framework, the business is subject to independent assurance by internal audit (third
line of defence). The use of independent compliance monitoring, risk reviews (second line of defence) and risk and
control self-assessments (first line of defence) provides additional support to the integrated assurance programme
and ensures that the Group is effectively identifying, managing and reporting its risks. The Group continues to make
enhancements to its Risk Management Framework and governance to provide a more structured approach to
identifying and managing the risks to which it is exposed. The Board has undertaken a robust assessment of the
principal risks facing the Group. Its top and emerging risks are those that would threaten its business model, future
performance, solvency or liquidity. These are outlined below and details of financial risks and their management are
set out in note 30 to the Financial Statements. Top and emerging risks during the year, which form either a subset of
one or multiple principal risks and continue to be at the forefront of the Group discussions, are:
• Brexit: On 31 December 2020 the UK’s transitional agreement with the EU ended, meaning UK companies
no longer had MiFID passporting rights to offer financial services to EEA clients. The Group established a
new German subsidiary during 2019 and started onboarding new German resident clients to the new
subsidiary from December 2019 and other EEA clients from December 2020.
Acting on advice received from one of our panel of regulatory advisors, the Group applied reverse solicitation
(“Grandfathering”) provisions, leaving certain EEA clients trading with its UK subsidiary after 31 December
2020. Given emerging regulatory uncertainty regarding the application of these provisions and further advice
from additional regulatory advisors, the Group informed those EEA clients that they would no longer be
permitted to trade with the UK subsidiary and offered them the opportunity to open an account with the new
German subsidiary. The majority of EEA clients’ activities with the UK subsidiary ceased prior to 31 March
2021.
The Group is proactively engaging with the regulatory authorities in the EEA markets where the UK subsidiary
continued to service clients after 31 December 2020. Whilst it is possible that regulatory censure may result
from these matters, they are in their very early stages and such an outcome is not currently considered
probable.
• COVID-19: The continued spread and deepening of the pandemic throughout the financial year gave rise to
multiple risks to the Group. Market and counterparty credit risk resulting from the increased trading activity
driven by the pandemic is actively monitored as a course of business. From an operational risk perspective,
the Group has put significant measures in place aimed at mitigating specific risks relating to its people and
operational activities and continues to actively monitor the situation and closely follow governmental advice.
• Market risk management: The Group’s risk management is constantly reviewed to ensure it is optimised
and as efficient as possible.
• Regulatory change: The Australian regulator, ASIC, announced new regulatory measures in October 2020
that came into effect from 29 March 2021. The measures are broadly similar to those implemented by ESMA
in August 2018 and include:
o prohibition of the issue and distribution of OTC binary options to retail clients;

20
o implementation of CFD leverage ratio limits;
o protection against negative balances;
o standardised approach to the automatic close-out of retail client positions;
o prohibition on firms offering monetary and non-monetary benefits to retail investors; and
o enhanced transparency of CFD pricing, execution, costs and risks.
The Group continues to believe that in the medium to long term these changes present opportunities for the
Group and the Group’s strong balance sheet and increasing diversification put it in a strong position to deal
with, and take advantage of, these changes.
Further information on the structure and workings of Board and Management Committees is included in the Corporate
Governance report on page 48 to 53 of the 2021 Annual Report and Financial Statements.
Principal Risk Risk Description Management and mitigation
Business and strategic risks
Acquisitions and disposals risk
The risk that mergers, acquisitions, disposals or other partnership arrangements made by the Group do not achieve the stated strategic objectives or that they give rise to ongoing or previously unidentified liabilities.
• Robust corporate governance structure including
strong challenge from independent Non-Executive
Directors.
• Vigorous and independent due diligence process.
• Align and manage the businesses to Group strategy as
soon as possible after acquisition.
Strategic / business model risk
The risk of an adverse impact
resulting from the Group’s
strategic decision making as
well as failure to exploit
strengths or take
opportunities. It is a risk
which may cause damage or
loss, financial or otherwise, to
the Group as a whole.
• Strong governance framework established including
three independent Non-Executive Directors and the
Chairman sitting on the Board.
• Robust governance, challenge and oversight from
independent Non-Executive Directors.
• Managing the Group in line with the agreed strategy,
policies and risk appetite.
Preparedness
for regulatory
change risk
The risk that changes to the
regulatory framework the
Group operates in impacts
the Group’s performance.
Such changes could result in the Group’s product offering becoming less profitable, more difficult to offer to clients, or an outright ban on the product offering in one or more of the countries where the Group operates.
• Active dialogue with regulators and industry bodies.
• Monitoring of market and regulator sentiment towards
the product offering.
• Monitoring by and advice from compliance department
on impact of actual and possible regulatory change.
• A business model and proprietary technology that is
responsive to changes in regulatory requirements.
Reputational risk
The risk of damage to the Group’s brand or standing with shareholders, regulators, existing and potential clients, the industry and the public at large.
• The Group is conservative in its approach to
reputational risk and operates robust controls to
ensure significant risks to its brand and standing are
appropriately mitigated.
• Examples include:
- proactive engagement with the Group’s regulators
and active participation with trade and industry
bodies; and positive development of media
relations with strictly controlled media contact; and
- systems and controls to ensure we continue to
offer a good service to clients and quick and
effective response to address any potential issues.

21
Principal Risk Risk Description Management and mitigation
Financial risks
Credit and counterparty risk
The risk of losses arising
from a counterparty failing to
meet its obligations as they
fall due.
Client counterparty risk
The Group’s management of client counterparty risk is
significantly aided by the automated liquidation
functionality. This is where the client positions are
reduced should the total equity of the account fall below
a predefined percentage of the required margin for the
portfolio held.
Other platform functionality mitigates risk further:
• tiered margin requires clients to hold more collateral
against bigger or higher risk positions;
• mobile phone access allowing clients to manage their
portfolios on the move;
• guaranteed stop loss orders allow clients to remove
their chance of debt from their position(s); and
• position limits can be implemented on an instrument
and client level. The instrument level enables the
Group to control the total exposure the Group takes on
in a single instrument. At a client level this ensures that
the client can only reach a pre-defined size in any one
instrument.
In relevant jurisdictions, CMC offers negative balance
protection to retail clients limiting the liability of a retail
investor to the funds held in their trading account.
However, after mitigations, there is a residual risk that
the Group could incur losses relating to clients (excluding
negative balance protection accounts) moving into debit
balances if there is a market gap.
Financial institution credit risk
Risk management is carried out by a central Liquidity
Risk Management (“LRM”) team under the Counterparty
Concentration Risk Policy.
Mitigation is achieved by:
• monitoring concentration levels to counterparties and
reporting these internally/externally on a
monthly/quarterly basis; and
• monitoring the credit ratings and credit default swap
(“CDS”) spreads of counterparties and reporting
internally on a weekly basis.
Insurance risk
The risk that an insurance
claim by the Group is
declined (in full or in part) or
there is insufficient insurance
coverage.
• Use of a reputable insurance broker who ensures
cover is placed with financially secure insurers.
• Comprehensive levels of cover maintained.
• Rigorous claim management procedures are in place
with the broker.
The Board’s appetite for uninsured risk is low and as a
result the Group has put in place established
comprehensive levels of insurance cover.
Tax and
financial
reporting risk
The risk that financial, statutory or regulatory reports including VAT and similar taxes are submitted late, incomplete or are inaccurate.
• Robust process of checking and oversight in place to
ensure accuracy.
• Knowledgeable and experienced staff undertake and
overview the relevant processes.
22
Principal Risk Risk Description Management and mitigation
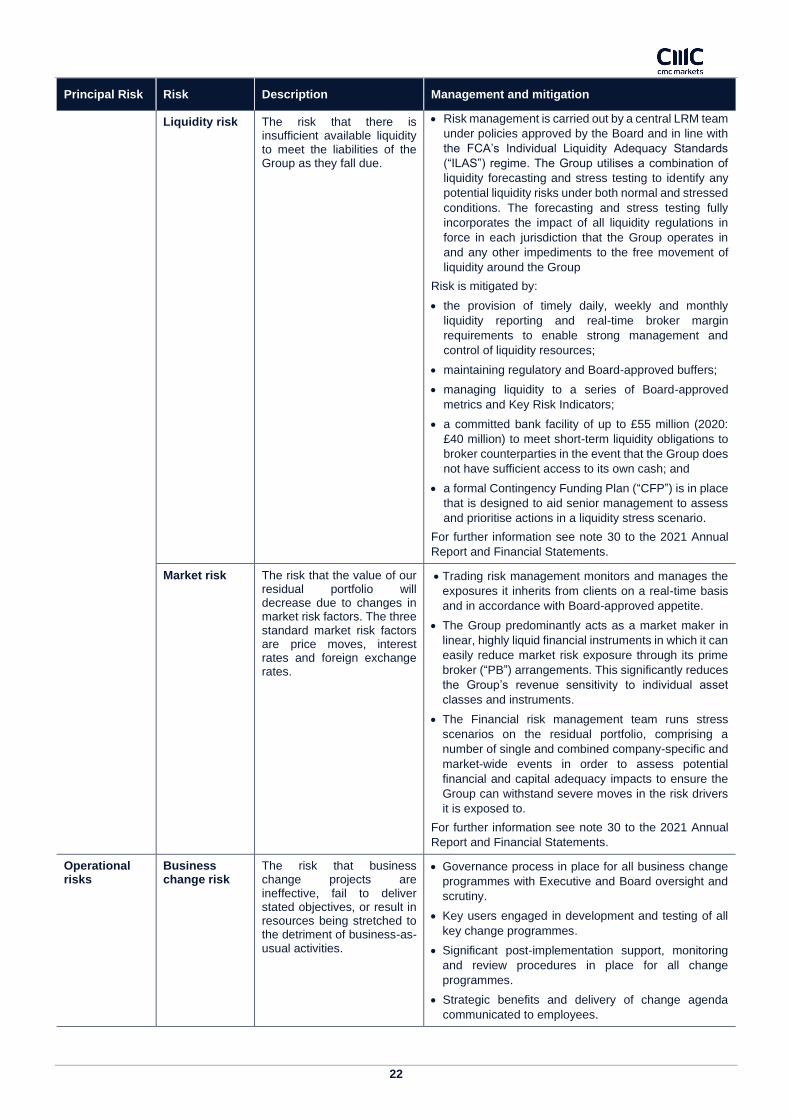
Liquidity risk The risk that there is insufficient available liquidity to meet the liabilities of the Group as they fall due.
• Risk management is carried out by a central LRM team
under policies approved by the Board and in line with
the FCA’s Individual Liquidity Adequacy Standards
(“ILAS”) regime. The Group utilises a combination of
liquidity forecasting and stress testing to identify any
potential liquidity risks under both normal and stressed
conditions. The forecasting and stress testing fully
incorporates the impact of all liquidity regulations in
force in each jurisdiction that the Group operates in
and any other impediments to the free movement of
liquidity around the Group
Risk is mitigated by:
• the provision of timely daily, weekly and monthly
liquidity reporting and real-time broker margin
requirements to enable strong management and
control of liquidity resources;
• maintaining regulatory and Board-approved buffers;
• managing liquidity to a series of Board-approved
metrics and Key Risk Indicators;
• a committed bank facility of up to £55 million (2020:
£40 million) to meet short-term liquidity obligations to
broker counterparties in the event that the Group does
not have sufficient access to its own cash; and
• a formal Contingency Funding Plan (“CFP”) is in place
that is designed to aid senior management to assess
and prioritise actions in a liquidity stress scenario.
For further information see note 30 to the 2021 Annual
Report and Financial Statements.
Market risk The risk that the value of our residual portfolio will decrease due to changes in market risk factors. The three standard market risk factors are price moves, interest rates and foreign exchange rates.
• Trading risk management monitors and manages the
exposures it inherits from clients on a real-time basis
and in accordance with Board-approved appetite.
• The Group predominantly acts as a market maker in
linear, highly liquid financial instruments in which it can
easily reduce market risk exposure through its prime
broker (“PB”) arrangements. This significantly reduces
the Group’s revenue sensitivity to individual asset
classes and instruments.
• The Financial risk management team runs stress
scenarios on the residual portfolio, comprising a
number of single and combined company-specific and
market-wide events in order to assess potential
financial and capital adequacy impacts to ensure the
Group can withstand severe moves in the risk drivers
it is exposed to.
For further information see note 30 to the 2021 Annual
Report and Financial Statements.
Operational risks
Business change risk
The risk that business change projects are ineffective, fail to deliver stated objectives, or result in resources being stretched to the detriment of business-as-usual activities.
• Governance process in place for all business change
programmes with Executive and Board oversight and
scrutiny.
• Key users engaged in development and testing of all
key change programmes.
• Significant post-implementation support, monitoring
and review procedures in place for all change
programmes.
• Strategic benefits and delivery of change agenda
communicated to employees.

23
Principal Risk Risk Description Management and mitigation
Business continuity and disaster recovery risk
The risk that a business continuity event or system failure results in a reduced ability or inability to perform core business activities or processes.
• Multiple data centres and systems to ensure core
business activities and processes are resilient to
individual failures.
• Dedicated alternate office sites for Tier 1 offices.
Remote access systems to enable staff to work from
home or other locations in the event of a disaster
recovery or business continuity requirement.
• Periodic testing of business continuity processes and
disaster recovery.
• Robust incident management processes and policies
to ensure prompt response to significant systems
failures or interruptions.
Financial crime risk
The risk that the Group is not
committed to combatting
financial crime and ensuring
that our platform and
products are not used for the
purpose of money
laundering, sanctions
evasion or terrorism
financing.
Adherence with applicable laws and regulations
regarding Anti-Money Laundering (“AML”), Counter
Terrorism Financing (“CTF”), Sanctions and Anti-Bribery
& Corruption is mandatory and fundamental to our
AML/CTF framework. We have strict and transparent
standards and we continuously strengthen our
processes to ensure compliance with applicable laws
and regulations. CMC Markets reserves the right to reject
any client, payment, or business that is not consistent
with our risk appetite. This risk is further mitigated by:
• establishing and maintaining a risk-based approach
towards assessing and managing the money
laundering and terrorist financing risks to the Group;
• establishing and maintaining risk-based know your
customer (“KYC”) procedures, including enhanced
due diligence (“EDD”) for those customers presenting
higher risk, such as politically exposed persons
(“PEPs”);
• establishing and maintaining risk-based systems for
surveillance and procedures to monitor ongoing
customer activity;
• procedures for reporting suspicious activity internally
and to the relevant law enforcement authorities or
regulators as appropriate;
• maintenance of appropriate records for the minimum
prescribed record keeping periods;
• training and awareness for all employees;
• provision of appropriate MI and reporting to senior
management of the Group’s compliance with the
requirements; and
• oversight of Group entities for financial crime in line
with the Group AML/CTF Oversight Framework.
Information and data security risk
The risk of unauthorised access to, or external disclosure of, client or Company information, including those caused by cyber attacks.
• Dedicated information security and data protection
expertise within the Group.
• Technical and procedural controls implemented to
minimise the occurrence or impact of information
security and data protection breaches.
• Access to information and systems only provided on a
“need-to-know” and “least privilege” basis consistent
with the user’s role and also requires the appropriate
authorisation.
• Regular system access reviews implemented across
the business.

24
Principal Risk Risk Description Management and mitigation
Information technology and infrastructure risk
The risk of loss of technology services due to loss of data, system or data centre or failure of a third party to restore services in a timely manner.
• Continuous investment in increased functionality,
capacity and responsiveness of systems and
infrastructure, including investment in software that
monitors and assists in the detection and prevention of
cyber attacks.
• Software design methodologies, project management
and testing regimes to minimise implementation and
operational risks.
• Constant monitoring of systems performance and, in
the event of any operational issues, changes to
processes are implemented to mitigate future
concerns.
• Operation of resilient data centres to support each
platform (two in the UK to support Next Generation and
two in Australia to support Stockbroking).
• Systems and data centres designed for high
availability and data integrity enabling continuous
service to clients in the event of individual component
failure or larger system failures.
• Dedicated Support and Infrastructure teams to
manage key production systems. Segregation of
duties between Development and Production Support
teams where possible to limit development access to
production systems.
Legal (commercial / litigation) risks
The risk that disputes deteriorate into litigation.
• Compliance with legal and regulatory requirements
including relevant codes of practice.
• Early engagement with legal advisers and other risk
managers.
• Appropriately managed complaints which have a
legal/litigious aspect.
• An early assessment of the impact and
implementation of changes in the law.
Operations (processing) risks
The risk that the design or execution of business processes is inadequate or fails to deliver an expected level of service and protection to client or Company assets.
• Investment in system development and upgrades to
improve process automation.
• Enhanced staff training and oversight in key business
processing areas.
• Monitoring and robust analysis of errors and losses
and underlying causes.
Procurement and outsourcing risks
The risk that third-party organisations inadequately perform, or fail to provide or perform, the outsourced activities or contractual obligations to the standards required by the Group.
• Responsibility for procurement, vendor management
and general outsourcing owned by the Chief Financial
Officer under the Senior Manager and Certification
Regime, with the accountability to ensure compliance
to the Group procurement process and completion of
key activities, based on the risk profile of the service
required by the organisation.
• Outsourcing only employed where there is a strategic
gain in resource or experience, which is not available
in house.
• Due diligence performed on service supplier ahead of
outsourcing being agreed.
• Service level agreements in place and regular
monitoring of performance undertaken.

25
Principal Risk Risk Description Management and mitigation
People risk The risk of loss of key staff, having insufficient skilled and motivated resources available or failing to operate people-related processes to an appropriate standard.
• The Board has directed that the Group maintains
active People, Succession and Resource Plans for the
Group and all key individuals and teams, which will
mitigate some of the risk of loss of key persons. It will
adopt policies and strategies commensurate with its
objectives of:
- attracting and nurturing the best staff;
- retaining and motivating key individuals;
- managing employee-related risks;
- achieving a high level of employee engagement;
- developing personnel capabilities;
- optimising continuous professional development;
and
- achieving a reputation as a good employer with an
equitable remuneration policy.
Regulatory and compliance risk
The risk of regulatory sanction or legal proceedings as a result of failure to comply with regulatory, statutory or fiduciary requirements or as a result of a defective transaction.
• Internal audit outsourced to an independent third-party
professional services firm.
• Effective compliance oversight and advisory/technical
guidance provided to the business.
• Comprehensive monitoring and surveillance
programmes, policies and procedures designed by
compliance.
• Strong regulatory relations and regulatory horizon
scanning, planning and implementation.
• Controls for appointment and approval of staff holding
a senior management or certified function and annual
declarations to establish ongoing fitness and propriety.
• Governance and reporting of regulatory risks through
the Risk Management Committee, Group Audit
Committee and Group Risk Committee.
• Robust anti-money laundering controls, client due
diligence and sanctions checking.
Conduct risk The risk that through our culture, behaviours or practices we fail to meet the reasonable expectations of our customers, shareholders or regulators.
• The Treating Customers Fairly (“TCF”) and Conduct
Committee is comprised of senior management and
subject matter experts, it convenes regularly to
evaluate and challenge the TCF MI alongside any
emerging issues or incidents which could impact client
fairness. It reports to the Board via the Risk
Management Committee (“RMC”) who are also
charged with approving the TCF Policy.
Client money segregation risk
The risk that the Group fails to implement adequate controls and processes to ensure that client money is segregated in accordance with applicable regulations.
• The Client Money Review Group (“CMRG”), which
reports into the RMC, is a fundamental part of the
Group’s client money governance and oversight
procedures. The CMRG is chaired by the Chief
Financial Officer, an FCA-approved person, who is
responsible for overseeing the controls and
procedures in place to protect client money.
• The Committee is comprised of senior management
from across the Group who oversee functions which
impact client money. The CMRG forms a key part of
the oversight of client money in addition to compliance,
internal audit and PricewaterhouseCoopers LLP as
external auditors.

26
DIRECTORS’ STATEMENT PURSUANT TO THE FCA’S DISCLOSURE AND TRANSPARENCY
RULES The directors are required by the Disclosure and Transparency Rules to include a management report containing a
fair review of the business and a description of the principal risks and uncertainties facing the Group.
The directors listed below (being all the directors of CMC Markets plc) confirm to the best of their knowledge that:
• the Group Financial Statements contained in the 2021 Annual Report and Financial Statements, which have
been prepared in accordance with international accounting standards in conformity with the requirements of
the Companies Act 2006 and international financial reporting standards adopted pursuant to Regulation (EC)
No 1606/2002 as it applies in the European Union, give a true and fair view of the assets, liabilities, financial
position and results of the Group; and
• the Strategic Report contained in the 2021 Annual Report and Financial Statements includes a fair review of
the development and performance of the business and the position of the Company and the Group, together
with a description of the principal risks and uncertainties that they face; and
• the 2021 Annual Report and Financial Statements, taken as a whole, are fair, balanced and understandable
and provide the information necessary for shareholders to assess the Company’s performance, business
model and strategy
The Directors’ statement was approved by the Board of Directors on 9 June 2021 and signed on its behalf by:
Lord Cruddas Euan Marshall
Chief Executive Officer Chief Financial Officer
CMC Markets plc Board of Directors
Executive Directors
Lord Cruddas (Chief Executive Officer)
David Fineberg (Deputy Chief Executive Officer)
Euan Marshall (Chief Financial Officer)
Matthew Lewis (Head of Asia Pacific & Canada)
Non-Executive Directors
James Richards (Chairman)
Paul Wainscott (Senior Independent Director)
Sarah Ing
Clare Salmon

27
Consolidated income statement For the year ended 31 March 2021
£’000 Note
Year ended
31 March 2021
Year ended
31 March 2020
Revenue 461,308 294,727
Interest income 746 3,345
Total revenue 3 462,054 298,072
Introducing partner commissions and betting levies (52,288) (46,067)
Net operating income 2 409,766 252,005
Operating expenses 4 (183,994) (151,267)
Operating profit 225,772 100,738
Finance costs (1,762) (2,052)
Profit before taxation 224,010 98,686
Taxation 5 (45,903) (11,749)
Profit for the year attributable to owners of the parent 178,107 86,937
Earnings per share
Basic earnings per share (p) 6 61.5p 30.1p
Diluted earnings per share (p) 6 61.2p 29.9p
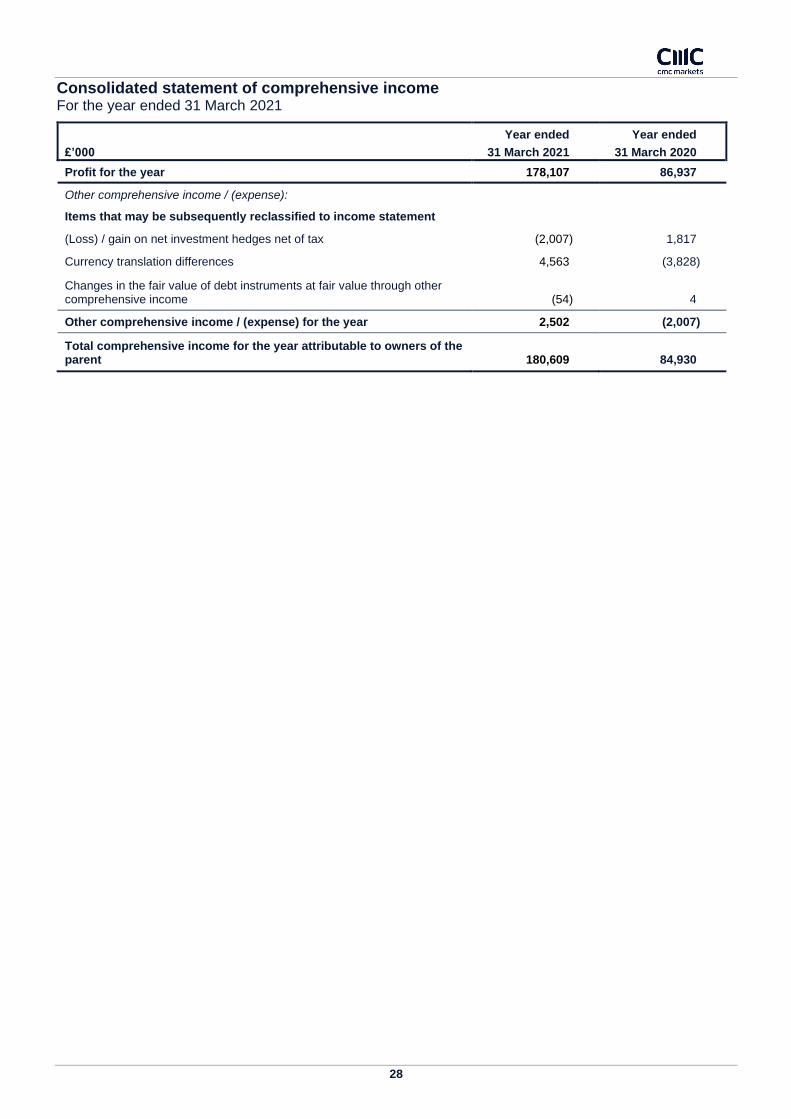
28
Consolidated statement of comprehensive income For the year ended 31 March 2021
£’000
Year ended
31 March 2021
Year ended
31 March 2020
Profit for the year 178,107 86,937
Other comprehensive income / (expense):
Items that may be subsequently reclassified to income statement
(Loss) / gain on net investment hedges net of tax (2,007) 1,817
Currency translation differences 4,563 (3,828)
Changes in the fair value of debt instruments at fair value through other comprehensive income (54) 4
Other comprehensive income / (expense) for the year 2,502 (2,007)
Total comprehensive income for the year attributable to owners of the parent 180,609 84,930
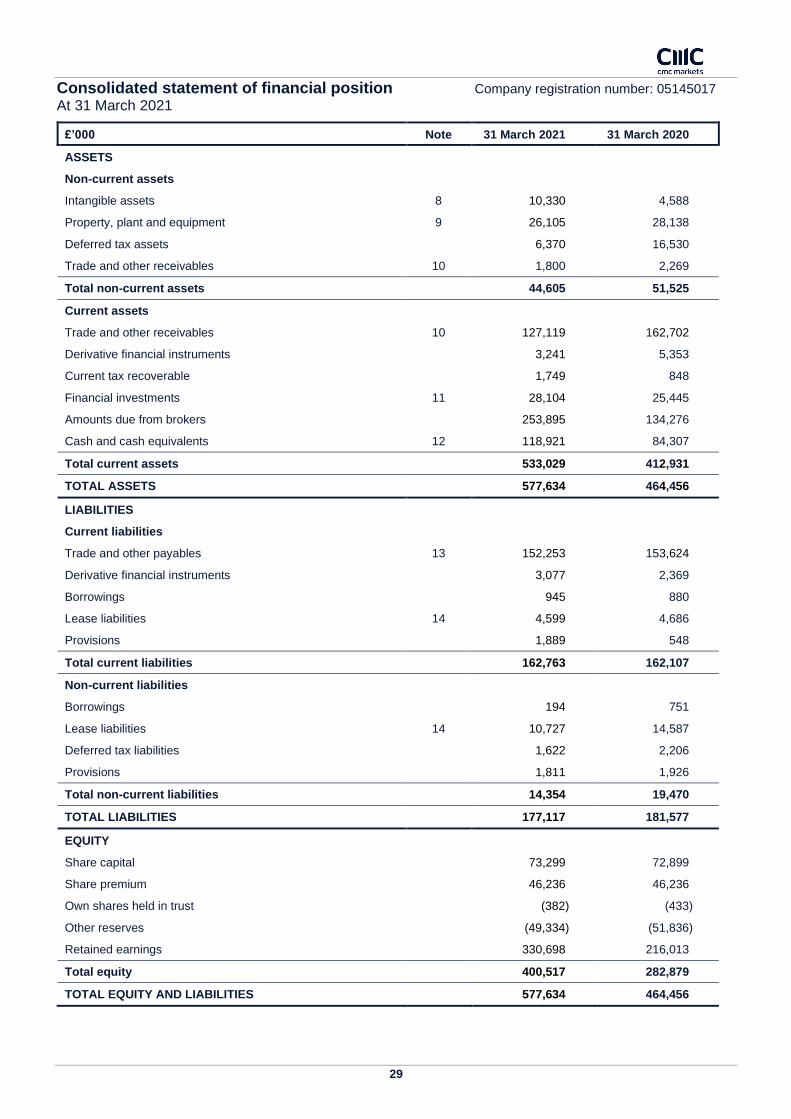
29
Consolidated statement of financial position Company registration number: 05145017 At 31 March 2021
£’000 Note 31 March 2021 31 March 2020
ASSETS
Non-current assets
Intangible assets 8 10,330 4,588
Property, plant and equipment 9 26,105 28,138
Deferred tax assets 6,370 16,530
Trade and other receivables 10 1,800 2,269
Total non-current assets 44,605 51,525
Current assets
Trade and other receivables 10 127,119 162,702
Derivative financial instruments 3,241 5,353
Current tax recoverable 1,749 848
Financial investments 11 28,104 25,445
Amounts due from brokers 253,895 134,276
Cash and cash equivalents 12 118,921 84,307
Total current assets 533,029 412,931
TOTAL ASSETS 577,634 464,456
LIABILITIES
Current liabilities
Trade and other payables 13 152,253 153,624
Derivative financial instruments 3,077 2,369
Borrowings 945 880
Lease liabilities 14 4,599 4,686
Provisions 1,889 548
Total current liabilities 162,763 162,107
Non-current liabilities
Borrowings 194 751
Lease liabilities 14 10,727 14,587
Deferred tax liabilities 1,622 2,206
Provisions 1,811 1,926
Total non-current liabilities 14,354 19,470
TOTAL LIABILITIES 177,117 181,577
EQUITY
Share capital 73,299 72,899
Share premium 46,236 46,236
Own shares held in trust (382) (433)
Other reserves (49,334) (51,836)
Retained earnings 330,698 216,013
Total equity 400,517 282,879
TOTAL EQUITY AND LIABILITIES 577,634 464,456
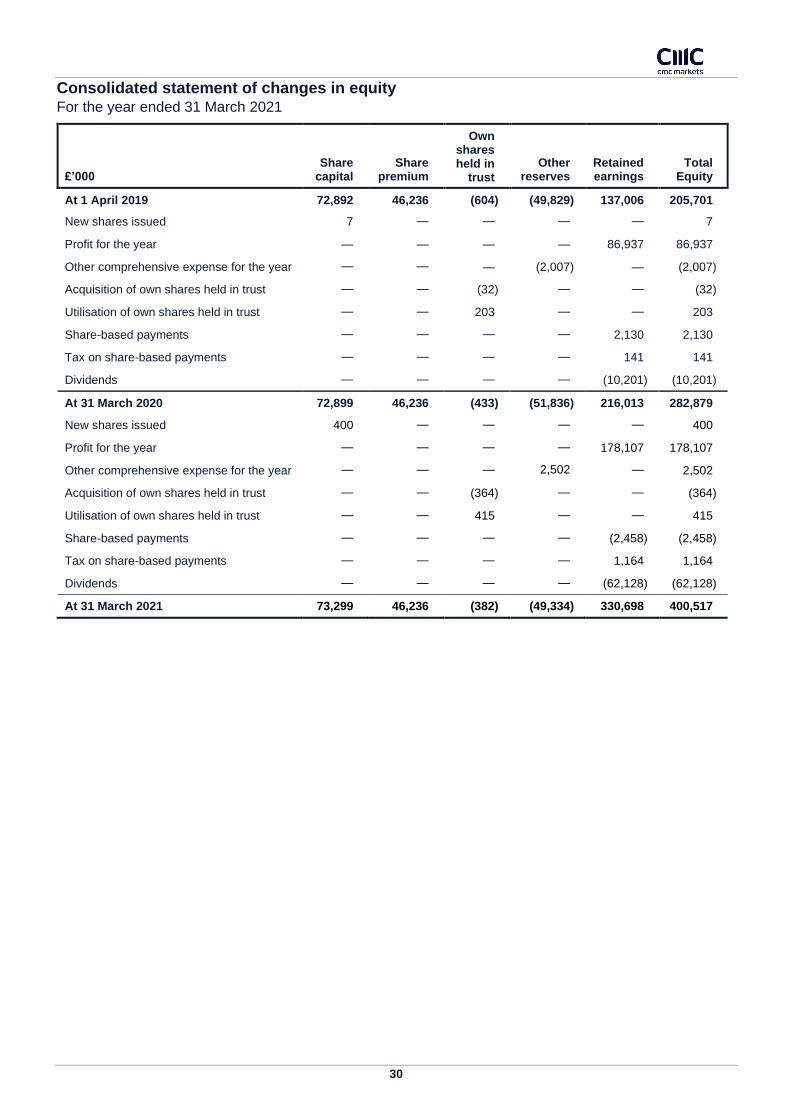
30
Consolidated statement of changes in equity For the year ended 31 March 2021
£’000 Share
capital Share
premium
Own shares held in
trust
Other reserves
Retained earnings
Total Equity
At 1 April 2019 72,892 46,236 (604) (49,829) 137,006 205,701
New shares issued 7 — — — — 7
Profit for the year — — — — 86,937 86,937
Other comprehensive expense for the year — — — (2,007) — (2,007)
Acquisition of own shares held in trust — — (32) — — (32)
Utilisation of own shares held in trust — — 203 — — 203
Share-based payments — — — — 2,130 2,130
Tax on share-based payments — — — — 141 141
Dividends — — — — (10,201) (10,201)
At 31 March 2020 72,899 46,236 (433) (51,836) 216,013 282,879
New shares issued 400 — — — — 400
Profit for the year — — — — 178,107 178,107
Other comprehensive expense for the year — — — 2,502 — 2,502
Acquisition of own shares held in trust — — (364) — — (364)
Utilisation of own shares held in trust — — 415 — — 415
Share-based payments — — — — (2,458) (2,458)
Tax on share-based payments — — — — 1,164 1,164
Dividends — — — — (62,128) (62,128)
At 31 March 2021 73,299 46,236 (382) (49,334) 330,698 400,517

31
Consolidated statement of cash flows For the year ended 31 March 2021
£’000 Note
Year ended
31 March 2021
Year ended
31 March 2020
Cash flows from operating activities
Cash generated from operations 15 151,300 74,393
Interest income 1,784 3,178
Tax paid (33,620) (13,079)
Net cash generated from operating activities 119,464 64,492
Cash flows from investing activities
Purchase of property, plant and equipment (4,162) (2,645)
Investment in intangible assets (8,028) (1,628)
Purchase of financial investments (28,933) (14,446)
Proceeds from maturity of financial investments and coupon receipts 25,176 11,245
(Outflow) / inflow on net investment hedges (1,761) 1,084
Net cash used in investing activities (17,708) (6,390)
Cash flows from financing activities
Repayment of borrowings (51,190) (11,494)
Proceeds from borrowings 50,000 10,175
Principal elements of lease payments (6,057) (5,746)
Proceeds from issue of Ordinary Shares 80 _
Acquisition of own shares (44) (25)
Dividends paid (62,128) (10,201)
Finance costs (1,749) (2,052)
Net cash used in financing activities (71,088) (19,343)
Net increase in cash and cash equivalents 30,668 38,759
Cash and cash equivalents at the beginning of the year 84,307 48,729
Effect of foreign exchange rate changes 3,946 (3,181)
Cash and cash equivalents at the end of the year 118,921 84,307

32
1. Basis of preparation
Basis of accounting
The financial information set out herein does not constitute the Group’s statutory accounts for the years ended 31 March 2021
and 2020, but is derived from those financial statements. The Annual Report and Financial Statements for the year ended 31
March 2020 have been delivered to the Registrar of Companies and those for the year ended 31 March 2021 will be delivered
following the Company’s Annual General Meeting to be held on 29 July 2021. The external auditor has reported on those financial
statements; its reports were unqualified, did not draw attention to any matters by way of emphasis without qualifying their report
and did not contain statements under s498(2) or (3) Companies Act 2006.
While the financial information included in this announcement has been prepared in accordance with the International Financial
Reporting Standards as adopted by the European Union (“IFRSs”), IFRS Interpretations Committee (“IFRS IC”) interpretations as
adopted by the European Union and the Companies Act 2006 applicable to companies reporting under IFRSs, this announcement
does not itself contain sufficient information to comply with IFRSs.
The Financial Statements have been prepared in accordance with the going concern basis, under the historical cost convention,
except in the case of “Financial instruments at fair value through profit or loss (“FVPL”)” and “Financial instruments at fair value
through other comprehensive income (“FVOCI”)”.The financial information is rounded to the nearest thousand, except where
otherwise indicated.
The Group’s principal accounting policies adopted in the preparation of these financial statements are consistent with those of the
previous financial year. The financial statements presented are at and for the years ending 31 March 2021 and 31 March 2020.
Financial annual years are referred to as 2021, and 2020 in the financial statements.
Changes in accounting policy
As described in Note 32 in the 2021 Annual Report and Financial Statements, the Group has a policy of holding all client monies
off balance sheet. As it relates to the stockbroking business in Australia, the accounting treatment of monies deposited by clients
in advance of trading has been open to interpretation with judgement required to determine whether risks and rewards are such
that the amounts should be on an entity’s statement of financial position. Previously, the Group determined that the amounts, and
associated payables to clients, should be reflected on the statement of financial position. During the year, and in line with emerging
and clarified industry practice, the Group has changed its accounting policy in this regard, concluding that the amounts should be
de-recognised. This change in accounting policy has been applied retrospectively, leading to the restatement of the Consolidated
statement of financial position as at 31 March 2020, whereby £23,561,000 has been derecognised from the Trade & Other
Receivables and Trade & Other Payables balances.
Significant accounting judgements
The preparation of Financial Statements in conformity with IFRSs requires the use of certain significant accounting judgements.
It also requires management to exercise its judgement in the process of applying the Group’s accounting policies. The only area
involving a higher degree of judgement or complexity, or where assumptions and estimates are significant to the Financial
Statements, is:
Deferred taxes
The carrying amounts of deferred tax assets are reviewed at each balance sheet date and reduced to the extent that it is no longer
probable that sufficient taxable profits will be available to allow all or part of the asset to be recovered.
Contingent liabilities
Judgement has been applied in evaluating the accounting treatment of the specific matters described in Note 35 in the 2021 Annual Report and Financial Statements, notably the probability of any obligation or future payments arising.
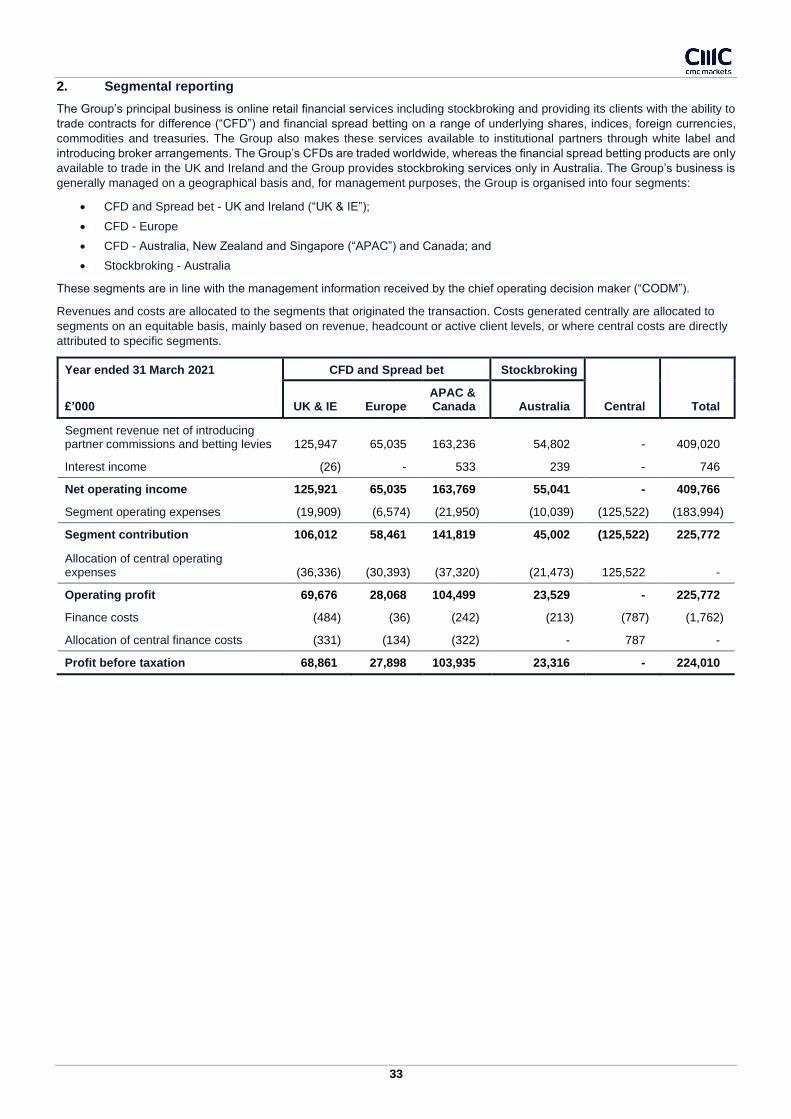
33
2. Segmental reporting
The Group’s principal business is online retail financial services including stockbroking and providing its clients with the ability to
trade contracts for difference (“CFD”) and financial spread betting on a range of underlying shares, indices, foreign currenc ies,
commodities and treasuries. The Group also makes these services available to institutional partners through white label and
introducing broker arrangements. The Group’s CFDs are traded worldwide, whereas the financial spread betting products are only
available to trade in the UK and Ireland and the Group provides stockbroking services only in Australia. The Group’s business is
generally managed on a geographical basis and, for management purposes, the Group is organised into four segments:
• CFD and Spread bet - UK and Ireland (“UK & IE”);
• CFD - Europe
• CFD - Australia, New Zealand and Singapore (“APAC”) and Canada; and
• Stockbroking - Australia
These segments are in line with the management information received by the chief operating decision maker (“CODM”).
Revenues and costs are allocated to the segments that originated the transaction. Costs generated centrally are allocated to
segments on an equitable basis, mainly based on revenue, headcount or active client levels, or where central costs are directly
attributed to specific segments.
Year ended 31 March 2021
CFD and Spread bet Stockbroking
£’000 UK & IE Europe APAC & Canada Australia Central Total
Segment revenue net of introducing partner commissions and betting levies 125,947 65,035 163,236 54,802 - 409,020
Interest income (26) - 533 239 - 746
Net operating income 125,921 65,035 163,769 55,041 - 409,766
Segment operating expenses (19,909) (6,574) (21,950) (10,039) (125,522) (183,994)
Segment contribution 106,012 58,461 141,819 45,002 (125,522) 225,772
Allocation of central operating expenses (36,336) (30,393) (37,320) (21,473) 125,522 -
Operating profit 69,676 28,068 104,499 23,529 - 225,772
Finance costs (484) (36) (242) (213) (787) (1,762)
Allocation of central finance costs (331) (134) (322) - 787 -
Profit before taxation 68,861 27,898 103,935 23,316 - 224,010
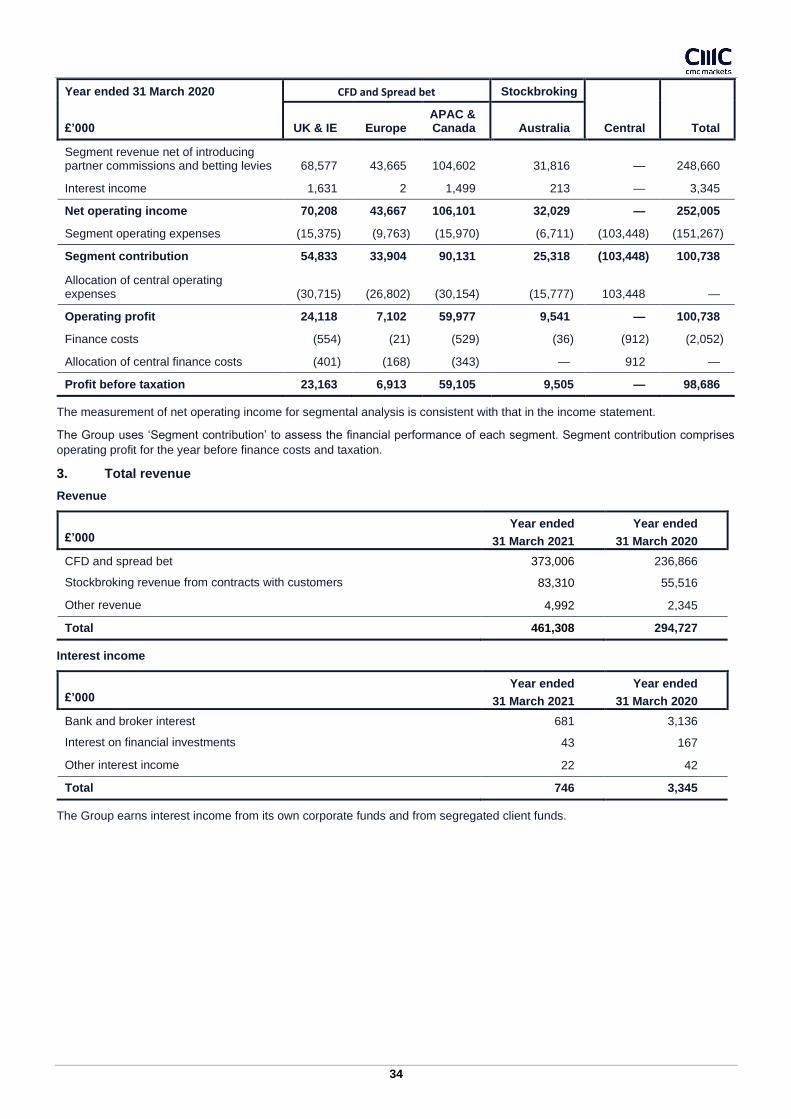
34
Year ended 31 March 2020
CFD and Spread bet Stockbroking
£’000 UK & IE Europe APAC & Canada Australia Central Total
Segment revenue net of introducing partner commissions and betting levies 68,577 43,665 104,602 31,816 — 248,660
Interest income 1,631 2 1,499 213 — 3,345
Net operating income 70,208 43,667 106,101 32,029 — 252,005
Segment operating expenses (15,375) (9,763) (15,970) (6,711) (103,448) (151,267)
Segment contribution 54,833 33,904 90,131 25,318 (103,448) 100,738
Allocation of central operating expenses (30,715) (26,802) (30,154) (15,777) 103,448 —
Operating profit 24,118 7,102 59,977 9,541 — 100,738
Finance costs (554) (21) (529) (36) (912) (2,052)
Allocation of central finance costs (401) (168) (343) — 912 —
Profit before taxation 23,163 6,913 59,105 9,505 — 98,686
The measurement of net operating income for segmental analysis is consistent with that in the income statement.
The Group uses ‘Segment contribution’ to assess the financial performance of each segment. Segment contribution comprises
operating profit for the year before finance costs and taxation.
3. Total revenue
Revenue
£’000
Year ended
31 March 2021 202120201
Year ended
31 March 2020
CFD and spread bet 373,006 236,866
Stockbroking revenue from contracts with customers 83,310 55,516
Other revenue 4,992 2,345
Total 461,308 294,727
Interest income
£’000 Year ended
31 March 2021
Year ended
31 March 2020
Bank and broker interest 681 3,136
Interest on financial investments 43 167
Other interest income 22 42
Total 746 3,345
The Group earns interest income from its own corporate funds and from segregated client funds.

35
4. Operating expenses
£’000
Year ended
31 March 2021
Year ended
31 March 2020
Net staff costs 78,653 67,797
IT costs 26,162 21,497
Sales and marketing 30,399 18,065
Premises 3,794 3,108
Legal and Professional fees 7,234 5,161
Regulatory fees 5,002 5,150
Depreciation and amortisation 11,239 10,959
Irrecoverable sales tax 6,536 5,086
Other 15,017 14,477
184,036 151,300
Capitalised internal software development costs (42) (33)
Operating expenses 183,994 151,267
The above presentation reflects the breakdown of Operating expenses by nature of expense.

36
5. Taxation
£’000
Year ended
31 March 2021
Year ended
31 March 2020
Analysis of charge for the year:
Current tax
Current tax on profit for the year 35,124 15,806
Adjustments in respect of previous years (815) (107)
Total current tax 34,309 15,699
Deferred tax
Origination and reversal of temporary differences 11,508 (3,968)
Adjustments in respect of previous years 86 181
Impact of change in tax rate — (163)
Total deferred tax 11,594 (3,950)
Total tax 45,903 11,749
The standard rate of UK corporation tax charged was 19% with effect from 1 April 2017. Taxation outside the UK is calculated at
the rates prevailing in the respective jurisdictions. The effective tax rate of 20.49% (year ended 31 March 2020: 11.91%) differs
from the standard rate of UK corporation tax of 19% (year ended 31 March 2020: 19%). The differences are explained below:
£’000
Year ended
31 March 2021
Year ended
31 March 2020
Profit before taxation 224,010 98,686
Profit multiplied by the standard rate of corp. tax in the UK of 19% (31 March 2020: 19%) 42,562 18,750
Adjustment in respect of foreign tax rates 3,918 2,394
Adjustments in respect of previous years (729) 74
Impact of change in tax rate 1 (163)
Expenses not deductible for tax purposes 415 303
Recognition of previously unrecognised tax losses (678) (10,162)
Other differences 414 553
Total tax 45,903 11,749
£’000
Year ended
31 March 2021
Year ended
31 March 2020
Tax on items recognised directly in Equity
Tax credit on Share based payments 1,164 141

37
6. Earnings per share (EPS)
Basic EPS is calculated by dividing the earnings attributable to the equity owners of the Company by the weighted average number
of Ordinary Shares in issue during each year excluding those held in employee share trusts which are treated as cancelled.
For diluted earnings per share, the weighted average number of Ordinary Shares in issue, excluding those held in employee share
trusts, is adjusted to assume vesting of all dilutive potential weighted average Ordinary Shares and that vesting is satisfied by the
issue of new Ordinary shares.
£’000 Year ended
31 March 2021
Year ended
31 March 2020
Earnings attributable to ordinary shareholders (£ '000) 178,107 86,937
Weighted average number of shares used in the calculation of basic earnings per share ('000) 289,677 288,632
Dilutive effect of share options ('000) 1,485 2,530
Weighted average number of shares used in the calculation of diluted earnings per share (‘000) 291,162 291,162
Basic earnings per share (p) 61.5p 30.1p
Diluted earnings per share (p) 61.2p 29.9p
For the year ended 31 March 2021, 1,485,000 (Year ended 31 March 2020: 2,530,000) potentially dilutive weighted average
Ordinary Shares in respect of share options in issue were included in the calculation of diluted EPS.
7. Dividends
£’000
Year ended
31 March 2021
Year ended
31 March 2020
Declared and paid in each year
Final dividend for 2020 at 12.18p per share (2019: 0.68p) 35,393 1,965
Interim dividend for 2021 at 9.20p per share (2020: 2.85p) 26,735 8,236
Total 62,128 10,201
The final dividend for 2021 of 21.43 pence per share, amounting to £62,301,000, was proposed by the Board on 9 June 2021 and
has not been included as a liability at 31 March 2021. The dividend will be paid on 9 September 2021, following approval at the
Company’s AGM, to those members on the register at the close of business on 6 August 2021.
The dividends paid or declared in relation to the financial year are set out below:
pence
Year ended
31 March 2021
Year ended
31 March 2020
Declared per share
Interim dividend 9.20p 2.85p
Final dividend 21.43p 12.18p
Total dividend 30.63p 15.03p

38
8. Intangible assets
£ ‘000 Goodwill Computer
software
Trademarks and trading
licences Client
relationships Assets under development Total
At 31 March 2020
Cost 11,500 121,085 1,409 2,684 1,054 137,732
Accumulated amortisation (11,500) (117,907) (1,053) (2,684) — (133,144)
Carrying amount at 31 March 2020 — 3,178 356 — 1,054 4,588
Additions — 2,678 — — 5,350 8,028
Transfers — 275 — — (275) —
Disposals — — (57) — (33) (90)
Research and development grant — (515) — — — (515)
Amortisation charge — (1,945) (40) — — (1,985)
Foreign currency translation — 249 3 — 52 304
Carrying amount at 31 March 2021 — 3,920 262 — 6,148 10,330
At 31 March 2021
Cost 11,500 125,995 1,397 2,995 6,148 148,035
Accumulated amortisation (11,500) (122,075) (1,135) (2,995) — (137,705)
Carrying amount — 3,920 262 — 6,148 10,330
9. Property, plant and equipment
£ ‘000 Leasehold
improvements
Furniture, fixtures and
equipment Computer hardware
RIght-of-use assets Total
At 31 March 2020
Cost 18,600 9,807 31,008 17,657 77,072
Accumulated amortisation (12,156) (8,523) (24,166) (4,089) (48,934)
Carrying amount at 31 March 2020 6,444 1,284 6,842 13,568 28,138
Additions — 58 4,805 1,707 6,570
Disposals — — — (324) (324)
Depreciation charge (1,796) (554) (2,756) (4,148) (9,254)
Foreign currency translation 232 73 123 547 975
Carrying amount at 31 March 2021 4,880 861 9,014 11,350 26,105
At 31 March 2021
Cost 19,273 9,656 36,249 19,146 84,324
Accumulated amortisation (14,393) (8,795) (27,235) (7,796) (58,219)
Carrying amount 4,880 861 9,014 11,350 26,105
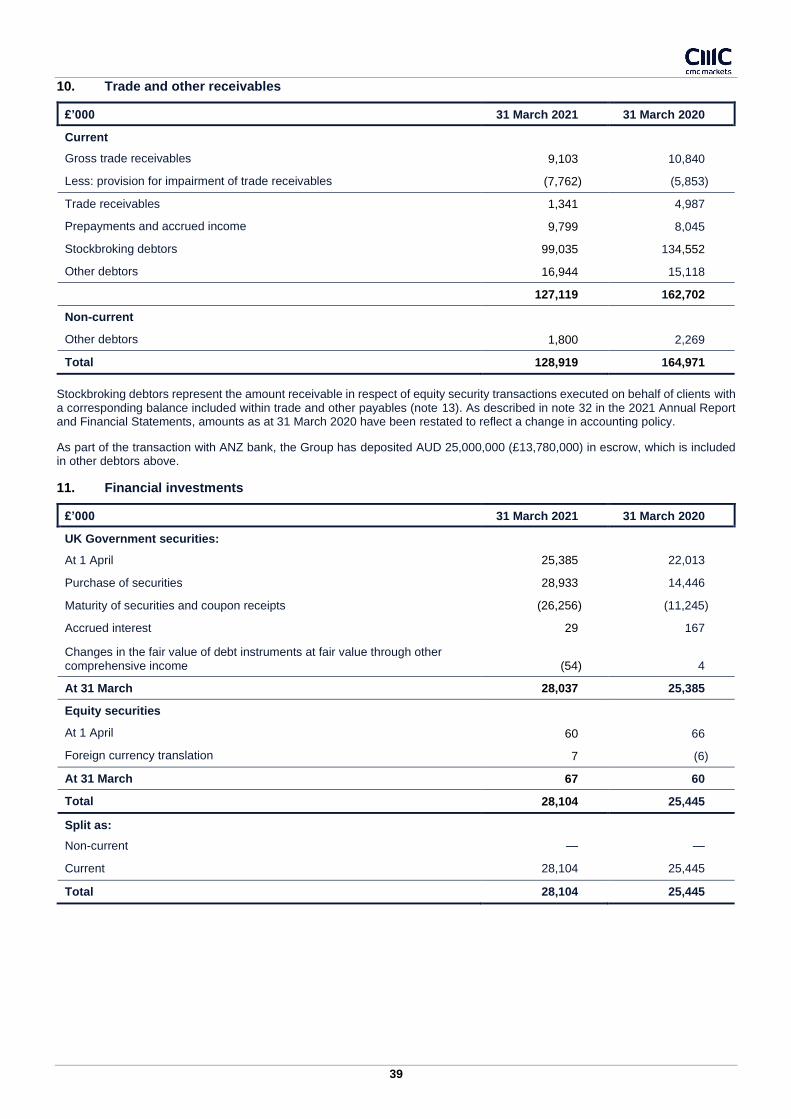
39
10. Trade and other receivables
£’000 31 March 2021 31 March 2020
Current
Gross trade receivables 9,103 10,840
Less: provision for impairment of trade receivables (7,762) (5,853)
Trade receivables 1,341 4,987
Prepayments and accrued income 9,799 8,045
Stockbroking debtors 99,035 134,552
Other debtors 16,944 15,118
127,119 162,702
Non-current
Other debtors 1,800 2,269
Total 128,919 164,971
Stockbroking debtors represent the amount receivable in respect of equity security transactions executed on behalf of clients with a corresponding balance included within trade and other payables (note 13). As described in note 32 in the 2021 Annual Report and Financial Statements, amounts as at 31 March 2020 have been restated to reflect a change in accounting policy.
As part of the transaction with ANZ bank, the Group has deposited AUD 25,000,000 (£13,780,000) in escrow, which is included in other debtors above.
11. Financial investments
£’000 31 March 2021 31 March 2020
UK Government securities:
At 1 April 25,385 22,013
Purchase of securities 28,933 14,446
Maturity of securities and coupon receipts (26,256) (11,245)
Accrued interest 29 167
Changes in the fair value of debt instruments at fair value through other comprehensive income (54) 4
At 31 March 28,037 25,385
Equity securities
At 1 April 60 66
Foreign currency translation 7 (6)
At 31 March 67 60
Total 28,104 25,445
Split as:
Non-current — —
Current 28,104 25,445
Total 28,104 25,445

40
12. Cash and cash equivalents
£’000 31 March 2021 31 March 2020
Gross cash and cash equivalents 668,304 424,077
Less: Client monies (549,383) (339,770)
Cash and cash equivalents 118,921 84,307
Analysed as:
Cash at bank 118,921 84,307
Cash and cash equivalents are short-term, highly liquid investments that are readily convertible to known amounts of cash and which are subject to an insignificant risk of changes in value.
13. Trade and other payables
£’000 31 March 2021 31 March 2020
Current
Gross trade payables 580,062 348,442
Less: Client monies (549,383) (339,770)
Trade payables 30,679 8,672
Tax and social security 236 112
Stockbroking creditors 89,091 115,973
Other creditors, accruals and deferred income 32,247 28,867
152,253 153,624
Non-current
Deferred income — —
Total 152,253 153,624
Stockbroking creditors represent the amount payable in respect of equity security transactions executed on behalf of clients with a corresponding balance included within trade and other receivables (note 10). As described in note 32 in the 2021 Annual Report and Financial Statements, amounts as at 31 March 2020 have been restated to reflect a change in accounting policy.

41
14. Leases
The Group leases several assets including leasehold properties and computer hardware to meet its operational business requirements. The average lease term is 2 years.
The movements in lease liabilities during the year were as follows:
£’000 31 March 2021 31 March 2020
At 1 April 19,273 —
Lease liabilities recognised on adoption of IFRS 16 on 1 April 2019 — 24,433
Additions / modifications of new leases during the year 1,181 1,481
Interest expense 818 1,001
Lease payments made during the year (6,875) (6,747)
Foreign currency translation 929 (895)
At 31 March 2021 15,326 19,273
£’000 31 March 2021 31 March 2020
Analysis of lease liabilities
Non-current 10,727 14,587
Current 4,599 4,686
Total 15,326 19,273
The lease payments for the year ended 31 March 2021 relating to short-term leases amounted to £748,000 (year ended 31 March 2020: £273,000).
15. Cash generated from operations
£’000
Year ended
31 March 2021
Year ended
31 March 2020
Cash flows from operating activities
Profit before taxation 224,010 98,686
Adjustments for:
Interest income (746) (3,345)
Finance costs 1,762 2,052
Depreciation 9,254 9,509
Amortisation of intangible assets 1,985 1,450
Research and development tax credit (728) (223)
Loss on disposal of property, plant and equipment (109) 151
Other non-cash movements including exchange rate movements (908) 666
Share-based payment (2,045) 2,043
Changes in working capital
Decrease / (Increase) in trade and other receivables 59,616 (43,550)
(Increase) / decrease in amounts due from brokers (119,619) (46,241)
(Decrease) / Increase in trade and other payables (24,932) 56,578
Decrease / (Increase) in net derivative financial instruments 2,574 (3,669)
Increase in provisions 1,186 286
Cash generated from operations 151,300 74,393