
6-Food and Water Lab
16
Food and Water – 1 THE MICROBIOLOGICAL EXAMINATION OF FOODS & WATER Foods and water contaminated with pathogenic microorganisms are major avenues for the spread of infectious diseases. In this country, strict state and federal guidelines regulate food and water processing industries, even so, many outbreaks of diseases linked to contaminated foods or water occur every year. Municipal water and food products are routinely monitored for both the total number of microorganisms and presence of pathogens, but there are many challenges to doing so. Even nonpathogens, if present in large enough numbers, can cause deterioration of food products and distaste in water. And testing for all types of pathogens is not practical since we do not know which may be present. The alternative to testing for many different types of pathogens is to test for bacteria that suggest the potential presence of pathogens. This is possible since most pathogen contaminants come from the digestive system of infected humans and animals, which also contain innumerable nonpathogenic bacteria. The presence of these other bacteria in food or water reveals that fecal contamination has occurred (undesirable enough), and a potential presence of pathogens. The most commonly used “indicator bacteria are fecal coliform and fecal enterococci. Coliform Bacteria Certain groups of bacteria serve as INDICATORS of fecal contamination. Indicator bacteria are not themselves pathogenic, but are common denizens of the digestive systems of animals. As a result, indicator bacteria are abundant in feces. COLIFORM bacteria are a widely used group of indicator bacteria. Coliform are defined as Gram-negative aerobic or facultative anaerobes, nonspore-forming, rod shaped bacteria that ferment lactose with acid and gas production. E. coli, an abundant denizen of the human colon, is the most important indicator of human fecal contamination. Some coliform bacteria are of non-fecal origin, such as Enterobacter ae rogenes , which may be naturally present in uncontaminated water of lakes and streams. The presence of indicator bacteria does not mean that human pathogens are definitely present, but their presence means that the fecal contamination has occurred, and that pathogens may be present. Counting bacteria There are two standard methods of counting bacteria: the standard plate count (SPC) and the most probable number (MPN) methods. The SPC is routinely used for samples that have a relatively large number of bacteria, which can be diluted down and grown as a countable number of colonies in a petri plate. The MPN method is used when there is a small number of bacteria, such as in water, where only a few coliform per liter is unacceptable. Summary of exercise
Transcript of 6-Food and Water Lab

7/31/2019 6-Food and Water Lab
http://slidepdf.com/reader/full/6-food-and-water-lab 1/16
Food and Water – 1
THE MICROBIOLOGICAL EXAMINATION
OF FOODS & WATER
Foods and water contaminated with pathogenic microorganisms are major avenues for the
spread of infectious diseases. In this country, strict state and federal guidelines regulate food and
water processing industries, even so, many outbreaks of diseases linked to contaminated foods or
water occur every year.
Municipal water and food products are routinely monitored for both the total number of
microorganisms and presence of pathogens, but there are many challenges to doing so. Even
nonpathogens, if present in large enough numbers, can cause deterioration of food products and
distaste in water. And testing for all types of pathogens is not practical since we do not know which
may be present.
The alternative to testing for many different types of pathogens is to test for bacteria that
suggest the potential presence of pathogens. This is possible since most pathogen contaminants
come from the digestive system of infected humans and animals, which also contain innumerable
nonpathogenic bacteria. The presence of these other bacteria in food or water reveals that fecal
contamination has occurred (undesirable enough), and a potential presence of pathogens. The most
commonly used “indicator bacteria are fecal coliform and fecal enterococci.
Coliform Bacteria
Certain groups of bacteria serve as INDICATORS of fecal contamination. Indicator bacteriaare not themselves pathogenic, but are common denizens of the digestive systems of animals. As
a result, indicator bacteria are abundant in feces. COLIFORM bacteria are a widely used group of
indicator bacteria. Coliform are defined as Gram-negative aerobic or facultative anaerobes,
nonspore-forming, rod shaped bacteria that ferment lactose with acid and gas production. E. coli,
an abundant denizen of the human colon, is the most important indicator of human fecal
contamination. Some coliform bacteria are of non-fecal origin, such as Enterobacter aerogenes,
which may be naturally present in uncontaminated water of lakes and streams. The presence of
indicator bacteria does not mean that human pathogens are definitely present, but their presence
means that the fecal contamination has occurred, and that pathogens may be present.
Counting bacteria
There are two standard methods of counting bacteria: the standard plate count (SPC) and the
most probable number (MPN) methods. The SPC is routinely used for samples that have a
relatively large number of bacteria, which can be diluted down and grown as a countable number
of colonies in a petri plate. The MPN method is used when there is a small number of bacteria, such
as in water, where only a few coliform per liter is unacceptable.
Summary of exercise

7/31/2019 6-Food and Water Lab
http://slidepdf.com/reader/full/6-food-and-water-lab 2/16
Food and Water – 2
1. You will count the total number of bacteria in a sample of spoiled milk using the STANDARD
PLATE COUNT technique.
2. You will perform a coliform count of a water sample using the MOST PROBABLE NUMBER
(MPN) technique.
I. STANDARD PLATE COUNT OF BACTERIA IN FOOD PRODUCTS
The STANDARD PLATE COUNT is the most common method used to quantify bacteria
in foods. To perform a standard plate count, the food to be tested is suspended in liquid and a
sample is then spread over the surface of a solid medium in a petri plate. Bacterial cells present will
form colonies that can be counted to determine the number of cells in the original sample. When
the objective is to estimate the total number of bacteria, a complex medium called Plate Count
Agar is commonly used since it will support growth of many different types of bacteria. We callthe results the number of Colony Forming Units (PFU), not total bacteria. This is because no
single culture medium will support all different types of bacteria, we can only count those that do
grow to form a visible colony.
Serial Dilution of samples
When performing a bacteria count, between 30 and 300 bacterial colonies need to be on the
plate. A minimum of 30 assures that the data is statistically reliable; however, if there are more than
300 colonies are present, competition for nutrients can suppress growth of colonies. For example,
if a sample were to contain 106 cells\ml, a 1 ml sample would contain 106 bacteria – far more than
the 300 cell limit of a standard plate count – and the sample must be serially diluted:
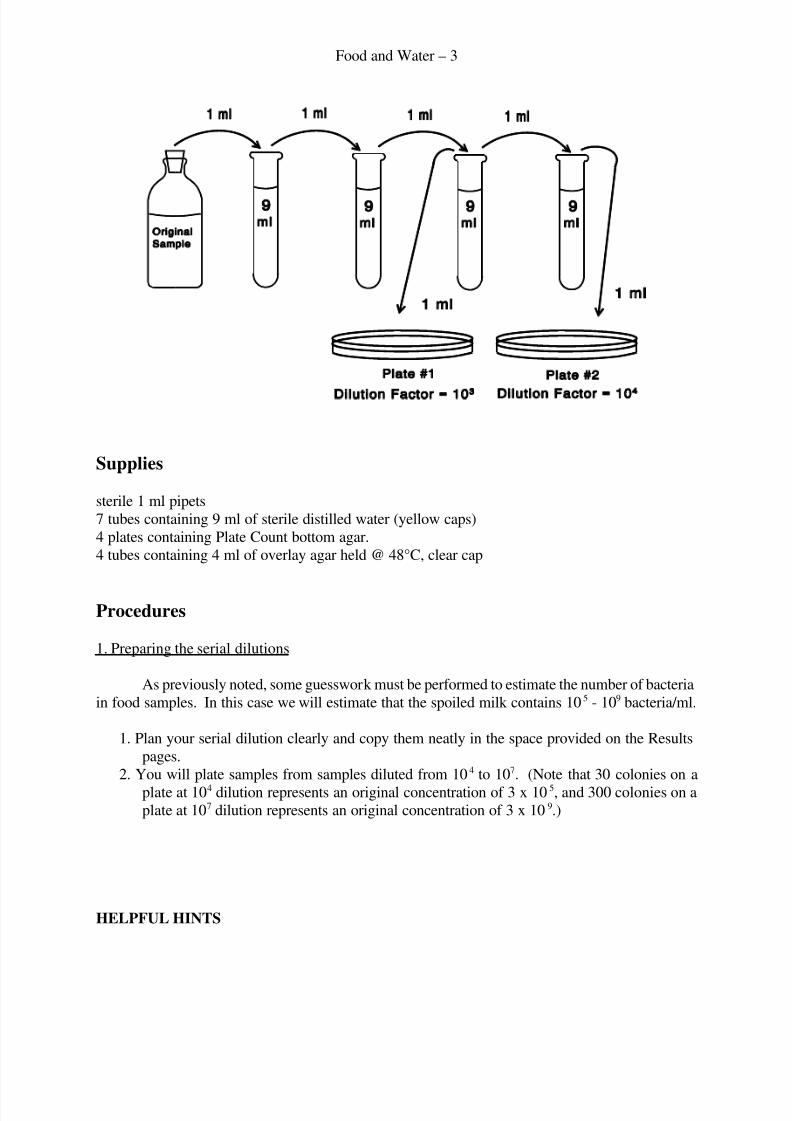
The standard way to dilute a sample in microbiology is through Serial Dilution. As shown in
Figure 1, a sample is diluted step-wise in a series of tubes containing sterile diluent. Each step yields
a particular dilution factor:
Dilution factor for each step =Final volume in the tube
Vol of the sample added to the tube
from which the total dilution of the sample can be calculated:
Total dilution of a sample plated = Product of all dilution steps
Vol of the sample plated
Since the original concentration of bacteria in the milk sample is unknown, we will plate several
dilutions, and hope that at least one will yield between 30- 300 colonies on the plate.
***Do the practice problems at the end of this lab exercise; these must be
turned in with the results of this lab exercise.***
Figure 1. Example dilution series for a sample.
7/31/2019 6-Food and Water Lab
http://slidepdf.com/reader/full/6-food-and-water-lab 3/16
Food and Water – 3
Supplies
sterile 1 ml pipets
7 tubes containing 9 ml of sterile distilled water (yellow caps)
4 plates containing Plate Count bottom agar.
4 tubes containing 4 ml of overlay agar held @ 48°C, clear cap
Procedures
1. Preparing the serial dilutions
As previously noted, some guesswork must be performed to estimate the number of bacteria
in food samples. In this case we will estimate that the spoiled milk contains 105 - 109 bacteria/ml.
1. Plan your serial dilution clearly and copy them neatly in the space provided on the Results
pages.
2. You will plate samples from samples diluted from 104 to 107. (Note that 30 colonies on a
plate at 104 dilution represents an original concentration of 3 x 10⁵, and 300 colonies on a
plate at 107 dilution represents an original concentration of 3 x 10⁹.)
HELPFUL HINTS
7/31/2019 6-Food and Water Lab
http://slidepdf.com/reader/full/6-food-and-water-lab 4/16
Food and Water – 4
When performing your dilutions keep in mind the following points:
1. Be sure to observe aseptic technique, and use a new sterile pipet for each dilution step. Why?
2. THOROUGHLY MIX each tube before preceding with the next dilution step. However, do
not mix so violently that the contents splash near the cap.
2. Plating the diluted samples
A 1 ml sample from the selected tubes will be plated using the AGAR OVERLAY METHOD. This
technique helps to distribute the cells evenly over the plate surface.
1. Label along the edge of the bottom of 4 bottom agar plates with:
a. your name(s) and date
b. the dilution factor of the sample plated
Prepare one overlay at a time following this procedure.2. Working near one of the 45°C water baths, aseptically pipet 1 ml into a tube of soft agar.
3. Mix the overlay thoroughly by rotating the tube between the palms of your hands.
4. Pour the overlay onto the bottom agar, reposition the lid, and gently swirl the plate to
spread the overlay.
5. Return the plate to your bench and allow the overlay to solidify.
6. Incubate all of the plates at 37°C for 24 to 48 hours.
3. Counting the colonies
The colonies can be easily counted with the bacterial colony counters present in thelaboratory. Most of the colonies that form will occur within the agar overlay (i.e., below the
surface); however, you will also see some colonies growing on the surface of the agar. may suppress
formation of colonies and cause an underestimate of the actual bacterial numbers.
1. Place the plate upside down on the colony counter. Turn on the power switch; this will
illuminate the plate from below.
2. Count the colonies while viewing through plate through the magnifying glass mounted
above it.
3. Mark the petri plate over each colony with a marking pen to indicate which colonies have
been counted. Use the Hand tally provided to record the number of colonies counted.
4. When you are done, record your results in Table 1, and properly discard the plates.
4. Calculating the original cell concentration
The concentration of bacteria in the original samples is calculated by multiplying the colony
counts by the total dilution factor. Only plates that contain between 30 and 300 colonies should be
used to calculate the original concentration. If multiple plates fall within this range, then average
the concentrations calculated for each plate.

7/31/2019 6-Food and Water Lab
http://slidepdf.com/reader/full/6-food-and-water-lab 5/16
Food and Water – 5
II. USING THE MOST PROBABLE NUMBER TECHNIQUE TO
COUNT COLIFORM IN WATER
In water, only a few coliform per liter can represent a potential health hazard. In this
situation, the concentration of cells is too low to count with a standard plate count (no cells may be
present within any particular 1 ml sample). The most probable number (MPN) technique is onesolution to this problem.
Theory of Most Probable Number counts
The MPN technique is a statistical method of estimating the concentration of bacteria.
Imagine a situation where a sample of water contains 100 bacteria per 100 ml. If the bacteria were
evenly dispersed throughout the sample, then each 1 ml sample withdrawn would contain 1 cell, and
each 1 ml sample would yield visible bacterial growth when cultured in nutrient broth medium. For
water containing 10 bacteria per 100 ml, bacterial growth would occur for each 10 ml sample
cultured, but in only 1 tube in 10 if 1 ml samples were cultured. Thus, the number of cultures that
show bacterial growth will depend upon the concentration of bacteria and the volume of the sample
being tested. Theoretically, the concentration of bacteria in a sample could be determined by
knowing the minimum volume that yields bacterial growth.
For example, suppose samples of different volumes were withdrawn from a sample of water,
and these samples were each cultured in a broth medium. We might observe the following results:
Volume Number of Number of cultures
cultured samples cultured showing bacterial growth
10 10 5
1.0 20 2
0.1 20 0
Since the smallest sample size that yielded growth was 1.0 ml, and growth occurred in 2 of 20 tubes,
the number of bacteria in the original sample appears to be 2 cells per 20 ml (i.e., 0.1 cell / ml).
In the real world bacteria are randomly but not necessarily evenly distributed in a water
sample. Thus, in our example above, if twenty 1 ml samples were cultured, growth might occur in
fewer or more than 20 tubes. Some tubes in which growth occurs might actually start with 2 or more
cells. If growth occurs, all we know is that at least one viable bacterial cell was present. What a
bummer!
However, since the cells are randomly distributed, statistical techniques can be used to
estimate the number of bacteria in the original sample, i.e., the "most probable number!" A
statistical estimate of the number of bacteria can be obtained from an appropriate statistical table,
such as the one shown below.
Table I. MPN Index when five 10 ml samples, one 1 ml sample, and one 0.1 ml sample are

7/31/2019 6-Food and Water Lab
http://slidepdf.com/reader/full/6-food-and-water-lab 6/16
Food and Water – 6
used.
Number of tubes giving
Positive Reaction (acid + gas)* 95% confidence limits
MPN cells
10 ml 1 ml 0.1 ml per 100 ml Lower Upper
0 0 0 <2 0 5.9
0 1 0 2 0.050 13
1 0 0 2.2 0.050 13
1 1 0 4.4 0.52 14
2 0 0 5.0 0.54 19
2 1 0 7.6 1.5 19
3 0 0 8.8 1.6 29
3 1 0 12 3.1 30
4 0 0 15 3.3 46
4 0 1 20 5.9 48
4 1 0 21 6.0 535 0 0 38 6.4 330
5 0 1 96 12 370
5 1 0 240 12 3700
5 1 1 88
*This table only includes those combinations of positive tubes that occur with a significant
frequency. If the other nine possible combinations occur with a greater frequency than 1%, than
faulty technique should be suspected.
The three stages of the MPN procedure
The MPN technique is used to estimate coliform bacteria (not total bacteria), and thereforeselective and differential media must be used. There are 3 stages to this method:
1. The Presumptive test. The samples are first inoculated into lactose broth containing a Durham
tube. In a positive culture, growth will occur with the production of BOTH acid and gas. Because
few other types of bacteria can ferment lactose and yield acid and gas, a positive presumptive test
is a very good indication of the presence of coliform.
2. The Confirmed test. Some non-coliform bacteria can yield a false positive in the presumptive
test. Thus, all positive lactose broth cultures are subjected to the confirmed test: a loopful of each
culture is streaked onto Eosine Methylene Blue agar (EMB) and inoculated into Brilliant Green
Lactose Bile Broth (BGLBB). EMB is a differential medium; eosine and methylene blue combineto yield a distinctive coloration pattern for coliform bacteria. The presence of bile and brilliant
green in BGLBB make this medium selective for coliform bacteria. A confirmed test is positive
when colonies with a green metallic sheen form on EMB and gas occurs in BGLBB.
3. The Completed test. Cells from an isolated colony on EMB are transferred to an agar slant and
again transferred to lactose broth. If acid and gas are again observed, and Gram-negative rods are
found in the slant culture, then the identification of coliform is considered positive.

7/31/2019 6-Food and Water Lab
http://slidepdf.com/reader/full/6-food-and-water-lab 7/16
Food and Water – 7
Composition of media used in MPN (g/L)
Lactose Broth Brilliant Green Bile Broth
Peptone . . . . . . 10 Peptone . . . . . . 10 g
Beef extct . . . . . 1 Lactose . . . . . . . 10
Lactose . . . . . . . 5 Oxgall (bile) . . . . 20
NaCl. . . . . . . . . . 5 Brilliant green . . . 0.0133
Phenol red . . . . . 0.018
Plate Count Agar Eosine methylene Blue Agar
Casein Digest . . . . 5 Peptone . . . . . . . 10
Yeast Extract . . . . . . 2.5 Lactose . . . . . . . . 10
Glucose . . . . . . 1 K Phosphate . . . . 2.0
Agar . . . . . . . . . 15 Eosine-Y. . . . . . . 0.4
Methylene Blue . 0.065
Agar . . . . . . . . . 15
Supplies:5 Tubes of double-strength lactose broth (green cap)
3 Tubes of single strength lactose broth (Red cap; one of these is for Completed Test)
1 sterile 16mm test tube (Black cap; for collecting water sample)
1 nutrient agar slant, yellow cap
1 ten ml pipet, 2 one ml pipets
1 plate of EMB agar media bottle containing 99 ml of sterile water
1 tube of Brilliant Green Bile Lactose Broth (Blue cap)
Procedures
1. PRESUMPTIVE TEST
We will be continuing the yearly microbiological study of "Goose Run,” the oasis of
water purity that runs through campus. Collect water from the creek behind Marietta Hall.
1. Collect a water sample into the sterile 16mm tube. Return the sample to the lab.
2. Transfer 1 ml of the sample to the bottle containing 99 ml of sterile H2O, and thoroughly
mix the sample. (Previous studies have found such high concentrations of coliform that
we need to dilute the sample first.)
3. Using a 10 ml pipet, aseptically inoculate each tube of double strength lactose broth with
10 ml of the water sample.
4. Using a 1 ml pipet, inoculate one tube containing single strength lactose broth with a 1 ml
volume of the water sample. Using another 1 ml pipet, inoculate a second tube of single
strength lactose broth with a 0.1 ml volume of the water sample.5. Incubate the tubes at 37°C for 48 hours.
6. A positive presumptive test is indicated by the formation of BOTH ACID AND GAS.
Lactose broth is red initially and turns yellow under acidic conditions. Record your
results in Table 2, and determine the MPN of coliform in the water sample from the
MPN table. Multiply this value by 100, the dilution of the original water sample.

7/31/2019 6-Food and Water Lab
http://slidepdf.com/reader/full/6-food-and-water-lab 8/16
Food and Water – 8
2. CONFIRMED TEST
Normally confirmed and completed tests would be run for all positive presumptive tests.
You will run a confirmed test for only one tube showing a positive presumptive test.
1. From a tube containing presumptive coliform, inoculate a tube of Brilliant Green LactoseBile Broth (BGLBB) and streak a plate containing Eosin Methylene Blue (EMB) Agar.
Both media are selective for Gram-negative bacteria.
2. Incubate at 37°C for 48 hours.
3. A positive confirmed test will show the presence of dark centered colonies with a metallic
green sheen. Other non-coliform colonies have different appearances (see table on next
page). Gas formation in BGLBB is also positive. Both tests must be positive for a
positive confirmed test.
4. Record your results in Table 2.
TYPICAL APPEARANCE OF SELECTED BACTERIA ON EMB AGAR
E. coli & Klebsiella pneumoniae: colonies with a dark center and
green metallic sheen
Enterobacter aerogenes: pink colonies with no sheen
Proteus mirabilis & Salmonella typhimurium: colorless colonies
3. COMPLETED TEST
1. From an ISOLATED colony with a typical coliform appearance from your EMB PLATE,
reinoculate a tube of lactose broth and a TSA slant.
2. Incubate both tubes at 37°C for 24 - 48 hours.
3. A positive completed test is indicated by the formation of acid and gas in the lactose broth,
and Gram-negative rods on the nutrient agar.
4. Record your results in Table 2.

7/31/2019 6-Food and Water Lab
http://slidepdf.com/reader/full/6-food-and-water-lab 9/16
Food and Water – 9
Figure 2. Steps of the MPN procedure

7/31/2019 6-Food and Water Lab
http://slidepdf.com/reader/full/6-food-and-water-lab 10/16
Food and Water – 10

7/31/2019 6-Food and Water Lab
http://slidepdf.com/reader/full/6-food-and-water-lab 11/16
Food and Water – 11
NAME: _________________________
In a fashion similar to Figure 1, diagram (neatly) the dilution series you used for your Standard
Plate Count, and identify the dilution factor for each tube and the total dilution factor for each plate.

7/31/2019 6-Food and Water Lab
http://slidepdf.com/reader/full/6-food-and-water-lab 12/16
Food and Water – 12
Do the practice problems on pages 14 & 15 first.
wwIndicate where your results do not agree with your expectations, and write a brief explanation
of the discrepancyww
NOTE: The subsurface colonies are very small; they look like little dots in the medium; count these
and any surface colonies.
Table 1. Standard plate count of milk sample
Plate1 Plate 2 Plate 3 Plate 4
Dilution Factor
Colony Count
Cell concentration*(viable cells / ml)
Note: express values using appropriate scientific notation (e.g., 2.3 x 10⁵)
Which plates had a countable (between 30 - 300) number of colonies?
What is the concentration of bacteria in the original milk sample? (average plates if appropriate)
If you did not get 30 - 300 colonies on any of your plates, what dilutions do you think might have
yielded an appropriate number of colonies?
7/31/2019 6-Food and Water Lab
http://slidepdf.com/reader/full/6-food-and-water-lab 13/16
Food and Water – 13
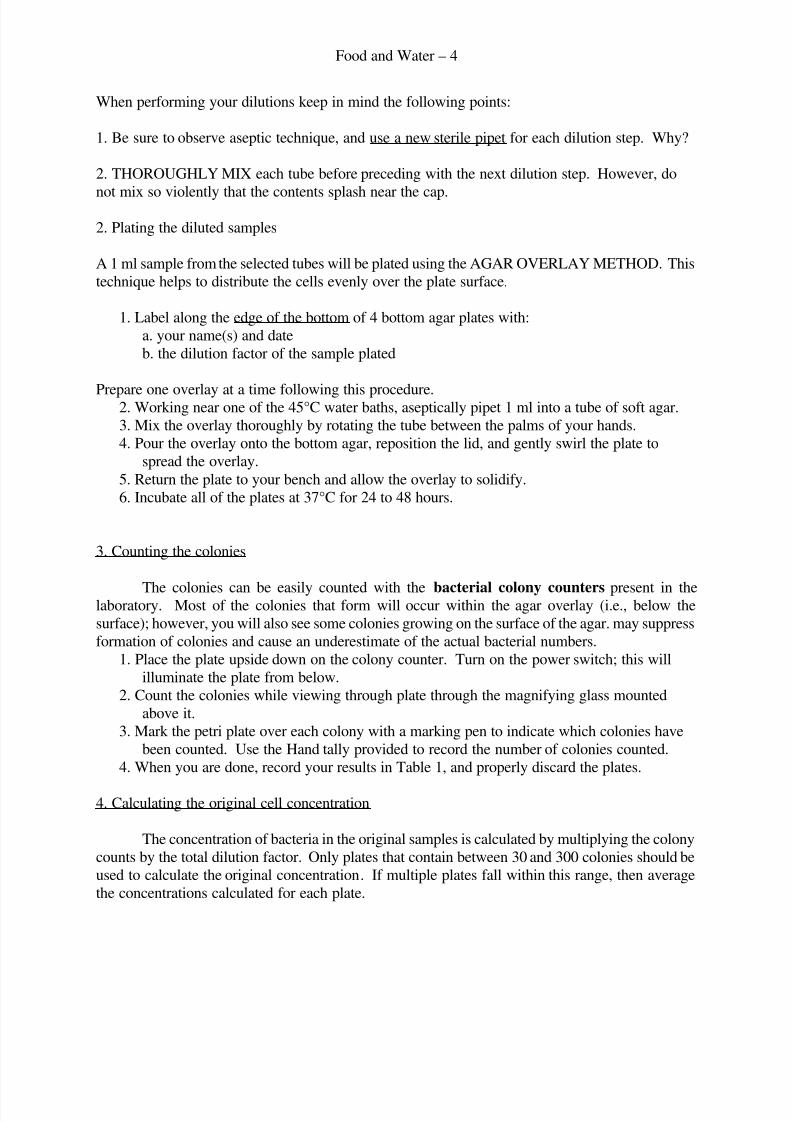
Results of MPN tests
Table 2. Presumptive Test
Tube 1 Tube 2 Tube 3 Tube 4 Tube 5
Tubes receiving: ACID GAS ACID GAS ACID GAS ACID GAS ACID GAS
10 ml samples
1.0 ml sample
O.1 ml sample
Number of positive tubes (acid + gas)
10 ml samples ________
1.0 ml sample ________
0.1 ml sample ________
MPN (from Table I) = _______ x 100 (dilution factor) = _______ cells/100 ml
RESULTS OF CONFIRMED TEST RESULTS OF COMPLETED TEST
Did any colonies on EMB Were acid and gas produced in
have a green metallic sheen? the lactose broth? yes / no
yes / no
Was gas produced in BGLBB? Appearance of cell on the agar slant:
cell shape: __________
yes / no Gram-reaction: __________
Was your confirmed test positive? Was your completed test positive?
yes / no yes / no
Also turn in an answer to this question: (typed)
The SPC and MPN techniques have advantages and disadvantages for different types of samples.
For which situations is each technique best suited (and explain why), and why would the other
technique be less useful?

7/31/2019 6-Food and Water Lab
http://slidepdf.com/reader/full/6-food-and-water-lab 14/16
Food and Water – 14
1. What is the equation used to calculate
... an individual dilution factor:
... a total dilution factor:
2. When ___ of a sample is combined
with ____ of media the
dilution factor is ____
1 ml 9 ml ______
4 ml 4 ml ______
5 ml 15 ml ______
2 ml 8 ml ______
If the above were performed as a series, the total dilution factor would be _______________.
3. Based upon the dilution series shown here:
A. The total dilution factors are: (show calculation)
Plate A: ______________
Plate B: ______________
B. Which plate has a countable
number of colonies? ____
C. What would have been the original
concentration of bacteria?
_________________ (Show calculation)

7/31/2019 6-Food and Water Lab
http://slidepdf.com/reader/full/6-food-and-water-lab 15/16
Food and Water – 15
4. Based upon the dilution series shown here:
A. Write in the dilution factor for each tube.
B. What is the total dilution factor for each plate?
(show calculations)Plate A: ______________
Plate B: ______________
C. What is the expected number of colonies on each plate?
(show calculations) .
Plate A: ______________
Plate B: ______________
Which plate has a countable number of colonies? ______
5. Based upon the dilution series shown
here:
A. Write in the dilution factor for eachtube.
B. What is the total dilution factor for the
plate? (show calculation)
C. What would be the bacteria concentration in the original tube? _________________
(show calculation)

7/31/2019 6-Food and Water Lab
http://slidepdf.com/reader/full/6-food-and-water-lab 16/16
Food and Water – 16