
6. ERP analysisoverview 2012
22
Design and ERP data: Basic concepts Caitlin M. Hudac© Graduate student, Developmental Brain Laboratory 1
Transcript of 6. ERP analysisoverview 2012

Design and ERP data: Basic concepts Caitlin M. Hudac© Graduate student, Developmental Brain Laboratory
1

Describe ERPs in terms of.. • Peaks (positive or negative) • Latency (post stimulus onset) • Duration (e.g., slow wave) • Scalp topography (maximal peak location) • Source (location within the brain)
Remember that: • Current flow across the scalp • Produces latency shiAs from one part of scalp to another • Also produces amplitude shiAs across scalp • Signals sum across the scalp
• large posiFve wave on scalp meeFng large negaFve wave could sum to flat line!
2

What info do we collect?
• Time
3
• Space • 2D: Scalp topographies • 3D: Source esFmaFon
• Person-‐specific characterisFcs • Demographics: Age, gender, SES, etc. • Constructs: Reading ability, temperament, emoFon regulaFon, social responsiveness, IQ, etc.

Time: Components
4
P1 / P50 / P70 • Peak amplitude and latency decrease with age (disappear, even) • P50: Auditory inhibition à Sensory gating: 2 clicks presented
quickly. 1st amplitude < 2nd amplitude. Reduced suppression in schizophrenia, neurodegenerative diseases.
• P1: Use pattern reversal (e.g. Plickering checkerboard) task. Largest over occipital regions. May relate to attention / arousal.
Time: Components
5
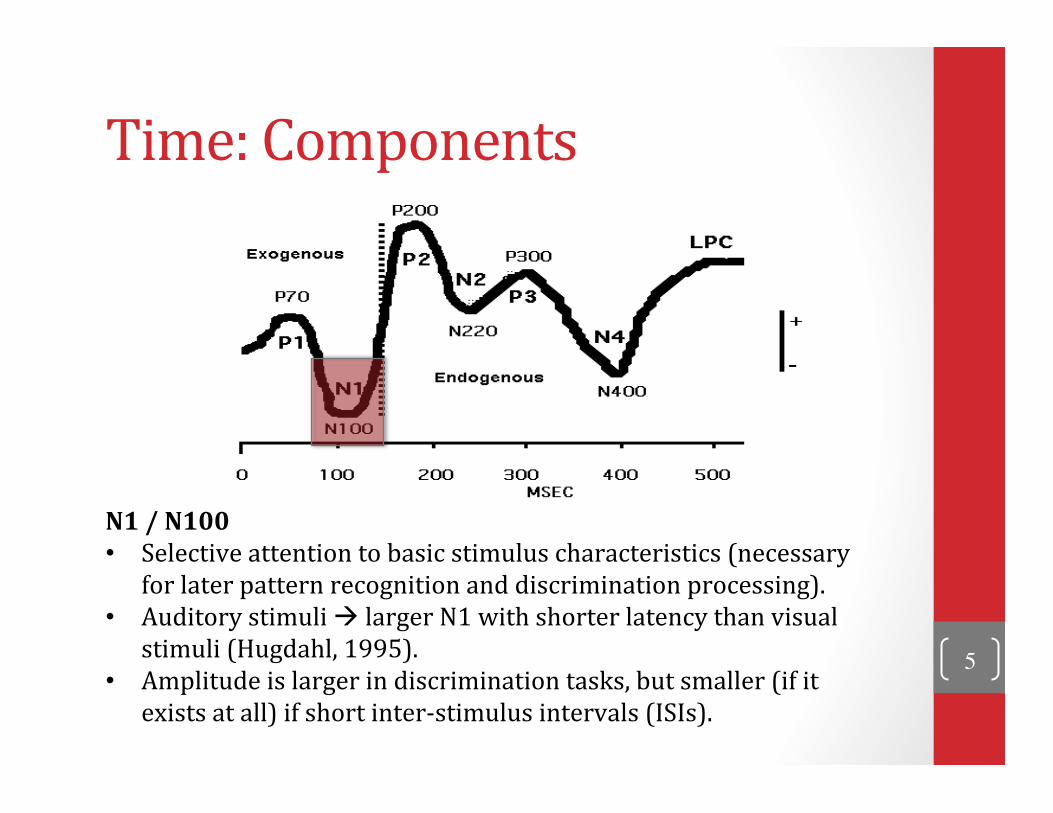
N1 / N100 • Selective attention to basic stimulus characteristics (necessary
for later pattern recognition and discrimination processing). • Auditory stimuli à larger N1 with shorter latency than visual
stimuli (Hugdahl, 1995). • Amplitude is larger in discrimination tasks, but smaller (if it
exists at all) if short inter-‐stimulus intervals (ISIs).

Time: Components
6
P2/ P200 • Low inter-‐individual variability and high replicabilty. • Often occurs together with the N1, yet peaks can be dissociated. • Can be double-‐peaked. • Amplitude increases with complexity of stimuli.
Time: Components
7
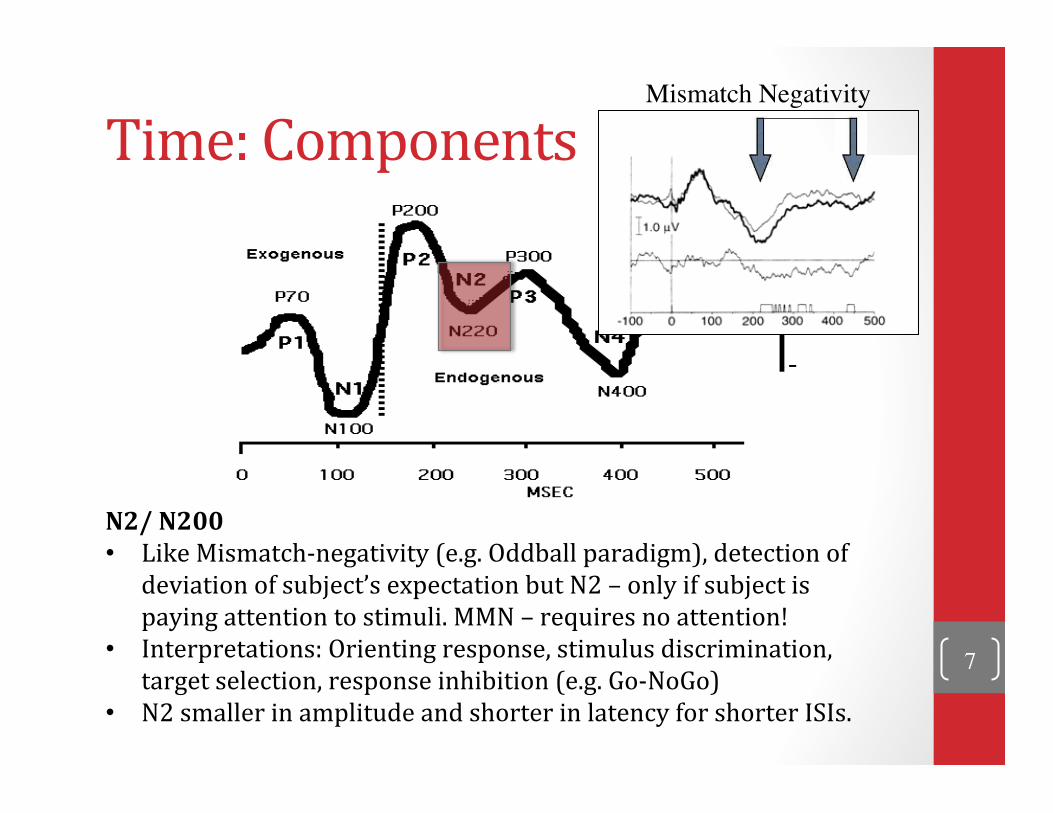
N2/ N200 • Like Mismatch-‐negativity (e.g. Oddball paradigm), detection of
deviation of subject’s expectation but N2 – only if subject is paying attention to stimuli. MMN – requires no attention!
• Interpretations: Orienting response, stimulus discrimination, target selection, response inhibition (e.g. Go-‐NoGo)
• N2 smaller in amplitude and shorter in latency for shorter ISIs.
Mismatch Negativity

Time: Components
8
N170 • Human face-‐processing (face vs. natural or human-‐made
objects) • Turns out, not speciPic to faces but to expert object recognition!
(Tanaka & Curran, 2001)
Jacques & Rossion, 2004
Time: Components
9
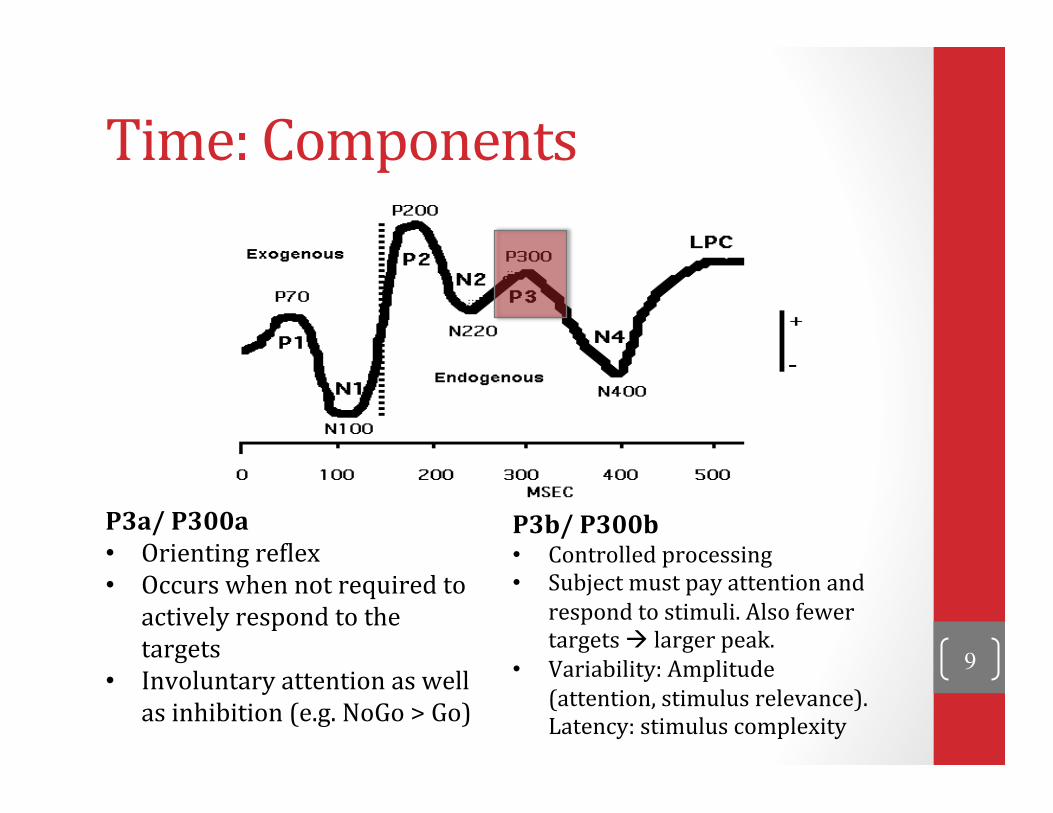
P3a/ P300a • Orienting rePlex • Occurs when not required to
actively respond to the targets
• Involuntary attention as well as inhibition (e.g. NoGo > Go)
P3b/ P300b • Controlled processing • Subject must pay attention and
respond to stimuli. Also fewer targets à larger peak.
• Variability: Amplitude (attention, stimulus relevance). Latency: stimulus complexity
Time: Components
10
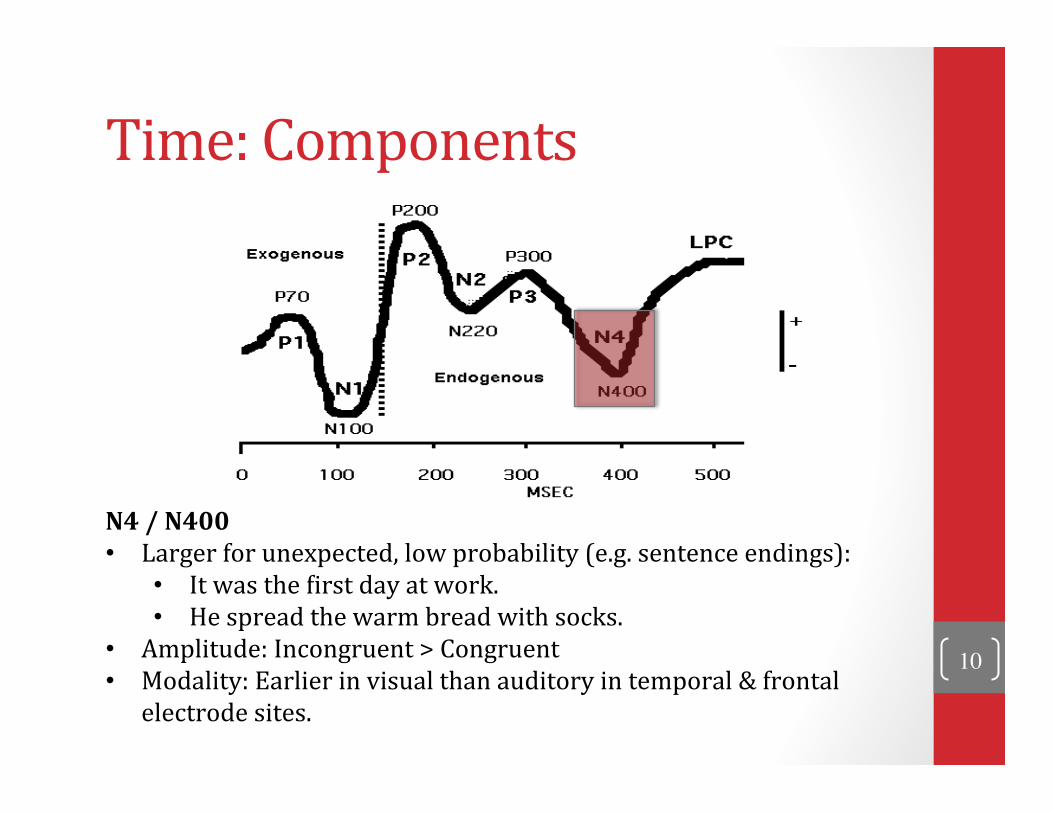
N4 / N400 • Larger for unexpected, low probability (e.g. sentence endings):
• It was the Pirst day at work. • He spread the warm bread with socks.
• Amplitude: Incongruent > Congruent • Modality: Earlier in visual than auditory in temporal & frontal
electrode sites.

Time: Components
11
Late positive component • Explicit and implicit recognition memory: (e.g. “Old/new”
effect).

Time: Components – Statistics? • How do we decide what part of Fme to look at?
• A priori • Principal Components Analysis
12
12-Year-Old n=68
ms 0 100 200 300 400 500 600 700
Centroid
Factor 1
Factor 2
Factor 3
Factor 4
Factor 5
Factor 6
Total Variance
31%
15%
8.4%
6.6%
5.7%
4.7%

Time: Components – Statistics? • How do we decide what part of Fme to look at?
• A priori • Principal Components Analysis
13
12-Year-Old n=68
ms 0 100 200 300 400 500 600 700
Centroid
Factor 1
Factor 2
Factor 3
Factor 4
Factor 5
Factor 6
Total Variance
31%
15%
8.4%
6.6%
5.7%
4.7%
Centroid
Factors

Space (and Time) • Electrode sites: Which sites reflect the variance in the ERP waveform?
• Example: PaVern-‐reversal task (800msà 4000ms)
14
No Prisms With Prisms
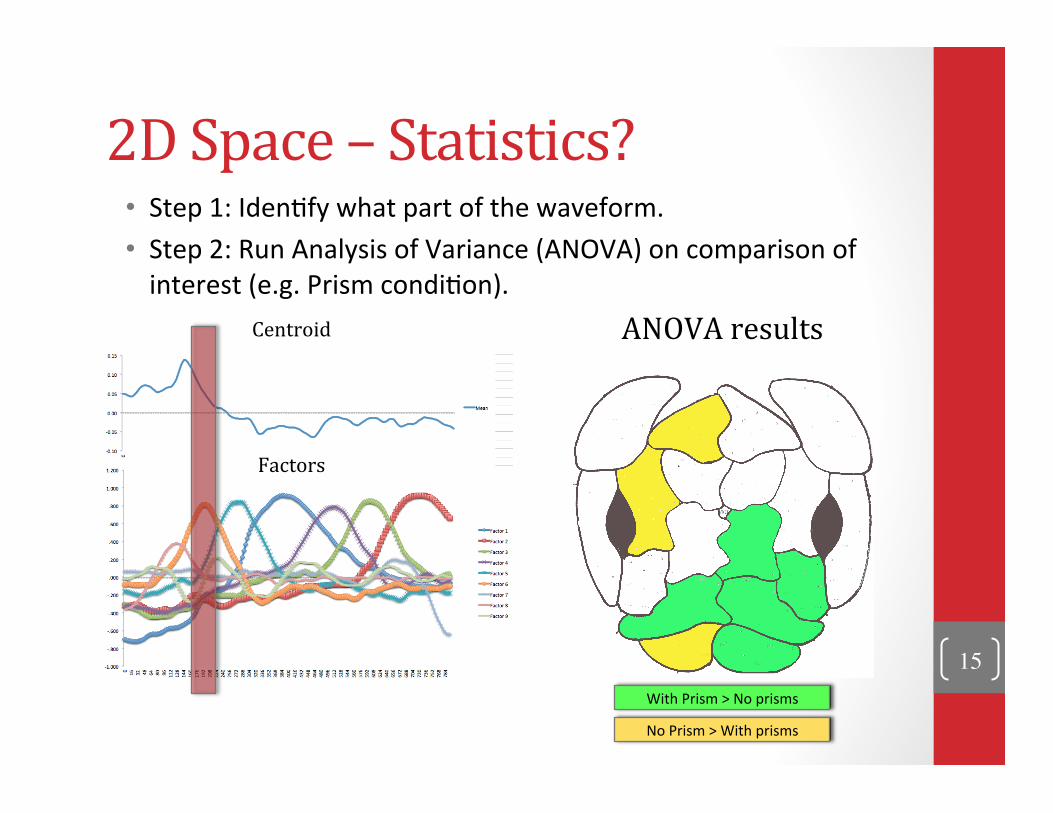
2D Space – Statistics? • Step 1: IdenFfy what part of the waveform. • Step 2: Run Analysis of Variance (ANOVA) on comparison of interest (e.g. Prism condiFon).
15
Centroid
Factors
ANOVA results
No Prism > With prisms
With Prism > No prisms

• Step 1: IdenFfy what part of the waveform. Base upon temporal PCA factors and ANOVA results.
3D Space – Source Localization
16
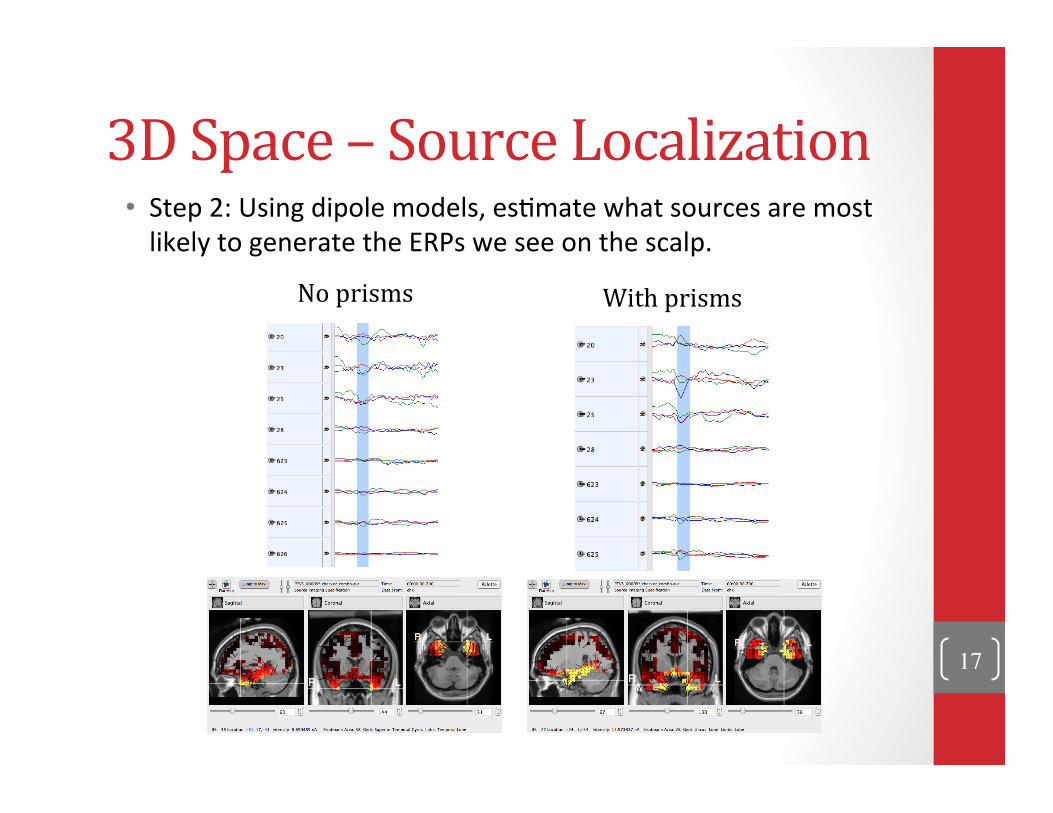
• Step 2: Using dipole models, esFmate what sources are most likely to generate the ERPs we see on the scalp.
3D Space – Source Localization
17
No prisms With prisms

• Step 3: Direct comparison of all dipoles across variable (e.g. prism condiFon).
3D Space – Source Localization
18
No Prisms
• Somatosensory • Primary somatosensory cortex • Primary motor cortex • Premotor cortex • Frontal eye fields • Polysensory associaFon center • Primary gustatory cortex
• Language • Broca’s area • Wernicke’s area
• ExecuFve and Memory • Prefrontal cortex • Dorsolateral prefrontal cortex
With Prisms
• Vision • V1 • V2 • V3
• SemanFc • Hippocampus • Parahippocampus • Cingulate cortex

Person-‐speciPic characteristics • How are people different?
• Across development – infants vs children vs adults • Cross-‐secFonal – different individuals of the same age • Longitudinal – same individuals at different ages/Fmes
• Gender • SES • Amount of sleep • CogniFve abiliFes
• IQ • Reading ability • Task performance
19

Increasing Positive Voltage
Increasing Negative Voltage
Yellow
Dark Blue
Purple
Red
20

Neonate
ERP to speech syllable “ba” Adult
21

22
QUESTIONS ???