
5d. Process Capabiity
23
Process Capability Prof G R C Nair
-
Upload
sagar-shah -
Category
Documents
-
view
236 -
download
0
Transcript of 5d. Process Capabiity

Process Capability
Prof G R C Nair

What’s the Difference?
ProcessControl
ProcessCapabilityvs
What about “consistent and predictable junk”?
Prof G R C Nair
Process Control – ability of a process to produce a predictable set of outputs having more or less the same characteristics

Customer Specifications (Engineering Tolerance):
USL - Upper Specification Limit
LSL - Lower Specification Limit
LSL USL
-3 -2 -1 +1
+2 +3
Process Capability StudyActual (Natural)Process Variation: 6 Standard Deviations = + 3
Prof G R C Nair

ExampleConsider two parts run on the same machine. Thenatural process variation for part A is the same for partB, but the tolerances are different.
CAPABILITY
TOLERANCE PART A
TOLERANCE PART B
Prof G R C Nair
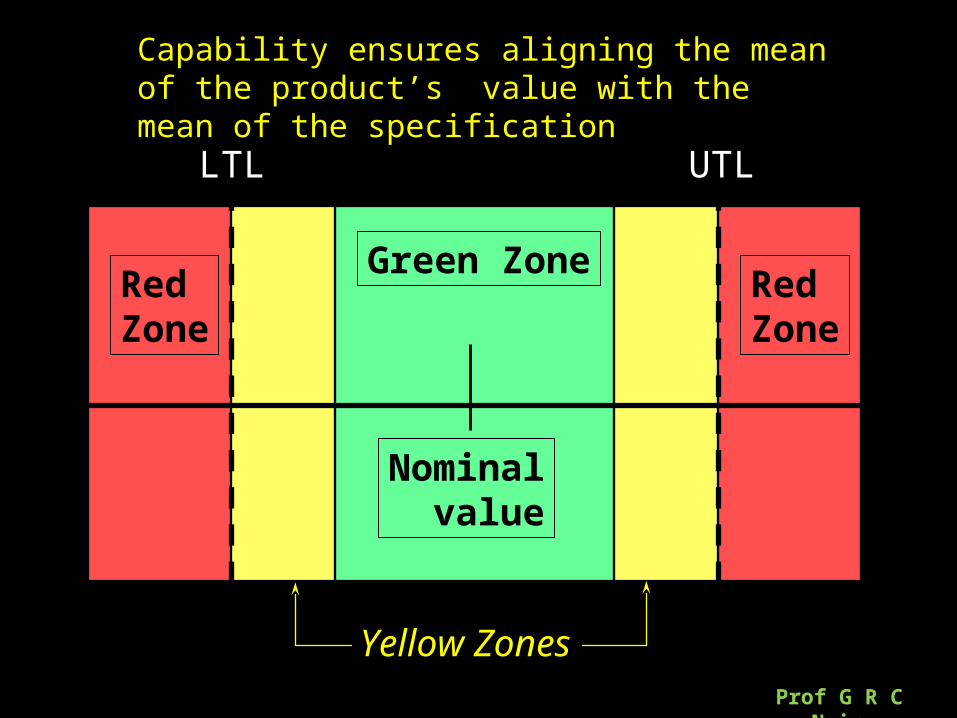
Nominal value
Green Zone
Yellow Zones
RedZone
RedZone
LTL UTL
Prof G R C Nair
Capability ensures aligning the mean of the product’s value with the mean of the specification

ExampleScrap and/or rework is inevitable for Part B
CAPABILITY
TOLERANCE PART A
TOLERANCE PART B
Prof G R C Nair

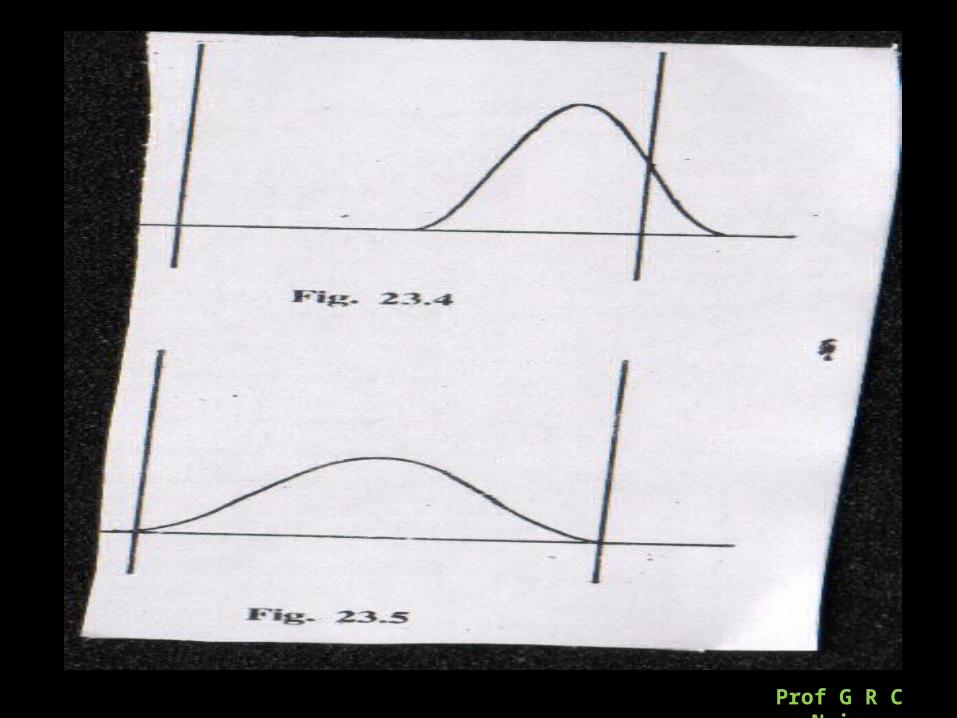
TroubleshootingIf the process is in statistical control but not capable of meeting specifications, any one of the following (or both) could be the problem:
a) Process variability is too large relative to tolerances
L S L U S L
Scrap/Rework
Prof G R C Nair

b) Process is not centered at nominal (target)
LSL USLNominal
Scrap/Rework
B
Prof G R C Nair

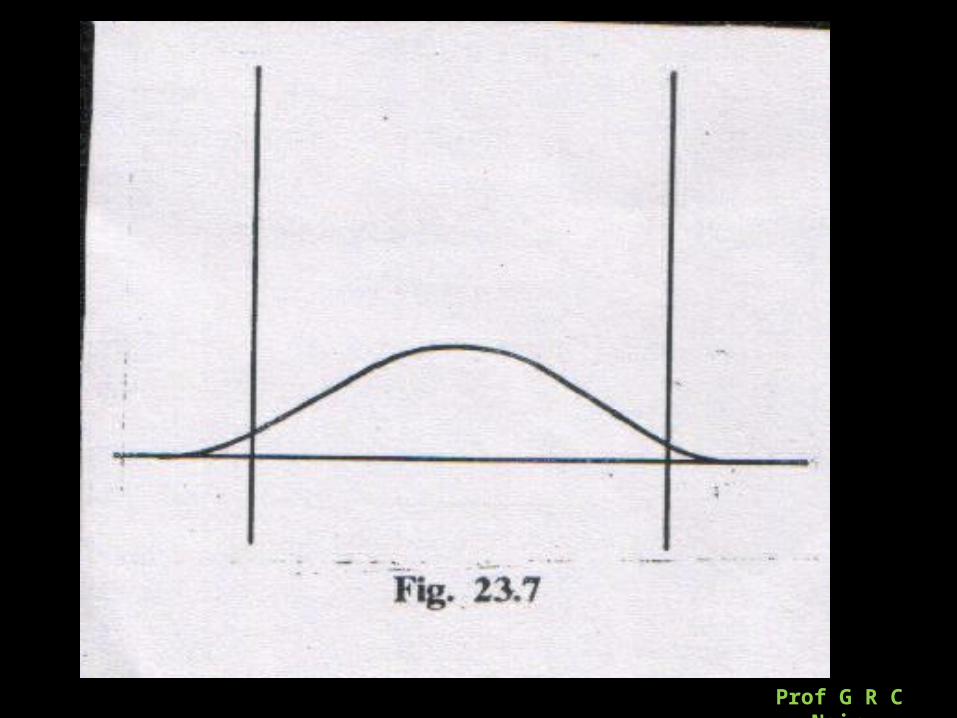
Troubleshooting Process is just capable
Must remain centred at all times. Needs to be watched carefully .
L S L U S L
Prof G R C Nair

Remedies
Continue to sort by 100% inspection
Use a different process to reduce process variation
Widen the tolerances (specification limits)
Use statistical methods to determine how to reduce the natural variation of the process
Prof G R C Nair

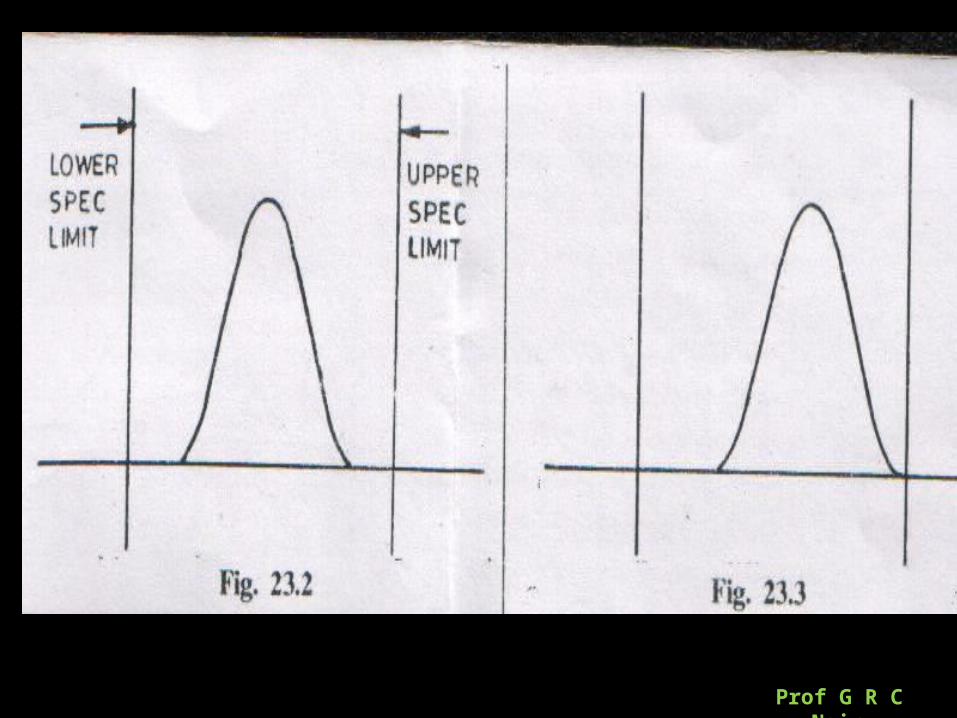
Process Capability• If the process is capable of consistently
giving quality product as per the specification, the process is said to possess the required capability.
• The natural tolerance limits of the process should be with in the specification /tolerance limits.
Prof G R C Nair
Prof G R C Nair

Prof G R C Nair
•
Prof G R C Nair
•
Prof G R C Nair

Relationship between Capability and Control
Process Capability is not the same as the statistical control
• However, a process must be in statistical control before an assessment of process capability can occur
Prof G R C Nair

Specification Limits vs. Control Chart LimitsSpecification LimitsSpecification Limits
characteristic of the part/item in question based on functional considerations related to/compared with an individual part
measurement used to establish a part’s conformability Should not appear on control charts
Control LimitsControl Limits characteristic of the process in question based on the process variability dependent upon sampling characteristics, namely,
sample size used to identify presence/absence of significant
variation in the processProf G R C Nair

• For a process, n = 7, K= 30 ∑ X = 157.95 ∑R=22.275
• Specification of the part to be made is 5+1.25mm. Is the process capable of giving the required quality?
Exercise
Prof G R C Nair

Ans: First find the R & X X = 5.265mm, R = 0.7425Then find the process capability (natural tolerance limits).
=R/d2 = 0.2746
Natural tolerance limits of the out put = X + 3 = 4.44 to 6.08 mmDesired /Specification tolerance limits = 3.75 to 6.25 mmAs the natural tolerance limits of the process are well within thespecified limits ,the process is capable of giving the quality specified, (if it is in control.)
Prof G R C Nair

1. Capability Index Cp = USL-LSL 6
If Cp < 1, the process is not capable of giving the consistent quality- causes rejectionIf Cp > 1, the product will have consistent quality but still can give rejects , if the process mean is not centred at or near the specification mean.Cp value can be increased by reducing the or variation in products or enlarging the tolerance
Process Capability Indices
Prof G R C Nair

2. Capability Index Cpk takes care of the centring aspect as wellCpk= Min of {(USL-Xbar) or (Xbar –LSL)}
3If Cpk >1, the process is considered capable of meeting the specs- it will produce < 0. 27% scrap.If Cpk< 1, it will produce > 0.27% scrap.
Prof G R C Nair
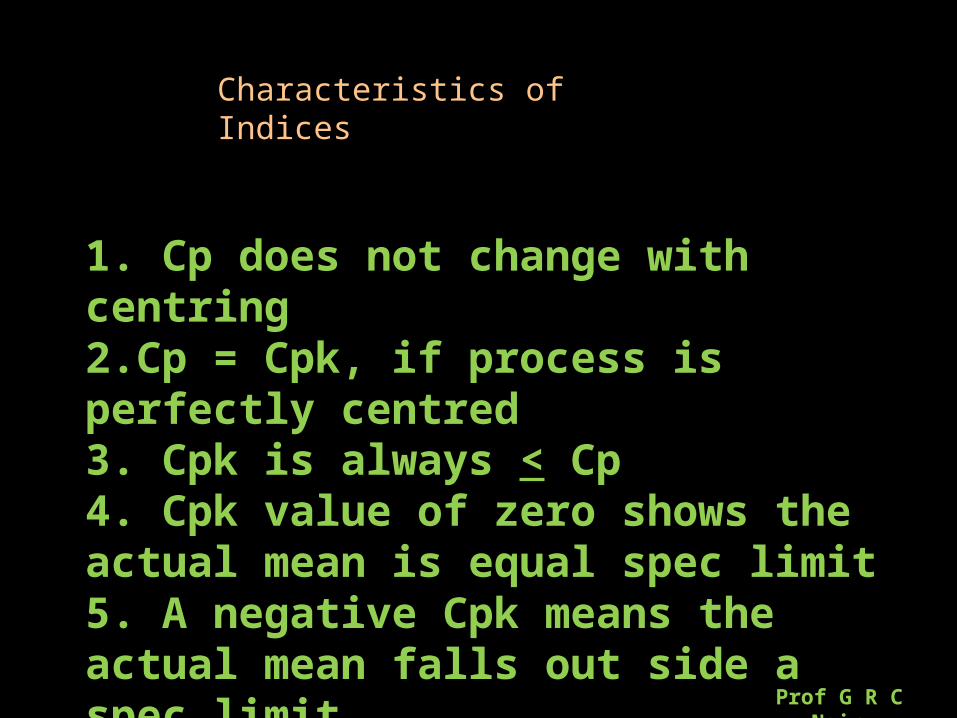
1. Cp does not change with centring2.Cp = Cpk, if process is perfectly centred3. Cpk is always < Cp4. Cpk value of zero shows the actual mean is equal spec limit5. A negative Cpk means the actual mean falls out side a spec limit
Characteristics of Indices
Prof G R C Nair

A job has a design specification of 15 + 0.6Find Cp and Cpk, if a process produces,a) 15 + 0.7b) 14 + 0.2c) 15.6 + 0.3d) 15 + 0.3Rank the processes in the order of minimum scrap they produce
Example
ans : take in each case 3 as max variation.a) Cp= 6/7, Cpk = 6/7b) =3 = -2c) =2 = 0d) =2 = 2
Prof G R C Nair


](https://static.fdocuments.in/doc/165x107/5562ac71d8b42a7c4a8b51ad/presentation15-b15d5b15d1carolina-panthersgalea.jpg)

![Proyecto de la_normal_2%5_b1%5d%5b1%5d[1]](https://static.fdocuments.in/doc/165x107/5561e5bad8b42af10c8b4d0b/proyecto-de-lanormal25b15d5b15d1.jpg)

![Diverticulosis%5B1%5D %5BAutosaved%5D[1]](https://static.fdocuments.in/doc/165x107/577d38db1a28ab3a6b989f85/diverticulosis5b15d-5bautosaved5d1.jpg)
