by Dr. Krzysztof Ostaszewski, FSA, CERA, FSAS, CFA, MAAA ...

Session 59, Assumption Setting Under VM‐20
Moderator:
Karen K. Rudolph, FSA, MAAA
Presenter: Carrie Lee Kelley, FSA, MAAA
Richard Nam, FSA, MAAA, CERA Karen K. Rudolph, FSA, MAAA

Richard Nam FSA, CERA, MAAA
VM-20 Mortality Overview

Mortality by Reserve Calculation
Net Premium Reserve
DeterministicReserve
Stochastic Reserve
Section of Valuation Manual
VM-20 Section 3.C.1VM-M
VM-20 Section 9.CVM-M
MortalityAssumption
2001 CSO or 2017 CSO
Prudent Estimate Mortality Assumption using 2008 VBT or 2015 VBT
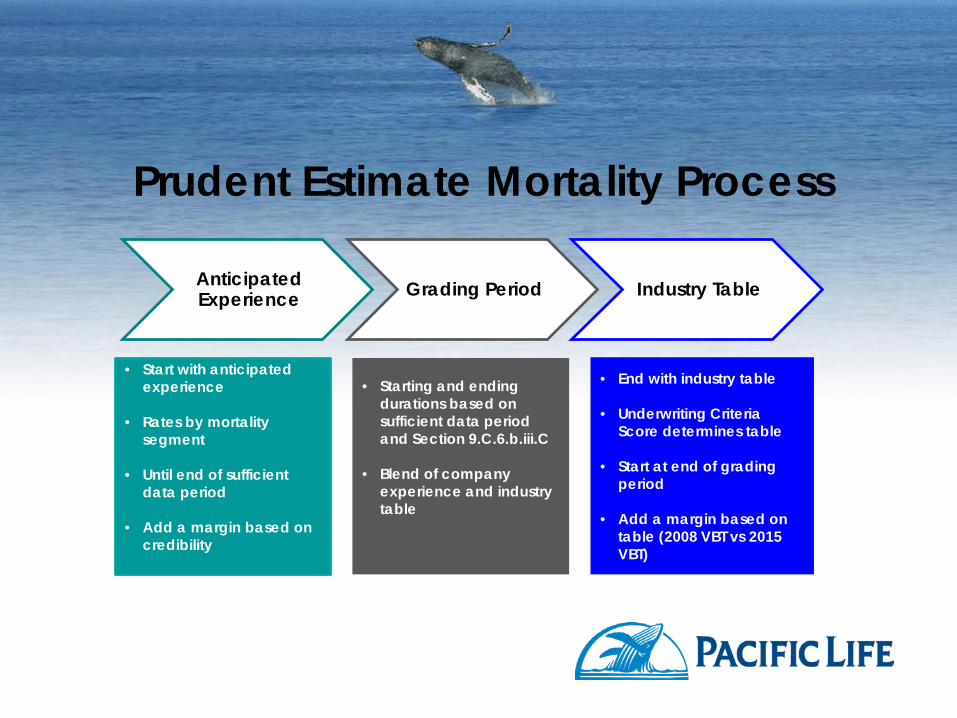
Prudent Estimate Mortality Process
Anticipated Experience Grading Period Industry Table
• Start with anticipated experience
• Rates by mortality segment
• Until end of sufficient data period
• Add a margin based on credibility
• Starting and ending durations based on sufficient data period and Section 9.C.6.b.iii.C
• Blend of company experience and industry table
• End with industry table
• Underwriting Criteria Score determines table
• Start at end of grading period
• Add a margin based on table (2008 VBT vs 2015 VBT)

Mortality Segments
Separate groups of policies by expected mortality experience
• Gender• Smoker status• Underwriting class• Age• Etc.
Based on company’s underwriting standards and mortality experience

Anticipated Experience
Based on actual experience for each segment• Company experience for that business• Company experience for business with similar
underwriting• Experience data from other sources
Review at least every three years May include mortality improvement only until the
valuation date Margins based on credibility

Margins for Anticipated Experience
Prescribed Margins Additional MarginsSection 9.C.5.b• 2008 VBT vs. 2015 VBT• Method for determining credibility• Credibility Level• Attained Age
Section 9.C.5.d• Low reliability of company data• Long time since experience data
updated• Underwriting has changed• Experience data lacks
homogeneity• Unfavorable environmental
developments• Changes to marketing or
administrative processes• Ineffective underwriting
Grading
Sufficient data period• Last policy duration with 50 or more claims
Grade linearly from company experience mortality rates to industry table rates
Grading start and end based on tables in Section 9.C.6.b.iii.C

Industry Table
2008 VBT or 2015 VBT Underwriting Criteria Score tool Margins based on table chosen and attained age
• Section 9.C.5.c Mortality improvement allowed up to valuation
date
Underwriting Criteria Score Tool
https://www.soa.org/Research/Experience-Study/Ind-Life/Valuation/2015-underwriting-criteria-calculator.aspx
Determine the appropriate industry basic table for a mortality segment
Company may adjust the industry basic table up or down two tables
Company may use other actuarially sound methods to determine appropriate basic table
Considerations
Documentation in PBR report Practice Notes for reference Updates to Valuation Manual and Underwriting
Criteria Score

Carrie Kelley, FSA, MAAAAugust 30, 2016
VM-20 Mortality Assumption ExampleValuation Actuary Symposium Session 59PD
© 2016 Willis Towers Watson. All rights reserved.
VM-20 Prescribed Approach to set Mortality Assumptions
© 2016 Willis Towers Watson. All rights reserved. Proprietary and Confidential. For Willis Towers Watson and Willis Towers Watson client use only. 2
Mortality segment
Company experience mortality rates
Applicable industry table
Level of credibility
Prescribed mortality margin
Prudent assumption

Mortality segmentStep 1
Expect mortality to vary by several factors, possibly including: Risk class Smoking status Face amount band Gender Distribution channel Underwriting type, etc.
Example – risk class and gender are key variables
1 2 3 4 5 6
© 2016 Willis Towers Watson. All rights reserved. Proprietary and Confidential. For Willis Towers Watson and Willis Towers Watson client use only. 3

Company experience ratesStep 2a
Example: Consistent with segment definitions, split experience by smoking status and gender
% A / E Based on 2015 VBT (SM / NS)Smoking Status Female – Raw Male – Raw
Female –After HMI*
Male –After HMI*
Non-smoker 80% 85% 78% 82%
Smoker 100% 110% 97% 107%Figures are illustrative, not based on any company experience*1% improvement for 3 years
1 2 3 4 5 6
© 2016 Willis Towers Watson. All rights reserved. Proprietary and Confidential. For Willis Towers Watson and Willis Towers Watson client use only. 4

Company experience ratesStep 2b
Example: Split FNS across risk classes
Note: Make sure weighted average is at least as great as aggregate factor
% A / E Based on 2015 VBT
Smoking Status Raw A/E Weight
RelativeFactor
ExperienceFactor
Best NS 59% 45% 80% 62%*
2nd Best NS 83% 35% 100% 78%
Residual NS 111% 20% 145% 113%
Total NS 78% 100% 100% 78%Figures are illustrative, not based on any company experience*62% = 80% * 78%
1 2 3 4 5 6
© 2016 Willis Towers Watson. All rights reserved. Proprietary and Confidential. For Willis Towers Watson and Willis Towers Watson client use only. 5
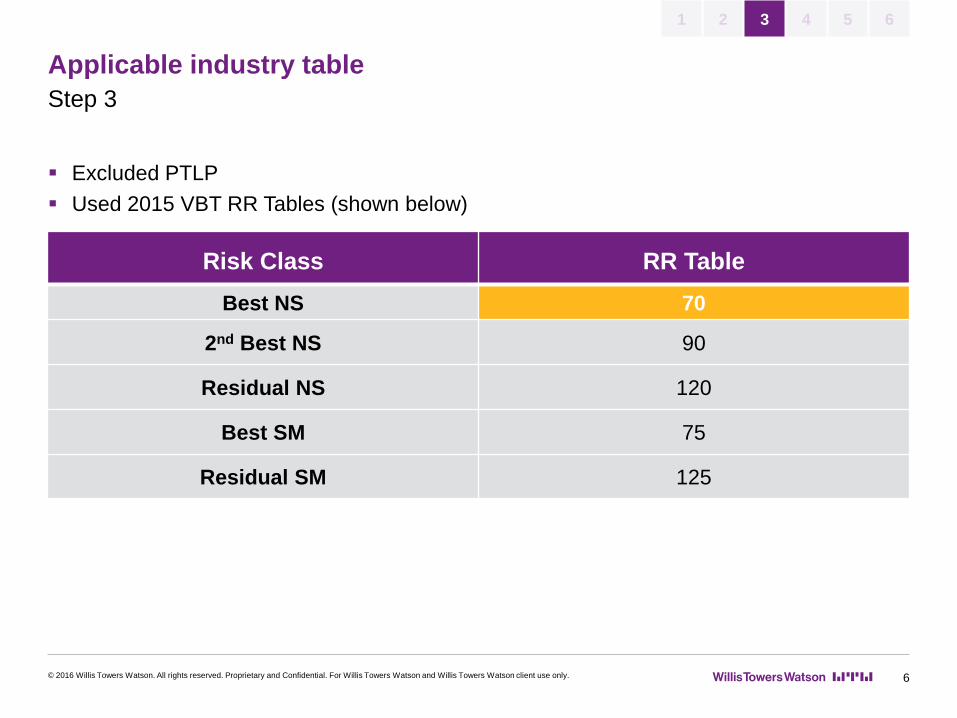
Applicable industry tableStep 3
Excluded PTLP Used 2015 VBT RR Tables (shown below)
Risk Class RR TableBest NS 70
2nd Best NS 90
Residual NS 120
Best SM 75
Residual SM 125
1 2 3 4 5 6
© 2016 Willis Towers Watson. All rights reserved. Proprietary and Confidential. For Willis Towers Watson and Willis Towers Watson client use only. 6
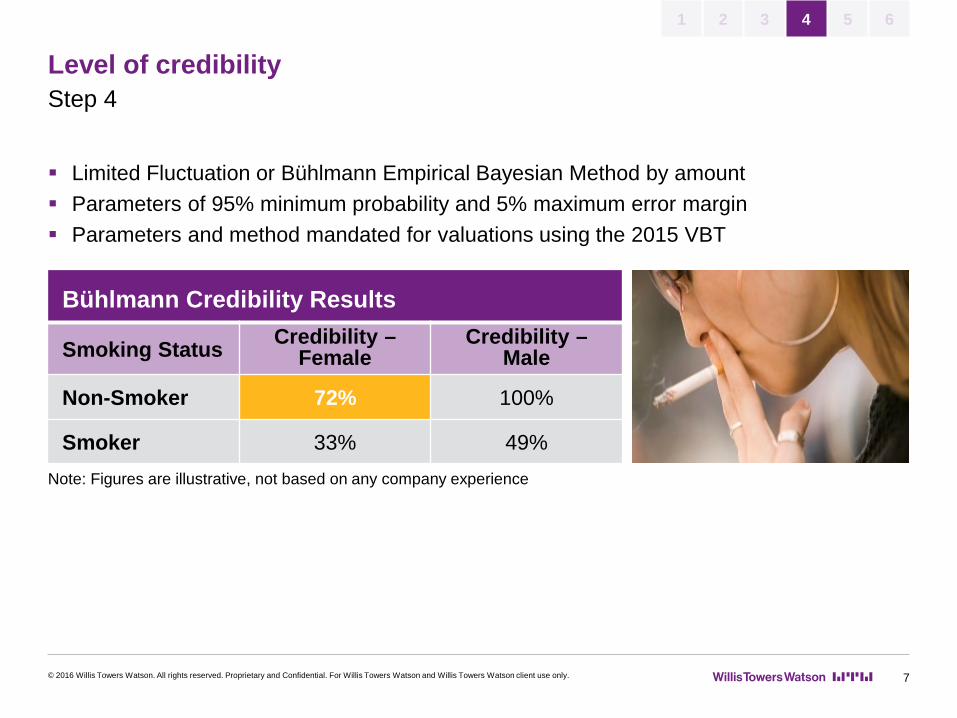
Level of credibilityStep 4
Limited Fluctuation or Bühlmann Empirical Bayesian Method by amount Parameters of 95% minimum probability and 5% maximum error margin Parameters and method mandated for valuations using the 2015 VBT
Bühlmann Credibility Results
Smoking Status Credibility –Female
Credibility –Male
Non-Smoker 72% 100%
Smoker 33% 49%Note: Figures are illustrative, not based on any company experience
1 2 3 4 5 6
© 2016 Willis Towers Watson. All rights reserved. Proprietary and Confidential. For Willis Towers Watson and Willis Towers Watson client use only. 7

Prescribed mortality margin Step 5
Attained Age
Credibility: 0 - 7% … Credibility:
63 - 67%Credibility:
68- 72%Credibility:
73 - 77% … Credibility: 99+%
<45 20.4% … 13.7% 12.7% 11.6% … 2.3%
46 - 47 20.2% … 13.7% 12.7% 11.6% … 2.3%
48 - 49 20.0% … 13.5% 12.5% 11.4% … 2.3%
… … … … … … … ….
Industry Table (2015 VBT)
Attained Age Load
≤45 20.4%
46 - 47 20.2%
48 - 49 20.0%
… …
1 2 3 4 5 6
© 2016 Willis Towers Watson. All rights reserved. Proprietary and Confidential. For Willis Towers Watson and Willis Towers Watson client use only. 8
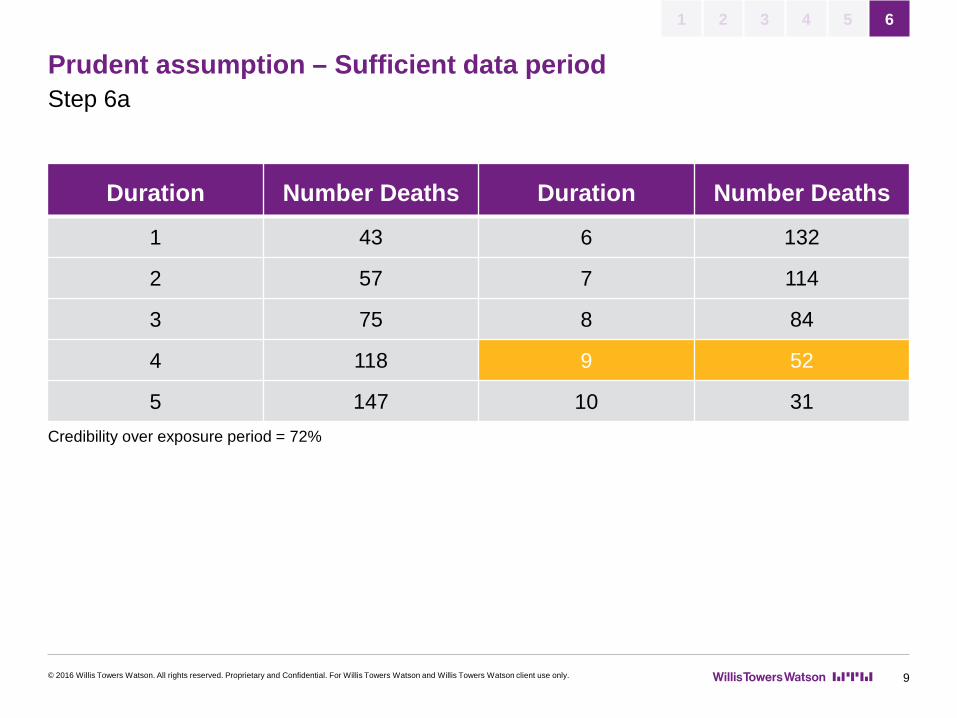
Duration Number Deaths Duration Number Deaths
1 43 6 132
2 57 7 114
3 75 8 84
4 118 9 52
5 147 10 31Credibility over exposure period = 72%
Prudent assumption – Sufficient data periodStep 6a
1 2 3 4 5 6
© 2016 Willis Towers Watson. All rights reserved. Proprietary and Confidential. For Willis Towers Watson and Willis Towers Watson client use only. 9

Credibility of company data over sufficient data period
Maximum # of years for data to be considered sufficient
Maximum # of years in which to begin grading after sufficient data no longer exists
Maximum # of years in which the assumption must grade to 100% of an applicable industry table (from duration where sufficient data no longer exists)*
20-39% 10 2 8*
40-59% 20 4 12*
60-79% 35 7 17*
80-100% 50 10 25** The maximum # of years in which the assumption must grade to 100% of an applicable industry table shall be the lesser
of (a) the appropriate number of years stated in the chart above, or (b) the number of years of sufficient data + 15 times the credibility percentage applicable to column (1) in the above chart
Note: Different grading parameters specified in VM-20 for valuations prior to 1/1/2017
Prudent assumption – Determine grading parametersStep 6b
1 2 3 4 5 6
© 2016 Willis Towers Watson. All rights reserved. Proprietary and Confidential. For Willis Towers Watson and Willis Towers Watson client use only. 10
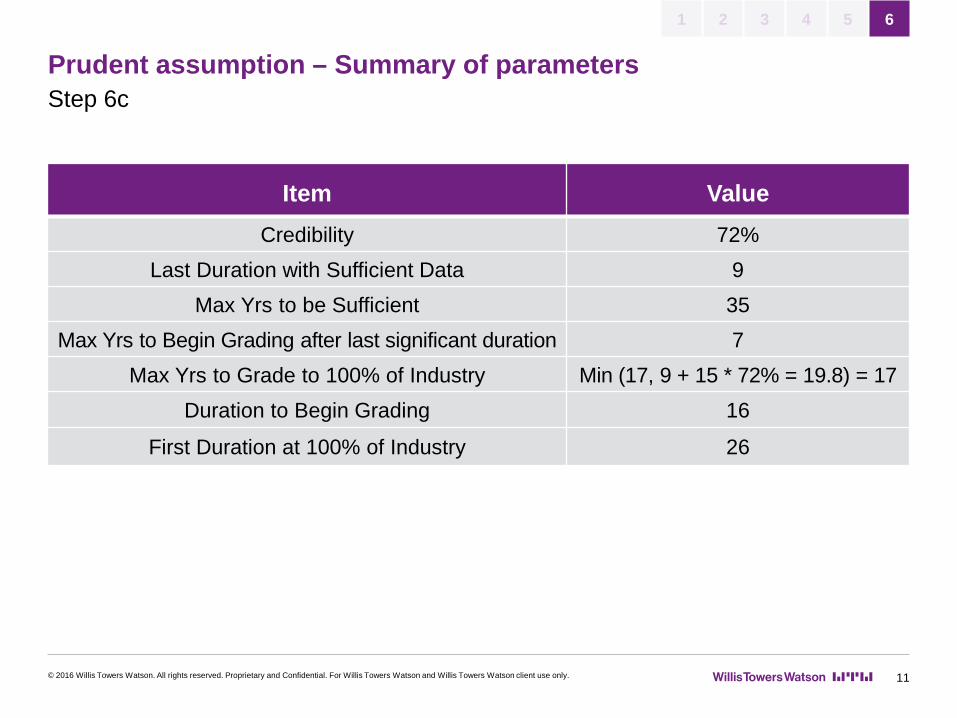
Prudent assumption – Summary of parametersStep 6c
Item ValueCredibility 72%
Last Duration with Sufficient Data 9Max Yrs to be Sufficient 35
Max Yrs to Begin Grading after last significant duration 7Max Yrs to Grade to 100% of Industry Min (17, 9 + 15 * 72% = 19.8) = 17
Duration to Begin Grading 16
First Duration at 100% of Industry 26
1 2 3 4 5 6
© 2016 Willis Towers Watson. All rights reserved. Proprietary and Confidential. For Willis Towers Watson and Willis Towers Watson client use only. 11

Prudent assumption – Summary of rates FNS, Issue Age 32, Preferred NSStep 6d
Duration Experience Factor*
Experience (% of 70 RR)
Experience Margin
Experience Weight
Industry Factor***
Industry Margin
Industry Weight
Final Rate
1-14 62% 62% * X** 12.70% 100% 100% 20.4% 0% 70% * X
15 62% 82% 12.70% 100% 100% 20.2% 0% 92%****
16 62% 82% 12.70% 100% 100% 20.2% 0% 92%
17 62% 82% 12.50% 90% 100% 20.0% 10% 95%
18 62% 81% 12.50% 80% 100% 20.0% 20% 97%
19 62% 81% 12.30% 70% 100% 19.8% 30% 100%
20 62% 81% 12.30% 60% 100% 19.8% 40% 102%
21 62% 81% 12.10% 50% 100% 19.6% 50% 105%
22 62% 81% 12.10% 40% 100% 19.6% 60% 108%
23 62% 80% 11.90% 30% 100% 19.2% 70% 110%
24 62% 80% 11.90% 20% 100% 19.2% 80% 113%
* Based on 2015 VBT 100 RR Table** X = (100 RRx / 70 RRx)*** % of the 70 RR Table**** 92% = 82% x (1 + 12.7%) x100% + 100% x (1 + 20.2%) x 0%
1 2 3 4 5 6
© 2016 Willis Towers Watson. All rights reserved. Proprietary and Confidential. For Willis Towers Watson and Willis Towers Watson client use only. 12

Potential challengesForm of company experience table
Where available consider using a company specific table, with adjustments, instead of an industry table
An aggregate % of an underlying table may not properly capture emerging experience
Note: Figures are illustrative, not based on any company experience
40%
60%
80%
100%
120%
140%
160%
1 2 3 4 5 6 7 8 9 10 11 12 13 14 15 16 17 18 19 20
Mortality Experience A/E on Industry Table (e.g., 2008 VBT)
IA <45 IA 45-65 IA 65+
© 2016 Willis Towers Watson. All rights reserved. Proprietary and Confidential. For Willis Towers Watson and Willis Towers Watson client use only. 13
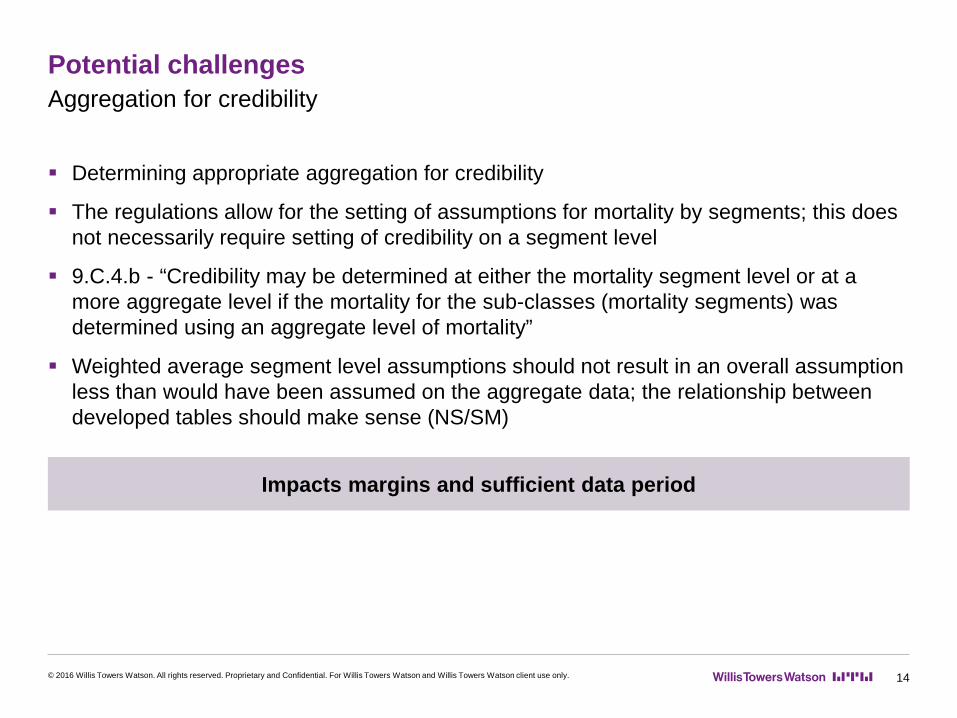
Potential challengesAggregation for credibility
Determining appropriate aggregation for credibility
The regulations allow for the setting of assumptions for mortality by segments; this does not necessarily require setting of credibility on a segment level
9.C.4.b - “Credibility may be determined at either the mortality segment level or at a more aggregate level if the mortality for the sub-classes (mortality segments) was determined using an aggregate level of mortality”
Weighted average segment level assumptions should not result in an overall assumption less than would have been assumed on the aggregate data; the relationship between developed tables should make sense (NS/SM)
Impacts margins and sufficient data period
© 2016 Willis Towers Watson. All rights reserved. Proprietary and Confidential. For Willis Towers Watson and Willis Towers Watson client use only. 14

Potential challengesAppropriate amount and type of experience
Balance between Using all available experience (to increase credibility and sufficient data period) Using experience that is relevant to the particular block of business
Questions to determine the relevance of available experience Similar risk class structure? Similar underwriting era? Any significant underwriting concessions during data period? Similar product design? Similar distribution channel? Should conversions, PLTP, and/or other special business be included?
© 2016 Willis Towers Watson. All rights reserved. Proprietary and Confidential. For Willis Towers Watson and Willis Towers Watson client use only. 15

Contact
Carrie Kelley, FSA, MAAAConsultant
One Alliance Center, 3500 Lenox Road, Suite 900Atlanta, GA 30326-4238
T +1 404 365 1595E [email protected]
© 2016 Willis Towers Watson. All rights reserved. Proprietary and Confidential. For Willis Towers Watson and Willis Towers Watson client use only. 16

Valuation Actuary SymposiumSession 59Assumption Setting Under VM-20
Karen RudolphAugust 30, 2016
Credibility
Focus is on MortalityVM-20 Requirements for Mortality Credibility CalculationsLimited FluctuationBuhlmannAdvantages/Disadvantages
((2)

Mortality Credibility
VM-20 Mortality requirements have been presented –these depend on the company having quantified its mortality credibility
VM-20 has parameters around how credibility is measured
((3)
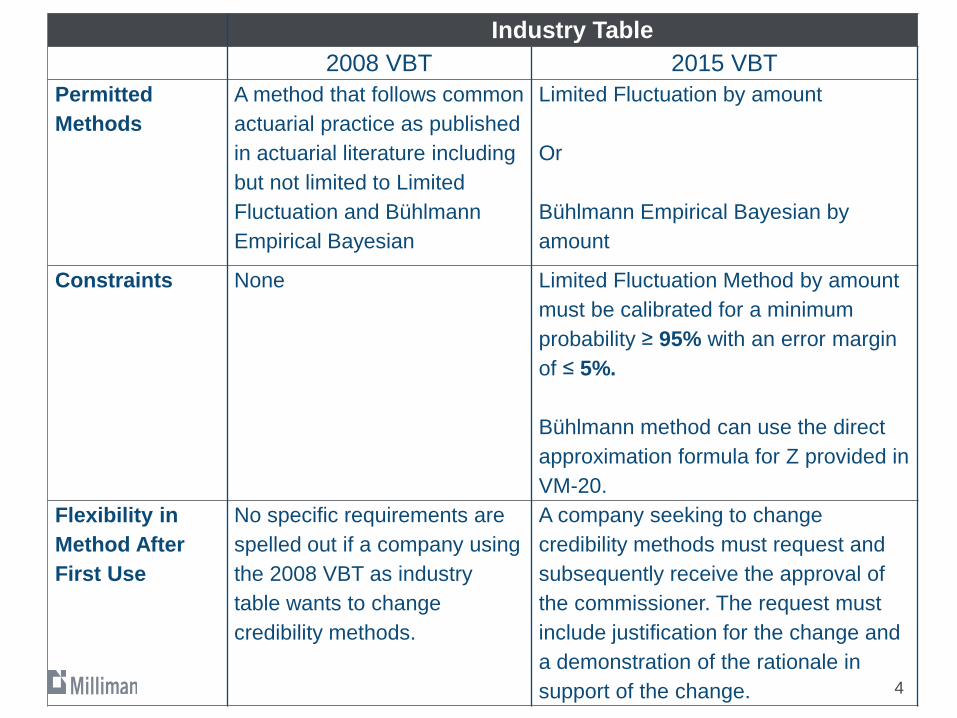
Industry Table2008 VBT 2015 VBT
Permitted Methods
A method that follows common actuarial practice as published in actuarial literature including but not limited to Limited Fluctuation and Bühlmann Empirical Bayesian
Limited Fluctuation by amount
Or
Bühlmann Empirical Bayesian by amount
Constraints None Limited Fluctuation Method by amount must be calibrated for a minimum probability ≥ 95% with an error margin of ≤ 5%.
Bühlmann method can use the direct approximation formula for Z provided in VM-20.
Flexibility in Method After First Use
No specific requirements are spelled out if a company using the 2008 VBT as industry table wants to change credibility methods.
A company seeking to change credibility methods must request and subsequently receive the approval of the commissioner. The request must include justification for the change and a demonstration of the rationale in support of the change. ((4)
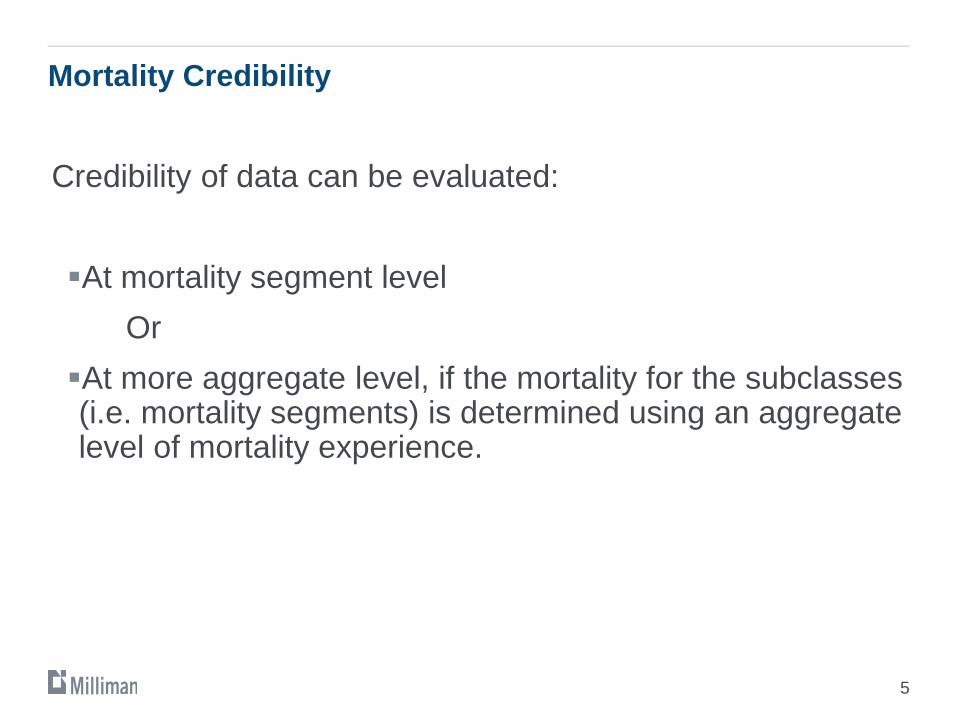
Mortality Credibility
Credibility of data can be evaluated:
At mortality segment levelOr
At more aggregate level, if the mortality for the subclasses (i.e. mortality segments) is determined using an aggregate level of mortality experience.
5

Mortality Credibility
VM-20 specifies that the mortality used in the modeled reserves be graded into industry rates, not blended with industry rates
Classical credibility methods would blend in proportion to the partial credibility measurementGrading implies that the company’s data is used for a certain number of durationsIndustry data is used to fill in those durations where company data is lacking
((666#66)
Mortality Credibility
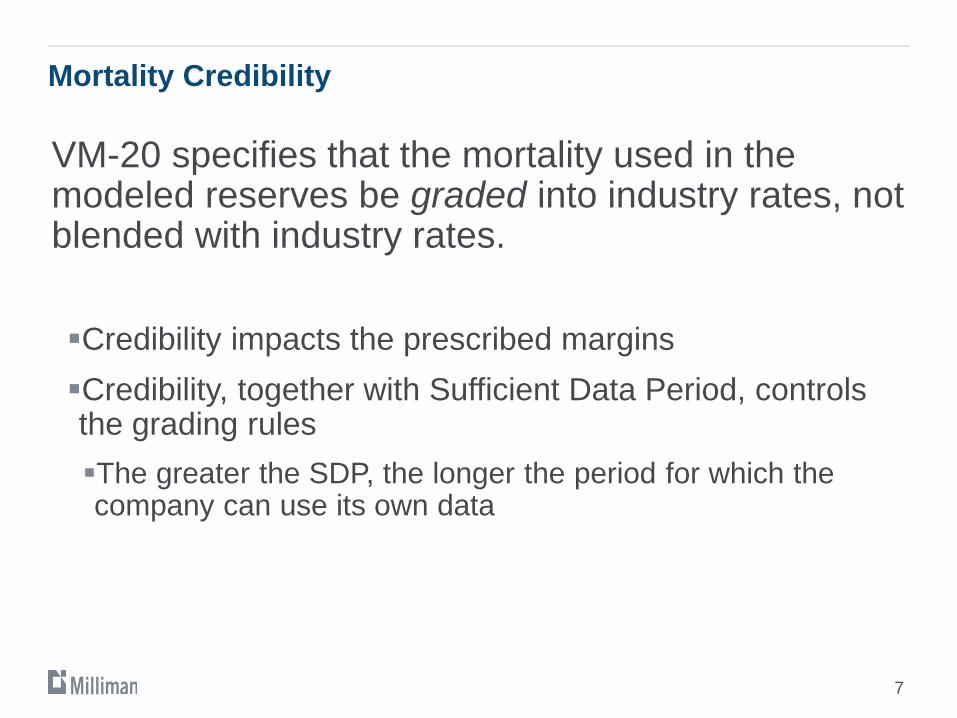
VM-20 specifies that the mortality used in the modeled reserves be graded into industry rates, not blended with industry rates.
Credibility impacts the prescribed margins Credibility, together with Sufficient Data Period, controls the grading rulesThe greater the SDP, the longer the period for which the company can use its own data
((777#77)

Mortality Credibility
Limited Fluctuation A classical statistical method based on confidence intervalsPremise: Normal DistributionRequires only the Company’s own dataFormula below is appropriate if the company chooses 95% and 5% as parameterization, rather than something higher than 95% or lower than 5%
Limited Fluctuation 𝑍𝑍 = min 1,.05 ∗ �𝑚𝑚1.96 ∗ �𝜎𝜎
8

Mortality Credibility
Limited Fluctuation 𝑍𝑍 = min 1,.05 ∗ �𝑚𝑚1.96 ∗ �𝜎𝜎
�𝑚𝑚 : This is the estimator�𝜎𝜎 : This is the standard deviation of the estimate1.96: Normal distribution z for the 95th percentile0.05: 5% margin for error
9

Mortality Credibility
10

Mortality CredibilityTaken from “Credibility Theory Practices” , December 2009𝑇𝑇𝑇𝑇𝑇𝑇𝑇𝑇𝑇 𝑎𝑎𝑇𝑇𝑇𝑇 𝑛𝑛 𝑜𝑜𝑜𝑜𝑜𝑜𝑇𝑇𝑇𝑇𝑜𝑜𝑇𝑇𝑜𝑜 𝑙𝑙𝑙𝑙𝑜𝑜𝑇𝑇𝑜𝑜 𝑤𝑤𝑙𝑙𝑤𝑤𝑇 𝑙𝑙𝑛𝑛𝑜𝑜𝑇𝑇𝑖𝑖 𝑙𝑙
𝐴𝐴 = �𝑖𝑖=1
𝑛𝑛𝑜𝑜𝑖𝑖𝑜𝑜𝑖𝑖
𝐸𝐸 = �𝑖𝑖=1
𝑛𝑛𝑜𝑜𝑖𝑖𝑓𝑓𝑖𝑖𝑞𝑞𝑖𝑖𝑠𝑠
𝑓𝑓𝑖𝑖 = 𝐹𝐹𝑇𝑇𝑎𝑎𝐹𝐹𝑤𝑤𝑙𝑙𝑜𝑜𝑛𝑛 𝑜𝑜𝑓𝑓 𝑦𝑦𝑇𝑇𝑎𝑎𝑇𝑇 𝑓𝑓𝑜𝑜𝑇𝑇 𝑤𝑤𝑇𝑙𝑙𝐹𝐹𝑇 𝑤𝑤𝑇𝑇𝑇 𝑙𝑙𝑙𝑙𝑓𝑓𝑇𝑇, 𝑙𝑙,𝑤𝑤𝑎𝑎𝑜𝑜 𝑜𝑜𝑜𝑜𝑜𝑜𝑇𝑇𝑇𝑇𝑜𝑜𝑇𝑇𝑜𝑜𝑜𝑜𝑖𝑖 = 𝐴𝐴𝑚𝑚𝑜𝑜𝐴𝐴𝑛𝑛𝑤𝑤 𝑜𝑜𝑓𝑓 𝑙𝑙𝑛𝑛𝑜𝑜𝐴𝐴𝑇𝑇𝑎𝑎𝑛𝑛𝐹𝐹𝑇𝑇𝑜𝑜𝑖𝑖 = 0 𝑙𝑙𝑓𝑓 𝑙𝑙𝑙𝑙𝑓𝑓𝑇𝑇 𝑜𝑜𝑙𝑙𝑜𝑜 𝑛𝑛𝑜𝑜𝑤𝑤 𝑜𝑜𝑙𝑙𝑇𝑇; 1 𝑙𝑙𝑓𝑓 𝑙𝑙𝑙𝑙𝑓𝑓𝑇𝑇 𝑜𝑜𝑙𝑙𝑜𝑜 𝑜𝑜𝑙𝑙𝑇𝑇
�𝒎𝒎 = �𝑨𝑨 𝑬𝑬((111111#1111)
Mortality Credibility
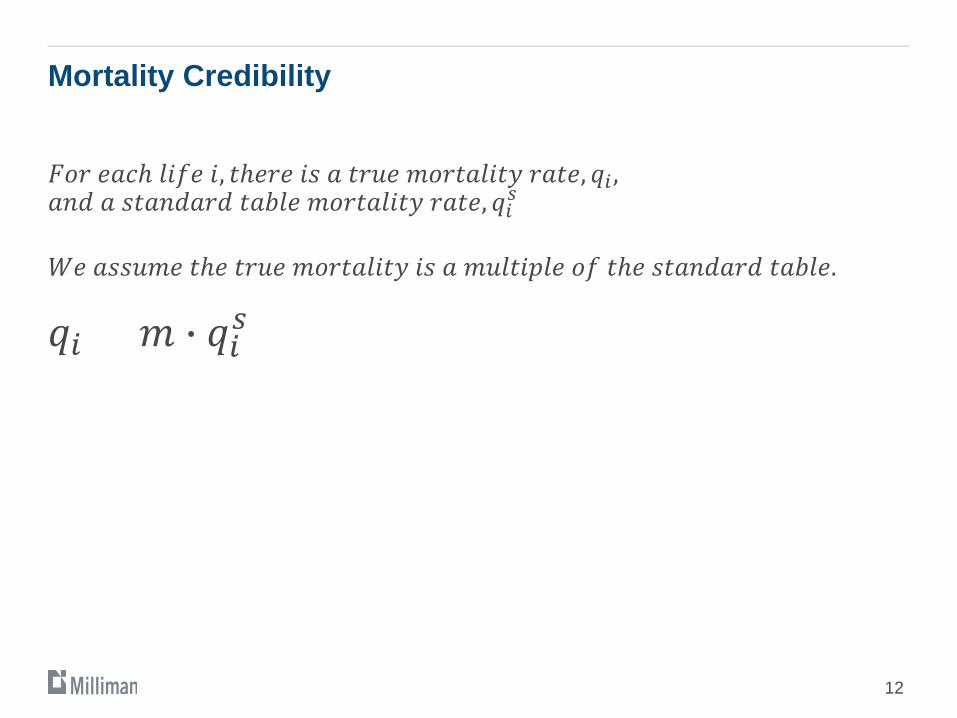
𝐹𝐹𝑜𝑜𝑇𝑇 𝑇𝑇𝑎𝑎𝐹𝐹𝑇 𝑙𝑙𝑙𝑙𝑓𝑓𝑇𝑇 𝑙𝑙, 𝑤𝑤𝑇𝑇𝑇𝑇𝑇𝑇𝑇 𝑙𝑙𝑜𝑜 𝑎𝑎 𝑤𝑤𝑇𝑇𝐴𝐴𝑇𝑇 𝑚𝑚𝑜𝑜𝑇𝑇𝑤𝑤𝑎𝑎𝑙𝑙𝑙𝑙𝑤𝑤𝑦𝑦 𝑇𝑇𝑎𝑎𝑤𝑤𝑇𝑇, 𝑞𝑞𝑖𝑖 ,𝑎𝑎𝑛𝑛𝑜𝑜 𝑎𝑎 𝑜𝑜𝑤𝑤𝑎𝑎𝑛𝑛𝑜𝑜𝑎𝑎𝑇𝑇𝑜𝑜 𝑤𝑤𝑎𝑎𝑜𝑜𝑙𝑙𝑇𝑇 𝑚𝑚𝑜𝑜𝑇𝑇𝑤𝑤𝑎𝑎𝑙𝑙𝑙𝑙𝑤𝑤𝑦𝑦 𝑇𝑇𝑎𝑎𝑤𝑤𝑇𝑇, 𝑞𝑞𝑖𝑖𝑠𝑠
𝑊𝑊𝑇𝑇 𝑎𝑎𝑜𝑜𝑜𝑜𝐴𝐴𝑚𝑚𝑇𝑇 𝑤𝑤𝑇𝑇𝑇 𝑤𝑤𝑇𝑇𝐴𝐴𝑇𝑇 𝑚𝑚𝑜𝑜𝑇𝑇𝑤𝑤𝑎𝑎𝑙𝑙𝑙𝑙𝑤𝑤𝑦𝑦 𝑙𝑙𝑜𝑜 𝑎𝑎 𝑚𝑚𝐴𝐴𝑙𝑙𝑤𝑤𝑙𝑙𝑚𝑚𝑙𝑙𝑇𝑇 𝑜𝑜𝑓𝑓 𝑤𝑤𝑇𝑇𝑇 𝑜𝑜𝑤𝑤𝑎𝑎𝑛𝑛𝑜𝑜𝑎𝑎𝑇𝑇𝑜𝑜 𝑤𝑤𝑎𝑎𝑜𝑜𝑙𝑙𝑇𝑇.
𝑞𝑞𝑖𝑖 = 𝑚𝑚 � 𝑞𝑞𝑖𝑖𝑠𝑠
((121212#1212)
Mortality Credibility
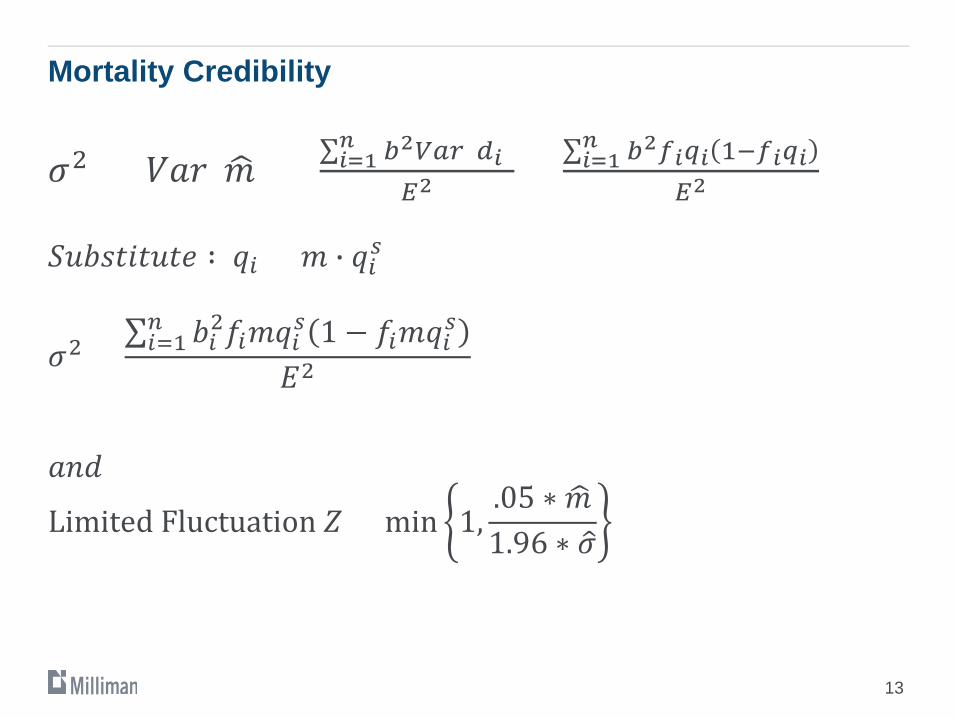
𝜎𝜎2 = 𝑉𝑉𝑎𝑎𝑇𝑇( �𝑚𝑚) = ∑𝑖𝑖=1𝑛𝑛 𝑏𝑏2𝑉𝑉𝑉𝑉𝑉𝑉(𝑑𝑑𝑖𝑖)
𝐸𝐸2= ∑𝑖𝑖=1
𝑛𝑛 𝑏𝑏2𝑓𝑓𝑖𝑖𝑞𝑞𝑖𝑖 1−𝑓𝑓𝑖𝑖𝑞𝑞𝑖𝑖𝐸𝐸2
𝑆𝑆𝐴𝐴𝑜𝑜𝑜𝑜𝑤𝑤𝑙𝑙𝑤𝑤𝐴𝐴𝑤𝑤𝑇𝑇 ∶ 𝑞𝑞𝑖𝑖 = 𝑚𝑚 � 𝑞𝑞𝑖𝑖𝑠𝑠
𝜎𝜎2 =∑𝑖𝑖=1𝑛𝑛 𝑜𝑜𝑖𝑖2𝑓𝑓𝑖𝑖𝑚𝑚𝑞𝑞𝑖𝑖𝑠𝑠 1 − 𝑓𝑓𝑖𝑖𝑚𝑚𝑞𝑞𝑖𝑖𝑠𝑠
𝐸𝐸2
𝑎𝑎𝑛𝑛𝑜𝑜
Limited Fluctuation 𝑍𝑍 = min 1,.05 ∗ �𝑚𝑚1.96 ∗ �𝜎𝜎
((131313#1313)
Mortality Credibility
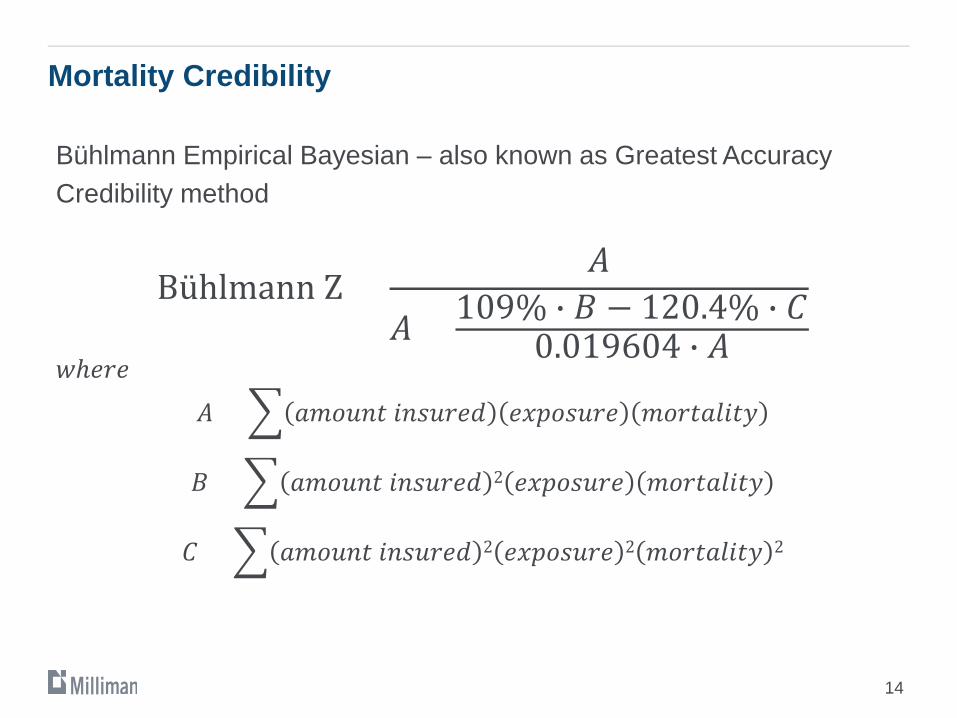
Bühlmann Empirical Bayesian – also known as Greatest Accuracy Credibility method
Bühlmann Z =𝐴𝐴
𝐴𝐴 + 109% � 𝐵𝐵 − 120.4% � 𝐶𝐶0.019604 � 𝐴𝐴
𝑤𝑤𝑇𝑇𝑇𝑇𝑇𝑇𝑇𝐴𝐴 = � 𝑎𝑎𝑚𝑚𝑜𝑜𝐴𝐴𝑛𝑛𝑤𝑤 𝑙𝑙𝑛𝑛𝑜𝑜𝐴𝐴𝑇𝑇𝑇𝑇𝑜𝑜 𝑇𝑇𝑖𝑖𝑚𝑚𝑜𝑜𝑜𝑜𝐴𝐴𝑇𝑇𝑇𝑇 𝑚𝑚𝑜𝑜𝑇𝑇𝑤𝑤𝑎𝑎𝑙𝑙𝑙𝑙𝑤𝑤𝑦𝑦
𝐵𝐵 = � 𝑎𝑎𝑚𝑚𝑜𝑜𝐴𝐴𝑛𝑛𝑤𝑤 𝑙𝑙𝑛𝑛𝑜𝑜𝐴𝐴𝑇𝑇𝑇𝑇𝑜𝑜 2 𝑇𝑇𝑖𝑖𝑚𝑚𝑜𝑜𝑜𝑜𝐴𝐴𝑇𝑇𝑇𝑇 𝑚𝑚𝑜𝑜𝑇𝑇𝑤𝑤𝑎𝑎𝑙𝑙𝑙𝑙𝑤𝑤𝑦𝑦
𝐶𝐶 = � 𝑎𝑎𝑚𝑚𝑜𝑜𝐴𝐴𝑛𝑛𝑤𝑤 𝑙𝑙𝑛𝑛𝑜𝑜𝐴𝐴𝑇𝑇𝑇𝑇𝑜𝑜 2 𝑇𝑇𝑖𝑖𝑚𝑚𝑜𝑜𝑜𝑜𝐴𝐴𝑇𝑇𝑇𝑇 2 𝑚𝑚𝑜𝑜𝑇𝑇𝑤𝑤𝑎𝑎𝑙𝑙𝑙𝑙𝑤𝑤𝑦𝑦 2
((141414#1414)
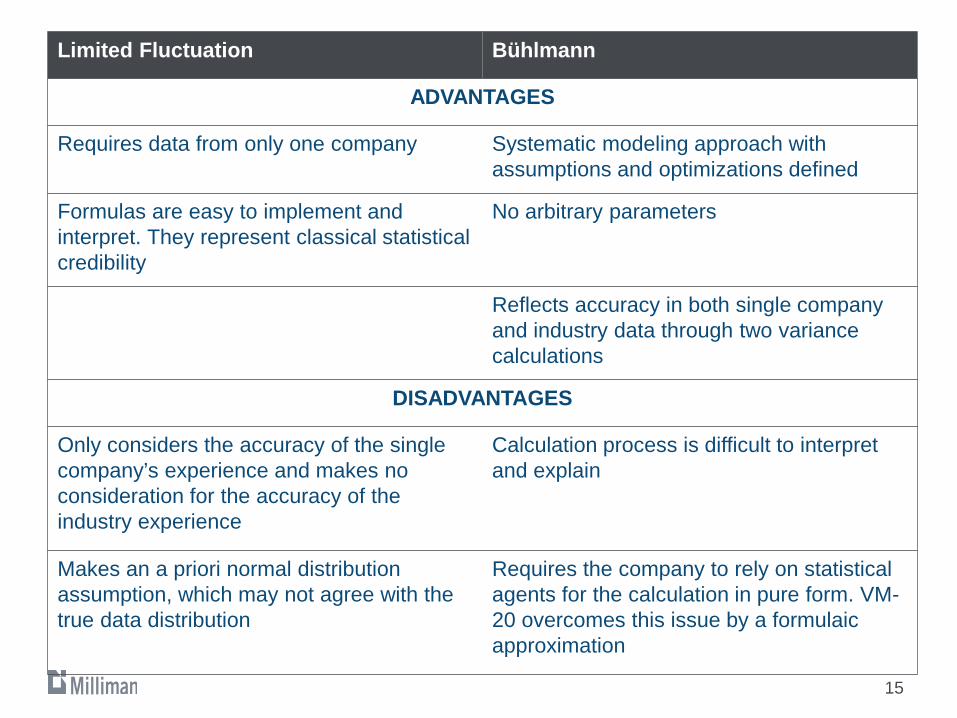
Limited Fluctuation Bühlmann
ADVANTAGES
Requires data from only one company Systematic modeling approach with assumptions and optimizations defined
Formulas are easy to implement and interpret. They represent classical statistical credibility
No arbitrary parameters
Reflects accuracy in both single company and industry data through two variance calculations
DISADVANTAGES
Only considers the accuracy of the single company’s experience and makes no consideration for the accuracy of the industry experience
Calculation process is difficult to interpret and explain
Makes an a priori normal distribution assumption, which may not agree with the true data distribution
Requires the company to rely on statistical agents for the calculation in pure form. VM-20 overcomes this issue by a formulaic approximation
((151515#1515)

Mortality Credibility
Credibility Range53-57%
58-62%
63-67%
68-72%
73-77%
78-82%
83-87%
88-92%
93-100%
LF 8.3% 7.6% 6.9% 6.3% 5.8% 5.3% 4.8% 4.4% 4.0%
B 15.5% 14.6% 13.7% 12.7% 11.6% 10.3% 8.9%Note(1)
Note(2)
Note (1) Note(2)88-89%: 8.0% margin 92-93%: 6.5% margin90-91%: 7.3% margin 94-95%: 5.7% margin92-93%: 6.5% margin 96-97%: 4.6% margin
98%: 3.3% margin99+%: 2.3% margin
VM-20 Prescribed Mortality Margins by Method for Ages < 45
((161616#1616)

((171717#1717)
Carrie Kelley, FSA, MAAAAugust 30, 2016
VM-20 Other Liability AssumptionsValuation Actuary Symposium Session 59PD
© 2016 Willis Towers Watson. All rights reserved.

Other prudent estimate assumptions
© 2016 Willis Towers Watson. All rights reserved. Proprietary and Confidential. For Willis Towers Watson and Willis Towers Watson client use only. 2
General guidance on assumptions
Product level assumptions and concerns
Term
ULSG
Corporate assumptions
Non Guaranteed Elements (NGE)
Reinsurance

General guidance on assumptions
Section 9 of VM-20 covers prudent estimate assumptions
Risk factor that is not prescribed or stochastically modeled
Anticipated experience plus a margin
Relevant and credible company experience should be used where available
Combine relevant less credible data with other data using accepted credibility methods
Where credibility theory is of limited use rely on other accepted actuarial practices Premium patterns do not lend themselves well to credibility methods Lack of industry data may prevent the use of credibility blending
© 2016 Willis Towers Watson. All rights reserved. Proprietary and Confidential. For Willis Towers Watson and Willis Towers Watson client use only. 3
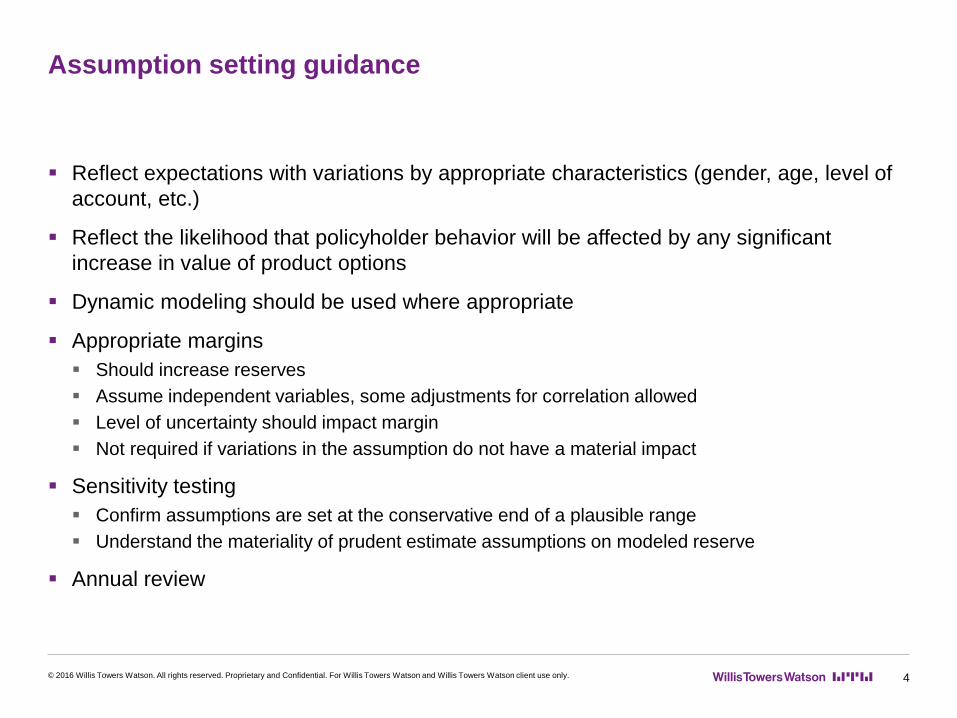
Assumption setting guidance
Reflect expectations with variations by appropriate characteristics (gender, age, level of account, etc.)
Reflect the likelihood that policyholder behavior will be affected by any significant increase in value of product options
Dynamic modeling should be used where appropriate
Appropriate margins Should increase reserves Assume independent variables, some adjustments for correlation allowed Level of uncertainty should impact margin Not required if variations in the assumption do not have a material impact
Sensitivity testing Confirm assumptions are set at the conservative end of a plausible range Understand the materiality of prudent estimate assumptions on modeled reserve
Annual review
© 2016 Willis Towers Watson. All rights reserved. Proprietary and Confidential. For Willis Towers Watson and Willis Towers Watson client use only. 4

Category Assumption Types
Term Lapses, post level profits, conversions
ULSG Lapse, premiums, withdrawals/surrenders
Corporate Assumptions Expenses and taxes
Non Guaranteed Elements COIs, crediting spreads, etc.
Reinsurance Counterparty actions
Liability assumptions
There will be various considerations by product
© 2016 Willis Towers Watson. All rights reserved. Proprietary and Confidential. For Willis Towers Watson and Willis Towers Watson client use only. 5

Summary
Richard has walked through general requirements for determining mortality assumptions under VM-20
We have walked through an example of setting prudent estimate mortality assumptions
Karen has given us a in-depth look at calculating credibility for prudent estimate mortality assumptions
We have gone through a high level overview of other prudent estimate liability assumptions
© 2016 Willis Towers Watson. All rights reserved. Proprietary and Confidential. For Willis Towers Watson and Willis Towers Watson client use only. 6

Key takeaways
Begin thinking about your prudent estimate assumptions early
Robust experience studies will be an integral part of assumption setting
Begin considering appropriate margins
Prudent estimate assumptions allow room for judgement – justify and document decisions
Use as many resources as necessary to help set prudent estimate assumptions
Keep up to date on changes to the Valuation Manual
© 2016 Willis Towers Watson. All rights reserved. Proprietary and Confidential. For Willis Towers Watson and Willis Towers Watson client use only. 7

Questions
© 2016 Willis Towers Watson. All rights reserved. Proprietary and Confidential. For Willis Towers Watson and Willis Towers Watson client use only. 8

Contact
Carrie Kelley, FSA, MAAAConsultant
One Alliance Center, 3500 Lenox Road, Suite 900Atlanta, GA 30326-4238
T +1 404 365 1595E [email protected]
© 2016 Willis Towers Watson. All rights reserved. Proprietary and Confidential. For Willis Towers Watson and Willis Towers Watson client use only. 9