58166 Covers.qxp:Layout 1 Sharma (212) 208-3333 ... 3,038 2,941 2,779 2,545 2,129 1,780 1,546 1,431...
28
New York | London | Sydney | Tokyo | Milan | Mexico City Share price $2.33 Market capitalization $669.2 million Net income $(2,331.2) million Net income per diluted share $(8.11) Book value per share $(2.74) Adjusted book value per share $7.53 Adjusted book value per share (excluding unrealized gains and losses) $20.18 Financial Highlights Q3 2008 Quarterly Operating Supplement Financial Peace of Mind. ®
Transcript of 58166 Covers.qxp:Layout 1 Sharma (212) 208-3333 ... 3,038 2,941 2,779 2,545 2,129 1,780 1,546 1,431...

N e w Y o r k | L o n d o n | S y d n e y | T o k y o | M i l a n | M e x i c o C i t y
Share price $2.33Market capitalization $669.2 millionNet income $(2,331.2) millionNet income per diluted share $(8.11)Book value per share $(2.74)Adjusted book value per share $7.53Adjusted book value per share(excluding unrealized gains and losses) $20.18
Financial Highlights
Q32008 Quarterly Operating Supplement
F i n a n c i a l P e a c e o f M i n d .®
Company Profile Ambac Financial Group, Inc., headquartered in New York City, is a holding company whose affiliates provide financial guarantees and financial services to clients in both the public and private sectors around the world. The principal operating subsidiary, Ambac Assurance Corporation, a guarantor of public finance and structured finance obligations, has been assigned an Aa3 rating and has been placed on review for possible downgrade by Moody’s Investors Services, Inc., and has been assigned an AA rating with a credit watch negative outlook from Standard & Poor’s Ratings Services. Ambac Financial Group, Inc., through its subsidiaries, also provided investment agreements, interest rate swaps, total return swaps and funding conduits, principally to clients of the financial guarantee business, which include municipalities and their authorities, health care organizations and asset-backed issuers. Ambac Financial Group, Inc. common stock is listed on the New York Stock Exchange (ticker symbol ABK). Company Information
Corporate headquarters are located at:
Ambac Financial Group, Inc. One State Street Plaza New York, New York 10004 (212) 668-0340 (212) 509-9190 (fax) www.ambac.com
Investor Relations Contact: Vandana Sharma (212) 208-3333 (212) 208-3108 (fax) [email protected]
For further information on Ambac Financial Group, Inc., or to obtain a copy of Ambac Financial Group, Inc.’s latest annual or quarterly report filed with the Securities and Exchange Commission or the most recent Annual Report to Stockholders, please call, write or e-mail the Investor Relations Department at the above number or address, or download it from our website at www.ambac.com.

Ambac Financial Group, Inc. Quarterly Operating Supplement
Third Quarter 2008
Table of Contents Annual Financial and Statistical Data……………………………………………………………… . 1 Key Financial Highlights…………………………………………………………………………..... 2 Earnings Analysis………………………………………………………………………………….... 3 Third Quarter 2008 Earnings Release……………………………………………………………….. 4-10 Consolidated Statements of Operations……………………………………………………………... 11 Consolidated Balance Sheets……………………………………………………………………….. 12 Financial Guarantees………………………………………………………………………………... 13 Normal Net Insurance Premiums Earned and Fees on Credit Derivatives………………………….. 14 Effect of Refundings, Calls and Other Accelerations……………………………………………… . 14 Public Finance New Issuance……………………………………………………………………….. 15 Net Exposure Amortization…………………………………………………………………………. 16 Net Unearned Premium Amortization and Estimated Future Installment Premiums ........................ 16 Fixed Income Investment Portfolio.................................................................................................... 17 Rating Distribution of Investment Portfolio….. ................................................................................ 17 Ratio of Net Claims Paid ................................................................................................................... 18 Summary of Net Insurance Loss Reserves and Credit Derivatives ................................................... 18 Summary of Below Investment Grade Exposures ............................................................................. 18 Expense Analysis ............................................................................................................................... 19 Deferred Expense Ratio Analysis ...................................................................................................... 19 Historical Financial Guarantee Exposures Outstanding .................................................................... 20 Bond Type Distribution of Financial Guarantee Exposures .............................................................. 21 Geographic Distribution of Financial Guarantee Exposures ............................................................. 22 Rating Distribution of Net Financial Guarantee Exposures............................................................... 22 Largest Domestic Public Finance Exposures..................................................................................... 23 Largest Domestic Healthcare Exposures ........................................................................................... 23 Largest Structured Finance Exposures............................................................................................... 24 Largest International Finance Exposures........................................................................................... 24 Claims-Paying Resources and Statutory Financial Ratios ................................................................. 25 Note 1: Throughout this Supplement adjusted book value (ABV) per share is reported and analyzed. ABV, is not promulgated in
conformity with U.S. generally accepted accounting principles (GAAP) and should not be considered a substitute for actual book value. It is used by management, equity analysts and investors as a measurement of the Company’s estimated intrinsic value with no benefit given for ongoing business activity. Management derives adjusted book value by beginning with stockholders’ equity (book value) and adding or subtracting the after-tax value of: the net unearned premium reserve; deferred acquisition costs; the present value of estimated net future installment premiums (discounted at 5.9% and 5.2% at September 30, 2008 and December 31, 2007, respectively); and the unrealized gain or loss on investment agreement liabilities. The definition of ABV used by the Company may differ from definitions of ABV used by other financial guarantors and should be considered in such context. The adjustments described above will not be realized until future periods and may differ materially from the amounts used in determining ABV.
Note 2: Credit enhancement production (CEP) and net credit enhancement production (NCEP), which are not promulgated
under GAAP, should not be considered a substitute for gross or net premiums written. CEP is used by management, equity analysts and investors as an indication of new business production. CEP, which Ambac reports as analytical data, is defined as gross (direct and assumed) up-front premiums written plus the present value of estimated installment premiums written on insurance policies, structured credit derivatives and other credit enhancement products issued in the period (discounted at 5.3% and 5.4% for the quarters ended September 30, 2008 and 2007, respectively). During the first quarter of 2008 Ambac curtailed its activities on a go-forward basis in certain sections of Structured Finance. The Structured Finance business written during 2008 primarily relates to transactions that closed prior to the suspension of Structured Finance underwriting. NCEP is defined as CEP less cessions to all reinsurers. The definition of CEP and NCEP used by Ambac may differ from definitions of CEP and NCEP used by other financial guarantors.
Note 3: Internal Ambac credit ratings contained in this Supplement are provided solely to indicate the underlying credit quality
of guaranteed obligations based on the view of Ambac Assurance. In cases where Ambac has insured multiple tranches of an issue with varying internal ratings, or more than one obligation of an issuer with varying internal ratings, a weighted average rating is used. Ambac credit ratings are subject to revision at anytime and do not constitute investment advice. Ambac Assurance, or one of its affiliates, has insured the obligations listed and may also provide other products or services to the issuers of these obligations for which Ambac may have received premiums or fees.
Note 4: Information contained in this report is unaudited.

Annual Financial and Statistical Data(Dollars in millions except share data)
2007 (1) 2006 2005 2004 2003 2002 (2) 2001 2000 1999 1998Summary Financial Data: Financial Guarantee: Credit enhancement production (non-GAAP) $1,414 $1,295 $1,249 $1,288 $1,489 $1,299 $974 $711 $652 $486 Gross premiums written 1,031 997 1,096 1,048 1,144 904 683 483 445 361 Net premiums/enhancement fees earned 918 871 866 765 667 500 400 323 268 213 Net investment income (3) 460 424 378 355 321 297 268 241 209 186 Loss and loss expenses (4) 256 20 150 70 53 27 20 15 11 6 Underwriting and operating expenses 139 134 118 107 92 77 68 55 49 47 Financial Services (5): Revenue 452 408 286 225 230 272 274 333 340 302 Expenses 432 372 253 184 208 241 244 295 312 284 Net (loss) income per diluted share ($31.56) $8.15 $6.87 $6.53 $5.66 $3.97 $3.97 $3.41 $2.88 $2.37 Net (loss) income per diluted share growth rate n.m. 18.6% 5.2% 15.4% 42.6% 0.0% 16.4% 18.4% 21.5% 13.4% Return on equity -76.7% 15.1% 14.4% 15.6% 15.7% 13.1% 15.5% 15.9% 15.0% 12.8% Total investments 18,396 17,434 15,592 14,422 13,965 12,539 10,288 8,324 8,963 8,748 Total assets 23,565 20,268 18,546 17,673 16,747 15,356 12,340 10,120 11,345 11,212 Unearned premium reserve 3,124 3,038 2,941 2,779 2,545 2,129 1,780 1,546 1,431 1,294 Loss and loss expense reserve 484 220 304 254 189 172 151 132 122 116 Obligations under investment, repurchase and payment agreements 8,706 8,357 7,253 7,081 7,076 7,283 5,512 4,893 6,140 5,957 Long-term debt (6) 1,670 992 1,192 792 792 617 619 424 424 424 Stockholders' equity 2,280 6,190 5,388 5,024 4,255 3,625 2,984 2,596 2,019 2,096 Statutory Data: Qualified statutory capital $6,422 $6,383 $5,693 $5,264 $4,526 $3,736 $3,262 $2,736 $2,421 $1,936 Unearned premium reserve 3,320 3,373 3,208 2,972 2,649 2,223 1,860 1,615 1,486 1,334 Loss and loss expense reserve 110 42 103 117 55 49 28 31 26 34 Estimated impairment losses on credit derivatives 757 - - - - - - - - - Policyholders' reserves 10,609 9,798 9,004 8,353 7,230 6,008 5,150 4,382 3,933 3,304 Third party capital support 800 800 800 800 800 800 800 800 750 555 P.V. of future installment premiums 3,103 2,503 2,166 2,060 1,556 1,342 987 764 527 309 Total claims-paying resources $14,512 $13,101 $11,970 $11,213 $9,586 $8,150 $6,937 $5,946 $5,210 $4,168
Net par outstanding $524,025 $519,043 $479,085 $459,432 $425,854 $379,211 $318,043 $276,252 $240,307 $198,274 Net debt service outstanding $833,303 $802,694 $726,612 $685,234 $625,564 $557,422 $476,190 $418,386 $374,484 $317,668Financial Ratios: Loss and loss expense ratio 148.4% 2.3% 17.3% 9.1% 8.2% 6.5% 5.3% 4.8% 4.2% 2.8% Underwriting expense ratio 15.2% 15.3% 13.6% 13.9% 13.8% 15.3% 17.0% 17.1% 18.2% 21.9% Combined ratio 163.6% 17.6% 30.9% 23.0% 22.0% 21.8% 22.3% 21.9% 22.4% 24.7%Stock Performance: Cumulative total return since IPO on 7/91 322.4% 1338.1% 1134.2% 1205.6% 996.3% 782.5% 802.4% 804.0% 435.0% 512.4% Annual total return -70.6% 16.5% -5.5% 19.1% 24.2% -2.2% -0.2% 69.0% -12.6% 31.8% Dividends declared per common share $0.780 $0.660 $0.550 $0.470 $0.420 $0.380 $0.340 $0.307 $0.280 $0.253 Adjusted book value per share (non-GAAP) $55.24 $87.81 $78.53 $71.73 $61.27 $49.84 $42.03 $36.35 $29.79 $28.00
(1) Net income was adversely impacted by mark-to-market losses on credit derivative contracts of $6,016.3 million, $3,910.6 million after-tax, or $37.99 per diluted share.(2) Net income was adversely impacted by a writedown of an investment security amounting to $139.7 million, $90.8 million after-tax or $0.83 per diluted share.(3) Excludes variable interest entity investment income of $4.8 million from 2007.(4) Includes losses of ($41.0) million, ($41.4) million and $91.5 million in 2007, 2006 and 2005, respectively, as a result of Hurricane Katrina.(5) Financial Services revenues exclude net realized investment gains/losses, net mark-to-market gains/losses on non-trading derivatives and net mark-to-market gains/losses on total return swaps. Amounts also exclude the discontinued operations of Cadre Financial Services, Inc.(6) Excludes the portion of long-term debt associated with a variable interest entity.

Key Financial HighlightsThird Third Nine Nine
Quarter Quarter Months Months2008 2007 2008 2007
KEY FINANCIAL LINES
Net (loss) income ($ millions). . . . . . . . . . . . . . . . . . . . . . . . . . . . . ($2,431.2) ($360.6) ($3,268.4) $25.8Stockholders' equity ($ millions) . . . . . . . . . . . . . . . . . . . . . . . . . . . ($886.9) $5,655.3 ($886.9) $5,655.3Return on equity . . . . . . . . . . . . . . . . . . . . . . . . . . . . . . . . . . . . . . . . -1847.9% -24.7% -625.7% 0.6%Total capitalization (1) ($ millions) . . . . . . . . . . . . . . . . . . . . . . . . . $735.4 $7,044.6 $735.4 $7,044.6Debt/total capital (1) . . . . . . . . . . . . . . . . . . . . . . . . . . . . . . . . . . . . . 220.6% 19.7% 220.6% 19.7%Capital ratio(2). . . . . . . . . . . . . . . . . . . . . . . . . . . . . . . . . . . . . . . . . . 175:1 143:1 175:1 143:1Claims-Paying ratio (2). . . . . . . . . . . . . . . . . . . . . . . . . . . . . . . . . . . 51:1 63:1 51:1 63:1Loss ratio (3) . . . . . . . . . . . . . . . . . . . . . . . . . . . . . . . . . . . . . . . . . . . 1047.0% 8.9% 690.1% 7.0%Expense ratio (4) . . . . . . . . . . . . . . . . . . . . . . . . . . . . . . . . . . . . . . . . 15.8% 16.1% 18.7% 15.2%Combined ratio(3) (4) . . . . . . . . . . . . . . . . . . . . . . . . . . . . . . . . . . . . . 1062.8% 25.0% 708.8% 22.2%Effective tax rates:
Financial Guarantee: Net investment income . . . . . . . . . . . . . . . . . . . . . . . . . . . . . 14.1% 12.8% 13.7% 12.9% Realized securities gains . . . . . . . . . . . . . . . . . . . . . . . . . . . . 35.0% 35.0% 35.0% 35.0% Underwriting and other income . . . . . . . . . . . . . . . . . . . . . . 18.1% 34.8% 22.5% 33.6% Total Financial Guarantee. . . . . . . . . . . . . . . . . . . . . . . . . 17.9% 40.2% 23.1% -53.6%
Financial Services . . . . . . . . . . . . . . . . . . . . . . . . . . . . . . . . . . . 84.5% 40.6% 35.0% 29.6%Other. . . . . . . . . . . . . . . . . . . . . . . . . . . . . . . . . . . . . . . . . . . . . . 35.0% -231.3% 35.0% -57.4% Consolidated total effective tax rate. . . . . . . . . . . . . . . . . . . . 20.9% 27.1% 25.0% 2.4%
STOCKHOLDER DATAMarket value per share . . . . . . . . . . . . . . . . . . . . . . . . . . . . . . . . . . $2.33 $62.91 $2.33 $62.91Net income per share. . . . . . . . . . . . . . . . . . . . . . . . . . . . . . . . . . . . ($8.45) ($3.53) ($13.66) $0.25Net income per diluted share. . . . . . . . . . . . . . . . . . . . . . . . . . . . . . ($8.45) ($3.53) ($13.66) $0.25
OTHER EARNINGS MEASURES (Per diluted share)Net (loss) income . . . . . . . . . . . . . . . . . . . . . . . . . . . . . . . . . . . . . . ($8.45) ($3.53) ($13.66) $0.25Net security losses and (gains) (5) . . . . . . . . . . . . . . . . . . . . . . . . . . . $0.64 $5.42 ($1.68) $5.63Operating earnings (non-GAAP). . . . . . . . . . . . . . . . . . . . . . . . . . . ($7.81) $1.89 ($15.34) $5.88Refundings, calls and other accelerations, net. . . . . . . . . . . . . . . . . ($0.30) ($0.10) ($0.81) ($0.57)Core earnings (non-GAAP) . . . . . . . . . . . . . . . . . . . . . . . . . . . . . . . ($8.11) $1.79 ($16.15) $5.31
ADJUSTED BOOK VALUE ANALYSIS (Per share)Book value. . . . . . . . . . . . . . . . . . . . . . . . . . . . . . . . . . . . . . . . . . . . ($3.09) $55.64 ($3.09) $55.64After-tax value of: Net unearned premium reserve less deferred acquisition costs. . 4.52 16.12 4.52 16.12 Present value of future installment premiums. . . . . . . . . . . . . . . 5.63 17.06 5.63 17.06 Unrealized loss on investment agreement liabilities. . . . . . . . . . . 0.12 (0.75) 0.12 (0.75) Adjusted book value . . . . . . . . . . . . . . . . . . . . . . . . . . . . . . . . . . . . $7.18 $88.07 $7.18 $88.07
(1) Excludes the portion of long-term debt associated with variable interest entities of $273.5 million and $272.8 million at September 30, 2008 and2007, respectively.
(2) Capital and financial resources ratios (Statutory) and loss, expense and combined ratios (GAAP) relate solely to Financial Guarantee operations.(3) Loss ratio is computed as insurance loss and loss expense plus credit derivative estimated credit impairment losses divided by net premiums earned and fees earned on credit derivatives.(4) Expense ratio is computed as financial guarantee underwriting and operating expenses divided by net premiums earned and fees earned on
credit derivatives.(5) Includes net gains and losses from sales of investment securities, net mark-to-market gains and losses on credit derivatives, total return swaps and non-trading derivatives in the Financial Services business.
2

Earnings Analysis(Dollars in Millions)
Third ThirdQuarter 2008 Quarter 2007
Pre-tax income……………………………………………………….. ($3,071.9) ($494.9)
Pre-tax Financial Guarantee: Net realized investment gains …………………………………………… (49.4) (4.0) Credit default swaps - total ……………………………………………. 2,722.3 743.4 Credit default swaps - estimated impairment losses…………………… (2,509.0) - Non-trading derivatives (1)……………………………………………… - 3.8 Total Financial Guarantee……………………………………………. 163.9 743.2
Pre-tax Financial Services: Net realized investment losses ………………………………………… 85.0 1.3 Non-trading derivatives………………………………………………… 5.2 (0.2) Total return swaps……………………………………………………… 28.6 12.9 Total Financial Services……………………………………………… 118.8 14.0
Pre-tax Operating earnings………………………………………………… (2,789.2) 262.3Tax on Operating earnings………………………………………………… (541.7) 69.4
After-tax Operating earnings……………………………………………… ($2,247.5) $192.9
(1) Included within the line item "Other income" in the Consolidated Statements of Operations.
3

4
For Immediate Release
AMBAC FINANCIAL GROUP, INC. ANNOUNCES THIRD QUARTER NET LOSS OF $2,431.2 MILLION Third Quarter Net Loss Per Diluted Share of $8.45
NEW YORK, November 5, 2008--Ambac Financial Group, Inc. (NYSE: ABK) (Ambac) today announced third quarter 2008 net loss of $2,431.2 million, or net loss of $8.45 on a per share basis. This compares to third quarter 2007 net loss of $360.6 million, or net loss of $3.53 on a per share basis. The increased net loss in the third quarter of 2008 is primarily due to recording net mark-to-market losses on credit derivatives, increased loss provisioning primarily related to second-lien residential mortgage-backed securities (RMBS) insurance transactions and market losses on RMBS within the financial services investment portfolio, partially offset by increased accelerated premiums from refundings. Quarter Summary
• Net loss provisioning of $607.7 million was recorded for the quarter primarily relating to the second-lien RMBS insurance portfolio. The quarterly provision was offset by a benefit resulting from an estimate of substantiated representation and warranty breach recoveries in certain RMBS transactions.
• Net mark-to-market losses on credit derivatives amounted to $2,705.2 million. Estimated impairment losses in this portfolio amounted to approximately $2,509.0 million during the quarter primarily due to increased future loss projections in our portfolio of high grade collateralized debt obligations (CDOs). Operating earnings and core earnings for the third quarter and nine months of 2008, shown below in table I, include the impact of estimated credit impairment for those periods. See footnote 1, below, for definitions of operating and core earnings.
• Financial guarantee revenues, excluding net securities gains/losses and accelerated premiums from refundings (both are defined below), were $294.4 million in the third quarter 2008, down 6% from the third quarter 2007.
• On September 18, 2008, Moody’s put Ambac Assurance Corporation’s (AAC) Aa2 rating on review for possible downgrade. As a result, the $850 million capital contribution to Connie Lee that had been approved by the Office of the Commissioner of Insurance of the State of Wisconsin (OCI) has been postponed.
Ambac’s President and Chief Executive Officer, David Wallis, commented, “Housing related data continues to vacillate, having taken a turn for the worse over the past few months after showing positive signs earlier in the year. Our loss provisioning and on a more forward looking basis, our CDO impairments, are indicative of this.” Mr. Wallis continued, “Our commitment to the management of our portfolio remains paramount and we continue to make progress in this important area.”

5
Financial Results Net (Loss)/Income Per Share Net income per diluted share and net loss per share are computed in conformity with U.S. generally accepted accounting principles (GAAP). However, many research analysts and investors do not limit their analysis of our earnings to a strictly GAAP basis. In order to assist investors in their understanding of quarterly results, Ambac provides additional information.
Earnings measures reported by research analysts exclude the net (loss)/income impact of net gains and losses from sales of investment securities and mark-to-market gains and losses on credit, total return and non-trading derivative contracts that are not impaired (collectively “net security gains and losses”) and certain other items. Certain research analysts and investors further exclude the net income impact of accelerated premiums earned on guaranteed obligations that have been refunded and other accelerated earnings (“accelerated earnings”). Table I, below, provides third quarter and nine-month comparisons of earnings for 2008 and 2007.
Table I Earnings Per Diluted Share Third Quarter Nine Months 2008 2007 2008 2007
Net income (loss) per diluted share ($8.45) ($3.53) ($13.66) $0.25 Effect of net security losses 6.31 5.42 10.58 5.63
Less impairment losses (5.67) 0.00 (12.26) 0.00 Operating (loss) earnings (a) (b) ($7.81) $1.89 ($15.34) $5.88 Effect of accelerated earnings (0.30) (0.10) (0.81) (0.57) Core (loss) earnings (b) ($8.11) $1.79 ($16.15) $5.31
(a) Consensus earnings that are reported by earnings estimate services, such as First Call, are on this basis. (b) Operating and core earnings are non-GAAP measures. See footnote 1, below.
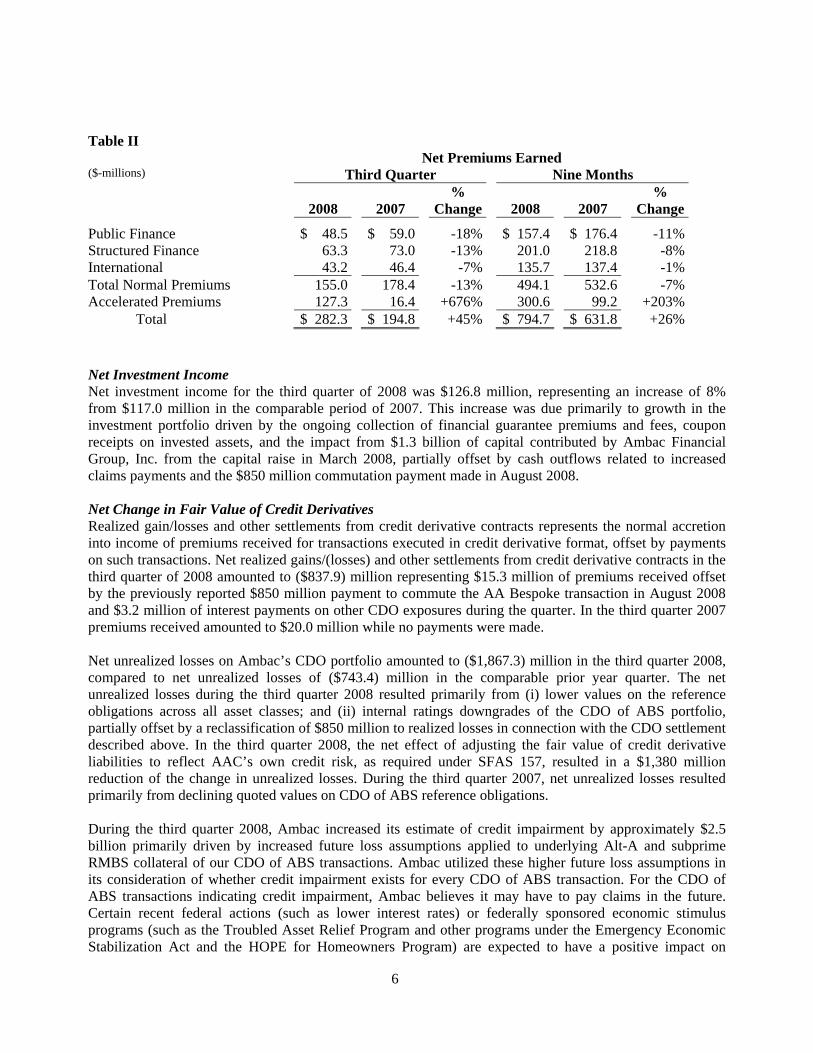
Net Premiums Earned Net premiums earned for the third quarter of 2008 were $282.3 million, up 45% from $194.8 million earned in the third quarter of 2007. Normal earned premiums in the third quarter 2008 of $155.0 million were 13% lower than $178.4 million reported in the third quarter 2007, primarily due to reduced premiums written in 2008, the high level of public finance refunding activity in 2008 and the Assured Guaranty Re cede which took place in December 2007. Net premiums earned include accelerated premiums, which result from refundings, calls and other accelerations recognized during the quarter. Accelerated premiums were $127.3 million in the third quarter of 2008, up $110.9 million from the third quarter of 2007. During the third quarter of 2008 and 2007, approximately 89% and 88%, respectively, of the accelerated premiums related to U.S. public finance transactions. A breakdown of net premiums earned by market sector for 2008 and 2007 are included in Table II. Normal net premiums earned exclude accelerated premiums that result from refundings, calls and other accelerations.
6
Table II Net Premiums Earned ($-millions) Third Quarter Nine Months
2008
2007 %
Change
2008
2007 %
Change
Public Finance $ 48.5 $ 59.0 -18% $ 157.4 $ 176.4 -11%Structured Finance 63.3 73.0 -13% 201.0 218.8 -8%International 43.2 46.4 -7% 135.7 137.4 -1%Total Normal Premiums 155.0 178.4 -13% 494.1 532.6 -7%Accelerated Premiums 127.3 16.4 +676% 300.6 99.2 +203% Total $ 282.3 $ 194.8 +45% $ 794.7 $ 631.8 +26%
Net Investment Income Net investment income for the third quarter of 2008 was $126.8 million, representing an increase of 8% from $117.0 million in the comparable period of 2007. This increase was due primarily to growth in the investment portfolio driven by the ongoing collection of financial guarantee premiums and fees, coupon receipts on invested assets, and the impact from $1.3 billion of capital contributed by Ambac Financial Group, Inc. from the capital raise in March 2008, partially offset by cash outflows related to increased claims payments and the $850 million commutation payment made in August 2008. Net Change in Fair Value of Credit Derivatives Realized gain/losses and other settlements from credit derivative contracts represents the normal accretion into income of premiums received for transactions executed in credit derivative format, offset by payments on such transactions. Net realized gains/(losses) and other settlements from credit derivative contracts in the third quarter of 2008 amounted to ($837.9) million representing $15.3 million of premiums received offset by the previously reported $850 million payment to commute the AA Bespoke transaction in August 2008 and $3.2 million of interest payments on other CDO exposures during the quarter. In the third quarter 2007 premiums received amounted to $20.0 million while no payments were made. Net unrealized losses on Ambac’s CDO portfolio amounted to ($1,867.3) million in the third quarter 2008, compared to net unrealized losses of ($743.4) million in the comparable prior year quarter. The net unrealized losses during the third quarter 2008 resulted primarily from (i) lower values on the reference obligations across all asset classes; and (ii) internal ratings downgrades of the CDO of ABS portfolio, partially offset by a reclassification of $850 million to realized losses in connection with the CDO settlement described above. In the third quarter 2008, the net effect of adjusting the fair value of credit derivative liabilities to reflect AAC’s own credit risk, as required under SFAS 157, resulted in a $1,380 million reduction of the change in unrealized losses. During the third quarter 2007, net unrealized losses resulted primarily from declining quoted values on CDO of ABS reference obligations. During the third quarter 2008, Ambac increased its estimate of credit impairment by approximately $2.5 billion primarily driven by increased future loss assumptions applied to underlying Alt-A and subprime RMBS collateral of our CDO of ABS transactions. Ambac utilized these higher future loss assumptions in its consideration of whether credit impairment exists for every CDO of ABS transaction. For the CDO of ABS transactions indicating credit impairment, Ambac believes it may have to pay claims in the future. Certain recent federal actions (such as lower interest rates) or federally sponsored economic stimulus programs (such as the Troubled Asset Relief Program and other programs under the Emergency Economic Stabilization Act and the HOPE for Homeowners Program) are expected to have a positive impact on

7
liquidity and credit throughout the markets and, therefore, were factored into management’s global assumptions of cumulative losses in the underlying collateral of the CDO of ABS transactions. Financial Guarantee Loss Reserves Total net loss and loss expenses were $607.7 million in the third quarter 2008, up from net expense of $19.1 million in the third quarter of 2007, primarily driven by increased second-lien RMBS losses in the third quarter 2008 as further deterioration in the performance of the underlying loans was observed, resulting in increased modeled losses. The losses related to second lien transactions are net of remediation benefits recorded for substantiated representation and warranty breaches in certain transactions amounting to approximately $250 million in the third quarter 2008. Such recoveries are expected to take several years for ultimate collection. Despite management’s expectation to recover under Ambac’s remediation rights, Ambac is required to meet all of its scheduled obligations to the bondholders of the impacted securities.
A roll forward of case basis and ACR reserves from June 30, 2008 to September 30, 2008 is shown in Table III.
Table III ($-millions) Insurance Loss Reserves Roll Forward
Case Reserve
ACR
Total
Incurred
Losses
Balance at June 30, 2008 $ 520.2 $ 555.5 $ 1,075.7 $ — Additions to reserves 383.8 223.9 607.7 607.7 Transfers from ACR to Case 179.1 (179.1) — — Less: claims paid (182.4) — (182.4) — Balance at September 30, 2008 $ 900.7 $ 600.3 $ 1,501.0 $ 607.7 The increase in case reserves was primarily driven by deteriorating performance in certain underperforming second-lien RMBS transactions partially offset by the impact of expected future remediation benefits. Total net claims paid during the quarter amounted to $182.4 million primarily related to second lien RMBS transactions.
Active credit reserves (ACR) are established for probable and estimable losses due to credit deterioration on certain adversely classified insured transactions. The ACR increase was primarily driven by deteriorating performance in certain underperforming RMBS and non-RMBS transactions partially offset by the impact of expected future remediation benefits as well as transfers of reserves to case basis as a result of defaults on certain second-lien RMBS that occurred during the quarter.
Case reserves and ACR for all RMBS insurance exposures at September 30, 2008 total $1,248.3 million, of which four transactions make up approximately 50% of the balance. The four transactions account for 54% of the total loss and loss adjustment expenses incurred during the third quarter 2008. Financial Services The financial services segment comprises the investment agreement business and the derivative products business. Gross interest income less gross interest expense from investment and payment agreements plus results from the derivative products business, excluding net realized investment gains and losses and unrealized gains and losses on total return swaps and non-trading derivative contracts, was ($3.1) million in

8
the third quarter of 2008, down from $9.8 million in the third quarter of 2007. The decrease resulted primarily from the increase in short-term municipal bond rates, which has caused a corresponding increase in Ambac’s payment obligations on related interest rate swaps, partially offset by increased net investment income from the investment agreement business During the first quarter 2008, Ambac announced that it would discontinue writing new Financial Services business as part of its efforts to refocus its business. The interest rate swap and investment agreement businesses are being run-off. Since year end 2007, approximately $960 million of swap notional has been terminated and approximately $725 million mitigated via restructuring or other strategies while the investment and payment agreement portfolio has been reduced by approximately $2.8 billion to $5.1 billion at September 30, 2008, through negotiated terminations and scheduled amortization. Taxes During the third quarter 2008, Ambac booked a $519 million valuation allowance against its deferred tax asset. The valuation allowance resulted from the significant increase in the unrealized loss on credit derivatives during the quarter. Liquidity Ambac’s financial guarantee investment portfolio amounts to $9.9 billion at September 30, 2008, and includes $1.1 billion of short-term securities. The portfolio consists primarily of high quality municipal bonds, Treasuries, U.S. Agencies and Agency MBS. In late October, Ambac received a $546 million tax refund related to taxes paid in prior years. Cash available at the holding company amounted to $186.6 million at quarter end. In October 2008, AAC made a dividend payment amounting to $54.6 million to the holding company and management expects to hold approximately 1.9 times debt service requirements at year end 2008. With respect to the impact of a potential downgrade on liquidity of the financial services business (which includes the investment agreement and derivative products businesses), Ambac has updated its calculations of the liquidity gap between the market value of the investment securities it holds in its financial services businesses and the value of the financial services liabilities that would need to be collateralized or terminated under various downgrade scenarios as of September 30. This liquidity gap is approximately $2.8 billion and $3.2 billion based on downgrades to A/A2 and BBB/Baa2, respectively. Almost all of the transactions entered into by our financial services businesses are guaranteed by AAC. Ambac continues to have discussions with the Commissioner of Insurance of the State of Wisconsin (OCI) regarding solutions to this potential shortfall. Ambac’s claims paying resources at September 30, 2008 increased to $15.4 billion from $14.5 billion at December 31, 2007, primarily on the strength of the net proceeds received from the $1.5 billion capital raise in March. AAC is currently rated AA and Aa3 by S&P and Moody’s, respectively. Moody’s announced on September 18 that its rating of Ambac is on review for possible downgrade after the agency significantly increased its subprime RMBS loss assumptions. Connie Lee Update In early September, Ambac announced that it had received regulatory approval from the OCI to capitalize and reactivate Connie Lee Insurance Company, which has been renamed Everspan Financial Guaranty Corp. ("Everspan"). AAC had planned to inject $850 million into Everspan with the intention of operating it as a

9
separate corporate and legal entity. However, on September 18, Moody’s announced that it is reviewing AAC for possible downgrade. As a result, management postponed the $850 million capital injection, pending greater clarity on AAC's rating. The Everspan team has continued to work closely with Moody's and Standard and Poor's in its efforts to achieve the highest ratings for the entity. Douglas Renfield-Miller, CEO of Everspan, stated, “While the start up of the new entity has been postponed due to capital uncertainties at AAC, our resolve towards initiating a fully transparent, municipal-only financial guarantee company has not wavered. I remain optimistic about this business proposition while ongoing dislocation in the municipal finance market clearly highlights the urgent need for its product.” About Ambac Ambac Financial Group, Inc., headquartered in New York City, is a holding company whose affiliates provide financial guarantees and financial services to clients in both the public and private sectors around the world. Ambac's principal operating subsidiary, Ambac Assurance Corporation, a guarantor of public finance and structured finance obligations, has earned a Aa3 rating (on review for possible downgrade) from Moody's Investors Service, Inc. and a AA rating (negative outlook) from Standard & Poor's Ratings Services. Ambac Financial Group, Inc. common stock is listed on the New York Stock Exchange (ticker symbol ABK). Contact Information: Investor/Media Contact: Vandana Sharma (212) 208-3333 [email protected] Fixed Income Contact: Peter Poillon (212) 208-3222 [email protected] Forward-Looking Statements
This release contains statements that may constitute "forward-looking statements" within the meaning of the safe harbor provisions of the Private Securities Litigation Reform Act of 1995. Any or all of management’s forward-looking statements here or in other publications may turn out to be wrong and are based on Ambac’s management current belief or opinions. Ambac’s actual results may vary materially, and there are no guarantees about the performance of Ambac’s securities. Among events, risks, uncertainties or factors that could cause actual results to differ materially are: (1) changes in Ambac’s and/or Ambac Assurance’s credit or financial strength ratings; (2) the risk of credit and liquidity risk due to unscheduled and unanticipated withdrawals on investment agreements; (3) the risk that market risks impact assets in our investment portfolio; (4) inadequacy of reserves established for losses and loss expenses; (5) credit risk throughout our business, including credit risk related to residential mortgage-backed securities and CDOs and large single exposures to reinsurers; (6) market spreads and pricing on insured collateralized debt obligations (“CDOs”) and other derivative products insured or issued by Ambac; (7) the risk that holders of debt securities or counterparties on credit default swaps or other similar agreements seek to declare events of default or seek judicial relief or bring claims alleging violation or breach of covenants by Ambac or one of its subsidiaries; (8) default by one or more of Ambac Assurance’s portfolio investments, insured issuers, counterparties or reinsurers; (9) the risk that we may be required to raise additional capital, which could have a dilutive effect on our outstanding equity capital and/or future earnings; (10) our ability or inability to raise additional capital, including the risks that regulatory or other approvals for any plan to raise capital are not obtained, or that various conditions to such a plan, either imposed by third parties or imposed by Ambac or its Board of Directors, are not satisfied and thus potentially necessary capital

10
raising transactions do not occur, or the risk that for other reasons the Company cannot accomplish any potentially necessary capital raising transactions; (11) the risk that Ambac’s holding company structure and certain regulatory and other constraints, including adverse business performance, affect Ambac’s ability to pay dividends and make other payments; (12) legislative and regulatory developments, including the Troubled Asset Relief Program and other programs under the Emergency Economic Stabilization Act and other similar programs; (13) changes in the economic, credit, foreign currency or interest rate environment in the United States and abroad; (14) changes in capital requirements whether resulting from downgrades in our insured portfolio or changes in rating agencies’ rating criteria or other reasons; (15) changes in accounting principles or practices relating to the financial guarantee industry or that may impact Ambac’s reported financial results; (16) the level of activity within the national and worldwide credit markets; (17) competitive conditions, pricing levels and reduction in demand for financial guarantee products; (18) changes in our business plan, our decision to discontinue writing new business in the financial services area, to significantly reduce new underwriting of structured finance business and to discontinue all new underwritings of structured finance business; (19) the risk that our underwriting and risk management policies and practices do not anticipate certain risks and/or the magnitude of potential for loss as a result of unforeseen risks; (20) the risk of volatility in income and earnings, including volatility due to the application of fair value accounting, or FAS 133, to the portion of our credit enhancement business which is executed in credit derivative form; (21) changes in expectations regarding future realization of gross deferred tax assets; (22) risks relating to the re-launch of Connie Lee as Everspan Financial Guaranty Corp.; (23) operational risks, including with respect to internal processes, risk models, systems and employees; (24) the risk of decline in market position; (25) changes in prepayment speeds on insured asset-backed securities; (26) factors that may influence the amount of installment premiums paid to Ambac; (27) the risk of litigation and regulatory inquiries or investigations, and the risk of adverse outcomes in connection therewith, which could have a material adverse effect on our business, operations, financial position, profitability or cash flows; (28) changes in tax laws; (29) the policies and actions of the United States and other governments; (30) other factors described in the Risk Factors section in Part I, 1A of our Annual Report on Form 10-K for the fiscal year ended December 31, 2007 and in Part II, Item 1A of our Quarterly Report on Form 10-Q for the quarters ended March 31, 2008 and June 30, 2008, and also disclosed from time to time by Ambac in its subsequent reports on Form 10-Q and Form 8-K, which are or will be available on the Ambac website at www.ambac.com and at the SEC’s website, www.sec.gov; and (31) other risks and uncertainties that have not been identified at this time. Readers are cautioned that forward-looking statements speak only as of the date they are made and that Ambac does not undertake to update forward-looking statements to reflect circumstances or events that arise after the date the statements are made. You are therefore advised to consult any further disclosures we make on related subjects in Ambac’s reports to the SEC.
*******************
Footnote (1) Operating earnings and core earnings are not substitutes for net income computed in accordance
with GAAP, but are useful measures of performance used by management, equity analysts and investors because they allow more consistent period-to-period comparison of our earnings without the effects of net securities gains/losses and accelerated earnings. Net securities gains/losses excluded from operating earnings consists of investment portfolio realized gains and losses, mark-to-market gains and losses on credit, total return and non-trading derivative contracts in excess of estimated impairment amounts, and certain other items. Core earnings further exclude the impact of refundings, calls and other accelerations. The definitions of operating earnings and core earnings used by Ambac may differ from definitions of operating earnings and core earnings used by other public holding companies of financial guarantors.
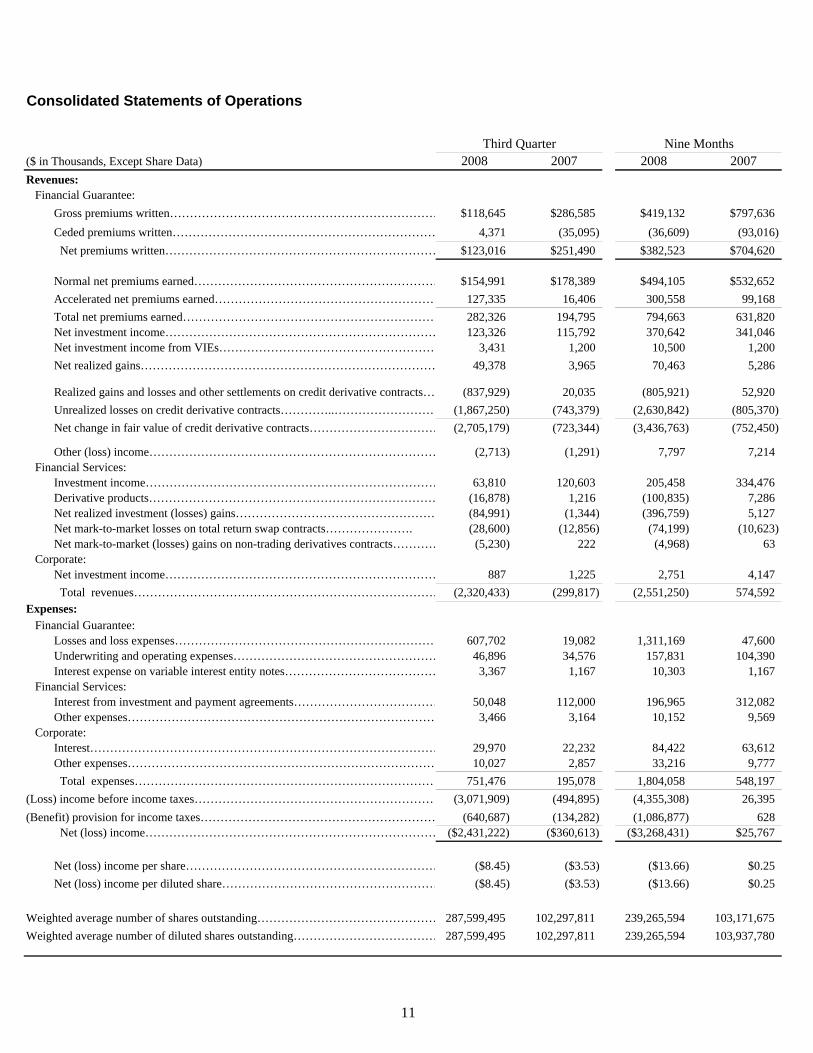
Consolidated Statements of Operations
Third Quarter Nine Months($ in Thousands, Except Share Data) 2008 2007 2008 2007Revenues: Financial Guarantee:
Gross premiums written…………………………………………………………… $118,645 $286,585 $419,132 $797,636Ceded premiums written………………………………………………………… 4,371 (35,095) (36,609) (93,016) Net premiums written…………………………………………………………… $123,016 $251,490 $382,523 $704,620
Normal net premiums earned……………………………………………………… $154,991 $178,389 $494,105 $532,652Accelerated net premiums earned………………………………………………… 127,335 16,406 300,558 99,168 Total net premiums earned……………………………………………………… 282,326 194,795 794,663 631,820 Net investment income…………………………………………………………… 123,326 115,792 370,642 341,046 Net investment income from VIEs……………………………………………… 3,431 1,200 10,500 1,200 Net realized gains………………………………………………………………… 49,378 3,965 70,463 5,286
Realized gains and losses and other settlements on credit derivative contracts… (837,929) 20,035 (805,921) 52,920 Unrealized losses on credit derivative contracts…………..……………………… (1,867,250) (743,379) (2,630,842) (805,370) Net change in fair value of credit derivative contracts…………………………… (2,705,179) (723,344) (3,436,763) (752,450)
Other (loss) income……………………………………………………………… (2,713) (1,291) 7,797 7,214 Financial Services:
Investment income………………………………………………………………… 63,810 120,603 205,458 334,476 Derivative products……………………………………………………………… (16,878) 1,216 (100,835) 7,286 Net realized investment (losses) gains…………………………………………… (84,991) (1,344) (396,759) 5,127 Net mark-to-market losses on total return swap contracts…………………. (28,600) (12,856) (74,199) (10,623) Net mark-to-market (losses) gains on non-trading derivatives contracts………… (5,230) 222 (4,968) 63
Corporate:Net investment income…………………………………………………………… 887 1,225 2,751 4,147 Total revenues…………………………………………………………………… (2,320,433) (299,817) (2,551,250) 574,592
Expenses: Financial Guarantee:
Losses and loss expenses………………………………………………………… 607,702 19,082 1,311,169 47,600 Underwriting and operating expenses…………………………………………… 46,896 34,576 157,831 104,390 Interest expense on variable interest entity notes………………………………… 3,367 1,167 10,303 1,167
Financial Services:Interest from investment and payment agreements……………………………… 50,048 112,000 196,965 312,082 Other expenses…………………………………………………………………… 3,466 3,164 10,152 9,569
Corporate: Interest…………………………………………………………………………… 29,970 22,232 84,422 63,612 Other expenses…………………………………………………………………… 10,027 2,857 33,216 9,777
Total expenses…………………………………………………………………… 751,476 195,078 1,804,058 548,197 (Loss) income before income taxes……………………………………………………… (3,071,909) (494,895) (4,355,308) 26,395 (Benefit) provision for income taxes…………………………………………………… (640,687) (134,282) (1,086,877) 628
Net (loss) income………………………………………………………………… ($2,431,222) ($360,613) ($3,268,431) $25,767
Net (loss) income per share……………………………………………………… ($8.45) ($3.53) ($13.66) $0.25Net (loss) income per diluted share……………………………………………… ($8.45) ($3.53) ($13.66) $0.25
Weighted average number of shares outstanding……………………………………… 287,599,495 102,297,811 239,265,594 103,171,675 Weighted average number of diluted shares outstanding……………………………… 287,599,495 102,297,811 239,265,594 103,937,780
11

Consolidated Balance Sheets September 30, December 31,
($ in Thousands, Except Share Data) 2008 2007ASSETSInvestments:
Fixed income securities, at fair value(amortized cost of $14,117,861 in 2008 and $17,225,611 in 2007) . . . . . . . . . . . . $12,407,606 $17,127,485Fixed income securities pledged as collateral, at fair value(amortized cost of $0 in 2008 and $345,140 in 2007) . . . . . . . . . . . . . . . . . . . . . . - 374,840 Short-term investments(amortized cost of $1,334,266 in 2008 and $879,039 in 2007) . . . . . . . . . . . . . . . 1,334,266 879,067 Other (cost of $13,769 in 2008 and $13,571 in 2007) . . . . . . . . . . . . . . . . . . . . . . . 13,475 14,278 Total investments. . . . . . . . . . . . . . . . . . . . . . . . . . . . . . . . . . . . . . . . . . . . . . . . . 13,755,347 18,395,670
Cash . . . . . . . . . . . . . . . . . . . . . . . . . . . . . . . . . . . . . . . . . . . . . . . . . . . . . . . . . . . . . . . . . . 92,380 123,933 Receivable for securities sold. . . . . . . . . . . . . . . . . . . . . . . . . . . . . . . . . . . . . . . . . . . . . . . 165,626 11,068 Investment income due and accrued . . . . . . . . . . . . . . . . . . . . . . . . . . . . . . . . . . . . . . . . . 139,967 202,737 Reinsurance recoverable on paid and unpaid losses . . . . . . . . . . . . . . . . . . . . . . . . . . . . . 72,376 11,862 Prepaid reinsurance . . . . . . . . . . . . . . . . . . . . . . . . . . . . . . . . . . . . . . . . . . . . . . . . . . . . . . 327,165 489,028 Deferred taxes . . . . . . . . . . . . . . . . . . . . . . . . . . . . . . . . . . . . . . . . . . . . . . . . . . . . . . . . . . 2,905,260 2,116,380 Current income taxes . . . . . . . . . . . . . . . . . . . . . . . . . . . . . . . . . . . . . . . . . . . . . . . . . . . . 753,832 - Deferred acquisition costs . . . . . . . . . . . . . . . . . . . . . . . . . . . . . . . . . . . . . . . . . . . . . . . . . 221,788 255,639 Loans. . . . . . . . . . . . . . . . . . . . . . . . . . . . . . . . . . . . . . . . . . . . . . . . . . . . . . . . . . . . . . . . . . 830,985 867,676 Derivative assets .. . . . . . . . . . . . . . . . . . . . . . . . . . . . . . . . . . . . . . . . . . . . . . . . . . . . . . . 904,151 990,534 Other assets . . . . . . . . . . . . . . . . . . . . . . . . . . . . . . . . . . . . . . . . . . . . . . . . . . . . . . . . . . . . 277,298 100,484
Total assets . . . . . . . . . . . . . . . . . . . . . . . . . . . . . . . . . . . . . . . . . . . . . . . . . . . . . $20,446,175 $23,565,011LIABILITIES AND STOCKHOLDERS' EQUITYLiabilities:
Unearned premiums . . . . . . . . . . . . . . . . . . . . . . . . . . . . . . . . . . . . . . . . . . . . . . . . . $2,547,414 $3,123,860Loss and loss expense reserve . . . . . . . . . . . . . . . . . . . . . . . . . . . . . . . . . . . . . . . . 1,556,715 484,276 Ceded reinsurance balances payable . . . . . . . . . . . . . . . . . . . . . . . . . . . . . . . . . . . . 13,459 32,435 Obligations under investment and payment agreements . . . . . . . . . . . . . . . . . . . . . 5,482,983 8,570,902 Obligations under investment repurchase agreements. . . . . . . . . . . . . . . . . . . . . . . . 135,305 135,524 Securities sold under agreement to repurchase . . . . . . . . . . . . . . . . . . . . . . . . . . . . - 100,000 Current income taxes . . . . . . . . . . . . . . . . . . . . . . . . . . . . . . . . . . . . . . . . . . . . . . . . - 97,826 Long-term debt . . . . . . . . . . . . . . . . . . . . . . . . . . . . . . . . . . . . . . . . . . . . . . . . . . . . 1,895,858 1,669,945 Accrued interest payable. . . . . . . . . . . . . . . . . . . . . . . . . . . . . . . . . . . . . . . . . . . . . . 67,328 113,443 Derivative liabilities. . . . . . . . . . . . . . . . . . . . . . . . . . . . . . . . . . . . . . . . . . . . . . . . . . 9,419,466 6,685,528 Other liabilities . . . . . . . . . . . . . . . . . . . . . . . . . . . . . . . . . . . . . . . . . . . . . . . . . . . . 206,590 270,734 Payable for securities purchased . . . . . . . . . . . . . . . . . . . . . . . . . . . . . . . . . . . . . . 7,969 645 Total liabilities. . . . . . . . . . . . . . . . . . . . . . . . . . . . . . . . . . . . . . . . . . . . . . . . . . . 21,333,087 21,285,118
Stockholders' equity:
Preferred stock. . . . . . . . . . . . . . . . . . . . . . . . . . . . . . . . . . . . . . . . . . . . . . . . . . . . . . - - Common stock. . . . . . . . . . . . . . . . . . . . . . . . . . . . . . . . . . . . . . . . . . . . . . . . . . . . . . 2,944 1,092 Additional paid-in capital. . . . . . . . . . . . . . . . . . . . . . . . . . . . . . . . . . . . . . . . . . . . . 2,028,141 839,952 Accumulated other comprehensive loss. . . . . . . . . . . . . . . . . . . . . . . . . . . . . . . . . . . (1,116,627) (22,138) Retained earnings. . . . . . . . . . . . . . . . . . . . . . . . . . . . . . . . . . . . . . . . . . . . . . . . . . . . (1,205,956) 2,107,773 Common stock held in treasury at cost. . . . . . . . . . . . . . . . . . . . . . . . . . . . . . . . . . . (595,414) (646,786) Total stockholders' equity. . . . . . . . . . . . . . . . . . . . . . . . . . . . . . . . . . . . . . . . . . . (886,912) 2,279,893 Total liabilities and stockholders' equity. . . . . . . . . . . . . . . . . . . . . . . . . . . . . $20,446,175 $23,565,011
Number of shares outstanding (net of treasury shares). . . . . . . . . . . . . . . . . . . . . . . 287,228,352 101,550,023 Book value per share . . . . . . . . . . . . . . . . . . . . . . . . . . . . . . . . . . . . . . . . . . . . . . . . . ($3.09) $22.45Adjusted book value per share. . . . . . . . . . . . . . . . . . . . . . . . . . . . . . . . . . . . . . . . . . $7.18 $55.20
12

Financial Guarantees(1)(2)(3)
($ Thousands) 2008 2007 2008 2007Public Finance: Gross Par Guaranteed . . . . . . . . . . . . . . . . . . . . . . . . . . . . . . . . . . . . . . . . . . . . . . . . . . . . $354,382 $14,191,917 $1,603,756 $42,749,908
Up-front Premium . . . . . . . . . . . . . . . . . . . . . . . . . . . . . . . . . . . . . . . . . . . . . . . . . . . . . . . $709 $122,983 $13,061 $334,043 Installment Premium . . . . . . . . . . . . . . . . . . . . . . . . . . . . . . . . . . . . . . . . . . . . . . . . . . . . 5,422 5,132 19,727 20,156 Gross Premium . . . . . . . . . . . . . . . . . . . . . . . . . . . . . . . . . . . . . . . . . . . . . . . . . . . . . . . $6,131 $128,115 $32,788 $354,199
Credit Enhancement Production . . . . . . . . . . . . . . . . . . . . . . . . . . . . . . . . . . . . . . . . . . $8,039 $151,339 $21,156 $380,441
Net Credit Enhancement Production . . . . . . . . . . . . . . . . . . . . . . . . . . . . . . . . . . . . . . $22,585 $141,808 $39,310 $348,056
Structured Finance: Gross Par Guaranteed . . . . . . . . . . . . . . . . . . . . . . . . . . . . . . . . . . . . . . . . . . . . . . . . . . . . $1,148,655 $11,005,753 $6,054,773 $45,510,746
Up-front Premium . . . . . . . . . . . . . . . . . . . . . . . . . . . . . . . . . . . . . . . . . . . . . . . . . . . . . . . $0 $5,818 $2,048 $22,097 Installment Premium . . . . . . . . . . . . . . . . . . . . . . . . . . . . . . . . . . . . . . . . . . . . . . . . . . . . 68,101 75,853 220,016 230,382 Gross Premium . . . . . . . . . . . . . . . . . . . . . . . . . . . . . . . . . . . . . . . . . . . . . . . . . . . . . . . $68,101 $81,671 $222,064 $252,479
Credit Enhancement Production . . . . . . . . . . . . . . . . . . . . . . . . . . . . . . . . . . . . . . . . . . $17,853 $108,179 $58,005 $402,602
Net Credit Enhancement Production . . . . . . . . . . . . . . . . . . . . . . . . . . . . . . . . . . . . . . $44,142 $76,011 $83,995 $343,716
International Finance: Gross Par Guaranteed . . . . . . . . . . . . . . . . . . . . . . . . . . . . . . . . . . . . . . . . . . . . . . . . . . . . $629,937 $8,194,362 $1,800,666 $15,654,570
Up-front Premium . . . . . . . . . . . . . . . . . . . . . . . . . . . . . . . . . . . . . . . . . . . . . . . . . . . . . . . ($687) $20,213 ($310) $30,963 Installment Premium . . . . . . . . . . . . . . . . . . . . . . . . . . . . . . . . . . . . . . . . . . . . . . . . . . . . 45,100 56,586 164,590 159,995 Gross Premium . . . . . . . . . . . . . . . . . . . . . . . . . . . . . . . . . . . . . . . . . . . . . . . . . . . . . . . $44,413 $76,799 $164,280 $190,958
Credit Enhancement Production . . . . . . . . . . . . . . . . . . . . . . . . . . . . . . . . . . . . . . . . . . $237 $171,628 $6,941 $326,012
Net Credit Enhancement Production . . . . . . . . . . . . . . . . . . . . . . . . . . . . . . . . . . . . . . $47,023 $114,096 $63,175 $241,493
Grand Total: Gross Par Guaranteed . . . . . . . . . . . . . . . . . . . . . . . . . . . . . . . . . . . . . . . . . . . . . . . . . . . . $2,132,974 $33,392,032 $9,459,195 $103,915,224
Up-front Premium . . . . . . . . . . . . . . . . . . . . . . . . . . . . . . . . . . . . . . . . . . . . . . . . . . . . . . . $22 $149,014 $14,799 $387,103 Installment Premium . . . . . . . . . . . . . . . . . . . . . . . . . . . . . . . . . . . . . . . . . . . . . . . . . . . 118,623 137,571 404,333 410,533 Gross Premium . . . . . . . . . . . . . . . . . . . . . . . . . . . . . . . . . . . . . . . . . . . . . . . . . . . . . . . $118,645 $286,585 $419,132 $797,636
Credit Enhancement Production . . . . . . . . . . . . . . . . . . . . . . . . . . . . . . . . . . . . . . . . . . $26,129 $431,146 $86,102 $1,109,055
Net Credit Enhancement Production . . . . . . . . . . . . . . . . . . . . . . . . . . . . . . . . . . . . . . $113,750 $331,915 $186,480 $933,265
(1) Credit enhancement production (CEP) and net credit enhancement production (NCEP) includes reinsurance assumed of $0.7 million and $3.3 million in the third quarter and nine months ended September 2008, respectively, offset by a cancellation of an assumed reinsurance contract resulting in ($0.7) million in CEP and NCEP in the third quarter and nine months ended September 2008. CEP and NCEP includes reinsurance assumed of $0.1 million and $15.4 million in the third quarter and nine months ended September 2007, respectively. NCEP is defined as CEP less reinsurance cessions. NCEP for the third quarter and nine months ended September 2008 includes $87.7 million and $103.0 million of recaptured reinsurance cessions relating to the cancellation of certain reinsurance contracts, respectively.(2) International Finance includes components of domestic exposure. (3) CEP and NCEP were discounted at rates of 5.2%, 5.0% and 5.3% in the first, second and third quarters of 2008, respectively, and at 5.4%, 5.4% and 5.8% in the first, second and third quarters of 2007.
Third Quarter Year-to-Date
13

Normal Net Insurance Premiums Earned and Fees on Credit DerivativesFirst Second Third Fourth Year-to
2008 ($ Thousands) Quarter Quarter Quarter Quarter DatePublic Finance:Up-front premiums earned . . . . . . . . . . . . . . . . . . . . . . . . . . . . . . . . . . . . . . . . . . . . . . . . . . $48,778 $46,106 $42,397 $137,281Installment premiums earned . . . . . . . . . . . . . . . . . . . . . . . . . . . . . . . . . . . . . . . . . . . . . . . 7,033 6,960 6,100 20,093 Total Public Finance premiums earned . . . . . . . . . . . . . . . . . . . . . . . . . . . . . . . . . . . 55,811 53,066 48,497 - 157,374
Structured Finance:Up-front premiums earned . . . . . . . . . . . . . . . . . . . . . . . . . . . . . . . . . . . . . . . . . . . . . . . . . . 3,956 3,939 3,389 11,284 Installment premiums earned . . . . . . . . . . . . . . . . . . . . . . . . . . . . . . . . . . . . . . . . . . . . . . . 66,418 63,430 59,903 189,751 Total Structured Finance premiums earned . . . . . . . . . . . . . . . . . . . . . . . . . . . . . . . 70,374 67,369 63,292 - 201,035
International Finance:Up-front premiums earned . . . . . . . . . . . . . . . . . . . . . . . . . . . . . . . . . . . . . . . . . . . . . . . . . . 5,082 5,122 4,831 15,035 Installment premiums earned . . . . . . . . . . . . . . . . . . . . . . . . . . . . . . . . . . . . . . . . . . . . . . . 41,603 40,687 38,371 120,661 Total International Finance premiums earned . . . . . . . . . . . . . . . . . . . . . . . . . . . . 46,685 45,809 43,202 - 135,696
Total normal premiums earned . . . . . . . . . . . . . . . . . . . . . . . . . . . . . . . . . . . . . . . . $172,870 $166,244 $154,991 $0 $494,105
Fees on credit derivative contracts (1) . . . . . . . . . . . . . . . . . . . . . . . . . . . . . . . . . . . . . . . . $16,973 $16,709 $15,342 $0 $49,024
First Second Third Fourth Full2007 ($ Thousands) Quarter Quarter Quarter Quarter YearPublic Finance:Up-front premiums earned . . . . . . . . . . . . . . . . . . . . . . . . . . . . . . . . . . . . . . . . . . . . . . . . . . $51,170 $52,005 $51,748 $50,880 $205,803Installment premiums earned . . . . . . . . . . . . . . . . . . . . . . . . . . . . . . . . . . . . . . . . . . . . . . . 7,182 7,070 7,281 7,514 29,047 Total Public Finance premiums earned . . . . . . . . . . . . . . . . . . . . . . . . . . . . . . . . . . . 58,352 59,075 59,029 58,394 234,850
Structured Finance:Up-front premiums earned . . . . . . . . . . . . . . . . . . . . . . . . . . . . . . . . . . . . . . . . . . . . . . . . . . 4,624 4,492 4,319 4,205 17,640 Installment premiums earned . . . . . . . . . . . . . . . . . . . . . . . . . . . . . . . . . . . . . . . . . . . . . . . 67,245 69,487 68,631 68,720 274,083 Total Structured Finance premiums earned . . . . . . . . . . . . . . . . . . . . . . . . . . . . . . . 71,869 73,979 72,950 72,925 291,723
International Finance:Up-front premiums earned . . . . . . . . . . . . . . . . . . . . . . . . . . . . . . . . . . . . . . . . . . . . . . . . . . 5,801 5,776 5,366 5,536 22,479 Installment premiums earned . . . . . . . . . . . . . . . . . . . . . . . . . . . . . . . . . . . . . . . . . . . . . . . 40,258 39,153 41,044 42,971 163,426 Total International Finance premiums earned . . . . . . . . . . . . . . . . . . . . . . . . . . . . 46,059 44,929 46,410 48,507 185,905
Total normal premiums earned . . . . . . . . . . . . . . . . . . . . . . . . . . . . . . . . . . . . . . . . $176,280 $177,983 $178,389 $179,826 $712,478
Fees on credit derivative contracts (1) . . . . . . . . . . . . . . . . . . . . . . . . . . . . . . . . . . . . . . . . $15,553 $17,332 $20,035 $23,514 $76,434
Effect of Refundings, Calls and Other AccelerationsFirst Second Third Fourth Year-to
2008 ($ Thousands, Except Share Data) Quarter Quarter Quarter Quarter Date
Earned premium recognized from refundings, calls and other accelerations. . . . $13,996 $159,227 $127,335 $300,558Net income effect . . . . . . . . . . . . . . . . . . . . . . . . . . . . . . . . . . . . . . . . . . . . . . . . . . . . . . . . . . $20,372 $87,738 $85,315 $193,425Net income per diluted share effect . . . . . . . . . . . . . . . . . . . . . . . . . . . . . . . . . . . . . . . . . . $0.15 $0.30 $0.30 $0.81
First Second Third Fourth Full2007 ($ Thousands, Except Share Data) Quarter Quarter Quarter Quarter Year
Earned premium recognized from refundings, calls and other accelerations. . . . $39,726 $43,036 $16,406 $29,815 $128,983Net income effect . . . . . . . . . . . . . . . . . . . . . . . . . . . . . . . . . . . . . . . . . . . . . . . . . . . . . . . . . . $24,658 $25,588 $9,559 $18,395 $78,200Net income per diluted share effect . . . . . . . . . . . . . . . . . . . . . . . . . . . . . . . . . . . . . . . . . . $0.24 $0.25 $0.10 $0.18 $0.76
(1) Fees on credit derivative contracts are included in "Realized gains & other settlements on credit derivative contracts" on the consolidated statement of operations.
14

Public Finance New Issuance (1)(2)
MarketInsured Share
($ Millions of Par Value) Issued Insured Percent Insured Percent2008 By Quarter
Third. . . . . . . . . . . . . . . . . . . . . . . . . . . . . . . . . $89,240 $11,420 12.8% $234 2.0%Second. . . . . . . . . . . . . . . . . . . . . . . . . . . . . . . 144,201 31,460 21.8% 223 0.7%First. . . . . . . . . . . . . . . . . . . . . . . . . . . . . . . . . 83,367 22,258 26.7% 261 1.2%2007 By Quarter
Fourth . . . . . . . . . . . . . . . . . . . . . . . . . . . . . . . $105,725 $43,667 41.3% $7,744 17.7%Third . . . . . . . . . . . . . . . . . . . . . . . . . . . . . . . . 92,957 46,531 50.1% 13,019 28.0%Second . . . . . . . . . . . . . . . . . . . . . . . . . . . . . . . 123,917 55,703 45.0% 11,422 20.5%First. . . . . . . . . . . . . . . . . . . . . . . . . . . . . . . . . 106,411 55,117 51.8% 13,340 24.2%
Full Year
Year-to-date 2008. . . . . . . . . . . . . . . . . . . . . . $316,808 $65,138 20.6% $718 1.1%2007. . . . . . . . . . . . . . . . . . . . . . . . . . . . . . . . . 429,010 201,018 46.9% 45,525 22.6%2006. . . . . . . . . . . . . . . . . . . . . . . . . . . . . . . . . 388,716 184,805 47.5% 43,111 23.3%2005. . . . . . . . . . . . . . . . . . . . . . . . . . . . . . . . . 408,266 233,046 57.1% 57,527 24.7%2004. . . . . . . . . . . . . . . . . . . . . . . . . . . . . . . . . 359,717 194,887 54.2% 44,760 23.0%2003. . . . . . . . . . . . . . . . . . . . . . . . . . . . . . . . . 383,559 190,641 49.7% 39,200 20.6%2002. . . . . . . . . . . . . . . . . . . . . . . . . . . . . . . . . 358,569 178,928 49.9% 35,894 20.1%2001. . . . . . . . . . . . . . . . . . . . . . . . . . . . . . . . . 288,083 134,359 46.6% 32,573 24.2%2000. . . . . . . . . . . . . . . . . . . . . . . . . . . . . . . . . 200,880 79,305 39.5% 17,185 21.7%1999. . . . . . . . . . . . . . . . . . . . . . . . . . . . . . . . . 227,741 105,575 46.4% 26,555 25.2%1998. . . . . . . . . . . . . . . . . . . . . . . . . . . . . . . . . 286,817 145,515 50.7% 29,552 20.3%1997. . . . . . . . . . . . . . . . . . . . . . . . . . . . . . . . . 220,685 107,468 48.7% 25,405 23.6%1996. . . . . . . . . . . . . . . . . . . . . . . . . . . . . . . . . 185,210 85,708 46.3% 24,694 28.8%1995. . . . . . . . . . . . . . . . . . . . . . . . . . . . . . . . . 160,369 68,553 42.7% 16,983 24.8%1994. . . . . . . . . . . . . . . . . . . . . . . . . . . . . . . . . 165,034 61,512 37.3% 17,437 28.3%1993. . . . . . . . . . . . . . . . . . . . . . . . . . . . . . . . . 292,249 107,955 36.9% 31,487 29.2%1992. . . . . . . . . . . . . . . . . . . . . . . . . . . . . . . . . 234,667 80,762 34.4% 24,596 30.5%
(1) Figures are Ambac estimates subject to revisions as new information becomes available. It is compiled from The Bond Buyer and Thompson Financial.(2) Data for industry and Ambac is provided on a sale date basis and will not agree with Ambac data in subsequent sections which is provided on a closing date basis.
Total New Issue Market Insured by Ambac
15

Net Exposure Amortization(1)
As of September 30, 2008Estimated Net Ending NetDebt Service Debt Service
($ Millions) Amortization Outstanding
2008 (4th Qtr). . . . . . . . . . . . . . . . . . . . . . . . . . . . . . . . . . . . . . . . . . . . . . . . . . . . . . . . . . . . . . . . . . . . . . . . . . . . . . . . . $11,772 $770,8232009. . . . . . . . . . . . . . . . . . . . . . . . . . . . . . . . . . . . . . . . . . . . . . . . . . . . . . . . . . . . . . . . . . . . . . . . . . . . . . . . . . . . . . . . . . . . 39,814 731,009 2010. . . . . . . . . . . . . . . . . . . . . . . . . . . . . . . . . . . . . . . . . . . . . . . . . . . . . . . . . . . . . . . . . . . . . . . . . . . . . . . . . . . . . . . . . . . . 40,093 690,916 2011. . . . . . . . . . . . . . . . . . . . . . . . . . . . . . . . . . . . . . . . . . . . . . . . . . . . . . . . . . . . . . . . . . . . . . . . . . . . . . . . . . . . . . . . . . . . 50,584 640,332 2012. . . . . . . . . . . . . . . . . . . . . . . . . . . . . . . . . . . . . . . . . . . . . . . . . . . . . . . . . . . . . . . . . . . . . . . . . . . . . . . . . . . . . . . . . . . . 36,391 603,941 2013. . . . . . . . . . . . . . . . . . . . . . . . . . . . . . . . . . . . . . . . . . . . . . . . . . . . . . . . . . . . . . . . . . . . . . . . . . . . . . . . . . . . . . . . . . . . 36,900 567,041
2008 (4th Qtr). . . . . . . . . . . . . . . . . . . . . . . . . . . . . . . . . . . . . . . . . . . . . . . . . . . . . . . . . . . . . . . . . . . . . . . . . . . . . . . . . 11,772 770,823 2009-2013. . . . . . . . . . . . . . . . . . . . . . . . . . . . . . . . . . . . . . . . . . . . . . . . . . . . . . . . . . . . . . . . . . . . . . . . . . . . . . . . . . . . . 203,782 567,041 2014-2018. . . . . . . . . . . . . . . . . . . . . . . . . . . . . . . . . . . . . . . . . . . . . . . . . . . . . . . . . . . . . . . . . . . . . . . . . . . . . . . . . . . . . 161,947 405,094 2019-2023. . . . . . . . . . . . . . . . . . . . . . . . . . . . . . . . . . . . . . . . . . . . . . . . . . . . . . . . . . . . . . . . . . . . . . . . . . . . . . . . . . . . . 124,319 280,775 2024-2028. . . . . . . . . . . . . . . . . . . . . . . . . . . . . . . . . . . . . . . . . . . . . . . . . . . . . . . . . . . . . . . . . . . . . . . . . . . . . . . . . . . . . 90,959 189,816 After 2028. . . . . . . . . . . . . . . . . . . . . . . . . . . . . . . . . . . . . . . . . . . . . . . . . . . . . . . . . . . . . . . . . . . . . . . . . . . . . . . . . . . . . 189,816 -
$782,595
Net Unearned Premium Amortization and Estimated Future Installment PremiumsAs of September 30, 2008
Estimated Total Fees on Net Future Premium Credit Derivative
($ Millions) Upfront Installments Installments(3) Earnings Contracts
2008 (4th Qtr). . . . . . . . . . . . . . . . . . . . . . . . . . . . . $49.0 $25.1 $76.8 $150.9 $14.02009. . . . . . . . . . . . . . . . . . . . . . . . . . . . . . . . . . . . . . . . 186.6 18.5 352.6 557.7 55.2 2010. . . . . . . . . . . . . . . . . . . . . . . . . . . . . . . . . . . . . . . . 173.3 2.9 324.9 501.1 52.5 2011. . . . . . . . . . . . . . . . . . . . . . . . . . . . . . . . . . . . . . . . 161.4 2.5 274.3 438.2 47.4 2012. . . . . . . . . . . . . . . . . . . . . . . . . . . . . . . . . . . . . . . . 150.3 1.8 219.9 372.0 43.3 2013. . . . . . . . . . . . . . . . . . . . . . . . . . . . . . . . . . . . . . . . 138.3 1.4 192.2 331.9 37.8
2008 (4th Qtr). . . . . . . . . . . . . . . . . . . . . . . . . . . . . 49.0 25.1 76.8 150.9 14.0 2009-2013. . . . . . . . . . . . . . . . . . . . . . . . . . . . . . . . . 809.9 27.1 1,363.9 2,200.9 236.2 2014-2018. . . . . . . . . . . . . . . . . . . . . . . . . . . . . . . . . 548.9 4.9 597.5 1,151.3 100.0 2019-2023. . . . . . . . . . . . . . . . . . . . . . . . . . . . . . . . . 356.6 2.8 390.9 750.3 27.3 2024-2028. . . . . . . . . . . . . . . . . . . . . . . . . . . . . . . . . 216.0 2.3 268.6 486.9 3.0 After 2028. . . . . . . . . . . . . . . . . . . . . . . . . . . . . . . . . 176.0 1.6 272.8 450.4 0.5 Total. . . . . . . . . . . . . . . . . . . . . . . . . . . . . . . . . . . . $2,156.4 $63.8 $2,970.5 $5,190.7 $381.0
(1) Depicts amortization of existing guaranteed portfolio (principal and interest), assuming no advance refundings, as of September 30, 2008. Expected maturities will differ from contractual maturities because borrowers may have the right to call or prepay guaranteed obligations.(2) Unearned premium amounts are net of prepaid reinsurance, which is reported separately as an asset on the Consolidated Balance Sheet. (3) Actual future installments are net of reinsurance and may differ from estimated because borrowers may have the right to call or terminate a transaction or the guaranteed obligation may be subject to prepayment.
Net Unearned Premium Amortization (2)
Total. . . . . . . . . . . . . . . . . . . . . . . . . . . . . . . . . . . . . . . . . . . . . . . . . . . . . . . . . . . . . . . . . . . . . . . . . . . . . . . . . . . . . . . .
16
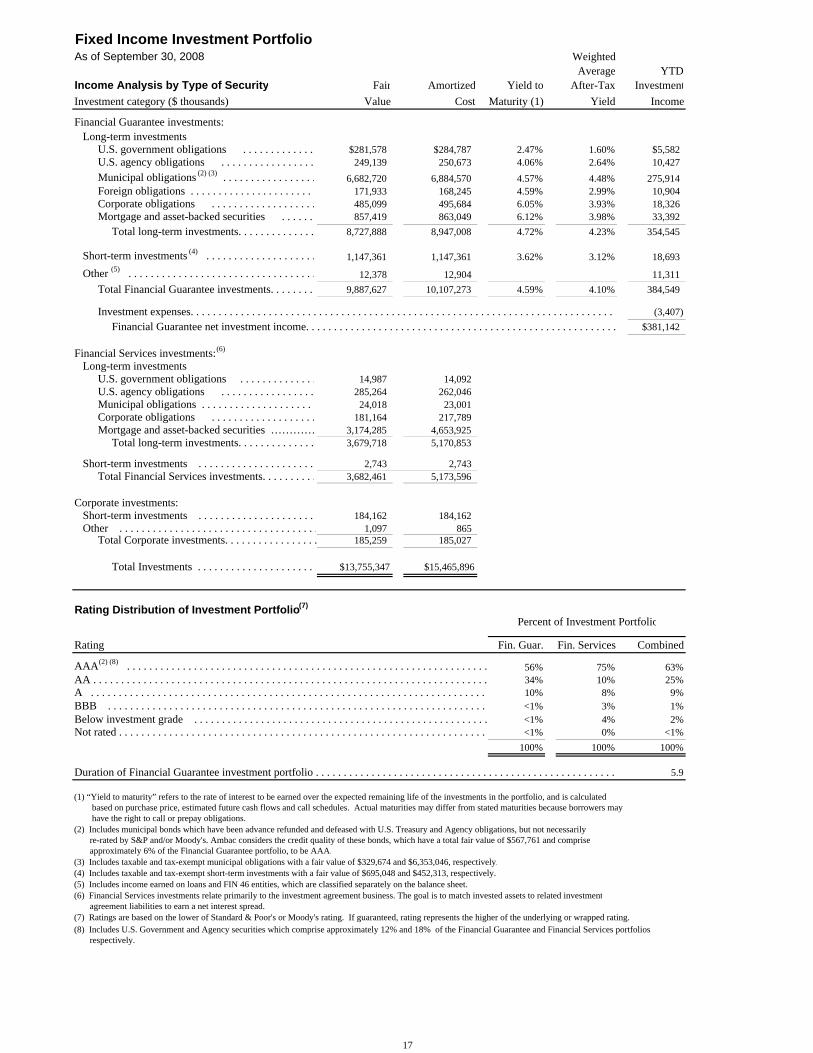
Fixed Income Investment PortfolioAs of September 30, 2008 Weighted
Average YTDIncome Analysis by Type of Security Fair Amortized Yield to After-Tax InvestmentInvestment category ($ thousands) Value Cost Maturity (1) Yield Income
Financial Guarantee investments: Long-term investments
U.S. government obligations . . . . . . . . . . . . . $281,578 $284,787 2.47% 1.60% $5,582U.S. agency obligations . . . . . . . . . . . . . . . . . 249,139 250,673 4.06% 2.64% 10,427Municipal obligations (2) (3) . . . . . . . . . . . . . . . . . 6,682,720 6,884,570 4.57% 4.48% 275,914 Foreign obligations . . . . . . . . . . . . . . . . . . . . . . 171,933 168,245 4.59% 2.99% 10,904 Corporate obligations . . . . . . . . . . . . . . . . . . . 485,099 495,684 6.05% 3.93% 18,326 Mortgage and asset-backed securities . . . . . . 857,419 863,049 6.12% 3.98% 33,392 Total long-term investments. . . . . . . . . . . . . . 8,727,888 8,947,008 4.72% 4.23% 354,545
Short-term investments (4) . . . . . . . . . . . . . . . . . . . . 1,147,361 1,147,361 3.62% 3.12% 18,693
Other (5) . . . . . . . . . . . . . . . . . . . . . . . . . . . . . . . . . . 12,378 12,904 11,311 Total Financial Guarantee investments. . . . . . . . 9,887,627 10,107,273 4.59% 4.10% 384,549
Investment expenses. . . . . . . . . . . . . . . . . . . . . . . . . . . . . . . . . . . . . . . . . . . . . . . . . . . . . . . . . . . . . . . . . . . . . . . . . . . . . (3,407) Financial Guarantee net investment income. . . . . . . . . . . . . . . . . . . . . . . . . . . . . . . . . . . . . . . . . . . . . . . . . . . . . . . . $381,142
Financial Services investments: (6)
Long-term investments U.S. government obligations . . . . . . . . . . . . . . 14,987 14,092 U.S. agency obligations . . . . . . . . . . . . . . . . . 285,264 262,046 Municipal obligations . . . . . . . . . . . . . . . . . . . . 24,018 23,001 Corporate obligations . . . . . . . . . . . . . . . . . . . 181,164 217,789 Mortgage and asset-backed securities ………… 3,174,285 4,653,925 Total long-term investments. . . . . . . . . . . . . . 3,679,718 5,170,853
Short-term investments . . . . . . . . . . . . . . . . . . . . . 2,743 2,743 Total Financial Services investments. . . . . . . . . . 3,682,461 5,173,596
Corporate investments: Short-term investments . . . . . . . . . . . . . . . . . . . . . 184,162 184,162 Other . . . . . . . . . . . . . . . . . . . . . . . . . . . . . . . . . . . . 1,097 865
Total Corporate investments. . . . . . . . . . . . . . . . . 185,259 185,027
Total Investments . . . . . . . . . . . . . . . . . . . . . . $13,755,347 $15,465,896
Rating Distribution of Investment Portfolio(7)
Percent of Investment Portfolio
Rating Fin. Guar. Fin. Services Combined
AAA(2) (8) . . . . . . . . . . . . . . . . . . . . . . . . . . . . . . . . . . . . . . . . . . . . . . . . . . . . . . . . . . . . . . . . . 56% 75% 63%AA . . . . . . . . . . . . . . . . . . . . . . . . . . . . . . . . . . . . . . . . . . . . . . . . . . . . . . . . . . . . . . . . . . . . . . . 34% 10% 25%A . . . . . . . . . . . . . . . . . . . . . . . . . . . . . . . . . . . . . . . . . . . . . . . . . . . . . . . . . . . . . . . . . . . . . . . 10% 8% 9%BBB . . . . . . . . . . . . . . . . . . . . . . . . . . . . . . . . . . . . . . . . . . . . . . . . . . . . . . . . . . . . . . . . . . . . <1% 3% 1%Below investment grade . . . . . . . . . . . . . . . . . . . . . . . . . . . . . . . . . . . . . . . . . . . . . . . . . . . . . <1% 4% 2%Not rated . . . . . . . . . . . . . . . . . . . . . . . . . . . . . . . . . . . . . . . . . . . . . . . . . . . . . . . . . . . . . . . . . . <1% 0% <1%
100% 100% 100%
Duration of Financial Guarantee investment portfolio . . . . . . . . . . . . . . . . . . . . . . . . . . . . . . . . . . . . . . . . . . . . . . . . . . . . . . 5.9
(1) “Yield to maturity” refers to the rate of interest to be earned over the expected remaining life of the investments in the portfolio, and is calculated based on purchase price, estimated future cash flows and call schedules. Actual maturities may differ from stated maturities because borrowers may have the right to call or prepay obligations.(2) Includes municipal bonds which have been advance refunded and defeased with U.S. Treasury and Agency obligations, but not necessarily re-rated by S&P and/or Moody's. Ambac considers the credit quality of these bonds, which have a total fair value of $567,761 and comprise approximately 6% of the Financial Guarantee portfolio, to be AAA.(3) Includes taxable and tax-exempt municipal obligations with a fair value of $329,674 and $6,353,046, respectively.(4) Includes taxable and tax-exempt short-term investments with a fair value of $695,048 and $452,313, respectively.(5) Includes income earned on loans and FIN 46 entities, which are classified separately on the balance sheet.(6) Financial Services investments relate primarily to the investment agreement business. The goal is to match invested assets to related investment agreement liabilities to earn a net interest spread.(7) Ratings are based on the lower of Standard & Poor's or Moody's rating. If guaranteed, rating represents the higher of the underlying or wrapped rating.(8) Includes U.S. Government and Agency securities which comprise approximately 12% and 18% of the Financial Guarantee and Financial Services portfolios, respectively.
17
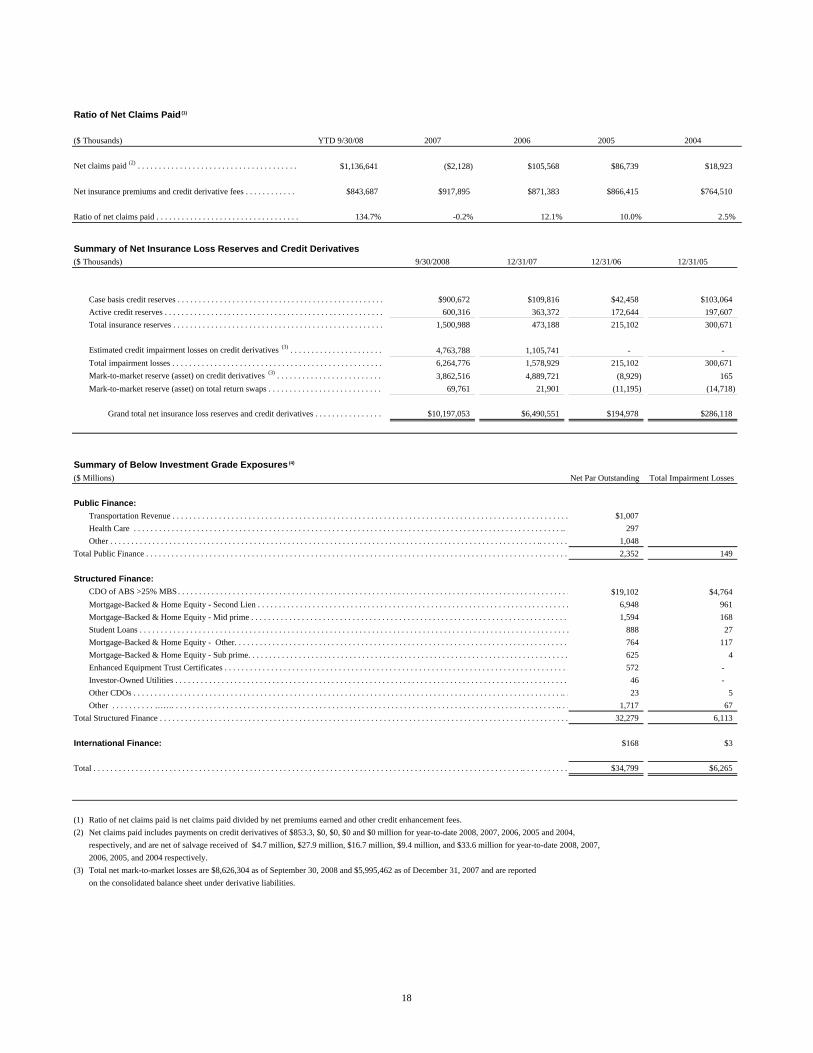
Ratio of Net Claims Paid (1)
($ Thousands) YTD 9/30/08 2007 2006 2005 2004
Net claims paid (2) . . . . . . . . . . . . . . . . . . . . . . . . . . . . . . . . . . . . . . $1,136,641 ($2,128) $105,568 $86,739 $18,923
Net insurance premiums and credit derivative fees . . . . . . . . . . . . . $843,687 $917,895 $871,383 $866,415 $764,510
Ratio of net claims paid . . . . . . . . . . . . . . . . . . . . . . . . . . . . . . . . . . 134.7% -0.2% 12.1% 10.0% 2.5%
Summary of Net Insurance Loss Reserves and Credit Derivatives($ Thousands) 9/30/2008 12/31/07 12/31/06 12/31/05
Case basis credit reserves . . . . . . . . . . . . . . . . . . . . . . . . . . . . . . . . . . . . . . . . . . . . . . . . . $900,672 $109,816 $42,458 $103,064Active credit reserves . . . . . . . . . . . . . . . . . . . . . . . . . . . . . . . . . . . . . . . . . . . . . . . . . . . . 600,316 363,372 172,644 197,607 Total insurance reserves . . . . . . . . . . . . . . . . . . . . . . . . . . . . . . . . . . . . . . . . . . . . . . . . . . 1,500,988 473,188 215,102 300,671
Estimated credit impairment losses on credit derivatives (3) . . . . . . . . . . . . . . . . . . . . . . 4,763,788 1,105,741 - - Total impairment losses . . . . . . . . . . . . . . . . . . . . . . . . . . . . . . . . . . . . . . . . . . . . . . . . . . 6,264,776 1,578,929 215,102 300,671 Mark-to-market reserve (asset) on credit derivatives (3) . . . . . . . . . . . . . . . . . . . . . . . . . 3,862,516 4,889,721 (8,929) 165 Mark-to-market reserve (asset) on total return swaps . . . . . . . . . . . . . . . . . . . . . . . . . . . 69,761 21,901 (11,195) (14,718)
Grand total net insurance loss reserves and credit derivatives . . . . . . . . . . . . . . . . $10,197,053 $6,490,551 $194,978 $286,118
Summary of Below Investment Grade Exposures (4)
($ Millions) Net Par Outstanding Total Impairment Losses
Public Finance:Transportation Revenue . . . . . . . . . . . . . . . . . . . . . . . . . . . . . . . . . . . . . . . . . . . . . . . . . . . . . . . . . . . . . . . . . . . . . . . . . . . . . . . . . . . . . . . . . . . . . . $1,007 $120Health Care . . . . . . . . . . . . . . . . . . . . . . . . . . . . . . . . . . . . . . . . . . . . . . . . . . . . . . . . . . . . . . . . . . . . . . . . . . . . . . . . . . . . . . . . . . . . . . . . . . . . . .. . 297 13 Other . . . . . . . . . . . . . . . . . . . . . . . . . . . . . . . . . . . . . . . . . . . . . . . . . . . . . . . . . . . . . . . . . . . . . . . . . . . . . . . . . . . . . . . . . . . . . . . . . . . . . .. . . . . . . 1,048 16
Total Public Finance . . . . . . . . . . . . . . . . . . . . . . . . . . . . . . . . . . . . . . . . . . . . . . . . . . . . . . . . . . . . . . . . . . . . . . . . . . . . . . . . . . . . . . . . . . . . . . . . . . . . 2,352 149
Structured Finance:CDO of ABS >25% MBS . . . . . . . . . . . . . . . . . . . . . . . . . . . . . . . . . . . . . . . . . . . . . . . . . . . . . . . . . . . . . . . . . . . . . . . . . . . . . . . . . . . . . . . . . . . . . $19,102 $4,764Mortgage-Backed & Home Equity - Second Lien . . . . . . . . . . . . . . . . . . . . . . . . . . . . . . . . . . . . . . . . . . . . . . . . . . . . . . . . . . . . . . . . . . . . . . . . . . 6,948 961 Mortgage-Backed & Home Equity - Mid prime . . . . . . . . . . . . . . . . . . . . . . . . . . . . . . . . . . . . . . . . . . . . . . . . . . . . . . . . . . . . . . . . . . . . . . . . . . . 1,594 168 Student Loans . . . . . . . . . . . . . . . . . . . . . . . . . . . . . . . . . . . . . . . . . . . . . . . . . . . . . . . . . . . . . . . . . . . . . . . . . . . . . . . . . . . . . . . . . . . . . . . . . . . . . . 888 27 Mortgage-Backed & Home Equity - Other. . . . . . . . . . . . . . . . . . . . . . . . . . . . . . . . . . . . . . . . . . . . . . . . . . . . . . . . . . . . . . . . . . . . . . . . . . . . . . . 764 117 Mortgage-Backed & Home Equity - Sub prime. . . . . . . . . . . . . . . . . . . . . . . . . . . . . . . . . . . . . . . . . . . . . . . . . . . . . . . . . . . . . . . . . . . . . . . . . . . . 625 4 Enhanced Equipment Trust Certificates . . . . . . . . . . . . . . . . . . . . . . . . . . . . . . . . . . . . . . . . . . . . . . . . . . . . . . . . . . . . . . . . . . . . . . . . . . . . . . . . . . 572 - Investor-Owned Utilities . . . . . . . . . . . . . . . . . . . . . . . . . . . . . . . . . . . . . . . . . . . . . . . . . . . . . . . . . . . . . . . . . . . . . . . . . . . . . . . . . . . . . . . . . . . . . 46 - Other CDOs . . . . . . . . . . . . . . . . . . . . . . . . . . . . . . . . . . . . . . . . . . . . . . . . . . . . . . . . . . . . . . . . . . . . . . . . . . . . . . . . . . . . . . . . . . . . . . . . . . . . . .. . 23 5 Other . . . . . . . . . . ……. . . . . . . . . . . . . . . . . . . . . . . . . . . . . . . . . . . . . . . . . . . . . . . . . . . . . . . . . . . . . . . . . . . . . . . . . . . . . . . . . . . . . . . . . . . .. . . 1,717 67
Total Structured Finance . . . . . . . . . . . . . . . . . . . . . . . . . . . . . . . . . . . . . . . . . . . . . . . . . . . . . . . . . . . . . . . . . . . . . . . . . . . . . . . . . . . . . . . . . . . . . . . . . 32,279 6,113
International Finance: $168 $3
Total . . . . . . . . . . . . . . . . . . . . . . . . . . . . . . . . . . . . . . . . . . . . . . . . . . . . . . . . . . . . . . . . . . . . . . . . . . . . . . . . . . . . . . . . . . . . . . . . . . . . . .. . . . . . . . . . . $34,799 $6,265
(1) Ratio of net claims paid is net claims paid divided by net premiums earned and other credit enhancement fees.(2) Net claims paid includes payments on credit derivatives of $853.3, $0, $0, $0 and $0 million for year-to-date 2008, 2007, 2006, 2005 and 2004,
respectively, and are net of salvage received of $4.7 million, $27.9 million, $16.7 million, $9.4 million, and $33.6 million for year-to-date 2008, 2007,2006, 2005, and 2004 respectively.
(3) Total net mark-to-market losses are $8,626,304 as of September 30, 2008 and $5,995,462 as of December 31, 2007 and are reportedon the consolidated balance sheet under derivative liabilities.
18
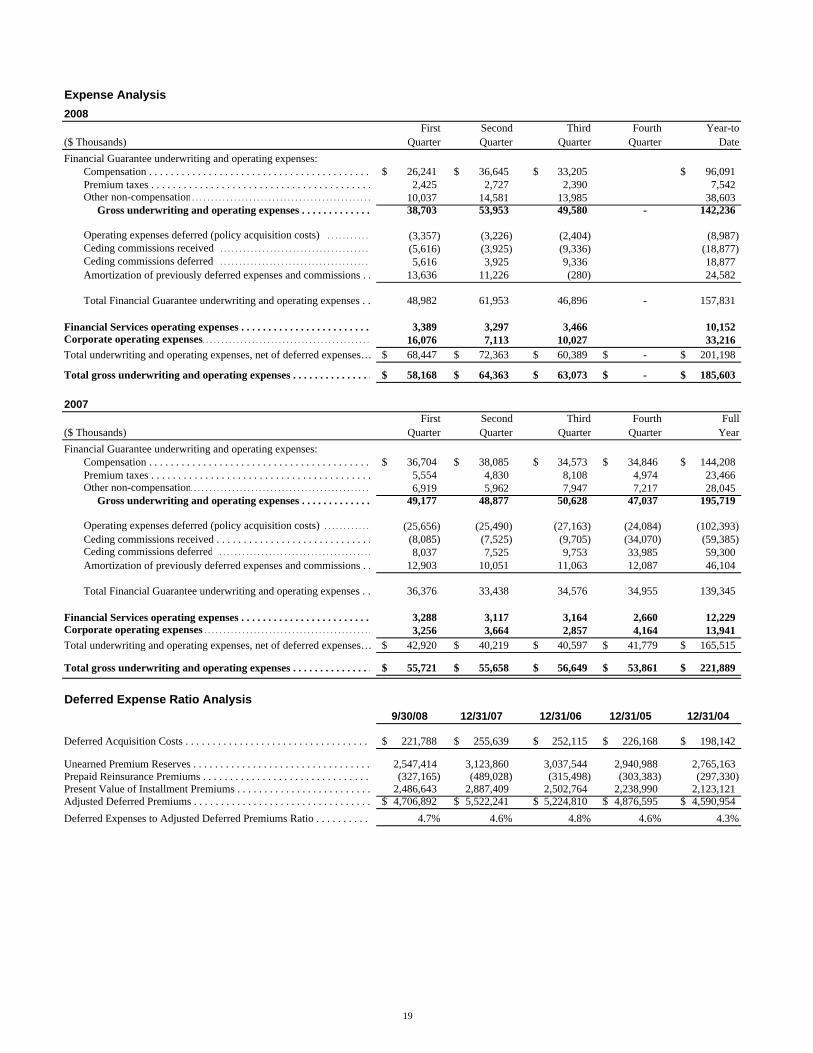
Expense Analysis2008
First Second Third Fourth Year-to($ Thousands) Quarter Quarter Quarter Quarter DateFinancial Guarantee underwriting and operating expenses:
Compensation . . . . . . . . . . . . . . . . . . . . . . . . . . . . . . . . . . . . . . . . . 26,241$ 36,645$ 33,205$ 96,091$ Premium taxes . . . . . . . . . . . . . . . . . . . . . . . . . . . . . . . . . . . . . . . . . 2,425 2,727 2,390 7,542 Other non-compensation . . . . . . . . . . . . . . . . . . . . . . . . . . . . . . . . . . . . . . . . . . . . . . . 10,037 14,581 13,985 38,603 Gross underwriting and operating expenses . . . . . . . . . . . . . 38,703 53,953 49,580 - 142,236
Operating expenses deferred (policy acquisition costs) . . . . . . . . . . . (3,357) (3,226) (2,404) (8,987) Ceding commissions received . . . . . . . . . . . . . . . . . . . . . . . . . . . . . . . . . . . . . . . (5,616) (3,925) (9,336) (18,877) Ceding commissions deferred . . . . . . . . . . . . . . . . . . . . . . . . . . . . . . . . . . . . . . . 5,616 3,925 9,336 18,877 Amortization of previously deferred expenses and commissions . . 13,636 11,226 (280) 24,582
Total Financial Guarantee underwriting and operating expenses . . 48,982 61,953 46,896 - 157,831
Financial Services operating expenses . . . . . . . . . . . . . . . . . . . . . . . . 3,389 3,297 3,466 10,152 Corporate operating expenses. . . . . . . . . . . . . . . . . . . . . . . . . . . . . . . . . . . . . . . . . . . . 16,076 7,113 10,027 33,216 Total underwriting and operating expenses, net of deferred expenses… 68,447$ 72,363$ 60,389$ -$ 201,198$
Total gross underwriting and operating expenses . . . . . . . . . . . . . . . 58,168$ 64,363$ 63,073$ -$ 185,603$
2007First Second Third Fourth Full
($ Thousands) Quarter Quarter Quarter Quarter YearFinancial Guarantee underwriting and operating expenses:
Compensation . . . . . . . . . . . . . . . . . . . . . . . . . . . . . . . . . . . . . . . . . 36,704$ 38,085$ 34,573$ 34,846$ 144,208$ Premium taxes . . . . . . . . . . . . . . . . . . . . . . . . . . . . . . . . . . . . . . . . . 5,554 4,830 8,108 4,974 23,466 Other non-compensation. . . . . . . . . . . . . . . . . . . . . . . . . . . . . . . . . . . . . . . . . . . . . . . 6,919 5,962 7,947 7,217 28,045 Gross underwriting and operating expenses . . . . . . . . . . . . . 49,177 48,877 50,628 47,037 195,719
Operating expenses deferred (policy acquisition costs) . . . . . . . . . . . . (25,656) (25,490) (27,163) (24,084) (102,393) Ceding commissions received . . . . . . . . . . . . . . . . . . . . . . . . . . . . . (8,085) (7,525) (9,705) (34,070) (59,385) Ceding commissions deferred . . . . . . . . . . . . . . . . . . . . . . . . . . . . . . . . . . . . . . . . 8,037 7,525 9,753 33,985 59,300 Amortization of previously deferred expenses and commissions . . 12,903 10,051 11,063 12,087 46,104
Total Financial Guarantee underwriting and operating expenses . . 36,376 33,438 34,576 34,955 139,345
Financial Services operating expenses . . . . . . . . . . . . . . . . . . . . . . . . 3,288 3,117 3,164 2,660 12,229 Corporate operating expenses . . . . . . . . . . . . . . . . . . . . . . . . . . . . . . . . . . . . . . . . . . . . 3,256 3,664 2,857 4,164 13,941 Total underwriting and operating expenses, net of deferred expenses… 42,920$ 40,219$ 40,597$ 41,779$ 165,515$
Total gross underwriting and operating expenses . . . . . . . . . . . . . . . 55,721$ 55,658$ 56,649$ 53,861$ 221,889$
Deferred Expense Ratio Analysis9/30/08 12/31/07 12/31/06 12/31/05 12/31/04
Deferred Acquisition Costs . . . . . . . . . . . . . . . . . . . . . . . . . . . . . . . . . . 221,788$ 255,639$ 252,115$ 226,168$ 198,142$
Unearned Premium Reserves . . . . . . . . . . . . . . . . . . . . . . . . . . . . . . . . . 2,547,414 3,123,860 3,037,544 2,940,988 2,765,163 Prepaid Reinsurance Premiums . . . . . . . . . . . . . . . . . . . . . . . . . . . . . . . (327,165) (489,028) (315,498) (303,383) (297,330) Present Value of Installment Premiums . . . . . . . . . . . . . . . . . . . . . . . . . 2,486,643 2,887,409 2,502,764 2,238,990 2,123,121 Adjusted Deferred Premiums . . . . . . . . . . . . . . . . . . . . . . . . . . . . . . . . . 4,706,892$ 5,522,241$ 5,224,810$ 4,876,595$ 4,590,954$ Deferred Expenses to Adjusted Deferred Premiums Ratio . . . . . . . . . . 4.7% 4.6% 4.8% 4.6% 4.3%
19
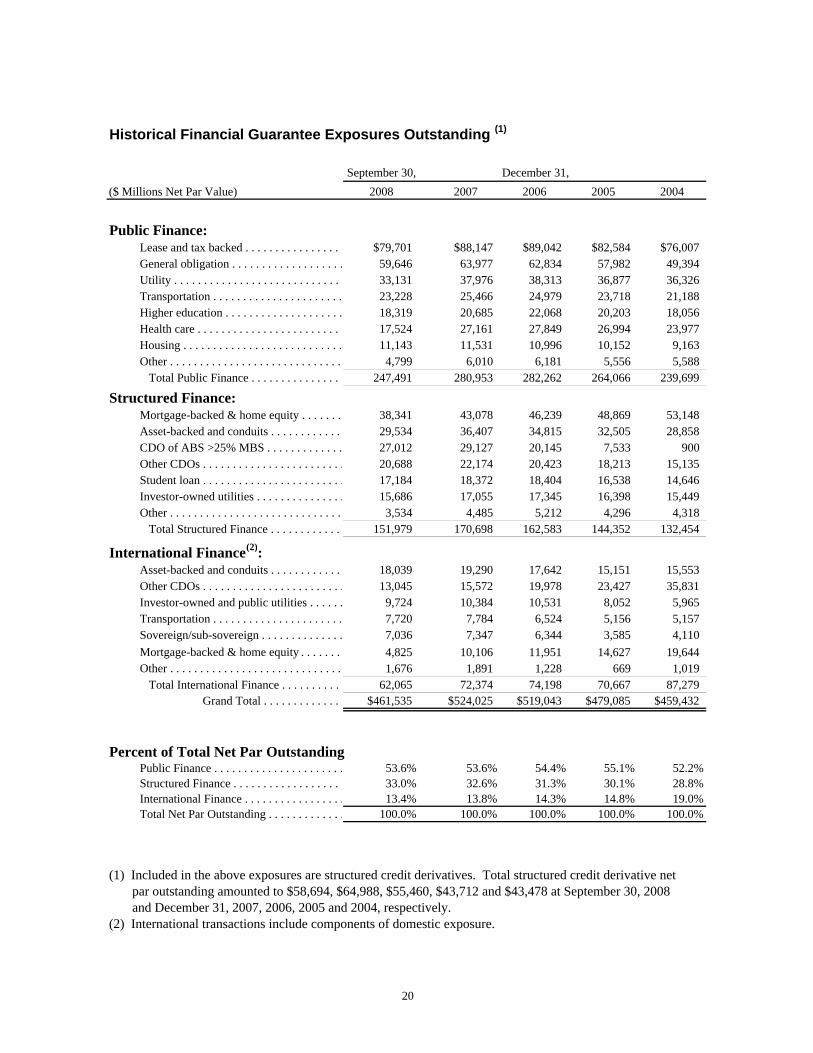
Historical Financial Guarantee Exposures Outstanding (1)
September 30,($ Millions Net Par Value) 2008 2007 2006 2005 2004
Public Finance: Lease and tax backed . . . . . . . . . . . . . . . . . $79,701 $88,147 $89,042 $82,584 $76,007 General obligation . . . . . . . . . . . . . . . . . . . 59,646 63,977 62,834 57,982 49,394 Utility . . . . . . . . . . . . . . . . . . . . . . . . . . . . . 33,131 37,976 38,313 36,877 36,326 Transportation . . . . . . . . . . . . . . . . . . . . . . 23,228 25,466 24,979 23,718 21,188 Higher education . . . . . . . . . . . . . . . . . . . . 18,319 20,685 22,068 20,203 18,056 Health care . . . . . . . . . . . . . . . . . . . . . . . . . 17,524 27,161 27,849 26,994 23,977 Housing . . . . . . . . . . . . . . . . . . . . . . . . . . . 11,143 11,531 10,996 10,152 9,163 Other . . . . . . . . . . . . . . . . . . . . . . . . . . . . . 4,799 6,010 6,181 5,556 5,588 Total Public Finance . . . . . . . . . . . . . . . . 247,491 280,953 282,262 264,066 239,699
Structured Finance: Mortgage-backed & home equity . . . . . . . 38,341 43,078 46,239 48,869 53,148 Asset-backed and conduits . . . . . . . . . . . . 29,534 36,407 34,815 32,505 28,858 CDO of ABS >25% MBS . . . . . . . . . . . . . 27,012 29,127 20,145 7,533 900 Other CDOs . . . . . . . . . . . . . . . . . . . . . . . . 20,688 22,174 20,423 18,213 15,135 Student loan . . . . . . . . . . . . . . . . . . . . . . . . 17,184 18,372 18,404 16,538 14,646 Investor-owned utilities . . . . . . . . . . . . . . . 15,686 17,055 17,345 16,398 15,449 Other . . . . . . . . . . . . . . . . . . . . . . . . . . . . . 3,534 4,485 5,212 4,296 4,318 Total Structured Finance . . . . . . . . . . . . 151,979 170,698 162,583 144,352 132,454
International Finance(2): Asset-backed and conduits . . . . . . . . . . . . 18,039 19,290 17,642 15,151 15,553 Other CDOs . . . . . . . . . . . . . . . . . . . . . . . . 13,045 15,572 19,978 23,427 35,831 Investor-owned and public utilities . . . . . . 9,724 10,384 10,531 8,052 5,965 Transportation . . . . . . . . . . . . . . . . . . . . . . 7,720 7,784 6,524 5,156 5,157 Sovereign/sub-sovereign . . . . . . . . . . . . . . 7,036 7,347 6,344 3,585 4,110 Mortgage-backed & home equity . . . . . . . 4,825 10,106 11,951 14,627 19,644 Other . . . . . . . . . . . . . . . . . . . . . . . . . . . . . 1,676 1,891 1,228 669 1,019 Total International Finance . . . . . . . . . . 62,065 72,374 74,198 70,667 87,279 Grand Total . . . . . . . . . . . . . . $461,535 $524,025 $519,043 $479,085 $459,432
Percent of Total Net Par Outstanding Public Finance . . . . . . . . . . . . . . . . . . . . . . 53.6% 53.6% 54.4% 55.1% 52.2% Structured Finance . . . . . . . . . . . . . . . . . . . 33.0% 32.6% 31.3% 30.1% 28.8% International Finance . . . . . . . . . . . . . . . . . 13.4% 13.8% 14.3% 14.8% 19.0% Total Net Par Outstanding . . . . . . . . . . . . . 100.0% 100.0% 100.0% 100.0% 100.0%
(1) Included in the above exposures are structured credit derivatives. Total structured credit derivative net par outstanding amounted to $58,694, $64,988, $55,460, $43,712 and $43,478 at September 30, 2008 and December 31, 2007, 2006, 2005 and 2004, respectively.(2) International transactions include components of domestic exposure.
December 31,
20

Bond Type Distribution of Financial Guarantee Exposures
Guaranteed Year-to-Date($ Millions Par Value) Gross % Net(1) %
Public Finance: Lease and tax backed . . . . . . . . . . . . . . . . . $653 6.9% $1,026 7.0% General obligation . . . . . . . . . . . . . . . . . . . 270 2.9% 517 3.5% Utility . . . . . . . . . . . . . . . . . . . . . . . . . . . . . 153 1.6% 575 3.9% Transportation . . . . . . . . . . . . . . . . . . . . . . 33 0.3% 340 2.3% Higher education . . . . . . . . . . . . . . . . . . . . 14 0.1% 186 1.3% Health care . . . . . . . . . . . . . . . . . . . . . . . . . 127 1.3% 425 2.9% Housing . . . . . . . . . . . . . . . . . . . . . . . . . . . 346 3.7% 374 2.6% Other . . . . . . . . . . . . . . . . . . . . . . . . . . . . . 7 0.1% 26 0.2% Total Public Finance . . . . . . . . . . . . . . . . 1,603 16.9% 3,469 23.8%
Structured Finance: Mortgage-backed & home equity . . . . . . . 34 0.4% 727 5.0% Asset-backed and conduits . . . . . . . . . . . . 4,859 51.4% 4,997 34.3% CDO of ABS > 25% MBS(3) . . . . . . . . . . . 101 1.1% 101 0.7% Other CDOs(3) . . . . . . . . . . . . . . . . . . . . . . 655 6.9% 653 4.5% Student loan . . . . . . . . . . . . . . . . . . . . . . . . - 0.0% 446 3.1% Investor-owned utilities . . . . . . . . . . . . . . . 154 1.6% 480 3.3% Other . . . . . . . . . . . . . . . . . . . . . . . . . . . . . 252 2.7% 364 2.5% Total Structured Finance . . . . . . . . . . . . 6,055 64.0% 7,768 53.3%
International Finance(2): Asset-backed and conduits . . . . . . . . . . . . 418 4.4% 791 5.4% Other CDOs(3) . . . . . . . . . . . . . . . . . . . . . . 797 8.4% 779 5.3% Investor-owned and public utilities . . . . . . - 0.0% 544 3.7% Transportation . . . . . . . . . . . . . . . . . . . . . . 586 6.2% 794 5.4% Sovereign/sub-sovereign . . . . . . . . . . . . . . - 0.0% 362 2.5% Mortgage-backed & home equity . . . . . . . - 0.0% 14 0.1% Other . . . . . . . . . . . . . . . . . . . . . . . . . . . . . - 0.0% 57 0.4% Total International Finance . . . . . . . . . . 1,801 19.0% 3,341 22.9% Grand Total . . . . . . . . . . . . . . $9,459 100.0% $14,578 100.0%
(1) Net financial guarantees written reflects the recapture of $6,088 million relating to the cancellation of certain reinsurance contracts.(2) International transactions include components of domestic exposure. (3) Par written during the period relates to increases in funding for transactions originated in prior years. The remaining unfunded net exposure for these transactions at September 30, 2008 is $2,808 million for Other CDO's.
21

Geographic Distribution of Financial Guarantee ExposuresNet Par Outstanding as of
Guaranteed Year-to-Date September 30, 2008($ Millions Par Value) Gross % Net % Net %
Domestic:California . . . . . . . . . . . . . . . . . . . . . $517 5.5% $760 5.2% $46,813 10.1%New York . . . . . . . . . . . . . . . . . . . . . 307 3.2% 417 2.9% 27,004 5.9%Florida . . . . . . . . . . . . . . . . . . . . . . . 243 2.6% 428 2.9% 19,261 4.2%Texas . . . . . . . . . . . . . . . . . . . . . . . . 153 1.6% 442 3.0% 18,550 4.0%New Jersey . . . . . . . . . . . . . . . . . . . . - 0.0% 10 0.1% 12,520 2.7%Pennsylvania . . . . . . . . . . . . . . . . . . . 50 0.5% 154 1.1% 11,597 2.5%Illinois . . . . . . . . . . . . . . . . . . . . . . . . 67 0.7% 127 0.9% 10,973 2.4%Massachusetts . . . . . . . . . . . . . . . . . . - 0.0% 139 1.0% 8,890 1.9%Colorado . . . . . . . . . . . . . . . . . . . . . . 255 2.7% 286 2.0% 7,206 1.6%Ohio . . . . . . . . . . . . . . . . . . . . . . . . . 6 0.1% 78 0.5% 6,980 1.5%Mortgage and asset-backed . . . . . . . 4,893 51.7% 5,724 39.3% 67,875 14.7%Other states . . . . . . . . . . . . . . . . . . . . 1,167 12.3% 2,672 18.3% 161,801 35.1%
Total Domestic . . . . . . . . . 7,658 81.0% 11,237 77.1% 399,470 86.6%
International:United Kingdom . . . . . . . . . . . . . . . . 9 0.1% 877 6.0% 24,359 5.3%Australia . . . . . . . . . . . . . . . . . . . . . . 16 0.2% 441 3.0% 5,771 1.3%Italy . . . . . . . . . . . . . . . . . . . . . . . . . . - 0.0% 85 0.6% 2,899 0.6%Japan . . . . . . . . . . . . . . . . . . . . . . . . . 4 0.0% 110 0.8% 2,476 0.5%Turkey . . . . . . . . . . . . . . . . . . . . . . . - 0.0% 57 0.4% 1,968 0.4%Internationally diversified . . . . . . . . 1,182 12.5% 1,161 8.0% 15,267 3.3%Other international . . . . . . . . . . . . . . 590 6.2% 610 4.2% 9,325 2.0%
Total International . . . . . . . 1,801 19.0% 3,341 22.9% 62,065 13.4%
Grand Total . . . . . . . $9,459 100.0% $14,578 100.0% $461,535 100.0%
Rating Distribution of Net Financial Guarantee Exposures(1)
As of September 30, 2008 Percentage of Guaranteed PortfolioPublic
Rating Finance Total
AAA . . . . . . . . . . . . . . . . . . . . . . . . . . . . . . . . . . . . . . . . . . . . . . . . . . . . . . . . . . . . . . . . . . . . . . . . . . . . . . . . . . . . . . <1 10AA . . . . . . . . . . . . . . . . . . . . . . . . . . . . . . . . . . . . . . . . . . . . . . . . . . . . . . . . . . . . . . . . . . . . . . . . . . . . . . . . . . . . . . . . 28 20A . . . . . . . . . . . . . . . . . . . . . . . . . . . . . . . . . . . . . . . . . . . . . . . . . . . . . . . . . . . . . . . . . . . . . . . . . . . . . . . . . . . . . . . . . . 58 41BBB . . . . . . . . . . . . . . . . . . . . . . . . . . . . . . . . . . . . . . . . . . . . . . . . . . . . . . . . . . . . . . . . . . . . . . . . . . . . . . . . . . . . . . 13 21BIG . . . . . . . . . . . . . . . . . . . . . . . . . . . . . . . . . . . . . . . . . . . . . . . . . . . . . . . . . . . . . . . . . . . . . . . . . . . . . . . . . . . . . . . <1 8
100 100
(1) Based upon Ambac ratings. See Note 3 on the Table of Contents page.
Structured andInternational Finance
2113213015
100
22

Largest Domestic Public Finance Exposures(1)
($ Millions)Ambac
Rating(2) AADS(3)Net Par
Outstanding
% of Total Net Par
Outstanding
California State - GO A + $198.9 $3,067 0.7%New Jersey Transportation Trust Fund Authority - Transportation System A + $151.9 2,162 0.5%Washington State - GO AA $133.0 1,836 0.4%MTA, NY, Transportation Revenue (Farebox) A $95.1 1,534 0.3%NYS Thruway Authority, Highway & Bridge Revenue AA - $117.5 1,438 0.3%Bay Area Toll Authority, CA Toll Bridge Revenue AA - $67.6 1,389 0.3%New Jersey Turnpike Authority Revenue A $90.9 1,372 0.3%Massachusetts Commonwealth - GO AA $88.3 1,332 0.3%Central Texas Turnpike, System Revenue BBB + $106.3 1,095 0.2%California Department of Water Resources, Power Supply A $143.5 1,034 0.2%Nassau County Interim Finance Authority, NY, Sales Tax Revenue AA $86.6 1,002 0.2%Los Angeles Unified School District, CA - GO AA - $70.8 999 0.2%South Carolina Transportation Infrastructure Bank Revenue A $68.5 994 0.2%New York City, NY - GO AA - $52.4 992 0.2%Massachusetts School Building Authority, MA, Sales Tax Revenue AA $71.4 982 0.2%Puerto Rico Highways & Transportation Authority, Transportation Revenue BBB + $55.5 956 0.2%Port Authority of New York & New Jersey, Consolidated Revenue AA - $67.7 935 0.2%Connecticut Housing Finance Authority, Housing Mortgage Finance Program AAA $58.3 931 0.2%Golden State Tobacco Securitization Corp., CA, Enhanced Tobacco Settlement A - $52.8 885 0.2%Connecticut State Special Tax Obligations AA - $60.3 828 0.2%New Jersey Economic Development Authority - School Facilities Construction A + $48.8 826 0.2%Chicago, IL - GO A + $38.7 821 0.2%Sales Tax Asset Receivable Corporation, NY, Revenue A $68.4 810 0.2%Puerto Rico Sales Tax Financing Corporation A + $153.8 775 0.2%Massachusetts Turnpike Authority, Metropolitan Highway Revenue A $51.0 741 0.2%Total: $29,736 6.4%
Largest Domestic Healthcare Exposures
($ Millions)Ambac
Rating(2) AADS(3)Net Par
Outstanding
% of Total Net Par
Outstanding
Trinity Health - Michigan AA - $24.8 $350 0.1%Sisters of Mercy Health System - Missouri AA $30.1 326 0.1%Children's Hospital Boston - Massachusetts AA $22.2 315 0.1%New York City Health and Hospitals Corporation A $30.1 302 0.1%Catholic Health East - Pennsylvania A + $21.4 285 0.1%Catholic Healthcare Partners - Ohio A + $20.9 285 0.1%Texas Health Resources - Texas A + $23.7 269 0.1%Christus Health - Texas A + $13.6 238 0.1%WellSpan Health - Pennsylvania A + $13.0 205 0.0%Parkview Health System - Indiana A + $12.9 205 0.0%Total: $2,780 0.6%
(1) Excludes Healthcare exposures.(2) See Note 3 on the Table of Contents page.(3) Average Annual Debt Service, net of reinsurance.
23

Largest Structured Finance Exposures
($ Millions)Ambac
Rating(1)Net Par
Outstanding
% of Total Net Par
Outstanding
CDO of ABS > 25% MBS (2) BIG $2,897 0.6%CDO of ABS < 25% MBS AAA 2,568 0.6%Kleros Preferred Funding VI, Ltd. BIG 2,362 0.5%Iowa Student Loan Liquidity Corporation Revenue Bonds A 2,247 0.5%Private Commercial Asset-Backed Transaction BBB + 2,159 0.5%Ridgeway Court Funding II, Ltd. BIG 1,942 0.4%Diversey Harbor ABS CDO, Ltd. BIG 1,826 0.4%Wachovia Asset Securitization Issuance II, LLC 2007-HE2 BBB + 1,814 0.4%Hertz Vehicle Financing, LLC BBB 1,811 0.4%Ridgeway Court Funding I, Ltd. BIG 1,530 0.3%Michigan Higher Education Student Loan Authority AA 1,514 0.3%Citibank - CHARTA, LLC AAA 1,503 0.3%Vermont Student Assistance Corporation Revenue Bonds A 1,501 0.3%Duke Funding High Grade III, Ltd. BBB - 1,475 0.3%Belle Haven ABS CDO 2006-1, Ltd. BIG 1,463 0.3%Citibank - CAFCO, LLC AAA 1,380 0.3%Citibank - CIESCO, LLC AAA 1,307 0.3%Duke Funding High Grade IV, Ltd. BIG 1,289 0.3%Massachusetts Educational Financing Authority Revenue Bonds AA 1,263 0.3%Wachovia Asset Securitization Issuance II, LLC 2007-HE1 BBB + 1,260 0.3%Duke Funding High Grade V, Ltd. BIG 1,238 0.3%Private Commercial Asset-Backed Transaction BBB - 1,234 0.3%Private Consumer Asset-Backed Transaction AAA 1,167 0.3%Cendant Rental Car Funding BBB - 1,152 0.2%McKinley Funding III, Ltd. BIG 1,142 0.2%Total: $41,044 8.9%
Largest International Finance Exposures
($ Millions)Ambac
Rating(1)Net Par
Outstanding
% of Total Net Par
Outstanding
Mitchells & Butlers Finance plc-UK Pub Securitisation A + $2,357 0.5%CDO of IG Corporate AAA 1,906 0.4%Telereal Securitisation plc AA - 1,653 0.4%Punch Taverns Finance plc-UK Pub Securitisation AA - 1,621 0.4%Channel Link Enterprises BBB 1,042 0.2%Romulus Finance s.r.l. BBB 1,031 0.2%Synthetic RMBS AAA 969 0.2%TubeLines (Finance) plc A 958 0.2%Private Consumer Asset-Backed Transaction A 953 0.2%
AA 925 0.2%CDO of HY Corporate AA 855 0.2%Aspire Defence Finance plc BBB - 840 0.2%CDO of HY Corporate AAA 813 0.2%RMPA Services plc BBB 809 0.2%Capital Hospitals plc BBB - 770 0.2%Sydney Airport Finance Co. Pty Ltd BBB 767 0.2%Spirit Issuer plc BBB + 734 0.2%Babcock & Brown Air Funding I Limited BBB + 717 0.2%Private CMBS Transaction AAA 706 0.2%Private CMBS Transaction AAA 691 0.1%Regione Campania A - 660 0.1%National Grid Electricity Transmission A 659 0.1%National Grid Gas A - 657 0.1%Banco de Credito del Peru-DPR Securitization A 652 0.1%Powercor Australia, LLC. A - 652 0.1%Total: $24,397 5.3%
(1) See Note on the Table of Contents page.
(3) Metronet BCV and SSL are separate operating corporate entities with distinguishable risk features. Individually they would not appear on this list, however their exposures are aggregated to reflect common business and financial issues currently confronting each company.
(2) Represents an outstanding commitment to provide a financial guarantee on a static pool consisting primarily of High-Grade and Mezzanine CDO of ABS securities, comprising primarily underlying sub prime and mid prime residential mortgage-backed securitizations.
Metronet Rail (3)
24

Ambac Assurance Corporation
Claims-Paying Resources (1) and Statutory Financial Ratios
($ Thousands, Except Ratios) September 30, 2008 December 31, 2007
$3,371,635 $3,106,462 1,088,503 3,316,143
4,460,138 6,422,605
2,870,113 3,320,054 900,672 109,816
3,432,482 756,714
11,663,405 10,609,189
800,000 800,000 2,912,360 3,102,968
15,375,765 14,512,157
$782,595,344 $833,303,123 175 : 1 130 : 1
Claims-Paying Ratio (5) . . . . . . . . . . . . . . . . . . . . . . . . 51 : 1 57 : 1
$908,008,553 $995,031,995 $530,567,001 $612,074,543
Third Third Full Quarter Quarter Year
2008 2007 2007Statutory financial ratios:
177.5% 29.6% 8.1% 28.9% 13.4% 15.0%
(1) Total claims-paying resources is a term used by the rating agencies to quantify total resources available to pay claims in their stress-cas scenarios. Rating agencies may apply adjustments to claims-paying resources to reflect their views of realization.
(2) Third party capital support represents pre-funded capital which provides for the unconditional ability to issue up to $800 million of preferre stock to high quality asset-backed investment vehicles.
(3) Present value of future installment premiums includes premiums on installment financial guarantee insurance contracts, credit derivatives an other credit enhancement products. Present value calculations utilize the Moody's rating agency prescribed exposure amortization schedule discounted at 6.0% at September 30, 2008. Present value calculations utilize the Fitch's rating agency prescribed exposure amortization schedules discounted at 5.0% at December 31, 2007. Ambac internal estimates of present value of future installment premiums a September 30, 2008 and December 31, 2007 are $2,486,643 and $2,887,409, respectively at a discount rate of 5.9% and 5.2%, respectively.
(4) Capital Ratio is net financial guarantees in force divided by qualified statutory capital.
(5) Claims-paying Ratio is net financial guarantees in force divided by total claims-paying resources.
(6) Loss ratio is statutory net incurred losses divided by statutory net earned premiums.
(7) Expense ratio is statutory underwriting expenses (including reinsurance commissions) divided by net premiums written.
Contingency reserve. . . . . . . . . . . . . . . . . . . . . . . .
Qualified statutory capital. . . . . . . . . . . . . . . . .
Unearned premiums . . . . . . . . . . . . . . . . . . . . . . . .
Policyholders' reserves . . . . . . . . . . . . . . . . . . .
Surplus to Policyholders . . . . . . . . . . . . . . . . . . . . .
Losses and loss adjustment expenses . . . . . . . . . . .Estimated impairment losses on credit derivatives
Third party capital support (2) . . . . . . . . . . . . . . . . .
Loss ratio (6). . . . . . . . . . . . . . . . . . . . . . . . . . . . . . . Expense ratio (7) . . . . . . . . . . . . . . . . . . . . . . . . . . .
Gross par outstanding. . . . . . . . . . . . . . . . . . . . . . . . . .
Present Value of Future Installment Premiums (3) .
Total Claims-Paying Resources . . . . . . . . . . . . . . . . . .
Net financial guarantees in force. . . . . . . . . . . . . . . . . .Capital Ratio (4). . . . . . . . . . . . . . . . . . . . . . . . . . . . . . .
Gross financial guarantees in force. . . . . . . . . . . . . . . .
25