'5$)7 - MARC
20
Mid‐America Regional Council Page 1 E4-11243.01 July 18, 2012 Contents Background and Objectives .......................................................................................................... 2 Key Findings ................................................................................................................................. 2 NAR Smart Growth Survey and National Findings ....................................................................... 4 Psychographic Modeling and its Application to the Kansas City metropolitan area...................... 7 Penetration Rates...................................................................................................................... 8 Results by Corridor ..................................................................................................................... 12 North Oak Corridor .................................................................................................................. 12 State Avenue Corridor ............................................................................................................. 13 Troost Avenue Corridor ........................................................................................................... 14 Highways 24/40 Corridor ......................................................................................................... 16 Rock Island Corridor ................................................................................................................ 17 Shawnee Mission Parkway Corridor ....................................................................................... 19 DRAFT
Transcript of '5$)7 - MARC

Mid‐America Regional Council Page 1
E4-11243.01 July 18, 2012
Contents Background and Objectives .......................................................................................................... 2
Key Findings ................................................................................................................................. 2
NAR Smart Growth Survey and National Findings ....................................................................... 4
Psychographic Modeling and its Application to the Kansas City metropolitan area ...................... 7
Penetration Rates ...................................................................................................................... 8
Results by Corridor ..................................................................................................................... 12
North Oak Corridor .................................................................................................................. 12
State Avenue Corridor ............................................................................................................. 13
Troost Avenue Corridor ........................................................................................................... 14
Highways 24/40 Corridor ......................................................................................................... 16
Rock Island Corridor ................................................................................................................ 17
Shawnee Mission Parkway Corridor ....................................................................................... 19
DRAFT

Mid‐America Regional Council Page 2
E4-11243.01 July 18, 2012
Background and Objectives
In support of a regional planning effort currently taking place in the Kansas City metropolitan area, the Mid-America Regional Council retained RCLCO to assess the potential depth of demand for smart growth and transit-oriented development using a combination of data from a recent survey conducted by the National Association of Realtors and ESRI’s Tapestry market segmentation model. The analysis of demand was applied to the metropolitan area as a whole, as well as several specific corridors under consideration for future transit service.
Key Findings The psychographic analysis suggests that there may be significant demand for smart growth and rail transit in the Kansas City metropolitan area. RCLCO estimates that, all else being equal, nearly 60% of metro area households would prefer to live in a neighborhood where stores and restaurants are within walkable distance. If that walkability must come at the expense of large lot sizes, preference drops somewhat to approximately 42% of households, which nonetheless represents over 340,000 households.
The trade-off in lot size for walkability appears to become much more palatable, however, if the commute to work also becomes shorter. Our analysis suggests that approximately 61% of households in the metro area would accept a smaller lot size if it also meant a reduction in their daily commute time from 40 minutes to 20 minutes. Perhaps even more surprising, the analysis also concludes that 38% of households would be willing to trade their single-family detached home for a townhouse or apartment if it meant they could live in a walkable neighborhood and have a shorter commute.
While the preference for rail transit is less pronounced than for certain aspects of smart growth, RCLCO nonetheless estimates that approximately 40%, or 323,000 Kansas City households would like walkable access to fixed-rail transit.
These findings for the metro area are largely in-line with the estimated preferences for transit-oriented and smart growth development in many other major metropolitan areas, and the country as a whole, as shown on Exhibit 1.
Most of the corridors analyzed exhibit slightly greater preferences for transit-oriented development and smart growth than the MSA as a whole. Preference for transit-oriented development ranges from 39% of households along the Rock Island Corridor, to over 50% on the Troost Avenue and Shawnee Mission corridors. Shawnee Mission and Troost Avenue also showed the highest preferences for smart growth, with nearly half of households willing to trade their single-family detached home for an apartment or townhome in a walkable neighborhood with a shorter commute. Of all the corridors, the Rock Island and North Oak corridors, showed the least preference for smart growth across all dimensions but even in these areas, a significant portion of households appear to prefer smart growth.
DRAFT

Mid‐America Regional Council Page 3
E4-11243.01 July 18, 2012
Geography Question 8:
Preference for Walkable Neighborhood with Smaller Lots
Question 9:
Preference for Shorter Commute with Smaller Lots
Question 10:
Preference for Walkable,
Mixed-Use Neighborhoo
ds
Question 11:
Preference for Walkable
Neighborhoods and Shorter Commute without
Detached Housing
Transit:
Preference for Walkable Access to Rail Transit
Kansas City metropolitan
area 42% 61% 59% 38% 40%
State Avenue Corridor
44% 61% 62% 41% 41%
Troost Avenue Corridor
52% 65% 69% 48% 52%
Rock Island Corridor
41% 62% 57% 37% 38%
North Oak Corridor
39% 64% 59% 38% 39%
24-40 Corridor 44% 61% 62% 41% 44%
Shawnee Mission Corridor
52% 70% 71% 49% 51%
Finally, our analysis concludes that the psychographic profile of those that make up the demand for smart growth and transit is diverse. While groups that are often associated with a preference for smart growth and transit, such as young, urban professionals, and singles, will certainly play an important part in demand for such housing, more traditional suburban families are actually estimated to constitute a greater share of the total demand for smart growth and transit.
DRAFT

Mid‐America Regional Council Page 4
E4-11243.01 July 18, 2012
NAR Smart Growth Survey and National Findings
The National Association of REALTORS ® commissioned a national consumer research survey in the spring of 2011 to probe householder attitudes towards smart growth and public transit. RCLCO was retained to analyze the survey to better understand the results. To do this, RCLCO segmented the respondent pool into age, income, and urbanization cohorts, as well as LifeModes, which are components of ESRI’s Tapestry model of psychographic market segmentation.
This report focuses specifically on the results of the psychographic analysis and their application to the Kansas City metropolitan area and the geographies identified by the Mid-America Regional Council.
The survey assessed preference for smart growth based on the responses to four questions that consider a variety of trade-off scenarios, listed below:
Imagine for a moment that you are moving to another community. These questions are about the kind of community you would like to live in. Please select the community where you would prefer
to live.
Question 8:
Community A – Houses are built far apart on larger lots, and you have to drive to get to schools, stores and restaurants, park/playgrounds, and recreation areas, or
Community B – Houses are built close together on smaller lots, and it is easy to walk to schools, stores and restaurants, parks/playgrounds, and recreation areas
Question 9:
Community A – Houses are smaller on smaller lots, and you would have a shorter commute to work, 20 minutes or less, or
Community B – Houses are larger on larger lots, and you would have a longer commute to work, 40 minutes or more
Question 10:
Community A – The neighborhood has a mix of houses and stores and other businesses that are easy to walk to, or
Community B – The neighborhood has houses only, and you have to drive to stores and other businesses
Question 11:
Community A – Own or rent an apartment or townhouse, and have an easy walk to shops and restaurants and a shorter commute to work, or
DRAFT
Mid‐America Regional Council Page 5
E4-11243.01 July 18, 2012
Community B – Own or rent a detached, single-family house, and have to drive to shops and restaurants and have a longer commute to work
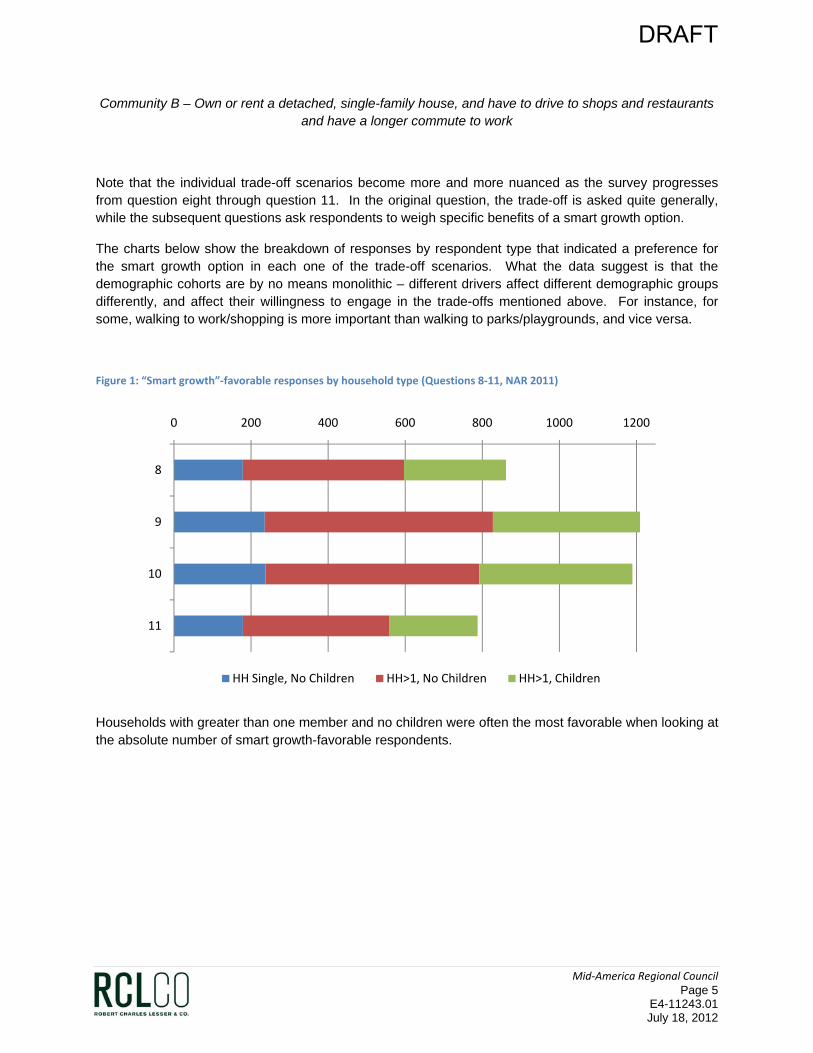
Note that the individual trade-off scenarios become more and more nuanced as the survey progresses from question eight through question 11. In the original question, the trade-off is asked quite generally, while the subsequent questions ask respondents to weigh specific benefits of a smart growth option.
The charts below show the breakdown of responses by respondent type that indicated a preference for the smart growth option in each one of the trade-off scenarios. What the data suggest is that the demographic cohorts are by no means monolithic – different drivers affect different demographic groups differently, and affect their willingness to engage in the trade-offs mentioned above. For instance, for some, walking to work/shopping is more important than walking to parks/playgrounds, and vice versa.
Figure 1: “Smart growth”‐favorable responses by household type (Questions 8‐11, NAR 2011)
Households with greater than one member and no children were often the most favorable when looking at the absolute number of smart growth-favorable respondents.
0 200 400 600 800 1000 1200
8
9
10
11
HH Single, No Children HH>1, No Children HH>1, Children
DRAFT

Mid‐America Regional Council Page 6
E4-11243.01 July 18, 2012
Figure 2: “Smart growth”‐favorable responses by respondent age (Questions 8‐11, NAR 2011)
Figure 3: “Smart growth”‐favorable responses by respondent income (Questions 8‐11, NAR 2011)
At a macro-level, the respondent breakdowns as per above indicate the following:
Not surprisingly, households with greater than one member and no children comprised a large portion of those who viewed smart growth favorably vis-à-vis the smart growth-favorable responses from other household types (even one-person households).
The two youngest groups, 18-34 and 35-54, comprised the strongest component of the total smart growth favorable response.
Viewed by income, both low-income and high-income respondents comprised the bulk of the smart growth favorable pool, while those in “middle incomes” comprised a smaller share of the pool.
0 200 400 600 800 1000 1200
8
9
10
11
18‐34 35‐54 55‐69 70+
0 200 400 600 800 1000 1200
8
9
10
11
Low Mid High
DRAFT

Mid‐America Regional Council Page 7
E4-11243.01 July 18, 2012
In addition to the questions addressing smart growth, the survey asked the following question related to transit:
“In deciding where to live, indicate how important it would be to you to have each of the following within an easy walk?”
Respondents were given an option to indicate public transportation by rail as unimportant, somewhat important, important, or very important.
Analysis of responses to this question in particular indicates that 23 percent of householders in general consider walking distance to public transportation by rail either “important” or “very important” in deciding where to live. One-person households without children exhibited slightly higher rates of affinity (28.7 percent), as did younger households 18-34 years of age (25.9 percent) and those with incomes below 80 percent of AMI (25.7 percent). Households with two or more persons with or without children were less likely to indicate an affinity for transit by rail, but the dropoff in affinity was less than two percentage points. Across the board, the only major subset of the respondent pool to favor walking distance to fixed rail transit at a rate below 20 percent were respondents over 70 years of age.
The NAR Smart Growth survey in 2004 did not ask an identical question, and so time-series evaluation of consumer preferences was not possible. However, the results from the above were cross-referenced with research conducted by the University of Utah under separate direction which sought to analyze the 2003 Porter | Novelli preference survey for a variety of Smart Growth preference coefficients, among them preference for transit. While the Porter | Novelli survey does not specify fixed rail transit or separate from bus transit, it did produce results that were similar to the NAR survey at the macro level.
Psychographic Modeling and its Application to the Kansas City metropolitan area
RCLCO analyzed the NAR survey response data through the lens of psychographics and segmentation modeling. Psychographics is defined as the study and classification of people according to their attitudes, aspirations, and other psychological criteria, and is a particularly powerful tool in market research. It creates profiles of consumers based not only on traditional demographic criteria such as age, income, gender, race, and other factors, but also by constructing behavioral relationships between customers (or householders, respondents, etc.) and a host of disparate datapoints (such as SUV sales penetration or dollars spent on Internet shopping). These relationships allow for a deeper understanding of the consumer attitudes, tastes, and psychologies that ultimately comprise decision-making in the marketplace, while allowing demographers and market research analysts to quantify the depth, character, and market share of these “segments.”
RCLCO utilized the Tapestry segmentation platform, created and maintained by ESRI, to further analyze the respondent dataset and better understand the potential classes of householders
DRAFT

Mid‐America Regional Council Page 8
E4-11243.01 July 18, 2012
that indicated a preference for smart growth and fixed-rail transit. A full description of the Tapestry segmentation methodology is given under separate cover, and a summary of the Tapestry segmentations conducted is given in the Appendix.
For each of the 12 LifeModes, which are ESRI’s groupings of the 65 individual tapestry segments, RCLCO calculated national preference “penetration” rates. That is to say, each respondent to the national NAR survey was categorized according to their Tapestry and LifeMode by associating the dominant tapestry in each zip code as determined by ESRI, with the zip code of the respondent. For each Tapestry and LifeMode, the number of favorable respondents was divided by the total respondents for each question to determine the penetration rate.
We should note that, while the survey included respondents from the Kansas City metropolitan area, the sample size from the Kansas City metropolitan area alone was insufficient to draw reliable conclusions. As a result, we have developed national preference rates for smart growth and transit for each LifeMode, and applied them to the distribution of LifeModes in the Kansas City metropolitan area and the specific study areas.
Penetration Rates The chart below shows the penetration rates, or the percentage of households within each LifeMode that is likely to prefer smart growth or transit, based on analysis of the NAR survey results. As noted above, penetration rates for smart growth vary depending on the question asked. The chart below presents the average preference rate for smart growth across all four questions.
0%
10%
20%
30%
40%
50%
60%
70%
80%
DRAFT
Mid‐America Regional Council Page 9
E4-11243.01 July 18, 2012
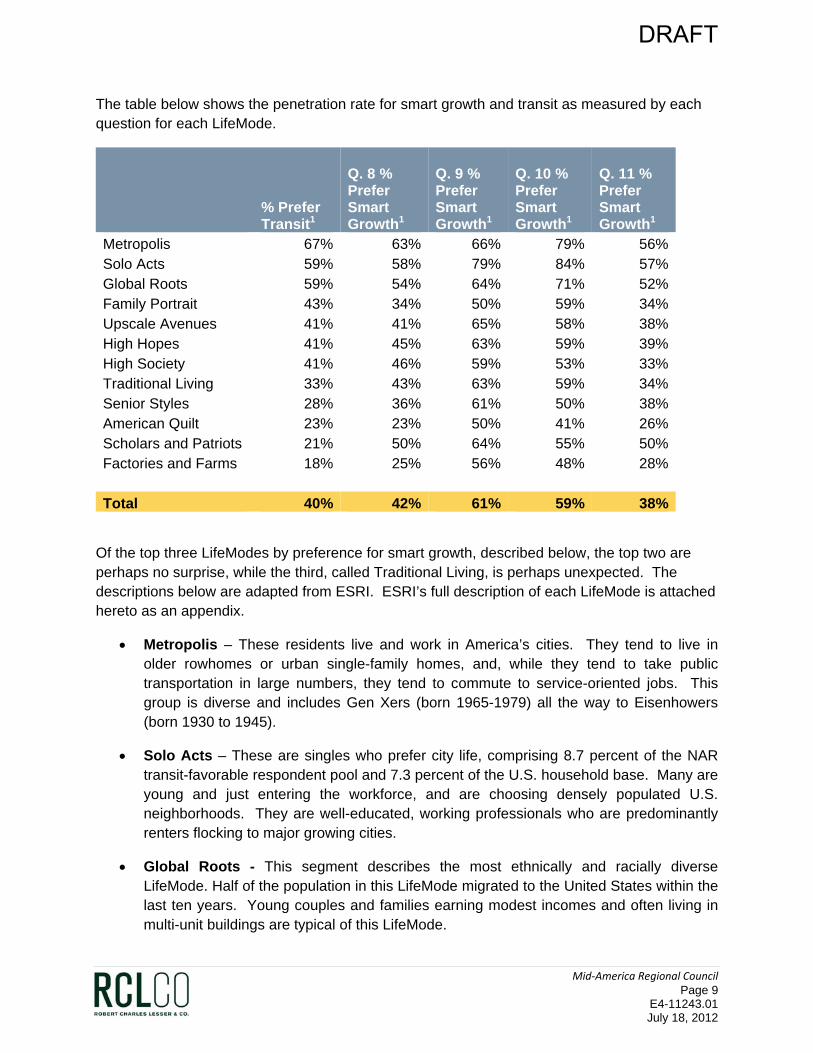
The table below shows the penetration rate for smart growth and transit as measured by each question for each LifeMode.
% Prefer Transit1
Q. 8 % Prefer Smart Growth1
Q. 9 % Prefer Smart Growth1
Q. 10 % Prefer Smart Growth1
Q. 11 % Prefer Smart Growth1
Metropolis 67% 63% 66% 79% 56%Solo Acts 59% 58% 79% 84% 57%Global Roots 59% 54% 64% 71% 52%Family Portrait 43% 34% 50% 59% 34%Upscale Avenues 41% 41% 65% 58% 38%High Hopes 41% 45% 63% 59% 39%High Society 41% 46% 59% 53% 33%Traditional Living 33% 43% 63% 59% 34%Senior Styles 28% 36% 61% 50% 38%American Quilt 23% 23% 50% 41% 26%Scholars and Patriots 21% 50% 64% 55% 50%Factories and Farms 18% 25% 56% 48% 28%
Total 40% 42% 61% 59% 38%
Of the top three LifeModes by preference for smart growth, described below, the top two are perhaps no surprise, while the third, called Traditional Living, is perhaps unexpected. The descriptions below are adapted from ESRI. ESRI’s full description of each LifeMode is attached hereto as an appendix.
Metropolis – These residents live and work in America’s cities. They tend to live in older rowhomes or urban single-family homes, and, while they tend to take public transportation in large numbers, they tend to commute to service-oriented jobs. This group is diverse and includes Gen Xers (born 1965-1979) all the way to Eisenhowers (born 1930 to 1945).
Solo Acts – These are singles who prefer city life, comprising 8.7 percent of the NAR transit-favorable respondent pool and 7.3 percent of the U.S. household base. Many are young and just entering the workforce, and are choosing densely populated U.S. neighborhoods. They are well-educated, working professionals who are predominantly renters flocking to major growing cities.
Global Roots - This segment describes the most ethnically and racially diverse LifeMode. Half of the population in this LifeMode migrated to the United States within the last ten years. Young couples and families earning modest incomes and often living in multi-unit buildings are typical of this LifeMode.
DRAFT
Mid‐America Regional Council Page 10
E4-11243.01 July 18, 2012
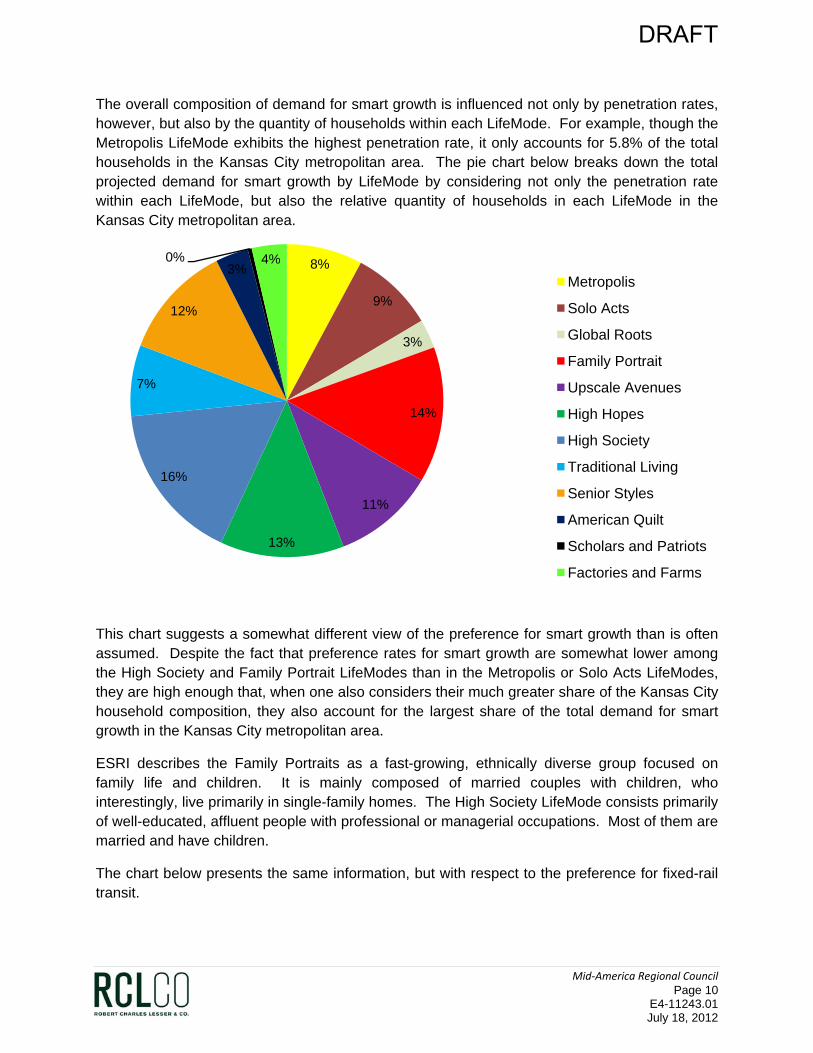
The overall composition of demand for smart growth is influenced not only by penetration rates, however, but also by the quantity of households within each LifeMode. For example, though the Metropolis LifeMode exhibits the highest penetration rate, it only accounts for 5.8% of the total households in the Kansas City metropolitan area. The pie chart below breaks down the total projected demand for smart growth by LifeMode by considering not only the penetration rate within each LifeMode, but also the relative quantity of households in each LifeMode in the Kansas City metropolitan area.
This chart suggests a somewhat different view of the preference for smart growth than is often assumed. Despite the fact that preference rates for smart growth are somewhat lower among the High Society and Family Portrait LifeModes than in the Metropolis or Solo Acts LifeModes, they are high enough that, when one also considers their much greater share of the Kansas City household composition, they also account for the largest share of the total demand for smart growth in the Kansas City metropolitan area.
ESRI describes the Family Portraits as a fast-growing, ethnically diverse group focused on family life and children. It is mainly composed of married couples with children, who interestingly, live primarily in single-family homes. The High Society LifeMode consists primarily of well-educated, affluent people with professional or managerial occupations. Most of them are married and have children.
The chart below presents the same information, but with respect to the preference for fixed-rail transit.
8%
9%
3%
14%
11%
13%
16%
7%
12%
3%0% 4%
Metropolis
Solo Acts
Global Roots
Family Portrait
Upscale Avenues
High Hopes
High Society
Traditional Living
Senior Styles
American Quilt
Scholars and Patriots
Factories and Farms
DRAFT

Mid‐America Regional Council Page 11
E4-11243.01 July 18, 2012
While the relative contributions to demand vary somewhat, the same conclusions emerge. Demand for transit, like smart growth, will come from a diverse variety of people and lifestyles, including those that are more frequently associated with traditional suburban living in single-family detached homes. In fact, in the Kansas City metropolitan area, the results suggest that the Family Portrait and High Society LifeModes will constitute the two most important sources of demand for smart growth and transit.
The table below presents the distribution of households by LifeMode in the Kansas City metropolitan area and the quantity that is likely to support transit and/or smart growth under each of the four questions asked by the NAR Survey. This suggests that approximately 40%, or 323,000 of Kansas City households would support transit in their neighborhoods, and the percentage of households willing to trade a larger lot and/or a single-family home for elements of smart growth ranges from 38% to 61%, depending mainly on whether the smart growth neighborhood would also offer a shorter commute time.
10%
10%
4%
14%
11%13%
18%
7%
9%
2%0% 2%Metropolis
Solo Acts
Global Roots
Family Portrait
Upscale Avenues
High Hopes
High Society
Traditional Living
Senior Styles
American Quilt
Scholars and Patriots
Factories and Farms
MSA House-holds Distrib.
% Prefer
Transit1Quantity of HHs
Q. 8 % Prefer Smart
Growth1Quantity of HHs
Q. 9 % Prefer Smart
Growth1Quantity of HHs
Q. 10 % Prefer Smart
Growth1Quantity of HHs
Q. 11 % Prefer Smart
Growth1Quantity of HHs
Metropolis 46,651 6% 67% 31,101 63% 29,157 66% 30,780 79% 36,830 56% 26,182Solo Acts 54,538 7% 59% 32,353 58% 31,859 79% 43,198 84% 45,898 57% 31,319Global Roots 20,667 3% 59% 12,098 54% 11,235 64% 13,126 71% 14,662 52% 10,680Family Portrait 106,903 13% 43% 45,816 34% 36,733 50% 52,983 59% 63,488 34% 36,271Upscale Avenues 85,444 11% 41% 35,379 41% 35,200 65% 55,724 58% 49,961 38% 32,361High Hopes 104,988 13% 41% 43,230 45% 47,573 63% 65,618 59% 62,337 39% 41,011High Society 137,876 17% 41% 56,565 46% 62,754 59% 81,515 53% 73,503 33% 45,182Traditional Living 63,978 8% 33% 21,099 43% 27,571 63% 40,074 59% 37,821 34% 21,795Senior Styles 105,730 13% 28% 29,265 36% 38,447 61% 64,556 50% 53,118 38% 40,665American Quilt 31,746 4% 23% 7,352 23% 7,339 50% 15,961 41% 12,908 26% 8,193Scholars and Patriots 4,437 1% 21% 951 50% 2,219 64% 2,824 55% 2,420 50% 2,219Factories and Farms 43,043 5% 18% 7,738 25% 10,822 56% 23,967 48% 20,532 28% 11,984
Total 806,001 100% 40% 322,945 42% 340,908 61% 490,326 59% 473,478 38% 307,860
DRAFT
Mid‐America Regional Council Page 12
E4-11243.01 July 18, 2012
Results by Corridor RCLCO analyzed the psychographic distribution of households and the resultant preference potential for smart growth and transit along six corridors identified by the Mid-America Regional Council: The North Oak Trafficway, State Avenue, Troost Avenue, Highway 24/40, Rock Island, and the Shawnee Mission Parkway. Each of these corridors was further divided into nodes or segments for more detailed analysis.
As a general rule, RCLCO analyzed the psychographic segmentation of households within a ½ mile distance in both directions from the centerline of the corridor or a ½ mile radius around the center of a node, where applicable. The specific boundaries of the analyzed areas are, however, determined by the boundaries of census block groups, the smallest geographic areas for which Tapestry segmentation data is available. The block groups included in each corridor and sub-corridor area are highlighted on the maps below.
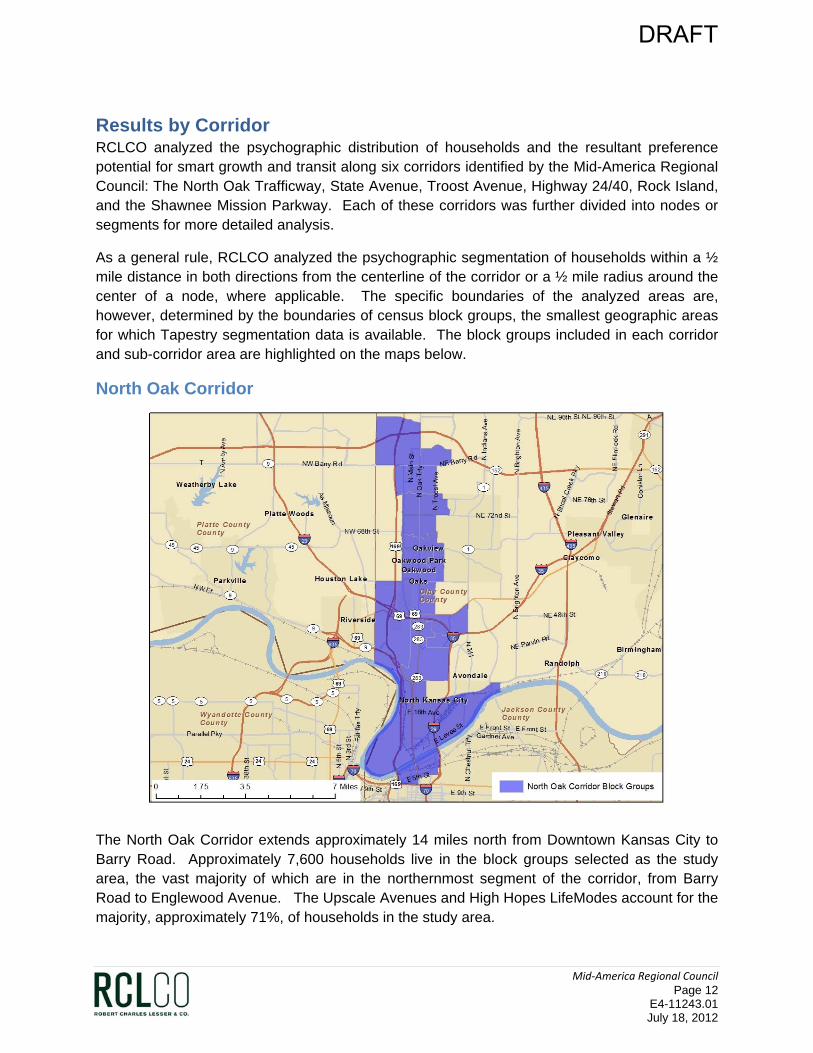
North Oak Corridor
The North Oak Corridor extends approximately 14 miles north from Downtown Kansas City to Barry Road. Approximately 7,600 households live in the block groups selected as the study area, the vast majority of which are in the northernmost segment of the corridor, from Barry Road to Englewood Avenue. The Upscale Avenues and High Hopes LifeModes account for the majority, approximately 71%, of households in the study area.
DRAFT

Mid‐America Regional Council Page 13
E4-11243.01 July 18, 2012
The demand for transit and smart growth in this corridor, expressed as a percentage of total households, is similar to that of the MSA as a whole. The results for the total corridor are presented below. Detailed results for each segment of the corridor are presented in the attached appendix.
State Avenue Corridor
The State Avenue corridor runs approximately 13.5 miles from East to West and the selected block groups that constitute the study area contain approximately 13,200 households. A diverse variety of LifeModes is represented in this corridor, with no single LifeMode accounting for more than 23% of the total. Nonetheless, it is noteworthy that the Metropolis LifeMode, which shows the highest preference for transit and high preferences for smart growth, makes up 17% of the
North Oak Corridor Total
House- holds Distrib.
% Prefer Transit
Quantity of HHs
Q. 8 % Prefer Smart Growth
Quantity of HHs
Q. 9 % Prefer Smart Growth
Quantity of HHs
Q. 10 % Prefer Smart Growth
Quantity of HHs
Q. 11 % Prefer Smart Growth
Quantity of HHs
Metropolis 0 0% 67% 0 63% 0 66% 0 79% 0 56% 0Solo Acts 226 3% 59% 134 58% 132 79% 179 84% 190 57% 130Global Roots 0 0% 59% 0 54% 0 64% 0 71% 0 52% 0Family Portrait 0 0% 43% 0 34% 0 50% 0 59% 0 34% 0Upscale Avenues 3,075 41% 41% 1,273 41% 1,267 65% 2,005 58% 1,798 38% 1165High Hopes 2,262 30% 41% 931 45% 1,025 63% 1,414 59% 1,343 39% 884High Society 0 0% 41% 0 46% 0 59% 0 53% 0 33% 0Traditional Living 1,376 18% 33% 454 43% 593 63% 862 59% 813 34% 469Senior Styles 617 8% 28% 171 36% 224 61% 377 50% 310 38% 237American Quilt 0 0% 23% 0 23% 0 50% 0 41% 0 26% 0Scholars and Patriots 0 0% 21% 0 50% 0 64% 0 55% 0 50% 0Factories and Farms 0 0% 18% 0 25% 0 56% 0 48% 0 28% 0Total 7,556 100% 39.22% 2,963 42.9% 3,241 64.0% 4,837 59.0% 4,455 38.2% 2,884
DRAFT
Mid‐America Regional Council Page 14
E4-11243.01 July 18, 2012
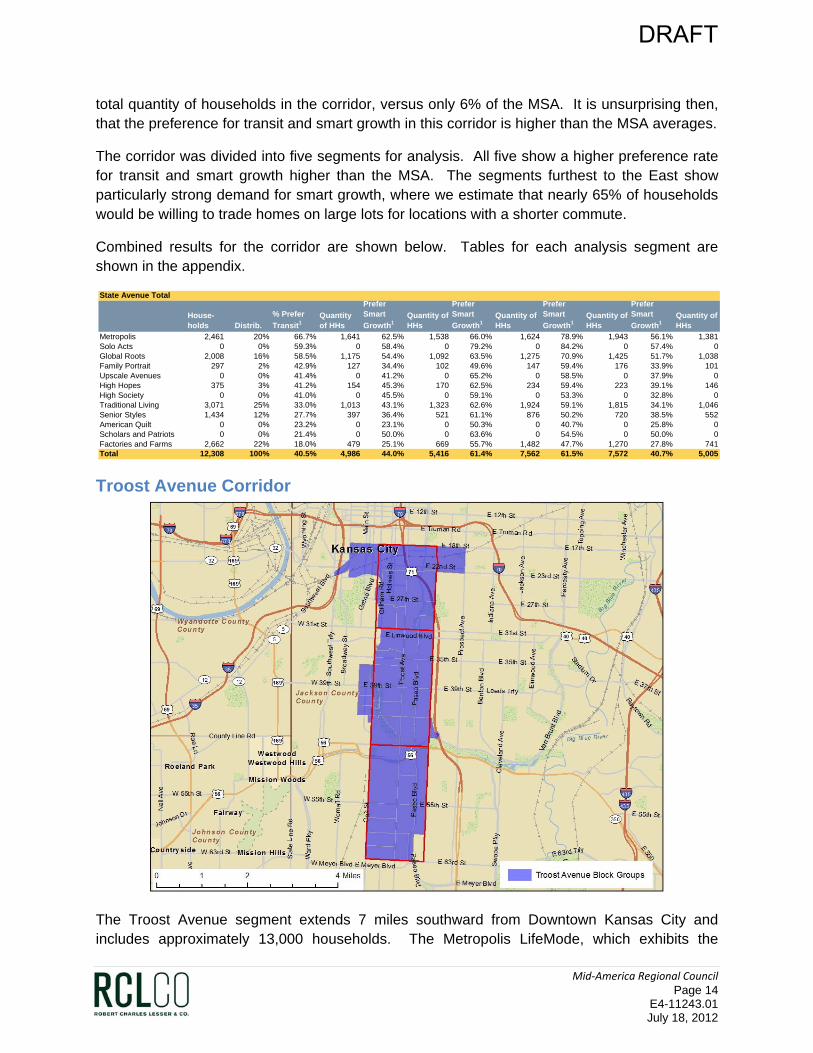
total quantity of households in the corridor, versus only 6% of the MSA. It is unsurprising then, that the preference for transit and smart growth in this corridor is higher than the MSA averages.
The corridor was divided into five segments for analysis. All five show a higher preference rate for transit and smart growth higher than the MSA. The segments furthest to the East show particularly strong demand for smart growth, where we estimate that nearly 65% of households would be willing to trade homes on large lots for locations with a shorter commute.
Combined results for the corridor are shown below. Tables for each analysis segment are shown in the appendix.
Troost Avenue Corridor
The Troost Avenue segment extends 7 miles southward from Downtown Kansas City and includes approximately 13,000 households. The Metropolis LifeMode, which exhibits the
State Avenue Total
House- holds Distrib.
% Prefer
Transit1Quantity of HHs
Prefer Smart
Growth1Quantity of HHs
Prefer Smart
Growth1Quantity of HHs
Prefer Smart
Growth1Quantity of HHs
Prefer Smart
Growth1Quantity of HHs
Metropolis 2,461 20% 66.7% 1,641 62.5% 1,538 66.0% 1,624 78.9% 1,943 56.1% 1,381Solo Acts 0 0% 59.3% 0 58.4% 0 79.2% 0 84.2% 0 57.4% 0Global Roots 2,008 16% 58.5% 1,175 54.4% 1,092 63.5% 1,275 70.9% 1,425 51.7% 1,038Family Portrait 297 2% 42.9% 127 34.4% 102 49.6% 147 59.4% 176 33.9% 101Upscale Avenues 0 0% 41.4% 0 41.2% 0 65.2% 0 58.5% 0 37.9% 0High Hopes 375 3% 41.2% 154 45.3% 170 62.5% 234 59.4% 223 39.1% 146High Society 0 0% 41.0% 0 45.5% 0 59.1% 0 53.3% 0 32.8% 0Traditional Living 3,071 25% 33.0% 1,013 43.1% 1,323 62.6% 1,924 59.1% 1,815 34.1% 1,046Senior Styles 1,434 12% 27.7% 397 36.4% 521 61.1% 876 50.2% 720 38.5% 552American Quilt 0 0% 23.2% 0 23.1% 0 50.3% 0 40.7% 0 25.8% 0Scholars and Patriots 0 0% 21.4% 0 50.0% 0 63.6% 0 54.5% 0 50.0% 0Factories and Farms 2,662 22% 18.0% 479 25.1% 669 55.7% 1,482 47.7% 1,270 27.8% 741Total 12,308 100% 40.5% 4,986 44.0% 5,416 61.4% 7,562 61.5% 7,572 40.7% 5,005
DRAFT

Mid‐America Regional Council Page 15
E4-11243.01 July 18, 2012
highest preference for transit, accounts for 37% of all households in the corridor versus only 6% of the MSA as previously mentioned. As a result, we believe this corridor would be among the most receptive to transit of any of the corridors studied. The analysis suggests that 52% of households in this corridor would prefer to live near rail transit.
The preference for smart growth is also quite high relative to the MSA and the other corridors studied, particularly with respect to question 11. Based on this analysis, we estimate that half of all households in this corridor would be willing to trade their single-family home for an apartment or townhome if it meant living in a walkable neighborhood with convenient stores and restaurants, and a shorter commute.
While there is some variation among the three segments of the corridor that were analyzed, they all exhibit much higher than average preference rates for transit and smart growth than the MSA as a whole.
The combined results are shown below:
Troost Avenue Total
House- holds Distrib.
% Prefer
Transit1Quantity of HHs
Q. 8 % Prefer Smart
Growth1Quantity of HHs
Q. 9 % Prefer Smart
Growth1Quantity of HHs
Q. 10 % Prefer Smart
Growth1Quantity of HHs
Q. 11 % Prefer Smart
Growth1Quantity of HHs
Metropolis 4,691 37% 67% 3,127 63% 2,932 66% 3,095 79% 3,703 56% 2,633Solo Acts 1,756 14% 59% 1,042 58% 1,026 79% 1,391 84% 1,478 57% 1,008Global Roots 598 5% 59% 350 54% 325 64% 380 71% 424 52% 309Family Portrait 1,479 12% 43% 634 34% 508 50% 733 59% 878 34% 502Upscale Avenues 0 0% 41% 0 41% 0 65% 0 58% 0 38% 0High Hopes 1,998 16% 41% 823 45% 905 63% 1,249 59% 1,186 39% 780High Society 0 0% 41% 0 46% 0 59% 0 53% 0 33% 0Traditional Living 266 2% 33% 88 43% 115 63% 167 59% 157 34% 91Senior Styles 1,317 10% 28% 365 36% 479 61% 804 50% 662 38% 507American Quilt 0 0% 23% 0 23% 0 50% 0 41% 0 26% 0Scholars and Patriots 592 5% 21% 127 50% 296 64% 377 55% 323 50% 296Factories and Farms 0 0% 18% 0 25% 0 56% 0 48% 0 28% 0Total 12,697 100% 51.62% 6,555 51.9% 6,586 64.5% 8,195 69.4% 8,812 48.2% 6,126
DRAFT
Mid‐America Regional Council Page 16
E4-11243.01 July 18, 2012
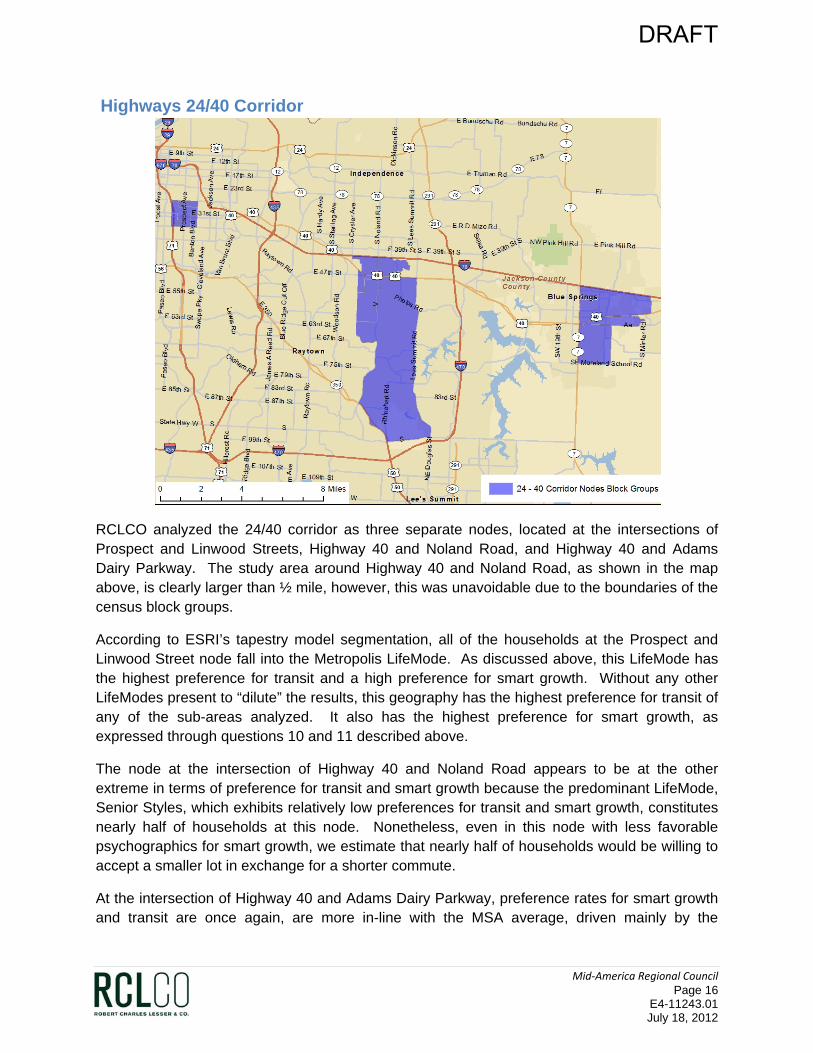
Highways 24/40 Corridor
RCLCO analyzed the 24/40 corridor as three separate nodes, located at the intersections of Prospect and Linwood Streets, Highway 40 and Noland Road, and Highway 40 and Adams Dairy Parkway. The study area around Highway 40 and Noland Road, as shown in the map above, is clearly larger than ½ mile, however, this was unavoidable due to the boundaries of the census block groups.
According to ESRI’s tapestry model segmentation, all of the households at the Prospect and Linwood Street node fall into the Metropolis LifeMode. As discussed above, this LifeMode has the highest preference for transit and a high preference for smart growth. Without any other LifeModes present to “dilute” the results, this geography has the highest preference for transit of any of the sub-areas analyzed. It also has the highest preference for smart growth, as expressed through questions 10 and 11 described above.
The node at the intersection of Highway 40 and Noland Road appears to be at the other extreme in terms of preference for transit and smart growth because the predominant LifeMode, Senior Styles, which exhibits relatively low preferences for transit and smart growth, constitutes nearly half of households at this node. Nonetheless, even in this node with less favorable psychographics for smart growth, we estimate that nearly half of households would be willing to accept a smaller lot in exchange for a shorter commute.
At the intersection of Highway 40 and Adams Dairy Parkway, preference rates for smart growth and transit are once again, are more in-line with the MSA average, driven mainly by the
DRAFT
Mid‐America Regional Council Page 17
E4-11243.01 July 18, 2012
presence of households in the Family Portrait and High Hopes LifeModes, which account for nearly all of the households at this node.
Combined, the three nodes show a higher relative demand for smart growth and transit than the MSA average, despite the below average preference rates at the Highway 40 and Noland Road intersection. Detailed results by node are shown in the Appendix.
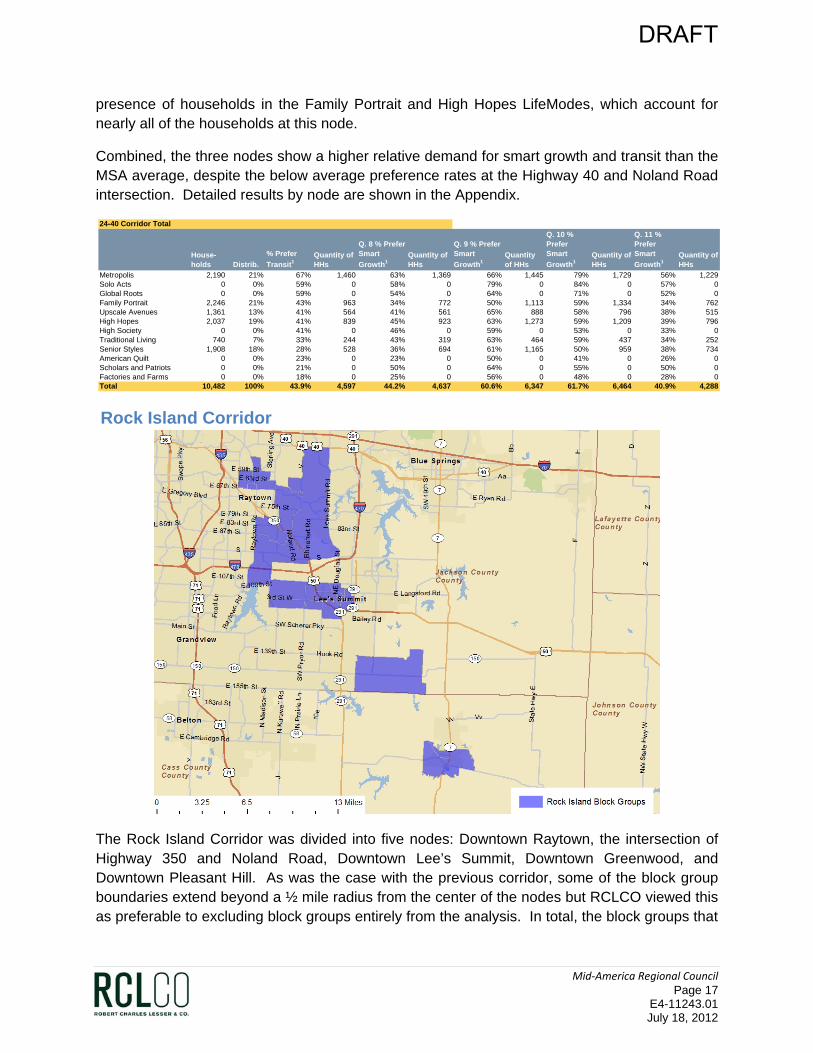
Rock Island Corridor
The Rock Island Corridor was divided into five nodes: Downtown Raytown, the intersection of Highway 350 and Noland Road, Downtown Lee’s Summit, Downtown Greenwood, and Downtown Pleasant Hill. As was the case with the previous corridor, some of the block group boundaries extend beyond a ½ mile radius from the center of the nodes but RCLCO viewed this as preferable to excluding block groups entirely from the analysis. In total, the block groups that
24-40 Corridor Total
House- holds Distrib.
% Prefer
Transit1Quantity of HHs
Q. 8 % Prefer Smart
Growth1Quantity of HHs
Q. 9 % Prefer Smart
Growth1Quantity of HHs
Q. 10 % Prefer Smart
Growth1Quantity of HHs
Q. 11 % Prefer Smart
Growth1Quantity of HHs
Metropolis 2,190 21% 67% 1,460 63% 1,369 66% 1,445 79% 1,729 56% 1,229Solo Acts 0 0% 59% 0 58% 0 79% 0 84% 0 57% 0Global Roots 0 0% 59% 0 54% 0 64% 0 71% 0 52% 0Family Portrait 2,246 21% 43% 963 34% 772 50% 1,113 59% 1,334 34% 762Upscale Avenues 1,361 13% 41% 564 41% 561 65% 888 58% 796 38% 515High Hopes 2,037 19% 41% 839 45% 923 63% 1,273 59% 1,209 39% 796High Society 0 0% 41% 0 46% 0 59% 0 53% 0 33% 0Traditional Living 740 7% 33% 244 43% 319 63% 464 59% 437 34% 252Senior Styles 1,908 18% 28% 528 36% 694 61% 1,165 50% 959 38% 734American Quilt 0 0% 23% 0 23% 0 50% 0 41% 0 26% 0Scholars and Patriots 0 0% 21% 0 50% 0 64% 0 55% 0 50% 0Factories and Farms 0 0% 18% 0 25% 0 56% 0 48% 0 28% 0Total 10,482 100% 43.9% 4,597 44.2% 4,637 60.6% 6,347 61.7% 6,464 40.9% 4,288
DRAFT

Mid‐America Regional Council Page 18
E4-11243.01 July 18, 2012
make up the Rock Island Corridor include approximately 18,000 households, making it the largest corridor studied.
As one might expect given the more suburban, almost rural character of portions of this corridor, its preference rates for transit and smart growth are, for the most part, in-line with or lower than the MSA average.
The combined results for the corridor are shown below:
Rock Island Corridor Total
House- holds Distrib.
% Prefer Transit
Quantity of HHs
Q. 8 % Prefer Smart Growth
Quantity of HHs
Q. 9 % Prefer Smart Growth
Quantity of HHs
Q. 10 % Prefer Smart Growth
Quantity of HHs
Q. 11 % Prefer Smart Growth
Quantity of HHs
Metropolis 0 0% 67% 0 63% 0 66% 0 79% 0 56% 0Solo Acts 0 0% 59% 0 58% 0 79% 0 84% 0 57% 0Global Roots 547 3% 59% 320 54% 297 64% 347 71% 388 52% 283Family Portrait 1,892 10% 43% 811 34% 650 50% 938 59% 1,124 34% 642Upscale Avenues 5,378 30% 41% 2,227 41% 2,216 65% 3,507 58% 3,145 38% 2,037High Hopes 1,819 10% 41% 749 45% 824 63% 1,137 59% 1,080 39% 711High Society 1,191 7% 41% 489 46% 542 59% 704 53% 635 33% 390Traditional Living 3,871 21% 33% 1,277 43% 1,668 63% 2,425 59% 2,288 34% 1,319Senior Styles 3,330 18% 28% 922 36% 1,211 61% 2,033 50% 1,673 38% 1,281American Quilt 0 0% 23% 0 23% 0 50% 0 41% 0 26% 0Scholars and Patriots 0 0% 21% 0 50% 0 64% 0 55% 0 50% 0Factories and Farms 0 0% 18% 0 25% 0 56% 0 48% 0 28% 0Total 18,028 100% 37.7% 6,794 41.1% 7,408 61.5% 11,091 57% 10,333 37.0% 6,662
DRAFT

Mid‐America Regional Council Page 19
E4-11243.01 July 18, 2012
Shawnee Mission Parkway Corridor
The Shawnee Mission Parkway Corridor, for purposes of this report includes 4 nodes. 3 nodes are located on Shawnee Mission Parkway at the following cross streets, Nieman Road, Antioch Road, and Johnson Road. An additional node at the intersection of Metcalf and 80th streets has also been included in this analysis. Together these nodes contain approximately 11,000 households.
With substantial number of households in the Metropolis and Solo Acts LifeModes – together they make up for more than half of the total households in the corridor – the preference for transit and smart growth is high relative to the average for the MSA. Based on our analysis, 70% of households in this corridor would accept a smaller lot in exchange for a shorter commute, and nearly half would trade a single-family detached home for an apartment or townhome if it meant a walkable neighborhood and shorter commute.
DRAFT

Mid‐America Regional Council Page 20
E4-11243.01 July 18, 2012
The combined results for the corridor are shown below:
Shawnee Mission Parkway Total
House- holds Distrib.
% Prefer Transit
Quantity of HHs
Q. 8 % Prefer Smart Growth
Quantity of HHs
Q. 9 % Prefer Smart Growth
Quantity of HHs
Q. 10 % Prefer Smart Growth
Quantity of HHs
Q. 11 % Prefer Smart Growth
Quantity of HHs
Metropolis 1,717 16% 67% 1,145 63% 1,073 66% 1,133 79% 1,356 56% 964Solo Acts 4,337 40% 59% 2,573 58% 2,533 79% 3,435 84% 3,650 57% 2,491Global Roots 0 0% 59% 0 54% 0 64% 0 71% 0 52% 0Family Portrait 0 0% 43% 0 34% 0 50% 0 59% 0 34% 0Upscale Avenues 1,514 14% 41% 627 41% 624 65% 987 58% 885 38% 573High Hopes 1,953 18% 41% 804 45% 885 63% 1,221 59% 1,160 39% 763High Society 0 0% 41% 0 46% 0 59% 0 53% 0 33% 0Traditional Living 450 4% 33% 148 43% 194 63% 282 59% 266 34% 153Senior Styles 965 9% 28% 267 36% 351 61% 589 50% 485 38% 371American Quilt 0 0% 23% 0 23% 0 50% 0 41% 0 26% 0Scholars and Patriots 0 0% 21% 0 50% 0 64% 0 55% 0 50% 0Factories and Farms 0 0% 18% 0 25% 0 56% 0 48% 0 28% 0Total 10,936 100% 50.9% 5,564 51.8% 5,660 69.9% 7,647 71.3% 7,801 48.6% 5,315
DRAFT