homework help,math homework help,homework help online,physics homeworkhelp,college homework help
56:171
Fall 2002
Operations Research
Homework Assignments Instructor: D. L. Bricker
University of Iowa
Dept. of Mechanical & Industrial Engineering

56:171 O.R. -- HW #1 Fall 2001 page 1
56:171 Operations ResearchHomework #1 - Due Wednesday, September 4, 2002
1. The Keyesport Quarry has two different pits from which it obtains rock. The rock isrun through a crusher to produce two products: concrete grade stone and road surfacechat. Each ton of rock from the South pit converts into 0.75 tons of stone and 0.25tons of chat when crushed. Rock from the North pit is of different quality. When it iscrushed it produces a “50-50” split of sone and chat. The Quarry has contracts for 60tons of stone and 40 tons of chat this planning period. The cost per ton of extractingand crushing rock from the South pit is 1.6 times as costly as from the North pit.a. What are the decision variables in the problem? Be sure to give their definitions,
not just their names!b. There are two constraints for this problem.
• State them in words.• State them in equation or inequality form.
c. State the objective function.d. Graph the feasible region (in 2 dimensions) for this problem.e. Draw an appropriate objective function line on the graph and indicate graphically
and numerically the optimal solution.f. Use LINDO (or other appropriate LP solver) to compute the optimal solution.
2. a. Draw the feasible region of the following LP:
Maximize 5X1 + 2X2
subject to 4X1 + 3X2 ≤ 24X1 + X2 ≤ 8
3X1 + X2 ≤ 9X1 ≥ 0, X2 ≥ 0
b. Indicate on the graph the optimal solution.
3. a. Compute the inverse of the matrix (showing your computational steps):
1 0 11 2 02 1 1
A−
= − −
b. Find a solution (if one exists) of the equations:
1 2 3
1 2 3
2 3
2 42 2 15
3 2 5
X X XX X X
X X
+ − = − + = − = −

56:171 O.R. -- HW #1 Fall 2001 page 2

56:171 O.R. -- HW #2 Fall 2001 page 1
56:171 Operations ResearchHomework #2 - Due Friday, September 12, 2002
1. (Exercise 3.4-18, page 98, of Hillier&Lieberman text, 7th edition)“Oxbridge University maintains a powerful mainframe computer for research use
by its faculty, Ph.D. students, and research associates. During all working hours, anoperator must be able to operate and maintain the computer, as well as to performsome programming services. Beryl Ingram, the director of the computer facility,oversees the operation.
It is now the beginning of the fall semester, and Beryl is confronted with theproblem of assigning different working hours to her operators. Because all theoperators are currently enrolled in the university, they are available to work only alimited number of hours each day, as shown in the following table.
Maximum # hours availableName Wage $/hr Mon Tues Wed Thur FriK.C. 10.00 6 0 6 0 6D.H. 10.10 0 6 0 6 0H.B. 9.90 4 8 4 0 4S.C. 9.80 5 5 5 0 5K.S. 10.80 3 0 3 8 0N.K. 11.30 0 0 0 6 2
There are six operators (four undergraduate students and two graduate students). They all have different wage rates because of differences in their experience withcomputers and in their programming ability. The above table shows their wage rates,along with the maximum number of hours that each can work each day.
Each operator is guaranteed a certain minimum number of hours per week that willmaintain an adequate knowledge of the operation. This level is set arbitrarily at 8hours per week for the undergraduate students (K.C,, D.H, H.B, and S.C.) and 7 hoursper week for the graduate students (K.S. and N.K.).
The computer facility is to be open for operation from 8 a.m. to 10 p.m. Mondaythrough Friday with exactly one operator on duty during these hours. On Saturdaysand Sundays, the computer is to be operated by other staff.
Because of a tight budget, Beryl has to minimize cost. She wishes to determine thenumber of hours she should assign to each operator on each day.”
a. Formulate a linear programming model for this problem. Be sure to define yourvariables!
b. Use an LP solver (e.g. LINDO or LINGO) to find the optimal solution.

56:171 O.R. -- HW #2 Fall 2001 page 2
2. (Exercise 4.4-9, page 176, of Hillier&Lieberman text, 7th edition)Work through the simplex method step by step (in tabular form) to solve the followingproblem:
Maximize Z=2X1 – X2 + X3subject to
3X1 + X2 + X3 ≤ 6X1 – X2 + 2X3 ≤ 1X1 + X2 – X3 ≤ 2
andX1 ≥ 0, X2 ≥ 0, X3 ≥ 0
3. (Exercise 3.5-3, p. 99, of Hillier&Lieberman text, 7th edition)Read the 1986 article footnoted in Sec. 2.1 that describes the third case study presented inSection 3.5: “Planning Supply, Distribution, and Marketing at Citgo PetroleumCorporation,” by D. Klingman, N. Phillips, D. Steiger, R. Wirth, & W. Young,Interfaces, Vol. 16 no. 3 (May-June 1986), pp. 1-19.
a. What happened during the years preceding this OR study that made it vastly more
important to control the amount of capital tied up in inventory?
b. What geographical area is spanned by Citgo’s distribution network of pipelines,
tankers, and barges? Where do they market their products?
c. What time periods are included in the model?
d. Which computer did Citgo use to solve the model? What were typical run times?
e. Who are the four types of model users?
f. List the major types of reports generated by the SDM system.
56:171 O.R. -- HW #3 Fall 2001 page 1 of 4
56:171 Operations ResearchHomework #3 - Due Friday, September 20, 2002
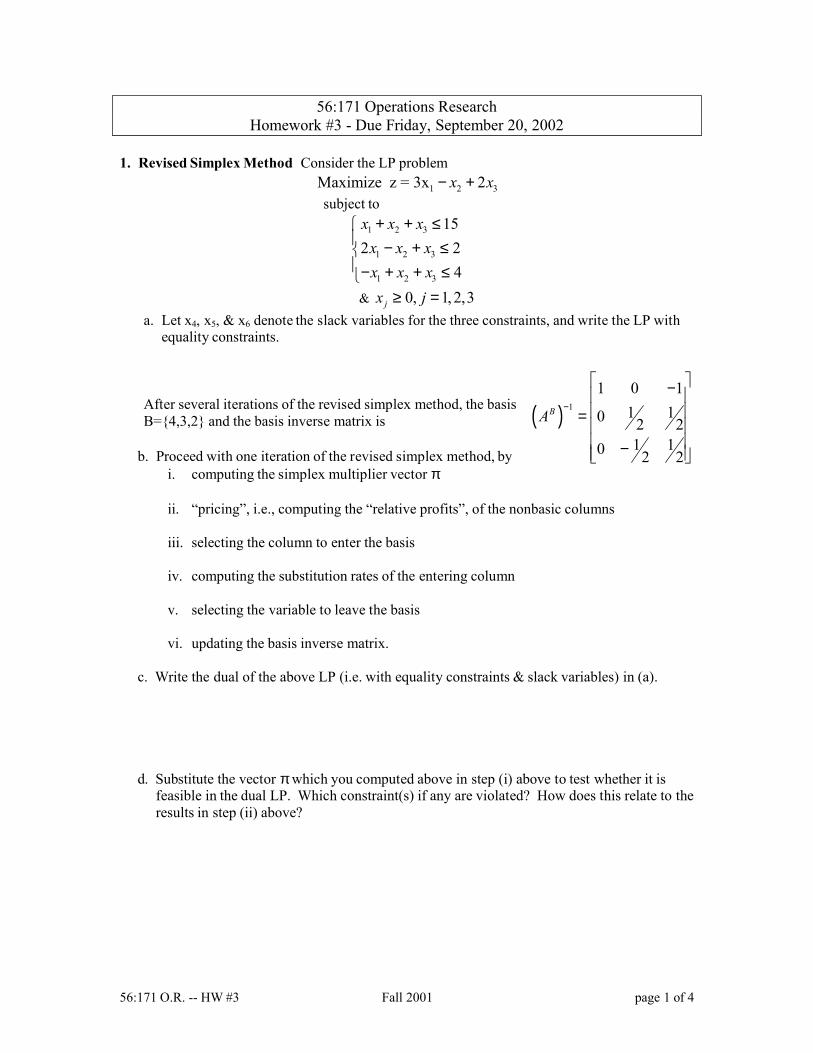
1. Revised Simplex Method Consider the LP problem1 2 3Maximize z = 3x 2x x− +
subject to
1 2 3
1 2 3
1 2 3
152 2
4
x x xx x xx x x
+ + ≤ − + ≤− + + ≤& 0, 1, 2,3jx j≥ =
a. Let x4, x5, & x6 denote the slack variables for the three constraints, and write the LP withequality constraints.
After several iterations of the revised simplex method, the basisB={4,3,2} and the basis inverse matrix is
b. Proceed with one iteration of the revised simplex method, byi. computing the simplex multiplier vector π
ii. “pricing”, i.e., computing the “relative profits”, of the nonbasic columns
iii. selecting the column to enter the basis
iv. computing the substitution rates of the entering column
v. selecting the variable to leave the basis
vi. updating the basis inverse matrix.
c. Write the dual of the above LP (i.e. with equality constraints & slack variables) in (a).
d. Substitute the vector πwhich you computed above in step (i) above to test whether it isfeasible in the dual LP. Which constraint(s) if any are violated? How does this relate to theresults in step (ii) above?
( ) 1
1 0 11 10 2 21 10 2 2
BA−
− = −

56:171 O.R. -- HW #3 Fall 2001 page 2 of 4
❚❏❚❏❚❏❚❏❚❏❚❏❚❏❚❏❚❏❚❏❚❏❚❏❚❏❚❏❚❏❚❏❚❏❚❏❚❏❚❏❚❏❚❏❚❏❚❏❚❏❚❏❚❏❚❏❚❏❚❏❚2. LP formulation: Staffing a Call Center (Case 3.3, pages 106-108, Intro. to O.R. by Hillier &Lieberman) Answer parts (a), (b), & (c) on page 108, using LINGO with sets to enter the model.
“California Children’s Hospital has been receivingnumerous customer complaints because of its confusing,decentralized appointment and registration process. Whencustomers want to make appointments or register childpatients, they must contact the clinic or department theyplan to visit. Several problems exist with this currentstrategy. Parents do not always know the most appropriateclinic or department they must visit to address theirchildren’s ailments. They therefore spend a significantamount of time on the phone being transferred from clinicto clinic until they reach the most appropriate clinic fortheir needs. The hospital also does not publish the phonenumbers of all clinics and departments, and parents musttherefore invest a large amount of time in detective work totrack down the correct phone number. Finally, the variousclinics and departments do not communicate with eachother. For example, when a doctor schedules a referralwith a colleague located in another department or clinicthat department or clinic almost never receives word of thereferral. The parent must contact the correct department orclinic and provide the needed referral information.
In efforts to reengineer and improve its appointment andregistration process, the children’s hospital has decided tocentralize the process by establishing one call centerdevoted exclusively to appointments and registration. Thehospital is currently in the middle of the planning stages forthe call center. Lenny Davis, the hospital manager, plans tooperate the call center from 7 a.m. to 9 p.m. during theweekdays.
Several months ago, the hospital hired an ambitiousmanagement consulting firm, Creative Chaos Consultants,to forecast the number of calls the call center would receiveeach hour of the day. Since all appointment andregistration- related calls would be received by the callcenter, the consultants decided that they could forecast thecalls at the call center by totaling the number ofappointment and registration-related calls received by allclinics and departments. The team members visited all theclinics and departments, where they diligently recordedevery call relating to appointments and registration. theythen totaled these calls and altered the totals to account forcalls missed during data collection. They also altered totalsto account for repeat calls that occurred when the sameparent called the hospital many times because of theconfusion surrounding the decentralized process. CreativeChaos Consultants determined the average number of callsthe call center should expect during each hour of aweekday. The following table provides the forecasts:
Work Shift Average Number of Calls per hour7 a.m. — 9 a.m. 409 a.m. —11 a.m. 8511 a.m. —1 p.m. 701 p.m.—3 p.m. 953 p.m. —5 p.m. 805 p.m.—7 p.m. 357 p.m.—9 p.m. 10
After the consultants submitted these forecasts, Lennybecame interested in the percentage of calls from Spanishspeakers since the hospital services many Spanish-speakingpatients. Lenny knows that he has to hire some operatorswho speak Spanish to handle these calls. The consultantsperformed further data collection and determined that onaverage, 20 percent of the calls were from Spanishspeakers.
Given these call forecasts, Lenny must now decide how tostaff the call center during each 2 hour shift of a weekday. During the forecasting project, Creative Chaos Consultantsclosely observed the operators working at the individualclinics and departments and determined the number of callsthat operators could process per hour. The consultantsinformed Lenny that an operator is able to process anaverage of six calls per hour. Lenny also knows that he hasboth full-time and part-time workers available to staff thecall center. A full-time employee works 8 hours per day,but because of paperwork that must be completed, theemployee spends only 4 hours per day on the phone. Tobalance the schedule, the employee alternates the 2-hourshifts between answering phones and completingpaperwork. Full-time employees can start their day eitherby answering phones or by completing paperwork on thefirst shift. The full-time employees speak either Spanish orEnglish, but none of them are bilingual. Both Spanish-speaking and English-speaking employees are paid $10 perhour for work before 5 p.m. and $12 per hour for work after5 p.m. The full-time employees can begin work at thebeginning of the 7 a.m. to 9 a.m. shift, 9 a.m. to 11 a.m.shift, 11 a.m. to 1 p.m. shift, or 1 p.m. to 3 p.m. shift. Thepart-time employees work for 4 hours, only answer calls,and only speak English. They can start work at thebeginning of the 3 p.m.—5 p.m. shift or the 5 p.m.—7 p.m.shift, and like the full-time employees, they are paid $10per hour for work before 5 p.m. and $12 per hour for workafter 5 p.m.
For the following analysis, consider only the labor cost forthe time employees spend answering phones. The cost forpaperwork time is charged to other cost centers.a. How many Spanish-speaking operators and how manyEnglish-speaking operators does the hospital need to staffthe call center during each 21-hour shift of the day in orderto answer all calls? Pleas provide an integer number sincehalf a human operator makes no sense

56:171 O.R. -- HW #3 Fall 2001 page 3 of 4
b. Lenny needs to determine how many full-timeemployees who speak Spanish, full-time employees whospeak English, and part-time employees he should hire tobegin on each shift. Creative Chaos Consultants advisehim that linear programming can be used to do this in sucha way as to minimize operating costs while answering all
calls. Formulate a linear programming model of thisproblem.
c. Obtain an optimal solution for the LP model formulatedin part (b) to guide Lenny’s decision.
❚❏❚❏❚❏❚❏❚❏❚❏❚❏❚❏❚❏❚❏❚❏❚❏❚❏❚❏❚❏❚❏❚❏❚❏❚❏❚❏❚❏❚❏❚❏❚❏❚❏❚❏❚❏❚❏❚❏❚❏❚
3. Sensitivity Analysis (exercise 6.7-18, pages 296-297, Intro. to O.R. by Hillier & Lieberman) Answer parts (a) through (e), using the information shown on page 296.Ken and Larry, Inc., supplies its ice cream parlors with three flavors of ice cream: chocolate,vanilla, and banana. Because of extremely hot weather and a high demand for its products, thecompany has run short of its supply of ingredients: milk, sugar, & cream. Hence, they will not beable to fill all the orders received from their retail outlets, the ice cream parlors. Owing to thesecircumstances, the company has decided to choose the amount of each product to produce thatwill maximize total profit, given the constraints on supply of the basic ingredients. Thechocolate, vanilla, and banana flavors generate, respectively, $1.00, $0.90, and $0.95 per profitper gallon sold. The company has only 200 gallons of milk, 150 pounds of sugar, and 60 gallonsof cream left in its inventory. The LP formulation for this problem has variables C, V, and Brepresenting gallons of chocolate, vanilla, and banana ice cream produced, respectively.
! Ken & Larry Ice Cream – from Intro to O.R.! Hillier &(7th ed) p. 296
MAXIMIZE C+0.9V+0.95BST
0.45C + 0.50V + 0.40B <= 200 ! milk resource0.50C + 0.40V + 0.40B <= 150 ! sugar resource0.10C + 0.15V + 0.20B <= 60 ! cream resource
END
OBJECTIVE FUNCTION VALUE1) 341.2500
VARIABLE VALUE REDUCED COSTC 0.000000 0.037500V 300.000000 0.000000B 75.000000 0.000000
ROW SLACK OR SURPLUS DUAL PRICES2) 20.000000 0.0000003) 0.000000 1.8750004) 0.000000 1.000000

56:171 O.R. -- HW #3 Fall 2001 page 4 of 4
RANGES IN WHICH THE BASIS IS UNCHANGED:
OBJ COEFFICIENT RANGESVARIABLE CURRENT ALLOWABLE ALLOWABLE
COEF INCREASE DECREASEC 1.000000 0.037500 INFINITYV 0.900000 0.050000 0.012500B 0.950000 0.021429 0.050000
RIGHTHAND SIDE RANGESROW CURRENT ALLOWABLE ALLOWABLE
RHS INCREASE DECREASE2 200.000000 INFINITY 20.0000003 150.000000 10.000000 30.0000004 60.000000 15.000000 3.750000
a. What is the optimal profit and the optimal solution?
b. Suppose the profit per gallon of banana changes to $1.00. Will the optimal solution change, and whatcan be said about the effect on total profit?
c. Suppose the profit per gallon of banana changes to 92 cents. Will the optimal solution change, and whatcan be said about the effect on total profit?
d. Suppose the company discovers that 3 gallons of cream have gone sour and so must be thrown out. Willthe optimal solution change, and what can be said about the effect on total profit?
e. Suppose that the company has the opportuntiy to buy an additional 15 pounds of sugar at a total cost of$15. Should they buy it? Explain!

56:171 O.R. -- HW #4 Fall 2001 page 1 of 3
56:171 Operations ResearchHomework #4 - Due Friday, September 27, 2002
1. Ken & Larry’s Ice Cream, continued. Refer to the problem description in last week’shomework (HW#3). The optimal LP tableau provided by LINDO is as shown below.
THE TABLEAU
ROW (BASIS) C V B SLK 2 SLK 31 ART 0.038 0.000 0.000 0.000 1.8752 SLK 2 -0.350 0.000 0.000 1.000 -2.0003 V 3.000 1.000 0.000 0.000 10.0004 B -1.750 0.000 1.000 0.000 -7.500
ROW SLK 41 1.000 341.2502 2.000 20.0003 -20.000 300.0004 20.000 75.000
a. Chocolate ice cream is not included in the optimal production plan. If one gallon of chocolateice cream were to be produced, how would it change the quantity
…of vanilla ice cream produced?…of banana ice cream produced?…of milk used?…of sugar used?…of cream used?
b. In last week’s homework, you were asked about the effect on profit of a reduction in thequantity of available cream due to spoilage. That is, the effect of an increase in the unusedcream (slack in the available cream constraint). According to the substitution rates in thetableau, what would be the effect of this spoilage on the quantity
…of vanilla ice cream produced?…of banana ice cream produced?…of milk used?…of sugar used?
The right-hand-side of row #4 (available cream) was changed to zero, and then parametricanalaysis performed with the right-hand-side increasing to 150 gallons, with the results below.
RIGHTHANDSIDE PARAMETRICS REPORT FOR ROW: 4
VAR VAR PIVOT RHS DUAL PRICE OBJOUT IN ROW VAL BEFORE PIVOT VAL
0.0000 10.0000 0.000SLK 3 V 4 30.0000 10.0000 300.000
C B 3 56.2500 1.42857 337.500V SLK 4 4 75.0000 1.00000 356.250
150.000 0.0000 356.250
56:171 O.R. -- HW #4 Fall 2001 page 2 of 3
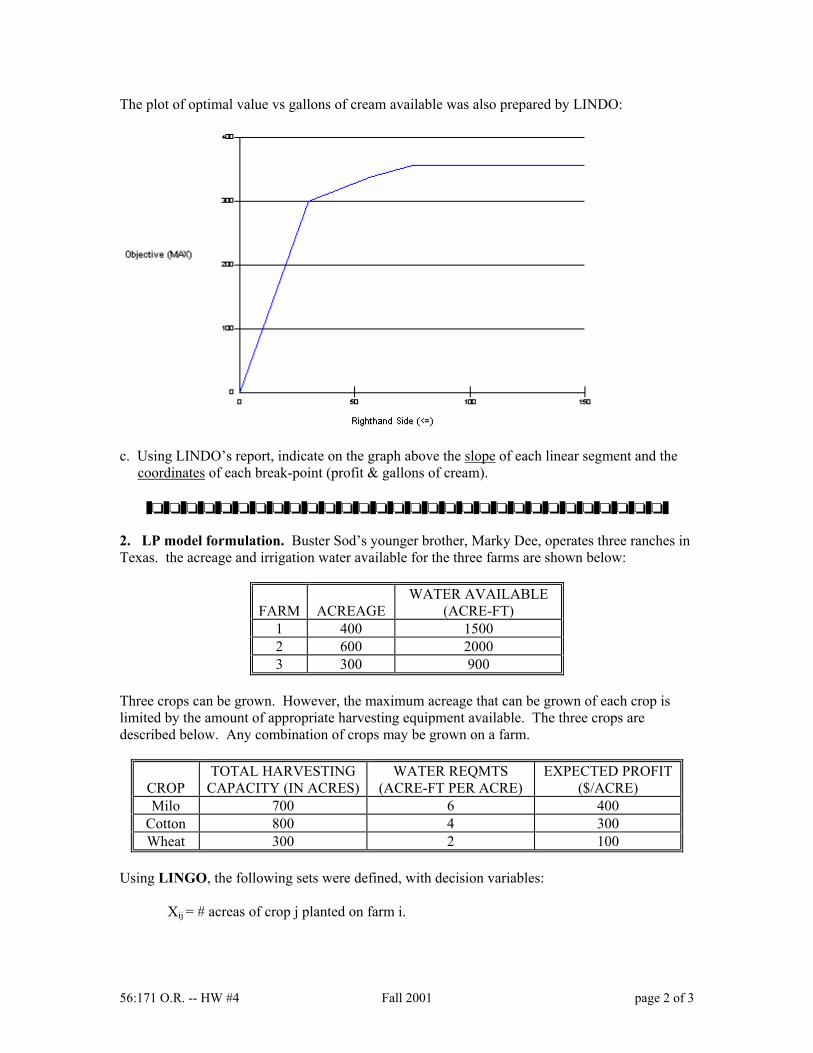
The plot of optimal value vs gallons of cream available was also prepared by LINDO:
c. Using LINDO’s report, indicate on the graph above the slope of each linear segment and thecoordinates of each break-point (profit & gallons of cream).
❚❏❚❏❚❏❚❏❚❏❚❏❚❏❚❏❚❏❚❏❚❏❚❏❚❏❚❏❚❏❚❏❚❏❚❏❚❏❚❏❚❏❚❏❚❏❚❏❚❏❚❏❚❏❚❏❚❏❚❏❚
2. LP model formulation. Buster Sod’s younger brother, Marky Dee, operates three ranches inTexas. the acreage and irrigation water available for the three farms are shown below:
FARM ACREAGEWATER AVAILABLE
(ACRE-FT)1 400 15002 600 20003 300 900
Three crops can be grown. However, the maximum acreage that can be grown of each crop islimited by the amount of appropriate harvesting equipment available. The three crops aredescribed below. Any combination of crops may be grown on a farm.
CROPTOTAL HARVESTING
CAPACITY (IN ACRES)WATER REQMTS
(ACRE-FT PER ACRE)EXPECTED PROFIT
($/ACRE)Milo 700 6 400
Cotton 800 4 300Wheat 300 2 100
Using LINGO, the following sets were defined, with decision variables:
Xij = # acreas of crop j planted on farm i.

56:171 O.R. -- HW #4 Fall 2001 page 3 of 3
MODEL: ! MARKY DEE SOD'S RANCHES;
SETS:FARM/1..3/:ACREAGE, H20_AVAIL;CROP/MILO, COTTON, WHEAT/:CAPACITY, H20_RQMT, PROFIT;COMBO(FARM,CROP):X;
ENDSETS
DATA:ACREAGE = 400 600 300;H20_AVAIL = 1500 2000 900;CAPACITY = 700 800 300;H20_RQMT = 6 4 2;PROFIT = 400 300 100;
ENDDATA
! INSERT OBJECTIVE & CONSTRAINTS HERE ;
END
a. Using LINGO, formulate the LP model to maximize the total expected profit of the threeranches.
b. Add the statements to the accompanying file (HW4_2.lg4) , and solve.
56:171 O.R. -- HW #5 Fall 2001 page 1 of 5
56:171 Operations ResearchHomework #5 - Due Friday, October 4, 2002
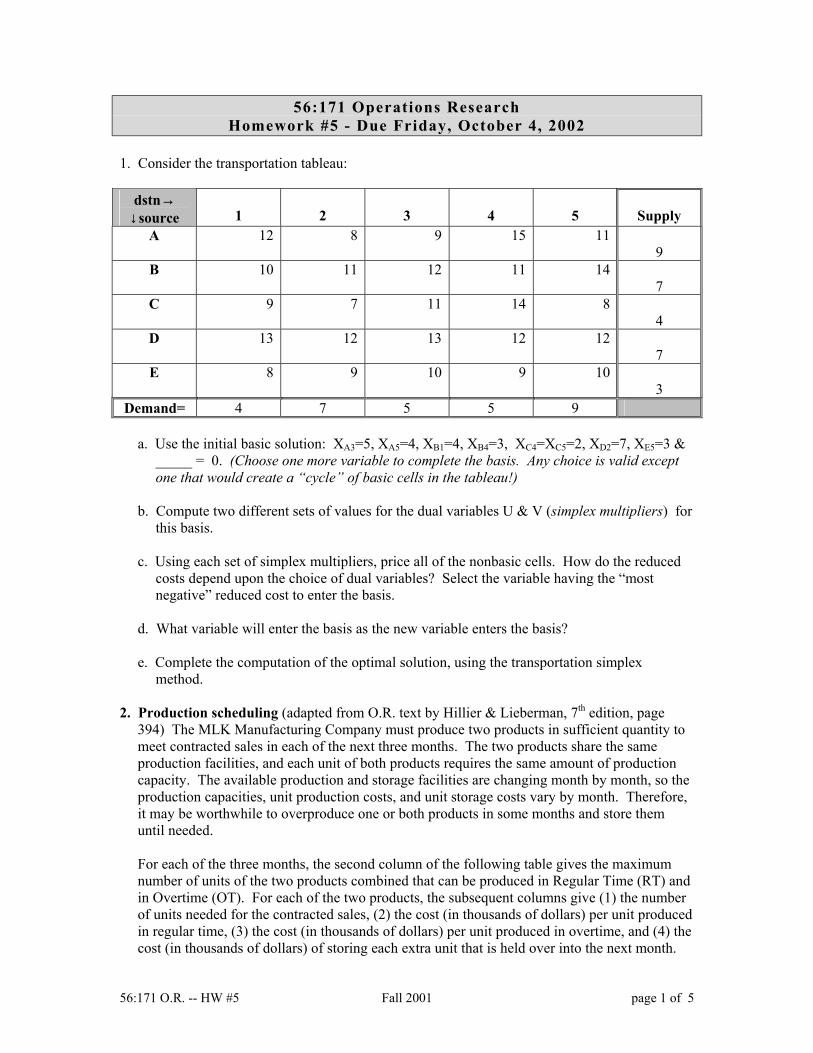
1. Consider the transportation tableau:
dstn→↓source 1 2 3 4 5 Supply
A 12 8 9 15 119
B 10 11 12 11 147
C 9 7 11 14 84
D 13 12 13 12 127
E 8 9 10 9 103
Demand= 4 7 5 5 9
a. Use the initial basic solution: XA3=5, XA5=4, XB1=4, XB4=3, XC4=XC5=2, XD2=7, XE5=3 &_____ = 0. (Choose one more variable to complete the basis. Any choice is valid exceptone that would create a “cycle” of basic cells in the tableau!)
b. Compute two different sets of values for the dual variables U & V (simplex multipliers) forthis basis.
c. Using each set of simplex multipliers, price all of the nonbasic cells. How do the reducedcosts depend upon the choice of dual variables? Select the variable having the “mostnegative” reduced cost to enter the basis.
d. What variable will enter the basis as the new variable enters the basis?
e. Complete the computation of the optimal solution, using the transportation simplex method.
2. Production scheduling (adapted from O.R. text by Hillier & Lieberman, 7th edition, page394) The MLK Manufacturing Company must produce two products in sufficient quantity tomeet contracted sales in each of the next three months. The two products share the sameproduction facilities, and each unit of both products requires the same amount of productioncapacity. The available production and storage facilities are changing month by month, so theproduction capacities, unit production costs, and unit storage costs vary by month. Therefore,it may be worthwhile to overproduce one or both products in some months and store themuntil needed.
For each of the three months, the second column of the following table gives the maximumnumber of units of the two products combined that can be produced in Regular Time (RT) andin Overtime (OT). For each of the two products, the subsequent columns give (1) the numberof units needed for the contracted sales, (2) the cost (in thousands of dollars) per unit producedin regular time, (3) the cost (in thousands of dollars) per unit produced in overtime, and (4) thecost (in thousands of dollars) of storing each extra unit that is held over into the next month.
56:171 O.R. -- HW #5 Fall 2001 page 2 of 5
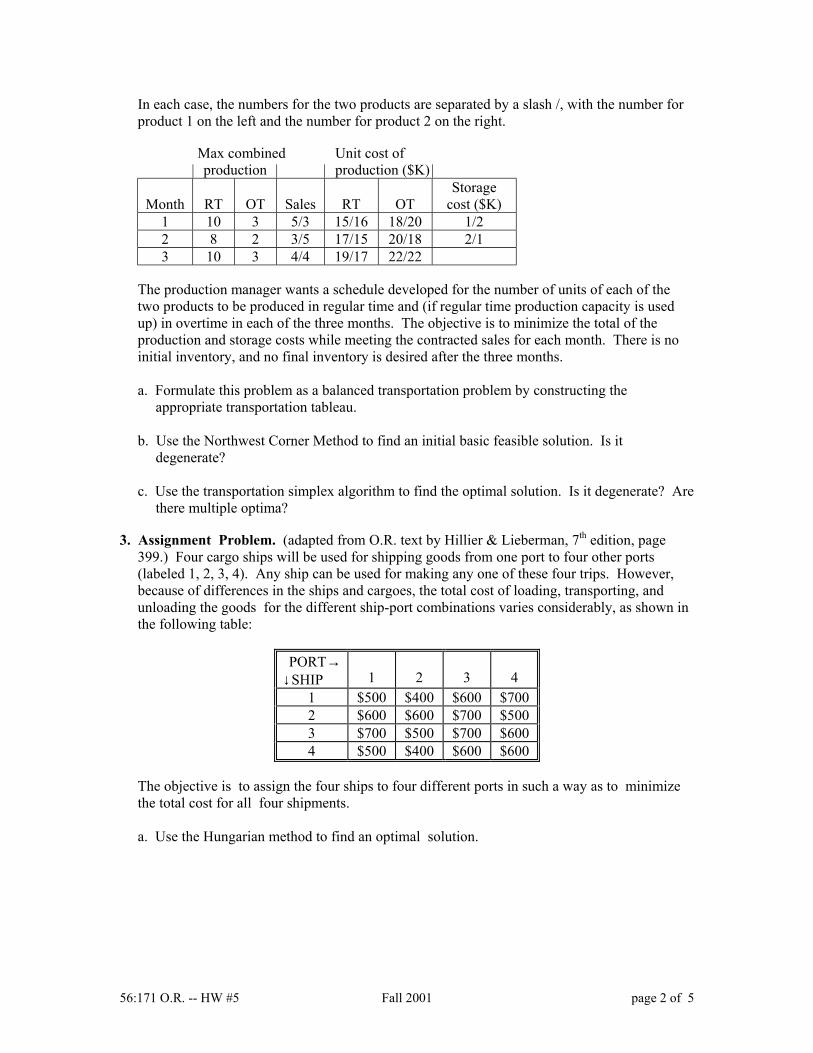
In each case, the numbers for the two products are separated by a slash /, with the number forproduct 1 on the left and the number for product 2 on the right.
Max combined Unit cost of| production | | production ($K)|
Month RT OT Sales RT OTStorage
cost ($K)1 10 3 5/3 15/16 18/20 1/22 8 2 3/5 17/15 20/18 2/13 10 3 4/4 19/17 22/22
The production manager wants a schedule developed for the number of units of each of thetwo products to be produced in regular time and (if regular time production capacity is usedup) in overtime in each of the three months. The objective is to minimize the total of theproduction and storage costs while meeting the contracted sales for each month. There is noinitial inventory, and no final inventory is desired after the three months.
a. Formulate this problem as a balanced transportation problem by constructing theappropriate transportation tableau.
b. Use the Northwest Corner Method to find an initial basic feasible solution. Is itdegenerate?
c. Use the transportation simplex algorithm to find the optimal solution. Is it degenerate? Arethere multiple optima?
3. Assignment Problem. (adapted from O.R. text by Hillier & Lieberman, 7th edition, page399.) Four cargo ships will be used for shipping goods from one port to four other ports(labeled 1, 2, 3, 4). Any ship can be used for making any one of these four trips. However,because of differences in the ships and cargoes, the total cost of loading, transporting, andunloading the goods for the different ship-port combinations varies considerably, as shown inthe following table:
PORT→↓SHIP 1 2 3 4
1 $500 $400 $600 $7002 $600 $600 $700 $5003 $700 $500 $700 $6004 $500 $400 $600 $600
The objective is to assign the four ships to four different ports in such a way as to minimizethe total cost for all four shipments.
a. Use the Hungarian method to find an optimal solution.

56:171 O.R. -- HW #5 Fall 2001 page 3 of 5
b. Reformulate this as an equivalent transportation problem.
dstn→↓source 1 2 3 4 Supply=
1
2
3
4
Demand=
c. Use the Northwest Corner Method to obtain an initial basic feasible solution. (This will be adegenerate solution. Be sure to specify which variables are basic!)
d. Use the transportation simplex method to find the optimal solution.
e. In how many iterations was the solution degenerate?
f. How many iterations produce a change in the values of the variables?
g. How many iterations leave the variables unchanged in value (although the basis changes)?
4. Return of Marky D. Sod Recall the LP model for this problem in HW#4:Buster Sod’s younger brother, Marky Dee, operates three ranches in Texas. the acreage andirrigation water available for the three farms are shown below:
FARM ACREAGEWATER AVAILABLE
(ACRE-FT)1 400 15002 600 20003 300 900
Three crops can be grown. However, the maximum acreage that can be grown of each crop islimited by the amount of appropriate harvesting equipment available. The three crops aredescribed below. Any combination of crops may be grown on a farm.
CROPTOTAL HARVESTING
CAPACITY (IN ACRES)WATER REQMTS
(ACRE-FT PER ACRE)EXPECTED PROFIT
($/ACRE)Milo 700 6 400
Cotton 800 4 300Wheat 300 2 100
Decisionvariables: Xij = # acreas of crop j planted on farm i.The LINDO model (generated by LINGO) is:
MAX 400 X1MILO + 300 X1COTTON + 100 X1WHEAT + 400 X2MILO+ 300 X2COTTON + 100 X2WHEAT + 400 X3MILO + 300 X3COTTON + 100 X3WHEAT
SUBJECT TO

56:171 O.R. -- HW #5 Fall 2001 page 4 of 5
2) X1MILO + X1COTTON + X1WHEAT <= 4003) 6 X1MILO + 4 X1COTTON + 2 X1WHEAT <= 15004) X2MILO + X2COTTON + X2WHEAT <= 6005) 6 X2MILO + 4 X2COTTON + 2 X2WHEAT <= 20006) X3MILO + X3COTTON + X3WHEAT <= 3007) 6 X3MILO + 4 X3COTTON + 2 X3WHEAT <= 9008) X1MILO + X2MILO + X3MILO <= 7009) X1COTTON + X2COTTON + X3COTTON <= 80010) X1WHEAT + X2WHEAT + X3WHEAT <= 300
END
1) 320000.0
VARIABLE VALUE REDUCED COSTX1MILO 0.000000 0.000000
X1COTTON 375.000000 0.000000X1WHEAT 0.000000 33.333332X2MILO 50.000000 0.000000
X2COTTON 425.000000 0.000000X2WHEAT 0.000000 33.333332X3MILO 150.000000 0.000000
X3COTTON 0.000000 0.000000X3WHEAT 0.000000 33.333332
ROW SLACK OR SURPLUS DUAL PRICES2) 25.000000 0.0000003) 0.000000 66.6666644) 125.000000 0.0000005) 0.000000 66.6666646) 150.000000 0.0000007) 0.000000 66.6666648) 500.000000 0.0000009) 0.000000 33.333332
10) 300.000000 0.000000
RANGES IN WHICH THE BASIS IS UNCHANGED:
OBJ COEFFICIENT RANGESVARIABLE CURRENT ALLOWABLE ALLOWABLE
COEF INCREASE DECREASEX1MILO 400.000000 0.000000 INFINITY
X1COTTON 300.000000 INFINITY 0.000000X1WHEAT 100.000000 33.333328 INFINITYX2MILO 400.000000 0.000000 0.000000
X2COTTON 300.000000 0.000000 0.000000X2WHEAT 100.000000 33.333328 INFINITYX3MILO 400.000000 INFINITY 0.000000
X3COTTON 300.000000 0.000000 INFINITYX3WHEAT 100.000000 33.333328 INFINITY
RIGHTHAND SIDE RANGESROW CURRENT ALLOWABLE ALLOWABLE
RHS INCREASE DECREASE2 400.000000 INFINITY 25.0000003 1500.000000 100.000000 300.0000004 600.000000 INFINITY 125.0000005 2000.000000 750.000000 300.0000006 300.000000 INFINITY 150.0000007 900.000000 900.000000 900.0000008 700.000000 INFINITY 500.0000009 800.000000 75.000000 425.000000
10 300.000000 INFINITY 300.000000

56:171 O.R. -- HW #5 Fall 2001 page 5 of 5
THE TABLEAU:ROW (BASIS) X1MILO X1COTTON X1WHEAT X2MILO X2COTTON X2WHEAT
1 ART 0.000 0.000 33.333 0.000 0.000 33.3332 SLK 2 -0.500 0.000 0.500 0.000 0.000 0.0003 X1COTTON 1.500 1.000 0.500 0.000 0.000 0.0004 SLK 4 0.500 0.000 0.167 0.000 0.000 0.6675 X2MILO 1.000 0.000 0.333 1.000 0.000 0.3336 SLK 6 0.000 0.000 0.000 0.000 0.000 0.0007 X3MILO 0.000 0.000 0.000 0.000 0.000 0.0008 SLK 8 0.000 0.000 -0.333 0.000 0.000 -0.3339 X2COTTON -1.500 0.000 -0.500 0.000 1.000 0.000
10 SLK 10 0.000 0.000 1.000 0.000 0.000 1.000
ROW X3MILO X3COTTON X3WHEAT SLK 2 SLK 3 SLK 4 SLK 51 0.000 0.000 33.333 0.000 66.667 0.000 66.6672 0.000 0.000 0.000 1.000 -0.250 0.000 0.0003 0.000 0.000 0.000 0.000 0.250 0.000 0.0004 0.000 -0.333 0.000 0.000 0.083 1.000 -0.1675 0.000 -0.667 0.000 0.000 0.167 0.000 0.1676 0.000 0.333 0.667 0.000 0.000 0.000 0.0007 1.000 0.667 0.333 0.000 0.000 0.000 0.0008 0.000 0.000 -0.333 0.000 -0.167 0.000 -0.1679 0.000 1.000 0.000 0.000 -0.250 0.000 0.000
10 0.000 0.000 1.000 0.000 0.000 0.000 0.000
ROW SLK 6 SLK 7 SLK 8 SLK 9 SLK 101 0.00E+00 67. 0.00E+00 33. 0.00E+00 0.32E+062 0.000 0.000 0.000 0.000 0.000 25.0003 0.000 0.000 0.000 0.000 0.000 375.0004 0.000 0.000 0.000 -0.333 0.000 125.0005 0.000 0.000 0.000 -0.667 0.000 50.0006 1.000 -0.167 0.000 0.000 0.000 150.0007 0.000 0.167 0.000 0.000 0.000 150.0008 0.000 -0.167 1.000 0.667 0.000 500.0009 0.000 0.000 0.000 1.000 0.000 425.000
10 0.000 0.000 0.000 0.000 1.000 300.000
a. Another farmer whose farm adjoins Sod Farm #3 might be willing to sell Marky a portion ofhis water rights. How much should Marky offer, and for how many acre-feet?
b. What increase in the profit per acre for wheat is required in order for it to be profitable forMarky to plant any?
c. If Marky were to plant 100 acres of wheat on Farm #1, how should he best adjust the optimalplan above?
d. Is there another optimal basic solution, besides the one given above? If so, how does it differfrom that given above?

56:171 O.R. -- HW #6 Fall 2002 page 1 of 2
56:171 Operations ResearchHomework #6 - Due Friday, October 11, 2002
1. (From O.R. Applications & Algorithms, by Wayne Winston)During the month of July, Pittsburgh resident B. Fly must make four round-trip flightsbetween Pittsburgh and Chicago. The dates of the trips are as shown below.
Leave Pittsburgh Leave ChicagoMonday, July 1 Friday, July 5Tuesday, July 9 Thursday, July 11Monday, July 15 Friday, July 19Wednesday, July 24 Thursday, July 25
B. Fly must purchase four round-trip tickets. Without a discounted fare, a round-trip ticketbetween Pittsburgh and Chicago costs $500. If Fly’s stay in a city includes a weekend, he getsa 20% discount on the round-trip fare. If his stay in a city is at least 21 days, he receives a35% discount, and if his stay is more than 10 days, he receives a 30% discount. Of course,only one discount can be applied toward the purchase of any ticket. Formulate and solve an assignment problem that minimizes the total cost of purchasing thefour round-trip tickets. (Hint: Let Xij = 1 if a round-trip ticket is purchased for use on the ithflight out of Pittsburgh and the jth flight out of Chicago. Also think about where Fly shouldbuy a ticket if, for example, X21 = 1.)
2. (From Practical Management Science, by W. Winston & S. C. Albright)The city of Spring View is taking bids from six bus companies on the eight routes that must bedriven in the surrounding school district. Each company enters a bid on how much it willcharge to drive selected routes, although not all companies bid on all routes. (Blank cells inthe table indicates routes on chich a company does not bid.)
Company 1 2 3 4 5 6 7 8A 8200 7800 5400 3900B 7800 8200 6300 3300 4900C 4800 4400 5600 3600D 8000 5000 6800 6700 4200E 7200 6400 3900 6400 2800 3000F 7000 5800 7500 4500 5600 6000 4200
The city needs to select which companies to assign to which routes with the specifications that(1) if a company does not bid on a route, it cannot be assigned to that route,(2) exactly one company must be assigned to each route, and(3) a company can be assigned to at most two routes.
The objective is to minimize the total cost of covering all routes. Formulate this as anassignment problem, and use the Hungarian method to solve it.

56:171 O.R. -- HW #6 Fall 2002 page 2 of 2
3. (Based on exercises 10.2-2, & 10.3-3, page 515f, Introduction to O.R., Hillier & Lieberman (7th ed.))Christine Phillips is in charge of planning and coordinating next spring’s sales managementtraining program for her company. Christine has listed the following activity information for thisproject. (Durations are given in weeks.)
Activity DescriptionImmediate
predecessorsExpectedDuration
Estimatedvariance
A Select location -- 2 1B Obtain keynote speaker -- 1 0.2C Obtain other speakers B 2 1D Make travel plans for keynote speaker A,B 2 1E Make travel plans for other speakers A, C 3 1F Make food arrangements A 2 1G Negotiate hotel rates A 1 0.2H Prepare brochure C, G 1 0.2I Mail brochure H 1 0.2J Take reservations I 3 1K Prepare handouts C, F 4 4
a. Draw the AON (activity-on-node) project network.b. Draw the AOA (activity-on-arrow) project network.c. Label the nodes (events) of the AOA network so that if there is an arrow i→j then i<j.
In parts (d)-(h), assume that the expected durations are the actual durations.d. Do a forward pass to compute the ET (earliest time) for each node.e. What is the earliest completion time for this project?f. Do a backward pass to compute the LT (latest time) for each node.g. Complete the table below of ES (earliest start), EF (earliest finish), LS (latest start), LF
(latest finish), and slack for each activity:
Activity Description ES EF LS LF SlackA Select locationB Obtain keynote speakerC Obtain other speakersD Make travel plans for keynote speakerE Make travel plans for other speakersF Make food arrangementsG Negotiate hotel ratesH Prepare brochureI Mail brochureJ Take reservationsK Prepare handoutsh. Which activities are critical?
Now assume that the durations are random with the variance shown above.i. What is the expected completion time of the project?j. What is the standard deviation of the completion time of the project?k. Assuming that the project completion time has normal distribution, what is the probability
that the project will be completed not later than two weeks after the expected completiontime?

56:171 O.R. HW#7 Fall 2002 page 1 of 4
56:171 Operations ResearchHomework #7 -- Due October 25, 2002
1. Decision Analysis (adapted from Exercise 15.2-7, page 784, Operations Research, 7th edition, byHillier & Lieberman.)Dwight Moody is the manager of a large farm with 1,000 acres of arable land. For greater efficiency,Dwight always devotes the farm to growing one crop at a time. He now needs to make a decision onwhich one of four crops to grow during the upcoming growing season. For each of these crops,Dwight has obtained the following estimates of crop yields and net incomes per bushel under variousweather conditions.
Weather Crop 1 Crop 2 Crop 3 Crop 4Dry 20 15 30 40Moderate 35 20 25 40Damp 40 30 25 40Net income/bushel $1.00 $1.50 $1.00 $0.50
After referring to historical meteorological records, Dwight also estimated the following probabilitiesfor the weather during the growing season:
Dry 0.3Moderate 0.5Damp 0.2
Using the criterion of “Maximize expected payoff”, determine which crop to grow.
2. Bayes’ Rule (Exercise 15.3-15, pp. 788-789, Operations Research, 7th edition, by Hillier &Lieberman)
There are two biased coins, coin A with probability of landing heads equal to 0.8 and the coin B withprobability of heads equal to 0.4. One coin is chosen at random (each with probability 50%) to betossed twice. You are to receive $100 if you correctly predict how many heads will occur in twotosses of this coin.
a. Using the “Maximum Expected Payoff” criterion, what is the optimal prediction, and what is thecorresponding expected payoff?
Suppose now that you may observe a preliminary toss of the chosen coin before predicting. b. Determine your optimal prediction after observing a head in the preliminary toss.
…after observing a tail in the preliminary toss.c. What is the expected value of the preliminary toss?
3. Integer Programming Model (based upon Case 12.3, page 649-653 of Operations Research, 7th
edition, by Hillier & Lieberman. See the text for the complete case description. What follows is acondensed version.) Brenda Sims, the saleswoman on the floor at Furniture City, understood that Furniture City required anew inventory policy. Not only was the megastore losing money by making customers unhappy withdelivery delays, but it was also losing money by wasting warehouse space. By changing the inventorypolicy to stock only popular items and replenish them immediately when they are sold, Furniture Citywould ensure that the majority of customers receive their furniture immediately and that the valuablewarehouse space was utilized effectively.
She decided… to use her kitchen department as a model for the new inventory policy. She wouldidentify all kitchen sets comprising 85% of customers orders. Given the fixed amount of warehouse

56:171 O.R. HW#7 Fall 2002 page 2 of 4
space allocated to the kitchen department, she would identify the items Furniture City should stock inorder to satisfy the greatest number of customer orders.
Brenda analyzed her records over the past three years and determined that 20 kitchen sets wereresponsible for 85% of customer orders. These 20 kitchen sets were composed of up to eight features,usually with four styles of each feature (except for the dishwashers, with two styles.)
• Floor tile: styles T1, T2, T3, T4• Wallpaper: styles W1, W2, W3, W4• Light fixtures: styles L1, L2, L3, L4• Cabinets: styles C1, C2, C3, C4• Countertops: styles O1, O2, O3, O4• Dishwashers: styles D1, D2• Sinks: styles S1, S2, S3, S4• Ranges: styles R1, R2, R3, R4
(Sets, 14 through 20, however, do not include dishwashers.)
The warehouse could hold 50 ft2 of tile and 12 rolls of wallpaper in the inventory bins. the inventoryshelves could hold two light fixtures, two cabinets, three countertops, and two sinks. Dishwashers andranges are similar in size, so Furniture City stored them in similar locations. The warehouse floorcould hold a total of four dishwashers and ranges.
Every kitchen set includes exactly 20 ft2 of tile and exactly 5 rolls of wallpaper. Therefore, 20 ft2 of aparticular style of tile and five rolls of a particular style of wallpaper are required for the styles to be instock.
a. Formulate and use LINGO to solve a binary integer programming model which will maximize thetotal number of kitchen sets (and thus the number of customer orders) Furniture City stocks in thelocal warehouse. Assume that when a customer orders a kitchen set, all the particular itemscomposing that kitchen set are replenished at the local warehouse immediately. (The sets and datasection of a LINGO model may be downloaded with this homework assignment.)
b. How many of each feature and style should Furniture City stock in the local warehouse? Howmany different kitchen sets are in stock?
Furniture City decides to discontinue carrying nursery sets, and the warehouse space previouslyallocated to the nursery department is divided between the existing departments at Furniture City. Thekitchen department receives enough additional space to allow it to stock both styles of dishwashers andthree of the four styles of ranges.
c. How does the optimal inventory policy for the kitchen department change with this additionalwarehouse space?

56:171 O.R. HW#7 Fall 2002 page 3 of 4
T1 T2 T3 T4 W1 W2 W3 W4 L1 L2 L3 L4 C1 C2 C3 C4 O1 O2 O3 O4 D1 D2 S1 S2 S3 S4 R1 R2 R3 R4Set 1 X X X X X X X XSet 2 X X X X X X X XSet 3 X X X X X X X XSet 4 X X X X X X X XSet 5 X X X X X X X XSet 6 X X X X X X X XSet 7 X X X X X X X XSet 8 X X X X X X X XSet 9 X X X X X X X XSet10 X X X X X X X XSet11 X X X X X X X XSet12 X X X X X X X XSet13 X X X X X X X XSet14 X X X X X X XSet15 X X X X X X XSet16 X X X X X X XSet17 X X X X X X XSet18 X X X X X X XSet19 X X X X X X XSet20 X X X X X X X
Table: Features composing each of twenty kitchen sets.
56:171 O.R. HW#7 Fall 2002 page 4 of 4
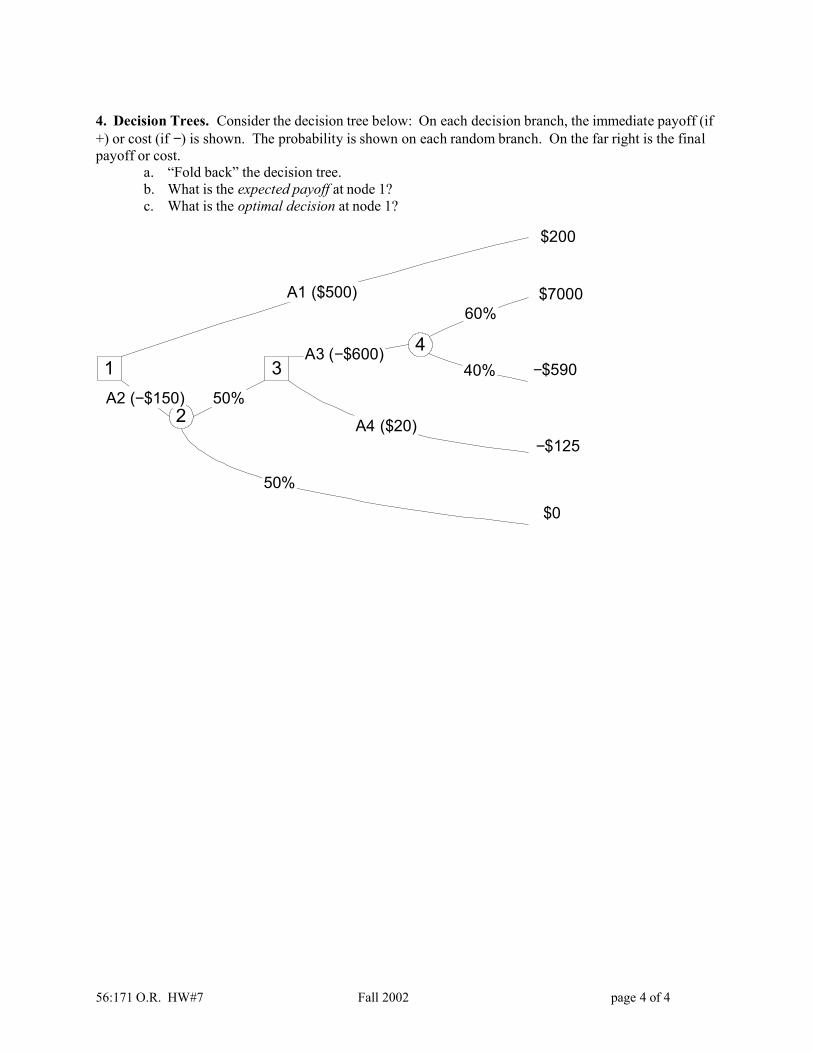
4. Decision Trees. Consider the decision tree below: On each decision branch, the immediate payoff (if+) or cost (if −) is shown. The probability is shown on each random branch. On the far right is the finalpayoff or cost.
a. “Fold back” the decision tree.b. What is the expected payoff at node 1?c. What is the optimal decision at node 1?
3
2
4
A1 ($500)
A2 (−$150) 50%
A3 (−$600)
A4 ($20)
50%
60%
40%
$0
−$125
−$590
$7000
$200
1

56:171 O.R. HW#8 Fall 2002 page 1 of 3
56:171 Operations ResearchHomework #8 -- Due November 1, 2002
1. Decision Analysis (an exercise from Operations Research: a Practical Introduction, by M. Carter & C. Price)Suppose that you are in the position of having to buy a used car, and you have narrowed down yourchoices to two possible models: one car is a private sale and the other is from a dealer. You must nowchoose between them. The cars are similar, and the only criterion is to minimize expected cost. Thedealer car is more expensive, but it comes with a one-year warranty which would cover all costs ofrepairs. You decide that, if the car will last for 1 year, you can sell it again and recover a large part ofyour investment. If it falls apart, it will not be worth fixing. After test driving both cars and checkingfor obvious flaws, you make the following evaluation of probably resale value:
CarPurchase
priceProbability of
lasting one yearEstimated
resale priceA: Private $800 0.3 $600B: Dealer $1500 0.9 $1000
a. Which car would you buy?
b. What is the expected value of perfect information (EVPI)?
Suppose you have the opportunity to take car A to an independent mechanic, who will charge you $50to do a complete inspection and offer you an opinion as to whether the car will last 1 year. For varioussubjective reasons, you assign the following probabiliities to the accuracy of the mechanic’s opinion:
Given: Mechanic says Yes Mechanic says NoA car that will last 1 year 70% 30%A car that will not last 1 year 10% 90%
(For example, if a car that will last 1 year is taken to the mechanic, there is 70% probability that hewill give you the opinion that it will last a year.)
c. Assuming that you must buy one of these two cars, formulate this problem as a decision treeproblem.
d. What is the expected value of the mechanic’s advice? Is it worth asking for the mechanic’sopinion? What is you optimal decision strategy?
Note: it is not necessary to ask for advice on car B because its problems could be repaired under thewarranty!
56:171 O.R. HW#8 Fall 2002 page 2 of 3
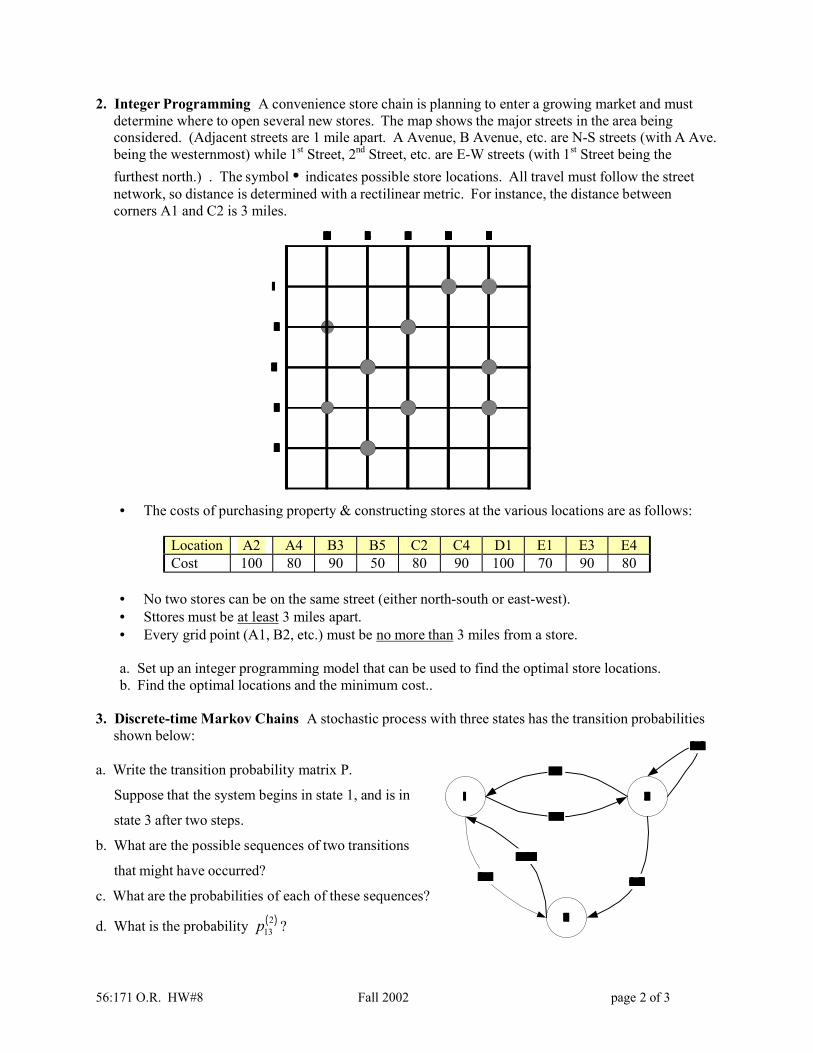
2. Integer Programming A convenience store chain is planning to enter a growing market and mustdetermine where to open several new stores. The map shows the major streets in the area beingconsidered. (Adjacent streets are 1 mile apart. A Avenue, B Avenue, etc. are N-S streets (with A Ave.being the westernmost) while 1st Street, 2nd Street, etc. are E-W streets (with 1st Street being thefurthest north.) . The symbol • indicates possible store locations. All travel must follow the streetnetwork, so distance is determined with a rectilinear metric. For instance, the distance betweencorners A1 and C2 is 3 miles.
• The costs of purchasing property & constructing stores at the various locations are as follows:
Location A2 A4 B3 B5 C2 C4 D1 E1 E3 E4Cost 100 80 90 50 80 90 100 70 90 80
• No two stores can be on the same street (either north-south or east-west).• Sttores must be at least 3 miles apart.• Every grid point (A1, B2, etc.) must be no more than 3 miles from a store.
a. Set up an integer programming model that can be used to find the optimal store locations.b. Find the optimal locations and the minimum cost..
3. Discrete-time Markov Chains A stochastic process with three states has the transition probabilitiesshown below:
a. Write the transition probability matrix P.
Suppose that the system begins in state 1, and is in
state 3 after two steps.
b. What are the possible sequences of two transitions
that might have occurred?
c. What are the probabilities of each of these sequences?
d. What is the probability ( )213p ?

56:171 O.R. HW#8 Fall 2002 page 3 of 3
c. Write the equations which determine π, the steadystate probability distribution.
d. Compute the steadystate probability distribution π.

56:171 O.R. HW#9 Fall 2002 page 1 of 4
56:171 Operations ResearchHomework #9 -- Due November 8, 2002
Computation may be done with the MARKOV workspace of APL functions, or any other software that youmay wish to use.
1. Markov Chains. In the game of “craps”, one player rolls a pair of six-sided diceone or more times, until he or she either wins or loses. Suppose that we are the“roller”:
On the first throw, if we roll a 7 or an 11, we win right away. If we roll a 2, 3, or 12, we lose right away. If we first roll a 4, 5, 6, 8, 9, or 10, we keep rolling the dice until we get eithera 7 or the total rolled on the first throw: • If we get a 7, we lose. • If we roll the same total as the first throw, we win.
Define the states of a Markov chain model as :state 1 : start the game,state 2 : roll a 4 or 10,state 3 : roll a 5 or 9,state 4 : roll a 6 or 8,state 5 : win,state 6 : loss.
(We have simplified the model by combining states: forexample, whether a 4 or 10 is rolled, the probability of“making one’s point” is the same.)
There are 6×6=36 different outcomes (equally likely) ofthrowing the dice:
+|1 2 3 4 5 61|2 3 4 5 6 72|3 4 5 6 7 83|4 5 6 7 8 94|5 6 7 8 9 105|6 7 8 9 10 116|7 8 9 10 11 12
a. Complete the table with the probability distribution of the outcome of a toss:Sum: 2 3 4 5 6 7 8 9 10 11 12Probability
The transition probability matrix is :1 2 3 4 5 6
1 0 6/36 8/36 10/36 8/36 4/362 0 27/36 0 0 3/36 6/363 0 0 26/36 0 4/36 6/364 0 0 0 25/36 5/36 6/365 0 0 0 0 1 06 0 0 0 0 0 1

56:171 O.R. HW#9 Fall 2002 page 2 of 4
b. Identify the following matrices:Q =
From\to 1 2 3 41234
R=From\to 5 6
1234
E = (I−Q)−1 = Expected number of visits\ 1 2 3 4
1 | 1 0.6666667 0.8 0.909090912 | 0 4 0 03 | 0 0 3.6 04 | 0 0 0 3.2727273
A = ER = Absorption probabilities\ 5 6
1 | 0.49292929 0.507070712 | 0.33333333 0.666666673 | 0.4 0.64 | 0.45454545 0.54545455
c. What is the probability of winning for the roller (the person rolling the dice)?
d. What is the expected number of rolls of the dice in a crap game?
e. If the first roll is a "4", what is the roller’s probability of winning?
f. If the first roll of the dice is a "4", how many additional rolls are expected before the game ends?
2. Light Bulb Replacement A bowling center has just purchased a new outdoor sign containing 1000light bulbs. Based upon historical data, the manager has the following probability distribution of abulb’s failure. Failed bulbs are replaced monthly. The age of a bulb is its age at the beginning of amonth, so when t=0, the bulb has just been placed in service and according to the table, has a 50%probability of failing during its first month of operation. (There is a high “infant mortality” rate.)
Age t (months) 0 1 2 3 4Failure probability p(t) 0.5 0.1 0.1 0.1 0.2Cumulative probability F(t) 0.5 0.6 0.7 0.8 1.0Conditional probability of failure, f(t|n≥t) 0.5 0.2 0.25 0.333 1.0
For example, the probability that a bulb fails during the next month, if it has reached the age 2months, is f(2|n≥2) = 0.1/(0.1+0.1+0.2) = 0.25.We assume that a 4-month-old bulb is certain to fail during its next month of operation.

56:171 O.R. HW#9 Fall 2002 page 3 of 4
Define a discrete-time Markov chain model for one of positions in the sign,where the state t=0, 1, …4is the age of the bulb in that position at the end of the month after all failed bulbs have been replaced.a. Draw a transition diagram and write the transition probability matrix.
From\to 0 1 2 3 401234
b. What is the steadystate probability distribution?t 0 1 2 3 4πt
c. According to this model, what is the expected number of replacements when the sign is examined atthe end of each month?
d. If each bulb costs $2 to replace, what is the monthly replacement cost?
Because of the high “infant mortality” rate, the manager is considering “burn-in”—for $2.40 themanufacturer will burn them for one month at the plant. The more expensive bulb will have one lessmonth of life, but the first failure-prone month is eliminated. She wants to know if the extra $0.40 isworth it.
e. Define a new Markov chain model with states t=1, 2, 3, 4, and write the transition probabilitymatrix:
From\to 1 2 3 41234
f. What is the steadystate distribution of the new Markov chain?t 1 2 3 4πt
g. What is the expected number of failed bulbs each month?
h. What is the expected monthly replacement cost for the sign?
3. Consider a two-stage production flow line. At each stage, an operation is performed on the partbeing processed. Parts are introduced into the system at stage 1. Processing is serial, and each stagecan hold only one part at a time.
For purposes of analysis, we discretize time into 1-minute intervals. At the beginning of an interval,stage 1 is empty, working, or blocked whereas stage 2 is either working or empty. The systemoperates under the following rules:• If stage 1 is empty at the beginning of an intgerval, a new part is introduced into stage 1 with
probability 0.9. Work begins on the part; however, it cannot be completed during the minute it isintroduced. If stage 1 is working or blocked, no part enters.

56:171 O.R. HW#9 Fall 2002 page 4 of 4
• If stage 2 is working at the beginning of an interval, the part will be completed and will leave thesystem with probability 0.8. Alternatively, it will remain in stage 2 with probability 0.2.
• If stage 1 is working at the beginning of an interval, the part will be completed with probability0.6. A completed part will move to stage 2 if stage 2 is empty. Otherwise, it is blocked andremains in stage 1 until stage 2 becomes empty.
Develop a discrete-time Markov chain model of this situation, defining the states1. (empty, idle)2. (working, empty)3. (working, working)4. (empty, working)5. (blocked, working)
a. Draw the transition diagram, and write the transition probability matrix.From\to 1 2 3 4 5
12345
b. Compute the steadystate probability distribution of this process.i 1 2 3 4 5πi
c. What is the expected idle time (empty or blocked) for each stage?
d. What is the expected throughput, i.e., # parts completed per hour?
____________________________Problems 2 & 3 are based upon exercises in the textbook Operations Research Models & Methods, byPaul Jensen & Jonathan Bard.

56:171 Operations ResearchHomework #10 –due November 15, 2002
1. (#18.4-3, page 927, of Intro to O.R. by Hillier & Lieberman) The Garrett-TompkinsCompany provides three copy machines in its copying room for the use of itsemployees. However, due to recent complaints about considerable time being wastedwaiting for a copier to become free, management is considering adding one or moreadditional copy machines.
During the 2,000 working hours per year, employees arrive at the copying roomaccording to a Poisson process at a mean rate of 30 per hour. The time each employeeneeds with a copy machine is believed to have an exponential distribution with a meanof 5 minutes. The lost productivity due to an employee spending time in the copyingroom is estimated to cost the company an average of $25 per hour. Each copymachine is leased for $3,000 per year. (Assume that the number of employees is solarge that it could be assumed to be infinite.)
a. According to this model, what is currently the average number of employeeswaiting to use a copier?
b. What is currently the number of person-hours per year that is lost because of thewaiting line?
c. Determine how many copy machines the company should have in order tominimize its expected total cost per hour.
2. (#17.6-14, page 898, of Intro to O.R. by Hillier & Lieberman) Airplanes arrive fortakeoff at the runway of an airport according to a Poisson process at a mean rate of20/hour (i.e., time between arrivals has exponential distribution with mean 1/20hour = 3 minutes). The time required for an airplane to take off has an exponentialdistribution with a mean of 2 minutes, and this process must be completed beforethe next airplane can begin to take off.
Because a brief thunderstorm has just begun, all airplanes which have notcommenced takeoff have just been grounded temporarily. However, airplanescontinue to arrive at the runway during the thunderstorm to await its end.
Assuming steady-state operation before the thunderstorm, determine the expectednumber of airplanes that will be waiting to take off at the end of the thunderstormif it lasts 30 minutes.
3. A production system consists of two machines which may operate simultaneouslybut independently. The machines fail randomly, with mean time to failure havingexponential distribution with mean 15 hours. There is a single repairman whosereponsibility is to return the machines to operating condition. Most of the failuresrequire only an average of 1 hour to be made operational again, but 20% of thefailures are severe and require an average of 8 hours. Assume the repair timeshave exponential distributions.
a. List the states of a continuous-time Markov chain model of this system.
b. Draw the transition diagram, with transition rates.
c. Write down Λ, the transition rate matrix.
d. Write down one of the balance equations which describe π, the steady statedistribution.
e. Compute the steady state distribution. (You may use the APL workspace CTMC, orsolve the system of linear equations using other software.)
f. What is the utilization of the machines, i.e., the fraction of the time that a machineis operable?
g. What is the utilization of the repairman, i.e., the fraction of the time that he isbusy?

56:171 O.R. HW #10 Fall 2002 page 1 of 3
A
B
56:171 Operations ResearchHomework #11 –due November 22, 2002
1. Consider the continuous-time Markov chain at the right.a. Write the matrix Λ of transition rates.b. Write the system of linear equations which determine the steady-
state probabilities.c. Solve the equations to obtain the steady-state distribution.
2. Four customers circulate between two single-server systems, i.e., all customers leaving server A enterthe queue of server B, and vice versa. Server A works can serve 2 customers per hour, while server Bworks at half the rate of server A.Define the states of a continuous-time Markov chain modelof this system to be(i,j) where i=# customers in queue or being served at A, and
j=# customers in queue or being served at B.
a. Indicate the possible transitions from each state, and label themwith the transition rates:
b. Is this a birth-death process?
c. Compute the steady-state probability distribution to find the expected number of customers insubsystem A and subsystem B.
3. At a taxi stand, taxis looking for customers and customers looking for taxis arrive according to Poissonprocesses with rates λ t = 1/minute and λc = 2/minute, respectively.
A taxi will always wait if no customers are at the stand. However, an arriving customer waits only ifthere are 3 or fewer customers already waiting.
Define a continuous-time Markov chain model with states:(−3): three customers waiting(−2): two customers waiting(−1): one customer waiting( 0 ): neither customer nor taxi waiting(+1): one taxi waiting(+2): two taxis waiting(+3): three taxis waitingetc.
Draw the transition diagram.
b. Compute the steady-state probability distribution.
c. What fraction of the time will customers be waiting for taxis?
0 3
12
1/hr
2/hr
1/hr
1/hr1/hr
4,0 3,1 2,2 1,3 0,4
56:171 O.R. HW #10 Fall 2002 page 2 of 3
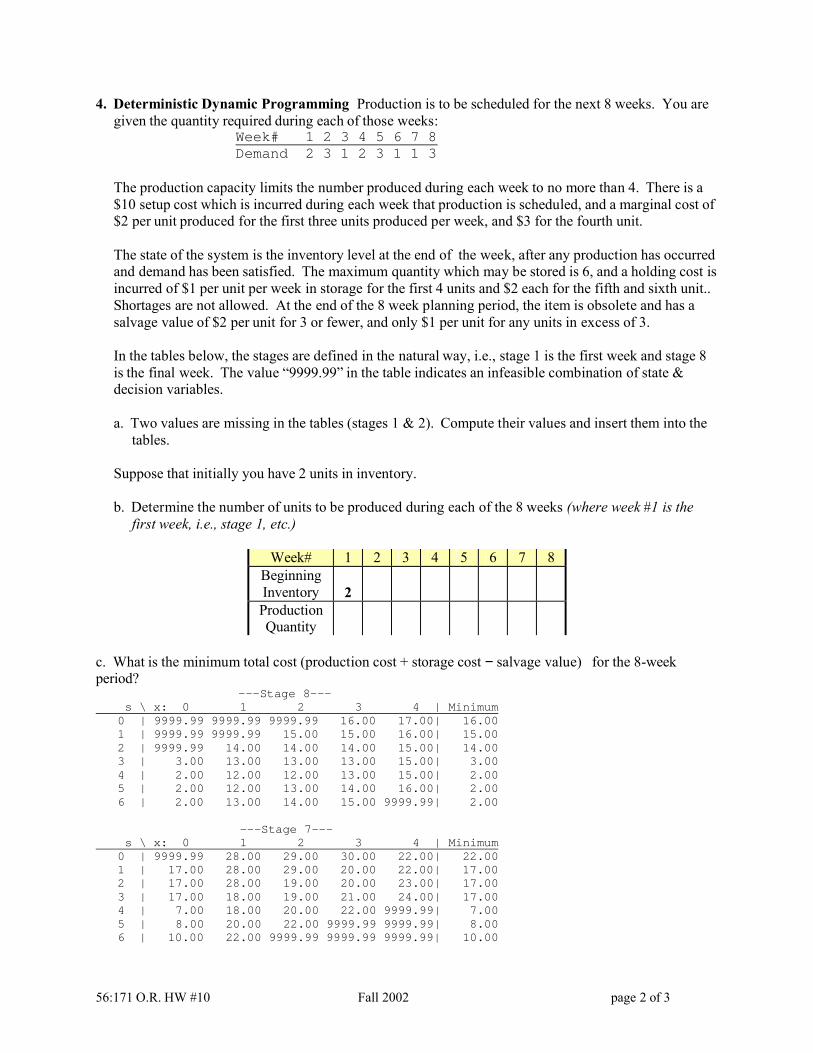
4. Deterministic Dynamic Programming Production is to be scheduled for the next 8 weeks. You aregiven the quantity required during each of those weeks:
Week# 1 2 3 4 5 6 7 8 Demand 2 3 1 2 3 1 1 3
The production capacity limits the number produced during each week to no more than 4. There is a$10 setup cost which is incurred during each week that production is scheduled, and a marginal cost of$2 per unit produced for the first three units produced per week, and $3 for the fourth unit.
The state of the system is the inventory level at the end of the week, after any production has occurredand demand has been satisfied. The maximum quantity which may be stored is 6, and a holding cost isincurred of $1 per unit per week in storage for the first 4 units and $2 each for the fifth and sixth unit..Shortages are not allowed. At the end of the 8 week planning period, the item is obsolete and has asalvage value of $2 per unit for 3 or fewer, and only $1 per unit for any units in excess of 3.
In the tables below, the stages are defined in the natural way, i.e., stage 1 is the first week and stage 8is the final week. The value “9999.99” in the table indicates an infeasible combination of state &decision variables.
a. Two values are missing in the tables (stages 1 & 2). Compute their values and insert them into thetables.
Suppose that initially you have 2 units in inventory.
b. Determine the number of units to be produced during each of the 8 weeks (where week #1 is thefirst week, i.e., stage 1, etc.)
Week# 1 2 3 4 5 6 7 8BeginningInventory 2ProductionQuantity
c. What is the minimum total cost (production cost + storage cost − salvage value) for the 8-weekperiod?
---Stage 8---s \ x: 0 1 2 3 4 | Minimum
0 | 9999.99 9999.99 9999.99 16.00 17.00| 16.00 1 | 9999.99 9999.99 15.00 15.00 16.00| 15.00 2 | 9999.99 14.00 14.00 14.00 15.00| 14.00 3 | 3.00 13.00 13.00 13.00 15.00| 3.00 4 | 2.00 12.00 12.00 13.00 15.00| 2.00 5 | 2.00 12.00 13.00 14.00 16.00| 2.00 6 | 2.00 13.00 14.00 15.00 9999.99| 2.00
---Stage 7---s \ x: 0 1 2 3 4 | Minimum
0 | 9999.99 28.00 29.00 30.00 22.00| 22.00 1 | 17.00 28.00 29.00 20.00 22.00| 17.00 2 | 17.00 28.00 19.00 20.00 23.00| 17.00 3 | 17.00 18.00 19.00 21.00 24.00| 17.00 4 | 7.00 18.00 20.00 22.00 9999.99| 7.00 5 | 8.00 20.00 22.00 9999.99 9999.99| 8.00 6 | 10.00 22.00 9999.99 9999.99 9999.99| 10.00

56:171 O.R. HW #10 Fall 2002 page 3 of 3
---Stage 6---s \ x: 0 1 2 3 4 | Minimum
0 | 9999.99 34.00 31.00 33.00 36.00| 31.00 1 | 23.00 30.00 32.00 34.00 27.00| 23.00 2 | 19.00 31.00 33.00 25.00 29.00| 19.00 3 | 20.00 32.00 24.00 27.00 32.00| 20.00 4 | 21.00 23.00 26.00 30.00 9999.99| 21.00 5 | 13.00 26.00 30.00 9999.99 9999.99| 13.00 6 | 16.00 30.00 9999.99 9999.99 9999.99| 16.00
---Stage 5---s \ x: 0 1 2 3 4 | Minimum
0 | 9999.99 9999.99 9999.99 47.00 42.00| 42.00 1 | 9999.99 9999.99 46.00 40.00 39.00| 39.00 2 | 9999.99 45.00 39.00 37.00 41.00| 37.00 3 | 34.00 38.00 36.00 39.00 43.00| 34.00 4 | 27.00 35.00 38.00 41.00 36.00| 27.00 5 | 25.00 38.00 41.00 35.00 41.00| 25.00 6 | 28.00 41.00 35.00 40.00 9999.99| 28.00
---Stage 4---s \ x: 0 1 2 3 4 | Minimum
0 | 9999.99 9999.99 56.00 55.00 56.00| 55.00 1 | 9999.99 55.00 54.00 54.00 54.00| 54.00 2 | 44.00 53.00 53.00 52.00 48.00| 44.00 3 | 42.00 52.00 51.00 46.00 47.00| 42.00 4 | 41.00 50.00 45.00 45.00 51.00| 41.00 5 | 40.00 45.00 45.00 50.00 9999.99| 40.00 6 | 35.00 45.00 50.00 9999.99 9999.99| 35.00
---Stage 3---s \ x: 0 1 2 3 4 | Minimum
0 | 9999.99 67.00 68.00 60.00 61.00| 60.00 1 | 56.00 67.00 59.00 59.00 61.00| 56.00 2 | 56.00 58.00 58.00 59.00 61.00| 56.00 3 | 47.00 57.00 58.00 59.00 57.00| 47.00 4 | 46.00 57.00 58.00 55.00 9999.99| 46.00 5 | 47.00 58.00 55.00 9999.99 9999.99| 47.00 6 | 48.00 55.00 9999.99 9999.99 9999.99| 48.00
---Stage 2---s \ x: 0 1 2 3 4 | Minimum
0 | 9999.99 9999.99 9999.99 76.00 75.00| 75.00 1 | 9999.99 9999.99 75.00 73.00 76.00| 73.00 2 | 9999.99 74.00 72.00 74.00 68.00| 68.00 3 | 63.00 71.00 73.00 66.00 68.00| 63.00 4 | 60.00 72.00 65.00 66.00 70.00| 60.00 5 | 62.00 65.00 66.00 69.00 73.00| _____6 | 55.00 66.00 69.00 72.00 9999.99| 55.00
---Stage 1---s \ x: 0 1 2 3 4 | Minimum
0 | 9999.99 9999.99 89.00 89.00 87.00| 87.00 1 | 9999.99 88.00 88.00 85.00 83.00| 83.00 2 | 77.00 87.00 _____ 81.00 81.00| 77.00 3 | 76.00 83.00 80.00 79.00 84.00| 76.00 4 | 72.00 79.00 78.00 82.00 78.00| 72.00 5 | 69.00 78.00 82.00 77.00 9999.99| 69.00 6 | 68.00 82.00 77.00 9999.99 9999.99| 68.00

56:171 O.R. HW#12 Fall 2002 page 1 of 6
56:171 Operations ResearchHomework #12 --Due Friday, 6 December 2002
1. Power Plant Construction. The construction of eight power plants is to bescheduled over an eight-year period, with a restriction that no more than three maybe built during each one-year period. The cost per plant is 125M$. In addition, acost of 100M$ is incurred in each year that construction is scheduled. (Assume forsake of simplicity that completion of the plant occurs
Year 1 2 3 4 5 6 7 8# plants required at end of year 2 3 3 4 5 5 7 8The table above gives the cumulative # of plants required by the end of each year, i.e.,a total of 8 additional plants are required by the end of year #8.
The utility company wants to minimize the present value of the construction costs,using an internal rate-of-return of 20%.
A deterministic dynamic programming model was developed, with stages = years (stage1 = year 1, etc.), state = cumulative # of plants built, and decision = # plants to beadded in each stage. The tables below show the tables of computations of the optimalschedule:
---Stage 8---s \ x: 0 1 | Minimum
7 | 99999.999 225.000| 225.000 8 | 0.000 99999.999| 0.000
---Stage 7---s \ x: 0 1 2 3 | Minimum
5 | 99999.999 99999.999 537.500 475.000| 475.000 6 | 99999.999 412.500 350.000 99999.999| 350.000 7 | 187.500 225.000 99999.999 99999.999| 187.500 8 | 0.000 99999.999 99999.999 99999.999| 0.000
---Stage 6---s \ x: 0 1 2 3 | Minimum
5 | 395.833 516.667 506.250 475.000| 395.833 6 | 291.667 |_______| 350.000 99999.999| 291.6677 | 156.250 225.000 99999.999 99999.999| 156.250 8 | 0.000 99999.999 99999.999 99999.999| 0.000
---Stage 5---s \ x: 0 1 2 3 | Minimum
4 | 99999.999 554.861 593.056 605.208| 554.861 5 | 329.861 468.056 480.208 475.000| 329.861 6 | 243.056 355.208 350.000 99999.999| 243.056 7 | 130.208 225.000 99999.999 99999.999| 130.208 8 | 0.000 99999.999 99999.999 99999.999| 0.000
---Stage 4---s \ x: 0 1 2 3 | Minimum
3 | 99999.999 687.384 624.884 677.546| 624.884 4 | 462.384 499.884 552.546 583.507| 462.384 5 | 274.884 427.546 458.507 475.000| 274.884 6 | 202.546 333.507 350.000 99999.999| 202.546 7 | 108.507 225.000 99999.999 99999.999| 108.507 8 | 0.000 99999.999 99999.999 99999.999| 0.000

56:171 O.R. HW#12 Fall 2002 page 2 of 6
---Stage 3---s \ x: 0 1 2 3 | Minimum
3 | 520.737 610.320 579.070 643.789| 520.737 4 | 385.320 454.070 518.789 565.422| 385.320 5 | 229.070 393.789 440.422 475.000| 229.070 6 | 168.789 315.422 350.000 99999.999| 168.789 7 | 90.422 225.000 99999.999 99999.999| 90.422 8 | 0.000 99999.999 99999.999 99999.999| 0.000
---Stage 2---s \ x: 0 1 2 3 | Minimum
2 | 99999.999 658.947 671.100 |_______| 658.947 3 | 433.947 546.100 540.892 615.657| 433.947 4 | 321.100 415.892 490.657 550.352| 321.100 5 | 190.892 365.657 425.352 475.000| 190.892 6 | 140.657 300.352 350.000 99999.999| 140.657 7 | 75.352 225.000 99999.999 99999.999| 75.352 8 | 0.000 99999.999 99999.999 99999.999| 0.000
---Stage 1---s \ x: 0 1 2 3 | Minimum
0 | 99999.999 99999.999 899.123 836.623| 836.623 1 | 99999.999 774.123 711.623 742.583| 711.623 2 | 549.123 586.623 617.583 634.077| 549.123 3 | 361.623 492.583 509.077 592.214| 361.623 4 | 267.583 384.077 467.214 537.793| 267.583 5 | 159.077 342.214 412.793 475.000| 159.077 6 | 117.214 287.793 350.000 99999.999| 117.214 7 | 62.793 225.000 99999.999 99999.999| 62.793 8 | 0.000 99999.999 99999.999 99999.999| 0.000
a. What are the two values which are missing in the tables above, for stages 7 and 2?
b. What is the present value of the construction costs of the optimal schedule?
c. What is the optimal construction schedule?Year 1 2 3 4 5 6 7 8
# plants required at end of year 2 3 3 4 5 5 7 8# plants to be constructed __ __ __ __ __ __ __ __
cumulative # of plants added
2. System Reliability A system is to be composed of five unreliable components withunit weights and reliabilities as shown in the table below.The designer wishes to select the level of redundancy to maximize the system reliability, subject to a restriction that the total weight of the system cannot be morethan 15 kg. (Note that the system requires at least one unit of each component for successful operation.)Component 1 2 3 4 5Weight (kg) 1 2 3 1 2Reliability (%) 80 85 90 75 70
A deterministic dynamic programming model was developed, in which the componentsare assumed to be considered one at a time, beginning with component 5. The
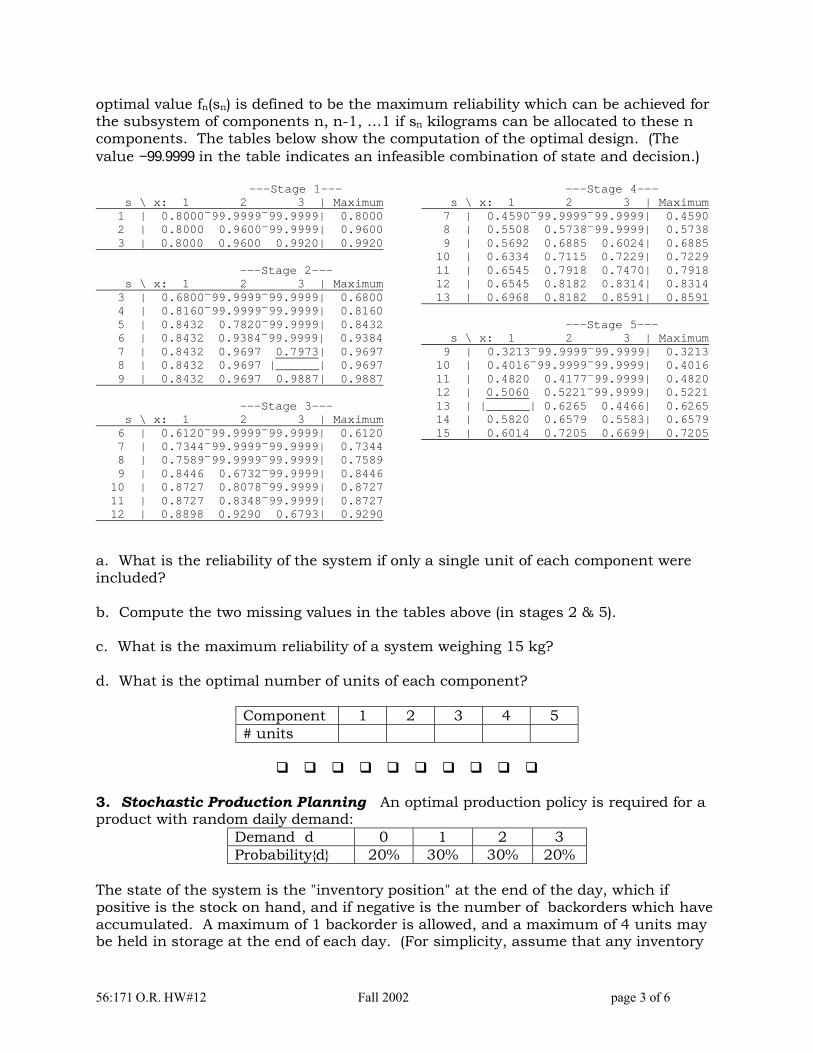
56:171 O.R. HW#12 Fall 2002 page 3 of 6
optimal value fn(sn) is defined to be the maximum reliability which can be achieved forthe subsystem of components n, n-1, …1 if sn kilograms can be allocated to these ncomponents. The tables below show the computation of the optimal design. (Thevalue −99.9999in the table indicates an infeasible combination of state and decision.)
---Stage 1---s \ x: 1 2 3 | Maximum
1 | 0.8000¯99.9999¯99.9999| 0.8000 2 | 0.8000 0.9600¯99.9999| 0.9600 3 | 0.8000 0.9600 0.9920| 0.9920
---Stage 2---s \ x: 1 2 3 | Maximum
3 | 0.6800¯99.9999¯99.9999| 0.6800 4 | 0.8160¯99.9999¯99.9999| 0.8160 5 | 0.8432 0.7820¯99.9999| 0.8432 6 | 0.8432 0.9384¯99.9999| 0.9384 7 | 0.8432 0.9697 0.7973| 0.9697 8 | 0.8432 0.9697 |______| 0.9697 9 | 0.8432 0.9697 0.9887| 0.9887
---Stage 3---s \ x: 1 2 3 | Maximum
6 | 0.6120¯99.9999¯99.9999| 0.6120 7 | 0.7344¯99.9999¯99.9999| 0.7344 8 | 0.7589¯99.9999¯99.9999| 0.7589 9 | 0.8446 0.6732¯99.9999| 0.8446 10 | 0.8727 0.8078¯99.9999| 0.8727 11 | 0.8727 0.8348¯99.9999| 0.8727 12 | 0.8898 0.9290 0.6793| 0.9290
---Stage 4---s \ x: 1 2 3 | Maximum
7 | 0.4590¯99.9999¯99.9999| 0.4590 8 | 0.5508 0.5738¯99.9999| 0.5738 9 | 0.5692 0.6885 0.6024| 0.6885 10 | 0.6334 0.7115 0.7229| 0.7229 11 | 0.6545 0.7918 0.7470| 0.7918 12 | 0.6545 0.8182 0.8314| 0.8314 13 | 0.6968 0.8182 0.8591| 0.8591
---Stage 5---s \ x: 1 2 3 | Maximum
9 | 0.3213¯99.9999¯99.9999| 0.3213 10 | 0.4016¯99.9999¯99.9999| 0.4016 11 | 0.4820 0.4177¯99.9999| 0.4820 12 | 0.5060 0.5221¯99.9999| 0.5221 13 | |______| 0.6265 0.4466| 0.6265 14 | 0.5820 0.6579 0.5583| 0.6579 15 | 0.6014 0.7205 0.6699| 0.7205
a. What is the reliability of the system if only a single unit of each component wereincluded?
b. Compute the two missing values in the tables above (in stages 2 & 5).
c. What is the maximum reliability of a system weighing 15 kg?
d. What is the optimal number of units of each component?
Component 1 2 3 4 5# units
3. Stochastic Production Planning An optimal production policy is required for aproduct with random daily demand:
Demand d 0 1 2 3Probability{d} 20% 30% 30% 20%
The state of the system is the "inventory position" at the end of the day, which ifpositive is the stock on hand, and if negative is the number of backorders which haveaccumulated. A maximum of 1 backorder is allowed, and a maximum of 4 units maybe held in storage at the end of each day. (For simplicity, assume that any inventory
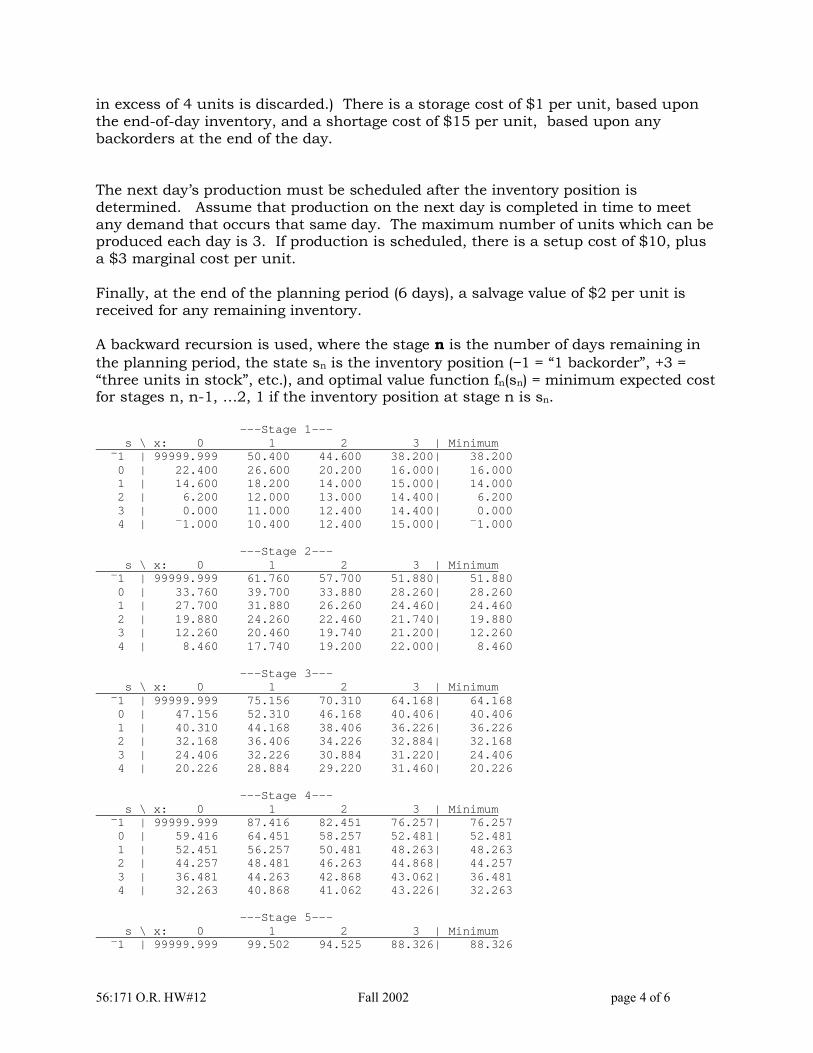
56:171 O.R. HW#12 Fall 2002 page 4 of 6
in excess of 4 units is discarded.) There is a storage cost of $1 per unit, based uponthe end-of-day inventory, and a shortage cost of $15 per unit, based upon anybackorders at the end of the day.
The next day’s production must be scheduled after the inventory position isdetermined. Assume that production on the next day is completed in time to meetany demand that occurs that same day. The maximum number of units which can beproduced each day is 3. If production is scheduled, there is a setup cost of $10, plusa $3 marginal cost per unit.
Finally, at the end of the planning period (6 days), a salvage value of $2 per unit isreceived for any remaining inventory.
A backward recursion is used, where the stage n is the number of days remaining inthe planning period, the state sn is the inventory position (−1 = “1 backorder”, +3 =“three units in stock”, etc.), and optimal value function fn(sn) = minimum expected costfor stages n, n-1, …2, 1 if the inventory position at stage n is sn.
---Stage 1---s \ x: 0 1 2 3 | Minimum
¯1 | 99999.999 50.400 44.600 38.200| 38.200 0 | 22.400 26.600 20.200 16.000| 16.000 1 | 14.600 18.200 14.000 15.000| 14.000 2 | 6.200 12.000 13.000 14.400| 6.200 3 | 0.000 11.000 12.400 14.400| 0.000 4 | ¯1.000 10.400 12.400 15.000| ¯1.000
---Stage 2---s \ x: 0 1 2 3 | Minimum
¯1 | 99999.999 61.760 57.700 51.880| 51.880 0 | 33.760 39.700 33.880 28.260| 28.260 1 | 27.700 31.880 26.260 24.460| 24.460 2 | 19.880 24.260 22.460 21.740| 19.880 3 | 12.260 20.460 19.740 21.200| 12.260 4 | 8.460 17.740 19.200 22.000| 8.460
---Stage 3---s \ x: 0 1 2 3 | Minimum
¯1 | 99999.999 75.156 70.310 64.168| 64.168 0 | 47.156 52.310 46.168 40.406| 40.406 1 | 40.310 44.168 38.406 36.226| 36.226 2 | 32.168 36.406 34.226 32.884| 32.168 3 | 24.406 32.226 30.884 31.220| 24.406 4 | 20.226 28.884 29.220 31.460| 20.226
---Stage 4---s \ x: 0 1 2 3 | Minimum
¯1 | 99999.999 87.416 82.451 76.257| 76.257 0 | 59.416 64.451 58.257 52.481| 52.481 1 | 52.451 56.257 50.481 48.263| 48.263 2 | 44.257 48.481 46.263 44.868| 44.257 3 | 36.481 44.263 42.868 43.062| 36.481 4 | 32.263 40.868 41.062 43.226| 32.263
---Stage 5---s \ x: 0 1 2 3 | Minimum
¯1 | 99999.999 99.502 94.525 88.326| 88.326

56:171 O.R. HW#12 Fall 2002 page 5 of 6
0 | 71.502 76.525 70.326 64.548| 64.548 1 | 64.525 68.326 62.548 60.326| 60.326 2 | 56.326 60.548 58.326 56.927| 56.326 3 | 48.548 56.326 54.927 55.106| 48.548 4 | 44.326 52.927 53.106 55.263| 44.326
---Stage 6---s \ x: 0 1 2 3 | Minimum
¯1 | 99999.999 111.570 106.593 100.393| 100.393 0 | 83.570 88.593 82.393 76.615| 76.615 1 | 76.593 80.393 |______| 72.393| 72.393 2 | 68.393 72.615 70.393 68.993| 68.393 3 | 60.615 68.393 66.993 67.171| 60.615 4 | 56.393 64.993 65.171 67.326| 56.393
a. Compute the missing value in the table for stage 6 (the first day of the planningperiod).
Suppose that initially there is one unit in stock.
b. What is the expected total cost of production, storage, & shortages during the sixdays, minus salvage value received for any final inventory?
c. What is the optimal production quantity for the first day (stage 6)?
d. What is the optimal production policy for each of the first five days? If inventory position is… Produce…
-101234
e. What is the optimal production policy for the final day (stage 1)?If inventory position is… Produce…
-101234

56:171 O.R. HW#12 Fall 2002 page 6 of 6
4. Equipment Replacement A machine initially costs $5000. The annual operatingcost increases with the age of the machine, while the trade-in value decreases,according to the following table (assume that management policy is to keep nomachine more than four years) :
Year of operation 1 2 3 4Operating cost($) 1000 1200 1500 1800Trade-in value atend of year ($)
3500 3000 2200 1500
Assume an interest rate of 12%, that initially you have a new machine, and that thecurrent machine at the end of eight years will be traded in, but not replaced.
Determine the replacement strategy for the next 8 years which will minimize thepresent value of replacement & operating costs, minus trade-in value.
What is the present value of the costs for the eight-year period


![bD-h ( ) ( ) r 171] (ãÊ 1 171 171 (073-000-0000) b b -50 (Zîü ......r 171] (ãÊ 1 171 171 (073-000-0000) b b -50 (Zîü) ï640-8226 073-432-4704 ("MY "MY "MY O"MY 99 "MY ßfifVk"y5"](https://static.fdocuments.in/doc/165x107/6025e16303f4d66b72289886/bd-h-r-171-1-171-171-073-000-0000-b-b-50-z-r-171.jpg)