542-10-#1 Statistics 542 Introduction to Clinical Trials Issues in Analysis of Randomized Clinical...
73
542-10-#1 Statistics 542 Statistics 542 Introduction to Clinical Introduction to Clinical Trials Trials Issues in Analysis of Issues in Analysis of Randomized Clinical Randomized Clinical Trials Trials
-
Upload
cali-delmar -
Category
Documents
-
view
229 -
download
3
Transcript of 542-10-#1 Statistics 542 Introduction to Clinical Trials Issues in Analysis of Randomized Clinical...
542-10-#1
Statistics 542Statistics 542
Introduction to Clinical TrialsIntroduction to Clinical Trials
Issues in Analysis of Issues in Analysis of Randomized Clinical TrialsRandomized Clinical Trials
542-10-#2
Issues in Analysis of Issues in Analysis of Randomized Clinical TrialsRandomized Clinical Trials
• Reference:
May, DeMets et al (1981)
Circulation 64:669-673
Peto et al (1976)
British Journal of Cancer

542-10-#3
Sources of BiasSources of Bias1. Patient selection
2. Treatment assignment
3. Patient Evaluation
4. Data Analysis
Methods to Minimize Bias1. Randomized Controls
2. Double blind (masked)
3. Analyze what is randomized

542-10-#4
What Data Should Be Analyzed?What Data Should Be Analyzed?• Basic Intention-to-Treat Principle
– Analyze what is randomized!– All subjects randomized, all events during
follow-up• Randomized control trial is the “gold”
standard”
• Definitions
Exclusions– Screened but not randomized– Affects generalizability but validity OK
Withdrawals from Analysis– Randomized, but not included in data analysis– Possible to introduce bias!

542-10-#5
Patient CloseoutPatient Closeout
• ICH E9 Glossary– “Intention-to-treat principle - …It has the
consequence that subjects allocated to a treatment group should be followed up, assessed, and analyzed as members of that group irrespective of their compliance with the planned course of treatment.”

542-10-#6
Intention To Treat (ITT) Intention To Treat (ITT) PrinciplePrinciple
• Analyze all subjects randomized & all events
• Beware of “look alikes”– Modified ITT: Analyze subjects who get
some intervention– Per Protocol: Analyze subjects who comply
according to the protocol
542-10-#7
Patient Withdrawn in Analysis (1)Patient Withdrawn in Analysis (1)
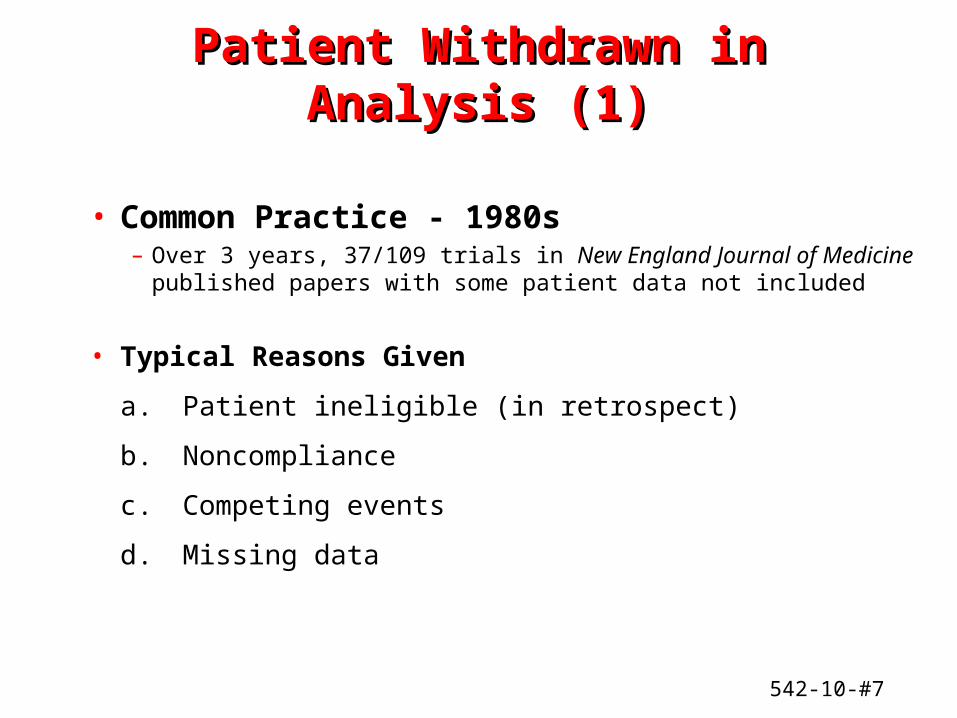
• Common Practice - 1980s– Over 3 years, 37/109 trials in New England Journal of Medicine
published papers with some patient data not included
• Typical Reasons Given
a. Patient ineligible (in retrospect)
b. Noncompliance
c. Competing events
d. Missing data

542-10-#8
Patient Withdrawn in Analysis (2)Patient Withdrawn in Analysis (2)
A. Patient INELIGIBLE
– After randomization, discover some patients did not in fact meet entry criteria
– Concern ineligible patients may dilute treatment effect
– Temptation to withdraw ineligibles
– Withdrawl of ineligible patients, post hoc, may introduce bias

542-10-#9
Betablocker Heart Attack TrialBetablocker Heart Attack Trial(JAMA, 1982)(JAMA, 1982)
• 3837 post MI patients randomized• 341 patients found by Central Review to be ineligible• Results
% Mortality
Propranolol Placebo
Eligible 7.3 9.6
Ineligible 6.7 11.3 Best
Total 7.2 9.8
In the ineligible patients, treatment works best
542-10-#10
Anturane Reinfarction Trial (1980) Anturane Reinfarction Trial (1980) NEJMNEJM
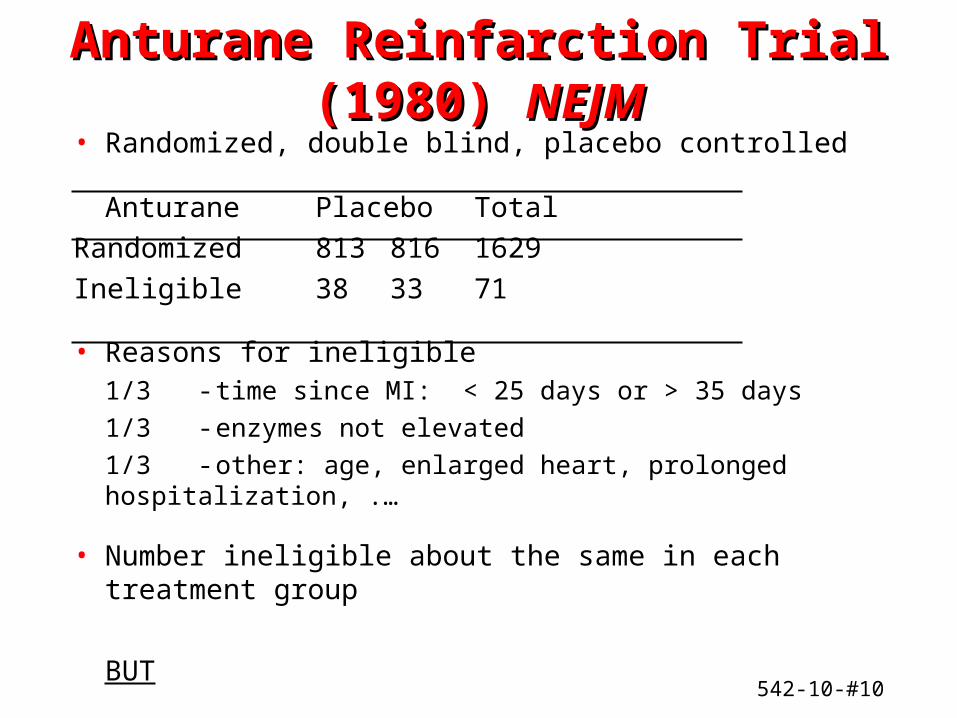
• Randomized, double blind, placebo controlled
Anturane Placebo Total
Randomized 813 816 1629
Ineligible 38 33 71
• Reasons for ineligible1/3 - time since MI: < 25 days or > 35 days
1/3 - enzymes not elevated
1/3 - other: age, enlarged heart, prolonged hospitalization, .…
• Number ineligible about the same in each treatment group
BUT

542-10-#11
Anturane Reinfarction Trial (1980)Anturane Reinfarction Trial (1980)
• 1629 patients randomized– 1631 entered, but two patients randomized twice
– Need to delete 03013, 17008
– Use first randomization!
• Declared post hoc 71 “ineligible” patients

542-10-#12
Anturane Reinfarction Trial Anturane Reinfarction Trial (1980)(1980)
Placebo Anturane Total
All 817 812 1629
Ineligible 33 38 71
Eligible 784 774 1558
< 7 day rule 15 15 30
Analyzable subjects 769 759 1528
(Table 3)
Analyzable Deaths - Within 7 days of being off drug

542-10-#13
1980 Anturane Mortality 1980 Anturane Mortality ResultsResults
Anturane Placebo P-Value
Randomized 74/813 (9.1%) 89/816 (10.9%) 0.20
“Eligible” 64/775 (8.3%) 85/783 (10.9%) 0.07
“Ineligible” 10/38 (26.3%) 4/33 (12.1%) 0.12
P-Values for 0.0001 0.92 eligible vs ineligible
Reference: Temple & Pledger (1980) NEJM, p. 1488

542-10-#14
1980 Anturane Mortality 1980 Anturane Mortality ResultsResults
Anturane Placebo
Withdrawn 10 4
• “Early” discontinuation 4 3
• “Late” discontinuation 6 1
542-10-#15
Total MortalityTotal MortalityAnturane Reinfarction Trial (1980)Anturane Reinfarction Trial (1980)
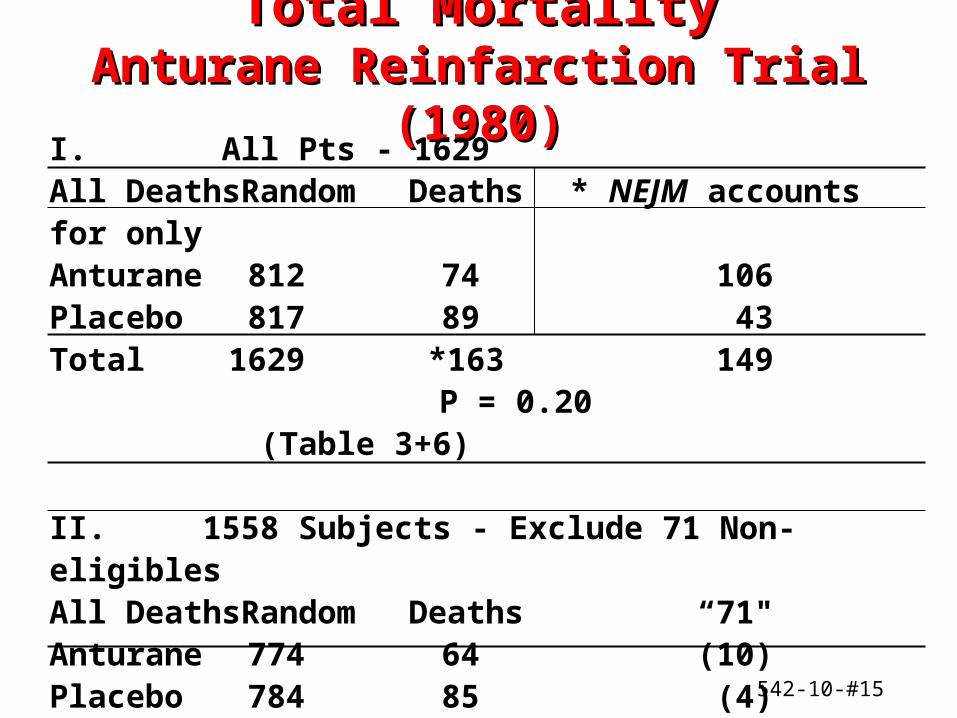
I. All Pts - 1629All Deaths Random Deaths * NEJM accounts for onlyAnturane 812 74 106Placebo 817 89 43Total 1629 *163 149
P = 0.20 (Table 3+6)
II. 1558 Subjects - Exclude 71 Non-eligiblesAll Deaths Random Deaths “71"Anturane 774 64 (10)Placebo 784 85 (4)Total 1558 149 P = 0.07
542-10-#16
Total MortalityTotal MortalityAnturane Reinfarction Trial (1980)Anturane Reinfarction Trial (1980)
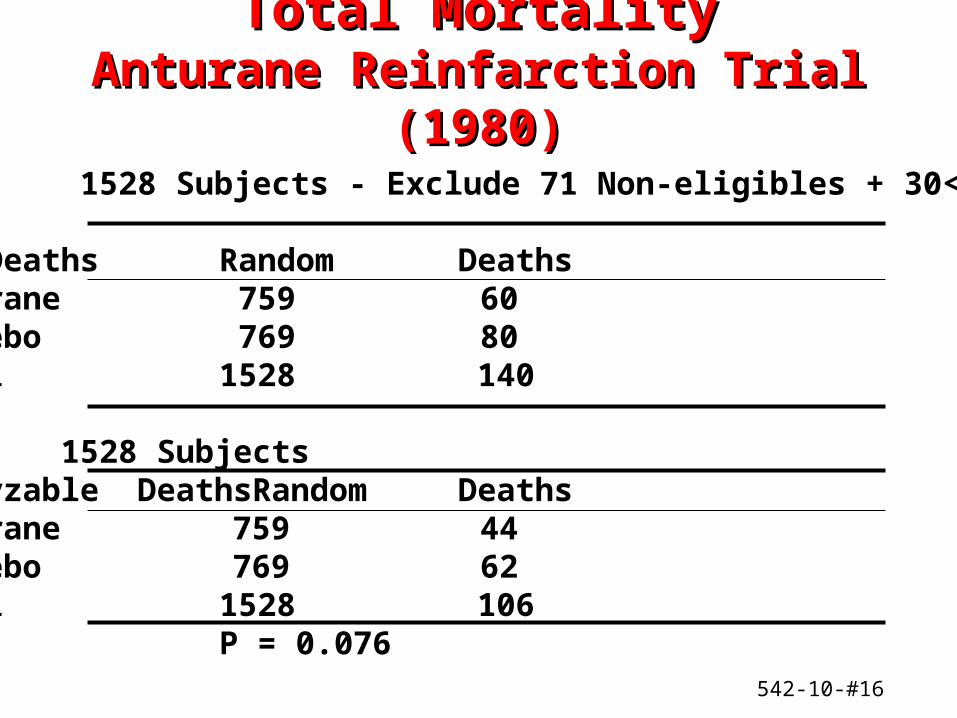
III. 1528 Subjects - Exclude 71 Non-eligibles + 30<7 days
All Deaths Random DeathsAnturane 759 60Placebo 769 80Total 1528 140
IV. 1528 SubjectsAnalyzable Deaths Random DeathsAnturane 759 44Placebo 769 62Total 1528 106
P = 0.076

542-10-#17
Total MortalityTotal Mortality Anturane Reinfarction Trial (1980)Anturane Reinfarction Trial (1980)
Consider Patients Excluded
I. < 7 day rule - 30 pts
Alive Dead TotalPlacebo 10 5 15Anturane 11 4 15Total 21 9 30

542-10-#18
Total MortalityTotal Mortality Anturane Reinfarction Trial (1980)Anturane Reinfarction Trial (1980)
II. 71 "ineligibles"
Alive Dead TotalPlacebo 29 4 33Anturane 28 10 38Total 57 14 71

542-10-#19
Anturane Sudden Death (SD)Anturane Sudden Death (SD)I. All Patients (N = 1629)
Randomized NDA-SDs NEJM-SDsPlacebo 816 41 49 8Anturane 813 27 30 3Total 1629 68 79P-value 0.08 0.0311 additional SD's were defined from submission of NDs to publications
II. Exclude 71 Protocol Violators (N = 1558)Randomized NDA-SDs NEJM-SDs
Placebo 783 40 46Anturane 775 26 28Total 1558 66 64P-value 0.08 0.03Difference of 8 SD's

542-10-#20
Anturane Sudden Death (SD)Anturane Sudden Death (SD)for Total Follow-upfor Total Follow-up
III. Exclude 71 Protocol Violators & 30 7 Day Rule Violators (N = 1528)
Randomized NDA-SDs NEJM-SDsPlacebo 768 37 37Anturane 760 24 22Total 1528 61 59P-value 0.09 0.04
* Information not necessarily given in NEJM articlebut used to prepare tables presented
542-10-#21
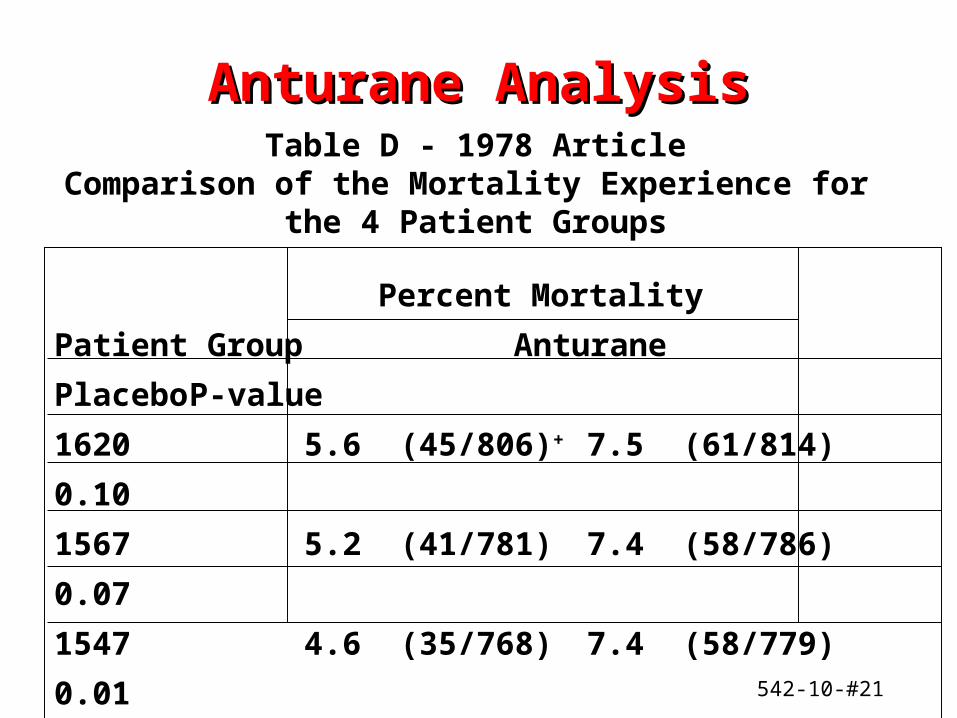
Anturane AnalysisAnturane Analysis
Percent Mortality
Patient Group Anturane Placebo P-value
1620 5.6 (45/806)+ 7.5 (61/814) 0.10
1567 5.2 (41/781) 7.4 (58/786) 0.07
1547 4.6 (35/768) 7.4 (58/779) 0.01
1475 4.4 (32/733) 7.1 (53/742) 0.02
Article '78 3.4 (25/733) 5.9 (44/742) 0.016+ Number of deaths/number at risk
Table D - 1978 ArticleComparison of the Mortality Experience for
the 4 Patient Groups
542-10-#22
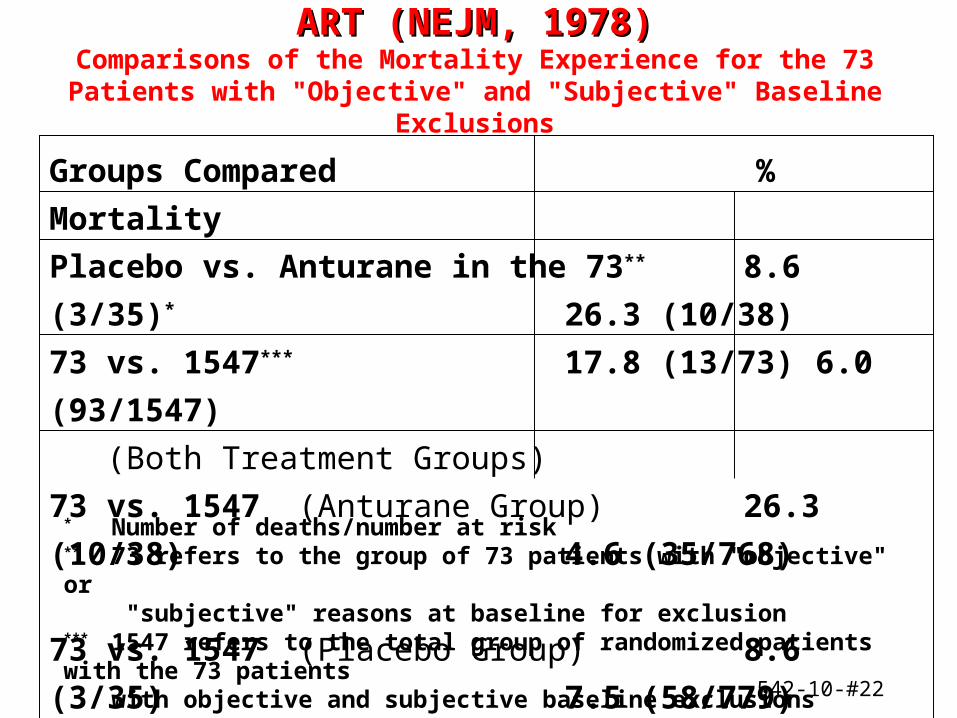
ART (NEJM, 1978)ART (NEJM, 1978)Comparisons of the Mortality Experience for the 73 Patients with
"Objective" and "Subjective" Baseline Exclusions
Groups Compared % Mortality
Placebo vs. Anturane in the 73** 8.6 (3/35)* 26.3 (10/38)
73 vs. 1547*** 17.8 (13/73) 6.0 (93/1547)
(Both Treatment Groups)
73 vs. 1547 (Anturane Group) 26.3 (10/38) 4.6 (35/768)
73 vs. 1547 (Placebo Group) 8.6 (3/35) 7.5 (58/779)* Number of deaths/number at risk** 73 refers to the group of 73 patients with "objective" or
"subjective" reasons at baseline for exclusion*** 1547 refers to the total group of randomized patients with the 73 patients
with objective and subjective baseline exclusions removed

542-10-#23
ART (NEJM, 1978)ART (NEJM, 1978)P-Values Using Two Techniques for
Survival Curve Comparisons of the Groups
P-Values Groups Compared Mantel-Haenszel Gehan
Method Method
Placebo vs. Anturane in the 73 0.045 0.052
73 vs. 1547
(Both Treatment Groups) 0.0009 0.0003
73 vs. 1547 (Anturane Only) < 0.0001 < 0.0001
73 vs. 1547 (Placebo Only) 0.91 0.98
542-10-#24
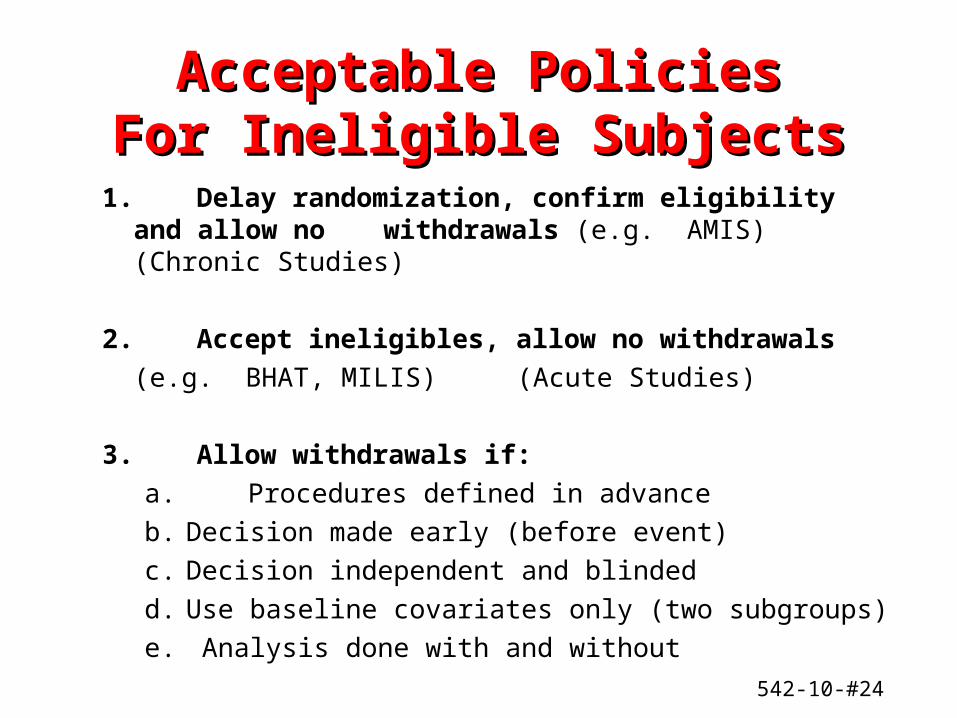
Acceptable PoliciesAcceptable PoliciesFor Ineligible SubjectsFor Ineligible Subjects
1. Delay randomization, confirm eligibility and allow no withdrawals (e.g. AMIS) (Chronic Studies)
2. Accept ineligibles, allow no withdrawals
(e.g. BHAT, MILIS) (Acute Studies)
3. Allow withdrawals if:
a. Procedures defined in advance
b. Decision made early (before event)
c. Decision independent and blinded
d. Use baseline covariates only (two subgroups)
e. Analysis done with and without

542-10-#25
B. WITHDRAWL FOR NON-COMPLIANCE
References: Sackett & Gent (1979) NEJM, p. 1410Coronary Drug Project (1980) NEJM, p. 1038
• Two Types of Trials
1. Management
- "Intent to Treat" Principle
- Compare all subjects, regardless of compliance
2. Explanatory
- Estimate optimum effect, understand mechanism
- Analyze subjects who fully comply
WITHDRAWALS FOR NON-COMPLIANCE MAY LEAD TO BIAS!

542-10-#26
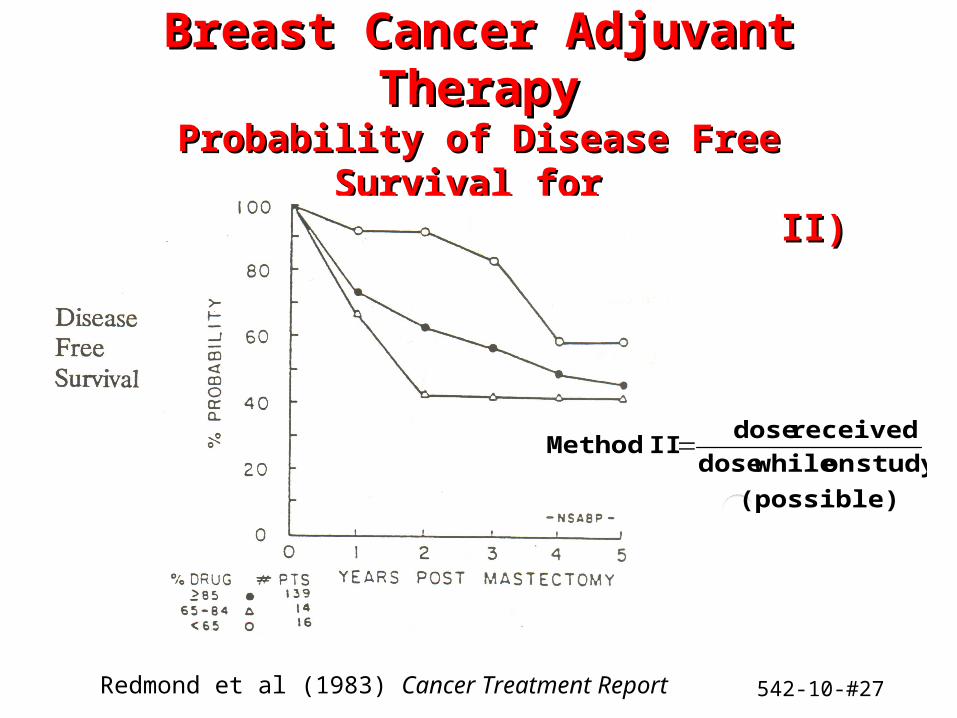
Breast Cancer Adjuvant TherapyBreast Cancer Adjuvant TherapyProbability of Disease Free Survival for Probability of Disease Free Survival for
Years Post Mastectomy (Method I)Years Post Mastectomy (Method I)
Redmond et al (1983) Cancer Treatment Report
dose protocol total
received dose I Method
542-10-#27
Breast Cancer Adjuvant TherapyBreast Cancer Adjuvant TherapyProbability of Disease Free Survival for Probability of Disease Free Survival for
Years Post Mastectomy (Method II)Years Post Mastectomy (Method II)
(possible)
study on while dose
received dose II Method
Redmond et al (1983) Cancer Treatment Report

542-10-#28
Breast Cancer Adjuvant TrialBreast Cancer Adjuvant Trial
• Results using stratification by compliance analysis can be re-ordered according to definition
• Both previous graphs are for the placebo arm
• Lesson: Compliance is an outcome & analysis of one outcome, stratified by another, is highly vulnerable to bias
542-10-#29
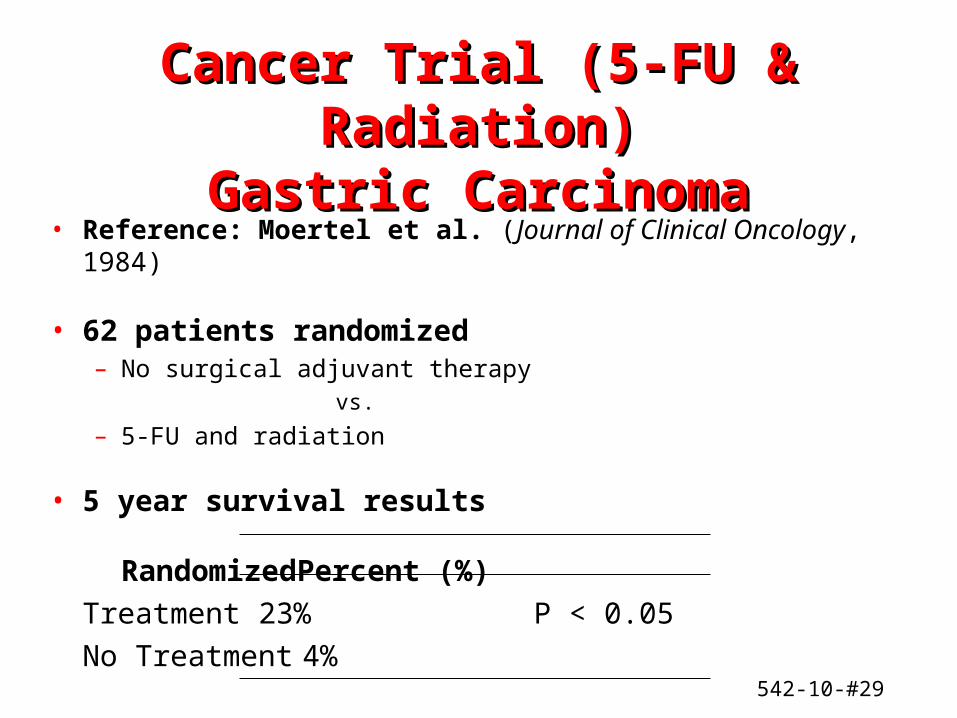
Cancer Trial (5-FU & Radiation)Cancer Trial (5-FU & Radiation)Gastric CarcinomaGastric Carcinoma
• Reference: Moertel et al. (Journal of Clinical Oncology, 1984)
• 62 patients randomized– No surgical adjuvant therapy
vs.
– 5-FU and radiation
• 5 year survival results
Randomized Percent (%)
Treatment 23% P < 0.05
No Treatment 4%
542-10-#30
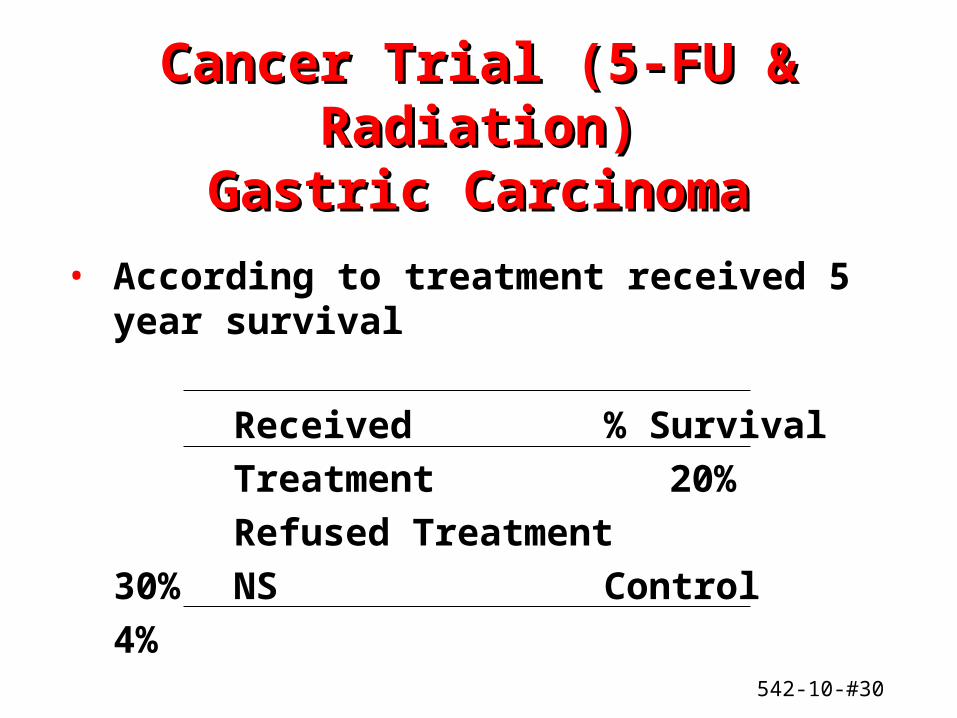
Cancer Trial (5-FU & Radiation)Cancer Trial (5-FU & Radiation)Gastric CarcinomaGastric Carcinoma
• According to treatment received 5 year survival
Received % Survival
Treatment 20%
Refused Treatment 30% NS
Control 4%

542-10-#31
Example: Coronary Drug ProjectExample: Coronary Drug Project5-Year Mortality5-Year Mortality
Clofibrate Placebo
N % Deaths N % Deaths
Total (as reported) 1103 20.0 2782 20.9
By Compliance 1065 18.2 2695 19.4
< 80% 357 24.6 882 28.2
> 80% 708 15.0 1813 15.1
• Adjusting for 40 covariates had little impact
• Compliance is an outcome
Compliers do better, regardless of treatment

542-10-#32
Example: Coronary Drug ProjectExample: Coronary Drug Project2-Year Mortality2-Year Mortality
Compliance Assessed Estrogen Placebo
N % Deaths N % Deaths
Total 903 6.2 2361 5.7
< 80% 488 6.1 436 9.9
> 80% 415 6.3 1925 4.8
Comments• Higher % of estrogens patients did not comply• Beneficial to be randomized to estrogen & not take it • (6.1% vs. 9.9%)• Best to be randomized to placebo & comply (4.8%)
542-10-#33
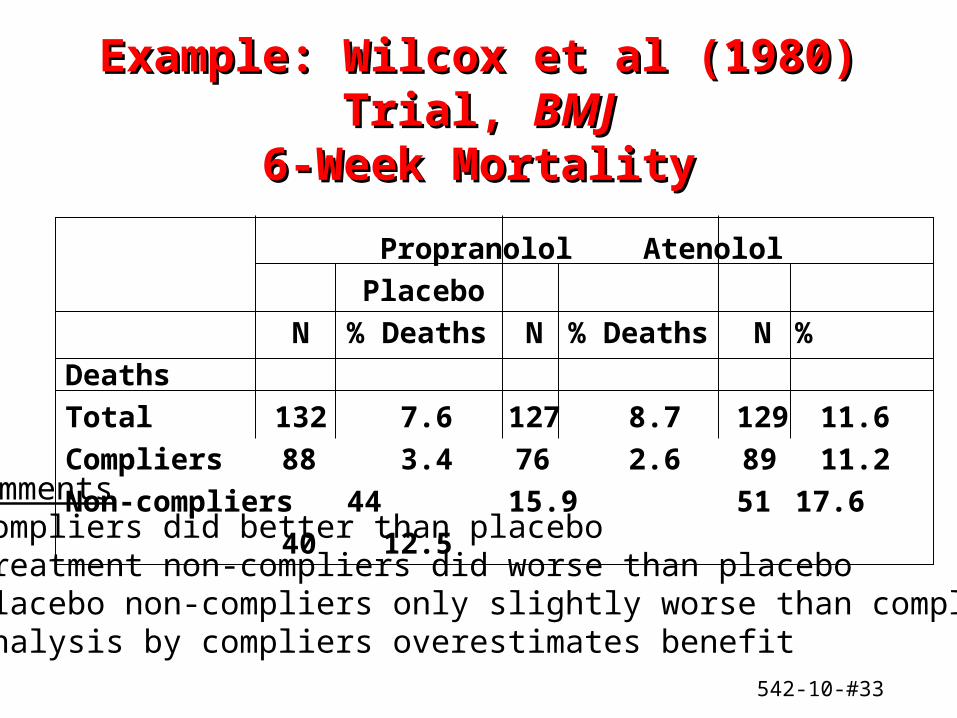
Example: Wilcox et al (1980) Trial, Example: Wilcox et al (1980) Trial, BMJBMJ6-Week Mortality6-Week Mortality
Propranolol Atenolol Placebo
N % Deaths N % Deaths N % Deaths
Total 132 7.6 127 8.7 129 11.6
Compliers 88 3.4 76 2.6 89 11.2
Non-compliers 44 15.9 51 17.6 40 12.5
Comments• Compliers did better than placebo• Treatment non-compliers did worse than placebo• Placebo non-compliers only slightly worse than compliers• Analysis by compliers overestimates benefit
542-10-#34
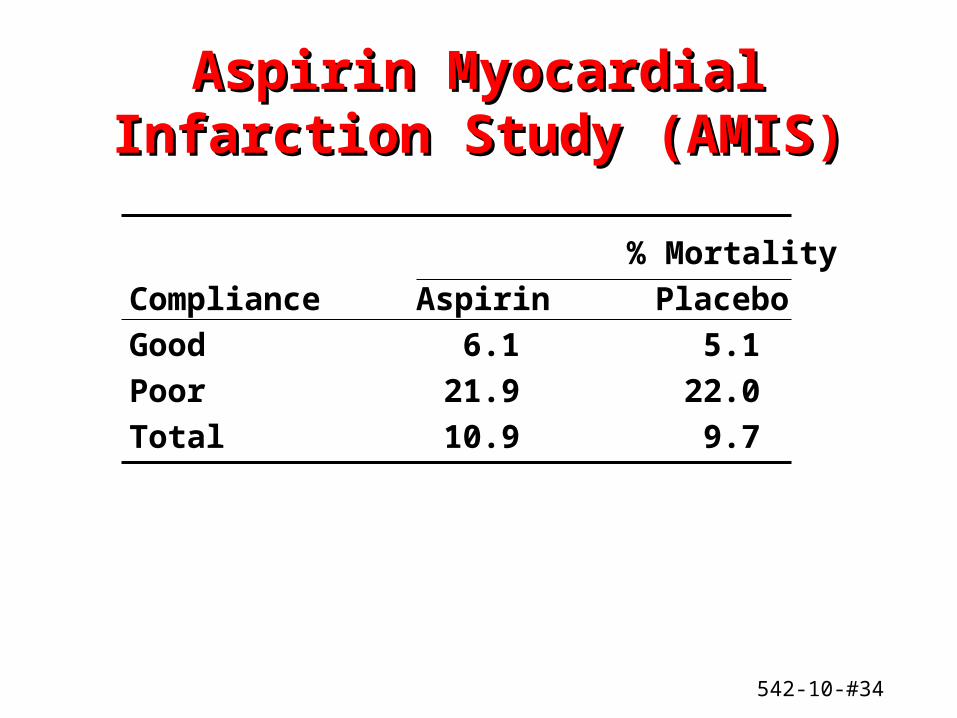
Aspirin Myocardial Infarction Aspirin Myocardial Infarction Study (AMIS)Study (AMIS)
% Mortality
Compliance Aspirin Placebo
Good 6.1 5.1
Poor 21.9 22.0
Total 10.9 9.7

542-10-#35
Summary of ComplianceSummary of Compliance
• No consistent pattern
Example Non-compliance Did Worse
CDP Clofibrate, AMIS Both Treatment & Control
CDP Estrogen Control OnlyBeta-blocker, Wilcox Two Treatments, Not
Control• Compliance an outcome, not always independent
of treatment• Withdrawal of non-compliers can lead to bias• Non-compliers dilute treatment• Try hard not to randomize non-compliers

542-10-#36
II. Competing EventsII. Competing Events
• Subject may be censored from primary event by some other event (e.g. cancer vs. heart disease)
• Must assume independence
• If cause specific mortality used, should also look at total death
• If non-fatal event is primary, should also look at total death and non-fatal event
• Problem for some response measures

542-10-#37
III. Problem of DefinitionsIII. Problem of Definitions
Classification Anturane Placebo P-value
ART 30/812 48/817 0.03
Another Committee 28/812 39/817 0.17
• Cause specific definitions hard to apply
• Example: Anturane Reinfarction Trail (ART)(NEJM, 1980)
Sudden Death

542-10-#38
Anturane Reinfarction TrialAnturane Reinfarction TrialSudden DeathSudden Death
Category Source Placebo Anturane P-value
All patients & all NEJM 48/817 30/812 0.03
sudden deaths AC 39/817 28/812 0.17
"Eligible" patients & NEJM 46/785 28/775 0.03
all sudden deaths AC 37/782 25/773 0.12
• Problem of cause specific definitions• AC = Another review committee

542-10-#39
IV. "Wrong", Inconsistent, IV. "Wrong", Inconsistent, Outlying DataOutlying Data
• "Wrong" or "outlying" data may in fact be real
• Decisions must be made blind of group assignment
• All modifications or withdrawals must be documented
542-10-#40
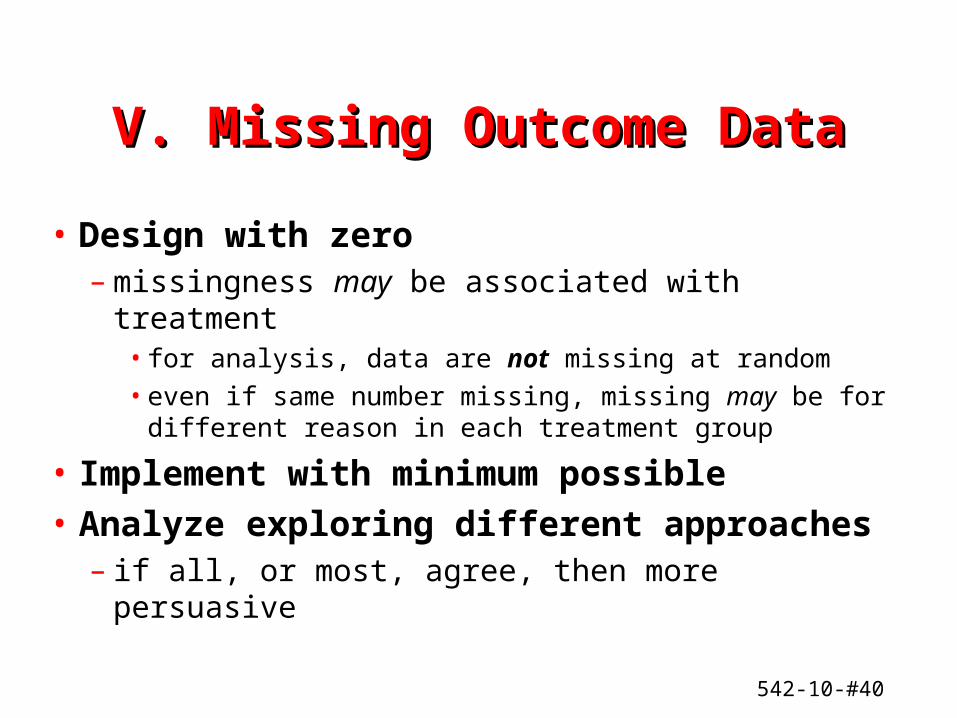
V. Missing Outcome DataV. Missing Outcome Data
• Design with zero– missingness may be associated with treatment
• for analysis, data are not missing at random• even if same number missing, missing may be for
different reason in each treatment group
• Implement with minimum possible
• Analyze exploring different approaches– if all, or most, agree, then more persuasive

542-10-#41
““Best” and “Worst” Best” and “Worst” Case AnalysesCase Analyses
Treatment Control
Total Events 170 220
Lost to Follow-up 30 10
"Best" Case 170 230
"Worst" Case 200 220
542-10-#42
VI. Poor Quality DataVI. Poor Quality Data
542-10-#43
Poor Quality Data (1)Poor Quality Data (1)
1. Lost to Follow-up (enforced withdrawals) NO DATA:
PROBLEMS:
– Not necessarily independent of treatment
– Raises questions about study conduct

542-10-#44
Poor Quality Data (2)Poor Quality Data (2)
SOLUTIONS:
1. Keep to a minimum• Easiest if vital status is the outcome• Hardest if the response variables are
time-related measures requiring a hospital or clinic visit
2. Censor at the time lost– Can be done in survival analysis– Assumes independence of treatment

542-10-#45
Poor Quality Data (3)Poor Quality Data (3)
SOLUTIONS:
3. Estimate missing data using previous data or averages
4. “Best” case and “worst” case analyses
542-10-#46
VII. Poor Clinic Performance in VII. Poor Clinic Performance in a Multicenter Studya Multicenter Study
• If randomization was stratified by clinic, then withdrawal of a clinic is theoretically valid
• Withdrawal must be done independent of the outcome at that clinic

542-10-#47
Mortality in Aspirin Myocardial Mortality in Aspirin Myocardial Infarction Study (AMIS)Infarction Study (AMIS)
Aspirin Placebo P-value
All 30 Centers 246/2267 219/2257 0.997 “Selected” Centers 39 66 < 0.01
• In “selected” centers, aspirin showed superiority
542-10-#48
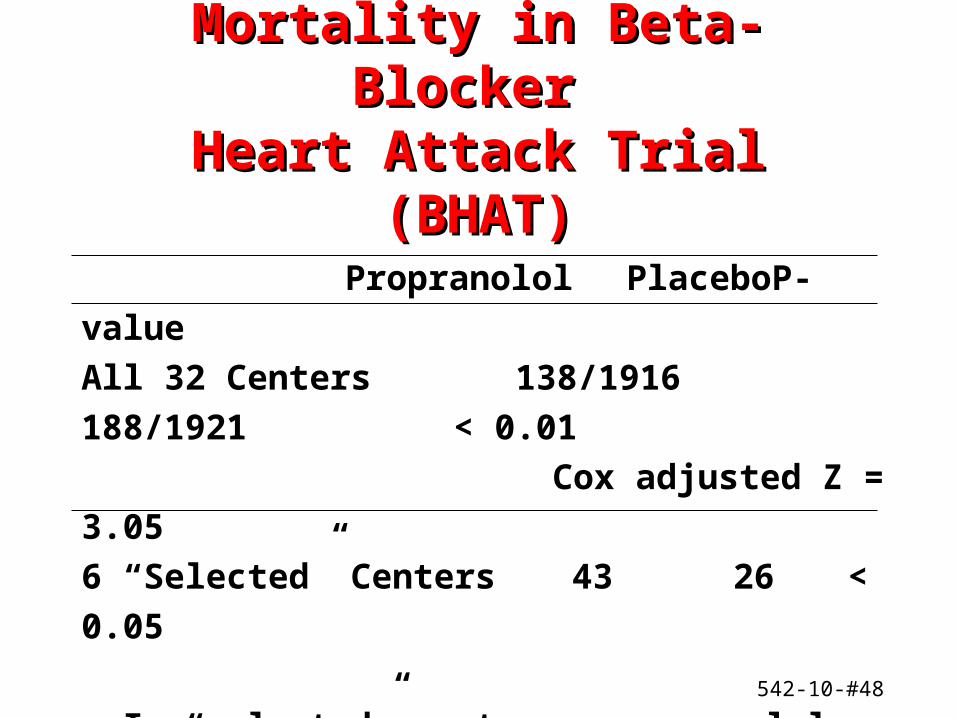
Mortality in Beta-Blocker Mortality in Beta-Blocker Heart Attack Trial (BHAT)Heart Attack Trial (BHAT)
Propranolol Placebo P-value
All 32 Centers 138/1916 188/1921 < 0.01
Cox adjusted Z = 3.05
6 “Selected” Centers 43 26 < 0.05
• In “selected” centers, propranolol worse
542-10-#49
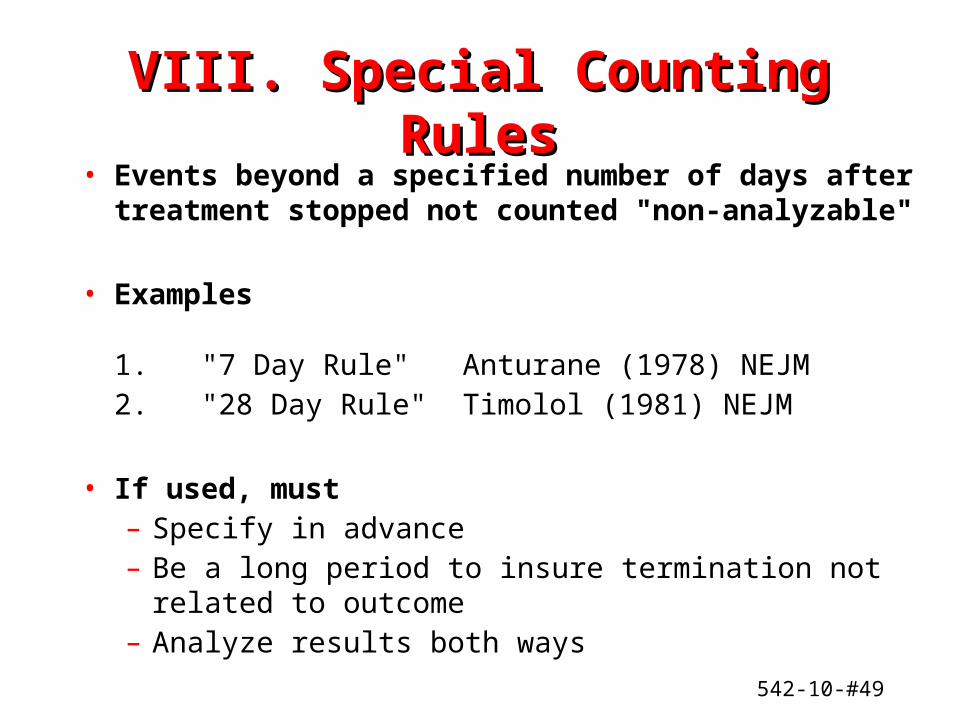
VIII. Special Counting RulesVIII. Special Counting Rules• Events beyond a specified number of days after
treatment stopped not counted "non-analyzable"
• Examples
1. "7 Day Rule" Anturane (1978) NEJM2. "28 Day Rule" Timolol (1981) NEJM
• If used, must– Specify in advance– Be a long period to insure termination not related to
outcome– Analyze results both ways

542-10-#50
IX. Fishing orIX. Fishing orDichotomizing OutcomesDichotomizing Outcomes
• Common practice to define a response (S,F) from a non-dichotomous variable
• By changing our definition, we can alter results
• Thus, definitions stated in advance
• Definitions should be based on external data

542-10-#51
Dichotomizing OutcomesDichotomizing Outcomes
Heart Rate
Trt A Trt B
Subject Pre Post Pre Post
1 72 72 0 72 702
2 74 73 1 71 68 3
...
25 73 73 0 79 79 0
Mean 74.0 73.2 0.8 74.4 74.0 0.4
Example

542-10-#52
Three Possible Analyses (1)Three Possible Analyses (1)
Change Treatment A Treatment B P-Value
1.F = < 7 23 25 0.49
S = > 7 2 0

542-10-#53
Three Possible Analyses (2)Three Possible Analyses (2)
Change Treatment A Treatment B P-Value
1.F = < 7 23 25 0.49
S = > 7 2 0
2.F = < 5 19 25 0.02
S = > 5 6 0

542-10-#54
Three Possible Analyses (3)Three Possible Analyses (3)
Change Treatment A Treatment B P-Value
1.F = < 7 23 25 0.49
S = > 7 2 0
2.F = < 5 19 25 0.02
S = > 5 6 0
3.F = < 3 17 18 0.99
S = > 3 8 7

542-10-#55
X. Time Dependent Covariate X. Time Dependent Covariate AdjustmentAdjustment
• Classic covariate adjustment uses baseline prognostic factors only– Adjust for Imbalance– Gain Efficiency
• Adjustment by time dependent variates not recommended in clinical trials (despite Cox time dependent regression model)
• Habit from epidemiology studies

542-10-#56
Coronary Drug ProjectCoronary Drug Project5-Year Mortality5-Year Mortality
Baseline Cholesterol % DeathsCholesterol Change Clofibrate Placebo
< 250mg%* Fall 16.0 21.2
< 250 Rise 25.5 18.7
> 250 mg% Fall 18.1 20.2
> 250 ** Rise 15.5 21.3
• Little change in placebo group• Best to have
a. Low cholesterol getting lower *b. High cholesterol getting higher **
Example

542-10-#57
Example: Cancer TrialsExample: Cancer Trials
• A common practice to compare survival on patients with a tumor response
• Problem is that patient must first survive to be a responder
length - bias sampling

542-10-#58
Cancer Trials (1)Cancer Trials (1)
Advanced Breast Cancer: Surgery vs. Medicine
Santen et al. (1981) NEJM
(Letter to editor, Paul Meier, U of Chicago)
• A randomized clinical trial comparing surgical adrenalectomy vs. drug therapy in women with advanced breast cancer
• 17 pts withdrawn from surgery group
10 pts withdrawn from medical group

542-10-#59
Cancer Trials (2)Cancer Trials (2)• Reasons
– Medical group (10 pts)
2 stopped taking their drugs
5 drug toxicity
– Surgical group (17 pts)
7 later refused surgery
8 rapid progression precluding surgery
• No follow-up data on these 27 pts presented
542-10-#60
XI. Subgroup AnalysesXI. Subgroup Analyses
542-10-#61
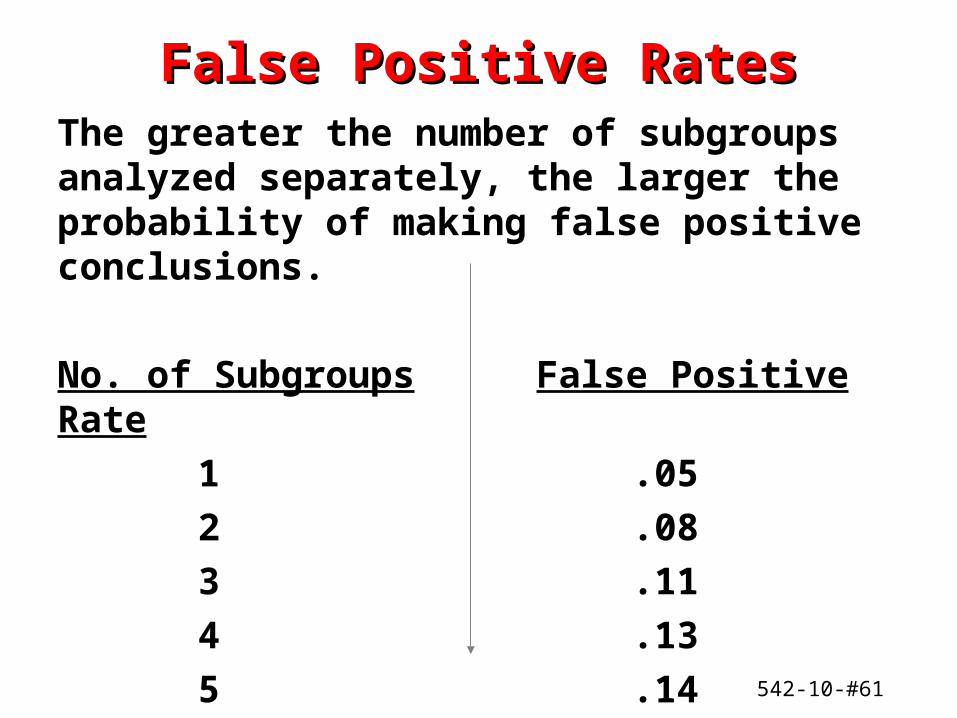
False Positive RatesFalse Positive RatesThe greater the number of subgroups analyzed separately, the larger the probability of making false positive conclusions.
No. of Subgroups False Positive Rate
1 .05
2 .08
3 .11
4 .13
5 .14
10 .19

542-10-#62
Subgroup AnalysesSubgroup Analyses
• Focusing on a particular “significant” subgroup can be risky– Due to chance– Results not consistent
• Estimates not precise due to small sample size

542-10-#63
MERIT Total MortalityMERIT Total Mortality

542-10-#64
MERITMERIT

542-10-#65
MERITMERIT(AHJ, 2001)

542-10-#66
Praise IPraise IRef: NEJM, 1996
• Amlodipine vs. placebo• NYHA class II-III• Randomized double-blind• Mortality/hospitalization outcomes• Stratified by etiology (ischemic/non-ischemic)• 1153 patients

542-10-#67
PRAISE IPRAISE I
542-10-#68
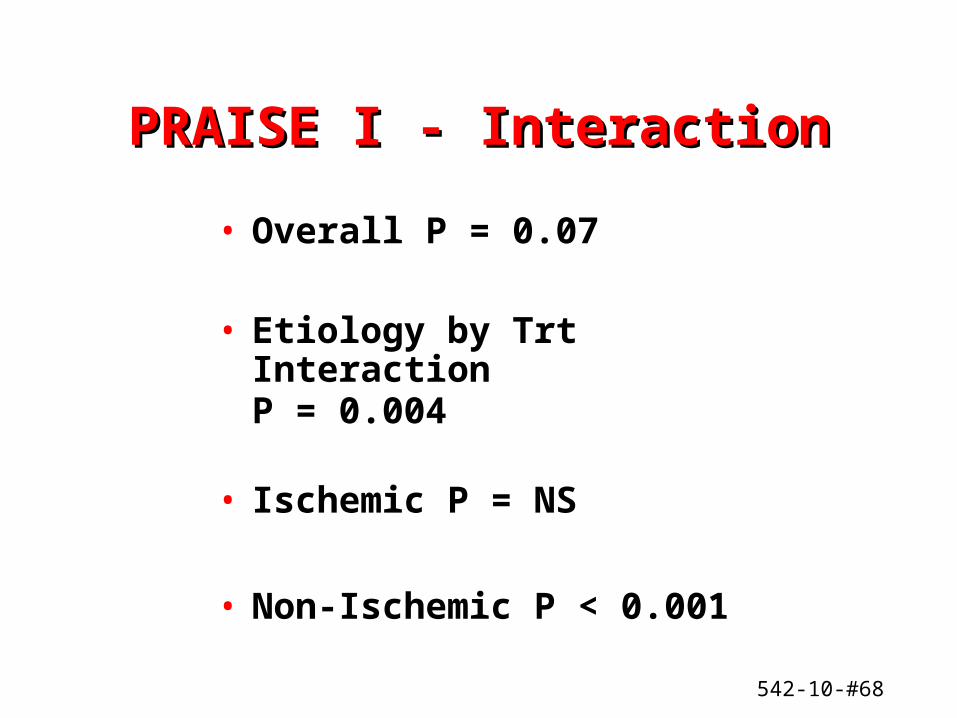
PRAISE I - InteractionPRAISE I - Interaction
• Overall P = 0.07
• Etiology by Trt InteractionP = 0.004
• Ischemic P = NS
• Non-Ischemic P < 0.001

542-10-#69
PRAISE I - IschemicPRAISE I - Ischemic

542-10-#70
PRAISE I – Non- IschemicPRAISE I – Non- Ischemic
542-10-#71
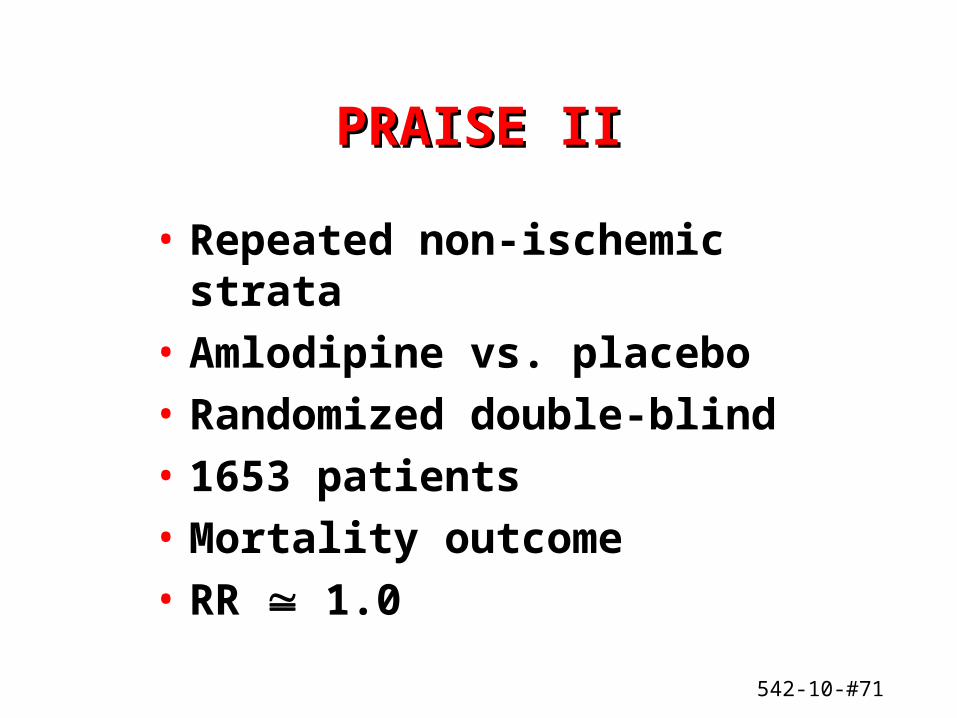
PRAISE IIPRAISE II
• Repeated non-ischemic strata
• Amlodipine vs. placebo
• Randomized double-blind
• 1653 patients
• Mortality outcome
• RR 1.0

542-10-#72
Three ViewsThree Views
• Ignore subgroups and analyze only by treatment groups.
• Plan for subgroup analyses in advance. Do not “mine” data.
• Do subgroup analyses
However view all results with caution.
542-10-#73
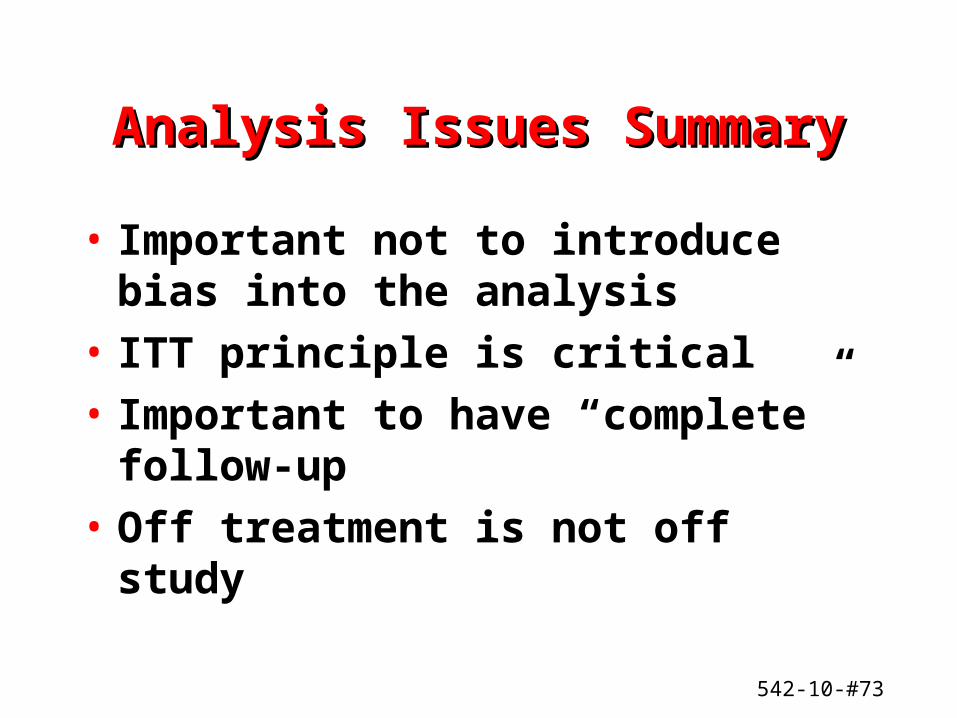
Analysis Issues SummaryAnalysis Issues Summary
• Important not to introduce bias into the analysis
• ITT principle is critical
• Important to have “complete” follow-up
• Off treatment is not off study