
54-621 Mass Flow Handbook - Magnetrol
36
Thermatel ® Thermal Dispersion Mass Flow Measurement Handbook
Transcript of 54-621 Mass Flow Handbook - Magnetrol

Thermatel®Thermal Dispersion Mass Flow
Measurement Handbook

Table of Contents
Introduction ....................................................................................................1
What is Mass Flow Measurement?...................................................................1
Types of Flow Transmitters ..............................................................................4
Differential Pressure.........................................................................................4
Orifice .............................................................................................................4
Venturi ............................................................................................................6
Averaging Pitot Tube .......................................................................................7
Vortex Shedding ..............................................................................................7
Turbine Flow Meters .......................................................................................8
Ultrasonic Flow ...............................................................................................9
Coriolis............................................................................................................9
Pressure/Temperature Correction...................................................................10
Multi-Variable Transmitters ...........................................................................10
Thermal Mass Flow.......................................................................................11
Different Types of Thermal Mass Flow Meters ..............................................13
Response Time ..............................................................................................14
Temperature Compensation ..........................................................................15
Pressure Effects ..............................................................................................17
Calibration ....................................................................................................18
Calibration vs. Configuration ........................................................................20
Accuracy ........................................................................................................20
Flow Profile ...................................................................................................21
Installation Options.......................................................................................25
Accuracy vs. Repeatability .............................................................................27
Limitations of Technology .............................................................................28
Applications...................................................................................................29
Difficult Applications ....................................................................................30
Unique Features.............................................................................................30
References......................................................................................................31
Common Conversion Factors ........................................................................32
Gas Density at Standard Conditions .............................................................33

1
Introduction
Accurate mass flow measurement of gas is difficult to obtain. The main reasonis that gas is a compressible fluid. This means that the volume of a fixed massof gas depends upon the pressure and temperature it is subject to.
Consider a balloon containing one actual cubic foot of gas at room tempera-ture (70° F) and atmospheric pressure. An increase in the room temperaturecauses the balloon to expand. An increase in the pressure surrounding the bal-loon results in a decrease in volume. Although the volume of the balloonchanges with variations in pressure and temperature, the mass of the gas insidethe balloon has remained the same. This illustrates how pressure and tempera-ture affect the actual volume.
There are many well established methods of measuring the actual volumetricflow rate. However, the measured flow rate will vary with changes in tempera-ture and pressure. For virtually all industrial process operations, the user wantsto measure the mass flow rate instead of the actual flow rate. Chemical reac-tions work on the basis of mass relationships of ingredients. Combustion isbased upon the mass flow rate of the air and the fuel. Gas consumption in afacility is based upon mass flow rate. To accurately measure mass flow, theactual flow rate must be adjusted to correct for any change in temperatureand pressure.
Thermal mass flow technology is a method of gas flow measurement that doesnot require correction for changes in process temperature or pressure. Thermalmass flow technology also has a benefit of measurement at low velocities andgreater turndown capabilities than those obtainable with other gas flowmeasurement devices.
What is Mass Flow Measurement?
Mass Flow is the measurement of the flow rate without consideration of theprocess conditions. Mass flow is equivalent to the actual flow rate multipliedby the density of the gas. M = Q × where Q is the actual flow and is thedensity. As the pressure and temperature change, the volume and densitychange, however the mass remains the same.
To obtain standardization of gas flow measurement, Standard conditions ofTemperature and Pressure (STP conditions) are utilized. Gas flow measured atSTP conditions is corrected from the actual process conditions to standardconditions; this will be discussed in more detail later.

2
The simplest way of measuring mass flow of gas is in units of cubic feet perminute or cubic meters per hour, corrected to STP conditions. This is referredto as SCFM (standard cubic feet per minute) or the metric equivalent ofNm3/h (normal cubic meters per hour). The density of a gas at standard con-ditions is known, thus providing a relationship between SCFM and poundsper hour or between Nm3/h and kg/h.
The conversion between the volume at actual conditions and the volume atstandard conditions is based on the ideal gas law — actual volume increasesin direct proportion to an increase in absolute temperature, and decreasesin direct portion to an increase in absolute pressure. Consider the balloonexample — as the temperature increases, the volume expands; as the pressureincreases, the volume shrinks.
Absolute pressure of zero psia (pounds per square inch at absolute conditions)is a perfect vacuum. One atmosphere of pressure is defined as 14.69 psia orzero psig. The conversion between psia and psig is easy: PSIA = PSIG + 14.69.If you have a pressure gauge calibrated for psig, it will read zero at sea leveland only measure gauge pressure above atmospheric pressure. The followingchart will help clarify this.
Absolute zero is defined as the temperature where molecular motion stops. Itis defined as 0 K (Kelvin) which is -273.16° C or 0° R (Rankine) which is-459.67° F. To convert between actual temperature and absolute temperature,simply add 460 to the temperature in degrees Fahrenheit or 273 to the tem-perature in Celsius.
Vacuum (negative gauge pressure)Absolute Pressure (psia)
Gauge Pressure (psig)
Atmospheric Pressure (psia)
System Pressure (1)
Atmospheric Pressure
System Pressure (2)
Absolute Zero Pressure
Figure 1

3
Once we establish a set of conditions as a standard temperature and pressure(STP conditions), we can convert between the flow rate at actual conditionsand the flow rate at standard conditions.
The subscript (a) refers to actual conditions; the subscript (s) refers to stan-dard conditions.
Unfortunately, not all STP conditions are universal. Many users consider oneatmosphere and 70° F as STP. Some industries use one atmosphere and 60° Fas standard; others use one atmosphere and 32° F as standard. The metricequivalent is Normal conditions which are based on a pressure of one bar(14.5 psia) and 0° C or 1 bar and 20°C.
The important issue is that Standard Conditions are not Standard and a massflow meter needs to be able to permit the user to select the desired STP condi-tion. An error of approximately 8% will occur if there is a difference in STPconditions between 70° F and 32° F.
Once a set of standard conditions is identified, the density of that gas at theseconditions is known. Therefore, it is a simple matter to convert from SCFMto mass in pounds per hour:
In this formula, the density in pounds per cubic foot is the density at the spec-ified STP conditions. A list of common gases and their density is in theappendix.
SCFM = ACFMT(s)
T(a)
P(a)
P(s)( ) ( )
poundshour
= SCFM x poundscubic foot
x 60 minuteshour

4
Types of Flow Transmitters
There are many types of flow transmitters — some are used for both liquidand gas flow measurement, while others are specifically used for one fluid. Thefollowing table identifies many of the different types of flow transmitters andtheir use in liquid, steam, or gas service, and if they measure actual flow ormass flow.
As shown, there are many technologies to measure the flow rate of gas. Mostof these methods measure the flow rate at the actual operating pressure andtemperature and require pressure and temperature correction to obtain themass flow.
The following discusses some of the common types of flow measurement:
Differential Pressure
Measuring the pressure difference across a flow element is the most commonmethod of flow measurement. There are several types of flow elements.
Orifice
The most common flow element is the orifice plate as shown in Figure 2.
Technology Liquids Steam Gas Actual Flow Mass Flow
DifferentialPressure X X X X
Vortex X X X X
Turbine X X X X
Magnetic X X
PositiveDisplacement X X X
Variable Area X X X X
Coriolis X X X
Ultrasonic X X X
Thermal X X
Differential Pressure
Differential PressurePressure
Flow
Reference
Orifice Plate
Figure 2

5
This method of flow measurement utilizes a proven technical concept called“Bernoulli’s Equation.” This relation states that the pressure drop across a flowrestriction is based upon the square of the flow:
The flow rate is based upon flow at actual operating conditions.
The pressure drop across the flow element is proportional to the square of theflow. If the pressure drop (∆P) is equal to “a”, and the flow rate doubles, thepressure drop increases to 4a. If the flow rate triples, then the pressure dropincreases to 9a. Therefore the signal strength increases as the flow rateincreases. At zero flow there is no signal, and the signal strength slowlyincreases as the flow increases as shown in the chart below. This results inpoor low flow sensitivity.
Basic limitations of this type of flow measurement are:
1. Limited turndown. A 3:1 turndown causes a 9:1 reduction in pressuredrop. A 4:1 turndown causes a 16:1 reduction in pressure drop.There becomes a limit on the turndown ratio of any differentialpressure measurement instrument due to the DP transmitter. Typicalturndown of a DP transmitter is 10:1.
2. Limited low flow measurement. There is a minimum flow ratewhich generates a pressure drop that can be measured with anydifferential pressure transmitter. This is illustrated in the above graph.
0
2
4
6
8
10
12
14
16
0 0.5 1 1.5 2 2.5 3 3.5 4
Pre
ssu
reD
rop
Flow Rate
Flow = constant ×∆P( )
1⁄2
Figure 3
6
3. Creates pressure drop. Because the flow measurement is based uponmeasuring a differential pressure, the flow measurement requires thatadditional pressure drop be added to the process, which increasesoperating cost. The pressure drop created by the primary element isfrequently overlooked when considering operating cost.
4. Measures actual flow rate. Any differential pressure flow device meas-ures the actual flow rate in ACFM. To determine the mass flow rate,correction from actual conditions to standard (mass) conditions isrequired. To determine mass flow from actual flow, it is necessary tomeasure:
— Differential pressure
— Absolute pressure
— Absolute temperature
These measurements are then sent to a flow computer that calculates the massflow rate in SCFM, using the equations previously discussed.
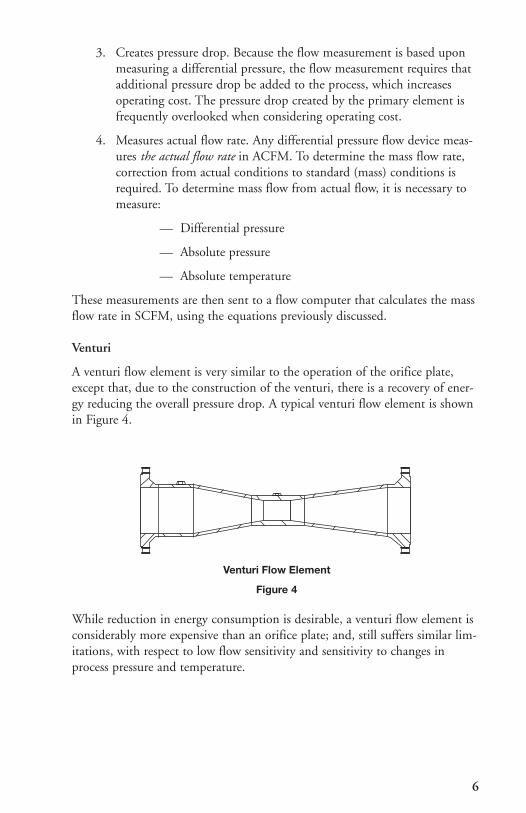
Venturi
A venturi flow element is very similar to the operation of the orifice plate,except that, due to the construction of the venturi, there is a recovery of ener-gy reducing the overall pressure drop. A typical venturi flow element is shownin Figure 4.
While reduction in energy consumption is desirable, a venturi flow element isconsiderably more expensive than an orifice plate; and, still suffers similar lim-itations, with respect to low flow sensitivity and sensitivity to changes inprocess pressure and temperature.
Venturi Flow Element
Figure 4

7
Averaging Pitot Tube
The averaging pitot tube can be an effective differential pressure flow measure-ment device. It is an insertion device that measures the average velocity acrossthe pipe as shown in the illustration below. While this type of instrument iseffective for liquid and steam flow, it has limitations with gas flow measurement,particularly low flow sensitivity and turndown.
The flow measurement is based on determining the velocity pressure, which isthe difference between the total pressure (measured on the upstream side) andthe static pressure (measured on the downstream side). The velocity pressureprovides an indication of the actual velocity at the operating temperature andpressure. The averaging pitot tube samples at various points across the pipe orduct in order to reduce the effect of flow profile. Refer to Figure 5.
Vortex Shedding
This technology is well accepted for flow measurement at high flow rates. Theprinciple of operation is based upon the shedding or the creation of vorticesfrom a blunt element. The instrument counts the number of vortices created;and, through a known relationship, converts this to the actual flow ratethrough the element. Refer to Figure 6.
TotalPressure Static
Pressure
Averaging Pitot Tube
Flow
Still Fluid
Shear Layer
High Velocity Fluid
AlternateVortices
Vortex Shedding
Figure 5
Figure 6

8
There are limitations when using this technology for measurement of gasflow rates:
1. Vortex flow meters measure the actual flow rate moving past the flowelement. To convert to mass flow, it is necessary to measure pressure,temperature, and use a flow computer to calculate mass flow.
2. Minimum flow rate. There is a minimum flow velocity that generatesvortices. At flow rates below this minimum flow rate, the instrumentwill not generate vortices. This is why some vortex flow meters arereported to drop off at the low end. This reduces the ability to detectlow flow rates and reduce overall turndown of the instrument. This isa physical limitation that exists for all vortex flow meters. Sometimesthe pipe size is reduced in order to increase the velocity through thevortex flow meter to improve low flow sensitivity. This complicates aninstallation—especially if done as a retrofit on an existing installation.
While vortex flow transmitters are occasionally used for high velocity gas flow,their most common applications are for liquid or steam flow.
Turbine Flow Meters
Frequently used for air and gas flow measurement, turbine flow meters areavailable as both an in-line body and an insertion probe.
The vanes of the turbine flow meter spin as the fluid moves — the greater theflow rate, the faster the vanes will turn. Various methods are used to count thepulse rate (number of turns) of the vanes.
Turbine meters can be accurate for measuring the actual gas flow rate; but,like other devices, they require pressure and temperature correction to obtainmass flow measurement. Turbine meters also have a minimum velocity thatthey can detect, and may require some type of lubrication of the bearings.They are also known to continue spinning after the flow has stopped resultingin high flow measurements.
Many applications for turbine flow meters are for smaller, in-line flow bodieswhere pressure and temperature are fairly constant. Because of the movingparts the gas does need to be clean.

9
Ultrasonic Flow
Ultrasonic technology is used to measure the velocity of the fluid in a closedpipe. The sensors can be either insertion type or a non-invasive type, whichclamp onto the side of the pipe.
When there is flow, the time for a pulse to go between the downstream andupstream transducer will be longer than the time from the upstream to thedownstream transducer. The faster the velocity the greater this difference intime. This time difference can then be used to calculate the velocity and flowin the pipe at operating conditions. Measurement of both pressure andtemperature is used to obtain mass flow.
The accuracy of an ultrasonic flow meter can be improved by providing multi-ple sets of transducers or paths which measure the flow in different areas ofthe pipe.
Coriolis
Coriolis is a direct form of mass flow measurement, which does not rely uponthe physical properties of the fluid. When first developed, Coriolis flow metersdid not have the sensitivity for gas flow measurement; however, the technologyhas improved and Coriolis is now used to measure gas flows.
There are a variety of designs of Coriolis Mass Flow Meters. These include singlestraight tube, multiple straight tube, curved tube, S-tube and other variations.They work on the basic principle that the the Coriolis force is dependent onthe mass flow through an oscillating sensor tube.
The advantage of Coriolis is that it is a true, high accuracy, mass flowmeasurement, independent of the properties of the fluid. Disadvantages arethat it is available only as an in-line device with limitations in size. Coriolisflowmeters are expensive to purchase and install. May not be suitable for lowflow, low pressure applications. Pressure drop across a Coriolis flowmeter isalso a consideration.
Downstreamtransducer
Upstreamtransducer
Flow direction Flow directionD
L
tu
td
Figure 7
10
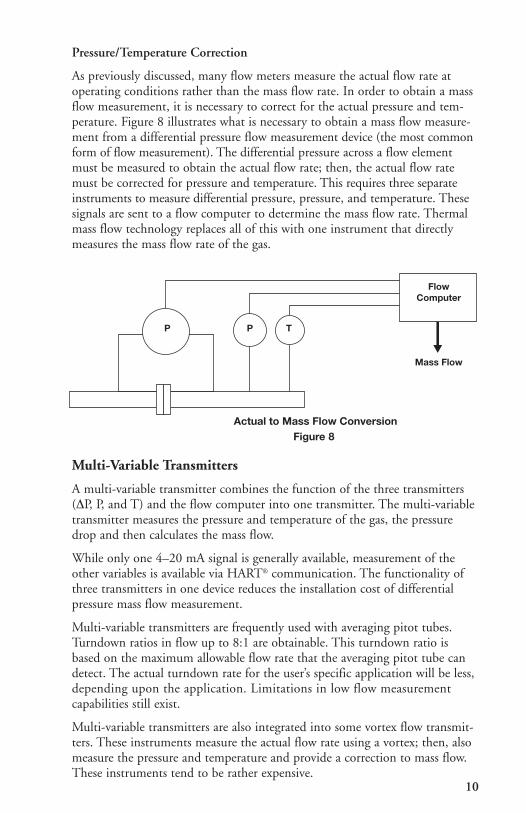
Pressure/Temperature Correction
As previously discussed, many flow meters measure the actual flow rate atoperating conditions rather than the mass flow rate. In order to obtain a massflow measurement, it is necessary to correct for the actual pressure and tem-perature. Figure 8 illustrates what is necessary to obtain a mass flow measure-ment from a differential pressure flow measurement device (the most commonform of flow measurement). The differential pressure across a flow elementmust be measured to obtain the actual flow rate; then, the actual flow ratemust be corrected for pressure and temperature. This requires three separateinstruments to measure differential pressure, pressure, and temperature. Thesesignals are sent to a flow computer to determine the mass flow rate. Thermalmass flow technology replaces all of this with one instrument that directlymeasures the mass flow rate of the gas.
Multi-Variable Transmitters
A multi-variable transmitter combines the function of the three transmitters(∆P, P, and T) and the flow computer into one transmitter. The multi-variabletransmitter measures the pressure and temperature of the gas, the pressuredrop and then calculates the mass flow.
While only one 4–20 mA signal is generally available, measurement of theother variables is available via HART® communication. The functionality ofthree transmitters in one device reduces the installation cost of differentialpressure mass flow measurement.
Multi-variable transmitters are frequently used with averaging pitot tubes.Turndown ratios in flow up to 8:1 are obtainable. This turndown ratio isbased on the maximum allowable flow rate that the averaging pitot tube candetect. The actual turndown rate for the user’s specific application will be less,depending upon the application. Limitations in low flow measurementcapabilities still exist.
Multi-variable transmitters are also integrated into some vortex flow transmit-ters. These instruments measure the actual flow rate using a vortex; then, alsomeasure the pressure and temperature and provide a correction to mass flow.These instruments tend to be rather expensive.
FlowComputer
P P T
Mass Flow
Actual to Mass Flow ConversionFigure 8

11
Thermal Mass Flow
Thermal Mass Flow offers many advantages over other, more traditional,methods of measuring gas flow.
1. Mass flow measurement. Thermal mass flow transmitters provide ameasurement of the mass flow rate of the gas based upon heat trans-fer. The gas flows past a heated surface creating a cooling effect. Heattransfer is caused by the mass (or molecular) flow of the gas providinga mass flow measurement. Correction of the gas flow rate for pressureand temperature is not required.
2. Excellent low flow sensitivity. Thermal technology can measure veloci-ties down to 10 standard feet per minute —much lower than anyother flow device. The heat transfer rate is greatest at low flow ratesand decreases as the flow rate increases. This makes this technologyespecially sensitive for low velocity measurement and high turndownrequirements.
3. Excellent turndown. The Magnetrol® Thermal Mass Flow Transmitteroffers the ability to measure the low velocities as well as high flowrates. This can provide a turndown rate of 100:1 or more dependingupon the application requirements and calibration of the instrument.
4. Low pressure drop. The insertion probe has little blockage of thepipe, thereby, creating very low pressure drops.
5. Ease in installation. Using an insertion probe, the instrument caneasily be installed in a pipe or duct. Many installations use a compres-sion fitting or a retractable probe assembly for inserting the probeinto the pipe.
6. Factory Calibrated. Each instrument is calibrated by MAGNETROLfor the application specific requirements and configured to the user’sspecifications. The instrument can be installed and placed directlyinto service without any need for field set up, calibration, oradjustment.
7. Lowest installed cost. When considering options to measure massflow, the TA2 has the lowest installed cost while providing excellentperformance. No additional instrumentation is required to obtain amass flow measurement.

12
MAGNETROL offers the TA2 thermal mass flow meter to meet a broadrange of user’s application requirements:
The sensor used with the MAGNETROL Thermal Mass Flow meter isillustrated in Figure 9.
The sensors on the TA2 are protected to prevent possible damage from “bot-toming out” when inserted into a pipe. This is an important consideration ifthe probe is installed into the pipe with a compression fitting. There are twosensors — a heated sensor (shown on the right) and a reference sensor whichmeasures the temperature of the gas. Precision matched Platinum RTDs areused for the temperature measurement. A mass balancing element is used toensure that both sensors will respond the same to changes in temperature.
RTD
HeaterMass BalancingElement
ReferenceSensor
TA2 Sensor
Model TA2 withInsertion Probe
Model TA2with Flow Body
Figure 9
13
Different Types of Thermal Mass Flow Meters
There are two different technologies utilized for thermal mass flow measurement.Both methods obtain the same results, and the user should not be concernedwhich method is used. MAGNETROL has experience with both technologies.
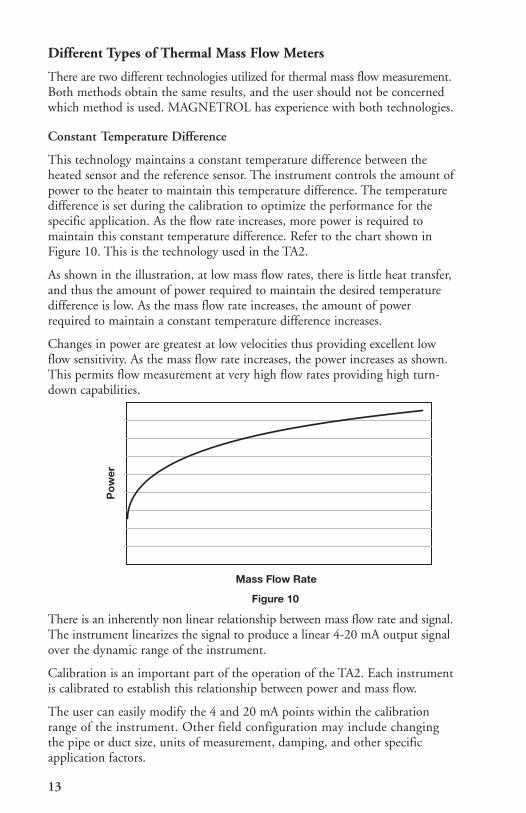
Constant Temperature Difference
This technology maintains a constant temperature difference between theheated sensor and the reference sensor. The instrument controls the amount ofpower to the heater to maintain this temperature difference. The temperaturedifference is set during the calibration to optimize the performance for thespecific application. As the flow rate increases, more power is required tomaintain this constant temperature difference. Refer to the chart shown inFigure 10. This is the technology used in the TA2.
As shown in the illustration, at low mass flow rates, there is little heat transfer,and thus the amount of power required to maintain the desired temperaturedifference is low. As the mass flow rate increases, the amount of powerrequired to maintain a constant temperature difference increases.
Changes in power are greatest at low velocities thus providing excellent lowflow sensitivity. As the mass flow rate increases, the power increases as shown.This permits flow measurement at very high flow rates providing high turn-down capabilities.
There is an inherently non linear relationship between mass flow rate and signal.The instrument linearizes the signal to produce a linear 4-20 mA output signalover the dynamic range of the instrument.
Calibration is an important part of the operation of the TA2. Each instrumentis calibrated to establish this relationship between power and mass flow.
The user can easily modify the 4 and 20 mA points within the calibrationrange of the instrument. Other field configuration may include changingthe pipe or duct size, units of measurement, damping, and other specificapplication factors.
Po
wer
Mass Flow Rate
Figure 10
14
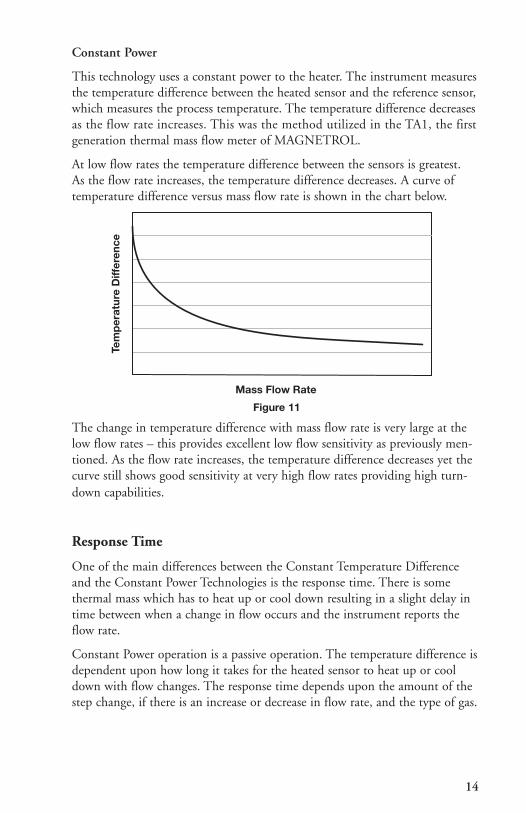
Constant Power
This technology uses a constant power to the heater. The instrument measuresthe temperature difference between the heated sensor and the reference sensor,which measures the process temperature. The temperature difference decreasesas the flow rate increases. This was the method utilized in the TA1, the firstgeneration thermal mass flow meter of MAGNETROL.
At low flow rates the temperature difference between the sensors is greatest.As the flow rate increases, the temperature difference decreases. A curve oftemperature difference versus mass flow rate is shown in the chart below.
The change in temperature difference with mass flow rate is very large at thelow flow rates – this provides excellent low flow sensitivity as previously men-tioned. As the flow rate increases, the temperature difference decreases yet thecurve still shows good sensitivity at very high flow rates providing high turn-down capabilities.
Response Time
One of the main differences between the Constant Temperature Differenceand the Constant Power Technologies is the response time. There is somethermal mass which has to heat up or cool down resulting in a slight delay intime between when a change in flow occurs and the instrument reports theflow rate.
Constant Power operation is a passive operation. The temperature difference isdependent upon how long it takes for the heated sensor to heat up or cooldown with flow changes. The response time depends upon the amount of thestep change, if there is an increase or decrease in flow rate, and the type of gas.
Tem
per
atur
eD
iffer
ence
Mass Flow Rate
Figure 11

15
The constant temperature difference operation used in the TA2 has a fasterresponse time to changes in flow. The TA2 controls the power to the heaterto always maintain a constant temperature difference between the referenceRTD and the RTD measuring the temperature of the heater. There is a PIDcontrol circuit in the TA2 with parameters set to provide the fastest responsepossible while maintaining steady operation once flow has been reached. Theresponse time of the TA2 to increasing and decreasing flow is shown below:
Temperature Compensation
Thermal Mass Flow Transmitters measure heat transfer and infer the massflow. This relationship between heat transfer and mass flow is obtained duringthe calibration which will be discussed in more detail later.
However, the gas properties that affect convective heat transfer are also affectedby changing temperature. These properties include thermal conductivity, gasviscosity, density and specific heat.
MAGNETROL has done extensive testing and analysis on the effect ofchanges in flow at different temperatures and has developed a proprietarymethod of providing temperature compensation over the entire operatingrange of the instrument. The chart below shows typical curves for the TA2showing the change in flow rate which occur at different process temperaturesdue to changes in gas properties.
Figure 12

16
MAGNETROL temperature compensates over the entire operatingtemperature range of the instrument. The TA2 measures the temperature andthen applies a correction in the flow measurement based upon the operatingtemperature.
The chart below shows the same data after we apply our temperaturecompensation.
These illustrations demonstrate the effectiveness of MAGNETROLtemperature compensation of the mass flow measurement based upon varyinggas properties.
Some thermal mass flow manufacturers just temperature compensate the elec-tronic circuit. What these manufacturers overlook is that the gas propertiesthat affect convective heat transfer are temperature dependent. Thus changingtemperature changes heat transfer. MAGNETROL provides real time temper-ature compensation that measures the temperature of the gas and automaticallycorrects the mass flow measurement based on temperature variations.
Without real time temperature compensation, the accuracy of the flow meas-urement will degrade with temperature changes. In some competitive designs,the rated accuracy is only good within 50° F of the calibration temperature.
Po
wer
mW
Mass Flow
100° F200° F300° F400° F
TA2 UncompensatedFlow Data
Po
wer
mW
Mass Flow
100° F200° F300° F400° F
TA2 CompensatedFlow Data
Figure 13
Figure 14
17
If the instrument does not provide a temperature measurement, the instru-ment cannot provide real time temperature compensation. This is especially aconsideration with other manufacturers’ constant temperature difference oper-ation; these designs have a reference RTD and a self heated RTD. The refer-ence RTD is used in the electronic circuit and does not provide temperaturemeasurement. Thus these instruments do not provide real time temperaturecompensation.
Another consideration in using a self heated RTD is that the resistance of theself-heated RTD changes with temperature. Without knowing the tempera-ture, the instrument cannot compensate for the changing resistance of theheated RTD.
MAGNETROL advanced real time temperature compensation is an importantfeature which provides superior performance for the Model TA2.
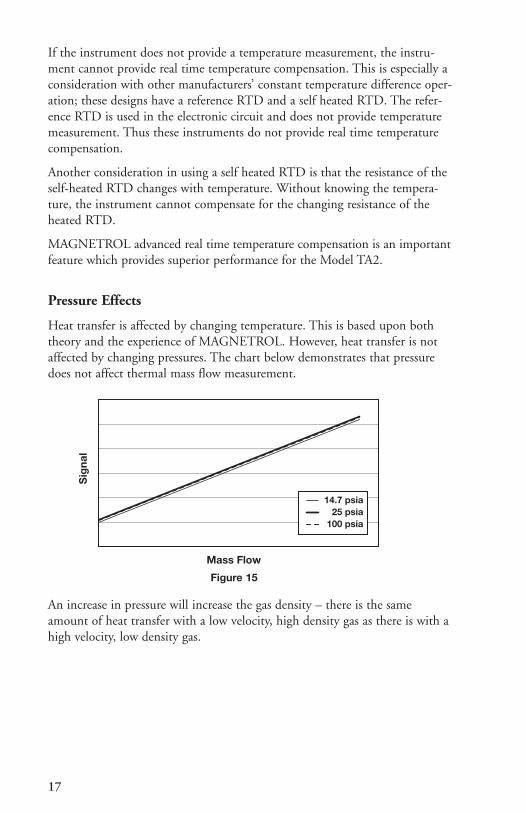
Pressure Effects
Heat transfer is affected by changing temperature. This is based upon boththeory and the experience of MAGNETROL. However, heat transfer is notaffected by changing pressures. The chart below demonstrates that pressuredoes not affect thermal mass flow measurement.
An increase in pressure will increase the gas density – there is the sameamount of heat transfer with a low velocity, high density gas as there is with ahigh velocity, low density gas.
Sig
nal
Mass Flow
14.7 psia25 psia
100 psia
Figure 15

18
Calibration
Each instrument is calibrated for the gas and the specified flow rate.Calibration involves placing the sensor in a flow bench, flowing a knownamount of gas over the sensor and measuring the signal. This is repeated for atleast 10 different flow rates. The calibration data of signal and flow rate is theninstalled in the instrument. The calibration is NIST traceable. A calibrationcertificate is included with the instrument and all calibration data is retainedat MAGNETROL for future reference.
When installed and placed into operation, the instrument measures a signal,and then converts that signal to the flow rate for the user’s application. Theinstrument adjusts for differences in area and blockage effect between thecalibration fixture and the field installation.
Each gas has different thermal properties that effect convective heat transfer.An instrument calibrated for air will not provide accurate measurements ifused for natural gas. Each instrument is calibrated for a specified gas over themaximum flow rate specified.
It is possible to have two sets of calibration data in the TA2. Thus the sameunit can be calibrated on two different gases such as natural gas and Oxygenallowing the user to swap between calibration tables. If the instrument is cali-brated for a specific gas, it is also calibrated on air. The gas data goes into onetable and the air data into the second table. If the user ever needs to check thecalibration on a flow bench, it would be possible to check the air data ratherthan the more expensive third party calibration for different gases.
Direct calibration on the actual gas is commonly performed and will providebest results. There are occasions where the user is looking for close and repeat-able flow measurements. In these cases MAGNETROL can provide an AirEquivalency calibration. Every time we perform a direct calibration on a gas,we also calibrate on air. This has given us an extensive database which comparesthe velocity of air to the velocity of gas to produce the same signal. Thefollowing shows a typical air equivalency curve.
Figure 16

19
Using this data permits us to calibrate the TA2 on air and then apply this datato adjust for the specified gas. It is also possible for the user to change airequivalency factors in the field for different gases further increasing the flexi-bility of this instrument.
In some cases it is not possible to flow a gas or gas mixture for the calibration.This can occur with a gas mixture where it is not possible to create the samegas mixture for the calibration. This can also occur for safety reasons where somegases cannot be handled in a flow bench. When either of these two situationsoccur, MAGNETROL can perform a gas correlation. For these calibrations wecalibrate on two different gases with known thermal properties. This defines theheat transfer characteristics of the sensor. By knowing the thermal propertiesof the gas or gas mixture it is possible to correlate the data from the twoindividual calibration gases to obtain calibration data for the specified gas.
Each instrument has its own unique calibration. The sensor and the electronicsare a matched pair—each has a serial number to enable the units to bematched in the field. Previously, if the probe needs to be replaced, the probeand associated electronics must be calibrated together as a unit. This has beena difficulty with this technology. There are tolerances in both the probe andthe electronics which effect the calibration. With the development of the TA2,MAGNETROL has developed a method by which the probe (or circuitboards) can be field replaced. A new calibration certificate will be providedwith the replacement probe and the user will enter these new probe calibrationfactors into the instrument using the keypad and display, HART® orPACTware™ software.
The cable length is totally independent of the calibration. This enables thecustomer to provide their own cable or to change the cable length in the field.Some competitors’ units require that the instrument be calibrated with thespecified cable length, and any change in cable will affect the accuracy.
Calibration Verification
Once a thermal flow meter is calibrated there is the question of how to deter-mine if the unit remains in calibration. One method is to remove the unit andreturn it to the original manufacturer for recalibration. This requires having aspare flow meter or operating without the flow meter while it is being recali-brated. The actual cost of the recalibration can become expensive.
There are better methods. Some manufacturers claim that the calibration oftheir flow meters can be verified by simulating a signal and checking that theoutput matches the expected flow. However, all this does is to check that thetransmitter is performing the correct calculations; there is no check of the sensor.
From our experience we believe that the TA2 requires a one time calibrationto establish the relationship between heat transfer and mass flow. This is a onetime, permanent calibration unless something happens to the sensor. WhenTA2s have been returned, we find that the new calibration data matches theoriginal calibration.

20
MAGNETROL understands the user’s desire to verify calibration and hasdeveloped a method of checking both the transmitter and the sensor. Theseare simple tests which can be performed in the Instrument Shop and do notrequire returning the TA2 to MAGNETROL.
• The transmitter can be checked by simulating an input and verifyingthat the TA2 calculates the flow shown on the calibration certificate.This can easily be done using the keypad and display, using HART, orPACTware software.
• It is more difficult to check the operation of the sensor. Consider thatthe TA2 measures heat transfer. The sensor can be checked by creating acondition which produces a known and repeatable amount of heat trans-fer. This is done at two points—in still air to check no flow and in awater bath to simulate a high flow. This test can be done at some futuredate and when the values compare with initial values the user can beassured that the heat transfer characteristics of the flow meter are thesame and the TA2 remains in calibration.
This calibration verification test can easily be performed in the InstrumentShop. The initial, base line values are determined during the original calibra-tion. These values are stored in the TA2 memory and are found on the calibra-tion certificate. When the verification test is made, the TA2 firmware providessimple step by step procedures for conducting the test. The validation test canalso be performed using HART or PACTware.
Calibration vs. Configuration
Sometimes users will want to calibrate an instrument in the field. Often whatthey really want to do is to configure the instrument in the field. Calibrationrequires a flow bench; configuration of the instrument for the specific applica-tion is very simple permitting the user to change pipe or duct size, zero andspan of the 4-20 mA signal, units of measurement, installation factors. Theuser has full capability to configure the TA2 to fit the application.
Accuracy
The accuracy of the TA2 is well accepted in the industry. Our stated accuracyis ± 1% of reading plus 0.5% of full scale. In reality the accuracy will be betterthan this. MAGNETROL uses a spline curve where the calibration curve goesdirectly through the data points. The following curve shows actual calibrationdata points, allowable error with other data points taken in between thecalibration data points. This shows that the accuracy is better than 1% ofreading over a turndown rate of 65 to 1.

21
This also shows that the greater the number of data points the better the over-all accuracy. MAGNETROL uses a minimum of 10 data points and sometimesup to 30 data points depending upon the calibration range. Other manufac-turers may only use a zero flow point and 4 calibration data points yet claimthe same accuracy.
The accuracy component is made up of both a measurement of reading and apercentage of overall span. At 100% of full scale, the accuracy will be ±1.5 %.As the flow decreases, the accuracy is represented in the chart above.
Flow Profile
While MAGNETROL goes to great extent to provide an instrument with excel-lent accuracy, our accuracy is the calibration accuracy. When the probe is insertedinto a pipe or duct, the sensor will measure the flow at that point. Thereforethe measured flow is affected by the flow profile at the location of the sensor.
When a fluid flows in a pipe, it develops a flow profile. A flow profile willeither be laminar or turbulent. These terms are sometimes misused.
In laminar flow, each fluid particle travels in a straight line as it flows throughthe pipe. Refer to Figure 18.
The fluid moves in layers with each layer sliding over the other. The velocityof the fluid at the wall is zero and increases as the distance from the wallincreases as shown in Figure 20.
0102030405060
-5.0%
-4.0%
-3.0%
-2.0%
-1.0%
0.0%
1.0%
2.0%
3.0%
4.0%
5.0%
0 5,000 10,000 15,000 20,000
Turndown
Acc
ura
cy
Flow Rate - SCFH
% readingAllowableCal Points% Cal Range
Figure 17

22
With turbulent flow, the flow path consists of eddies and swirls within thefluid; there is intermixing as the fluid flows. Typical turbulent flow is shown inFigure 19.
Turbulent flow and laminar flow have very specific definitions based upon theReynolds number.
Reynolds Number is defined as:
Reynolds Number shows the relationship between:
V = Velocity
D = Diameter
= Density
µ = Viscosity
Reynolds numbers less than 2,000 are laminar flow, larger than 4,000 are tur-bulent flow, and between 2,000 and 4,000 are considered transition zone.
The flow profile in the pipe for laminar flow and turbulent flow are consider-ably different. With laminar flow the flow moves straight ahead without mix-ing. The velocity at the wall is zero and the velocity profile across the pipe willlook something like Figure 20. Because there is no mixing, the velocity at thecenterline is much greater than the average velocity.
Turbulent Flow
Flow
Re =VDµ[ ]
Laminar Flow
Flow
Figure 18
Figure 19

A fully developed turbulent flow profile is shown in Figure 21.Virtually all gas flow applications will be in the turbulent flow area.
Theoretically the velocity at the pipe wall is zero and the velocity at thecenterline is approximately 20% higher than the average velocity. Inturbulent flow, the flow profile will change slightly with Reynolds Numberas shown in Figure 22.
23
V max
0.07
V avg
V avg
0.13 D
0.15 D
V avg
V max
RD < 2000
RD < 4000
RD < 3,000,000
Laminar Flow Profile
Turbulent Flow Profile
Laminar vs. Turbulent Flow Profile
Turbulent Flow
Laminar Flow Profile
Figure 20
Figure 21
Figure 22
In turbulent flow, the location of the average velocity will range between0.07 D (1⁄14 the diameter) to 0.13 D (1⁄8 the diameter), depending upon theReynolds number. At this location, changes in velocity (Reynolds number)will change the flow profile.
The center line velocity in turbulent flow is approximately 20% greater thanthe average velocity. The lower portion of Figure 20 shows a laminar flowprofile — the centerline velocity is approximately twice the average velocity.
Another factor, which is not shown, but will also affect the velocity profile, isthe roughness factor of the pipe. Rough pipe will have a slightly differentvelocity profile than smooth pipe.
There are difficulties locating the sensor at the point of average velocity. Thislocation may be difficult to accurately determine as the profile will change withchanges in velocity. The velocity profile is very sensitive at this point; a slightvariation in flow profile will cause a major change in the flow measurement.
The best place to locate the sensor is at the centerline of the pipe. The pipecenterline is easy to determine, and changes in velocity will have minimaleffect on the flow profile. The disadvantage is that the centerline velocity of afully developed turbulent flow profile is theoretically 20% higher than theaverage velocity. This 20% factor between center line velocity and averagevelocity is taken into account in the calculations of the TA2.
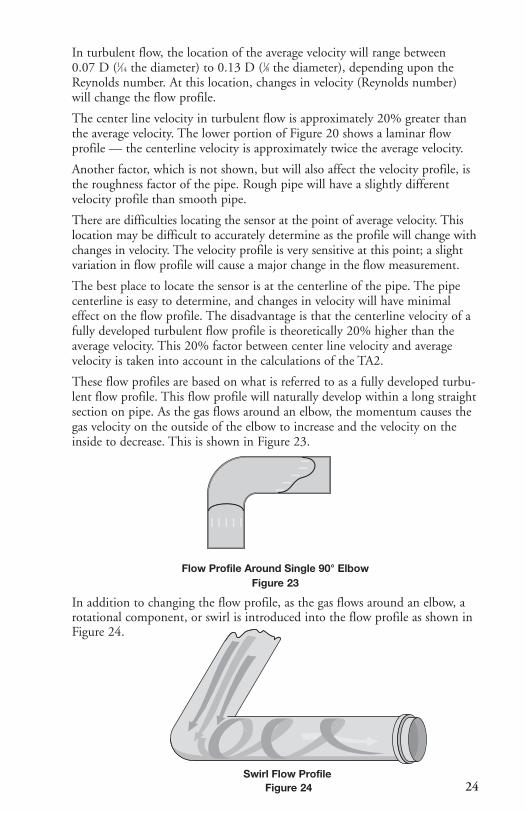
These flow profiles are based on what is referred to as a fully developed turbu-lent flow profile. This flow profile will naturally develop within a long straightsection on pipe. As the gas flows around an elbow, the momentum causes thegas velocity on the outside of the elbow to increase and the velocity on theinside to decrease. This is shown in Figure 23.
In addition to changing the flow profile, as the gas flows around an elbow, arotational component, or swirl is introduced into the flow profile as shown inFigure 24.
Swirl Flow Profile
Flow Profile Around Single 90° Elbow
24
Figure 23
Figure 24

25
With sufficient straight run of pipe, swirl patterns will dissipate and a fullydeveloped turbulent flow profile will redevelop. Historically, 10 diametersupstream and 5 diameters downstream was considered as adequate straightrun. Recent testing by NIST has demonstrated that these dimensions may notbe sufficient, especially if there are two elbows. MAGNETROL brochure 54-131provides additional information on recommended probe locations.
For flow measurement in larger ducts, a single probe can be used to obtain arepeatable flow measurement suitable for combustion air flow applications. Insome applications, the probe has been inserted directly following an elbow.Refer to Figure 25. The flow profile in the duct is far from ideal, howeverrepeatable flow measurements are obtainable and can be used for the combus-tion control system.
The effect of flow profile variations and swirl patterns may result in the probebeing positioned at a location where the flow profile is different than the flowprofile during calibration.
For most process flow measurement, there is insufficient room to obtain a per-fect flow profile. The basic rule is to attempt to get as much straight run aspossible and position the probe to get two to three times the upstream asdownstream distance.
Installation Options
There are various options for installing the probe into the pipe or the duct.Perhaps the most common and simplest is the compression fitting shown inthe Figure 26 below.
Flow Measurement in Larger Ducts
Typical Probe Installation
Figure 25
Figure 26

26
Insertion probes with compression fittings can fit into pipe sizes11⁄2" and larger.
A standard bored-through compression fitting is commercially availablethrough MAGNETROL or Swagelok, Parker-Hannifin, and others. Either a 3⁄4"NPT or 1" NPT for 3⁄4" tubing is useable.
Compression fittings are available with either Teflon® ferrules or stainless steelferrules. The Teflon® ferrules are useable for pressures up to 100 psig and havethe advantage of being able to slide along the probe and readjust the position.Stainless steel ferrules are suitable for much higher pressures; however, once theferrules are tightened and swaged onto the probe they cannot be removed. Thishas an advantage to ensure that the probe is reinserted into the same location.
Another benefit of using compression fittings with Teflon® ferrules is the abilityto interchange units in the field. Providing that the probe is long enough andthe velocity range is covered, the same instrument can be used in multiplepipe sizes, or an additional unit kept as a spare. Refer to Figure 27.
Hot tap Retractable Probe Assembly is also available for the TA2 probe.Designs are available for different pressure ranges.
Other process connections include NPT threads, BSP threads, and ANSI andDIN flanges. We recommend locating the end of the probe one inch (25 mm)past the center line of the pipe. This places the sensor at the centerline.
Probe Installation in Different Pipe Sizes
Figure 27

27
Accuracy vs. Repeatability
While most users talk about accuracy, for most process flow applications,repeatability of flow measurement is most important. Does the flow transmit-ter measure the same today, for the same set of conditions, as it did last week?From this respect, thermal mass flow measurement is excellent. Our repeata-bility of flow measurement is specified as 0.5% of reading.
While our absolute accuracy is important, and we have gone to great extent tobe able to calibrate the instrument to the stated accuracy, we have no controlover external factors.
Factors which can affect total system accuracy, include:
1. Blockage effect. The sensor and probe block a portion of the flowpath, reducing the cross sectional flow area. MAGNETROL takes thisblockage into account with area compensation built into the software.This feature is not available on all competitors’ units.
2. Error in entering flow area. If this information is entered inaccurately,the flow rate will be in error. MAGNETROL uses nominal pipedimensions found in various handbooks; however ASME permitstolerance in wall thickness which can effect pipe ID.
3. Standard conditions are not always standard. The TA2 permits theuser to select the desired standard conditions. The TA2 will adjust theflow measurement based on different STP conditions. An error ofapproximately 8% will occur with differences in STP conditionsbetween 70° F and 32° F.
4. Flow profile. As discussed above, flow profile can have a significantimpact on flow measurement. The TA2 has the ability to correct theflow measurements for flow profile.
5. Inserting a probe in a tee. Calibration is typically done in a pipe. Ifthe probe is inserted in a tee, the flow profile has changed and thedimensions of a tee are larger than the dimensions of a pipe. Thiscombination can account for errors up to 20%.
MAGNETROL has taken into account many factors to provide the user withthe ability to configure the instrument to their own requirements, thereby,providing the best possible overall performance.
28
Limitations of Technology
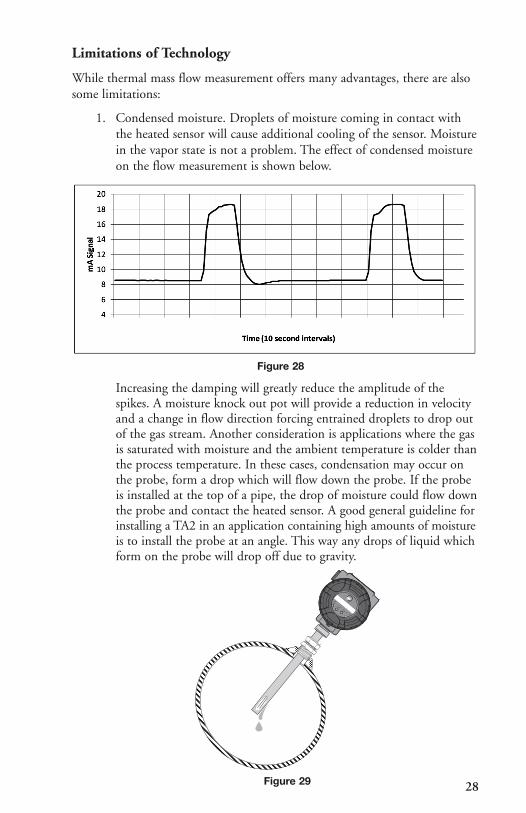
While thermal mass flow measurement offers many advantages, there are alsosome limitations:
1. Condensed moisture. Droplets of moisture coming in contact withthe heated sensor will cause additional cooling of the sensor. Moisturein the vapor state is not a problem. The effect of condensed moistureon the flow measurement is shown below.
Increasing the damping will greatly reduce the amplitude of thespikes. A moisture knock out pot will provide a reduction in velocityand a change in flow direction forcing entrained droplets to drop outof the gas stream. Another consideration is applications where the gasis saturated with moisture and the ambient temperature is colder thanthe process temperature. In these cases, condensation may occur onthe probe, form a drop which will flow down the probe. If the probeis installed at the top of a pipe, the drop of moisture could flow downthe probe and contact the heated sensor. A good general guideline forinstalling a TA2 in an application containing high amounts of moistureis to install the probe at an angle. This way any drops of liquid whichform on the probe will drop off due to gravity.
Figure 28
Figure 29

29
2. Changing gas compositions. The instrument is calibrated for theheat transfer created by a particular gas composition. If the gascomposition changes, the heat transfer rate will change, which affectsthe overall accuracy of flow measurement. Minor changes incomposition will not have a noticeable effect.
3. Buildup. Buildup on the sensor will reduce the heat transfer rate, thuscreating less cooling and indicating a lower flow than actual. Forapplications where buildup may be present, it is suggested that afterstartup, the condition of the sensor is periodically checked and ahistory of frequency of cleaning be developed and followed. The useof a Retractable Probe Assembly or simple ball valve with compressionfitting permits the probe to be removed during normal operation.
Applications
There are many applications for thermal dispersion mass flow measurement.Some of the more typical and successful applications are:
1. Compressed air/gas. Measurement and totalization of compressed airor gas flow is utilized for internal plant allocation and measurementof overall consumption. Can be used for detecting and identifyinggeneral location of leaks. Government estimates that leakage canaccount for 20–30% of compressed air generation. Eliminating asmall 1⁄4" leak can result in cost savings up to $4,000 in a year.
2. Combustion air flow. Measurement of the mass flow rate of combus-tion air is desirable when determining fuel to air mixtures for propercombustion control. Thermal mass measurement is very appropriatedue to combination of direct mass measurement, excellent low flowsensitivity, wide turndown, and low pressure drops.
3. Natural gas. In-plant measurement of natural gas flows to boiler, fur-naces, dryers, and heaters is an ideal application for thermal mass flowmeasurement. Knowing the natural gas usage of individual combus-tion sources can help identify efficiency leading to reduced fuel usage.The composition of natural gas may vary slightly during the year.These changes in heat transfer characteristics of the gas are minor andwill not have any noticeable affect on TA2 performance.
4. Green House Gas Emissions. The EPA requires many facilities toreport yearly their green house gas emissions from each combustionsource. A TA2 is an ideal method of determining the natural gasusage and then follow the EPA guidelines to calculate the green housegas emissions.

30
Difficult Applications
1. Flare lines. Thermal dispersion mass flow offers many benefits forflare lines—wide turndown, low flow detection, and low pressure drop.Thermal flow measurement has successfully been used in this application.However, consideration must be given to changes in gas composition.
Different gases have different thermal properties that affect convectiveheat transfer. Changes in gas composition will change heat transferrates, resulting in inaccuracies in flow measurement.
If used in a flare line with a consistent gas composition such as naturalgas, there is no difficulty. However, if used in an application with widevariations in gas composition, especially major changes in concentrationof hydrogen, the user must be made aware of the considerable potentialfor inaccurate flow measurement. Hydrogen cools the sensor muchgreater than other gases; a small flow of hydrogen will appear like amuch larger flow of other hydrocarbons.
In those applications with varying gas compositions, a TA2 will providea relative flow measurement. It can be used to provide an indicationof changes and magnitude in flow rate as well as duration of a releaseto the flare. Often a TA2 will be used to monitor the flow to the flarefrom individual production units with a different technology flowmeter measuring the main flare flow for environmental reporting orobtaining a mass balance. Considering that the flow meter is used forfor flow monitoring rather than flow measurement considerationshould be given to a simple calibration rather than trying to calibratefor an exact gas mixture.
2. Stacks. While thermal mass flow measurement has successfully beenused for measurement of stack flow, generally multiple point arraysystems are utilized for large diameter stacks. Another option is to usefour or more single point probes inserted from opposite sides of thestack. An external device is needed to average the flow rates.
Unique Features
There are several unique features of the TA2:
1. Temperature compensation over the entire dynamic range of theinstrument, by measuring the temperature and adjusting the flowmeasurement for changes in physical properties. For more information,review the section on Temperature Compensation.
31
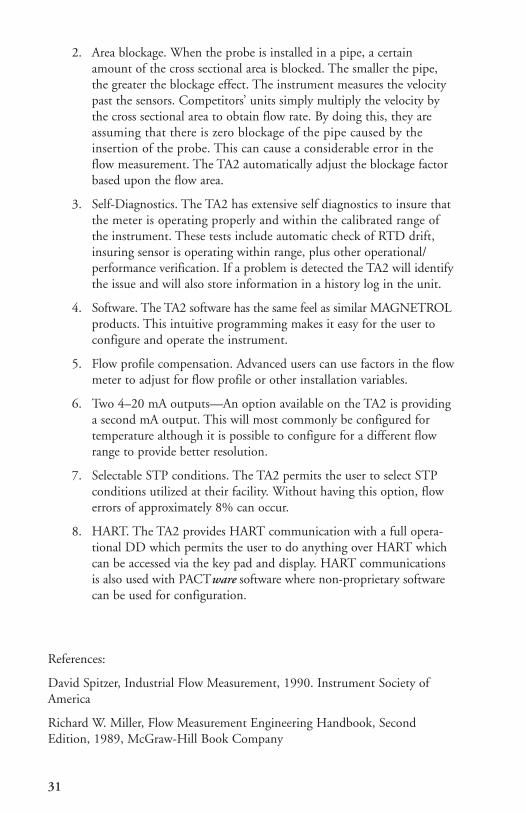
2. Area blockage. When the probe is installed in a pipe, a certainamount of the cross sectional area is blocked. The smaller the pipe,the greater the blockage effect. The instrument measures the velocitypast the sensors. Competitors’ units simply multiply the velocity bythe cross sectional area to obtain flow rate. By doing this, they areassuming that there is zero blockage of the pipe caused by theinsertion of the probe. This can cause a considerable error in theflow measurement. The TA2 automatically adjust the blockage factorbased upon the flow area.
3. Self-Diagnostics. The TA2 has extensive self diagnostics to insure thatthe meter is operating properly and within the calibrated range ofthe instrument. These tests include automatic check of RTD drift,insuring sensor is operating within range, plus other operational/performance verification. If a problem is detected the TA2 will identifythe issue and will also store information in a history log in the unit.
4. Software. The TA2 software has the same feel as similar MAGNETROLproducts. This intuitive programming makes it easy for the user toconfigure and operate the instrument.
5. Flow profile compensation. Advanced users can use factors in the flowmeter to adjust for flow profile or other installation variables.
6. Two 4–20 mA outputs—An option available on the TA2 is providinga second mA output. This will most commonly be configured fortemperature although it is possible to configure for a different flowrange to provide better resolution.
7. Selectable STP conditions. The TA2 permits the user to select STPconditions utilized at their facility. Without having this option, flowerrors of approximately 8% can occur.
8. HART. The TA2 provides HART communication with a full opera-tional DD which permits the user to do anything over HART whichcan be accessed via the key pad and display. HART communicationsis also used with PACTware software where non-proprietary softwarecan be used for configuration.
References:
David Spitzer, Industrial Flow Measurement, 1990. Instrument Society ofAmerica
Richard W. Miller, Flow Measurement Engineering Handbook, SecondEdition, 1989, McGraw-Hill Book Company

32
Common Conversion Factors
Atmosphere × 1.01325 = Bars× 33.8995 = Feet of water (32° F)× 29.92125 = Inches of Mercury (32° F)× 406.794 = Inches of Water (32° F)× 101.325 = Kilopascals× 760 = mm Mercury (0° C)× 1.01325 x 105 = Newtons/square meter× 1.01325 x 105 = Pascals× 14.696 = Pounds/square inch× 760 = Torr
Bar × 0.986923 = Atmospheres× 100 = Kilopascals (Kpa)× 14.5038 = Pounds/square inch
Cubic Feet × 0.028316 = Cubic meters× 28.31605 = Liters
Cubic meters × 35.31467 = Cubic feet× 1000 = Liters
Feet × 30.48 = Centimeters× 0.3048 = Meters
Inches × 0.083333 = Feet× 25.4 = mm× 0.0254 = Meters
Kilograms × 2.2046 = Pounds
Kilopascal (Kpa) × 0.1450377 = Pounds/ sq inch× 4.01474 = Inches water
Meters × 3.2808 = Feet× 1000 = mm
NM3/H × 0.5886 = SCFM× 1000 = l/h
Pounds/sq inch × 0.068046 = Atmospheres× 0.0689476 = Bar× 27.6807 = Inches water (32° F)× 6.89476 = Kilopascals
Square feet × 144 = Square inches× 0.09290304 = Square meters
Square meters × 10.7639 = Square feet× 1550.0031 = Square inches× 1 × 106 = Square mm
SCFM × 1.69990 = NM3/H× 1,698.96 = Nl/h
Temperature:
T° C = (T° F -32)/1.8T° F = 1.8 × T° C + 32T° K = T° C + 273.15T° R = T° F + 459.67

33
Gas
Chem
icalForm
ulaMolecular
Weig
htDensity
lb/ft 3
(1)Density
kg/m
3(2)
Gravity
SG
Air
-28.96
0.07481.2740
1.000Ammonia
NH3
17.030.0440
0.74910.588
Argon
Ar
39.950.1032
1.75721.379
65%Methane,
Bio
Gas
35%CO2
25.830.0668
1.13630.892
Butane
C4 H
1058.12
0.15022.5567
2.007Butylene
C4 H
856.11
0.14502.4681
1.937Carb
onDioxid
eCO2
44.010.1137
1.93591.520
Carb
onMonoxid
eCO
28.010.0724
1.23210.967
Chlorine
Cl2
70.910.1833
3.12052.449
Ethane
C2 H
630.07
0.07771.3227
1.038Ethylene
C2 H
428.05
0.07251.2340
0.969Helium
He
4.000.0103
0.17610.138
Hexane
C6 H
1486.18
0.22273.7908
2.976Hyd
rogenH2
2.020.0052
0.08870.070
Methane
CH4
16.040.0415
0.70570.554
Nitrogen
N2
28.010.0724
1.23230.967
Oxygen
O2
32.000.0827
1.40761.105
Pentane
C5 H
1272.15
0.18653.1738
2.491Prop
aneC3 H
844.10
0.11401.9397
1.523Prop
yleneC3 H
642.08
0.10881.8510
1.453Sulfur
Dioxid
eSO2
64.060.1656
2.81912.213
1.Gas
Density
at70°
Fand
14.7psia
2.Gas
Density
at0°
Cand
1bar
Gas
Density
atStand
ardCond
itions

CORPORATE HEADQUARTERS:5300 Belmont Road • Downers Grove, Illinois 60515-4499 USA
Phone: 630-969-4000 • Fax: 630-969-9489magnetrol.com • [email protected]
EUROPEAN HEADQUARTERS:Heikensstraat 6 • 9240 Zele, Belgium
Phone: 052 45.11.11 • Fax: 052 45.09.93
BRAZIL: Av. Dr. Mauro Lindemberg Monteiro, 185, Quadrante 16 • CEP 06278-010 • Osasco • São Paulo
CANADA: 145 Jardin Drive, Units 1 & 2 • Concord, Ontario L4K 1X7
CHINA: Plant 6, No. 191, Huajin Road • Minhang District • Shanghai 201108
DEUTSCHLAND: Alte Ziegelei 2–4 • D-51491 Overath
DUBAI: DAFZA Office 5EA 722, P.O. Box 293671 • Dubai, United Arab Emirates
INDIA: C-20 Community Centre • Janakpuri, New Delhi 110 058
ITALIA: Via Arese, 12 • 20159 Milano
SINGAPORE: 33 Ubi Avenue 3 • #05-10 Vertex • Singapore 408868
UNITED KINGDOM: Regent Business Centre • Jubilee Road • Burgess Hill, West Sussex RH15 9TL
Magnetrol, Magnetrol logotype and Thermatel are registered trademarks of Magnetrol International, Incorporated.HART® is a registered trademark of the HART Communication Foundation.
PACTware™ is trademark of PACTware Consortium.Teflon® is a registered trademark of DuPont.
Copyright © 2012 Magnetrol International, Incorporated.All rights reserved. Printed in the USA.Bulletin: 54-621.4 • Effective: April 2012
Worldwide Level and Flow SolutionsSM


