536 IEEE/ACM TRANSACTIONS ON NETWORKING,...
16
536 IEEE/ACM TRANSACTIONS ON NETWORKING, VOL. 21, NO. 2, APRIL 2013 Mobile Data Of floading: How Much Can WiFi Deliver? Kyunghan Lee, Associate Member, IEEE, Joohyun Lee, Student Member, IEEE, Yung Yi, Member, IEEE, Injong Rhee, Member, IEEE, and Song Chong, Member, IEEE Abstract—This paper presents a quantitative study on the per- formance of 3G mobile data offloading through WiFi networks. We recruited 97 iPhone users from metropolitan areas and col- lected statistics on their WiFi connectivity during a two-and-a-half- week period in February 2010. Our trace-driven simulation using the acquired whole-day traces indicates that WiFi already offloads about 65% of the total mobile data traffic and saves 55% of battery power without using any delayed transmission. If data transfers can be delayed with some deadline until users enter a WiFi zone, substantial gains can be achieved only when the deadline is fairly larger than tens of minutes. With 100-s delays, the achievable gain is less than only 2%–3%, whereas with 1 h or longer deadlines, traffic and energy saving gains increase beyond 29% and 20%, respectively. These results are in contrast to the substantial gain (20%–33%) reported by the existing work even for 100-s delayed transmission using traces taken from transit buses or war-driving. In addition, a distribution model-based simulator and a theoret- ical framework that enable analytical studies of the average per- formance of offloading are proposed. These tools are useful for net- work providers to obtain a rough estimate on the average perfor- mance of offloading for a given WiFi deployment condition. Index Terms—Delayed transmission, experimental networks, mobile data offloading, mobility. I. INTRODUCTION M OBILE data traffic is growing at an unprecedented rate. Many researchers from networking and financial sectors [2], [3], [18], [27] forecast that by 2014, an average broadband mobile user will consume 7 GB of traffic per month, which is 5.4 times more than today’s average user consumes per month, and the total mobile data traffic throughout the world Manuscript received January 06, 2011; revised October 21, 2011 and March 29, 2012; accepted May 29, 2012; approved by IEEE/ACM TRANSACTIONS ON NETWORKING Editor A. Feldmann. Date of publication November 16, 2012; date of current version April 12, 2013. This work was supported in part by the National Science Foundation under Grants CNS-0910868 and CNS-1016216 and the Korea Communications Commission (KCC), Korea, under the R&D Program KCA-2012-11913-05004 supervised by the Korea Communications Agency (KCA). (Corresponding author: J. Lee) K. Lee is with the School of Electrical and Computer Engineering, Ulsan National Institute of Science and Technology (UNIST), Ulsan 689-798, Korea (e-mail: [email protected]). J. Lee, Y. Yi, and S. Chong are with the Department of Electrical Engi- neering, KAIST, Daejeon 305-701, Korea (e-mail: [email protected]; [email protected]; [email protected]). I. Rhee is with the Department of Computer Science, North Carolina State University, Raleigh, NC 27695 USA (e-mail: [email protected]). Color versions of one or more of the figures in this paper are available online at http://ieeexplore.ieee.org. Digital Object Identifier 10.1109/TNET.2012.2218122 will reach about 3.6 EB per month, 39 times increase from 2009 at a compound annual rate of 108%. It is also predicted by Cisco that about 66% of this traffic is mobile video data [2]. The main drive behind this explosive growth in traffic demand is rapid increase in the number of smart phones and tablets that offer ubiquitous Internet access and proliferation of traffic-in- tensive applications for such smart devices (e.g., applications providing cloud-based services). There are several solutions to this explosive traffic growth problem. The first is to scale the network capacity by building out more cell towers and base stations of smaller cell sizes (e.g., picocell, femtocell) or upgrading the network to the next-generation networks such as Long Term Evolution (LTE) and WiMAX. However, this is not a winning strategy, espe- cially under a flat price structure where revenue is independent of data usage. It is interesting to note that most of these data consumptions come from a small percentage of mobile users: While smartphone users constitute about 3% of the total users in AT&T, they consume about 40% of the network traffic as of the end of 2009 [18]. Besides, expanding the network capacity may even exacerbate the problem by encouraging more data usages since the first deployment of the 4G networks is likely targeting the densely populated metropolitan areas like Manhattan, NY, or San Francisco, CA. The second is to adopt a usage-based price plan that limits heavy data usages. While price restructuring is rather inevitable, pure usage-based plans are likely to backfire by singling out a particular sector of user groups, e.g., smartphone users, which have the highest potential for future revenue growth. WiFi offloading seems the most viable solution at the mo- ment. Building more WiFi hotspots is significantly cheaper than network upgrades and build-out. Many users are also installing their own WiFi access points (APs) at homes and work. If a ma- jority of traffic is redirected through WiFi networks, carriers can accommodate the traffic growth only at a far lower cost. Given that there is already a widespread deployment of WiFi networks, WiFi offloading addresses the “time-to-capacity” issue for the currently pressing need of additional network capacity. There are two types of offloading: on-the-spot and delayed [20]. On-the-spot offloading is to use spontaneous connectivity to WiFi and transfer data on the spot. Most of the current smartphones support on-the-spot offloading by default. In delayed offloading, each data transfer is associated with a deadline, and the data transfer is resumed whenever getting in the coverage of WiFi until the transfer is complete. If the transfer does not finish within its deadline, cellular networks 1063-6692 © 2012 IEEE. Personal use is permitted, but republication/redistribution requires IEEE permission. See http://www.ieee.org/publications_standards/publications/rights/index.html for more information.
Transcript of 536 IEEE/ACM TRANSACTIONS ON NETWORKING,...

536 IEEE/ACM TRANSACTIONS ON NETWORKING, VOL. 21, NO. 2, APRIL 2013
Mobile Data Offloading: How Much CanWiFi Deliver?
Kyunghan Lee, Associate Member, IEEE, Joohyun Lee, Student Member, IEEE, Yung Yi, Member, IEEE,Injong Rhee, Member, IEEE, and Song Chong, Member, IEEE
Abstract—This paper presents a quantitative study on the per-formance of 3G mobile data offloading through WiFi networks.We recruited 97 iPhone users from metropolitan areas and col-lected statistics on theirWiFi connectivity during a two-and-a-half-week period in February 2010. Our trace-driven simulation usingthe acquired whole-day traces indicates that WiFi already offloadsabout 65% of the total mobile data traffic and saves 55% of batterypower without using any delayed transmission. If data transferscan be delayed with some deadline until users enter a WiFi zone,substantial gains can be achieved only when the deadline is fairlylarger than tens of minutes. With 100-s delays, the achievable gainis less than only 2%–3%, whereas with 1 h or longer deadlines,traffic and energy saving gains increase beyond 29% and 20%,respectively. These results are in contrast to the substantial gain(20%–33%) reported by the existing work even for 100-s delayedtransmission using traces taken from transit buses or war-driving.In addition, a distribution model-based simulator and a theoret-ical framework that enable analytical studies of the average per-formance of offloading are proposed. These tools are useful for net-work providers to obtain a rough estimate on the average perfor-mance of offloading for a given WiFi deployment condition.
Index Terms—Delayed transmission, experimental networks,mobile data offloading, mobility.
I. INTRODUCTION
M OBILE data traffic is growing at an unprecedentedrate. Many researchers from networking and financial
sectors [2], [3], [18], [27] forecast that by 2014, an averagebroadband mobile user will consume 7 GB of traffic per month,which is 5.4 times more than today’s average user consumes permonth, and the total mobile data traffic throughout the world
Manuscript received January 06, 2011; revised October 21, 2011 and March29, 2012; accepted May 29, 2012; approved by IEEE/ACM TRANSACTIONS ONNETWORKING Editor A. Feldmann. Date of publication November 16, 2012;date of current version April 12, 2013. This work was supported in part by theNational Science Foundation under Grants CNS-0910868 and CNS-1016216and the Korea Communications Commission (KCC), Korea, under the R&DProgram KCA-2012-11913-05004 supervised by the Korea CommunicationsAgency (KCA). (Corresponding author: J. Lee)K. Lee is with the School of Electrical and Computer Engineering, Ulsan
National Institute of Science and Technology (UNIST), Ulsan 689-798, Korea(e-mail: [email protected]).J. Lee, Y. Yi, and S. Chong are with the Department of Electrical Engi-
neering, KAIST, Daejeon 305-701, Korea (e-mail: [email protected];[email protected]; [email protected]).I. Rhee is with the Department of Computer Science, North Carolina State
University, Raleigh, NC 27695 USA (e-mail: [email protected]).Color versions of one or more of the figures in this paper are available online
at http://ieeexplore.ieee.org.Digital Object Identifier 10.1109/TNET.2012.2218122
will reach about 3.6 EB per month, 39 times increase from2009 at a compound annual rate of 108%. It is also predictedby Cisco that about 66% of this traffic is mobile video data [2].The main drive behind this explosive growth in traffic demandis rapid increase in the number of smart phones and tablets thatoffer ubiquitous Internet access and proliferation of traffic-in-tensive applications for such smart devices (e.g., applicationsproviding cloud-based services).There are several solutions to this explosive traffic growth
problem. The first is to scale the network capacity by buildingout more cell towers and base stations of smaller cell sizes(e.g., picocell, femtocell) or upgrading the network to thenext-generation networks such as Long Term Evolution (LTE)and WiMAX. However, this is not a winning strategy, espe-cially under a flat price structure where revenue is independentof data usage. It is interesting to note that most of these dataconsumptions come from a small percentage of mobile users:While smartphone users constitute about 3% of the total usersin AT&T, they consume about 40% of the network trafficas of the end of 2009 [18]. Besides, expanding the networkcapacity may even exacerbate the problem by encouragingmore data usages since the first deployment of the 4G networksis likely targeting the densely populated metropolitan areaslike Manhattan, NY, or San Francisco, CA. The second is toadopt a usage-based price plan that limits heavy data usages.While price restructuring is rather inevitable, pure usage-basedplans are likely to backfire by singling out a particular sectorof user groups, e.g., smartphone users, which have the highestpotential for future revenue growth.WiFi offloading seems the most viable solution at the mo-
ment. Building moreWiFi hotspots is significantly cheaper thannetwork upgrades and build-out. Many users are also installingtheir ownWiFi access points (APs) at homes and work. If a ma-jority of traffic is redirected throughWiFi networks, carriers canaccommodate the traffic growth only at a far lower cost. Giventhat there is already a widespread deployment ofWiFi networks,WiFi offloading addresses the “time-to-capacity” issue for thecurrently pressing need of additional network capacity.There are two types of offloading: on-the-spot and
delayed [20]. On-the-spot offloading is to use spontaneousconnectivity to WiFi and transfer data on the spot. Most of thecurrent smartphones support on-the-spot offloading by default.In delayed offloading, each data transfer is associated with adeadline, and the data transfer is resumed whenever gettingin the coverage of WiFi until the transfer is complete. If thetransfer does not finish within its deadline, cellular networks
1063-6692 © 2012 IEEE. Personal use is permitted, but republication/redistribution requires IEEE permission.See http://www.ieee.org/publications_standards/publications/rights/index.html for more information.

LEE et al.: MOBILE DATA OFFLOADING: HOW MUCH CAN WiFi DELIVER? 537
Fig. 1. Sketch of a system supporting delayed mobile data offloading. Our il-lustration focuses on uplink scenarios, but can be symmetrically extended todownlink cases.
finally complete the transfer. Fig. 11 illustrates a system thatenables offloading.2
On-the-spot offloading is prevalent in current smartphones,but delayed offloading, whose notion is close to delay-tolerantnetworks, is relatively new. While users prefer to have data im-mediately, if network carriers provide more incentives in pricefor users to use transfer data with longer deadlines [35], userswill be willing to tolerate delay for non-real-time traffic, e.g.down-and-play video/audio, software update, mobile backup,etc. For instance, Alice records videos and photos of her familyouting at a park using her smartphone and wants to archive itin her cloud data storage. She can use delayed offloading sinceshe does not need the data until she arrives home after a fewhours. This scenario is in fact implemented in a project on UrbanTomography [1].There is no doubt that both on-the-spot and delayed of-
floading reduce the load on 3G networks. However, animportant yet underaddressed question is how much benefitsoffloading can bring to network providers and users. Networkcarriers are interested in knowing how much traffic load WiFioffloading takes away from cellular networks under a givenor future WiFi network deployment. On-the-spot offloading iscurrently being offered through smartphones. Since carriers donot have control over WiFi networks that users connect to, theyhave no idea how much on-the-spot offloading helps them evennow, let alone the future. How much does the new notion ofdelayed offloading help reduce their traffic given the projectedamount of data growth in the future? The answers to thesequestions can provide clues on their price and cost restructuringstrategies. Users are also interested in offloading because ofeconomic reasons, e.g., a potential decrease of subscriptionfees or better service with the same fees. The average delays ofoffloaded data are also important to users. If they can predict inadvance how long the actual data transfers will take on average
1Note that each data associated with a deadline is served in a shortest re-maining time first (SRTF) manner, not in a first-in–first-out (FIFO) manner.2Although the figure shows an uplink scenario, the same can be symmetrically
applied to downlink with a server supporting data queueing inside a carrier net-work.
based on their own mobility patterns, they can use that informa-tion in choosing the right price and deadlines for their transferservices. Users are also interested in actual energy saving thatdelayed offloading can achieve. All the above questions arefundamentally tied to the mobility patterns of users as usersmay come in and out of WiFi coverage. In this paper, we offerrough and rule-of-thumb answers to these questions.
A. Summary of Results
There have been several recent studies [6], [7], [23], [26] onthe related topic. Some [7], [23], [26] have studied in the con-text of energy saving with the assumption that data can toleratea delay of 1 min to a few hours, and the other [6], [23] in thecontext of on-the-spot or short delayed (up to 100 s) offloading.However, the benefits of the full-scale delayed offloading underdaily WiFi usage traces have not been studied in detail. Thedata sets used in these studies are somewhat limited to be gen-eralized. In [6], the authors use several traces of a war-drivingaround a city using their own vehicles and 20 city transit buses,which might incur more frequentWiFi contacts and shorter con-nection duration per contact. These data sets are not generalenough to answer our questions as they do not account for thetemporal coverage of normal users in their daily lives (i.e., theirresults are meaningful only when mobile data are generated in acity transit bus or in their war-driving scenarios) and their char-acteristics (e.g., how often and when they enter and leave WiFizones, how long and when they stay inWiFi zones). The authorsreport about 10%–30% of the total traffic can be offloaded usingon-the-spot offloading, and with up to 100-s delays, delayedoffloading can achieve about 20%–33% additional gains overon-the-spot offloading. However, our results using whole-daytraces show that on-the-spot offloading can offload about 65%of the total traffic load and delayed offloading with 100-s delaydeadlines can get only 2%–3%. In [26], the authors study energysaving efficiency using a set of walk traces, each walk taking afew hours with an instrumented mobile device. For our study,these data are of limited use because each trace is too short toaccount for the daily-life patterns of users. More details on re-lated work can be found in Section V.We offer, to the best of our knowledge, the first quantitative
answers to some of these questions by conducting an extensivemeasurement study in South Korea. For our measurement study,we first designed and implemented an iPhone application thattracks WiFi connectivity. We recruited 97 iPhone users fromthe Internet who downloaded our application to their phonesand used it for about a two-and-a-half-week period in February2010. About 55% of the users live in Seoul, and the othersin the other major cities in Korea. None of the users, to ourknowledge, are related to the authors. We briefed the usersabout the types of the measured data and their objectives.The phone is configured to connect to various WiFi networksas the users travel, including its carrier’s WiFi network. Theapplication runs in the background to record the locations ofWiFi stations to which each user connects, the connectiontimes and durations, and the data transfer rates between WiFistations and smartphones, and then periodically uploads therecorded data to our server. These data are used to carryout trace-driven simulation of offloading with diverse datatraffic and WiFi deployment scenarios.

538 IEEE/ACM TRANSACTIONS ON NETWORKING, VOL. 21, NO. 2, APRIL 2013
From our data, we find that users are in a WiFi coverage zonefor 70% of their time on average (63% during the active hours(9:00 24:00). They stay in a coverage area for about 2 hon average, and after leaving the area, they return to an WiFiarea within 40 min (this time interval is called interconnectiontimes). The distributions of these statistics have a strong heavy-tail tendency. Data rates from the phone to our measurementserver in the Internet are about 1.26 Mb/s on average duringthe active hours and 2.76 Mb/s during the nighttime. The fullanalysis is presented in Section II-B.Using the data traces we obtained from the experiments,
we run a trace-driven simulation to measure the efficiency ofon-the-spot and delayed offloading. Our simulation uses themeasured data rates from our traces, and each data transfer bya user in a WiFi zone is assumed to run at the actual transferrate experienced by the user in our trace. This ignores the effectof changed load (e.g., contention) on the network bandwidthin the future. The same simulation strategy is used in [6]. Theresults below must be interpreted as upper bounds if the carrierscan sustain the measured data rates through additional WiFiresource provisioning in the future.The following are the key findings from our simulation.1) On-the-spot offloading can offload about 65% of the totaltraffic load. This is achieved without using any delayedtransfer. When delayed offloading is used with 100-s delaydeadlines, the achievable gain over on-the-spot is very in-significant: 2%–3%. Our analysis indicates that in orderfor delayed offloading to get significant gains, the deadlinemust be much longer than 100 s because of long intercon-nection times. When data transfers are opted by users fordelayed transfers with a deadline of 1 h and longer, the gainover on-the-spot becomes larger than about 29%.
2) On-the-spot offloading alone (without any delayedtransfer) can achieve about 55% energy saving for mobiledevices because WiFi offloading can reduce the transmis-sion time of mobile devices substantially. However, fordelayed transfers with very short deadlines like 100 s, theachievable energy saving gain over on-the-spot offloadingis highly limited to about 3%. However, with 1-h delay, theachievable energy saving gain increases to around 20%.
3) For a prediction-based offloading strategy like Bread-crumbs [6], [23] to be useful, it has to predict over severaltens of minutes since the interconnection time has a me-dian of 10 min (90th percentile of 162 min). Because ofthe heavy-tail tendency of the interconnection times, thisprediction will be even harder.
4) The average completion time of data transfers is muchshorter than their delay deadlines. While on-the-spot of-floading obviously achieves faster transfer than using 3Gnetworks only, it is surprising that video file transfers ofsize larger than 30 MB with 1-h deadline are consistentlyfaster than no offloading. Furthermore, the 3G networkusage reduction gain of these transfers is more than 50%over on-the-spot offloading and more than 80% over nooffloading, which implies 50% or more cost reduction forthe carriers to deliver such transfers and translates directlyinto price reductions for users.
We develop a theoretical framework using a queueing modelwith impatience of customers and service interruptions. The
Fig. 2. iPhone App, DTap, for measuring WiFi availability.
model can be used to predict the average performance of of-floading for a given WiFi deployment condition that can be ex-pressed by statistics on the durations of users inside and outsidea WiFi coverage area (i.e., temporal coverage). Simulating thisqueueing model can predict the performance of offloading withabout 10% margin error.More detailed analysis of our simulation can be found
in Sections III. We describe our theoretical framework inSection IV and summarize related works in Section V. Wepresent some discussions on the limitations of our work andfuture work in Section VI.
II. MEASUREMENT STUDY
A. Experimental Setup
The performance of offloading highly depends on the pat-terns of WiFi coverage and user mobility. Accurate modelingof offloading performance calls for a measurement study. Wefirst develop an Apple iPhone application, called DTap (DelayTolerant APplication) that records the statistics of WiFi connec-tivity in the background and periodically sends the recorded sta-tistics to a server (see Fig. 2 for a screenshot). Running in thebackground, DTap scans for WiFi connectivity at every 3-mininterval. As scanning for WiFi, iPhone connects to the AP, ifany, with the strongest signal strength among those to which ithas a past history of connections. Note that the captured WiFiAPs include the private APs at home and work and commer-cial APs installed by the carrier of the mobile phone and thethird-party companies (e.g., Boingo). As our participants are ac-tively using their iPhones, these APs are mostly included in theirpast histories. After connecting to a WiFi network, it measuresdata throughput and round-trip times by pinging the server witha 100-B packet 10 times and computing the average. This mea-sures the end-to-end data rate between the client phone and aserver we have. This is obviously not the most accurate mea-surement method, but it is reasonable under the constraint thatDTap should minimally consume bandwidth and battery of asmartphone.3 Note that, according to an extensive measurement
3By running DTap based on the ping test, participants’ usage time had alreadybeen reduced significantly from about 1 day to 4–6 h. Also, to enable moreusers’ participation in our experiment, we had to strictly avoid potential 3G dataconsumption of participants since data cost during the experiment period wasvery high in South Korea.
LEE et al.: MOBILE DATA OFFLOADING: HOW MUCH CAN WiFi DELIVER? 539
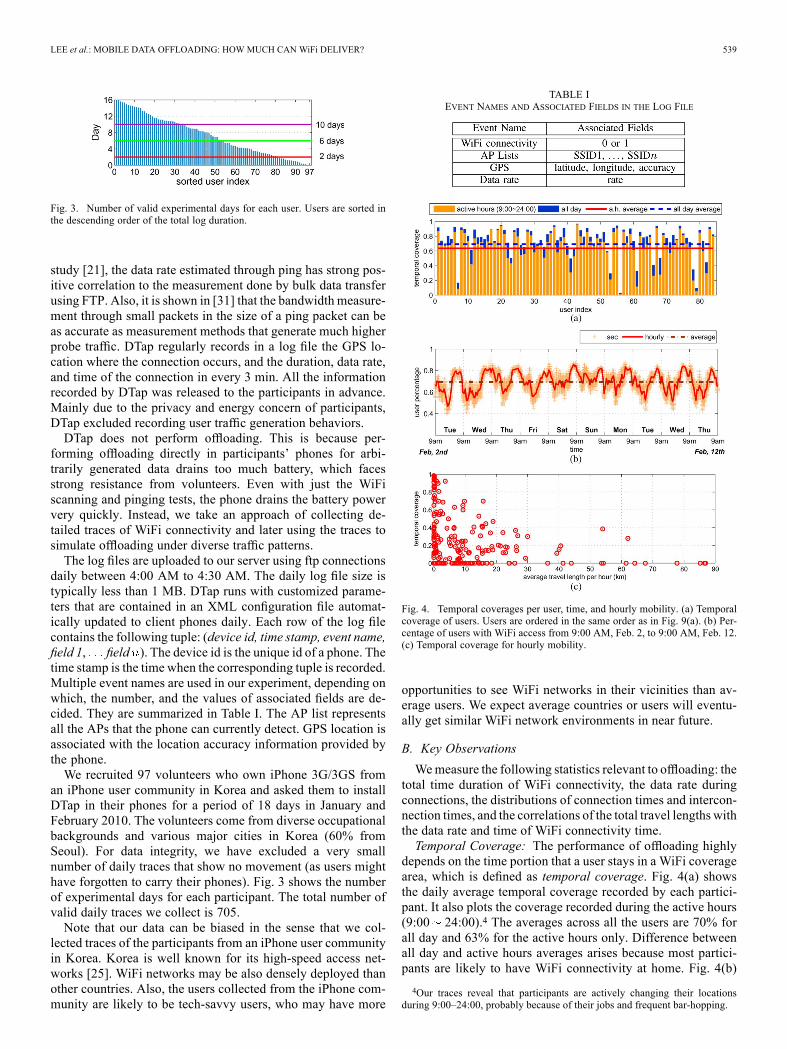
Fig. 3. Number of valid experimental days for each user. Users are sorted inthe descending order of the total log duration.
study [21], the data rate estimated through ping has strong pos-itive correlation to the measurement done by bulk data transferusing FTP. Also, it is shown in [31] that the bandwidth measure-ment through small packets in the size of a ping packet can beas accurate as measurement methods that generate much higherprobe traffic. DTap regularly records in a log file the GPS lo-cation where the connection occurs, and the duration, data rate,and time of the connection in every 3 min. All the informationrecorded by DTap was released to the participants in advance.Mainly due to the privacy and energy concern of participants,DTap excluded recording user traffic generation behaviors.DTap does not perform offloading. This is because per-
forming offloading directly in participants’ phones for arbi-trarily generated data drains too much battery, which facesstrong resistance from volunteers. Even with just the WiFiscanning and pinging tests, the phone drains the battery powervery quickly. Instead, we take an approach of collecting de-tailed traces of WiFi connectivity and later using the traces tosimulate offloading under diverse traffic patterns.The log files are uploaded to our server using ftp connections
daily between 4:00 AM to 4:30 AM. The daily log file size istypically less than 1 MB. DTap runs with customized parame-ters that are contained in an XML configuration file automat-ically updated to client phones daily. Each row of the log filecontains the following tuple: (device id, time stamp, event name,field 1, field ). The device id is the unique id of a phone. Thetime stamp is the time when the corresponding tuple is recorded.Multiple event names are used in our experiment, depending onwhich, the number, and the values of associated fields are de-cided. They are summarized in Table I. The AP list representsall the APs that the phone can currently detect. GPS location isassociated with the location accuracy information provided bythe phone.We recruited 97 volunteers who own iPhone 3G/3GS from
an iPhone user community in Korea and asked them to installDTap in their phones for a period of 18 days in January andFebruary 2010. The volunteers come from diverse occupationalbackgrounds and various major cities in Korea (60% fromSeoul). For data integrity, we have excluded a very smallnumber of daily traces that show no movement (as users mighthave forgotten to carry their phones). Fig. 3 shows the numberof experimental days for each participant. The total number ofvalid daily traces we collect is 705.Note that our data can be biased in the sense that we col-
lected traces of the participants from an iPhone user communityin Korea. Korea is well known for its high-speed access net-works [25]. WiFi networks may be also densely deployed thanother countries. Also, the users collected from the iPhone com-munity are likely to be tech-savvy users, who may have more
TABLE IEVENT NAMES AND ASSOCIATED FIELDS IN THE LOG FILE
Fig. 4. Temporal coverages per user, time, and hourly mobility. (a) Temporalcoverage of users. Users are ordered in the same order as in Fig. 9(a). (b) Per-centage of users with WiFi access from 9:00 AM, Feb. 2, to 9:00 AM, Feb. 12.(c) Temporal coverage for hourly mobility.
opportunities to see WiFi networks in their vicinities than av-erage users. We expect average countries or users will eventu-ally get similar WiFi network environments in near future.
B. Key Observations
Wemeasure the following statistics relevant to offloading: thetotal time duration of WiFi connectivity, the data rate duringconnections, the distributions of connection times and intercon-nection times, and the correlations of the total travel lengths withthe data rate and time of WiFi connectivity time.Temporal Coverage: The performance of offloading highly
depends on the time portion that a user stays in a WiFi coveragearea, which is defined as temporal coverage. Fig. 4(a) showsthe daily average temporal coverage recorded by each partici-pant. It also plots the coverage recorded during the active hours(9:00 24:00).4 The averages across all the users are 70% forall day and 63% for the active hours only. Difference betweenall day and active hours averages arises because most partici-pants are likely to have WiFi connectivity at home. Fig. 4(b)
4Our traces reveal that participants are actively changing their locationsduring 9:00–24:00, probably because of their jobs and frequent bar-hopping.

540 IEEE/ACM TRANSACTIONS ON NETWORKING, VOL. 21, NO. 2, APRIL 2013
Fig. 5. Locations of WiFi APs detected by the participants in a 3 3-km areawith the most dense WiFi deployment inside Seoul (more visible in color).
shows the percentage of users that have WiFi connectivity atany given time averaged over 1-s and 1-h periods, respectively.It indicates that at any time, about 70% of users stay in a WiFicoverage area.There is a substantial difference between the data from [6]
that reports 11% temporal coverage. This difference comes fromthe fact that their measurements are done only when a user is ona vehicle. Typically, users spend most of their time in the officeand home. This type of information is missing as average usersare not likely to spend most of their time only inside a car or bus.To verify our conjecture, we also record the traveling distancesof each user for each hour. This can be calculated as the logcontains GPS data. We map the temporal coverage during eachhour to the travel distance that the user makes during that timeperiod. Fig. 4(c) shows the results. The results indicate that userswith high mobility (i.e., including those moving in a car) havevery low temporal coverage.We measure spatial coverage, which is defined to be the frac-
tion of an area that is under any WiFi coverage. Our traces giveonly a rough estimation of spatial coverage since they do notcapture all possible WiFi APs located in the city because thewalkabouts of participants do not cover the whole area. How-ever, it certainly gives a lower bound. Fig. 5 shows the loca-tions of WiFi APs that the users visit in a 3 3-km area of thecity where the users visit most. We measure the spatial coverageby drawing 50-m-radius circles, a typical WiFi range, aroundeach WiFi-detected AP and totaling the areas of the drawn cir-cles. Our analysis shows that the spatial coverage is about 8.3%(20.6% for 100-m-radius circles).Our data show that the temporal coverage is about
3.5 8 times larger than the spatial coverage for a givenregion, indicating that most users stay inside a WiFi networkfor a long time once they connect to a WiFi network. Fig. 6shows the complementary cumulative distribution function(CCDF) of the stay time (called connection times). The averageconnection times is about 2 h for all day and 52 min for activehours only. Fig. 7 shows the CCDF of interconnection times,the time duration after a user leaves a coverage area until itreturns to a coverage area. The average is about 40 min forall day and 25 min for active hours. Similarly, we measuredthe medians (and 90th percentiles) of connection and intercon-nection times. For whole-day traces, they are shown to be 7.4
Fig. 6. CCDF of connection times. The median and 90th percentile are 7.4and 694 min. The distribution fits best with truncated Pareto distribution with
for all day and for active hours only.
Fig. 7. CCDF of interconnection times. The median and 90th percentile are10.5 and 162 min. The distribution fits best with truncated Pareto distributionwith for all day and for active hours only.
(694) and 10.5 (162) min, respectively. They become 7.4 (280)and 10.4 (109) min when considering active hours only. An in-teresting observation from our trace is that both CCDFs show aheavy-tailed tendency and, in particular, fit best with truncatedPareto distributions5 using maximum likelihood estima-tion (MLE). To find the best fit, we performed two well-knowntest methods: Cramer–Smirnov–Von–Mises (CSVM) statisticalhypothesis test [12], [33] and Akaike test [28], where thetested distributions are exponential, log-normal, Weibull, andtruncated Pareto distributions. The test results for aggregateinterconnection and connection time distributions are sum-marized in Table II. In both tests, a smaller criterion measure(value) for a distribution indicates a better fit.The parameter in truncated Pareto distribution controls the
shape of the PDF function. Pareto distribution that has no trun-cation (i.e., ) is known to become heavy-tailed when
. A smaller gets a heavier tail. Themeasured statistics fitvery well with and 0.63 for connection and intercon-nection times, as shown in Figs. 6 and 7. The minimum valueof truncated Pareto distributions is set to be 3 min, which is ourmeasurement interval. The maximum value of truncated Paretodistributions is set to be the maximum observed from all sam-ples. The maximum of interconnection and connection times forall day are 29.5 and 58.3 h, respectively. The maximum of inter-connection and connection times at active hours (9:00 24:00)
5The probability density function (PDF) of the truncated Pareto distributionwith the parameters is , where is truncatedas .
LEE et al.: MOBILE DATA OFFLOADING: HOW MUCH CAN WiFi DELIVER? 541
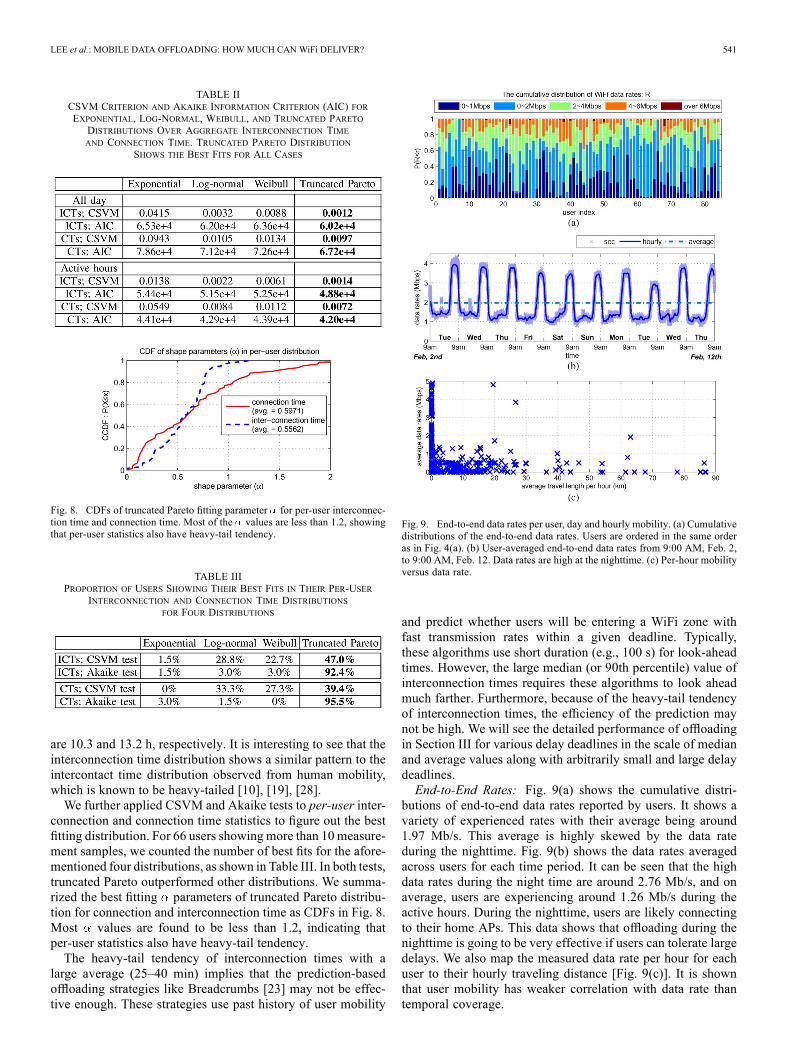
TABLE IICSVM CRITERION AND AKAIKE INFORMATION CRITERION (AIC) FOREXPONENTIAL, LOG-NORMAL, WEIBULL, AND TRUNCATED PARETODISTRIBUTIONS OVER AGGREGATE INTERCONNECTION TIMEAND CONNECTION TIME. TRUNCATED PARETO DISTRIBUTION
SHOWS THE BEST FITS FOR ALL CASES
Fig. 8. CDFs of truncated Pareto fitting parameter for per-user interconnec-tion time and connection time. Most of the values are less than 1.2, showingthat per-user statistics also have heavy-tail tendency.
TABLE IIIPROPORTION OF USERS SHOWING THEIR BEST FITS IN THEIR PER-USER
INTERCONNECTION AND CONNECTION TIME DISTRIBUTIONSFOR FOUR DISTRIBUTIONS
are 10.3 and 13.2 h, respectively. It is interesting to see that theinterconnection time distribution shows a similar pattern to theintercontact time distribution observed from human mobility,which is known to be heavy-tailed [10], [19], [28].We further applied CSVM and Akaike tests to per-user inter-
connection and connection time statistics to figure out the bestfitting distribution. For 66 users showing more than 10 measure-ment samples, we counted the number of best fits for the afore-mentioned four distributions, as shown in Table III. In both tests,truncated Pareto outperformed other distributions. We summa-rized the best fitting parameters of truncated Pareto distribu-tion for connection and interconnection time as CDFs in Fig. 8.Most values are found to be less than 1.2, indicating thatper-user statistics also have heavy-tail tendency.The heavy-tail tendency of interconnection times with a
large average (25–40 min) implies that the prediction-basedoffloading strategies like Breadcrumbs [23] may not be effec-tive enough. These strategies use past history of user mobility
Fig. 9. End-to-end data rates per user, day and hourly mobility. (a) Cumulativedistributions of the end-to-end data rates. Users are ordered in the same orderas in Fig. 4(a). (b) User-averaged end-to-end data rates from 9:00 AM, Feb. 2,to 9:00 AM, Feb. 12. Data rates are high at the nighttime. (c) Per-hour mobilityversus data rate.
and predict whether users will be entering a WiFi zone withfast transmission rates within a given deadline. Typically,these algorithms use short duration (e.g., 100 s) for look-aheadtimes. However, the large median (or 90th percentile) value ofinterconnection times requires these algorithms to look aheadmuch farther. Furthermore, because of the heavy-tail tendencyof interconnection times, the efficiency of the prediction maynot be high. We will see the detailed performance of offloadingin Section III for various delay deadlines in the scale of medianand average values along with arbitrarily small and large delaydeadlines.End-to-End Rates: Fig. 9(a) shows the cumulative distri-
butions of end-to-end data rates reported by users. It shows avariety of experienced rates with their average being around1.97 Mb/s. This average is highly skewed by the data rateduring the nighttime. Fig. 9(b) shows the data rates averagedacross users for each time period. It can be seen that the highdata rates during the night time are around 2.76 Mb/s, and onaverage, users are experiencing around 1.26 Mb/s during theactive hours. During the nighttime, users are likely connectingto their home APs. This data shows that offloading during thenighttime is going to be very effective if users can tolerate largedelays. We also map the measured data rate per hour for eachuser to their hourly traveling distance [Fig. 9(c)]. It is shownthat user mobility has weaker correlation with data rate thantemporal coverage.
542 IEEE/ACM TRANSACTIONS ON NETWORKING, VOL. 21, NO. 2, APRIL 2013
III. OFFLOADING EFFICIENCY
In this section, we report the simulation results using thetraces we discussed in Section II. Since we have detailed recordsof user connectivity and data rates during the connectivity forevery 3-min interval, they can be used to simulate the offloadingof input traffic with diverse patterns.
A. Simulation Method
As it is impossible to accurately anticipate the mobile datausage patterns of users under the situation where the offloadingis adopted, for each user, we exhaustively generate input datatraffic with diverse arrival and size patterns. A data requestfor upload (or download) arrives during typical active hours(9:00 24:00) to the phone of a user (or to an offloading serverin a carrier’s network) with a random interarrival time and arandom size selected from input distributions (typically expo-nential or Weibull6) of a mean for interarrival times and amean for file sizes. We say that is traffic intensity. Gen-erating traffic during active hours can be simplistic, given re-cent measurement studies [13], [14], [24] that characterize thesmartphone usage patterns including temporal characteristicsof aggregate traffic, traffic volume distribution over users, andpopularity of applications. However, considering that the tem-poral correlation revealed so far has only rough information(e.g., aggregate traffic volume during the active hours is largerthan nighttime), more detailed spatial and temporal correlationsof individual mobile data traffic have not been clearly investi-gated. Thus, we provide extensive simulation results for varioustraffic intensities, which may give some insights of upper- orlower-bounded offloading efficiency in practice.We assume that each data request is associatedwith a deadline
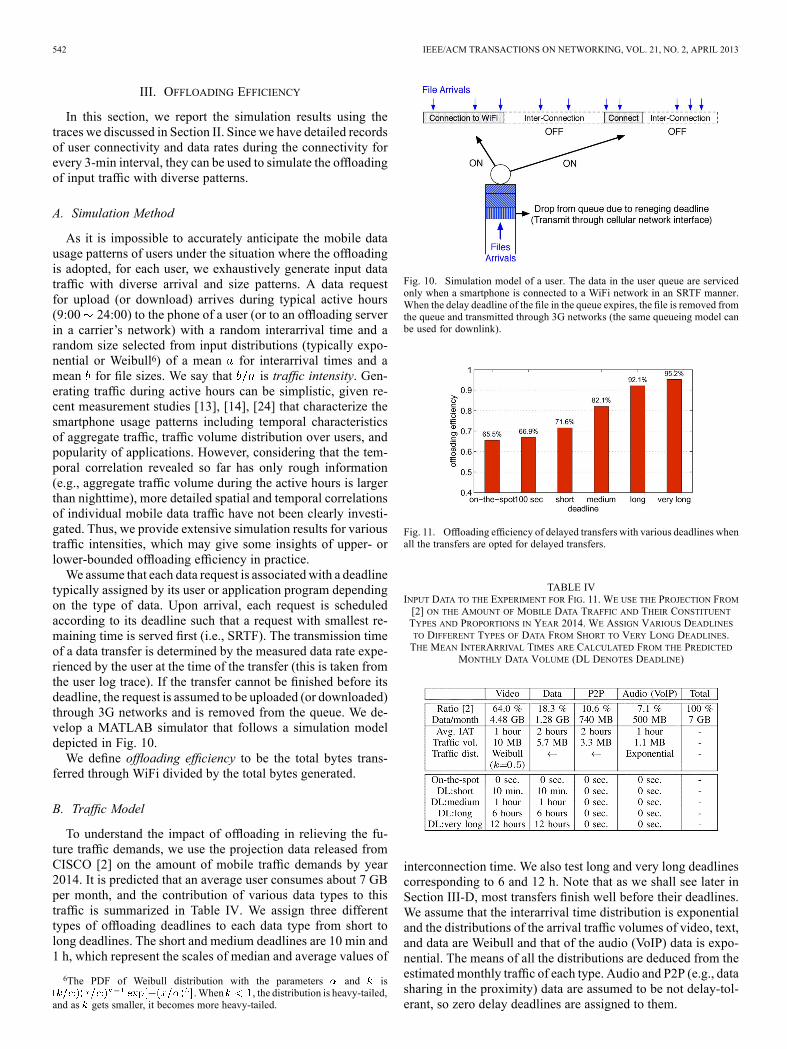
typically assigned by its user or application program dependingon the type of data. Upon arrival, each request is scheduledaccording to its deadline such that a request with smallest re-maining time is served first (i.e., SRTF). The transmission timeof a data transfer is determined by the measured data rate expe-rienced by the user at the time of the transfer (this is taken fromthe user log trace). If the transfer cannot be finished before itsdeadline, the request is assumed to be uploaded (or downloaded)through 3G networks and is removed from the queue. We de-velop a MATLAB simulator that follows a simulation modeldepicted in Fig. 10.We define offloading efficiency to be the total bytes trans-
ferred through WiFi divided by the total bytes generated.
B. Traffic Model
To understand the impact of offloading in relieving the fu-ture traffic demands, we use the projection data released fromCISCO [2] on the amount of mobile traffic demands by year2014. It is predicted that an average user consumes about 7 GBper month, and the contribution of various data types to thistraffic is summarized in Table IV. We assign three differenttypes of offloading deadlines to each data type from short tolong deadlines. The short and medium deadlines are 10 min and1 h, which represent the scales of median and average values of
6The PDF of Weibull distribution with the parameters and is.When , the distribution is heavy-tailed,
and as gets smaller, it becomes more heavy-tailed.
Fig. 10. Simulation model of a user. The data in the user queue are servicedonly when a smartphone is connected to a WiFi network in an SRTF manner.When the delay deadline of the file in the queue expires, the file is removed fromthe queue and transmitted through 3G networks (the same queueing model canbe used for downlink).
Fig. 11. Offloading efficiency of delayed transfers with various deadlines whenall the transfers are opted for delayed transfers.
TABLE IVINPUT DATA TO THE EXPERIMENT FOR FIG. 11. WE USE THE PROJECTION FROM[2] ON THE AMOUNT OF MOBILE DATA TRAFFIC AND THEIR CONSTITUENTTYPES AND PROPORTIONS IN YEAR 2014. WE ASSIGN VARIOUS DEADLINESTO DIFFERENT TYPES OF DATA FROM SHORT TO VERY LONG DEADLINES.THE MEAN INTERARRIVAL TIMES ARE CALCULATED FROM THE PREDICTED
MONTHLY DATA VOLUME (DL DENOTES DEADLINE)
interconnection time. We also test long and very long deadlinescorresponding to 6 and 12 h. Note that as we shall see later inSection III-D, most transfers finish well before their deadlines.We assume that the interarrival time distribution is exponentialand the distributions of the arrival traffic volumes of video, text,and data are Weibull and that of the audio (VoIP) data is expo-nential. The means of all the distributions are deduced from theestimatedmonthly traffic of each type. Audio and P2P (e.g., datasharing in the proximity) data are assumed to be not delay-tol-erant, so zero delay deadlines are assigned to them.

LEE et al.: MOBILE DATA OFFLOADING: HOW MUCH CAN WiFi DELIVER? 543
In this work, we assumed that mobile data traffic are ran-domly generated at users’ devices independent from their po-sitions. Due to privacy concerns, we intentionally avoided col-lecting data generation patterns from users, but incorporatingthese patterns from real data is clearly of our future work.
C. 3G Network Traffic Reduction
In this section, we measure the amount of traffic offloadingto WiFi from 3G networks. Fig. 11 shows the offloading effi-ciency of on-the-spot and delayed offloading. We added the re-sults using 100-s delay deadlines to show the impact of veryshort delay mainly discussed in other research works. In thisexperiment, we assume that all transfers of video and data usedelayed transfers. It is surprising that on-the-spot offloading(without any delays) can achieve extremely high offloading ef-ficiency already. Note that on-the-spot offloading is what is cur-rently being performed by smartphones today. If most of mobiledata volume comes from smartphones, WiFi can offload morethan 65% of traffic even today.As we increase delay deadlines, offloading efficiency
increases substantially. For long deadlines, the efficiencyincreases to 92.1%, indicating most mobile data can be of-floaded to WiFi. However, with short and medium deadlinescorresponding to the scale of median and average intercon-nection time, we get only 9.3% and 25.5% gains. This isbecause: 1) offloading efficiency is computed by offloadeddata volume/total traffic volume; and 2) the amount of trafficvolume generated during a short interconnection is mostlysmall. With 100-s-or-less deadlines, the additional gains ofdelayed transfers over on-the-spot become even smaller. Only2%–3% gain is observable. That is substantially smaller than20%–33% gain reported by [6]. This difference also comesfrom that their traces contain much shorter interconnectiontimes as buses and cars travel much faster than average users onthe street or offices. To have substantial gain using short delays,users must need to experience very short interconnection times(as if they are in a car).The offloading efficiency of 92.1% for long deadlines is cer-
tainly unrealistic. It is not true that all transfers of video anddata in Table IV are opted for delayed transfers with such along delay (6 h). It is possible that despite pricing incentives,users may opt for on-the-spot offloading only. To see the ef-fect of this, we measure the performance as the ratio of delayedtransfers over the total data traffic (called delayed transfer ratio)is varied in Fig. 12. In this plot, we are interested in the gainachieved by delayed transfers over on-the-spot. Again, the gainachieved by 100-s deadlines is very minimal from 2% to 3% for30%–50% delayed transfer ratios. The gain for 1-h deadline isabout 13%–21% with 30% –50% delayed transfer. This resultindicates that since on-the-spot offloading is already very good,for delayed transfers to achieve substantial gain, their deadlinesmust be fairly long (e.g., longer than several tens of minutes).
D. Completion Time
Deadlines of 30 min or 1 h seem very long for some applica-tions. However, our results indicate that most transfers finishwell before these deadlines. In Fig. 13, we measure the av-erage completion times of transfers with various traffic types.For this experiment, we set the data rate of 3G networks to be
Fig. 12. Offloading efficiency gains over on-the-spot offloading achieved bydelayed transfers as the delayed transfer ratio varies.
Fig. 13. Comparison of average completion times of offloading methods forvarious types of applications normalized to the time taken using only cellularnetworks. Parameters in the bracket show the size of files and applied deadlines(more visible in color).
200 kb/s, which we typically get through our iPhones for up-link [29]. For WiFi, we use the end-to-end data rate of WiFimeasured by DTap, whose average is 1.97 Mb/s. We measurethe completion times for: 1) delayed offloading; 2) on-the-spotoffloading; and 3) no offloading (3G network only). The resultin each traffic type is normalized by the completion time of nooffloading. Photo messages with 60-s deadlines finish in 26 son average, 6 s more than no offloading. The breakeven pointwhere the completion time of delayed offloading becomes thesame as that of no offloading occurs when video messages with30 MB of 1-h deadline are transmitted. When that happens, theamount of 3G network usage of delayed offloading is half of thatof on-the-spot. At this point, users using delayed offloading mayexperience the same delay as no offloading while the cost of de-livery by the carriers is only half of that of on-the-spot and about20% of no offloading. This happens because delayed offloadingdelays its transfer until it has a WiFi connectivity. Since WiFioffers higher data rate, more use of WiFi leads to shorter com-pletion time. Although delayed offloading has a longer com-pletion time than on-the-spot offloading, it uses 3G networkfar less, which is translated into cost reduction for carriers andprice reduction for users. With larger file sizes or longer dead-lines, delayed offloading achieves faster completion time andmore cost reduction than no offloading. If 3G data rate changes,the 3G time portion in the graph (green bars) will change ac-cordingly. This tells that when the tangible cellular data rate be-comes slower, the gap in the completion time between delayedoffloading and on-the-spot offloading will reduce. If the datarate increases by network upgrade, the gap will increase in thesame manner. Overall, the cellular data rate affects the attrac-tiveness of delayed offloading.
544 IEEE/ACM TRANSACTIONS ON NETWORKING, VOL. 21, NO. 2, APRIL 2013
Fig. 14. Normalized energy consumption of delayed transfers of 10- and100-MB files with 1-h deadline. File sizes and intervals are assumed to beexponentially distributed.
E. Energy Saving
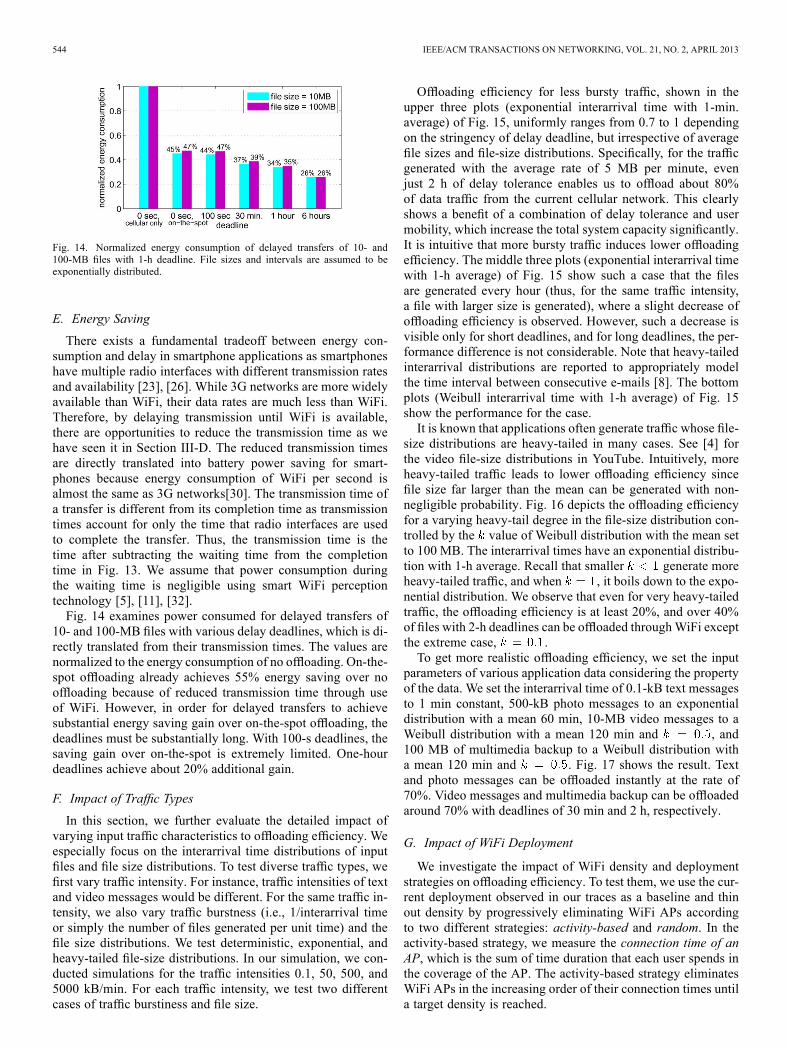
There exists a fundamental tradeoff between energy con-sumption and delay in smartphone applications as smartphoneshave multiple radio interfaces with different transmission ratesand availability [23], [26]. While 3G networks are more widelyavailable than WiFi, their data rates are much less than WiFi.Therefore, by delaying transmission until WiFi is available,there are opportunities to reduce the transmission time as wehave seen it in Section III-D. The reduced transmission timesare directly translated into battery power saving for smart-phones because energy consumption of WiFi per second isalmost the same as 3G networks[30]. The transmission time ofa transfer is different from its completion time as transmissiontimes account for only the time that radio interfaces are usedto complete the transfer. Thus, the transmission time is thetime after subtracting the waiting time from the completiontime in Fig. 13. We assume that power consumption duringthe waiting time is negligible using smart WiFi perceptiontechnology [5], [11], [32].Fig. 14 examines power consumed for delayed transfers of
10- and 100-MB files with various delay deadlines, which is di-rectly translated from their transmission times. The values arenormalized to the energy consumption of no offloading. On-the-spot offloading already achieves 55% energy saving over nooffloading because of reduced transmission time through useof WiFi. However, in order for delayed transfers to achievesubstantial energy saving gain over on-the-spot offloading, thedeadlines must be substantially long. With 100-s deadlines, thesaving gain over on-the-spot is extremely limited. One-hourdeadlines achieve about 20% additional gain.
F. Impact of Traffic Types
In this section, we further evaluate the detailed impact ofvarying input traffic characteristics to offloading efficiency. Weespecially focus on the interarrival time distributions of inputfiles and file size distributions. To test diverse traffic types, wefirst vary traffic intensity. For instance, traffic intensities of textand video messages would be different. For the same traffic in-tensity, we also vary traffic burstness (i.e., 1/interarrival timeor simply the number of files generated per unit time) and thefile size distributions. We test deterministic, exponential, andheavy-tailed file-size distributions. In our simulation, we con-ducted simulations for the traffic intensities 0.1, 50, 500, and5000 kB/min. For each traffic intensity, we test two differentcases of traffic burstiness and file size.
Offloading efficiency for less bursty traffic, shown in theupper three plots (exponential interarrival time with 1-min.average) of Fig. 15, uniformly ranges from 0.7 to 1 dependingon the stringency of delay deadline, but irrespective of averagefile sizes and file-size distributions. Specifically, for the trafficgenerated with the average rate of 5 MB per minute, evenjust 2 h of delay tolerance enables us to offload about 80%of data traffic from the current cellular network. This clearlyshows a benefit of a combination of delay tolerance and usermobility, which increase the total system capacity significantly.It is intuitive that more bursty traffic induces lower offloadingefficiency. The middle three plots (exponential interarrival timewith 1-h average) of Fig. 15 show such a case that the filesare generated every hour (thus, for the same traffic intensity,a file with larger size is generated), where a slight decrease ofoffloading efficiency is observed. However, such a decrease isvisible only for short deadlines, and for long deadlines, the per-formance difference is not considerable. Note that heavy-tailedinterarrival distributions are reported to appropriately modelthe time interval between consecutive e-mails [8]. The bottomplots (Weibull interarrival time with 1-h average) of Fig. 15show the performance for the case.It is known that applications often generate traffic whose file-
size distributions are heavy-tailed in many cases. See [4] forthe video file-size distributions in YouTube. Intuitively, moreheavy-tailed traffic leads to lower offloading efficiency sincefile size far larger than the mean can be generated with non-negligible probability. Fig. 16 depicts the offloading efficiencyfor a varying heavy-tail degree in the file-size distribution con-trolled by the value of Weibull distribution with the mean setto 100 MB. The interarrival times have an exponential distribu-tion with 1-h average. Recall that smaller generate moreheavy-tailed traffic, and when , it boils down to the expo-nential distribution. We observe that even for very heavy-tailedtraffic, the offloading efficiency is at least 20%, and over 40%of files with 2-h deadlines can be offloaded throughWiFi exceptthe extreme case, .To get more realistic offloading efficiency, we set the input
parameters of various application data considering the propertyof the data. We set the interarrival time of 0.1-kB text messagesto 1 min constant, 500-kB photo messages to an exponentialdistribution with a mean 60 min, 10-MB video messages to aWeibull distribution with a mean 120 min and , and100 MB of multimedia backup to a Weibull distribution witha mean 120 min and . Fig. 17 shows the result. Textand photo messages can be offloaded instantly at the rate of70%. Video messages and multimedia backup can be offloadedaround 70% with deadlines of 30 min and 2 h, respectively.
G. Impact of WiFi Deployment
We investigate the impact of WiFi density and deploymentstrategies on offloading efficiency. To test them, we use the cur-rent deployment observed in our traces as a baseline and thinout density by progressively eliminating WiFi APs accordingto two different strategies: activity-based and random. In theactivity-based strategy, we measure the connection time of anAP, which is the sum of time duration that each user spends inthe coverage of the AP. The activity-based strategy eliminatesWiFi APs in the increasing order of their connection times untila target density is reached.
LEE et al.: MOBILE DATA OFFLOADING: HOW MUCH CAN WiFi DELIVER? 545
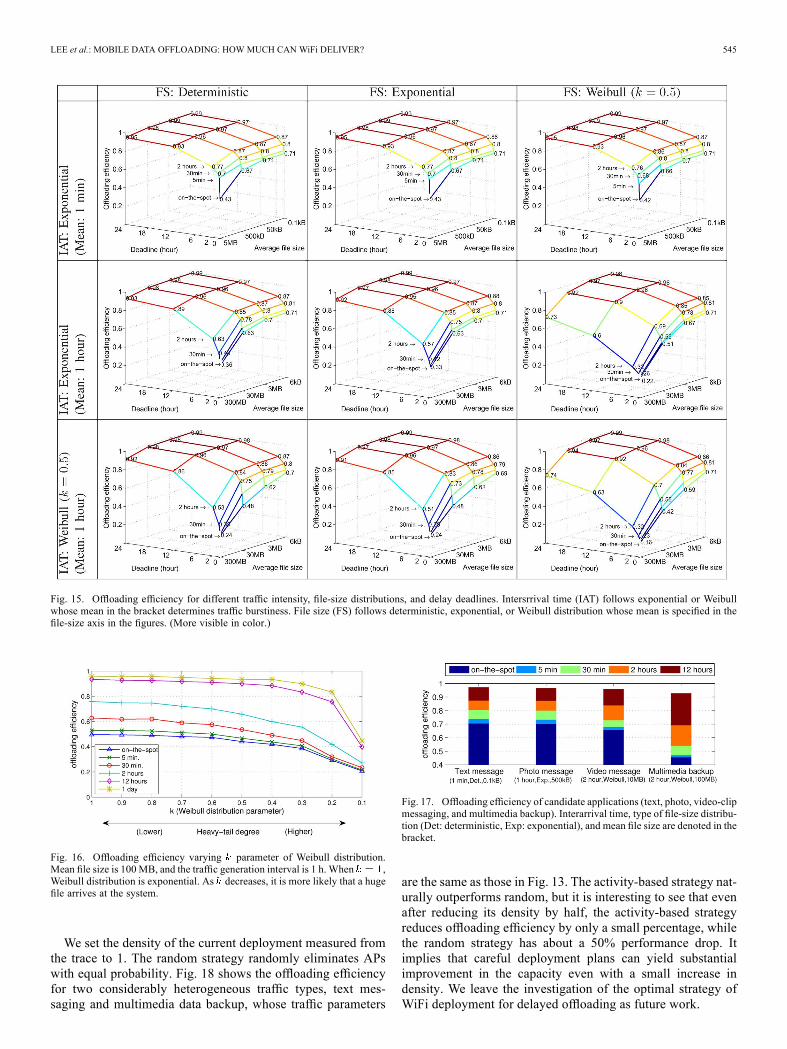
Fig. 15. Offloading efficiency for different traffic intensity, file-size distributions, and delay deadlines. Intersrrival time (IAT) follows exponential or Weibullwhose mean in the bracket determines traffic burstiness. File size (FS) follows deterministic, exponential, or Weibull distribution whose mean is specified in thefile-size axis in the figures. (More visible in color.)
Fig. 16. Offloading efficiency varying parameter of Weibull distribution.Mean file size is 100MB, and the traffic generation interval is 1 h. When ,Weibull distribution is exponential. As decreases, it is more likely that a hugefile arrives at the system.
We set the density of the current deployment measured fromthe trace to 1. The random strategy randomly eliminates APswith equal probability. Fig. 18 shows the offloading efficiencyfor two considerably heterogeneous traffic types, text mes-saging and multimedia data backup, whose traffic parameters
Fig. 17. Offloading efficiency of candidate applications (text, photo, video-clipmessaging, and multimedia backup). Interarrival time, type of file-size distribu-tion (Det: deterministic, Exp: exponential), and mean file size are denoted in thebracket.
are the same as those in Fig. 13. The activity-based strategy nat-urally outperforms random, but it is interesting to see that evenafter reducing its density by half, the activity-based strategyreduces offloading efficiency by only a small percentage, whilethe random strategy has about a 50% performance drop. Itimplies that careful deployment plans can yield substantialimprovement in the capacity even with a small increase indensity. We leave the investigation of the optimal strategy ofWiFi deployment for delayed offloading as future work.

546 IEEE/ACM TRANSACTIONS ON NETWORKING, VOL. 21, NO. 2, APRIL 2013
Fig. 18. Offloading efficiency for various amount of WiFi deployment and dif-ferent deployment strategies. Irrespective of traffic type, activity-based deploy-ment that might primarily lead to installWiFi APs to users’ houses shows clearlyhigher offloading efficiency than random. (a) Random (text msg.). (b) Activity(text msg.). (c) Random (video msg.). (d) Activity (video msg.).
Fig. 19. Comparison of offloading efficiencies after scaling up or down datarates to mimic network conditions with physical-layer innovation (e.g., IEEE802.11n) or with heavier congestion due to more smartphone users. The num-bers ( x) represent the increase or decrease of the offloading efficiency com-pared to the offloading efficiency when the scaling factor is one. For example,the number “1.06 ” at the on-the-spot deadline indicates that the offloading ef-ficiency is increased by 6% when the scaling factor is four.
H. Impact of Throughput Scaling
It is relatively easy to forecast that the total WiFi network ca-pacity increases in the future. However, predicting changes inWiFi network environment in the future for an individual user isof extreme difficulty since it is both possible for a user to experi-ence higher data rates mainly due to more investment from car-riers or physical-layer innovations (e.g., 802.11n, 802.11ac/ad)and lower data rates mainly due to excessive smartphone userscompared to the present. To see the impact of the changes in bothdirections, we emulate the network environments by scaling upand down the current data rates as shown in Fig. 19. We per-formed simulations with scaled data rates from 33% to 400%under the same data traffic shown in Table IV. Interestingly, the
performance gap in the offloading efficiencies under widely dif-ferent data rates becomes reduced as longer deadlines are al-lowed. This implies that longer deadlines are more beneficial tothe networks with limited capacity because the deadline allowstemporal load balancing, which makes data traffic to be widelydistributed over time and to leverage more unused WiFi con-nection opportunities.
IV. ANALYTICAL FRAMEWORK
In this section, we develop a model-based simulation methodas well as an analytic framework based on a queueing model tosimply obtain offloading efficiency. The model-based simula-tion removes the necessity of detailed WiFi connectivity tracesby abstracting the traces into closelymatching distributions withfew parameters. This method is helpful in predicting variationin offloading efficiency for the changes (e.g., additional deploy-ment) in WiFi environment. Moreover, the framework referredto as a queueing system with reneging and service interruptions,models a user’s data queue that switches the transmission inter-face between WiFi and cellular networks under a deadline. Itprovides a closed-form expression of offloading efficiency forsome restricted cases. This theoretical framework is extremelyhelpful in predicting the offloading performance for diverse fu-ture WiFi deployments.
A. Model
Reneging: We consider a continuous queueing system witha single server (see Fig. 10). This queueing system models filegeneration and transfer from the phone of a user through cellularor WiFi networks. Files are generated and queued according tosome stochastic process. The file size is assumed to follow aprobabilistic distribution. A deadline, called a reneging dead-line, is associated with each generated file. Files are servicedin the SRTF order depending on their remaining deadlines. Afile can be serviced only via WiFi before its deadline. As thequeueing system is continuous, it handles transmission at thebit level so that assigning a deadline to a file is equivalent toassigning the same deadline to each bit of the file. Any bits thathave not finished transmission by its deadline will be removedfrom the queue and are assumed to be transmitted through cel-lular networks.Service Interruption: Users move in and out of a WiFi cov-
erage area. We model this time varying nature of the connectionstate by the ON and OFF states, where only in the ON state, theuser is connected to a WiFi network. ON and OFF periods arerandom values selected from connection and interconnectiontime distributions in Figs. 6 and 7, respectively. We assume thatthe arrival process, file size distribution, and mobility processare pairwise independent. The “actual” service capacity of theserver is determined by the length of ON and OFF states. For sim-plicity, we assume that the service capacity when the server isON is constant. The queueing system introduced here is also re-ferred to as a queue with reneging and service interruptions inthis paper.Challenges: To compute offloading efficiency using
our queueing model, we need to compute the stationary proba-bility that data is removed from the queue before service whenits deadline is , i.e.,

LEE et al.: MOBILE DATA OFFLOADING: HOW MUCH CAN WiFi DELIVER? 547
Fig. 20. Comparison of offloading efficiencies between trace-based andmodel-based simulations.
The arrival process and file size distributions are in generalquite diverse, depending on the target applications. We use aPoisson arrival process and exponential or heavy-tail file-sizedistributions, e.g., Weibull. In Section II-B, we showed thatthe distributions of connection times and interconnection timeshave good fit with truncated Pareto distributions, .The queueing system with reneging and service interruptions
often obviates a tractable analysis if the statistical propertiesof the input parameters are as complex as heavy-tailed distri-butions. Nonetheless, this simple model is still useful for thefollowing reasons. We can use this model to perform a model-based simulation in which the system parameter values such asthe ON and OFF periods and the file arrival rates are selectedfrom input distributions, which can be obtained from real tracesor arbitrarily modeled. This simulation is much simpler thanthe trace-driven simulation we used in Section III, which needsto emulate user mobility from input mobility traces. Second,for some restricted set of the input distributions, we can obtaina closed-form solution, allowing us to predict offloading effi-ciency through simple numerical computation.
B. Trace-Based Versus Model-Based Simulation
To measure the accuracy of our model, we run a model-basedsimulation using the input distributions measured from the realtraces. The input distributions obtained from the traces are thedistributions of connection and interconnection times and thedistribution of WiFi data rates. We vary the arrival process offiles and the distribution of file sizes. The results are comparedto those from the trace-driven simulations in Section III. Recallthat from ourMLE based fitting in Section II-B, the best-fit trun-cated Pareto parameters are for connection time and
for interconnection times. The server capacity for theON state is assumed to be 1.97 Mb/s, which is the average datarate from the real trace.Fig. 20 compares offloading efficiency between the trace- and
model-based simulations for two considerably different cases:500-kB/min and 300-MB/h intensities with Poisson arrivals andexponential file sizes, and from short (10 min) to long (12 h)reneging deadlines. We observe that the results from the twosimulations have minor difference, ranging from 0.1% to 10%.This difference comes from the imperfect fitting of truncatedPareto distribution to the actual connection and interconnectiontime distribution.To test the accuracy of the model-based simulation, we test
the offloading efficiency under the condition where 20% ofWiFiAPs in our traces are randomly removed using the technique in
Fig. 21. Comparison of offloading efficiencies between trace-based andmodel-based simulations after random elimination of 20% WiFi APs.
Section III-G. For the traces with 20% less WiFi APs, we ob-tain the best-fitting parameters and forinterconnection and connection time distributions and comparethe performances as shown in Fig. 21. We again observe lessthan 5% of performance differences between trace-driven sim-ulations and model-based simulations.
C. Queue With Tractable Cases
Our continuous queueing model runs at the bit level inwhich an arrival of a file is modeled by a burst arrival of bitscorresponding to the file size. The burst arrival is very hard tomodel in the continuous queueing model. Instead, we consideroffloading at the file granularity. This makes the queueingsystem much more tractable, and with some restricted caseswhere all input distributions are exponential, we can obtain aclosed-form solution. We assume that the file sizes, connectiontimes, and interconnections follow exponential distributionswith rates , , and , respectively. The arrival process of filesfollows a Poisson process with rate . Denote by the capacityof the server when the server is ON.We consider two types of reneging deadlines: random and de-
terministic. Random deadlines model a situation that users mayset their own deadlines and are randomly picked from an ex-ponential distribution with mean . Deterministic deadlines aretypically set by each application to a constant. One side effectof considering files as the basic unit is that the deadline of a filemay expire in the middle of the transfer. In such a case, we allowthe file to continue to be transmitted throughWiFi as long as theserver state is ON.Modeling Based on Markov Chain: The system can be de-
scribed as a two-dimensional continuous-time Markov chainwhere the state is a tuple of . is the numberof files at time and is the state of the server (ON or OFF).Fig. 22 describes this Markov chain where
random reneging
deterministic reneging. (1)
For random reneging deadlines, the memoryless property ofexponential random variables simplifies the solution. The tran-sitions between ON and OFF occur at rates and . The numberof files in the queue decreases due to reneging as well as ser-vice, both of which are proportional to the number of files atthat time. A similar problem was studied in the queueing com-munity [34] in the context of the machine-repair problem withimpatient customers.

548 IEEE/ACM TRANSACTIONS ON NETWORKING, VOL. 21, NO. 2, APRIL 2013
Fig. 22. 2-D Markov chain for the queueing system with reneging and serviceinterruptions for exponential interarrival times with rate , file size with rate ,contact time with rate , and the intercontact time with rate .
For deterministic deadlines, the system is not clearly Mar-kovian. Thus, it is challenging to analyze the system. There exista few studies on deterministic reneging, see, e.g., [9] and [16].However, they deal only with the systems without service inter-ruptions. We develop a tractable method to analyze our systemby extending [9] and [34]. Note that the stationary distribution ofa non-Markovian system is equivalent to that of the Markoviansystem in Fig. 22. This notion is extremely powerful since itallows to obtain a closed-form stationary solution even for thecase of deterministic deadlines. We now elaborate on this bytreating ON and OFF states separately.1) ON: The transition between states, say, from to
, is made by either finishing the transfer ofa file in the queue or after its deadline expiration. Theservice rate is , whereas the rate of leaving the queuedue to deadline expiration is complicated because thedeadline is deterministic which requires recording theremaining deadline. Fortunately, in [9], such rates havebeen studied and are shown to be the same as (1).
2) OFF: The server sleeps during this state, and files willjust leave the queue whenever the deterministic dead-line expires at the rate of . The evolution of thenumber of files in this queue is the same as that of the“customers” of the queue where the work-load of all customers is . The workload processingin queue model can be interpreted as filedrops in our model because, in both cases, deterministicis applied to all customers from the moment they
entered the queue. It is known that has theinsensitivity property to the workload distribution [16],i.e., the steady-state probabilities and output processare independent of the distribution of the customers’workload .
Thus, the stationary distribution of the processin the original system is equivalent to that computed from theMarkovian system in Fig. 22. Markov-chain-based modelingfacilitates the computation of stationary distributions, denotedby , , for thereneging deadline . It turns out that the transition rate ma-trices of Fig. 22 have a block tridiagonal form and similar tothose in quasi-birth-death (QBD) Markov process, allowing avariety of matrix-geometric techniques [22], [34]. We omit theresulting closed-form expression for brevity. The offloading ef-ficiency can be obtained by deriving the ratio of the av-erage leaving rates of files due to reneging over the average in-coming rates, i.e.,
Fig. 23. Analytical result and simulation for exponential interarrivals times,service ON–OFF, and file-size distributions with deterministic reneging.
Fig. 23 compares the offloading efficiency between the the-oretical analysis and the model-based simulation when deter-ministic reneging deadlines and exponentially distributed ONand OFF times are used. The figure verifies a good match be-tween the two with the maximum difference of about 20%. Thegap comes from the difference in the granularity of handlingreneging. In the queueing simulation, reneging is applied at abit unit, whereas in the theoretical model, it is applied at a fileunit. Thus, in Fig. 23, the experiment with the smaller file sizeshows less error.
V. RELATED WORK
Balasubramanian et al. [6] develop several techniquescombining 3G networks and WiFi for reducing the totalcost of data transfer. The proposed techniques are similar toBreadcrumb [23]. The authors use a citywide measurement dataof 3G and WiFi network availability obtained from 20 transitbuses in a city and war-driving in two other cities. The workfocuses on gains achieved by on-the-spot offloading or delayedoffloading with a very short delay deadline (up to 100 s).Based on these traces, they report about 10%–30% on-the-spotoffloading efficiency and about 20%–33% offloading gain ofdelayed offloading over on-the-spot. Since their traces aretaken during driving, they contain a lot of short connectionand interconnection times with WiFi, which contribute to thesubstantial gains of delayed transfers with short deadlines (alsolow efficiency of on-the-spot offloading).There are several more measurement studies focusing on
WiFi and 3G network availability over given movement paths.Han et al. [17] suggest a two-pass measurement methodologyinvolving rough search and detailed measurement phases forWiFi APs. Gass et al. [15] present a detailed measurementresult by comparing the characteristics of 3G networks andWiFi in a city. Both of these results are based on war-drivingby vehicles or by walk.Ra et al. [26] present an online algorithm called SALSA over
mobile smartphones with 3G/EDGE/WiFi interfaces that opti-mizes energy and delay tradeoffs using a Lyapunov optimizationframework. SALSA is tested over real 3G/EDGE/WiFi mea-surement performed using 66 sample walk traces of about 1 hlength in various areas including campus, shopping mall andairport. Balasubramanian et al. [7] present a different type ofenergy and delay tradeoffs arising from energy consumptioncharacteristics of multimodal wireless terminal equipped withWiFi, 3G and GSM mobile network technologies. Based on ameasurement study, they develop a energy consumption model

LEE et al.: MOBILE DATA OFFLOADING: HOW MUCH CAN WiFi DELIVER? 549
for each technology. The model is then used to design an algo-rithm that schedules (i.e., delays) transmissions to minimize theoverall time spent in high-energy states (i.e., energy tail) whilerespecting user-specified delay-tolerance deadlines.Nicholson et al. [23] propose a scheme that can predict
near future WiFi connectivity and quality. The scheme enablesmobile devices to schedule their data transfers to harness highertransmission rates of WiFi APs. It exploits users’ tendency offollowing regular movement patterns around the region wherestatic WiFi APs are deployed. The authors show that delayingtransmissions according to short-term forecasts can achievehigher data rate as well as lower power consumption.
VI. DISCUSSIONS AND CAVEATS
The perhaps biggest surprise in our analysis is 65% trafficreduction currently achievable by on-the-spot WiFi offloadingwithout use of any delay. Assuming most mobile data demandsare from smartphone users, this gain is what the carriers arecurrently achieving. Roughly, it implies that about 35% of theprojected 7 GB/month per-user usage in 2014 (about 2.5 GB)will be transferred through 3G networks. With additional incen-tives for delayed offloading, this gain can quickly grow. Thismeans that from the user’s perspective, with a fixed price planof 2 GB/month over 3G networks (what is currently adopted byAT&T for iPhone 4G), average users do not overscribe at all.With more creative price plans for delayed transfers, users mayeven opt for a cheaper monthly data plan and can offload mostof excess data traffic.This paper focuses only on temporal offloading. However,
allowing delays in applications also enables load balancing.End-to-end data rates at night are much higher than activehours (9:00 24:00) because we tend to experience stablelinks overnight at home as well as less congestion in thebackhaul network. Delayed transfer, especially with long delaydeadlines, is likely to enable traffic dispersion over time soas to shift the high daytime demand for networking resourcesto the nighttime. Temporal and spatial asymmetry of WiFiconnectivity can be further exploited to develop an adaptiveoffloading policy, which will improve offloading efficiency. Asan example, when the time of the day is close to a typical hourwhen a user comes back to home, the deadline can be flexiblyextended to exploit guaranteed WiFi connection opportunityat home as long as the users prefer to maximize offloadingefficiency. Similarly, when users visit unknown places, thedeadline can be adjusted to be short since the user may havelimited WiFi connection opportunities in such places. Thestudy of adaptive offloading policies is left as an interestingfuture work.Our study makes a number of convenient assumptions. First,
we assume that the measured data rates of WiFi in our traces aresustained independent of load in the network. Although themea-sured data rates account for traffic conditions (e.g., contentionand dynamic data rates) existing at the time of connection, weignore the issue of increased contention in the future as moreusers use WiFi offloading. Measuring and predicting the exactdata rates for the future are very challenging. This factor de-pends on the tradeoff between capacity and demands offered bythe current WiFi technology, which is still developing, so we donot have a clear answer for how we can incorporate the impact
of the increased load on the performance of WiFi offloading.However, our results are still meaningful as they can be viewedas an upper bound on the performance gain since contention canonly increase with more usage. In other words, our results aremeaningful if the carriers can provision enough WiFi resourceto sustain the current WiFi data rates.The main focus of our study is purely performance-oriented.
We ignore a number of technical and policy issues in ourstudy. First, energy consumption is high if mobile devicesconstantly scan for WiFi connectivity. A number of solutions(e.g., [5], [11], and [32]) for this problem are developed.Rahmati and Zhong [5] proposed an intelligent energy-savingalgorithm for predicting WiFi availability and device scansfor WiFi APs only in areas where WiFi is likely available.Several researchers [11], [32] developed an energy-efficientlocation-tracking system for mobile phones based on mapmatching and war-driving or magnetometer and accelerometersensor readings, which consume only a small fraction of powerused for GPS. As users tend to maintain regular mobilitypatterns daily, mobile phones can perform scanning only whenthey are in a prerecorded area of WiFi stations. Although thesetechniques can save energy for WiFi discovery, it is not easy forthem to guarantee full discovery. Therefore, in order to studythe capacity region of WiFi offloading, we intentionally do notapply these techniques in DTap.We also do not examine issues of security and administration
or billing control. As user data are diverted away from the car-riers’ network, carriers may lose control over the data being of-floaded. Despite these issues, we believe that the impact of ourwork is significant: Since our findings conclude that offloadingis an effective means for accommodating the current and futuretraffic growth, our simulation tools can offer important guid-ance for network providers in deploying and upgrading theirnetworks and also in designing successful and creative priceplans. Given the strong performance advantages of WiFi of-floading, we foresee that there will be technical solutions as wellas policy and price restructuring to address these issues in thenear future.
REFERENCES
[1] “Urban tomography project,” 2008 [Online]. Available: http://tomography.usc.edu/
[2] Cisco, San Jose, CA, “Cisco visual networking index: Global mobiledata traffic forecast update, 2009–2014,” Feb. 2010 [Online]. Avail-able: http://www.cisco.com/en/US/solutions/collateral/ns341/ns525/ns537/ns705/ns827/white_paper_c11-520862.html
[3] “Data, data everywhere,” Economist Feb. 2010 [Online]. Avail-able: http://www.economist.com/specialreports/displayStory.cfm?story_id=15557443
[4] A. Abhari and M. Soraya, “Workload generation for YouTube,”Multi-media Tools Appl., vol. 46, no. 1, pp. 91–118, 2010.
[5] R. Ahmad and Z. Lin, “Context-for-wireless: Context-sensitive en-ergy-efficient wireless data transfer,” in Proc. ACM MobiSys, 2007,pp. 165–178.
[6] A. Balasubramanian, R. Mahajan, and A. Venkataramani, “Aug-menting mobile 3G using WiFi,” in Proc. ACM MobiSys, 2010, pp.209–222.
[7] N. Balasubramanian, A. Balasubramanian, and A. Venkataramani,“Energy consumption in mobile phones: A measurement study andimplications for network applications,” in Proc. ACM SIGCOMMIMC, 2009, pp. 280–293.
[8] A.-L. Barabasi, “The origin of bursts and heavy tails in human dy-namics,” Nature, vol. 435, pp. 207–211, May 2005.
[9] D. Y. Barrer, “Queuing with impatient customers and ordered service,”Oper. Res., vol. 5, no. 5, pp. 650–656, 1957.

550 IEEE/ACM TRANSACTIONS ON NETWORKING, VOL. 21, NO. 2, APRIL 2013
[10] A. Chaintreau, P. Hui, J. Crowcroft, C. Diot, R. Gass, and J. Scott,“Impact of human mobility on the design of opportunistic forwardingalgorithms,” in Proc. IEEE INFOCOM, 2006, pp. 1–13.
[11] I. Constandache, R. R. Choudhury, and I. Rhee, “Towards mobilephone localization without war-driving,” in Proc. IEEE INFOCOM,2010, pp. 1–9.
[12] W. T. Eadie, M. G. Roos, and F. E. James, Statistical Methods in Ex-perimental Physics. Amsterdam, The Netherlands: Elsevier, 1971.
[13] H. Falaki, D. Lymberopoulos, R. Mahajan, S. Kandula, and D. Estrin,“A first look at traffic on smartphones,” in Proc. ACM IMC, 2010, pp.281–287.
[14] H. Falaki, R. Mahajan, S. Kandula, D. Lymberopoulos, R. Govindan,and D. Estrin, “Diversity in smartphone usage,” in Proc. ACM Mo-biSys, 2010, pp. 179–194.
[15] R. Gass and C. Diot, “An experimental performance comparison of 3Gand Wi-Fi,” in Proc. ACM PAM, 2010, pp. 71–80.
[16] D. Gross, Fundamentals of Queueing Theory. Hoboken, NJ: Wiley,2008.
[17] D. Han, M. Kaminsky, A. Agarwala, K. Papagiannaki, D. G. Andersen,and S. Seshan, “Mark-and-Sweep: Getting the “inside” scoop on neigh-borhood networks,” in Proc. ACM IMC, 2008, pp. 99–104.
[18] T. Kaneshige, “AT&T iPhone users irate at idea ofusage-based pricing,” PCWorld Dec. 2009 [Online].Available: http://www.pcworld.com/article/184589/atandt_iphone_users_irate_at_idea_of_usagebased_pricing.html
[19] T. Karagiannis, J.-Y. L. Boudec, and M. Vojnovic, “Power law andexponential decay of inter contact times between mobile devices,” inProc. ACM MobiCom, 2007, pp. 183–194.
[20] K. Lee, I. Rhee, J. Lee, Y. Yi, and S. Chong, “Mobile data offloading:How much can WiFi deliver?,” in Proc. ACM CoNEXT, 2010, pp.425–426.
[21] S. C. Networking, “Correlations between ftp and ping,” 2011 [On-line]. Available: http://www.slac.stanford.edu/comp/net/wan-mon/tutorial.html
[22] M. F. Neuts, Matrix-Geometric Solutions in Stochastic Models. Bal-timore, MD: Johns Hopkins Univ. Press, 1981.
[23] A. J. Nicholson and B. D. Noble, “BreadCrumbs: Forecasting mobileconnectivity,” in Proc. ACM MobiCom, 2008, pp. 46–57.
[24] U. Paul, A. P. Subramanian, M. M. Buddhikot, and S. R. Das, “Un-derstanding traffic dynamics in cellular data networks,” in Proc. IEEEINFOCOM, 2011, pp. 882–890.
[25] G. Prodhan and G. E. McCormick, “S. Korea still top world communi-cations economy,” Sep. 2011 [Online]. Available: http://af.reuters.com/article/maliNews/idAFL5E7KF3SH20110915
[26] M.-R. Ra, J. Paek, A. B. Sharma, R. Govindan, M. H. Krieger, and M.J. Neely, “Energy-delay tradeoffs in smartphone applications,” inProc.ACM MobiSys, 2010, pp. 255–270.
[27] M. Reardon, Cisco predicts wireless-data explosion“,” Feb. 2010[Online]. Available: http://news.cnet.com/8301-30686_3-10449758-266.html
[28] I. Rhee, M. Shin, S. Hong, K. Lee, and S. Chong, “On the levy walk na-ture of humanmobility,” inProc. IEEE INFOCOM, 2008, pp. 924–932.
[29] W. Rothman, “The definitive coast-to-coast 3G data test,” Dec.2008 [Online]. Available: http://gizmodo.com/5111989/the-defini-tive-coast+to+coast-3 g-data-test
[30] A. Sharma, V. Navda, R. Ramjee, V. N. Padmanabhan, and E. M.Belding, “Cool-Tether: Energy efficient on-the-fly wifi hot-spots usingmobile phones,” in Proc. ACM CoNEXT, 2009, pp. 109–120.
[31] J. Strauss, D. Katabi, and F. Kaashoek, “A measurement study of avail-able bandwidth estimation tools,” in Proc. ACM IMC, 2003, pp. 39–44.
[32] A. Thiagarajan, L. Ravindranath, K. LaCurts, S. Madden, H. Balakr-ishnan, S. Toledo, and J. Eriksson, “VTrack: Accurate, energy-awareroad traffic delay estimation using mobile phones,” in Proc. ACMSenSys, 2009, pp. 85–98.
[33] T. F. Vania Conan and J. Leguay, “Characterizing pairwise inter-con-tact patterns in delay tolerant networks,” in Proc. Int. Conf. Auton.Comput. Commun. Syst., 2007, Article no. 19.
[34] K.-H. Wang and Y.-C. Chang, “Cost analysis of a finite M/M/Rqueueing system with balking, reneging, and server breakdowns,”Math. Methods Oper. Res., vol. 56, no. 2, pp. 169–180, 2002.
[35] X. Zhuo, W. Gao, G. Cao, and Y. Dai, “Win-Coupon: An incentiveframework for 3G traffic offloading,” in Proc. IEEE ICNP, 2011, pp.206–215.
Kyunghan Lee (S’07–A’10) received the B.S., M.S.,and Ph.D. degrees in electrical engineering and com-puter science from Korea Advanced Institute of Sci-ence and Technology (KAIST), Daejeon, Korea, in2002, 2004, and 2009, respectively.He is currently an Assistant Professor with the
School of Electrical and Computer Engineering,Ulsan National Institute of Science and Technology(UNIST), Ulsan, Korea. Prior to joining UNIST,he was with the Department of Computer Science,North Carolina State University, Raleigh, as a
Senior Research Scholar. His research interests include the areas of humanmobility modeling, delay-tolerant networking, information-centric networking,context-aware service design, and cloud-powered network service design.
Joohyun Lee (S’11) received the B.S. degree inelectrical engineering and computer science fromKorea Advanced Institute of Science and Technology(KAIST), Daejeon, Korea, in 2008, and is currentlyan integrated M.S. and Ph.D. candidate at KAIST.His research interests are in the areas of mo-
bility-aware networks, delay-tolerant networks, andnetwork economics.
Yung Yi (S’04–M’06) received the B.S. and M.S.degrees in computer science and engineering fromSeoul National University, Seoul, Korea, in 1997 and1999, respectively, and the Ph.D. degree in electricaland computer engineering from the University ofTexas at Austin in 2006.From 2006 to 2008, he was a Post-Doctoral Re-
search Associate with the Department of ElectricalEngineering, Princeton University, Princeton, NJ.Now, he is an associate professor at the Departmentof Electrical Engineering at KAIST, South Korea.
His current research interests include the design and analysis of computernetworking and wireless systems, especially congestion control, scheduling,and interference management, with applications in wireless ad hoc networks,broadband access networks, economic aspects of communication networkseconomics, and greening of network systems.Dr. Yi has been serving as a TPC member at various conferences including
ACM MobiHoc, Wicon, WiOpt, IEEE INFOCOM, ICC, GLOBECOM, andITC. His academic service also includes the Local Arrangement Chair ofWiOpt2009 and CFI 2010, the Networking Area Track Chair of TENCON 2010, thePublication Chair of CFI 2010, and a Guest Editor of the Special Issue on GreenNetworking and Communication Systems of IEEE Surveys and Tutorials. Healso serves as the Co-Chair of the Green Multimedia Communication InterestGroup of the IEEE Multimedia Communication Technical Committee.
Injong Rhee (S’89–M’94) received the Ph.D. degreein computer science from the University of NorthCarolina at Chapel Hill.He is a Professor with the Department of Com-
puter Science, North Carolina State University,Raleigh. His areas of research interests includecomputer networks, congestion control, wireless adhoc networks, and sensor networks.Prof. Rhee is an Editor of the IEEE TRANSACTIONS
ON MOBILE COMPUTING.

LEE et al.: MOBILE DATA OFFLOADING: HOW MUCH CAN WiFi DELIVER? 551
Song Chong (M’93) received the B.S. and M.S.degrees in control and instrumentation engineeringfrom Seoul National University, Seoul, Korea, in1988 and 1990, respectively, and the Ph.D. degreein electrical and computer engineering from theUniversity of Texas at Austin in 1995.Since March 2000, he has been with the Depart-
ment of Electrical Engineering, Korea Advanced In-stitute of Science and Technology (KAIST), Daejeon,Korea, where he is a Professor and was the head ofthe Communications and Computing Group. Prior to
joining KAIST, he was aMember of Technical Staff with the Performance Anal-ysis Department, AT&TBell Laboratories, Holmdel, NJ. He has published morethan 100 papers in international journals and conferences. His current researchinterests include wireless networks, future Internet, and human mobility char-acterization and its application to mobile networking.He is an Editor of Computer Communications and the Journal of Communi-
cations and Networks. He has served on the Technical Program Committee ofa number of leading international conferences including IEEE INFOCOM andACM CoNEXT. He serves on the Steering Committee of WiOpt and was theGeneral Chair of WiOpt 2009.