52. The use of maximum SOFA score to quantify organ dysfunctionfailure in intensive care Results of...
11
R. Moreno J.-L. Vincent R. Matos A. Mendonça F.Cantraine L. Thijs J. Takala C. Sprung M. Antonelli H. Bruining S. Willatts on behalf of the working group on sepsisrelated problems of the ESICM The use of maximum SOFA score to quantify organ dysfunction/failure in intensive care. Results of a prospective, multicentre study Received: 16 September 1998 Accepted: 16 April 1999 R. Moreno ( ) ) · R. Matos Unidade de Cuidados Intensivos Polivalente, Hospital de St. António dos Capuchos, Alameda de St. António dos Capuchos, P-1150 Lisboa, Portugal (e-mail: [email protected], Fax: + 351–1-4 844635), J.-L. Vincent · A. Mendonc ¸a Department of Intensive Care, Erasme University Hospital, Brussels, Belgium F.Cantraine FacultØ de Medicine, UniversitØ Libre de Bruxelles, Brussels, Belgium L. Thijs Medical Intensive Care Unit, Academisch Ziekenhuis Vrije Universiteit Amsterdam, Amsterdam, The Netherlands J. Takala Department of Intensive Care, Kuopio University Hospital, Kuopio, Finland C. Sprung Department of Intensive Care, Hadassah Hebrew University Medical Center, Jerusalem, Israel M. Antonelli Istituto di Anestesiologia e Rianimazione, Università “La Sapienza”, Rome, Italy H. Bruining Intensive Care Unit, Academisch Ziekenhuis Rotterdam, Rotterdam, The Netherlands S. Willatts Directorate of Anaesthesia, Bristol Royal Infirmary, Bristol, UK Abstract Objective: To evaluate the performance of total maximum se- quential organ failure assessment (SOFA) score and a derived mea- sure, delta SOFA (total maximum SOFA score minus admission total SOFA) as a descriptor of multiple organ dysfunction/failure in inten- sive care. Design: Prospective, multicentre and multinational study. Setting: Forty intensive care units (ICUs) from Australia, Europe, North and South America. Patients: Data on 1,449 patients, evaluated at admission and then consecutively every 24 h until ICU discharge (11,417 records) during May 1995. Excluded from data col- lection were all patients with a length of stay in the ICU less than 2 days following uncomplicated scheduled surgery. Main outcome measure: Survival status at ICU discharge. Interventions: The collection of raw data necessary for the computation of a SOFA score on admission and then every 24 h, and basic demo- graphic and clinical statistics. Measurements and main results: Mean total maximum SOFA score presented a very good correlation to ICU outcome, with mortality rates ranging from 3.2 % in patients with- out organ failure to 91.3 % in pa- tients with failure of all the six or- gans analysed. A maximum score was reached 1.1 0.2 days after ad- mission for all the organ systems analysed. The total maximum SOFA score presented an area under the ROC curve of 0.847 (SE 0.012), which was significantly higher than any of its individual components. The cardiovascular score (odds ratio 1.68) was associated with the highest relative contribution to outcome. No independent contribution could be demonstrated for the hepatic score. No significant interactions were found. Principal components analysis dem- onstrated the existence of a two-fac- tor structure that became clearer when analysis was limited to the presence or absence of organ failure (SOFA score ‡ 3 points) during the ICU stay. The first factor comprises respiratory, cardiovascular and neu- rological systems and the second co- agulation, hepatic and renal sys- tems. Delta SOFA also presented a good correlation to outcome. The area under the receiver operating char- acteristic (ROC) curve was 0.742 (SE 0.017) for delta SOFA, lower than the total maximum SOFA score or admission total SOFA score. The impact of delta SOFA on prognosis remained significant after correction for admission total SOFA. Conclusions: The results show that total maximum SOFA score and delta SOFA can be used to quantify the degree of dysfunction/failure al- Intensive Care Med (1999) 25: 686–696 Ó Springer-Verlag 1999 ORIGINAL
-
Upload
zikri-putra-l-lubis -
Category
Documents
-
view
212 -
download
0
description
Cara menulis daftar pustaka dengan metode Vancouver akan saya tuliskan dalam postingan kali ini. Hal ini sebagai kelanjutan dari postingan saya sebelumnya tentang cara menulis daftar pustaka dengan metode Harvard.Cara menulis daftar pustaka dengan metode Vancouver ini sedikit berbeda dengan metode Harvard. Letak perbedaan sangat jelas. Dan kebanyakan sitasi jurnal ilmiah mengacu kepada cara menulis daftar pustaka dengan metode Vancouver. Metode penulisan daftar pustaka yang mengikuti metode Harvard mayoritas diikuti oleh penulis karya tulis ilmiah, seperti skripsi, makalah, tesis dan karya tulis ilmiah lainnya. Secara umum juga mengikuti cara menulis daftar pustaka yang sudah umum bahkan tidak mengikuti kedua metode tersebut, metode Harvard dan Vancouver.Langkah – langkah dalam cara menulis daftar pustaka dengan metode VancouverAdapun langkah-langkah yang dapat ditempuh dalam cara menulis daftar pustaka dengan metode Vancouver adalah sebagai berikut: Menggunakan bullet angka Angka tersebut menjadi rujukan dalam sitasi sebuah karya tulis yang dibuat Nomor rujukan (referensi) yang ada di dalam karya tulis itu harus sama dengan urutan penulis yang ada dalam daftar pustaka Tidak perlu mengurutkan tahun publikasi tulisan Nama tidak perlu diurutkan berdasarkan alfabetisContoh cara menulis daftar pustaka dengan metode VancouverDaftar pustaka yang mengikuti metode Vancouver dapat dilihat pada contoh sebagai berikut
Transcript of 52. The use of maximum SOFA score to quantify organ dysfunctionfailure in intensive care Results of...

R. MorenoJ.-L. VincentR. MatosA. MendonçaF.CantraineL.ThijsJ. TakalaC. SprungM. AntonelliH. BruiningS. Willattson behalf of the working group onsepsisrelated problems of the ESICM
The use of maximum SOFA score toquantify organ dysfunction/failure inintensive care. Results of a prospective,multicentre study
Received: 16 September 1998Accepted: 16 April 1999
R. Moreno ()) ´ R. MatosUnidade de Cuidados IntensivosPolivalente, Hospital de St. António dosCapuchos, Alameda de St. António dosCapuchos, P-1150 Lisboa, Portugal(e-mail: [email protected],Fax: + 351±1-4844635),
J.-L. Vincent ´ A. MendoncËaDepartment of Intensive Care,Erasme University Hospital, Brussels,Belgium
F.CantraineFacultØ de Medicine,UniversitØ Libre de Bruxelles, Brussels,Belgium
L. ThijsMedical Intensive Care Unit,Academisch Ziekenhuis Vrije UniversiteitAmsterdam, Amsterdam, The Netherlands
J. TakalaDepartment of Intensive Care,Kuopio University Hospital, Kuopio,Finland
C.SprungDepartment of Intensive Care,Hadassah Hebrew University MedicalCenter, Jerusalem, Israel
M. AntonelliIstituto di Anestesiologia e Rianimazione,Università ªLa Sapienzaº, Rome, Italy
H. BruiningIntensive Care Unit,Academisch Ziekenhuis Rotterdam,Rotterdam, The Netherlands
S.WillattsDirectorate of Anaesthesia,Bristol Royal Infirmary, Bristol, UK
Abstract Objective: To evaluate theperformance of total maximum se-quential organ failure assessment(SOFA) score and a derived mea-sure, delta SOFA (total maximumSOFA score minus admission totalSOFA) as a descriptor of multipleorgan dysfunction/failure in inten-sive care.Design: Prospective, multicentreand multinational study.Setting: Forty intensive care units(ICUs) from Australia, Europe,North and South America.Patients: Data on 1,449 patients,evaluated at admission and thenconsecutively every 24 h until ICUdischarge (11,417 records) duringMay 1995. Excluded from data col-lection were all patients with alength of stay in the ICU less than2 days following uncomplicatedscheduled surgery.Main outcome measure: Survivalstatus at ICU discharge.Interventions: The collection of rawdata necessary for the computationof a SOFA score on admission andthen every 24 h, and basic demo-graphic and clinical statistics.Measurements and main results:Mean total maximum SOFA scorepresented a very good correlation toICU outcome, with mortality ratesranging from 3.2% in patients with-out organ failure to 91.3 % in pa-tients with failure of all the six or-gans analysed. A maximum scorewas reached 1.1 � 0.2 days after ad-
mission for all the organ systemsanalysed. The total maximum SOFAscore presented an area under theROC curve of 0.847 (SE 0.012),which was significantly higher thanany of its individual components.The cardiovascular score (odds ratio1.68) was associated with the highestrelative contribution to outcome.No independent contribution couldbe demonstrated for the hepaticscore. No significant interactionswere found.Principal components analysis dem-onstrated the existence of a two-fac-tor structure that became clearerwhen analysis was limited to thepresence or absence of organ failure(SOFA score ³ 3 points) during theICU stay. The first factor comprisesrespiratory, cardiovascular and neu-rological systems and the second co-agulation, hepatic and renal sys-tems.Delta SOFA also presented a goodcorrelation to outcome. The areaunder the receiver operating char-acteristic (ROC) curve was 0.742(SE 0.017) for delta SOFA, lowerthan the total maximum SOFAscore or admission total SOFAscore. The impact of delta SOFA onprognosis remained significant aftercorrection for admission totalSOFA.Conclusions: The results show thattotal maximum SOFA score anddelta SOFA can be used to quantifythe degree of dysfunction/failure al-
Intensive Care Med (1999) 25: 686±696Ó Springer-Verlag 1999 ORIGINAL

Introduction
In recent years, a series of negative results in clinical tri-als on sepsis [1±13] has challenged the classical adoptionof hospital mortality as the end point for the evaluationof clinical trials in intensive care [14]. The use of thismeasure has constituted the gold standard until now,since it is easy to define and to measure and representsa clinically very relevant end point. However, it hasbeen contested [15], since hospital policy can and doeschange the location of deaths (e. g. discharging patientsto die) and mortality can be significantly underestimat-ed in hospitals which discharge patients very early inthe course of their disease.
Recently authors have questioned the adequacy ofall cause mortality as an end point [16]. A meaningfulend point can only be chosen when a direct relation be-tween an event and its consequences is known. In thecase of sepsis (and multiple organ failure) our knowl-edge is very limited and only an indirect and partial rela-tionship can actually be established to most phenomena.Moreover, all cause mortality implies the need for largesamples, with problems in reliability of data collection,heterogeneity of enrolled patients and costs. Patients inintensive care, even with strict inclusion criteria for sep-sis or septic shock, do not constitute a homogeneoussample. Patients have different diagnoses, time-courses,ages, chronic illnesses (chronic health, co-morbidities),different sites of infection and invading microorganismsand different degrees of physiological dysfunction, re-sulting in a large dispersion of mortality risks [17, 18].Additionally, the presence and impact of other con-founding events such as inappropriate antimicrobialtherapy, inadequate medical-surgical management andforgoing life-sustaining therapies must be analysed andtaken into account [19]. Several methods have been pro-posed to deal with this variation [18, 20, 21], but theseusually lead to complex, extensive (and expensive) datacollection and sophisticated analysis.
It has been shown that certain interventions, effec-tive in their specific scope, fail to reduce all cause hos-pital mortality. A recent example is selective decon-tamination of the digestive tract (SDD); it has beendemonstrated to diminish the prevalence of nosocomi-al pneumonia [22], but does not consistently decreasehospital mortality [23, 24]. In other cases, therapeuticinterventions have failed to demonstrate beneficial ef-fects in multicentre trials [1] and have been found tobe associated with a significant reduction in mortality
when applied to more homogeneous groups of patients[25].
The awareness of these factors led the WorkingGroup on Sepsis-related Problems of the European So-ciety of Intensive Care Medicine (ESICM) to organisea consensus meeting in Paris (December 1994) to createthe so-called sepsis-related organ failure assessment(SOFA) score [26], later called sequential organ failurescore since it is not restricted to sepsis. The rationale be-hind this decision was the necessity to find an objectiveand simple way to describe individual organ dysfunc-tion/failure in a continuous form, from mild dysfunctionto severe failure, that can be used over time to measurethe evolution of individual (or aggregated) organ dys-function in clinical trials on sepsis or for the clinician atthe bedside.
A retrospective evaluation of the application of thisscore to the first 24 h in the ICU on 1,643 patients withearly sepsis on an international database [26] demon-strated a good correlation to mortality and an accept-able distribution of the patients among the severalgroups. To confirm these retrospective findings, a pro-spective, multinational study was initiated, the main re-sults of which are presented elsewhere [27].
The aim of this work was to evaluate the perfor-mance of total maximum SOFA score and a derivedmeasure, delta SOFA (total maximum SOFA minus ad-mission total SOFA, that is, the magnitude of organ dys-function appearing during the ICU stay) as a descriptorof multiple organ dysfunction/failure in intensive care.
Materials and methods
Patients
Two months before the start of data collection, all participants inthe working group on sepsis-related problems of the ESICM wereinvited to collaborate. Data collection took place from May 1,1995, to May 31, 1995. Forty ICUs from 16 countries in Australia(1), Europe (35), North (1) and South America (3) participated inthe study. Patients with a length of stay (LOS) in the ICU lessthan 2 days following uncomplicated scheduled surgery were ex-cluded from data collection.
For each patient a simple set of variables was collected that in-cluded basic demographic characteristics and all the variables ofthe SOFA score [26] (see Appendix). Data were registered on ad-mission and every 24 h thereafter using the worst values until ICUdischarge. All data were collected as raw data. In the co-ordinatingcentre (Erasme Hospital, Free University of Brussels, Belgium),data were entered into a computer format using a continuous pro-
687
ready present on ICU admission, thedegree of dysfunction/failure thatappears during the ICU stay and thecumulative insult suffered by thepatient. These properties make it a
good instrument to be used in theevaluation of organ dysfunction/failure.
Key words Severity of illness index ´Sepsis ´ Multiple organ failure ´Multiple organ dysfunctionsyndrome ´ Intensive care ´ Criticalcare

cess of monitoring of its completeness and correction. For a singlemissing value a replacement was calculated using the mean valueof the result preceding and that following the missing one. Whenmore than one consecutive value was missing it was considered asa missing value in the analysis. More details about data collectionare given elsewhere [27].
Methods
Maximum organ failure scores were calculated for all the six com-ponents of the system during the entire ICU stay. The aggregatescore (total maximum SOFA score) was calculated summing theworst scores for each of the components. The amount of organ dys-function/failure appearing after ICU admission (delta SOFA) wasevaluated computing the total maximum SOFA score minus theadmission total SOFA score (Appendix). For purposes of analysis,organ dysfunction was defined as a SOFA score of 1 or 2 points andorgan failure as a SOFA score ³ 3. Chi-square statistics (with Yatescorrection when applicable) were used to test for the statistical sig-nificance of categorical variables and one-way analysis of variancewas used to assess continuous variables. All statistical tests weretwo-sided, and a significance level of 0.05 or less was used exceptwhen stated otherwise.
The discriminative power of the scores, that is, the ability of thescores to discriminate between patients who live and patients whodie, was defined by the area under the receiver operating charac-teristic (ROC) curve, computed by a modification of the Wilcoxonstatistics, as proposed by Hanley and McNeil [28]. The comparisonof the areas under ROC curves was made using the Z statistic withcorrection for the correlation introduced by studying the samesample [29].
For the computation of the odds ratios and interactions associ-ated with each component of the system, we fitted a logistic regres-sion model with outcome in the ICU as the dependent variable.The maximum SOFA scores for each of the six systems were usedas independent variables. Later, pertinent interactions were addedto the model. The same method was applied in the evaluation ofthe relative contributions of delta SOFA and admission total
SOFA score to prognosis, using outcome in the ICU as the depen-dent variable and delta SOFA and admission SOFA as the inde-pendent variables. Logistic regression analysis was used to evalu-ate the relationship between total maximum SOFA score andICU mortality. Linear regression analysis was used to evaluate thecorrelation between mean delta SOFA and ICU mortality.
Exploratory factor analysis was applied to study meaningful in-terrelations among the six components of the SOFA score. Thistype of analysis aims at analysing the interrelations between a setof variables, without the need to consider which variables are de-pendent and which variables are independent (opposite to regres-sion where this specification must be done). This technique allowsfor the identification of association patterns of the different vari-ables under consideration, without first having to specify a cause-and-effect relationship [30]. An eigen value of ³ 1 or more wasconsidered as significant.
The results are presented as means � standard deviation exceptwhen stated otherwise. The outcome measure used was survivalstatus at discharge from the ICU. Data analysis and statistics wereperformed using the Statistical Package for Social Sciences(SPSS) version 5.0 for MS DOS and 7.0 for Microsoft Windows atthe Intensive Care Unit, Hospital de Santo António dos Capuchos,Lisbon, Portugal.
Results
A total of 1,449 patients were studied for a total of11,417 ICU days. Thirty-two percent of the patientswere admitted from the emergency room, 27% fromthe ward, 26 % from the operative theatre and 11%from other hospitals. Most patients were male (64 %),with an overall mean age of 55 � 19 years ranging from12 to 95 years. Non-operative patients comprised 44%of the sample. The median LOS in the ICU was5.0 days (interquartile range 3±10 days). The overallmortality in the ICU was 22% with a correspondingoverall hospital mortality of 26 %. Five patients hadmissing data in their ICU outcome and were excludedfrom the analysis related to outcome. More details canbe found in the main description of the study [27].
Figure 1 shows the frequency distribution of totalmaximum SOFA score in survivors and non-survivors.The mean total maximum SOFA score was8.2 + 5.4 points, median 7 points, range 0±24 points,and was significantly higher in non- survivors than insurvivors (13.6 � 4.8 points versus 6.7 � 4.5 points,p < 0.001). The relationship between total maximumSOFA score and ICU outcome was established as:
Pr =eÿ4:0473 + 0:2790(TMS)
1 + eÿ4:0473 + 0:2790(TMS)
where Pr is the probability of death in the ICU and TMSis the total maximum SOFA score during the ICU stay.
In all the organ systems analysed, the maximumSOFA score during the ICU stay for that specific organpresented an acceptable frequency distribution amongthe various groups (Fig. 2). The differences between sur-
688
Fig.1 Frequency distribution of maximum SOFA in survivors(open bars, n = 1131) and non-survivors (black bars, n = 313). As-terisks present the relationship between maximum SOFA scoreand ICU mortality, with the logistic regression curve superimposed

vivors and non-survivors were always significant (Ta-ble 1). The mortality rate increased as the score in-creased in all organ systems (Fig. 2). For respiratoryand neurological scores the patterns were less clear, es-pecially when the scores were lower than 3 points.
The number of organ failures (maximum SOFAscore ³ 3) also showed a significant correlation to ICUoutcome, with mortality rates ranging from 3.2 % in pa-tients without any organ failure to 91.3 % in patientswith failure of all the six organs analysed (Table 2).The mean maximum SOFA score also showed a corre-sponding increase, with values ranging from3.1 � 2.2 points in patients without organ failures to21.3 � 1.5 points in patients with six organ failures. Themaximum SOFA score occurred shortly after admissionfor all organ systems analysed (1.1 � 0.2 days) withmean values ranging from 0.8 days (95 % confidence in-terval 0.6±0.9 days) for the neurological score to1.4 days (95 % confidence interval 1.2±1.5 days) for therespiratory score.
If we limit the analysis to organ failures (SOFA ³ 3points), the time required to reach maximum valueswas longer (mean 2.9 + 1.1 days, ranging from 1.6 days
for the neurological score to 4.9 for liver failure) thanthe time needed to reach a maximum SOFA score, andsignificant differences were noted between the differentorgan systems analysed (p < 0.001). The neurologicalsystem was the first to fail, the respiratory, cardiovascu-lar, renal and coagulation systems occupied an interme-diate position and the hepatic was the last (Fig. 3).
In the evaluation of the discriminative power of thescores, the area under the ROC curve was used. Thebest discriminative power was shown for the cardiovas-cular score (0.802, standard error (SE) 0.015), the renalscore (0.739, SE 0.016) and the respiratory score (0.736,SE 0.016). For the neurological score the value was in-termediate (0.727, SE 0.016). Coagulation (0.684, SE0.018) and hepatic scores (0.655, SE 0.019) had a lowerdiscriminative power. The aggregated score (total maxi-mum SOFA score) presented an area under the ROCcurve of 0.847 (SE 0.012) which was significantly higher(cardiovascular score p = 0.005, all others p < 0.001)than any of its individual components (Fig. 4).
In order to evaluate the relative contribution to out-come of each of the six individual organ system dysfunc-tions, a non-stepwise logistic regression equation wasdeveloped, relating the score for each organ to the out-come in the ICU. In this way, the exponent of the esti-
689
Fig.2 Mortality rate (bars) and number of patients in each organsystem (*), according to maximum SOFA score
Table 1 Maximum SOFA scores for the six organ systems in theglobal population, in survivors and in non-survivors. The differen-ces between survivors and non-survivors were always significant(p < 0.001). Results are presented as mean ± standard deviation
Component Global population(n = 1,444)
Survivors(n = 1,131)
Non-survivors(n = 313)
Respiratory 2.2 ± 1.3 2.0 ± 1.3 3.0 ± 1.1Cardiovascular 1.5 ± 1.5 1.2 ± 1.3 2.9 ± 1.4Renal 1.0 ± 1.2 0.8 ± 1.0 1.9 ± 1.4Coagulation 1.0 ± 1.1 0.8 ± 1.0 1.7 ± 1.3Hepatic 0.7 ± 1.0 0.6 ± 0.9 1.3 ± 1.3Neurological 1.7 ± 1.7 1.4 ± 1.5 2.9 ± 1.6Total MaximumSOFA score 8.2 ± 5.4 6.7 ± 4.5 13.6 ± 4.8
Table 2 Number of organ failures (maximum SOFA score L3 points) and ICU outcome
Numberof organfailures
Numberof patients
% ofpatients
Death inthe ICU(n)
Mortalityrate(%)
MaximumSOFAscorea
0 507 35.1 16 3.2 3.1 ± 2.21 360 24.9 38 10.6 7.0 ± 2.22 243 16.8 62 25.5 10.1 ± 2.03 175 12.1 90 51.4 13.7 ± 1.94 93 6.5 57 61.3 16.4 ± 1.55 43 3.0 29 67.4 19.4 ± 1.36 23 1.6 21 91.3 21.3 ± 1.5a mean ± standard deviation

mated coefficient (b) for each organ score representsthe factor by which the odds ratio of ICU death changeswhen the score for that particular organ increases1 point. The results (Table 3) demonstrated that the car-diovascular score was associated with the highest rela-tive contribution to outcome (odds ratio 1.68, 95% con-fidence interval 1.49±1.91), followed by the renal (oddsratio 1.46, 95 % confidence interval 1.29±1.64), the neu-rological (odds ratio 1.40, 95 % confidence interval1.28±1.55), the coagulation (odds ratio 1.22, 95% confi-dence interval 1.06±1.40) and the respiratory (odds ratio1.18, 95% confidence interval 1.01±1.38) scores. Nosuch contribution could be demonstrated for the hepaticscore (odds ratio 0.82, 95 % confidence interval0.60±1.11).
The same technique was used to evaluate significantinteractions among the six components of the SOFAscore. However, no conclusive results could be demon-
strated. A trend (non-significant) was found for interac-tions between respiratory and coagulation scores (oddsratio 1.14, 95% confidence interval 0.97±1.33), respira-tory and renal scores (odds ratio 1.09, 95% confidenceinterval 0.95±1.25), cardiovascular and renal scores(odds ratio 1.07, 95% confidence interval 0.96±1.07), re-nal and hepatic scores (odds ratio 1.11, 95% confidenceinterval 0.98±1.25), and hepatic and coagulation scores(odds ratio 1.09, 95% confidence interval 0.97±1.23).
Exploratory factor analysis was then used to identi-fy meaningful interrelations among the six components
690
Fig.3 Mean time to reach maximum SOFA score in patients withorgan failure (SOFA ³ 3). Values are presented as mean � 95%confidence intervals for the mean. The numbers of patients ineach of the systems were: respiratory 644, cardiovascular 392, renal198, coagulation 190, hepatic 119 and neurological 561
Fig.4 Discriminative power of total maximum SOFA score, deltaSOFA and admission total SOFA score. The receiver operatingcharacteristics (ROC) curve summarises the relationship betweensensitivity (number of true positives) and 1 minus specificity (num-ber of false positives) for all the possible values of the score. Thereference line represents the discriminative power of a score nobetter than chance (area under ROC curve 0.5). The values withinbrackets are standard errors. The outcome used was vital status atICU discharge
Table 3 Relative contributions to ICU outcome of the maximum value during ICU stay for each of the six components of the SOFAscore
Variable b SE Wald p R Odds-ratio(95% confidence intervals)
Respiratory 0.164 0.080 4.176 0.041 0.038 1.176 (1.007±1.378)Cardiovascular 0.521 0.063 68.242 < 0.001 0.210 1.683 (1.488±1.905)Renal 0.377 0.061 37.951 < 0.001 0.154 1.458 (1.294±1.643)Coagulation 0.198 0.072 7.482 0.006 0.060 1.219 (1.059±1.404)Hepatic �0.202 0.155 1.702 0.192 0.000 0.817 (0.603±1.107)Neurological 0.339 0.049 48.703 < 0.001 0.176 1.404 (1.275±1.545)Constant �3.750 0.351 113.930
b, coefficient; SE, standard error; Wald, Wald statistic, R, partial correlation. Odds-ratios are presented for a 1-point change in the scoresfor each organ

of the SOFA score. The results (Table 4) demonstratedthe existence of a two-factor structure, each compris-ing three components of the system, that becamemore clear when the analysis was limited to the pres-ence or absence of organ failure (SOFA score ³ 3) dur-
ing the ICU stay. The first factor comprises the re-spiratory, cardiovascular and neurological scores andthe second the coagulation, hepatic and renal compo-nents.
Delta SOFA presented a mean value of 3.0 � 3.3points, median 2.0 points, range 0±19 points. DeltaSOFA was significantly higher (p < 0.001) in non-survi-vors than in survivors (5.5 � 4.1 points versus2.3 � 2.7 points). As presented in Table 5, ICU mortalityincreased as the delta SOFA score increased. The asso-ciation between mean delta SOFA and ICU mortalityfollowed a linear pattern (Fig. 5, Table 5). Delta SOFApresented an area under the ROC curve of 0.742 (SE0.017) (Fig.4), which was significantly lower (p < 0.001)than that of the total maximum SOFA score and slightlylower (non-significant) than that of the admission totalSOFA score (0.772, SE 0.015).
In order to evaluate the relative contribution to ICUoutcome of the amount of organ dysfunction present atICU admission (admission total SOFA score) and thatdeveloping during ICU stay (delta SOFA score), a non-stepwise logistic regression equation was developed.Results demonstrate that both were important for out-come, and with a similar weight (Table 6). The associat-ed odds ratios, for a 1 point change in the score were1.36 (95 % confidence interval 1.30±1.42) for the admis-
691
Table 4 Principal components analysis of the six components ofthe SOFA system. Results are presented for maximum values dur-ing ICU stay (top) and for the presence of organ failure (SO-FA L 3 points) during ICU stay (bottom), after varimax rotation
Component Factor 1 Factor 2
Maximum values during ICU stayRespiratory 0.3578 0.7221Cardiovascular 0.5844 0.5168Renal 0.6796 0.1154Coagulation 0.7662 0.1711Hepatic 0.7605 0.1269Neurological 0.0057 0.8737
Organ failures (SOFA L 3 points) during ICU stayRespiratory 0.1252 0.7812Cardiovascular 0.3212 0.6960Renal 0.6248 0.1409Coagulation 0.7500 0.1580Hepatic 0.7398 0.0928Neurological 0.0505 0.7636
Fig.5 Delta SOFA score and ICU mortality. A linear relation ex-ists between delta SOFA and ICU mortality
Table 5 Delta SOFA (total maximum SOFA score minus admis-sion total SOFA score) and ICU outcome
DeltaSOFA
Number ofpatients
% ofpatients
Death inthe ICU (n)
Mortalityrate (%)
0 390 27.0 38 9.71 234 16.2 20 8.52 191 13.2 29 15.23 140 9.7 26 18.64 118 8.2 29 24.65 90 6.2 24 26.76 72 5.0 29 40.37 53 3.7 24 45.38 39 2.7 21 53.89 33 2.3 17 51.5
10 22 1.5 16 72.711 20 1.4 12 60.012 16 1.1 9 56.313 9 0.6 7 77.814 5 0.3 4 80.0L 15 12 0.8 8 66.7
Table 6 Relative contribution for outcome in the ICU of the admission SOFA score and delta SOFA
Variable b SE Wald p R Odds-ratio (95% confidence intervals)
Admission total SOFAscore
0.308 0.022 192.784 < 0.001 0.356 1.361 (1.303±1.421)
Delta SOFA 0.312 0.024 170.274 < 0.001 0.334 1.367 (1.303±1.432)
Constant �4.765 0.247 372.404
b, coefficient; SE, standard error; Wald, Wald statistic, R, partial correlation. Odds-ratios are presented for a 1-point change in the score.

sion total SOFA score and 1.37 (95 % confidence inter-val 1.30±1.43) for the delta SOFA score.
Discussion
Multiple organ dysfunction syndrome (MODS) has be-come the leading cause of morbidity and mortality in in-tensive care [31±33]. Described initially by Tilney et al.in 1973 after massive acute blood loss and shock [34], itwas found later to be associated with infection [35, 36],acute pancreatitis [37], burns [38], shock [39] and trau-ma [40].
As emphasised by a recent Consensus Conference[41], there is a need for a comprehensive database totest and validate optimal criteria for describing this syn-drome, in which specific variables could be testedagainst outcome. Various efforts to this end have ap-peared recently in the literature [26, 42±44]. All werebuilt on the common assumptions: that one can describeincreasing dysfunction in individual organs and assessMODS as a continuum of organ dysfunction/failure in-stead of an on/off phenomenon. However, limitationsexist for all. The systems proposed by Marshall et al.(multiple organ dysfunction score) and by Bernardet al.(Brussels score) have not been tested in a multicen-tre representative database of critically ill patients. Thesystem proposed by Le Gall et al., logistic organ dys-function (LOD) score, was developed with very sophis-ticated statistical techniques to choose and weigh thevariables in a large international database. However, itwas developed and validated with data collected onlyin the first 24 h in the ICU and no information existsabout its behaviour at later stages in the evolution ofMODS.
A panel of experts constructed the latest system,SOFA score, based on a review of the literature. Thismethodology, has been applied successfully in the past[45] but needs extensive validation in order to evaluatethe adequacy of the variables chosen and their limits.This was recognised in the original description [26] andprompted the Working Group on Sepsis-related Prob-lems of the ESICM to perform a prospective, multina-tional validation study. The main data have been pre-sented elsewhere [27]. Based on these data, we studiedthe validity of two complementary measures as descrip-tors of morbidity in intensive care: total maximumSOFA score and delta SOFA.
The results show that, in this ICU patient database,total maximum SOFA score showed a very good corre-lation to outcome and occurred early during the ICUstay. All the individual organ scores were significantlyhigher in non-survivors than in survivors, with a clearcorrelation between increasing score and increasingmortality except for low values (less than 3) of the neu-rological and respiration scores, where the patterns
were not clear. The same relation was present when welimited the analysis to organ failure (SOFA score ³ 3points). The discriminative power was very good (areaunder ROC curve 0.847, SE 0.012). For individual organscores, the best discriminative power was seen for car-diovascular score. In multivariate analysis the impacton outcome of organ dysfunction/failure was higher forcardiovascular (odds ratio 1.68) and renal (odds ratio1.46) scores. The hepatic dysfunction/failure did notshow a significant impact on prognosis (odds ratio0.82). No significant interactions were seen between in-dividual organ failures. Using principal componentsanalysis, a clear pattern was seen when we analysed or-gan failures (SOFA score ³ 3 points), with a two-factorstructure: respiratory, cardiovascular and neurological,and coagulation, hepatic and renal. In the overall analy-sis the same pattern was present although less clear, withthe cardiovascular score having an intermediate posi-tion.
The amount of organ dysfunction/failure occurringafter ICU admission (delta SOFA) also showed a goodcorrelation to outcome. On multivariate analysis this ef-fect was still significant after controlling for admissionscore. It should be noted that the delta SOFA ability todistinguish between patients who died and patientswho survived was lower than that of the total maximumSOFA score or even than of the admission SOFA score.This stresses the importance of the degree of physiolog-ical derangement on admission to the ICU [46±48] andof cumulative organ dysfunction [31, 43] to the progno-sis.
Why use a total maximum SOFA score instead of asimpler measure? Our rationale was that a daily evalua-tion would not be able to capture the overall amount oforgan dysfunction/failure sustained by the patient dur-ing the course of the disease. Different organs are af-fected in this complex physiopathological process at dif-ferent points in time [32] and a daily evaluation, al-though appealing, can miss the total amount of organdysfunction sustained by the patient, leading to an un-derestimation of the cumulative insult suffered. It hasbeen shown that mortality due to MODS depends onthe number of failing organs [31, 43, 49], on the severityof the dysfunction/failure [43, 44], on the particularcombination of failing organs [49±51] and on the dura-tion [31, 49]. Our system, following the path of previouswork by Marshall et al. [43], allows the quantification ofall these conditions. Alternative approaches, based onthe daily application of severity scores have been pro-posed [48, 52±57] but are usually limited to the firstdays in the ICU [48, 54] or have later failed to confirmtheir initial performances [58].
Additionally, the proposed system allows the distinc-tion between the dysfunction/failure already present atICU admission (which depends mainly on admissionpolicies), the dysfunction/failure that appears during
692

the ICU stay and the evaluation of the total insult suf-fered by the patient. All are very important by them-selves, as shown in Table 6, but also address comple-mentary facets of a complex response. The admissionSOFA reflects the degree of failure already presentwhen the patient enters the ICU. This measurement,that only the admission mortality prediction model [47]is able to achieve, can be used to stratify patients ac-cording to severity of illness, for example, for inclusionin clinical trials based on the admission SOFA score.The delta SOFA measures the progress of the patientduring the ICU stay and is potentially influenced bytherapy. The fact that it was a good prognostic indicatorafter controlling for admission SOFA score suggeststhat strategies directed at the prevention and/or limita-tion of further organ dysfunction will have a significantimpact on prognosis, independent of the condition ofthe patient on admission to the ICU. This certainlyneeds further research. Last but not least, the quantifi-cation of the total insult suffered by the patient duringthe ICU stay (total maximum SOFA) was a very impor-tant prognostic indicator. This suggests that it can beused to quantify the impact of therapeutic interventionson overall or organ-specific morbidity. Some but not allof those interventions could also have an impact onmortality, but to focus exclusively on mortality as anend point could lead to an underestimation of the rele-vant effects of therapeutic interventions obscured bythe heterogeneity of causes of death.
What is the precise nature of the two-factor structureobserved? What are the precise relationships betweenthe respiratory, cardiovascular and neurological systemsor between the coagulation, hepatic and renal systems?One tempting explanation could be the presence oftwo targets in this complex syndrome. If this is thecase, the first association would represent the primaryinsult (e. g. shock or severe respiratory failure) and thesecond its late consequences, appearing as a result ofthe host response to the primary insult. This two-targetexplanation is consistent with previous descriptions[41, 59] but must be tested in adequate models. Thepresence of neurological dysfunction/failure in the firstfactor could be explained by the presence of patientswith trauma in this database (181 patients, althoughprobably not all with head trauma) or by the early onsetof septic encephalopathy in MODS [60]. Moreover,concerns about the reliability of the evaluation of neu-rological dysfunction in critically ill patients have re-cently been raised [61], although not shared by all theresearchers [62, 63]. Maybe when physiologists returnfrom the drawing board, as recently suggested [64], wewill gain more insight into the explanation of this phe-nomenon.
Our study presents some limitations that must be ac-knowledged. First, we only evaluated the relationshipof SOFA with ICU outcome and not with hospital or
30-day mortality. This fact could have introduced somebias in the analyses and more research should be under-taken to examine whether there exists a link betweenorgan dysfunction/failure during the ICU stay, short-term (ICU) mortality and long-term mortality. For thatpurpose, patients must be followed after ICU dischargeand monitored for the development of further complica-tions. Second, SOFA, similar to all the published organfailure scores, uses the Glasgow coma score for neuro-logical evaluation [65] and this computation can bevery difficult or impossible in sedated patients and veryprone to errors in data collection. Certainly we need todevelop better ways to assess neurological dysfunctionin the critically ill, non-trauma patient.
The best treatment for MODS is certainly preven-tion. Unfortunately, this is not possible in many cases.New diagnostic tools and new therapeutic options areneeded to deal with this complex syndrome that is re-sponsible for so many deaths. In the meantime, instru-ments like the SOFA score and their derived measuresshould be used for the evaluation and quantification oforgan dysfunction/failure.
Acknowledgements The authors want to acknowledge the effortsin data collection by all the participants in the study. A completelist of participating centres can be found in J.-L. Vincent et al. [27].
Appendix
SOFA score was computed at admission and for every24 h period from the most deranged values for each ofthe organ systems considered [26].
An example of the computation of the associated val-ues is shown below:
A patient was admitted to the ICU subsequent to sur-gery for a perforated duodenal ulcer, complicated byperitonitis. At admission, he had respiratory failurewith a PaO2/FiO2 ratio of 180 on mechanical ventilation,mild cardiovascular dysfunction (mean arterial pressure60 mmHg without vasoactive drugs), and mild neuro-logical dysfunction (Glasgow Coma score 14). Therewere no renal, liver or coagulation disturbances (bloodcreatinine 1.0 mg/dl, serum bilirubin 1.0 mg/dl and250 � 103platelets/mm3). The SOFA score computed atadmission was 5 points.
During his ICU stay, the respiratory function im-proved with the patient being weaned from the ventila-tor on day 2 and presenting a PaO2/FiO2 ratio of 420 onthe day of discharge. Cardiovascular support with do-butamine was needed on days 1 and 2. A mild renal dys-function (creatinine 1.6) was present on days 1 and 2.Thrombocytopenia (minimal value 40 � 103platelets/mm3) and hyperbilirubinaemia (maximum serum biliru-bin 7.8 mg/dl) appeared during the ICU stay. Neurologi-cal function worsened during days 2 and 3 (Glasgow
693
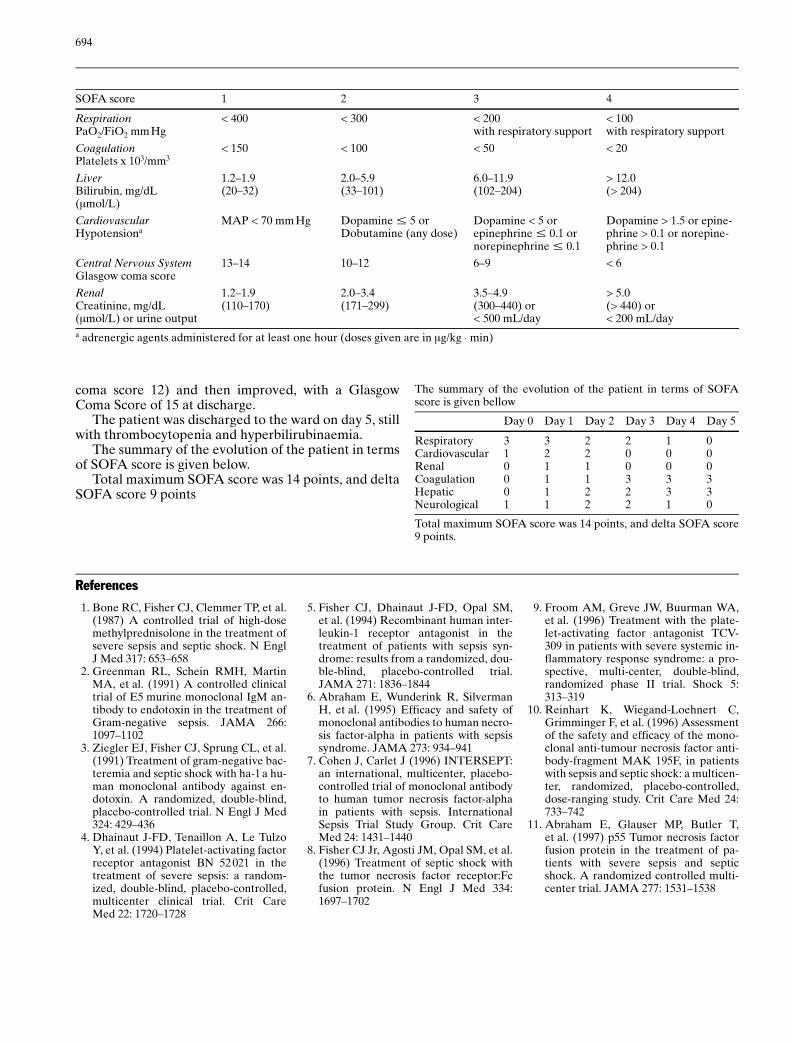
coma score 12) and then improved, with a GlasgowComa Score of 15 at discharge.
The patient was discharged to the ward on day 5, stillwith thrombocytopenia and hyperbilirubinaemia.
The summary of the evolution of the patient in termsof SOFA score is given below.
Total maximum SOFA score was 14 points, and deltaSOFA score 9 points
694
The summary of the evolution of the patient in terms of SOFAscore is given bellow
Day 0 Day 1 Day 2 Day 3 Day 4 Day 5
Respiratory 3 3 2 2 1 0Cardiovascular 1 2 2 0 0 0Renal 0 1 1 0 0 0Coagulation 0 1 1 3 3 3Hepatic 0 1 2 2 3 3Neurological 1 1 2 2 1 0
Total maximum SOFA score was 14 points, and delta SOFA score9 points.
References
1. Bone RC, Fisher CJ, Clemmer TP, et al.(1987) A controlled trial of high-dosemethylprednisolone in the treatment ofsevere sepsis and septic shock. N EnglJ Med 317: 653±658
2. Greenman RL, Schein RMH, MartinMA, et al. (1991) A controlled clinicaltrial of E5 murine monoclonal IgM an-tibody to endotoxin in the treatment ofGram-negative sepsis. JAMA 266:1097±1102
3. Ziegler EJ, Fisher CJ, Sprung CL, et al.(1991) Treatment of gram-negative bac-teremia and septic shock with ha-1 a hu-man monoclonal antibody against en-dotoxin. A randomized, double-blind,placebo-controlled trial. N Engl J Med324: 429±436
4. Dhainaut J-FD, Tenaillon A, Le TulzoY, et al. (1994) Platelet-activating factorreceptor antagonist BN 52 021 in thetreatment of severe sepsis: a random-ized, double-blind, placebo-controlled,multicenter clinical trial. Crit CareMed 22: 1720±1728
5. Fisher CJ, Dhainaut J-FD, Opal SM,et al. (1994) Recombinant human inter-leukin-1 receptor antagonist in thetreatment of patients with sepsis syn-drome: results from a randomized, dou-ble-blind, placebo-controlled trial.JAMA 271: 1836±1844
6. Abraham E, Wunderink R, SilvermanH, et al. (1995) Efficacy and safety ofmonoclonal antibodies to human necro-sis factor-alpha in patients with sepsissyndrome. JAMA 273: 934±941
7. Cohen J, Carlet J (1996) INTERSEPT:an international, multicenter, placebo-controlled trial of monoclonal antibodyto human tumor necrosis factor-alphain patients with sepsis. InternationalSepsis Trial Study Group. Crit CareMed 24: 1431±1440
8. Fisher CJ Jr, Agosti JM, Opal SM, et al.(1996) Treatment of septic shock withthe tumor necrosis factor receptor:Fcfusion protein. N Engl J Med 334:1697±1702
9. Froom AM, Greve JW, Buurman WA,et al. (1996) Treatment with the plate-let-activating factor antagonist TCV-309 in patients with severe systemic in-flammatory response syndrome: a pro-spective, multi-center, double-blind,randomized phase II trial. Shock 5:313±319
10. Reinhart K, Wiegand-Loehnert C,Grimminger F, et al. (1996) Assessmentof the safety and efficacy of the mono-clonal anti-tumour necrosis factor anti-body-fragment MAK 195F, in patientswith sepsis and septic shock: a multicen-ter, randomized, placebo-controlled,dose-ranging study. Crit Care Med 24:733±742
11. Abraham E, Glauser MP, Butler T,et al. (1997) p55 Tumor necrosis factorfusion protein in the treatment of pa-tients with severe sepsis and septicshock. A randomized controlled multi-center trial. JAMA 277: 1531±1538
SOFA score 1 2 3 4
RespirationPaO2/FiO2 mmHg
< 400 < 300 < 200with respiratory support
< 100with respiratory support
CoagulationPlatelets x 103/mm3
< 150 < 100 < 50 < 20
LiverBilirubin, mg/dL(mmol/L)
1.2±1.9(20±32)
2.0±5.9(33±101)
6.0±11.9(102±204)
> 12.0(> 204)
CardiovascularHypotensiona
MAP < 70 mm Hg Dopamine K 5 orDobutamine (any dose)
Dopamine < 5 orepinephrine K 0.1 ornorepinephrine K 0.1
Dopamine > 1.5 or epine-phrine > 0.1 or norepine-phrine > 0.1
Central Nervous SystemGlasgow coma score
13±14 10±12 6±9 < 6
RenalCreatinine, mg/dL(mmol/L) or urine output
1.2±1.9(110±170)
2.0±3.4(171±299)
3.5±4.9(300±440) or< 500 mL/day
> 5.0(> 440) or< 200 mL/day
a adrenergic agents administered for at least one hour (doses given are in mg/kg × min)

695
12. Bernard GR, Wheeler AP, Russell JA,et al. (1997) The effects of ibuprofenon the physiology and survival of pa-tients with sepsis. N Engl J Med 336:912±918
13. Fein AM, Bernard GR, Criner GJ, et al.(1997) Treatment of severe systemic in-flammatory response syndrome andsepsis with a novel bradykinin antago-nist, deltibant (CP-0127). Results of arandomized, double-blind, placebo-controlled trial. JAMA 277: 482±487
14. Sibbald WJ, Vincent J-L (1995) Roundtable conference on clinical trials forthe treatment of sepsis. Brussels, March12±14, 1994. Intensive Care Med 21:184±189
15. Jencks SF, Williams DK, Kay TL (1988)Assessing hospital-associated deathsfrom discharge data. The role of lengthof stay and comorbidities. JAMA 260:2240±2246
16. Petros AJ, Marshall JC, Van-Saene HK(1995) Should morbidity replace mor-tality as an endpoint for clinical trialsin intensive care? Lancet 345: 369±371
17. Knaus WA, Wagner DP, Harrell FE,Draper EA (1994) What determinesprognosis in sepsis? Evidence for acomprehensive individual patient riskassessment approach to the design andanalysis of clinical trials. In: ReinhartK, Eyrich K, Sprung C (eds) Sepsis.Current Perspectives in Pathophysiolo-gy and Therapy. Springer, Berlin Hei-delberg, pp 23±37
18. Le Gall J-R, Lemeshow S, Leleu G,et al. (1995) Customized probabilitymodels for early severe sepsis in adultintensive care patients. JAMA 273:644±650
19. Sprung CL, Finch RG, Thijs LG, Glau-ser MP (1996) International sepsis trial(INTERSEPT): role and impact of aclinical evaluation committee. CritCare Med 24: 1441±1447
20. Knaus WA, Harrell FE, Fisher CJ, et al.(1993) The clinical evaluation of newdrugs for sepsis. A prospective study de-sign based on survival analysis. JAMA270: 1233±1241
21. Knaus WA (1994) Principles of severitystratification and outcome predictionin sepsis and shock. Intensive CareMed 20: S115
22. Stoutenbeek CP, Van Saene HK, Miran-da DR, Zandstra DF (1984) The effectof selective decontamination of the di-gestive tract on colonisation and infec-tion rate in multiple trauma patients.Intensive Care Med 10: 185±192
23. Kollef MH (1994) The role of selectivedigestive tract decontamination on mor-tality and respiratory tract infections. Ameta-analysis. Chest 105: 1101±1108
24. GrØgoire G, Derderian F, Le Lorier J(1995) Selecting the language of thepublications included in a meta-analy-sis: is there a tower of Babel bias? JClin Epidemiol 48: 159±163
25. Hoffman SL, Punjabi NH, Kumala S,et al. (1984) Reduction of mortality inchloramphenicol treated severe thy-phoid fever by high-dose dexametha-sone. N Engl J Med 310: 82±88
26. Vincent J-L, Moreno R, Takala J, et al.(1996) The SOFA (Sepsis-related organfailure assessment) score to describe or-gan dysfunction/failure. Intensive CareMed 22: 707±710
27. Vincent J-L, De Mendonça A, Can-traine F, et al. (1998) Use of the SOFAscore to assess the incidence of organdysfunction/failure in intensive careunits: results of a multicentric, prospec-tive study. Crit Care Med 26: 1793±1800
28. Hanley J, McNeil B (1982) The mean-ing and use of the area under a receiveroperating characteristic (ROC) curve.Radiology 143: 29±36
29. Hanley J, McNeil B (1983) A method ofcomparing the areas under receiver op-erating characteristic curves derivedfrom the same cases. Radiology 148:839±843
30. Kleinbaum DG, Kupper LL, Muller KE(1987) Applied regression analysis andother multivariate methods. PWS-KentPublishing Company, Boston
31. Knaus WA, Draper EA, Wagner DP,Zimmerman JE (1985) Prognosis inacute organ-system failure. Ann Surg202: 685±693
32. Deitch EA (1992) Multiple organ fail-ure: pathophysiology and potential fu-ture therapy. Ann Surg 216: 117±134
33. Tran DD (1994) Age, chronic disease,sepsis, organ system failure and mortal-ity in the elderly admitted to the inten-sive care medicine. Intensive Care Med20: S110
34. Tilney NL, Baily GL, Morgan AP(1973) Sequential system failure afterrupture of abdominal aortic aneurysms:an unsolved problem in postoperativecare. Ann Surg 178: 117±122
35. Fry DE, Pearlstein L, Fulton RL, PolkHC (1980) Multiple system organ fail-ure. The role of uncontrolled infection.Arch Surg 115: 136±140
36. Bell RC, Coalson JJ, Smith JD, Johan-son WG (1983) Multiple organ failureand infection in adult respiratory dis-tress syndrome. Ann Intern Med 99:293±298
37. Tran DD, Cuesta MA (1992) Evalua-tion of severity in patients with acutepancreatitis. Am J Gastroenterol 87:604±608
38. Marshall WG, Dimick AR (1983) Natu-ral history of major burns with multiplesubsystem failure. J Trauma 23: 102±105
39. Henao FJ, Daes JE, Dennis RJ (1991)Risk factors for multiorgan failure: acase-control study. J Trauma 31: 74±80
40. Faist E, Baue AE, Dittmer H, HebererG (1983) Multiple organ failure in poly-trauma patients. J Trauma 23: 775±787
41. Members of the American College ofChest Physicians and the Society ofCritical Care Medicine Consensus Con-ference Committee (1992) AmericanCollege of Chest Physicians / Society ofCritical Care Medicine Consensus Con-ference: definitions of sepsis and multi-ple organ failure and guidelines for theuse of innovative therapies in sepsis.Crit Care Med 20: 864±874
42. Bernard GR, Doig BG, Hudson G,et al. (1995) Quantification of organfailure for clinical trials and clinicalpractice. Am J Respir Crit Care Med151: A323
43. Marshall JC, Cook DA, Christou NV,Bernard GR, Sprung CL, Sibbald WJ(1995) Multiple organ dysfunctionscore: a reliable descriptor of a complexclinical outcome. Crit Care Med 23:1638±1652
44. Le Gall JR, Klar J, Lemeshow S, et al.(1996) The logistic organ dysfunctionsystem. A new way to assess organ dys-function in the intensive care unit.JAMA 276: 802±810
45. Knaus WA, Draper EA, Wagner DP,Zimmerman JE (1985) APACHE II: aseverity of disease classification system.Crit Care Med 13: 818±829
46. Knaus WA, Wagner DP, Draper EA,et al. (1991) The APACHE III prognos-tic system. Risk prediction of hospitalmortality for critically ill hospitalizedadults. Chest 100: 1619±1636
47. Lemeshow S, Teres D, Klar J, AvruninJS, Gehlbach SH, Rapoport J (1993)Mortality Probability Models (MPMII) based on an international cohort ofintensive care unit patients. JAMA270: 2478±2486
48. Wagner DP, Knaus WA, Harrel FE Jr,Zimmerman JE, Watts C (1994) Dailyprognostic estimates for critically illadults in intensive care units: resultsfrom a prospective, multicenter, incep-tion cohort analysis. Crit Care Med 22:1359±1372
49. Zimmerman JE, Knaus WA, Sun X,Wagner DP (1996) Severity stratifica-tion and outcome prediction for multi-system organ failure and dysfunction.World J Surg 20: 401±405

696
50. Hebert PC, Drummond AJ, Singer J,Bernard GR, Russell JA (1993) A sim-ple multiple system organ failure scor-ing system predicts mortality of patientswho have sepsis syndrome. Chest 104:230±235
51. Fagon J-Y, Chastre J, Novara A, Medi-oni P, Gilbert C (1993) Characterizationof intensive care unit patients using amodel based on the presence or absenceof organ dysfunctions and/or infection:the ODIN model. Intensive Care Med19: 137±144
52. Chang RWS, Jacobs S, Lee B (1988)Predicting outcome among intensivecare unit patients using computerisedtrend analysis of daily Apache II scorescorrected for organ system failure. In-tensive Care Med 14: 558±566
53. Chang RWS (1989) Individual outcomeprediction models for intensive careunits. Lancet i: 143±146
54. Lemeshow S, Klar J, Teres D, et al.(1994) Mortality probability models forpatients in the intensive care unit for 48or 72 hours: a prospective, multicenterstudy. Crit Care Med 22: 1351±1358
55. Rogers J, Fuller HD (1994) Use of dailyacute physiology and chronic healthevaluation (APACHE) II scores to pre-dict individual patient survival rate.Crit Care Med 22: 1402±1405
56. Yzerman EP, Boelens HA, Tjhie JH,Kluytmans JA, Mouton JW, VerbrughHA (1996) Delta APACHE II for pre-dicting course and outcome of nosoco-mial Staphylococcus aureus bacteremiaand its relation to host defense. J InfectDis 173: 914±919
57. Pittet D, ThiØvent B, Wenzel RP, Li N,Auckenthaler R, Suter PM (1996) Bed-side prediction of mortality from bacte-riemic sepsis. A dynamic analysis ofICU patients. Am J Respir Crit CareMed 153: 684±693
58. Jacobs S, Arnold A, Clyburn PA, WillisBA (1992) The Riyadh intensive careprogram applied to a mortality analysisof a teaching hospital intensive careunit. Anaesth Resusc Intensive Ther47: 775±780
59. Redl H, Schlag G (1990) Pathophysiol-ogy of multi-organ failure (MOF) ± pro-posed mechanisms. Clin Intensive Care1: 66±71
60. Eidelman LA, Putterman D, PuttermanC, Sprung CL (1996) The spectrum ofseptic encephalopathy. Definitions, eti-ologies, and mortalities. JAMA 275:470±473
61. Rowan K (1996) The reliability of casemix measurements in intensive care.Curr Opin Crit Care 2: 209±213
62. Damiano AM, Bergner M, Draper EA,Knaus WA, Wagner DP (1992) Reli-ability of a measure of severity of ill-ness: acute physiology and chronichealth evaluation -II. J Clin Epidemiol45: 93±101
63. Bastos PG, Sun X, Wagner DP, Wu AW,Knaus WA (1993) Glasgow coma scalescore in the evaluation of outcome inthe intensive care unit: findings fromthe acute physiology and chronic healthevaluation III study. Crit Care Med 21:1459±1465
64.Chernow B (1996) Back to the drawingboard. Crit Care Med 24: 1097±1098
65. Bernard GR (1998) Quantification oforgan dysfunction: seeking standardiza-tion. Crit Care Med 26: 1767±1768