5.12 Traffic and Transportation - California Energy … a n J o a q u i n C o u n t ySan Joaquin...
29
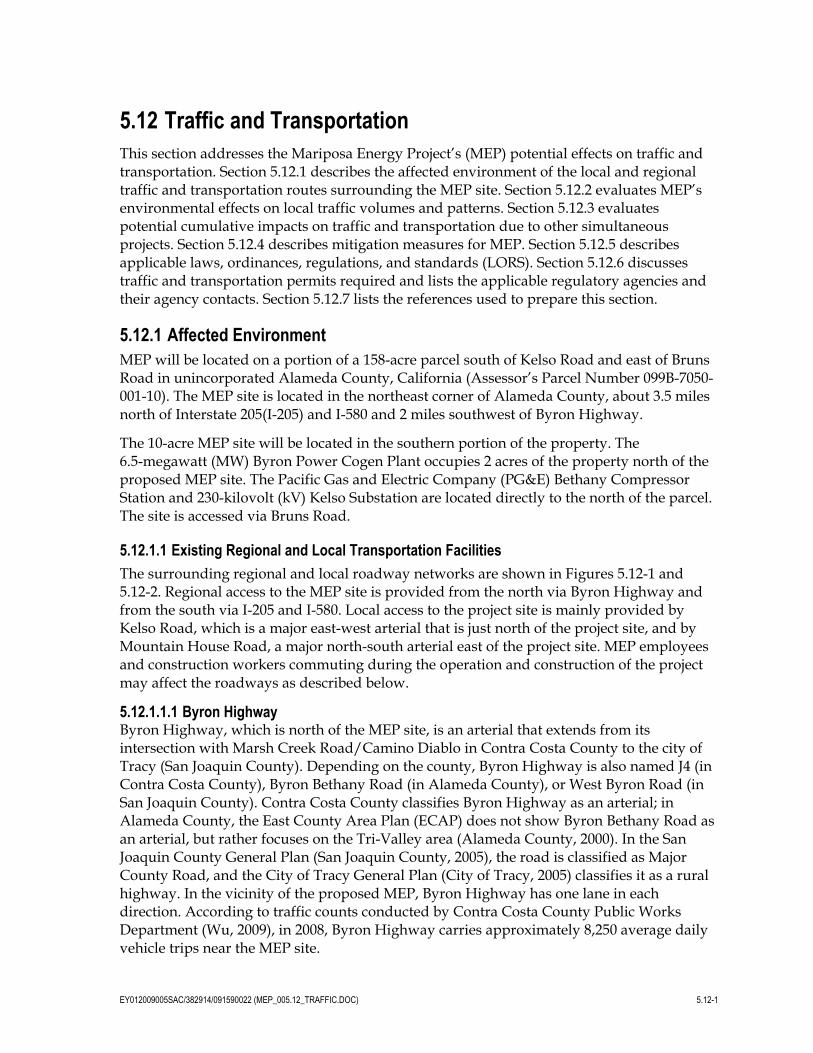
5.12 Traffic and Transportation This section addresses the Mariposa Energy Project’s (MEP) potential effects on traffic and transportation. Section 5.12.1 describes the affected environment of the local and regional traffic and transportation routes surrounding the MEP site. Section 5.12.2 evaluates MEP’s environmental effects on local traffic volumes and patterns. Section 5.12.3 evaluates potential cumulative impacts on traffic and transportation due to other simultaneous projects. Section 5.12.4 describes mitigation measures for MEP. Section 5.12.5 describes applicable laws, ordinances, regulations, and standards (LORS). Section 5.12.6 discusses traffic and transportation permits required and lists the applicable regulatory agencies and their agency contacts. Section 5.12.7 lists the references used to prepare this section. 5.12.1 Affected Environment MEP will be located on a portion of a 158-acre parcel south of Kelso Road and east of Bruns Road in unincorporated Alameda County, California (Assessor’s Parcel Number 099B-7050- 001-10). The MEP site is located in the northeast corner of Alameda County, about 3.5 miles north of Interstate 205(I-205) and I-580 and 2 miles southwest of Byron Highway. The 10-acre MEP site will be located in the southern portion of the property. The 6.5-megawatt (MW) Byron Power Cogen Plant occupies 2 acres of the property north of the proposed MEP site. The Pacific Gas and Electric Company (PG&E) Bethany Compressor Station and 230-kilovolt (kV) Kelso Substation are located directly to the north of the parcel. The site is accessed via Bruns Road. 5.12.1.1 Existing Regional and Local Transportation Facilities The surrounding regional and local roadway networks are shown in Figures 5.12-1 and 5.12-2. Regional access to the MEP site is provided from the north via Byron Highway and from the south via I-205 and I-580. Local access to the project site is mainly provided by Kelso Road, which is a major east-west arterial that is just north of the project site, and by Mountain House Road, a major north-south arterial east of the project site. MEP employees and construction workers commuting during the operation and construction of the project may affect the roadways as described below. 5.12.1.1.1 Byron Highway Byron Highway, which is north of the MEP site, is an arterial that extends from its intersection with Marsh Creek Road/Camino Diablo in Contra Costa County to the city of Tracy (San Joaquin County). Depending on the county, Byron Highway is also named J4 (in Contra Costa County), Byron Bethany Road (in Alameda County), or West Byron Road (in San Joaquin County). Contra Costa County classifies Byron Highway as an arterial; in Alameda County, the East County Area Plan (ECAP) does not show Byron Bethany Road as an arterial, but rather focuses on the Tri-Valley area (Alameda County, 2000). In the San Joaquin County General Plan (San Joaquin County, 2005), the road is classified as Major County Road, and the City of Tracy General Plan (City of Tracy, 2005) classifies it as a rural highway. In the vicinity of the proposed MEP, Byron Highway has one lane in each direction. According to traffic counts conducted by Contra Costa County Public Works Department (Wu, 2009), in 2008, Byron Highway carries approximately 8,250 average daily vehicle trips near the MEP site. EY012009005SAC/382914/091590022 (MEP_005.12_TRAFFIC.DOC) 5.12-1
Transcript of 5.12 Traffic and Transportation - California Energy … a n J o a q u i n C o u n t ySan Joaquin...
5.12 Traffic and Transportation This section addresses the Mariposa Energy Project’s (MEP) potential effects on traffic and transportation. Section 5.12.1 describes the affected environment of the local and regional traffic and transportation routes surrounding the MEP site. Section 5.12.2 evaluates MEP’s environmental effects on local traffic volumes and patterns. Section 5.12.3 evaluates potential cumulative impacts on traffic and transportation due to other simultaneous projects. Section 5.12.4 describes mitigation measures for MEP. Section 5.12.5 describes applicable laws, ordinances, regulations, and standards (LORS). Section 5.12.6 discusses traffic and transportation permits required and lists the applicable regulatory agencies and their agency contacts. Section 5.12.7 lists the references used to prepare this section.
5.12.1 Affected Environment MEP will be located on a portion of a 158-acre parcel south of Kelso Road and east of Bruns Road in unincorporated Alameda County, California (Assessor’s Parcel Number 099B-7050-001-10). The MEP site is located in the northeast corner of Alameda County, about 3.5 miles north of Interstate 205(I-205) and I-580 and 2 miles southwest of Byron Highway.
The 10-acre MEP site will be located in the southern portion of the property. The 6.5-megawatt (MW) Byron Power Cogen Plant occupies 2 acres of the property north of the proposed MEP site. The Pacific Gas and Electric Company (PG&E) Bethany Compressor Station and 230-kilovolt (kV) Kelso Substation are located directly to the north of the parcel. The site is accessed via Bruns Road.
5.12.1.1 Existing Regional and Local Transportation Facilities The surrounding regional and local roadway networks are shown in Figures 5.12-1 and 5.12-2. Regional access to the MEP site is provided from the north via Byron Highway and from the south via I-205 and I-580. Local access to the project site is mainly provided by Kelso Road, which is a major east-west arterial that is just north of the project site, and by Mountain House Road, a major north-south arterial east of the project site. MEP employees and construction workers commuting during the operation and construction of the project may affect the roadways as described below.
5.12.1.1.1 Byron Highway Byron Highway, which is north of the MEP site, is an arterial that extends from its intersection with Marsh Creek Road/Camino Diablo in Contra Costa County to the city of Tracy (San Joaquin County). Depending on the county, Byron Highway is also named J4 (in Contra Costa County), Byron Bethany Road (in Alameda County), or West Byron Road (in San Joaquin County). Contra Costa County classifies Byron Highway as an arterial; in Alameda County, the East County Area Plan (ECAP) does not show Byron Bethany Road as an arterial, but rather focuses on the Tri-Valley area (Alameda County, 2000). In the San Joaquin County General Plan (San Joaquin County, 2005), the road is classified as Major County Road, and the City of Tracy General Plan (City of Tracy, 2005) classifies it as a rural highway. In the vicinity of the proposed MEP, Byron Highway has one lane in each direction. According to traffic counts conducted by Contra Costa County Public Works Department (Wu, 2009), in 2008, Byron Highway carries approximately 8,250 average daily vehicle trips near the MEP site.
EY012009005SAC/382914/091590022 (MEP_005.12_TRAFFIC.DOC) 5.12-1

5.12 TRAFFIC AND TRANSPORTATION
5.12-2 EY012009005SAC/382914/091590022 (MEP_005.12_TRAFFIC.DOC)
5.12.1.1.2 Kelso Road Kelso Road is a local, east-west road that begins at the State Water Agency site and ends at its intersection with North Great Valley Parkway, near West Byron Road. Kelso Road is a two-lane roadway in the MEP site vicinity.
5.12.1.1.3 Mountain House Road Mountain House Road is north-south local road that begins at Byron Highway and ends at its intersection with West Grant Line Road near I-580. Mountain House Road is a two-lane roadway in the MEP site vicinity. The City of Tracy General Plan (City of Tracy, 2005) classifies the roadway as a two-lane rural highway.
5.12.1.1.4 West Grant Line Road West Grant Line Road is a primarily an east-west roadway that begins south of I-580 (connecting to I-580 via a diamond interchange) and ends at Byron Bethany Road. West Grant Line Road is a two-lane, rural roadway in the MEP site vicinity.
5.12.1.1.5 Interstate 205 I-205, located south of the MEP site, is a four-lane, east-west divided freeway in San Joaquin County near Tracy, and a six-lane divided freeway in Alameda County near Midway Road. According to traffic counts published by Caltrans in 2007, I-205 carried approximately 112,000 daily vehicles near the Alameda/San Joaquin county line. Truck traffic accounts for approximately 12 percent of all trips on I-205 in the vicinity of I-580.
5.12.1.1.6 Interstate 580 I-580, located south of the MEP site, is a predominantly east-west freeway. I-580 is a four-lane freeway extending from I-5 in San Joaquin County (north of the Stanislaus County border) to Alameda County, where it connects with I-205 west of the San Joaquin County border. At the junction with I-205, I-580 widens to an eight-lane freeway and shifts to an east-west direction continuing through Alameda County. According to traffic counts published by Caltrans in 2007, I-580 carries approximately 144,000 daily vehicles near the West Grant Line Road interchange. Truck traffic accounts for approximately 13 percent of all trips on I-580 in the vicinity of I-205.
5.12.1.2 Existing Traffic Conditions and Level of Service Analysis Traffic analysis was conducted according to the 2000 Highway Capacity Manual (HCM) for freeway peak-hour and intersection level of service (LOS) analyses (Transportation Research Board, 2000). To determine local road and highway LOS, a planning-level methodology based on daily volumes was used.
5.12.1.2.1 Existing Roadway Conditions The ratio of the volume to the capacity (v/c) is an indicator of traffic conditions, speeds, and driver maneuverability. Table 5.12-1 reports traffic flow characteristics for different LOSs and was used to determine the LOS on freeway segments.
Table 5.12-2 shows the various LOS criteria based on daily volumes along highways and arterials.
In Alameda County, the ECAP states that LOS D on major arterial segments within unincorporated areas shall be achieved; Congestion Management Program- designated roadways such as I-580 should not operate beyond LOS E in unincorporated areas (Alameda County, 2000).

San
Joaq
uin
Cou
nty
San
Joaq
uin
Cou
nty
San
Joaq
uin
Cou
nty
San
Joaq
uin
Cou
nty
Alam
eda
Cou
nty
Alam
eda
Cou
nty
Alameda County
Alameda CountyContra Costa County
Contra Costa County
Con
tra C
osta
Cou
nty
Con
tra C
osta
Cou
nty
k
kk
k
k
LivermorePleasanton
Tracy
LivermorePleasanton
Tracy
ByronByron
Kelso Rd.Kelso Rd.Byron-Bethany Rd.
Byron-Bethany Rd.
Byron Hwy.
Byron Hwy.
Brun
s R
d.Br
uns
Rd.
Mou
ntai
n H
ouse
Pkw
y.M
ount
ain
Hou
se P
kwy.
Midw
ay Rd.
Midw
ay Rd.
Byron AirportByron Airport(3 miles from project site)(3 miles from project site)
BrentwoodBrentwood
OakleyOakleyAntiochAntioch
PittsburgPittsburg
Discovery BayDiscovery Bay
StocktonStockton
LathropLathrop
Byron
Kelso Rd.Byron-Bethany Rd.
Byron Hwy.
W. Grant Line Rd.W. Grant Line Rd.
Brun
s R
d.
Mou
ntai
n H
ouse
Pkw
y.
Midw
ay Rd.
Byron Airport(3 miles from project site)
Livermore Municipal AirportLivermore Municipal Airport(14 miles from project site)(14 miles from project site)
Livermore Municipal Airport(14 miles from project site) Tracy Municipal AirportTracy Municipal Airport
(11 miles from project site)(11 miles from project site)Tracy Municipal Airport(11 miles from project site)
New Jerusalem New Jerusalem AirportAirport(18 miles from (18 miles from project site)project site)
New Jerusalem Airport(18 miles from project site)
Funny Farm AirportFunny Farm Airport(11 miles from project site)(11 miles from project site)
Funny Farm Airport(11 miles from project site)
Brentwood
OakleyAntioch
Pittsburg
Discovery Bay
Stockton
Lathrop
580
580
205
5
5
680
FIGURE 5.12-1REGIONAL TRANSPORTATION MAPMariposa Energy ProjectAlameda County, California
EY012009005SAC Figure_5.12-1.ai 05.22.09 tdaus
LEGEND
Project Site
Local Airport
Major Freeway
Roads
Railroad/Lightrail
Project Location
0 2
Miles
4
k
Scale: 1:250,000

Alameda County
Alameda CountyContra Costa County
Contra Costa County
5
30
12
23
Byron AirportByron Airport(3 miles from project site)(3 miles from project site)Byron Airport(3 miles from project site)
Kelso Rd.Kelso Rd.
Byron Hwy.
Byron Hwy.
Brun
s R
d.Br
uns
Rd.
Kelso Rd.
Kelso Rd.
Kelso Rd.
Kelso Rd.
Bethany Ln.Bethany Ln.Bethany Ln.
Holey Rd.Holey Rd.Holey Rd.
Christensen Rd.Christensen Rd.Christensen Rd.
BethanyBethanyReservoirReservoirBethany
Reservoir
Clifton CourtClifton CourtForebayForebay
Clifton CourtForebay
Byron Hwy.
CanalCanal
CanalCanal
CanalCanal
CanalCanal
Canal
Canal
Brun
s R
d.
Byro
n H
ot S
prin
gs R
d.By
ron
Hot
Spr
ings
Rd.
Byro
n H
ot S
prin
gs R
d.
Arm
stro
ng R
d.Ar
mst
rong
Rd.
Arm
stro
ng R
d.
Mou
ntai
n H
ouse
Rd.
Mou
ntai
n H
ouse
Rd.
Mou
ntai
n H
ouse
Rd.
Patte
rson
Par
k R
d.Pa
tters
on P
ark
Rd.
Patte
rson
Par
k R
d.
Del
ta-M
endo
ta C
anal
Del
ta-M
endo
ta C
anal
Del
ta-M
endo
ta C
anal
Califor
nia Aqu
educ
t
Califor
nia Aqu
educ
t
Califor
nia Aqu
educ
t
Aqueduct
Aqueduct
Aqueduct
Priv
ate
Aque
duct
Priv
ate
Aque
duct
Priv
ate
Aque
duct
FIGURE 5.12-2LOCAL TRANSPORTATION MAPMariposa Energy ProjectAlameda County, California
EY012009005SAC Figure_5.12-2.ai 05.22.09 tdaus
LEGEND
Project Site
Railroad/Lightrail
Bicycle Trails
Pipelines
Tri Delta Transit Bus Route
0 1,000
Feet
2,000
Scale: 1:24,000

5.12 TRAFFIC AND TRANSPORTATION
TABLE 5.12-1 LOS Criteria for Basic Freeway Segments
LOS V/C Traffic Flow Characteristics
A 0.00 – 0.32 Free flow; insignificant delays
B 0.33 – 0.53 Stable operation; minimal delays
C 0.54 – 0.74 Stable operation; acceptable delays
D 0.75 – 0.90 Approaching unstable flow; queues develop rapidly but no excessive delays
E 0.91 – 1.00 Unstable operation; significant delays
F > 1.00 Forced flow; jammed conditions
Source: Transportation Research Board, 2000
TABLE 5.12-2 LOS Criteria for Highways and Arterials
Generalized Annual Average Daily Volumes
Type of Facility LOS A LOS B LOS C LOS D LOS E
2-lane Undivided Highway 2,400 8,000 14,900 21,100 26,700
2-lane Undivided Arterial * 4,000 13,100 15,500 16,300
Notes: Volumes shown are maximum daily traffic volumes at each LOS grade. * LOS A cannot be achieved for this facility type for daily LOS analysis.
Hourly counts were provided by the Contra Costa County Public Works Department for its portion of Byron Highway. Average daily traffic (ADT) volumes on other local streets were provided by the Alameda County Traffic Engineer. The counts along Kelso Road and along Mountain House Road were performed near the county line, and were reused on the segments described in Table 5.12-3 (because of its size, this table is provided at the end of this section). Daily counts, directional factors, and peak-hour factors for state facilities were found on the California Department of Transportation (Caltrans) website (Caltrans, 2009a). Truck percentages on State facilities were also found on Caltrans website (Caltrans, 2009b). All counts were adjusted to reflect year 2009 conditions by using a growth factor of 1 percent per year. A growth factor of 1 percent per year is a standard assumption when the local jurisdiction has not developed a growth rate.
All study area roadway segments currently operate at an acceptable LOS according to the ECAP performance criteria, as shown in Table 5.12-3 (because of its size, this table is provided at the end of this section).
In Contra Costa County, Bruns Road is a rural standard facility; the maximum acceptable v/c ratio is 0.74. Byron Highway is a regional route, and the maximum acceptable v/c ratio is 0.95. Assuming daily capacities of 16,300 and 26,700, respectively, and using the annual average daily volume (AADV) generated in Table 5.12-3, these two roadway segments currently operate at an acceptable LOS according to Contra Costa County performance criteria.
5.12.1.2.2 Existing Intersection Conditions The HCM 2000 methodology has been used to determine the intersection LOS at unsignalized intersections in the study area. The resulting delay is expressed using LOS,
EY012009005SAC/382914/091590022 (MEP_005.12_TRAFFIC.DOC) 5.12-7

5.12 TRAFFIC AND TRANSPORTATION
5.12-8 EY012009005SAC/382914/091590022 (MEP_005.12_TRAFFIC.DOC)
where LOS A represents free-flow activity and LOS F represents overcapacity operation. The relationship of delay and LOS at unsignalized intersections is summarized in Table 5.12-4.
TABLE 5.12-4 Unsignalized Intersection LOS Criteria
LOS Unsignalized Intersection Delay per Vehicle (seconds)
A 10.0
B >10.0 and 15.0
C >15.0 and 25.0
D >25.0 and 35.0
E >35.0 and 50.0
F >50.0
Source: Transportation Research Board, 2000
Because of unavailability of data for the area, only the following intersections were studied:
West Grant Line Road and Midway Road West Grant Line Road and I-580 EB Ramps West Grant Line Road and I-580 WB Ramps
The turning movement counts at the three locations in Alameda County were found in the Altamont Motorsports Park Rezoning Draft Environmental Impact Report (for the PM peak hour only) (Impact Sciences, 2008) and illustrated on Figure 5.12-3. At unsignalized intersections, where the minor street is controlled by stop signs, the resulting LOS reflects delays experienced by that minor street traffic. LOS D is the minimum acceptable LOS.
The results of the analysis are summarized in Table 5.12-5. Although the West Grant Line Road and Midway Road intersection has a relatively high delay on its minor approach, the volumes on that approach are only 12 vehicles per hour, so the intersection has an overall delay of 10.9 seconds per vehicle.
TABLE 5.12-5 Existing Intersection LOS Summary
PM Peak Hour
Intersection Delay (seconds) LOS
West Grant Line Road/I-580 EB Ramps (controlling approach: southbound on West Grant Line Road)
9.6 A
West Grant Line Road/I-580 WB Ramps (controlling approach: westbound on I-580 Ramp)
10.0 B
West Grant Line Road/Midway Road (controlling approach: northbound on Midway Road)
91.3 F

580
580
205
Christensen Rd.
West Grant Line Rd.
West Grant Line Rd.
Patte
rson
Pass
Rd.
Mid
way
Rd.
Mou
ntai
n H
ouse
Rd.
Mou
ntai
n H
ouse
Pkw
y.
Nor
th G
reat
Val
ley
Pkw
y.
Byron-Bethany Rd.Kelso Rd.
Contra Costa County
Alameda County
Alam
eda
Cou
nty
San
Joaq
uin
Cou
nty
San
Joaq
uin
Cou
nty
Brun
s R
d.
Project Location
W. Grant Line Rd.
I-580 EBRamps
T
R
0
L139
12
LT19516
T R12 19
W. Grant Line Rd.
Midway Rd.
L
R 8
4
LT8121
T R688 20
W. Grant Line Rd.
I-580 WBRamps
T
L
0
R 37
16
TR19549
L T15 136
Channelizer
FIGURE 5.12-3EXISTING PM PEAK HOUR TURNING MOVEMENTSMariposa Energy ProjectAlameda County, California
EY012009005SAC Figure_5.12-3.ai 05.22.09 tdaus
5.12 TRAFFIC AND TRANSPORTATION
5.12.1.3 Truck Routes—Weight and Load Limitations In addition to California Vehicle Code (CVC) Sections 35550-35559, San Joaquin County staff indicate that the county also has restrictions on county roads (Cooper, 2008). In 35 mile-per-hour (mph) zones, the weight limitation is 7 tons, and in 25 mph zones, the restriction drops to 5 tons. No map or list of roads is available.
Alameda County does not have a list of truck routes. County staff recommended the use of the most direct route and the use of Byron Highway as much as possible. However, trucks are banned on Mountain House Road by county ordinance (unless the final destination is along Mountain House Road) (Bates, 2009).
Contra Costa County does not have a list of truck routes in unincorporated parts of the County. If a weight or dimension exceeds the CVC’s provisions, the route proposed must be pre-approved by the permitting department.
5.12.1.4 Other Projects
5.12.1.4.1 Future Plans and Projects I-580 Tri-Valley Rapid Transit Corridor Improvements – Congestion during the morning and afternoon peak periods in the I-580 Corridor in eastern Alameda County rank among the most congested corridors in the Bay Area. The facility links the Central Valley to the Bay Area.
The addition of eastbound and westbound high-occupancy vehicle (HOV) lanes in the corridor from Greenville Road in Livermore to I-680 in Dublin/Pleasanton is a component of the planned improvements. Intelligent Transportation System, Traffic Operation System; HOV lanes, auxiliary lanes, and modifications at the I-580/I-680 interchange will also be included as part of those planned improvements. Regional Measure 2 funds will be used to complete Phase 1 of the project, including the design and construction of the eastbound HOV lane and preliminary studies on subsequent stages of the overall corridor improvements (Alameda County Congestion Management Agency, 2009).
5.12.1.4.2 Local Comprehensive Transportation Plans The Metropolitan Transportation Commission (MTC) Regional Transportation Plan
(Transportation 2030 (Metropolitan Transportation Commission, 2005)) details transportation investments throughout the nine-county San Francisco Bay Area from 2005 through 2030. In Alameda County, system efficiency improvements include an auto/truck separation lane at the I-580/I-205 interchange and an I-205/I-580 Altamont Pass westbound truck lane. System efficiency improvements in Contra Costa County include the widening of shoulders on Byron Highway and the construction of a grade separation over Union Pacific Railroad tracks.
The Alameda Countywide Transportation Plan is a long-range policy document that guides the development of the county’s transportation system (Alameda County Congestion Management Agency, 2008). Projects include local interchanges improvements along I-580 in Livermore and I-580 corridor improvements.
San Joaquin County Council of Governments’ (SJCOG) 2007 Regional Transportation Plan provides a general description of transportation improvements in the San Joaquin region (SJCOG, 2007). Short-range plan (2007–2019) action items include the addition of auxiliary lanes between Tracy Boulevard and Mountain House Parkway on I-205, and
EY012009005SAC/382914/091590022 (MEP_005.12_TRAFFIC.DOC) 5.12-11
5.12 TRAFFIC AND TRANSPORTATION
widening of I-205 between I-5 and Eleventh Street in Tracy. Long-range plan (2020-2030) action items include the modification of freeway-to-freeway connectors at I-5 and State Route (SR) 4, Highway 99 and SR-4, Route 120 at I-5, and SR-99.
The Contra Costa County Draft 2009 Countywide Comprehensive Transportation Plan lays out the county’s future transportation priorities (Contra Costa Transportation Authority, 2009). The list of projects includes the construction of the Route 239 (Byron Highway)/84 (Vasco Road) connector, the Byron Highway extension to Bethel Island, the Byron Highway Widening at Byron Elementary School, the replacement of Canal Road bridge, and the widening of Byron Highway at SR- 4 to provide for a second left turn lane.
5.12.1.5 Pedestrian/Bicycle Facilities The Final 2006 Alameda Countywide Bicycle Plan integrates bicycling into the Alameda County transportation system, providing connections to countywide destinations and adjacent counties (Alameda County Congestion Management Agency, 2006). The 2006 Countywide Strategic Pedestrian Plan concentrates on identifying and prioritizing pedestrian projects, programs and planning efforts of countywide significance (Alameda County Transportation Improvement Authority and Alameda County Congestion Management Agency, 2002).
The East Contra Costa County 2001 Bikeway Plan provides guidance for planning and funding East County bike projects (Contra Costa County, 2001). It also serves as the East County component of a larger, Countywide Bicycle and Pedestrian Plan (Contra Costa Transportation Authority, 2003).
The July 2002 Unincorporated San Joaquin County Bikeway Plan provides a blueprint for developing a bikeway system that includes on-street and support facilities and programs throughout the unincorporated parts of San Joaquin County (San Joaquin County and Fehrs and Peers Associates, 2002).
No existing or planned facilities are located in the vicinity of the MEP site.
5.12.1.6 Public Transportation The San Joaquin Regional Transit District operates 161 buses throughout the county, and
allows the passengers to transfer to local bus services at hub points. No routes are located near MEP (San Joaquin Regional Transit District, 2008).
The Amtrak San Joaquin’s intercity rail service includes six daily round trips with two trains stopping daily at the Cabral Station and Lodi Station (to and from Sacramento) and four trains stopping at the Burlington Northern Santa Fe station on San Joaquin Street (to and from the Bay Area) (Amtrak, 2009).
The Altamont Commuter Express (ACE) provides access to Silicon Valley and the Livermore/Almaden Valley with four trains daily between Stockton and San Jose (ACE, 2009). Two trains depart from Stockton in the morning and two from San Jose return in the evening. The ACE stops in Lathrop/Manteca, Tracy, Livermore, Pleasanton, Fremont, and Santa Clara and ends at the San Jose Diridon Station. The Tracy ACE station is located at Tracy Boulevard and Linne Road. The Vasco Road station is located on South Vasco Road in Livermore.
5.12-12 EY012009005SAC/382914/091590022 (MEP_005.12_TRAFFIC.DOC)

5.12 TRAFFIC AND TRANSPORTATION
The Tri-Delta Transit system provides bus service along the SR-4 corridor between Bay Point and Brentwood (Tri Delta Transit, 2009). The Delta Express Commuter recently expanded its service to include two stops in Mountain House (two pickups in the morning and two drop offs in the evening), going to the Dublin/Pleasanton Bay Area Rapid Transit station and the Hacienda Business Park. The bus stop is located on Legacy Drive in front of Wicklund Elementary School (Mountain House Community Services District, 2008). Bus lines operating in the MEP vicinity are illustrated in Figure 5.12-2.
A park-and-ride lot is located at the interchange of Grant Line Road/Naglee Road and I-205 (511.org, 2009).
5.12.1.7 Rail Traffic
There are no railroads with at-grade crossings on public roadways in the vicinity of MEP.
5.12.1.8 Air Traffic As shown on Figure 5.12-1, Byron Airport (Federal Aviation Administration [FAA] Identifier C83) is located about 2.7 miles northwest of the MEP site. For a 12-month period ending January 29, 2004, there was an average of 164 aircraft operations per day (AirNav, 2009). The MEP site is located within the airport’s influence area and subject to Compatibility Zone “D” Criteria:
Residential Development: Residential development is not restricted.
Nonresidential Development: Allowable intensities for nonresidential activities are not limited.
Uses Specifically Prohibited: No uses are specifically prohibited.
Height Limitations: Unless a specific exemption is granted, the height of objects shall be limited in accordance with the Byron Airport Airspace Protection Surfaces; generally, there is no concern with regard to any object up to 100 feet tall unless it is located on high ground or it is a solitary object such as an antenna more than 35 feet taller than other nearby objects. The Contra Costa County Airport Land Use Commission’s review is required for any proposed object taller than 100 feet (Contra Costa County, 2000).
Other Development Conditions: None.
5.12.2 Environmental Analysis This section assesses the traffic and transportation impacts associated with the construction and operation of MEP. This analysis primarily examines impacts on roadway LOSs expected during construction and operation of MEP.
Potential traffic impacts during construction, as well as plant operation after construction, have been considered and analyzed. Significance criteria were developed based on Appendix G of the CEQA Guidelines, which identifies significant impacts to be caused by a project if it results in an increase in traffic that is substantial relative to the amount of existing traffic and the capacity of the surrounding roadway network. Additionally, impacts are assessed in accordance with the criteria used by the counties and Caltrans. The more stringent criteria were used to determine project-related impacts.
EY012009005SAC/382914/091590022 (MEP_005.12_TRAFFIC.DOC) 5.12-13
5.12 TRAFFIC AND TRANSPORTATION
During the peak construction phase, MEP is expected to generate approximately 159 average daily construction worker trips (there will be a maximum of 177 workers per day, but it was assumed that 10 percent carpool with other workers). During operations, MEP is expected to generate no more than four vehicle trips per day during the daytime (three daily employees with an 8 AM-4 PM shift, and an operator with a 7 AM-7 PM shift). To analyze the worst-case scenario, traffic impacts associated with peak construction traffic were analyzed. A quantitative traffic analysis was not conducted for the long-term operations phase because it will generate a very low volume of trips.
5.12.2.1 Significance Criteria The significance criteria have been developed using guidance provided in CEQA, Appendix G (Title 14 California Code of Regulations 15000 et seq.) and relevant local policies. Impacts of the proposed project to transportation and circulation will be considered significant if the following criteria are met:
Cause an increase in traffic that is substantial in relation to the existing traffic load and capacity of the street system
Exceed, either individually or cumulatively, a LOS standard established by the county congestion management agency for designated roads or highways
Result in a change in air traffic patterns, including either an increase in traffic levels or a change in location that results in substantial safety risks
Substantially increase hazards due to a design feature or incompatible uses
Result in inadequate emergency access
Result in inadequate parking capacity
Conflict with adopted policies, plans, or programs supporting alternative transportation
5.12.2.2 “With Project” Traffic Conditions and LOS Analysis It is anticipated that the construction period (including grading and construction of the new facilities) will begin in the second quarter of 2011 and will be completed in the second quarter of 2012. The analysis of the “with project” traffic scenario was conducted for the peak month construction traffic.
5.12.2.2.1 Construction Traffic Generation To determine the construction traffic destined to the MEP site, Mariposa Energy provided construction data that included the anticipated number of delivery vehicles, haul vehicles, and employees.
Based on the construction data, a maximum of 177 construction workers per day during the peak construction period will be working at the MEP site.
Based on the provided construction data, a total of approximately 18 delivery/haul truck trips will be made to the MEP site per day. Of these 18 delivery/haul truck trips, it was assumed that two truck trips will access and leave the site during the peak hours. The remaining truck trips will occur throughout the day. For purposes of this analysis, the truck trips were converted to passenger car equivalent (PCE) trips at a ratio of 1.5 passenger cars
5.12-14 EY012009005SAC/382914/091590022 (MEP_005.12_TRAFFIC.DOC)

5.12 TRAFFIC AND TRANSPORTATION
for each truck, consistent with the HCM 2000 guidelines. The construction trip estimates are presented in Table 5.12-6.
TABLE 5.12-6 Construction Trip Generation Estimate
Total Trips Added
AM Peak Hour PM Peak Hour
Trip Type Daily In Out In Out
Delivery/ haul trucks 18 2 2 2 2
PCE (1.5) 27 3 3 3 3
Construction workers
Carpooling with others 18 Not applicable Not applicable Not applicable Not applicable
Not carpooling 159 159 0 0 159
Total Construction Traffic 186 162 3 3 162
5.12.2.2.2 Construction Traffic Distribution The following assumptions, based on professional judgment and knowledge of local traffic patterns and land use, were used to distribute construction traffic over the study area network:
10 percent of construction traffic will originate from Contra Costa County via Byron Highway
30 percent of construction traffic will originate from Alameda County/San Francisco Bay Area via I-580
20 percent of construction traffic will originate from San Joaquin County/Central Valley via I-580
30 percent of construction traffic will originate from San Joaquin County/Central Valley via I-205
10 percent of construction traffic will originate from Tracy and beyond via West Grant Line Road.
For the entire project, a total of 26 oversized or heavy loads are anticipated. It is expected that up to 16 of these heavy loads may come via rail to Tracy, then via truck from Tracy to the MEP site. The remaining loads will come directly to the site by truck.
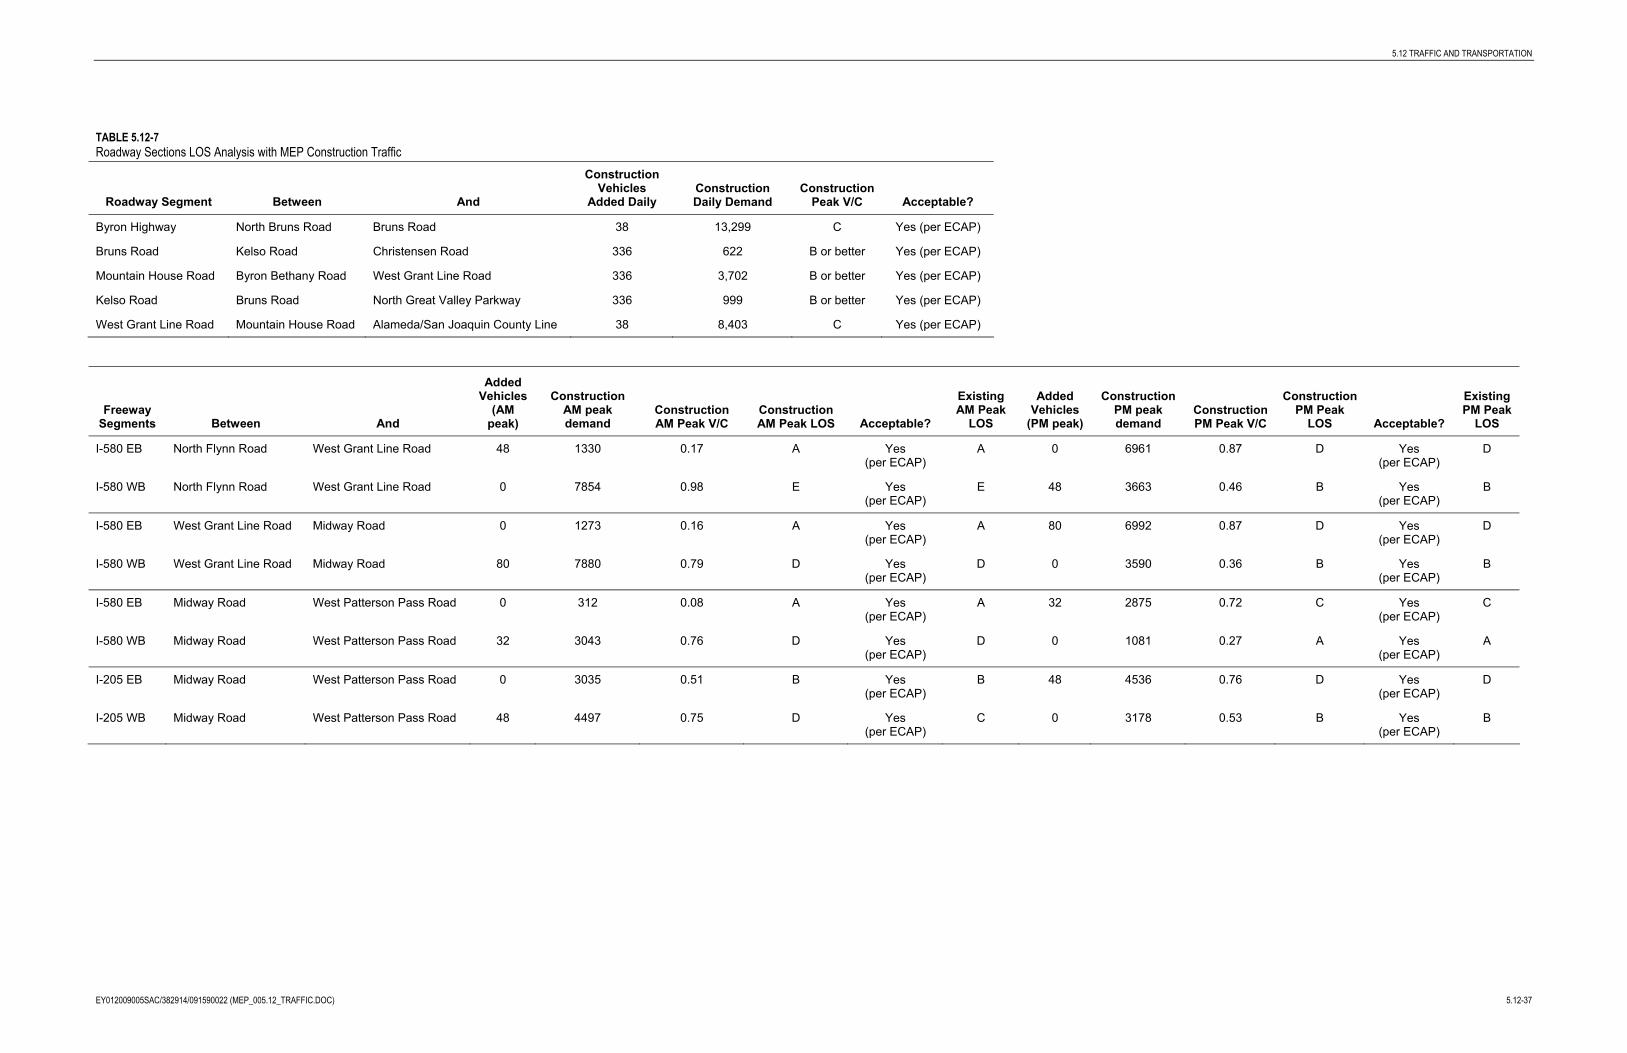
5.12.2.2.3 Roadway LOS with Construction Traffic Average daily traffic generated during the construction period was added to the existing traffic volumes on each highway and arterial segments; peak-hour traffic generated during the construction period was added to the existing traffic volumes on each freeway segment. Then, the traffic impacts were assessed based on v/c ratios, daily volumes, and LOS from Tables 5.12-1 and 5.12-2. The results of the analysis are summarized in Table 5.12-7 (because of its size, this table is provided at the end of this section). Based on the ECAP performance criteria, the roadway segments are projected to operate at an acceptable LOS.
EY012009005SAC/382914/091590022 (MEP_005.12_TRAFFIC.DOC) 5.12-15
5.12 TRAFFIC AND TRANSPORTATION
5.12-16 EY012009005SAC/382914/091590022 (MEP_005.12_TRAFFIC.DOC)
The LOS along Bruns Road and Byron Highway are also acceptable based on Contra Costa County’s performance criteria.
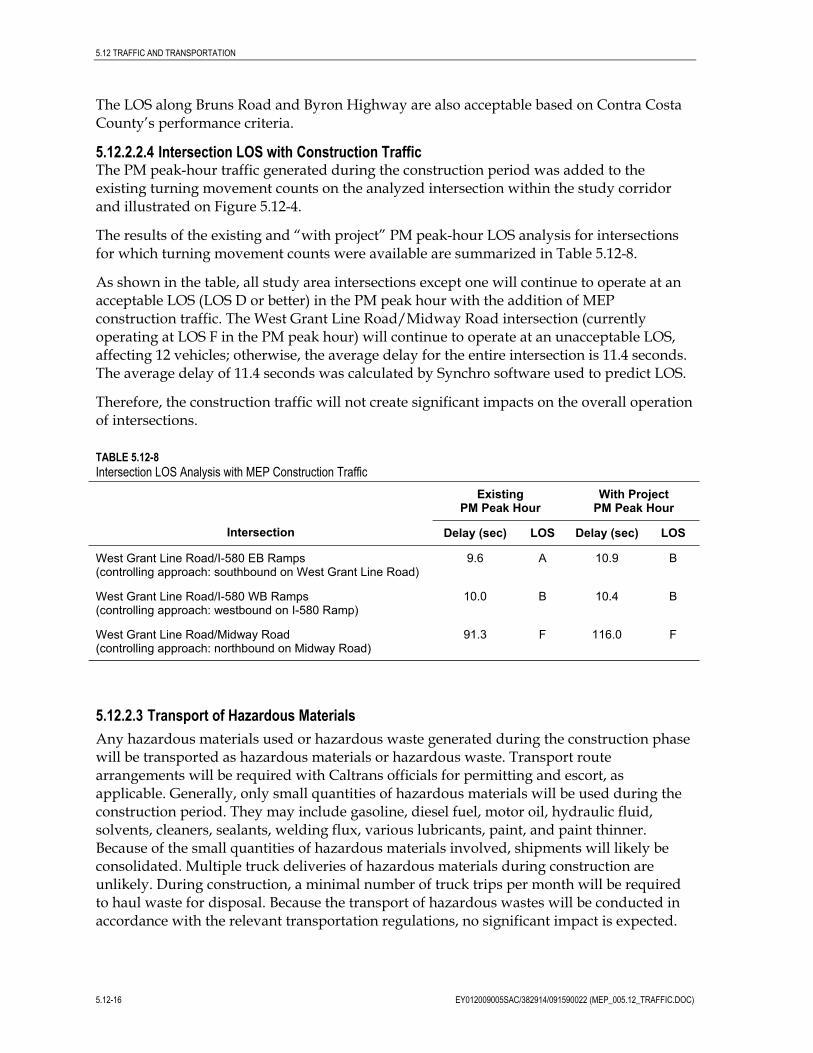
5.12.2.2.4 Intersection LOS with Construction Traffic The PM peak-hour traffic generated during the construction period was added to the existing turning movement counts on the analyzed intersection within the study corridor and illustrated on Figure 5.12-4.
The results of the existing and “with project” PM peak-hour LOS analysis for intersections for which turning movement counts were available are summarized in Table 5.12-8.
As shown in the table, all study area intersections except one will continue to operate at an acceptable LOS (LOS D or better) in the PM peak hour with the addition of MEP construction traffic. The West Grant Line Road/Midway Road intersection (currently operating at LOS F in the PM peak hour) will continue to operate at an unacceptable LOS, affecting 12 vehicles; otherwise, the average delay for the entire intersection is 11.4 seconds. The average delay of 11.4 seconds was calculated by Synchro software used to predict LOS.
Therefore, the construction traffic will not create significant impacts on the overall operation of intersections.
TABLE 5.12-8 Intersection LOS Analysis with MEP Construction Traffic
Existing PM Peak Hour
With Project PM Peak Hour
Intersection Delay (sec) LOS Delay (sec) LOS
West Grant Line Road/I-580 EB Ramps (controlling approach: southbound on West Grant Line Road)
9.6 A 10.9 B
West Grant Line Road/I-580 WB Ramps (controlling approach: westbound on I-580 Ramp)
10.0 B 10.4 B
West Grant Line Road/Midway Road (controlling approach: northbound on Midway Road)
91.3 F 116.0 F
5.12.2.3 Transport of Hazardous Materials Any hazardous materials used or hazardous waste generated during the construction phase will be transported as hazardous materials or hazardous waste. Transport route arrangements will be required with Caltrans officials for permitting and escort, as applicable. Generally, only small quantities of hazardous materials will be used during the construction period. They may include gasoline, diesel fuel, motor oil, hydraulic fluid, solvents, cleaners, sealants, welding flux, various lubricants, paint, and paint thinner. Because of the small quantities of hazardous materials involved, shipments will likely be consolidated. Multiple truck deliveries of hazardous materials during construction are unlikely. During construction, a minimal number of truck trips per month will be required to haul waste for disposal. Because the transport of hazardous wastes will be conducted in accordance with the relevant transportation regulations, no significant impact is expected.

580
580
205
Christensen Rd.
West Grant Line Rd.
West Grant Line Rd.
Patte
rson
Pass
Rd.
Mid
way
Rd.
Mou
ntai
n H
ouse
Rd.
Mou
ntai
n H
ouse
Pkw
y.
Nor
th G
reat
Val
ley
Pkw
y.
Byron-Bethany Rd.Kelso Rd.
Contra Costa County
Alameda County
Alam
eda
Cou
nty
San
Joaq
uin
Cou
nty
Brun
s R
d.
Project Location
San
Joaq
uin
Cou
nty
W. Grant Line Rd.
I-580 EBRamps
T
R
0
L139
12
LT27616
T R12 19
W. Grant Line Rd.
Midway Rd.
L
R 8
4
LT8252
T R688 20
W. Grant Line Rd.
I-580 WBRamps
T
L
0
R 37
16
TR27699
L T15 136
Channelizer
FIGURE 5.12-4CONSTRUCTION PM PEAK HOUR TURNING MOVEMENTSMariposa Energy ProjectAlameda County, California
EY012009005SAC Figure_5.12-4.ai 05.22.09 tdaus

5.12 TRAFFIC AND TRANSPORTATION
According to Division 13 Section 31303 of the CVC, the transportation of regulated substances and hazardous materials will be on the state or interstate highways that offer the shortest overall transit time possible. Transporters of hazardous or explosive materials must contact the California Highway Patrol (CHP) and apply for a Hazardous Material Transportation License. Upon receiving this license, the shipper will obtain a handbook that will specify the routes approved to ship inhalation hazardous or explosive materials. The exact route of the hazardous material shipment will not be determined until the shipper contacts the CHP and applies for a license. Transportation impacts related to hazardous materials associated with MEP operations will not be significant because deliveries of hazardous materials will be limited. Delivery of these materials will occur over prearranged routes and will be in compliance with all LORS governing the safe transportation of hazardous materials.
Standards for the transport of hazardous materials are contained in the Code of Federal Regulations (CFR), Title 49 and enforced by the U.S. Department of Transportation. Additionally, the State of California has promulgated rules for hazardous waste transport that can be found in the California Code of Regulations, Title 26. Additional regulations for the transportation of hazardous materials are outlined in the CVC (Sections 2500-505, 12804-804.5, 31300, 34000, and 34500-501). The two state agencies with primary responsibility for enforcing federal and state regulations governing the transportation of hazardous wastes are the CHP and Caltrans. Transport of hazardous materials to and from the MEP site will comply with all applicable requirements.
Additionally, the federal government prescribes regulations for transporting hazardous materials. These regulations are described in the CFR, Title 49, Section 171. These laws and ordinances place requirements on various aspects of hazardous waste hauling, from materials handling to vehicle signs, to ensure public safety. Transporting and handling of chemicals and wastes are discussed in Section 5.5, Hazardous Materials Handling.
The recommended route subject to Caltrans approval for hazardous materials delivery to the MEP site is from I-580 and/or I-205 to Byron Bethany Road and south on Bruns Road to the project site. This route was selected due to the truck traffic restriction on Mountain House Road and to avoid the Mountain House residential community entrance at the North Great Valley Parkway/Kelso Road intersection.
5.12.2.4 Air Traffic Byron Airport is located approximately 2.7 miles northwest of the MEP site. The project is located away from visual and instrument flight paths or approaches for the airport. As shown in Figure 5.12-5, MEP is approximately 1 mile from the centerline of the instrument flight path for Runway 30, and approximately 1.5 miles from the closest visual flight path approach.
MEP will be located beneath the FAA Conical Airspace Protection Surface, as defined in Title 14 of the CFR, Part 77. As shown in Figure 5.12-6, the height of the FAA airspace protection surface directly above the MEP exhaust stacks ranges from approximately 375 to 400 feet above mean sea level (amsl). The MEP exhaust stacks will be 80 feet tall, reaching an elevation of 205 feet amsl. Therefore, the plant stacks will be at least 170 feet below the FAA
EY012009005SAC/382914/091590022 (MEP_005.12_TRAFFIC.DOC) 5.12-19

5.12 TRAFFIC AND TRANSPORTATION
5.12-20 EY012009005SAC/382914/091590022 (MEP_005.12_TRAFFIC.DOC)
Airspace Protection Surface, indicating that the plant structures will not create a potential hazard to air navigation.
The MEP 230-kV transmission towers will range from approximately 84 to 95 feet in height, and are not expected to exceed 210 feet amsl based on surface elevations along the route. As shown in Figures 5.12-5 and 5.12-6, the existing 500-kV transmission lines located approximately 1,500 feet east of the site (running north/south) range in height from 226 to 309 feet amsl. Additionally, the 230-kV tower immediately west of the site (running north/south) reaches 305 feet amsl. Therefore, the MEP site and 230-kV transmission line will be located between existing transmission structures of greater height.
Based on the vertical clearance of the MEP structures below the FAA Airspace Protection Surfaces, location of the project and new 230-kV transmission line between existing transmission lines at higher maximum elevations, and horizontal distance from the project to aircraft flight paths, MEP will not create a hazard to air navigation due to structure height or thermal plumes. Additionally, visible plumes are not expected based on the operating characteristics of the simple-cycle combustion turbines and lack of evaporative cooling towers (refer to Appendix 5.13A for additional information).
Because MEP is located in the restricted airspace of the Byron Airport, an FAA Notice Criteria evaluation was performed for the exhaust stacks (205 feet amsl) and highest proposed transmission tower (95 feet above ground level, top elevation of 210 feet amsl); the documentation is provided in Appendix 5.12A. Based on the results of this evaluation, an FAA Form 7460-1, Notice of Proposed Construction or Alteration, was filed for these project features (Appendix 5.12B).
5.12.3 Cumulative Effects A cumulative impact refers to a proposed project’s incremental effect together with other closely related past, present, and reasonably foreseeable future projects whose impacts may compound or increase the incremental effect of the proposed project (Pub. Resources Code § 21083; California Code of Regulations, Title 14, §§ 15064(h), 15065(c), 15130, and 15355). Cumulative traffic impacts may occur when more than one project has an overlapping construction schedule that generates excessive construction-related traffic.
At this time, the Green Volts Utility-Scale Solar Field (located on Kelso Road, across from the Tracy Substation) is the only project near the MEP site that will be built in the near future. According to the Initial Study for the Green Volts Utility-Scale Solar Field (ICF Jones & Stokes, 2008), Phase 2 construction is scheduled for spring 2009. This project is expected to be operating prior to MEP construction. Only one or two employees will be needed during operation, which will not adversely affect traffic conditions when added to MEP construction-related traffic.
5.12.4 Mitigation Measures To address any potential traffic issues during construction, the construction contractor will be required to prepare a construction traffic control plan and construction management plan, also known as a Traffic Management Plan (TMP). The TMP should address timing of heavy equipment and building material deliveries, potential street and/or lane closures, signing, lighting, and traffic control device placement. Damage to any roadway caused by

\\ZION\SACGIS\PROJ\DIAMOND_376670\MAPFILES\AFC_MAPS\SITEAIRSPACEPROTECTIONSURFACES.MXD SSCOPES 4/13/2009 15:19:34
VICINITY MAP
!(
!(
!(
kj
!(
!(
!(
CONICAL SURFACE
20:1
SLOPE
PRECISIONINSTRUMENT
OUTERAPPROACH
SURFACE
40:1 SLOPE
PRECISION INSTRUMENT
INNER APPROACHSURFACE
50:1 SLOPE
CONICAL SURFACE
20:1
SLOPE
TRANSITIONAL SURFACE
7:1 SLOPE, TYP
PROPOSED MARIPOSA ENERGY FACILITYGROUND ELEVATION: 125 FEET AMSL
TOP OF STACK: 205 FEET AMSLAIRSPACE PROTECTION SURFACE: 350 - 400 FEET AMSL
DISTANCE FROM NEAREST RUNWAY: 2.7 MILESDISTANCE TO APPROACH SURFACE CL: 1.0 MILES
GROUND ELEVATION: 120' at MSL (Approx.)
AIRSPACE PROTECTION SURFACE: 375' at MSL (Approx.)
50' CONTOUR LINES ONSLOPED SURFACES, TYPNUMBERS INDICATE FEET ABOVEMEAN SEA LEVEL (MSL)
350
400
450
500
550
600
650
226
200
150
100
50
100
150200
226
100150200226
400
350
300
250
226
426
250300
350400
426
226
100
150
200
250
TRANSITIONAL ZONE
TRANSITIONAL ZONE
50' CONTOUR LINES ONSLOPED SURFACES, TYPNUMBERS INDICATE FEET ABOVEMEAN SEA LEVEL (MSL)
Byron Rd
usykP
e
Byron
000,40 2,000
Feet
LEGEND!( TOWER 1A - HEIGHT 238FT!( TOWER 1B- HEIGHT 226FT!( TOWER 2A- HEIGHT 269FT!( TOWER 2B- HEIGHT 249FT!( TOWER 3A- HEIGHT 291FT!( TOWER 3B- HEIGHT 309FTkj TOWER 4- HEIGHT 305FT
VISUAL FLIGHT PATHSSURFACE ZONES
APPROACHCONICAL SURFACESINNER APPROACH SURFACESTRANSITIONAL ZONESPROJECT SITE
ConcordConcord
AntiochAntioch
TracyTracy
LivermoreLivermore
Bethel IslandBethel Island
Discovery BayDiscovery Bay
§̈¦680
§̈¦580
§̈¦205
§̈¦580
Mount Diablo State ParkMount Diablo State Park
$
This map was compiled from various scale source data andmaps and is intended for use as only an approximaterepresentation of actual locations.
PROJECT SITE
_̂
FIGURE 5.12-5AIRSPACE PROTECTION SURFACES, BYRON AIRFIELDMariposa Energy ProjectAlameda County, California
EY012009005SAC Figure_5.12-5.ai 05.22.09 tdaus

FIGURE 5.12-6RELATIVE STRUCTURE HEIGHTSMariposa Energy ProjectAlameda County, California
EY012009005SAC Figure_5.12-6.ai 05.22.09 tdaus

5.12 TRAFFIC AND TRANSPORTATION
MEP construction traffic will be restored to or near its preexisting condition. The construction contractor will work with the local agency’s engineer to prepare a schedule and mitigation plan for the roadways along the construction routes.
The construction of MEP will add a small amount of traffic to local roadways. MEP-related traffic increases will not result in significant impacts. Additionally, operations-related and maintenance-related traffic associated with MEP is considered to be minimal, so no operations-related mitigation measures are required.
5.12.5 Laws, Ordinances, Regulations, and Standards LORS related to traffic and transportation are summarized in the following subsections.
5.12.5.1 Federal LORS Title 49, CFR, Sections 171-177 (49 CFR 171-177), governs the transportation of
hazardous materials, the types of materials defined as hazardous, and the marking of the transportation vehicles.
49 CFR 350-399, and Appendices A-G, Federal Motor Carrier Safety Regulations, address safety considerations for the transport of goods, materials, and substances over public highways.
49 CFR 397.9, the Hazardous Materials Transportation Act of 1974, directs the U.S. Department of Transportation to establish criteria and regulations for the safe transportation of hazardous materials.
14 CFR 77.13(2)(i) requires an applicant to notify the FAA of the construction of structures within 20,000 feet of the nearest point of the nearest runway of an airport with at least one runway longer than 3,200 feet. The project site is within Byron Airport’s influence area (2.7 miles away); therefore, this requirement is applicable.
14 CFR 77.17 requires an applicant to submit a Notice of Proposed Construction or Alteration (FAA Form No. 7460-1) to the FAA for construction within 20,000 feet of the nearest runway of an airport with at least one runway longer than 3,200 feet. This requirement is applicable.
14 CFR 77.21, 77.23, and 77.25 outlines the criteria used by the FAA to determine whether an obstruction would create an air navigation conflict. MEP will be subject to these criteria.
5.12.5.2 State LORS
CVC Sections 13369, 15275, and 15278 address the licensing of drivers and classifications of licenses required to operate particular types of vehicles. Additionally, certificates permitting the operation of vehicles transporting hazardous materials are addressed.
CVC Sections 25160 et seq. address the safe transport of hazardous materials.
CVC Sections 2500-2505 authorize the issuance of licenses by the Commissioner of the CHP to transport hazardous materials, including explosives.
EY012009005SAC/382914/091590022 (MEP_005.12_TRAFFIC.DOC) 5.12-25
5.12 TRAFFIC AND TRANSPORTATION
CVC Sections 31300 et seq. regulate the highway transportation of hazardous materials, routes used, and restrictions. CVC Section 31303 requires hazardous materials to be transported on state or interstate highways that offer the shortest overall transit time possible.
CVC Sections 31600-31620 regulate the transportation of explosive materials.
CVC Sections 32000-32053 regulate the licensing of carriers of hazardous materials and include noticing requirements.
CVC Sections 32100-32109 establish special requirements for the transportation of substances presenting inhalation hazards and poisonous gases. CVC Section 32105 requires shippers of inhalation or explosive materials to contact the CHP and apply for a Hazardous Material Transportation License. Upon receiving this license, the shipper will obtain a handbook specifying approved routes.
CVC Sections 34000-34121 establish special requirements for transporting flammable and combustible liquids over public roads and highways.
CVC Sections 34500, 34501, 34501.2, 34501.3, 34501.4, 34501.10, 34505.5-7, 34506, 34507.5, and 34510-11 regulate the safe operation of vehicles, including those used to transport hazardous materials.
California Street and Highways Code (S&HC), Sections 660, 670, 1450, 1460 et seq., 1470, and 1480, regulate right-of-way encroachment and granting of permits for encroachments on state and county roads.
S&HC, Sections 117 and 660-711, and CVC Section 35780 et seq. require permits to transport oversized loads on county roads. California S&HC Sections 117 and 660 to 711 require permits for any construction, maintenance, or repair involving encroachment on state highway rights of way. CVC Section 35780 requires approval for a permit to transport oversized or excessive loads over state highways.
Caltrans weight and load limitations for state highways apply to all state and local roadways. The weight and load limitations are specified in CVC Sections 35550 to 35559. The following CVC provisions apply to all roadways and are therefore applicable to this project.
General Provisions:
The gross weight imposed upon the highway by the wheels on any axle of a vehicle shall not exceed 20,000 pounds and the gross weight upon any one wheel, or wheels, supporting one end of an axle, and resting upon the roadway, shall not exceed 10,500 pounds.
The maximum wheel load is the lesser of the following: a) the load limit established by the tire manufacturer, or b) a load of 620 pounds per lateral inch of tire width, as determined by the manufacturer’s rated tire width.
5.12-26 EY012009005SAC/382914/091590022 (MEP_005.12_TRAFFIC.DOC)

5.12 TRAFFIC AND TRANSPORTATION
Vehicles with Trailers or Semi-trailers:
The gross weight imposed upon the highway by the wheels on any one axle of a vehicle shall not exceed 18,000 pounds and the gross weight upon any one wheel, or wheels, supporting one end of an axle and resting upon the roadway, shall not exceed 9,500 pounds, except that the gross weight imposed upon the highway by the wheels on any front steering axle of a motor vehicle shall not exceed 12,500 pounds.
California State Planning Law, Government Code Section 65302, requires each city and county to adopt a General Plan, consisting of seven mandatory elements, to guide its physical development. Section 65302(b) requires that a circulation element be one of the mandatory elements.
All construction in the public right-of-way will need to comply with the Manual on Uniform Traffic Control Devices (Caltrans, 2006; Federal Highway Administration, 2003).
5.12.5.3 Local LORS
The San Joaquin County Regional Transportation Plan, administered by SJCOG, establishes regional transportation goals, policies, objectives and actions for various modes of transportation. The plan identified the following goals (SJCOG, 2007):
- Improve safety and security
- Improve system maintenance and operations
- Promote interagency coordination, public participation, and citizen involvement
- Improve quality of life
- Improve goods movement
- Improve mobility and accessibility
- Enhance the environment
- Maximize cost effectiveness
San Joaquin County Hazardous Waste Management Plan establishes various policies to ensure safe and effective management and transport of hazardous waste within the county (San Joaquin County and EMCON Associates, 1988).
The MTC’s current Regional Transportation Plan, Transportation 2030, aims to:
- Reduce trips of excessive distance and duration
- Offer a better range of travel options
- Provide a transit system that is second to none in its upkeep and performance
- Provide an easier and safer way to walk and bike
- Reduce reliance on the auto for various types of trips
EY012009005SAC/382914/091590022 (MEP_005.12_TRAFFIC.DOC) 5.12-27

5.12 TRAFFIC AND TRANSPORTATION
5.12-28 EY012009005SAC/382914/091590022 (MEP_005.12_TRAFFIC.DOC)
- Provide those who do not own a car better access to jobs, medical centers, schools, and grocery stores
- Create a sustainable transportation system
The Alameda Countywide Transportation Plan is a long-range policy document that guides the development of the county’s transportation system (Alameda County Congestion Management Agency, 2008). The goals and performance objectives presented include:
- Mobility improvement
- Transit access and use increase
- Air quality improvement
- Economic vitality enhancement
- Operational efficiency enhancement
- Transportation and land use planning coordination
The Contra Costa County Draft 2009 Countywide Comprehensive Transportation Plan prepared by the CCTA lays out the future transportation priorities. Four key goals are presented:
- Enhance the movement for people and goods on highway and arterial roads
- Manage the impacts of growth to sustain Contra Costa’s economy and preserve its environment
- Expand safe, convenient, and affordable alternatives to the single-occupant vehicle
- Maintain the transportation system
The ECAP Transportation Systems element describes the policies and implementation programs to achieve the county’s goals in terms of transportation (Alameda County, 2000). In particular, “traffic volumes on intercity arterials significantly affected by MEP do not exceed LOS D on major arterial segments within unincorporated areas and traffic volumes on Congestion Management Program roadways do not exceed LOS E within unincorporated areas.”
The Contra Costa County General Plan Transportation and Circulation Element (Contra Costa County, 2005) establishes transportation goals, policies, and specific implementation measures to assure that the county’s transportation system will have adequate capacity to serve planned growth in Contra Costa County through 2020.
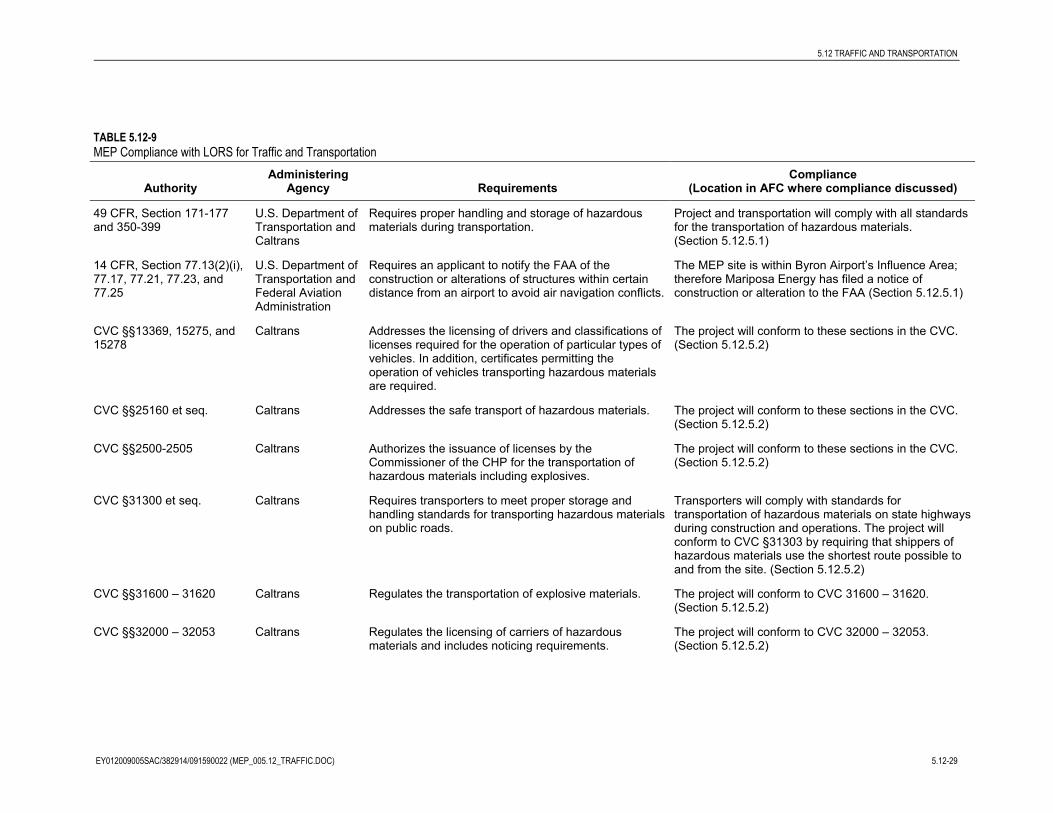
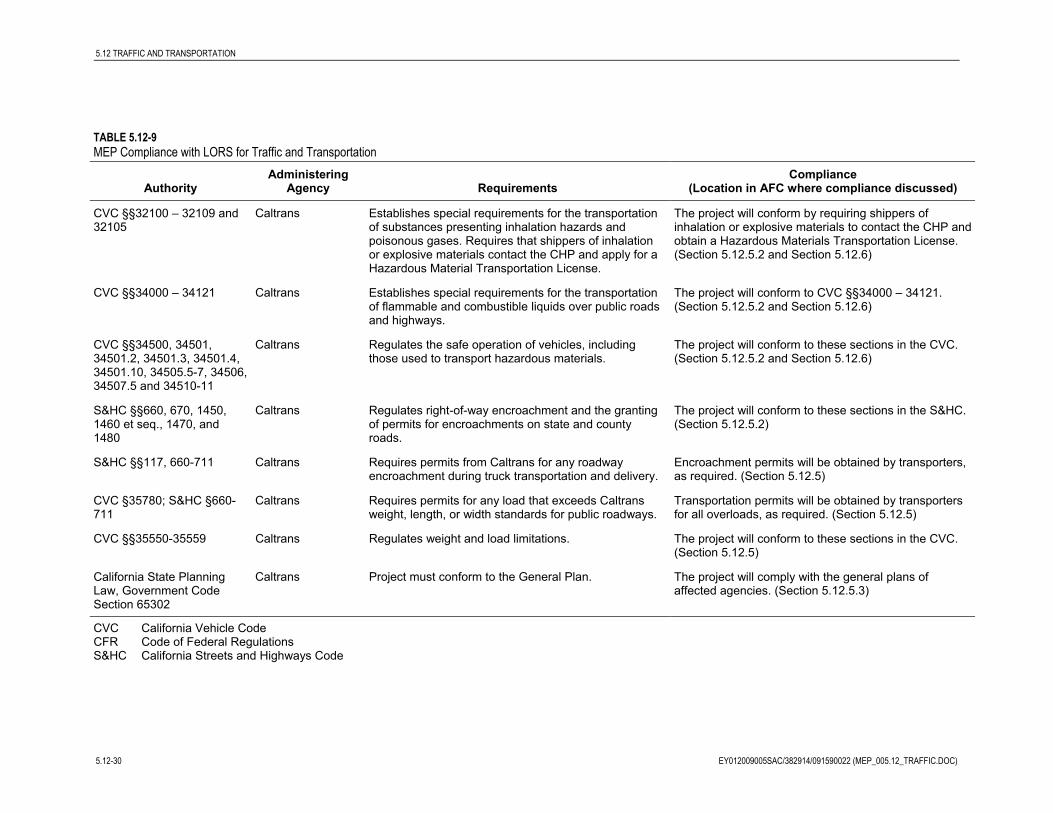
5.12.5.4 Compliance with Laws, Ordinances, Regulations, and Standards Table 5.12-9 summarizes all applicable federal, state and local LORS and administering agencies, and describes how Mariposa Energy will comply with all LORS pertaining to traffic and transportation impacts.
5.12 TRAFFIC AND TRANSPORTATION
TABLE 5.12-9 MEP Compliance with LORS for Traffic and Transportation
Authority Administering
Agency Requirements Compliance
(Location in AFC where compliance discussed)
49 CFR, Section 171-177 and 350-399
U.S. Department of Transportation and Caltrans
Requires proper handling and storage of hazardous materials during transportation.
Project and transportation will comply with all standards for the transportation of hazardous materials. (Section 5.12.5.1)
14 CFR, Section 77.13(2)(i), 77.17, 77.21, 77.23, and 77.25
U.S. Department of Transportation and Federal Aviation Administration
Requires an applicant to notify the FAA of the construction or alterations of structures within certain distance from an airport to avoid air navigation conflicts.
The MEP site is within Byron Airport’s Influence Area; therefore Mariposa Energy has filed a notice of construction or alteration to the FAA (Section 5.12.5.1)
CVC §§13369, 15275, and 15278
Caltrans Addresses the licensing of drivers and classifications of licenses required for the operation of particular types of vehicles. In addition, certificates permitting the operation of vehicles transporting hazardous materials are required.
The project will conform to these sections in the CVC. (Section 5.12.5.2)
CVC §§25160 et seq. Caltrans Addresses the safe transport of hazardous materials. The project will conform to these sections in the CVC. (Section 5.12.5.2)
CVC §§2500-2505 Caltrans Authorizes the issuance of licenses by the Commissioner of the CHP for the transportation of hazardous materials including explosives.
The project will conform to these sections in the CVC. (Section 5.12.5.2)
CVC §31300 et seq. Caltrans Requires transporters to meet proper storage and handling standards for transporting hazardous materials on public roads.
Transporters will comply with standards for transportation of hazardous materials on state highways during construction and operations. The project will conform to CVC §31303 by requiring that shippers of hazardous materials use the shortest route possible to and from the site. (Section 5.12.5.2)
CVC §§31600 – 31620 Caltrans Regulates the transportation of explosive materials. The project will conform to CVC 31600 – 31620. (Section 5.12.5.2)
CVC §§32000 – 32053 Caltrans Regulates the licensing of carriers of hazardous materials and includes noticing requirements.
The project will conform to CVC 32000 – 32053. (Section 5.12.5.2)
EY012009005SAC/382914/091590022 (MEP_005.12_TRAFFIC.DOC) 5.12-29
5.12 TRAFFIC AND TRANSPORTATION
5.12-30 EY012009005SAC/382914/091590022 (MEP_005.12_TRAFFIC.DOC)
TABLE 5.12-9 MEP Compliance with LORS for Traffic and Transportation
Authority Administering
Agency Requirements Compliance
(Location in AFC where compliance discussed)
CVC §§32100 – 32109 and 32105
Caltrans Establishes special requirements for the transportation of substances presenting inhalation hazards and poisonous gases. Requires that shippers of inhalation or explosive materials contact the CHP and apply for a Hazardous Material Transportation License.
The project will conform by requiring shippers of inhalation or explosive materials to contact the CHP and obtain a Hazardous Materials Transportation License. (Section 5.12.5.2 and Section 5.12.6)
CVC §§34000 – 34121 Caltrans Establishes special requirements for the transportation of flammable and combustible liquids over public roads and highways.
The project will conform to CVC §§34000 – 34121. (Section 5.12.5.2 and Section 5.12.6)
CVC §§34500, 34501, 34501.2, 34501.3, 34501.4, 34501.10, 34505.5-7, 34506, 34507.5 and 34510-11
Caltrans Regulates the safe operation of vehicles, including those used to transport hazardous materials.
The project will conform to these sections in the CVC. (Section 5.12.5.2 and Section 5.12.6)
S&HC §§660, 670, 1450, 1460 et seq., 1470, and 1480
Caltrans Regulates right-of-way encroachment and the granting of permits for encroachments on state and county roads.
The project will conform to these sections in the S&HC. (Section 5.12.5.2)
S&HC §§117, 660-711 Caltrans Requires permits from Caltrans for any roadway encroachment during truck transportation and delivery.
Encroachment permits will be obtained by transporters, as required. (Section 5.12.5)
CVC §35780; S&HC §660-711
Caltrans Requires permits for any load that exceeds Caltrans weight, length, or width standards for public roadways.
Transportation permits will be obtained by transporters for all overloads, as required. (Section 5.12.5)
CVC §§35550-35559 Caltrans Regulates weight and load limitations. The project will conform to these sections in the CVC. (Section 5.12.5)
California State Planning Law, Government Code Section 65302
Caltrans Project must conform to the General Plan. The project will comply with the general plans of affected agencies. (Section 5.12.5.3)
CVC California Vehicle Code CFR Code of Federal Regulations S&HC California Streets and Highways Code

5.12 TRAFFIC AND TRANSPORTATION
5.12.6 Permits Required, Permit Schedule, and Agency Contacts Table 5.12-10 presents the permits and permit schedule for MEP. The vehicles used to transport heavy equipment and construction materials will require transportation permits when they exceed the size, weight, width, or length thresholds set forth in Section 35780 of the CVC, Sections 117 and 660-711 of the California S&HC, and Sections 1411.1 to 1411.6 of the California Code of Regulations. Affected vehicles will be required to obtain transportation permits from Caltrans, affected counties and the City of Tracy (or any other affected city).
Transport route arrangements will be required with Caltrans and CHP officials for permitting and escort, as applicable. Transportation of hazardous materials to and from MEP will be conducted in accordance with CVC Section 31303.
TABLE 5.12-10 Permits and Permit Schedule for Traffic and Transportation
Permit Administering Agency Schedule
Single/Annual-Trip Transportation Permit for Oversized Loads and Oversized Vehicles
Caltrans North Region Transportation Permits Office 1823 14th Street Sacramento, CA 95814 Officer on Duty (909) 383-4637
Obtain when necessary, 2-hour processing time (single trip) to 2 weeks (annual trip).
Hazardous Materials Transportation License
California Highway Patrol Hazardous Materials Licensing Program (916) 327-5039
Obtain when necessary, approximately 2-week processing time
Overweight Transportation Permit San Joaquin County Department of Public Works Scott Cooper (209) 468-3058
Usually 2-day processing time for either a single trip permit or an annual (blanket) permit.
Overweight Transportation Permit Contra Costa County Permits Center 651 Pine Street, 2nd Floor, North Wing Martinez, CA 94553 Bob Hendry (925) 335-1375
1 hour for single-trip permits; 1 week for annual permits.
Oversize/Overweight Transportation Permit, Encroachment Permit
Alameda County Public Works – Encroachment, Grading, Watercourse 399 Elmhurst Street Hayward, CA 94544 Carlos Monsalve (510) 670-5868
Same day, except for annual blanket transportation permit (same as State Permit)
Oversize/Overweight Transportation Permit
City of Tracy Development and Engineering Services 520 Tracy Boulevard Tracy, CA 95376 Armando Salaiz (209) 831-6435
EY012009005SAC/382914/091590022 (MEP_005.12_TRAFFIC.DOC) 5.12-31

5.12 TRAFFIC AND TRANSPORTATION
5.12.7 References 511.org. 2009. Park and Ride Lots. http://rideshare.511.org/511maps/PandRText.asp
AirNav. 2009. Byron Airport Fact Sheet. http://www.airnav.com/airport/c83
Alameda County Congestion Management Agency. 2006. Final 2006 Alameda Countywide Bicycle Plan. http://www.accma.ca.gov/pages/HomeBicyclePlan.aspx
Alameda County Congestion Management Agency. 2008. Countywide Transportation Plan 2008. http://www.accma.ca.gov/pages/HomeCountywideTransPlan.aspx
Alameda County Congestion Management Agency. 2009. I-580 Tri-Valley Rapid Transit Corridor Improvements. http://www.accma.ca.gov/pages/Projects.aspx#p1
Alameda County Transportation Improvement Authority and Alameda County Congestion Management Agency. 2002. Alameda Countywide Strategic Pedestrian Plan. http://www.acta2002.com/ped-toolkit/Full_Ped_Plan.pdf
Alameda County. 2000. East County Area Plan. http://www.acgov.org/cda/planning/plans/EastCountyAreaPlancombined.pdf
Altamont Commuter Express. 2009. Route Maps. http://www.acerail.com/schedules/route-map.htm
Amtrak Routes. 2009. Amtrak. http://www.amtrak.com. March.
Bates, John/Alameda County Traffic Division. 2009. Personal Communication with CH2M HILL staff. February 10.
California Department of Motor Vehicles. California Vehicle Code. http://www.dmv.ca.gov/pubs/vctop/vc/vc.htm.
Caltrans, 2006. California Manual of Uniform Traffic Control Devices.
Caltrans. 2009a. 2007 Traffic Volumes on the California State Highway System. http://traffic-counts.dot.ca.gov/2007all.htm
Caltrans. 2009b. 2007 Annual Average Daily Truck Traffic on the California State Highway System. http://traffic-counts.dot.ca.gov/truck2007final.pdf
City of Tracy, 2005. City of Tracy General Plan Draft Environmental Impact Report.
Contra Costa County. 2000. Airport Land Use Compatibility Plan. December. http://www.co.contra-costa.ca.us/depart/cd/current/ALUCPlan/CCC-ALUC-Plan-Part3.pdf
Contra Costa County. 2001. East County Bikeway Plan. http://www.co.contra-costa.ca.us/depart/cd/transportation/committee/transplan/bike/
Contra Costa County. 2005. Contra Costa County General Plan 2005-2020.
Contra Costa Transportation Authority. 2003. Final Countywide Bicycle and Pedestrian Plan. http://www.ccta.net/GM/finalplan.htm
5.12-32 EY012009005SAC/382914/091590022 (MEP_005.12_TRAFFIC.DOC)
5.12 TRAFFIC AND TRANSPORTATION
EY012009005SAC/382914/091590022 (MEP_005.12_TRAFFIC.DOC) 5.12-33
Contra Costa Transportation Authority. 2009. 2009 Countywide Transportation Plan. http://www.ccta.net/assets/documents/Available~Publications/GMP~and~CMP~Publications/DraftCTP.021309.pdf
Cooper, Scott/San Joaquin County Permit Division. Personal communication with CH2M HILL staff. January 16.
Federal Highway Administration, 2003. Manual on Uniform Traffic Control Devices.
ICF Jones & Stokes. 2008. Proposed Mitigated Negative Declaration & Initial Study for the GreenVolts Utility-Scale Solar Field. May.
Impact Sciences Inc. 2008. Altamont Motorsport Park Rezoning Draft Environmental Impact Report. July. http://www.acgov.org/cda/planning/Altamont_DEIR/4_15_Transportation_and_Traffic.pdf
Metropolitan Transportation Commission (MTC), 2005. Regional Transportation Plan Transportation 2030. http://www.mtc.ca.gov/planning/2030_plan/
Mountain House Community Services District. 2008. Neighborhood News December 2008. http://www.ci.mountainhouse.ca.us/admin/upload/newsletter%20FINAL%208511.pdf
San Joaquin Council of Governments (SJCOG). 2007. 2007 Regional Transportation Plan. http://www.sjcog.org/Programs%20&%20Projects/Transportation_files/RTP.htm
San Joaquin County and EMCON Associates. 1988. 1988 San Joaquin County Hazardous Waste Management Plan.
San Joaquin County and Fehrs and Peers Associates. 2002. 2002 Unincorporated San Joaquin County Bikeway Plan.
San Joaquin County. 2005. San Joaquin County General Plan. http://www.co.san-joaquin.ca.us/commdev/cgi-bin/cdyn.exe?grp=planning&htm=generalplan
San Joaquin Regional Transit District. 2008. RTD Bus Service Map. http://www.sanjoaquinrtd.com/maps_and_schedules/metro.htm
State of California Legislative Counsel. California Streets and Highways Code. http://www.leginfo.ca.gov/.html/shc_table_of_contents.html.
Transportation Research Board. 2000. Highway Capacity Manual.
Tri Delta Transit. 2009. Service Map. http://www.trideltatransit.com/local_bus.aspx
Wu, Johnny/Contra Costa County Traffic Division. 2009. Personal communication with CH2M HILL staff. January 21.

5.12 TRAFFIC AND TRANSPORTATION
EY012009005SAC/382914/091590022 (MEP_005.12_TRAFFIC.DOC) 5.12-35
TABLE 5.12-3 Existing Roadway Segment LOS Analysis Summary
Roadway Segments Between And Classification Number of
Lanes Annual Average Daily
Volume LOS Acceptable?
Byron Highway North Bruns Road Bruns Road Regional route 2 13,261 C Yes (per ECAP)
Bruns Road Kelso Road Christensen Road Rural standard 2 286 B or better Yes (per ECAP)
Mountain House Road Byron Bethany Road West Grant Line Road Arterial 2 3,366 B or better Yes (per ECAP)
Kelso Road Bruns Road North Great Valley Parkway Minor collector 2 663 B or better Yes (per ECAP)
West Grant Line Road Mountain House Road Alameda/San Joaquin County Line Arterial 2 8,365 C Yes (per ECAP)
Freeway Segments Between And Classification Number of
Lanes 2-Way AADT
Truck Percent
AM Peak Demand (1-Way)
PM Peak Demand(1-Way)
Peak Hour
Capacity
AM Peak v/c
AM Peak LOS Acceptable?
PM Peak v/c
PM Peak LOS Acceptable?
I-580 Eastbound (EB) North Flynn Road West Grant Line Road Freeway 4 0.13 1282 6961 8,000 0.16 A Yes (per ECAP) 0.87 D Yes (per ECAP)
I-580 Westbound (WB) North Flynn Road West Grant Line Road Freeway 4 146,894
0.13 7854 3615 8,000 0.98 E Yes (per ECAP) 0.45 B Yes (per ECAP)
I-580 EB West Grant Line Road Midway Road Freeway 4 0.13 1273 6912 8,000 0.16 A Yes (per ECAP) 0.86 D Yes (per ECAP)
I-580 WB West Grant Line Road Midway Road Freeway 5 145,874
0.13 7800 3590 10,000 0.78 D Yes (per ECAP) 0.36 B Yes (per ECAP)
I-580 EB Midway Road West Patterson Pass Road Freeway 2 0.13 312 2843 4,000 0.08 A Yes (per ECAP) 0.71 C Yes (per ECAP)
I-580 WB Midway Road West Patterson Pass Road Freeway 2 41,824
0.13 3011 1081 4,000 0.75 D Yes (per ECAP) 0.27 A Yes (per ECAP)
I-205 EB Midway Road West Patterson Pass Road Freeway 3 0.12 3035 4488 6,000 0.51 B Yes (per ECAP) 0.75 D Yes (per ECAP)
I-205 WB Midway Road West Patterson Pass Road Freeway 3 114,251
0.12 4449 3178 6,000 0.74 C Yes (per ECAP) 0.53 B Yes (per ECAP)
5.12 TRAFFIC AND TRANSPORTATION
EY012009005SAC/382914/091590022 (MEP_005.12_TRAFFIC.DOC) 5.12-37
TABLE 5.12-7 Roadway Sections LOS Analysis with MEP Construction Traffic
Roadway Segment Between And
Construction Vehicles
Added Daily Construction Daily Demand
Construction Peak V/C Acceptable?
Byron Highway North Bruns Road Bruns Road 38 13,299 C Yes (per ECAP)
Bruns Road Kelso Road Christensen Road 336 622 B or better Yes (per ECAP)
Mountain House Road Byron Bethany Road West Grant Line Road 336 3,702 B or better Yes (per ECAP)
Kelso Road Bruns Road North Great Valley Parkway 336 999 B or better Yes (per ECAP)
West Grant Line Road Mountain House Road Alameda/San Joaquin County Line 38 8,403 C Yes (per ECAP)
Freeway Segments Between And
Added Vehicles
(AM peak)
Construction AM peak demand
Construction AM Peak V/C
Construction AM Peak LOS Acceptable?
Existing AM Peak
LOS
Added Vehicles
(PM peak)
Construction PM peak demand
Construction PM Peak V/C
Construction PM Peak
LOS Acceptable?
Existing PM Peak
LOS
I-580 EB North Flynn Road West Grant Line Road 48 1330 0.17 A Yes (per ECAP)
A 0 6961 0.87 D Yes (per ECAP)
D
I-580 WB North Flynn Road West Grant Line Road 0 7854 0.98 E Yes (per ECAP)
E 48 3663 0.46 B Yes (per ECAP)
B
I-580 EB West Grant Line Road Midway Road 0 1273 0.16 A Yes (per ECAP)
A 80 6992 0.87 D Yes (per ECAP)
D
I-580 WB West Grant Line Road Midway Road 80 7880 0.79 D Yes (per ECAP)
D 0 3590 0.36 B Yes (per ECAP)
B
I-580 EB Midway Road West Patterson Pass Road 0 312 0.08 A Yes (per ECAP)
A 32 2875 0.72 C Yes (per ECAP)
C
I-580 WB Midway Road West Patterson Pass Road 32 3043 0.76 D Yes (per ECAP)
D 0 1081 0.27 A Yes (per ECAP)
A
I-205 EB Midway Road West Patterson Pass Road 0 3035 0.51 B Yes (per ECAP)
B 48 4536 0.76 D Yes (per ECAP)
D
I-205 WB Midway Road West Patterson Pass Road 48 4497 0.75 D Yes (per ECAP)
C 0 3178 0.53 B Yes (per ECAP)
B