5.0 Findings - Penn State Harrisburg€¦ · Web viewPoliticians have been quick to notice that...
81
INVESTING IN OUR CHILDREN'S FUTURE JOYCE IUTCOVICH RICHARD FIENE ROSS KOPPEL JIM JOHNSON FRAN LANGAN 1
Transcript of 5.0 Findings - Penn State Harrisburg€¦ · Web viewPoliticians have been quick to notice that...

INVESTINGIN OURCHILDREN'SFUTURE
JOYCE IUTCOVICHRICHARD FIENEROSS KOPPELJIM JOHNSONFRAN LANGAN
1999
1

1.0 STATEMENT OF THE PROBLEM
Children are our future. The current trend in public opinion and political action highlights our concern about children and their welfare (McAllister 1997:36). “The fastest growing segment of the electorate is the one concerned about protecting children and helping parents be good parents,” says political pollster Mark Penn. In recent years we have seen the release of some exciting new research on the impact of a child’s early experiences on how his or her brain is “wired.” In an effort to bring attention to this important new research on brain development and its implications for public policy, the Families and Work Institute initiated the Early Childhood Public Engagement Campaign. A White House Conference on Early Childhood Development and a television special, I Am Your Child, launched this campaign in early 1997. Another White House Conference on child care was held in October 1997. Politicians have been quick to notice that children’s issues strike a special chord with Americans—hence the plethora of new initiatives aimed at the young.
All of this attention on children’s issues is heartening in an era of budget re-allocation, welfare reform, and move to eliminate Big Government. However, the extent to which all this talk will be translated into action is yet to be determined. Regardless, this public attention has brought into focus an area of critical need in our society—quality child care. With the dramatic rise in the number of mothers in the labor force with small children, the need for child care services and the maintenance of quality programs throughout the nation cannot be denied (Katz 1994). In response to this increased demand there has been a significant rise in the number of licensed child care centers and home-based child care providers—not to mention the unregulated child care settings. The welfare reform legislation has also resulted in an increase in mothers needing child care services as they move into the labor force. Some of these welfare-to-work mothers have been encouraged to offer child care out of their home to neighbors and relatives to help meet this increased demand for child care. Thus, as the need increases and child care facilities spring up to meet the growing demand—both regulated and unregulated care—the concern over quality becomes more pressing. A study conducted by Mathematica Policy Research for the U.S. Department of Education (1990) reports that the quality of care will be jeopardized with the trend of serving more children with fewer workers. More recent studies have determined that there is far too little good child care in the United States. Only 14 percent of center care, 12 percent of family child care, and even a lower percentage of infant care can be rated as good in this country (Galinsky et al. 1994; Helburn et al. 1995).
Given this state of affairs, research on child care and factors associated with quality care is very important, particularly if it has implications for public policy. State regulations play a key role in ensuring that programs comply with minimum standards regarding structural features and staff qualifications. But minimum standards related to child/staff ratios and educational level of staff are not enough. Other dimensions found to be associated with quality care are classroom/caregiver dynamics (including caregivers’ sensitivity and use of developmentally appropriate practice) and staff characteristics such
2
as specialized education, training, and experience (Love, Schochet, and Meckstroth, 1996).
The education and training child care workers has been viewed as the key to improving classroom/caregiver dynamics and staff characteristics. But not all education and training is equally effective. The Center for Career Development in Early Care and Education at Wheelock College has emphasized the importance of professional development programs for child care providers. The model developed by the Center focuses on the linkages between education and training and the development of new career opportunities for early childhood practitioners (Morgan, et al. 1993). Having all training opportunities build on one another, offering incentives for practitioners to obtain training, and specifying a core body of knowledge for all early childhood care and education practitioners are particularly important elements of a model program for career development. In addition, the Center says that a comprehensive, coordinated system of training and education should include these features: quality control over training content and trainers; a system for assessing training needs and offering training based of those needs; a system to make information about training easily accessible and widely distributed; a system for tracking provider training; a linkage between training and compensation; and an expanded and coordinated plan for funding training—preferably through public/private partnerships.
For a number of years Pennsylvania has been at the forefront nationally in the development of training opportunities for child care workers. Training for various segments of the child care provider population has been available for the past ten years. In 1992 a number of separate training programs were integrated into one system—The Pennsylvania Child Care/Early Childhood Development Training System (see section 2.0 for details on the development of this system). The Pennsylvania Department of Public Welfare (DPW) has been instrumental in the development of this training system and has promoted the establishment of an affordable and flexible training system that is based on the principles of early childhood education and child development.
Recognizing the importance of tracking the impact of this training system on the quality of care, DPW has supported research efforts in this regard. The research reported herein was designed for dual purposes: to identify the training needs for Pennsylvania child care providers and to assess the impact of training on the quality of care in child care sites. In addition, the results of this research effort are compared to earlier Pennsylvania studies that examined the quality of child care. Within these overarching research goals, this study examined a number of specific research questions that are delineated below.
Research Questions Related to Training Needs
What are the perceived needs for training? Do various provider groups have different needs (e.g., center teachers, center directors, group providers, and family providers)?
What are the observed needs for training as indicated through the site observations of quality of care?
What are the most important factors affecting the selection of training? How does the director impact this?
3

How do providers evaluate the training? What are their perceptions regarding appropriateness, usefulness, applicability, and effectiveness of training in achieving learning objectives? What is their level of interest in training? And how do they think it applies to their work?
What are the barriers to training? Are the barriers different for the various provider groups?
Research Questions Related to Quality of Care
How has the quality of care in Pennsylvania child care changed over the years? What factors are significant in predicting the quality of care as observed in child care
classrooms? To what extent do staff background characteristics (e.g., current education,
educational goals, age, years in field, and salary) impact the classroom’s quality of care?
How are features of a caregiver’s training experience related to classroom quality of care? To what extent does the level of training impact quality? What is the impact of the training’s perceived appropriateness, usefulness, applicability, and effectiveness in achieving learning objectives?
To what extent do teachers’ perceptions of organizational climate impact the quality of classroom care?
What is characteristic of the quality of work life in child care centers in terms of organizational climate, summary of worker values, overall commitment, how the environment resembles an ideal, the importance of educational goals and objectives, and the degree of influence of teaching staff?
To what extent is a center’s organizational climate associated with director background characteristics, aggregate teacher characteristics, site turnover, accreditation status, size of site, and average hours of training per site?
To what extent is a center’s overall quality of care associated with director background characteristics, aggregate teacher characteristics, organizational climate, and other site level features (e.g., size of center, accreditation status, turnover rate, and average hours of training per year)?
This study was undertaken in an effort to answer these research questions. The following sections provide a description of Pennsylvania’s child care training initiative and its evolution over the years; a review of the literature related to professional development systems and factors associated with the quality of child care; an overview of the conceptual framework and methodology used to guide the study; a summary of the results; and the implications of the findings for public policy.
4
2.0 PENNSYLVANIA’S CHILD CARE TRAINING INITIATIVE
Pennsylvania's child care training initiative started as many statewide training systems in the early 1990s utilizing Child Care and Development Block Grant (CCDBG) funds (Fiene 1995). States utilized the program quality portion of CCDBG1 to fund early childhood development training systems. The Pennsylvania training system is commonly known as the Pennsylvania Child Care/Early Childhood Development Training System (PA CC/ECD). The PA CC/ECD Training System started in January 1992 after lengthy public hearings into the Child Care and Development Block Grant in which child care advocates pushed for a comprehensive training system for early childhood providers throughout the state. The advocates felt that a comprehensive child care training system was a cost-effective way of improving the quality of early childhood programs throughout Pennsylvania.
The PA CC/ECD Training System has gone through several system changes since 1992 and several evaluations with the presently described study as just one of these. For example, prior to 1992, the only training available to child care providers was through a home-based voucher training program. This program proved to be very popular with providers because it gave them ultimate flexibility in the selection of training opportunities. As the training system has evolved, this home-based voucher program became part of the overall PA CC/ECD Training System in 1995. However, this program provides very little structure related to course sequencing or core competencies for child caregivers.
Four school-age technical assistance and capacity building projects also existed prior to 1992 but their major focus was not on training. After 1992 this changed and their focus turned to training. In 1995 these four school-age training projects became part of the overall PA CC/ECD Training System. By 1995, all training for center-based, home-based, and school age were under the umbrella of the PA CC/ECD Training System and administered by one contractor, Keystone University Research Corporation (KURC).
The Early Childhood Education Linkage System (ECELS), the program responsible for all health and safety training and technical assistance in Pennsylvania, delivered the American Red Cross Child Care Course throughout the state from 1992 until 1995. In 1995 this course was also taken under the umbrella of the PA CC/ECD Training System. This completed the coordination of all training activities related to early childhood and child care under the umbrella of PA CC/ECD with the exception of Head Start and early intervention training. However, there was a mandate for the KURC project director to coordinate with both groups.
Since 1992, approximately 50,000 training opportunities have been delivered to early childhood providers on an annual basis. These training opportunities include workshops, seminars, videos, learn-at-home materials, conferences, satellite teleconferences, mentoring visits, or vouchers for college coursework and other training outside the PA CC/ECD system. The PA CC/ECD Training System is a diverse system of training opportunities and funding mechanisms. Several of the PA CC/ECD Training System components have been recognized as innovative training modalities. For example, the home-based voucher
1This included a set aside of 6.25% of $731,915,000 in 1991 federal funds for program quality initiatives.5

program and ECELS were recognized in Making a Career of It, a report by the Center for Career Development in Early Care and Education at Wheelock College (Morgan et. al. 1993). However, a concern began to grow that the training opportunities, albeit comprehensive, were not coordinated to lead an individual on a career path. Therefore, several research studies were undertaken to determine the effectiveness of the overall system and its implementation.
Penn State University conducted the first, an evaluation in 1992 through 1995. Two other studies were initiated in 1996. The Penn State University evaluation research helped to clearly delineate the need for additional training opportunities for staff. The key variable that predicted positive developmentally appropriate changes in the classroom after three years of tracking staff was the accumulative amount of training over a number of years that staff were taking (Johnson 1994). This was a key finding, but other factors and features of training that were associated with child care quality needed to be determined.
There were overlapping concerns, although different purposes for the two studies initiated in 1996. Wheelock College (Stoney et al. 1997) conducted one study, an assessment of the various early childhood training systems in Pennsylvania. This study was undertaken to determine how to coordinate the existing PA CC/ECD Training System with other training systems in an effort to develop a full-fledged early childhood career development system within Pennsylvania. The other study initiated in 1996 is the one reported herein. It will help to answer many of the additional concerns not addressed in earlier studies and to track the changes in the quality of child care in Pennsylvania. We also hope that these findings address national issues of early child care education and planning.
6

3.0 LITERATURE REVIEW
Staff development research as well as studies on factors associated with the quality of child care always share the same long term goal, typically hold the same theoretical orientation, and often have variables in common within their research designs. Ultimately, the goal is to bring about optimal experiences for children in child care. Descriptive and explanatory knowledge about early childhood inservice education or staff development and about program quality is needed to achieve this aim. Other related goals can be served at the same time when research adds to an understanding of quality experiences for children in child care, the value of inservice training for staff development, and the relationship between the two.
3.1 Staff Development Research Current education literature addresses a number of issues related to the on-going professional development of teaching staff. One very important issue concerns the application of knowledge or the ability to transfer learning into practice. What are the most effective strategies to use to guarantee the transfer of knowledge into practice? Numerous reasons are provided relative to why staff who participate in educational programs do or do not apply in practice what is learned through education. The perception of program participants about the value and practicality of program content, the presence or absence of follow-up strategies, and supervisory attitudes toward changes required to apply what has been learned are all critical in determining transfer of learning (Caffarella 1994).
The value and practicality of a program implies that a training curriculum should be problem-centered and site-specific. According to Jorde-Bloom and Sheerer (1992), training programs should address real issues and concerns that participants face in their work setting on a daily basis. Staff development efforts should facilitate interaction between colleagues; staff developers should “take into account the distinctly different orientations, needs, and interests” of program participants; and training content should focus on bridging the gap between theoretical ideas and the practical realities of the work setting.
Discussions about the characteristics of effective staff development programs have resulted in some key themes. Holt-Reynolds (1995) maintains the importance of being aware of the rationales underlying the use of particular teaching practices. Rather than focusing on skill training as so many pre-service and in-service teacher development programs have done, staff development must be aimed at uncovering and dealing with lay beliefs, attitudes, behaviors, and decision-making strategies that teachers bring to the classroom.
VanderVen (1994) suggests a contextual model of professional development that enhances the current linear model, which is structural. The contextual model recognizes that early childhood is age-specific and it is “integrated across the domains of care, education, and development” (VanderVen 1994:84). The contextual model is generic and calls for situational application of multidisciplinary knowledge. VanderVen believes that professional development programs should facilitate constructivism and articulation
7

of theory into practice. Knowledge is gained by doing, then reflecting and dialoguing about it— a constructivist model for learning (Jones 1993).
In light of the contextual model, outcomes-based educational programs have also been recommended as more effective than the competency-based training programs of the past. Representing a paradigm shift, outcome-based programs focus on demonstrating application of knowledge in contextual settings and quality performance of integrated tasks. Simply acquiring knowledge and demonstrating competencies in isolation is not authentic and does not address the importance of making connections between pre-service training (development) and practice (performance).
Finally, as all this relates to teachers in child care settings, career mobility and advancement is seen as a sine qua non of professional development programs (Morgan 1994). According to Morgan, a professional development system should:
Make training count: when substantial training of good quality is offered, it should carry college credit or be transformed to college credit that can be applied to certificate or degree programs.
Improve access to credit-bearing training for practitioners who are already employed, particularly people of color and individuals from low-income populations.
Articulate programs: accept the Child Development Associate (CDA) Credential to count toward an associate degree program; and allow the associate degree program to count in full toward a bachelor’s degree program.
Given this background on staff development, we now raise the fundamental question: What constitutes a high quality professional development program? The National Association for the Education of Young Children (NAEYC) has provided leadership in professional development models for early childhood educators (Bredekamp and Willer 1994). One of NAEYC’s top priorities is improving professional preparation programs for the diverse staff who care for young children. A current NAEYC initiative, the National Institute for Early Childhood Professional Development, is a system designed to address the complexity of developing staff involved in the care and education of young children, improving the quality and consistency of professional pre-service and in-service programs, and linking them with improvements in practice.
Through the work of NAEYC, Willer (1994:17-19) has identified these principles that lay the foundation for effective professional development processes; they include:
Professional development is an ongoing process. Professional development experiences are most effective when grounded in sound
theoretical and philosophical base and structured as a coherent and systematic program.
Professional development experiences are most successful when they respond to individuals’ background, experiences, and the current context of their role.
Effective professional development opportunities are structured to promote clear linkages between theory and practice.
Providers of effective professional development experiences have an appropriate knowledge and experience base.
8

Effective professional development experiences use an active hands-on approach and stress an interactive approach that encourages students to learn from one another.
Effective professional development experiences contribute to positive self esteem by acknowledging the skills and resources brought to the training process as opposed to creating feelings of self-doubt or inadequacy by immediately call into question an individual’s current practices.
Effective professional development experiences provide opportunities for application and reflection, and allow for individuals to be observed and receive feedback upon what has been learned.
Students and professionals should be involved in the planning and design of their professional development program.
This attention to early childhood professional development comes at a critical time. Research on the background and skills of child caregivers paints a bleak picture. There is significant concern that child caregivers lack the skills, knowledge, and education to appropriately address the developmental needs of children. “Six out of seven child care centers provide care that is mediocre to poor. One in eight might actually be jeopardizing children’s safety and development” (Children’s Defense Fund 1998).
The 1993 National Child Care Staffing Study cited low wages as one factor that accounts for poor quality care. Low wages make recruitment and retention of qualified personnel difficult. Another reason for the low quality of child care is inadequate staff training. “Staff education and training are among the most critical elements in improving children’s experiences in child care” (Children’s Defense Fund 1998:39). Regardless, many states do not require pre-service training for teachers in licensed or regulated child care centers. Further, a majority of states only require 12 or fewer hours of annual training (Children’s Defense Fund 1994). Research has shown that a threshold for training to show some impact is around 18 hours (Howes, Smith & Galinsky 1995).
3.2 Quality of Child Care Research
Reviews of the research on the factors related to child care quality (Phillips 1987; Love et al 1996; Chung and Stoney 1997) group the studies into several categories. Some studies address global assessments of child care quality while others focus on the structural dimensions of quality or the dynamic measures of classroom quality. For our purposes, studies focusing on global assessments and structural dimensions of quality care are of particular importance.
Research from the late 80s (Phillips 1987) identifies the following as key indicators of quality child care:
The program is licensed. The child’s interaction with the caregiver is frequent, verbal, and educational , rather
than custodial and controlling. Children are not left to spend their time in aimless play. There is an adequate adult-child ratio and reasonable group size.
9

The caregiver has a balanced training in child development, some degree of professional experience in child care, and has been in the program for some period of time.
More recent studies (Helburn 1995, Phillips, Howes, and Whitebook 1992) confirm the importance of these indicators as well as identify other factors that are important. In addition, the following features of high-quality child care for preschool children include:
Space: the indoor environment is clean, in good repair, and well-ventilated; classroom space is divided into richly equipped activity areas; fenced outdoor play space is equipped with swing, climbing equipment, tricycles, and a sandbox.
Children’s activities: most of the time, children work individually or in small groups; children select many of their own activities and learn through experiences relevant to their own lives; caregivers facilitate children’s involvement, accept individual differences, and adjust expectations to children’s developing capacities.
Parent-caregiver interaction: parents are encouraged to observe and participate in the program; caregivers talk frequently with parents about children’s behavior and development.
For infants, the following signs of high-quality child care are in addition to the key indicators identified by Phillips (1987):
Play materials are appropriate for infants and toddlers and stored on low shelves within easy reach.
Daily schedule includes times for active play, quite play, naps, snacks, and meals; it is flexible rather than rigid, to meet the needs of individual children; and the atmosphere is warm supportive, and child are never left unsupervised.
Caregivers respond promptly to infants’ and toddlers’ distress; hold, talk , sing, and read to them; and interacts with them in a contingent manner that respects the individual child’s interests and tolerance for stimulation.
Parents are welcome anytime; caregivers talk frequently with parents about children’s behavior and development.
In light of this overview, the underlying theme is the consistency in which the above factors, as indicators of quality, appear in the research findings.
10

4.0 CONCEPTUAL FRAMEWORK
Staff development research as well as studies on factors associated with the quality of child care always share the same long term goal, typically the same theoretical orientation, and often have variables in common within their research designs. The present study, with its twofold purpose of investigating the PA CC/ECD Training System with respect to user perceptions and the relationship between training and program quality, intersects with the current research literature. Accordingly, its long range purpose, its conceptual underpinnings, and its choice of variables and measures are consistent with previous work in these two areas.
The long range motive inherent in this and related research is to bring about optimal experiences for children in child care. Descriptive and explanatory knowledge about early childhood inservice education or staff development and about program quality is needed to achieve this aim. Other related goals can be served at the same time when research adds to an understanding of quality experiences for children in child care, the value of training for staff development, and the relationship between the two. A socio-ecological or systems theory perspective provides a framework for this study. This perspective emphasizes reciprocal transactions between individuals and their environments. Individuals constructions (beliefs and attitudes) of their social environments, rather than some notion of objective reality, are central to personal adaptation and behavior (Bronfrenbrenner 1979; Lewin 1935). Child care and training workshops are dynamic, psychological entities as well as physical ones. Providers social role behaviors and interpersonal relations relevant to the care of children are associated with the totality of factors that constitute a particular child care site (i.e., overall staff and program characteristics). Likewise, providers role behaviors and relations within child care (staff-staff, staff-child, staff-parents) that contribute to program quality are assumed to influence and be influenced by the PA CC/ECD Training System.
The selection of variables and measures involved in this study, the rationales for the choices, how the variables are conceptually organized, and how they are consistent with previous research are described in the remaining part of this section. These variables are organized into categories as depicted in Figures A and B relevant to the two major purposes of the present study.
Figure A illustrates how the variables are conceptually organized and associated with levels of child care quality. Quality of child care is operationalized by scores from the Harms and Clifford Environment Rating Scales, while the various dimensions of a child care work environment are measured with Paula Jorde Blooms Early Childhood Work Environment Survey. Characteristics of the work environment are viewed as a primary set of intervening variables.
11

As measures of program quality, three separate environment rating scales were used in this study: the Early Childhood Environment Rating Scale (ECERS), the Infant/Toddler Environment Rating Scale (ITERS), and the Family Day Care Rating Scale (FDCRS). Although each scale has comparable areas that are assessed, the individual items composing each scale do vary depending on the type of child care site or classroom observed. Across each of these scales, these are the major components and the items used as indicators of the area:
Furnishings and Display: furnishings for routine care; use of furnishings for learning activities; furnishings for relaxation and comfort; room arrangement; child-related display; indoor space arrangement; active physical play; space to be alone for a) infants and toddlers and/or b) 2 years and older.
Personal/Basic Care: arriving/departing; meals/snacks; nap/rest; diapering/toileting; personal grooming; health practice; health policy; safety practice; safety policy.
Language and Reasoning: informal use of language for a) infants/toddlers and/or b) 2 years and older; helping children understand language for a) infants/toddlers (books & pictures) and/or b) 2 years and older; helping children use language; helping children reason.
Fine/Gross Motor (ECERS only): fine motor (FM); supervision (FM); gross motor (GM) space; GM equipment; GM time; supervision (GM).
Creative/Learning Activities: eye-hand coordination; active physical play; art; music and movement; sand and water play; dramatic (pretend) play; blocks; use of T.V.; schedule of daily activities; supervision of play indoors and outdoors; cultural awareness.
Social Development: tone; discipline; cultural awareness; space (alone); free play; group time; exceptional provisions.
Interaction (ITERS only): peer interaction; adult-child interaction; discipline.
Program Structure (ITERS only): schedule of daily activities; supervision of daily activities; staff cooperation; provisions for exceptional children.
Adult Needs: adult personal needs; opportunities for professional growth; adult meeting area; provisions for parents; relationships with parents; balancing personal and caregiving responsibilities.
As indicators of the various dimensions of an early childhood work environment, the Early Childhood Work Environment Survey (Jorde-Bloom 1988) includes these conceptual areas:
Organizational Climate is the collective perceptions of staff regarding these ten dimensions: Collegiality is the extent to which staff are friendly, supportive, and trust one another. Professional growth is the degree of emphasis placed on personal and professional
growth. Supervisor support measures the presence of facilitative leadership that provides clear
expectations, support, and encouragement.
12

Clarity looks at the way policies, procedures, and responsibilities are defined and communicated.
Reward system concerns the degree of fairness and equity in the distribution of pay, fringe benefits, and opportunities for advancement.
Decision making measures the degree of autonomy given to staff and the extent to which they are involved in center-wide decision making.
Goal consensus is the degree to which staff agree on the goals and objectives of the center.
Task orientation measures the emphasis placed on good planning, efficiency, and getting the job done.
Physical setting is the extent to which the equipment, materials and the spatial arrangement of the center help or hinder staff in carrying out responsibilities.
Innovativeness measures the extent to which the center adapts to change and encourages staff to find creative ways to solve problems.
Summary of Worker Values assesses the importance or value that staff attach to each of the dimensions of organizational climate.
Overall Commitment provides a summary of the staff’s overall commitment to the center; individuals who feel deeply committed to their jobs tend to put extra effort into their work and take pride in their center.
Summary of How Current Work Environment Resembles Ideal measures staff perceptions of how closely their current work situation resembles their ideal work environment.
Importance of Educational Goals and Objectives details the rankings that staff assign to six different early childhood educational objectives: language and problem solving skills; strong friendships; skills in sharing; concepts needed for reading and math; independence in caring for themselves; physical skill and coordination; and positive self concepts and self esteem.
Degree of Influence of the Teaching Staff describes the perceptions of workers regarding the degree of influence of the teaching staff with respect to various decisions that are typically made in early childhood programs–both those where centralized decision making may be preferred and those where shared decision making may be possible.
Figure A shows an overview of the variables and how they are conceptually organized with respect to the investigation of factors related to the quality of child care. Although the left- to right-hand side ordering of the variable categories in Figure A suggests directionality of effects, it is important to keep in mind that this study is basically descriptive-correlational in nature. The non-experimental, cross-sectional nature of the research design precludes testing directional hypotheses. Program quality could be the cause or the effect of the other variable categories. Nevertheless, the original rationale for selecting this research design centered on the plausible assumption that higher levels of training of personnel in a program would go hand-in-hand with the quality of care. In addition to organizational climate, certain staff and program characteristics were also expected to show a positive and statistically significant relationship with the quality of care.
13

Figure A here
14

The variable categories of program type and program variables shown on the far left-hand side of Figure A are best viewed as moderating variables. These variables suggest data-based comparisons but are not seen as predictors or mediators of quality (with the exception of accreditation status).
Figure B illustrates the relationships among variable categories pertinent to the identification of training needs and user perceptions of the training system. Of major interest, again, are the comparisons involving program type (family child care, group child care, and centers) and type of staff (directors versus teachers). The model included these specific areas: site characteristics, staff characteristics, quality of training, perceptions of the training system, and quantity of training. Training needs and interests were also identified. Questionnaires administered to child care staff were used to identify perceived training needs and interest areas via teacher and director self reports as well as directors views of staff interests and needs. Needs (as opposed to interests) were also gleaned from information obtained from the environmental rating scales.
15

Figure B here
16

5.0 METHODOLOGY
As previously indicated, this is a cross-sectional study that collected data from child care sites throughout Pennsylvania. Child care sites were sampled and trained fieldworkers conducted site visits to observe the quality of care in classrooms and to administer questionnaires to child care staff. Specific details about the sampling process, fieldworker training, and data collection instruments are described in the following sections.
5.1 Sampling
A stratified systematic sampling process was utilized to identify child care sites for this study. At the time in which we drew the sample, there was a population of approximately 4,144 family child care sites, 590 group homes, and 3,067 child care centers (the registered family child care sites and licensed group homes and centers). Within each of these separate lists, we then created sampling frames stratified by geographic region. From these stratified lists, we randomly selected a number of child care sites of each type within the various geographic regions of the state. Our sampling design called for a disproportionate number of sites in each category: 30 family child care homes, 30 group child care homes, and 60 child care centers.
We decided on these numbers for a couple reasons. First, limited resources and time would not allow us to conduct more than the 120 site visits. Second, to have a sufficient number of group homes to analyze, the number of group child care sites in the sample had to be disproportionate to what they represented in the population. Given the disproportionate nature of the sample, weights were used in any analysis that involved more than one type of child care site.
To encourage voluntary participation in this study, we implemented a number of procedures. First, we initially sent a letter to selected sites to explain the purpose of the study and the importance of the findings for improving the child care training system in Pennsylvania. In this letter we explained the advantages of their participation in the study: they would receive a voucher to purchase children’s books/toys from Gryphon House ($100 for centers and $50 for family and group homes); they would have an opportunity to have a early childhood professional visit their site and provide some feedback to them regarding the environment rating scales; and they would receive a certificate acknowledging their participation in the study. A follow-up call to the sites was made to further explain the study and encourage their participation. Once a confirmation was received from the site, a fieldworker was assigned to the site to establish a date for a site visit.
A number of the sites initially drawn for the sample were not included in the final total (some were no longer in business, some refused, some could not be visited due to scheduling difficulties). In each case, another randomly drawn site was used as a replacement. Our analysis of the data confirms that the resulting sample was not biased as a result of this replacement; the indicators of quality vary in the expected manner and other
17

site level characteristics reflect known data. The final sample size consisted of 29 family child care homes, 30 group homes, and 60 centers. 2
5.2 Fieldworker Identification and Training
The importance of having trained observers in a study of this nature cannot be underestimated. Because of this, we took care to identify fieldworkers who were familiar with the Harms and Clifford Environment Rating Scales or with the validation procedures used by the National Association for the Education of Young Children when they conduct accreditation site visits. Once fieldworkers were identified, we sent them the training materials (video and manual) for the Harms and Clifford Environment Rating Scales. Following that, we held a training session to review these materials and other procedures that were to be used in setting up and conducting the site visits. A fieldworker manual was prepared and distributed to everyone; monitoring of their work and progress was conducted from the KURC office; and inter-rater reliability was determined for a small percentage of each fieldworker's observations for the environment rating scales. The high inter-rater reliability scores indicate consistent use of the scales.3 Furthermore, the overall quality of the data gathered by the fieldworkers attests to their ability.
5.3 Data Collection Instruments
Our operationalization and measurement of two key areas in this study have been previously discussed. Quality of child care was measured through the three Harms and Clifford Environment Rating Scales: ECERS, ITERS, and FDCRS. The scale value for each of the items assessed on these instruments ranges between 1 and 7, where 1=inadequate, 3=minimal, 5=good, and 7=excellent.4
The dimensions of the child care work environment were measured with Paula Jorde-Bloom’s Early Childhood Work Environment Survey (ECWES). There are six separate conceptual areas assessed through this instrument, as identified earlier. For each of the organizational climate dimensions, a score of 0 to 10 is calculated by averaging the staff responses to 10 items for each dimension. The summary of worker values is indicated by the percentage of staff (0 to 100 percent) that identify an organizational climate dimension as one of the three most important aspects of their work. Overall commitment has a range of values between 0 and 10 where 0=not committed and 10=highly committed. Staff perceptions of how their current work environment compares with their ideal ranges between 1=not like my ideal and 5=like my ideal. The importance of educational goals and objectives is indicated by a priority ranking, ranging from 1=low priority to 6=high priority. Finally, the degree of influence of teaching staff regarding
2 A decision was made not to extend the data collection process for one additional family site after we had difficulty in scheduling the final site visit. 3 There were 26 paired observations analyzed to determine inter-rater reliability. For the ECERS, the rank order correlation was .90; for the ITERS it was .95; for FDCRS, it could not be calculated since there was only one paired observation; however, a visual inspection of the FDCRS data shows a high degree of consistency across observers.4 The instruments include specific descriptions of what to look for in assigning a value of 1,3,5 and 7 for each of the items assessed. A mid-point rating of 2,4 or 6 is given when all the lower and part of the higher description applies. The internal consistency scores (Cronbach’s Alpha) for each of the environment rating scales is .83 for ECERS, .83 for ITERS, and between .70 and .93 for the individual subscales of the FDCRS.
18

organizational decisions is assessed on a scale of 0 to 10 where 0=very little influence and 10=considerable influence.5
In addition to these standardized instruments, we developed a series of questions to gather background and training information from both directors and teachers within the child care sites. Although the questions were comparable for directors and teachers and across the type of sites, there were some items that applied only to one or the other. Given this, separate instruments were developed. One was for family providers; one for directors of small sites (group homes and some small centers); one for directors of centers; one for teachers of small sites; and one for teachers from centers. In the end, we analyzed the data in terms of the type of site (family, group, or center) as well as type of respondent (director or teacher). Copies of these instruments and the descriptive data for each question are in Appendix A.
The comprehensive background information gathered with these questionnaires included:
Director and/or Teacher Background: age, sex, race, education, years in early childhood field, years with current employer, employment status, salary, long-term educational goal, CDA status, and parental status.
Training Background and Assessment: number of training hours in past three years, annual training goal, evaluation of training system (appropriateness, achievement of goals/objectives, usefulness, applicability), helpfulness of additional training, specialized training, assessment of specific training modalities, decisions about staff training, presence of staff development plans, compensation for training, factors affecting the selection of training, barriers to training, interest in training, and need for additional training in selected topic areas.
Site Characteristics: age of children in facility, type of facility, licensed capacity, number of classrooms, change in licensed capacity in past year, number of paid staff, number of new staff in current year; presence of assistant director, and accreditation status.
5 The total scale alpha coefficient for internal consistency for the ten dimensions of organizational climate is .95. The specific details on the reliability and validity for other components of ECWES can be found in P. Jorde-Bloom (1996), Improving the Quality of Work Life in the Early Childhood Setting: Resource Guide and Technical Manual for the Early Childhood Work Environment Survey. Wheeling, Illinois: The Early Childhood Professional Development Project.
19

6.0 FINDINGS The results of this study address a number of specific research questions within the context of identifying training needs and assessing the factors associated with the quality of care (see section 1.0, Statement of the Problem). In presenting the results of the data analysis, we first provide an overview of the background data for each of the provider groups, followed by the findings for the specific research questions.
6.1 Background Data on Provider Groups and Child Care Facilities6
The socio-demographic characteristics of the provider groups, their training background, and various site characteristics are summarized in Tables 1-3 to give a better understanding of the child care providers and facilities included in this study.
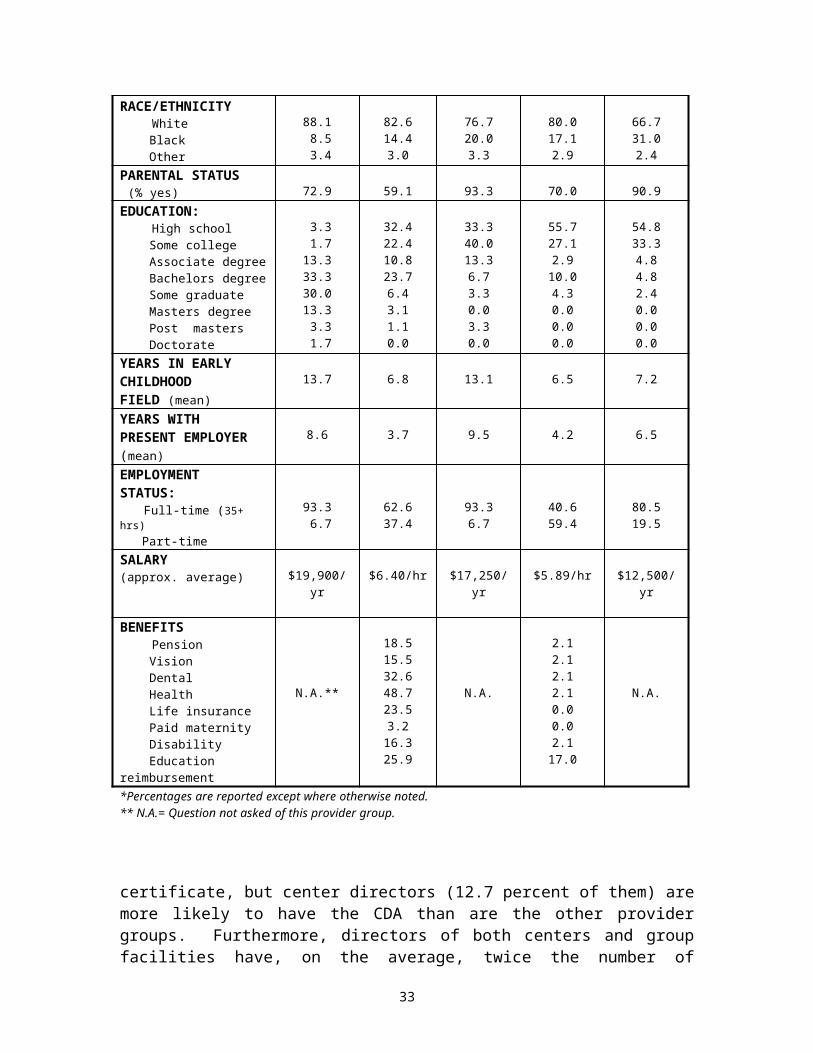
As Table 1 shows, the socio-demographic characteristics of this sample are typical of what we find in national statistics. As expected, the vast majority of providers are female. Their average age is between 34.8 and 45.8 with directors slightly older than teachers are. A majority of providers are parents (between 59 to 93 percent) with center teachers least likely to hold this status. Educationally, we see that center directors hold the highest levels of education while group teachers and family providers have the lowest levels, thus showing the relationship between child care position and academic background. The directors for both centers and group facilities have been in the field of early childhood education longer than the other provider groups (on an average of thirteen years for directors in comparison to approximately seven years for child care teachers and family providers). Center teachers have the least amount of time with their current employer in comparison to their total number of years in the field. The vast majority (over 93 percent) of directors for both centers and group facilities are full-time, while a majority of group teachers (59.4 percent) are part-time. Regarding compensation, group teachers are also the lowest paid (approximately $5.89/hour), while center directors, on the average, earn the highest salaries–just under $20,000 per year. Benefits are also not prevalent in the field, although center staff are more likely to have some benefits than are home-based providers. Health benefits are the most common, yet less than half (48.7 percent) of the center teachers report having this benefit.
Table 2 summarizes the responses to questions that are indicators of the extent to which providers are motivated to pursue additional as well as higher levels of education and training. Over one-third of each provider group indicate that they have no long-term educational goals when asked about them. However, the center directors are more likely to express a desire for higher education, with 57.1 percent of them indicating that a graduate degree is their long-term educational goal. As far as other child care training, a substantial percentage of providers do not have a Child Development Associate (CDA)
Table 1: Background Characteristics of Provider Groups*
6 Also see Appendix A for the summary of the data from each of the questionnaires administered to the provider groups–center directors, center teachers, group child care directors, group child care teachers, and family providers.
20

CharacteristicCenter
Directors(N = 60)
Center Teachers
(N = 561)
GroupDirectors
(N = 30)
GroupTeachers
(N = 70)
FamilyProviders
(N = 44)SEX (% female) 98.3 98.0 100 95.7 93.2AGE (mean) 41.6 34.9 45.8 34.8 38.8RACE/ETHNICITY White Black Other
88.1 8.5 3.4
82.614.43.0
76.720.03.3
80.017.12.9
66.731.02.4
PARENTAL STATUS (% yes) 72.9 59.1 93.3 70.0 90.9EDUCATION: High school Some college Associate degree Bachelors degree Some graduate Masters degree Post masters Doctorate
3.3 1.713.333.330.013.3 3.3 1.7
32.422.410.823.76.43.11.10.0
33.340.013.36.73.30.03.30.0
55.727.12.9
10.04.30.00.00.0
54.833.34.84.82.40.00.00.0
YEARS IN EARLYCHILDHOODFIELD (mean)
13.7 6.8 13.1 6.5 7.2
YEARS WITHPRESENT EMPLOYER (mean)
8.6 3.7 9.5 4.2 6.5
EMPLOYMENTSTATUS: Full-time (35+ hrs) Part-time
93.3 6.7
62.637.4
93.36.7
40.659.4
80.519.5
SALARY (approx. average) $19,900/yr $6.40/hr $17,250/yr $5.89/hr $12,500/yr
BENEFITS Pension Vision Dental Health Life insurance Paid maternity Disability Education reimbursement
N.A.**
18.515.532.648.723.53.2
16.325.9
N.A.
2.12.12.12.10.00.02.1
17.0
N.A.
*Percentages are reported except where otherwise noted. ** N.A.= Question not asked of this provider group.
certificate, but center directors (12.7 percent of them) are more likely to have the CDA than are the other provider groups. Furthermore, directors of both centers and group facilities have, on the average, twice the number of training hours than do the teacher and family provider groups. Over the past three years, directors averaged over 40 hours of training, while teachers and family providers averaged only around 20 hours (just slightly higher than what is required to meet the state regulations of 6 hours per year). The emphasis on only meeting state requirements is further evidenced by the responses from providers when asked to indicate their annual training goal. A majority in each provider group, except group directors, indicates that completing the 6 hours is their goal. Both
21
directors of centers and group facilities, as well as family providers show greater interest in education/training beyond the minimum required. The final indicator of a provider’s educational interest and motivation is revealed when asked, “Do you have a plan for your individual career development in early childhood care and education?” More than half of teachers and family providers indicate that they have a personal career development plan. This appears to be a higher percentage than expected, given the responses to the other questions related to educational interest and motivation. However, this question did not ask if the plan was written and/or formalized; as such, the responses to this question may include individuals who at a minimum have thought about their plans for further training and education.
Table 2: Training Background of Provider Groups*
CharacteristicCenter
Directors(N = 60)
Center Teachers
(N = 561)
GroupDirectors
(N = 30)
GroupTeachers
(N = 70)
FamilyProviders
(N = 44)LONG TERM EDUCATIONAL GOAL GED/High school Non-credit adult education Early childhood certification Associate degree College degree Graduate degree No long term goals
0.01.80.01.85.4
57.133.9
4.35.8
12.26.8
15.917.637.5
6.96.9
13.813.813.810.334.5
7.413.216.24.48.8
10.339.7
4.89.59.5
16.714.34.8
40.5SEEKING CDACERTIFICATE Yes No Already have
1.885.512.7
16.975.87.3
20.879.20.0
16.974.68.5
25.671.82.6
TRAINING INPAST 3 YRS(mean hours) 43.1 18.5 40.3 20.5 20.2ANNUAL TRAINING GOAL 6 hours 12 hours 12+ hours
40.727.132.2
67.319.013.7
31.031.037.9
63.921.314.8
53.714.631.7
PERSONAL CAREER DEVELOPMENT PLAN (% yes) N.A.** 55.1 N.A. 55.0 71.1
*Percentages are reported except where otherwise noted. ** N.A.= Question not asked of this provider group.
Table 3: Facility Characteristics
Characteristic Centers(N= 60)
Group Homes(N= 30)
Family Homes(N=29)
22

Licensed Capacity(mean) 76.23 13.8 6.6
Number of Classrooms (mean)
4.95 2.1 N.A.**
Number of Children Enrolled(mean)
68.73 15.9 7.2
Age of Children(% of facilities with): Birth to 12 months 13-24 months 25-36 months 3-5 years 6-8 years 9+ years Special needs (% yes)
55.071.783.396.763.348.361.7
66.780.090.096.760.033.316.7
52.368.272.788.643.222.711.4
Number of Paid Staff (mean)
10.93 3.6 N.A.
Assistant Director(% yes) 37.3 35.0 N.A.
Turnover Rate .22 .31 N.A.
Accreditation Status (% yes)
26.3 10.0 22.5
** N.A.= Question not asked of this provider group.
The characteristics of the sample sites are shown in Table 3. On the average, centers have a licensed capacity for 76 children, just under five classrooms, and an enrollment of 69 children. While centers have fewer enrolled children than they are licensed for, both group and family homes have more (probably due to school-age children or children who might not be enrolled for full-child care). As for the age of children served, children age two through five are most likely to be enrolled in child care. Special needs children are most likely served by centers, not group or family homes. Staffing patterns are also consistent with common knowledge–centers average just under eleven paid staff, while group homes average just fewer than four. Approximately one-third of both centers and group homes has an assistant director. The turnover rate, indicated by the ratio of new staff to total number employed, is slightly higher for group child care (.31) than it is for centers (.22). Centers are most likely to be accredited (26.3 percent) while group homes are least likely (10 percent).
23

6.2 Training Needs and Perceptions of Current Training System 6.2.1 Perceived Training Needs
The survey instrument distributed to child care staff asked both directors and teachers to identify the need for training in specified training topics.7 They were also asked to base their assessment on the need for training for child care providers, not just the importance of the topic, alone. Table 4 summarizes the responses of these provider groups: center directors, center teachers, group providers8, and family providers.
In examining Table 4, if we rank order the topics in terms of perceived priority, we see that the general topic area of supervision, motivation, and discipline/guidance of children is considered an area of very serious need for training. This topic is ranked at the top for all provider groups except family providers who rank it as the second most needed area of training. The family providers identify fostering social development (e.g., dealing with conflict) as their top priority for training. These two topics are closely related in that they both deal with the issue of behavior management–a serious concern for providers that is repeatedly expressed by them. This concern over behavior management is further supported by the data when we see that both topics end up being ranked as either a first or second priority for training by all provider groups.
When all topics are listed in rank order (from topics that are a very serious need to topics that are not a priority), there is a high degree of consistency across all provider groups–for center directors and teachers as well as the home-based providers. The four areas consistently ranked as priority training topics are:
supervision, motivation, and discipline/guidance of children social development (dealing with conflict) child development developmentally appropriate practice
In addition, family providers identify nutrition and infant/child development as important areas of training for them.
Regardless of their relative importance and rank order position, providers view none of the training topics specified on the research instrument as unimportant. The average scale value for these topics ranged between 1.28 and 2.53–thus there is no topic area that is viewed as not a priority for training.
7 They were asked to indicate if there is a need for training, based on a scale of 1 to 4 where 1= a very serious need and 4= not a training priority.8 For the purpose of this analysis on training needs, both the directors and teachers within a group home have been combined into one category, representing group child care providers. This decision was made because the child care setting is usually small and a distinction cannot always be made between a “director” and “teacher” within the group site.
24

Table 4: Perceived Need for Training in Selected Topic Areas*
TrainingTopic
Center Directors
(N=60)
Center Teachers (N=546)
Group Providers (N=100)
FamilyProviders
(N=44)Child care business,
management 2.19 (16) 2.36 (17) 2.43 (19) 2.03 (17)Child care program
development 1.77 (8) 1.87 (9) 2.04 (12) 1.67 (9)Child development 1.63 (4) 1.57 (3) 1.72 (2) 1.59 (5) Child/staff health 2.05 (14) 1.77 (5) 1.89 (7) 1.80 (12)
Development appropriate practice 1.43 (3) 1.65 (4) 1.81 (4) 1.66 (8)
Emergent literacy, children’s literature or literacy-based
socio-dramatic play1.84 (9) 2.04 (15) 2.05 (13) 1.92 (14)
Emergent numeracy, science for young children 1.74 (6) 1.92 (11) 2.12 (16) 2.00 (16)
Fostering social development (e.g., dealing with conflict) 1.39 (2) 1.56 (2) 1.76 (3) 1.44 (1)
Inclusive/special needs education issues 1.74 (7) 1.78 (6) 2.05 (14) 1.69 (10)
Infant/ Toddler child development/programming 1.88 (10) 1.78 (7) 1.89 (6) 1.51 (3)
Multicultural, gender sensitivity in programming
for young children1.93 (11) 2.02 (14) 2.01 (10) 1.95 (15)
Music. dance, movement for young children 1.98 (13) 1.93 (12) 2.02 (11) 1.89 (13)
Nutrition 2.27 (17) 1.99 (13) 1.88 (5) 1.57 (4)Personal care routines
(naptime, toileting, grooming)
2.46 (19) 2.12 (16) 2.11 (15) 1.60 (6)
Play 1.97 (12) 1.91 (10) 1.96 (8) 1.71 (11)Supervision, motivation discipline/guidance of
children1.28 (1) 1.51 (1) 1.55 (1) 1.46 (2)
Working with parents/community services 1.73 (5) 1.85 (8) 2.00 (9) 1.64 (7)
Statewide conference on multiple topics 2.48 (20) 2.53 (20) 2.48 (20) 2.22 (20)
Regional conference on multiple topics 2.41 (18) 2.53 (19) 2.36 (18) 2.18 (19)
Mentoring, multiple topics 2.18 (15) 2.45 (18) 2.30 (17) 2.08 (18)* Perceived need is indicated by the mean score for the provider group on a scale of 1=a very serious need, 2=important but not critical, 3=more would be helpful, and 4= not a priority; in addition, a rank order of training needs for each provider group is indicated in parentheses.
6.2.2 Training Needs as Observed via the Environment Rating Scales
In addition to the identification of training needs through the self-reports of child care staff, we are able to provide a more objective measure via the Harms and Clifford Environment Rating Scales. By identifying areas where child care sites are weak (e.g., where average scores are less than 5), we can specify needed training topics. Table 5 summarizes the average scores for the individual items included in each of the environment rating scales (FDCRS, ITERS, and ECERS).
25

Table 5 here
26
In analyzing the set of individual items on the three different Harms and Clifford Environment Rating Scales, we see that there are a number of areas that receive a very low rating–below a scale value of 4.00. Items rated this low indicate areas where special attention should be placed in the design and delivery of training. Across all three scales–FDCRS, ITERS, and ECERS–these items are consistently rated low: cultural awareness, personal grooming, dramatic (pretend) play, and sand and water play. Furthermore, these areas are rated low in two out of the three environment rating scales: displays for children (FDCRS and ITERS), space alone (FDCRS and ECERS), helping infants/toddlers understand language (FDCRS and ITERS), art (ITERS and ECERS), and blocks (FDCRS and ITERS).
Overall, the ECERS reveals fewer areas of serious concern (only 16 percent of the items on this scale have a score below 4.00), while the ITERS reveals the most (46 percent of the ITERS’ items have a score below 4.00). This is consistent with national data on the environment rating scales (Phillips 1987; Scarr 1994). Indeed, if we compare the overall average score for each scale, (FCDRS = 4.47; ITERS = 4.26; ECERS = 4.63), the ITERS has the lowest average score. This points to the need for particular focus on infant/toddler training, a finding that is consistent with anecdotal evidence and comments.
On the other end of the continuum, there are a number of items on each of these scales that score above 5.00, indicating an assessment in the good range. Keeping in mind that there are not comparable items across all three scales,9 we consistently see these areas rated highly: nap/rest time, discipline/supervision, provision for parents, informal use of language with infants/toddlers, and health practice and/or policy. Consistent with our analysis of the items rated poorly, the ECERS fares the best. It has the highest percentage of items (38 percent) receiving a score above 5.00 (ITERS only has 26 percent of the items scoring above 5.00, while FDCRS has 23 percent). There are a couple points of interest in our examination of these ratings. First, it is noteworthy that the health area received such a positive evaluation. No doubt, concerns about health and safety are of primary importance to parents as well as officials who regulate child care. Second, the high rating for discipline/supervision is paradoxical given the consistent identification of this area by caregivers as one in which they are in the most need of training. What this shows is that caregivers are performing better in this area than they think; it also reveals that discipline/supervision is perhaps one of the most challenging areas in child care and something for which caregivers think they need constant help and support.
6.2.3 Selection of Training
Providers were asked to indicate the importance of a number of factors in their selection of training.10 In Table 6 we see, again, there is a high degree of consistency across all provider groups. Providers indicate that their selection is based primarily on their interest in a topic and if a topic helps understand children. Furthermore, center staff (directors and teachers) identify opportunities for professional development as
9 For example, the ECERS doesn’t assess health and safety areas and the discipline item is spread across a number of supervision items.10 Each factor was assessed by providers as 1=very important, 2=somewhat important, or 3=not important.
27

important. All provider groups, except center directors, rank training that offers practical solutions within the top five on their list of factors that are important in the selection of training. Center directors mention the scheduled times for training as important. Similarly, home-based providers mention the scheduled times for training or the location/convenience as important factors affecting their selection of training. These priority rankings are congruent with the role responsibilities of center directors and teachers and home-based providers. Directors are responsible for the scheduling of staff at their child care facility, while home-based providers must participate in training that is offered during nonbusiness hours–hence the importance of when training is scheduled. On the other hand, teachers deal with the day-to-day child care activities for which they want practical guidance.
Table 6: Factors Affecting the Selection of Training*
Selection FactorsCenter
Directors(N=60)
Center Teachers (N=546)
Group Providers (N=100)
FamilyProviders
(N=44)Location/convenience 1.19 (5) 1.27 (5) 1.29 (3) 1.08 (3)
Session length 1.51 (10) 1.70 (12) 1.71 (11) 1.54 (10)Meet state requirements 1.24 (7) 1.40 (8) 1.33 (5) 1.34 (6)
Quality of previous training 1.41 (8) 1.39 (7) 1.49 (8) 1.49 (8)Cost of training 1.53 (11) 1.66 (11) 1.50 (9) 1.58 (11)
Scheduled times of training 1.13 (4) 1.31 (6) 1.36 (6) 1.03 (1)Interest in topic/contents 1.10 (1) 1.15 (2) 1.15 (1) 1.21 (4)Networking opportunities 1.75 (12) 1.81 (13) 1.82 (13) 1.66 (12)
Training organization 1.76 (13) 1.65 (10) 1.72 (12) 1.69 (13)The trainer 1.48 (9) 1.51 (9) 1.66 (10) 1.54 (9)
Offers practical solutions 1.19 (6) 1.25 (4) 1.32 (4) 1.24 (5)Helps understand children 1.12 (3) 1.09 (1) 1.16 (2) 1.08 (2)Professional development 1.10 (2) 1.22 (3) 1.37 (7) 1.35 (7)
Sent by director N.A.** 1.91 (14) 1.87 (14)*** N.A.*** Importance of factors in the selection of training is indicated by the mean score for the provider group on a scale of 1=a very important, 2=somewhat important, and 3=not important. In addition, the rank order of the factors in terms of importance is indicated in parentheses.** N.A.= Not asked of this provider group.*** This represents the response from the group teachers only.
However, all of the factors that might affect the selection of training are considered at least somewhat important by the child care providers. (Note that none of the factors have a mean score above 2.0.) But, in terms of priority, the factors having the least priority across all provider groups are: networking opportunities, training organization, session length, cost of training, and trainer. The relative unimportance of the cost of training is to be expected. The Pennsylvania child care training system provides training opportunities at no cost, or for a minimal registration fee, therefore this is not a critical issue. As for the trainer and training organization, it may be that providers are satisfied with current training organizations and trainers (as expressed elsewhere in these data and also in the participant evaluation forms completed for each training session). Given this,
28

who the trainer or training organization is may not be as important as other factors in the selection of training.
What is of interest is the relative unimportance of networking opportunities. Anecdotally, we often hear that the opportunity to meet and talk with other child care providers is highly valued. On closer inspection, we see that family providers (the provider group that is most isolated from peers), are more likely to consider networking opportunities as important than are the other provider groups. Half of the family providers indicate that networking is a very important factor in their selection of training, while only around one-third of the other provider groups indicate this.11
Center teachers also were asked to indicate the importance of being sent by the director in their selection of training. In comparison to other factors, being sent by the director is relatively unimportantit is ranked at the bottom. Regardless, approximately one-third of the teachers in centers indicates that being sent by the director is a very important factor. Ideally, the directors of child care centers should be working with their staff to establish professional development plans that meet the individual needs of their workers. However, this question, as asked, does not identify the reason why a director sends staff to particular trainingi.e., whether the selected training corresponds with professional development needs of staff or whether the training is offered at a convenient time and place.
When directors were asked about how decisions are made regarding staff training, just under half of the center directors (46.6 percent) indicate that they “guide the selection but the staff make the final decision.” Whereas, in the group child care situation, 60 percent of the group directors indicate this.
Having a personal plan for career development is related to this decision-making process and the selection of child care training. Whether or not staff have such plans was assessed by asking directors “What percentage of your child care staff have personal plans for career development in early child care and education?” Center directors, on the average, indicate that over half (51.9 percent) of their staff have personal plans. In group child care, directors report that only 24.2 percent of their staff have personal career development plans. A much higher percentage (71.1 percent) of the family providers indicate that they have a plan for their development as a child care provider. This question does not ask for specific details, therefore the interpretation of what constitutes a plan probably varies considerably.
6.2.4 Evaluation of Training
The appropriateness, usefulness, applicability, and effectiveness of training in achieving learning objectives, as perceived by the providers, were used as one means to evaluate the training system. Providers were asked for their overall assessment of the training in which they participated, knowing that many have participated in a number of training opportunities over the past few years (see Figure 1).
11 See Appendix A for percentages on relevant questions that are reported in the discussion in this section 5.2.3.29
The vast majority of all provider groups consider the training to be either very appropriate or somewhat appropriate. In comparison, the group providers are more likely than the others to consider the training appropriate (94.6 percent), while family providers are least likely (89.2 percent).
Providers also positively assess the usefulness of training. More than four-fifths of each provider group consider the training somewhat or very helpful. Comparatively, home-based providers are most likely to consider the training useful (group=89.1 percent and family=89.2 percent), while center directors are least likely (87.5 percent).
*For each factor, these data represent the percentage of providers who indicate that: The training was “very appropriate” or “somewhat appropriate” (Appropriateness) The training was “very helpful” or “somewhat helpful” in their work (Usefulness) They can apply “ all,” “a lot,” or “some” of what the learned in training (Applicability) The training goals were “achieved” or “somewhat achieved” (Effectiveness)
The applicability of training (or the knowledge and skills learned) to the work environment should be an important feature of any training system if it is to have an impact. It is impressive that a substantial majority of all providers (over 90 percent)
30
*For each factor, these data represent the percentage of providers who indicate that: The training was “very appropriate” or “somewhat appropriate” (Appropriateness) The training was “very helpful” or “somewhat helpful” in their work (Usefulness) They can apply “ all,” “a lot,” or “some” of what they learned in training (Applicability) The training goals were “achieved” or “somewhat achieved” (Effectiveness)

indicate that they could apply all, a lot, or some of what they learned in the training to their current work.
To assess the perceived effectiveness of training, providers were asked to indicate the extent to which the training goal(s) were achieved, that is, the extent to which they learned the material.12 As with the applicability of training, almost all of the providers (over 90 percent) respond that they learned at least some of the material. A slightly smaller percentage of family providers indicate this (91.9 percent vs. over 96 percent for the other provider groups).
Overall, the training system is viewed positively by the provider groups, as evidenced by their response to the questions about appropriateness, usefulness, applicability, and effectiveness in achieving learning objectives. The providers consider the training appropriate for their level of knowledge and skill, find it helpful in their current work, indicate they are able to apply what they have learned, and feel the training goals have been achieved.
This positive assessment also corresponds with their response when asked about their level of interest in training and if they think more training would help them in their work (see Figure 2).13 As with the other evaluative factors, the level of interest is high among the teachers, with over 80 percent of the center and group teachers indicating they are either interested or very interested in taking training. Furthermore, directors are on target in assessing the level of interest of their staff. As further evidence of the positive evaluation of the training by providers, a substantial percentage (86-100 percent) indicate that attending more workshops or training will help them in their work.
A final evaluative measure used in assessing the current training system asked about the perceived helpfulness of the various training methods used in the Pennsylvania Child Care/Early Childhood Development Training System. Only directors and family providers were asked about this.14 Table 7 summarizes the responses for center directors, group directors, and family providers. On-site training ranks as the most helpful method by the directors of centers and group homes, while family providers rank it as second most helpful. Center directors and family providers also positively assess workshops. While the satellite and video methods of training may be cost effective and efficient in reaching providers in the more rural areas, both these methods of training are viewed as less helpful than the other methods. Interestingly, both family providers and group directors express a more positive view of these two methods than do the center directors.
12 It is important to keep in mind that when providers indicate that they learned the material, this is based on their subjective assessment, and the extent to which they actually did learn the material is not objectively measured through this question.13 Teachers in both group and center settings were asked, “In general, how interested are you in taking workshops or courses on teaching and/or caring for children?” Directors were asked to indicate their perception of interest on the part of their staff.14 Family providers were asked, “Based on your experience, what method(s) of training are most helpful for you?” Center directors, were asked, “Based on your experience, what method(s) of training are most helpful for your staff?”
31
*For level of interest, numbers represent: The percentage of family providers, group teachers, and center teachers who indicate they are “interested” or “very interested” in taking workshops or training. The percentage of center directors and group directors who indicate their staff are “interested” or “very interested” in taking
workshops or training.
For helpfulness of additional training in one’s work numbers represent: The percentage of providers who indicate that attending additional workshops of training will “somewhat” or “very much” help
them in their work.

Table 7: Perceived Helpfulness of Training Methods*
TrainingMethod
Center Directors
(N=60)
Group Directors
(N=30)
FamilyProviders
(N=44)
Workshop 1.26 (2) 1.52 (2) 1.16 (1)Satellite 2.33 (6) 2.07 (6) 1.84 (6)Video 1.92 (5) 1.56 (5) 1.60 (4)
On-site Training 1.21 (1) 1.39 (1) 1.42 (2)Conference 1.57 (4) 1.48 (3) 1.55 (3)Mentoring 1.38 (3) 1.47(4) 1.78 (5)
* Perceived helpfulness is indicated by the mean score for those who have experienced a method of training, on a scale of 1=very helpful, 2=somewhat helpful, and 3=not helpful. In addition, a rank order of the methods is indicated in parentheses.
6.2.5 Barriers to Training
Several factors may limit child care providers from attending training. Providers were asked to indicate the importance of a number of factors that might prevent them from attending training or workshops (see Figure 3).
The lack of child care for their own children while they attend training is considered important as a barrier only by family providers. This is another expected finding since family providers are most likely to have to attend training outside of their work hours, necessitating the need to find care for their own children while they attend training.
32
Also, having no long term gains or rewards for training is not considered a very important barrier by the provider groups, contrary to what we might expect given the current status and reward system for child care providers. However, center directors, in comparison to the other provider groups, were more likely to perceive this as an important barrier.
Having no one to watch the children during the child care hours is seen as the most significant barrier to training by all provider groups. The center directors and family child care providers, however, are more likely to indicate this as a very important factor than are the teachers and group providers. This is normal, since directors and family providers are responsible for finding substitutes in their child care settings.
In identifying other barriers to training, we can also examine the reward system attached to training. Providers were asked, “Do you receive any compensation for attending relevant training?” Figure 4 shows the types of compensation received by the center and group child care providers. Few providers receive any type of compensation, i.e., being paid while in training, receiving compensatory time, or being reimbursed for expenses. Center directors appear to fare better than the other provider groups–55.9 percent of them indicate that they are paid while in training. This can be interpreted that they are more likely to attend relevant training during the work hours.
33
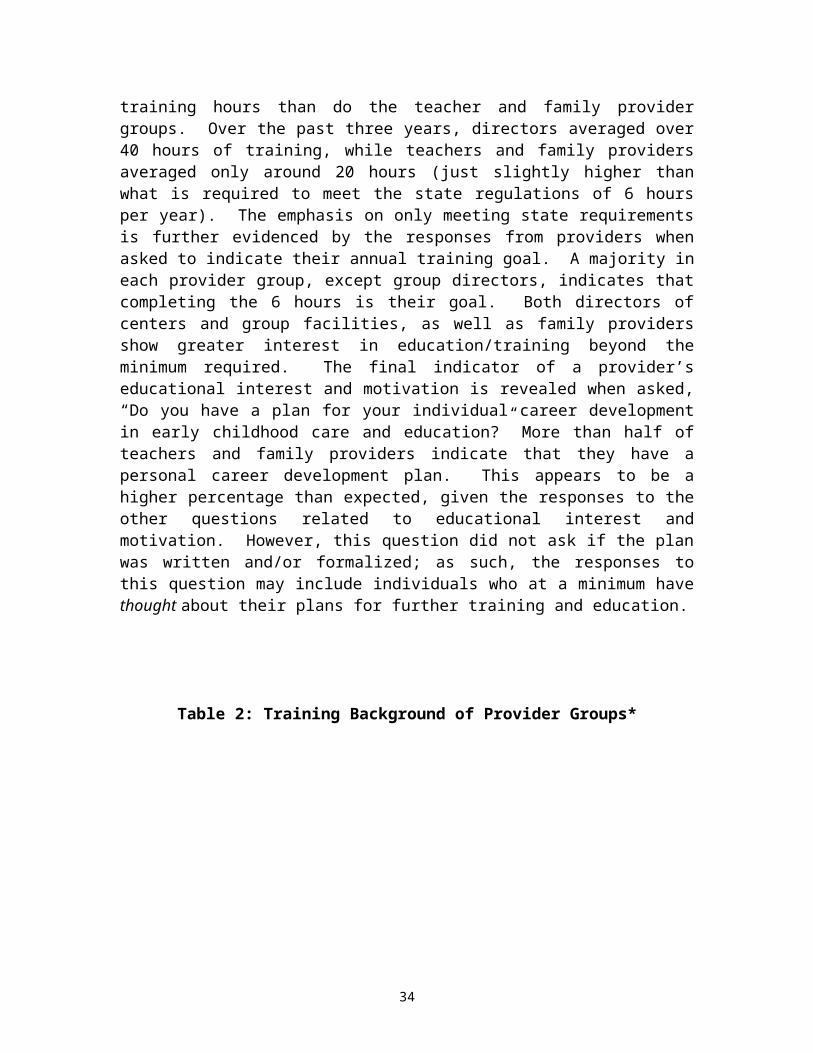
6.3 The Work Environment of Child Care Facilities
The quality of work life is not only an indicator of one type of quality within a child care environment, but as well, it is an important factor that can influence the overall quality of care for young children. As stated previously, we have used Jorde-Bloom's Early Childhood Work Environment Survey (ECWES) to assess a number of dimensions of the work environment within child care centers. The ECWES15 includes measurements of:
Ten dimensions of organizational climate (collegiality, professional growth, supervisor support, clarity, reward system, decision making, goal consensus, task orientation, physical setting, and innovativeness);
The importance that staff assign to each dimension (summary of worker values); The staff's overall commitment to the center; How the current work environment resembles the staff's ideal; The importance of various educational goals and objectives; The degree of influence of the teaching staff regarding various organizational
dimensions.
6.3.1 Organizational Climate
15 ?The analysis in this section only includes child care centers since we used Bloom's instrument only in facilities that had more than three staff, as recommended. There were a total of 60 centers included in the data set, however, due to missing data from some centers, only 55 are included in the analysis presented herein.
34
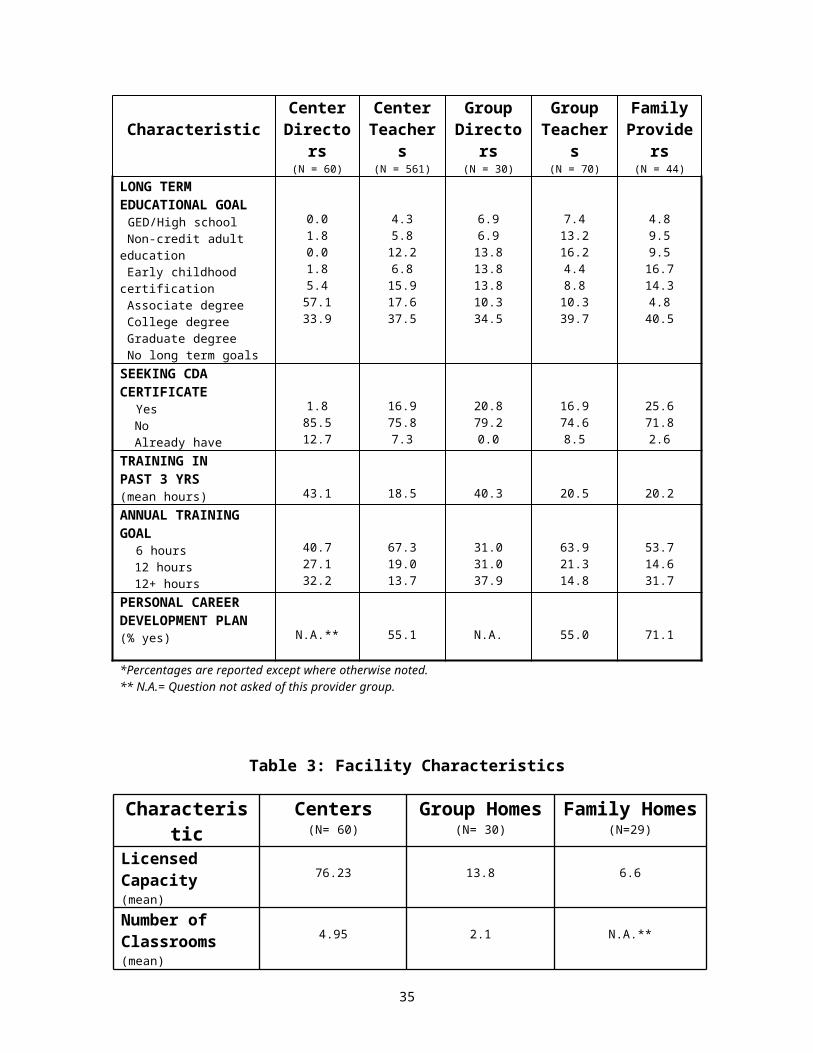
The ten dimensions of organizational climate are shown in Figure 5. In analyzing the scale values, which can range between 0 and 10, we see that the dimension of professional growth ranks at the bottom (3.94), followed by reward system (5.88) and clarity (5.91). This indicates that overall, the staff in centers do not perceive many opportunities for professional growth, they do not feel that pay and fringe benefits are fair and equitably distributed, and they feel that communication about policies and procedures is unclear. These results are similar to national data where professional growth opportunities and reward systems are evaluated poorly by most child care staff (Jorde-Bloom 1996).
It is important to determine what factors, if any, are associated with these ten dimensions of organizational climate. Table 8 provides a summary from an analysis of the relationships between each of the organizational climate dimensions and a series of factors. A number of director characteristics are examined first. In addition, characteristics of teachers (aggregated per site) and overall site characteristics are analyzed. The significant relationships that we find from these analyses are:
35
*Mean value for each dimension of organizational climate on a scale of 0=low and 10=high
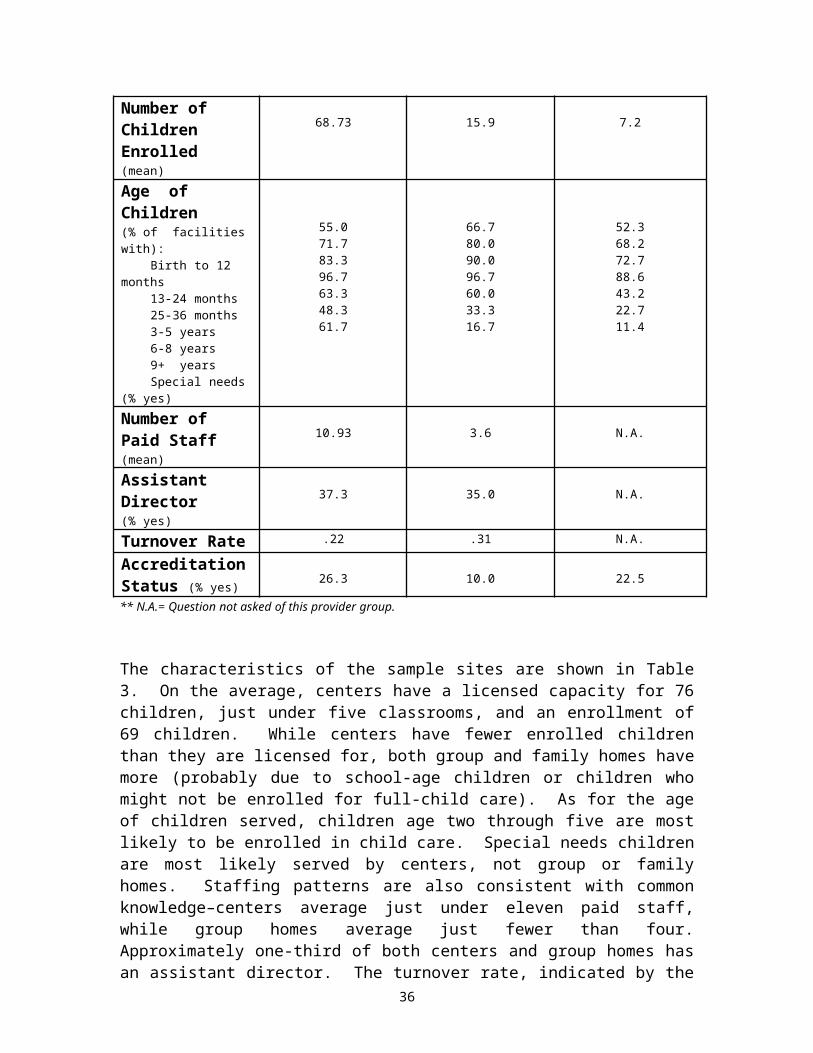
36

Collegiality is higher in centers where: directors have been in their current job longer; teachers are older and have been in their current job longer; site turnover is lower.
Opportunities for professional growth are perceived to be greater in centers where: directors are older, have more years in the field of early childhood education,
have been in their current job longer, and have higher salaries; teachers are older, have more years in the field of early childhood education, have
been in their current job longer, have higher salaries, and have an annual training goal of 12+ hours;
sites are larger (have more classrooms), have lower turnover, and are accredited.
Supervisor support is perceived to be greater in centers where: teachers are older and have been in their current job longer; site turnover is lower.
The clarity of policies and procedures is perceived to be better in centers where: teachers are older, have more years in the field of early childhood education, have
been in their current job longer, and have higher salaries.
The reward system is considered more fair and equitable in centers where: directors are older, have more years in the field of early childhood education, and
they are full-time; teachers are older, have more years in the field of early childhood education,
have been in their current job longer, and have higher salaries; sites are accredited.
The ability of staff to make decisions about those things that affect them (decision making) is perceived to be greater in centers where: teachers are older; site turnover is lower.
The level of goal consensus at a center is greater where: teachers are older and have been in their current job longer; sites have lower turnover and are accredited.
The emphasis on good planning, efficiency, and getting the job done (task orientation) is higher in centers where: directors have more years in the field of early childhood education and have been in
their current job longer; teachers are older, have been in their current job longer, and have higher salaries.
The physical setting is well-arranged, organized, and provides sufficient supplies and equipment in centers where:
37
directors have more years in the field of early childhood education and have been in their current job longer;
teachers are older; sites have lower turnover and are accredited.
The extent to which staff are encouraged to be creative and innovative in their work (innovativeness) is greater in centers where: directors have more years in the field of early childhood education; teachers are older.
Across all of these, the average age of teachers is significantly related to all dimensions of organizational climate. Centers with older workers have a more positive work environment. Correspondingly, two other factors that are closely related to each other (i.e., average number of years in the current position and site turnover) are also significantly related to a number of the dimensions of organizational climate. In addition, a number of these organizational climate dimensions are more positive in centers that have older and more experienced directors. Hence, an older and more stable workforce is closely associated with a positive organizational climate. The causal link between these factors cannot be determined from this analysis, but it is plausible that there is a reciprocal effect–a positive organizational climate results in a more stable workforce and vice-versa.
6.3.2 Summary of Worker Values
The previous analysis of organizational climate gives us a picture of how child care centers fare on each of these dimensions. We see that opportunities for professional growth are particularly poor while at the other end of the continuum, the physical setting is viewed very positively by workers. These perceptions, however, are tempered by the degree to which child care workers value these aspects of their work environment.
Figure 6 gives us an indication as to the overall value placed on each of the 10 dimensions of organizational climate. Center staff identified the three most important aspects of their work from the list of organizational climate dimensions. The most highly valued aspect is collegiality and co-worker relations–over 60 percent of the child care center staff identify this as one of the three most important aspects of their work. The reward system–fairness in pay and benefits–is second most important (48.2 percent) and supervisor support is third (40.9 percent) most important. The dimension of opportunities for professional growth comes in fourth with 30.5 percent of the caregivers identifying it as important. Therefore, even though staff do not perceive many opportunities for professional growth, this aspect is not as highly valued as other areas. Those areas least valued are goal consensus (13.5 percent), clarity (15.2 percent), and innovativeness (20.5 percent).
How these organizational climate dimensions are rated compared to the value placed on them gives us an indication where to focus improvement efforts. Improvement in the reward system will probably accrue the most lasting results since it is very poorly rated, yet highly valued. Improving opportunities for professional growth is also an area where attention should be focused since it is the most poorly rated area and it ranked fourth
38

in importance. On the other hand, collegiality is very important to workers, but given its positive assessment as a dimension of organizational climate, there is no need to improve it.
y of How Current Work Environment Resembles Ideal
6.3.3 Summary of How Current Work Environment Resembles Ideal
As a way of understanding the discrepancy between ideal and real work conditions, child care workers were asked, "If you could design the ideal job, how close would your present position resemble this ideal position with respect to the following?" Responses range between not at all like my ideal to is my ideal. Based on this assessment, we see in Figure 7 that the greatest discrepancy is in the reward system. There is a wide gap between what child care workers are paid versus what they think they should be paid. Given their current low salaries, this is an accurate appraisal on their part. The autonomy of staff to make decisions or express their opinions on important issues is another area where child care staff feel that their work environments least resemble their ideal.
The smallest gap between the ideal environment and the real one experienced by child care workers is in the areas of collegiality and supervisor support. As far as opportunities for professional growth, the discrepancy between the ideal and the real falls mid-range on the continuum.
39
* Percent of center staff (averaged across sites) that identify each dimension of organizational climate as important.

6.3.4 The Importance of Educational Goals and Objectives
Early childhood programs can have a number of educational goals and objectives–but the priority given to each can vary across programs. Figure 8 shows how these educational goals and objectives are ranked in Pennsylvania child care centers. Consistent with developmentally appropriate practice in the early childhood field, the greatest emphasis is placed on helping children to develop positive self concepts and self esteem while the least emphasis is placed on helping children develop concepts needed for reading and math.
6.3.5 Degree of Influence of Teaching Staff Regarding Organizational Decisions40
*Mean value for center staff on a scale of 1=not like my ideal to 5=like my ideal when asked “If you could design the ideal job, how close would your present position resemble your ideal work environment with respect to the following?”

The perceptions of workers regarding the degree of influence of the teaching staff with respect to the various organizational decisions provides a fuller understanding of the decision making dimension of organizational climate. Staff were asked how much influence they have (very little to considerable influence) in ordering materials and supplies, interviewing and hiring staff, determining program objectives, training new aides or teachers, and planning daily activities. In Figure 9 we see the difference between what directors perceive is the degree of influence versus what teachers perceive is their degree of influence. Not unexpectedly, teachers do not perceive that they have as much influence as what directors say they do. This discrepancy also points to an area where improvement efforts can be focused.
6.3.6 Overall Commitment
All of the characteristics that have been discussed provide an understanding of specific areas where attention can be paid in intervention efforts to improve child care work environments. The commitment scale provides a summary of the overall commitment of child care staff to their centers. Individuals who feel deeply committed to their jobs tend to put extra effort into their work and take pride in their centers. In such environments, turnover is generally lower. Commitment among Pennsylvania child care staff is relatively high. In Figure 10 we see that directors have a slightly higher level than teachers–8.6 for directors compared to 7.5 for teaching staff. Together this gives us an overall value of 7.6 for child care centers.
6.4 Quality of Care
41
*Mean value on a scale of 0=very little influence to 10=considerable influence when asked, “How much influence does teaching staff currently have in each of the following areas below:
a) ordering materials/suppliesb) interviewing/hiring new staffc) determining program objectivesd) training new aides/teacherse) planning daily schedule of activities.”
*Mean value on a scale of 1=not committed to 10=highly committed

6.4.1 Quality of Care as Assessed through the Environment Rating Scales
Section 5.2.2 discusses the results from our observations of child care sites and the scale values for each individual item on the FDCRS, ITERS, and ECERS. That discussion focuses on these data as a means to assess training needs. Our focus now shifts to the question about overall quality of training and its changes over the years. In this section we report the 1996 results on the ITERS, ECERS, and FDCRS (see Figure 12) and compare them to the ECERS and FDCRS results obtained in Pennsylvania in 1989 (Fiene and Melnick 1991) and in 1984 (Kontos and Fiene 1987).
Comparatively, in 1996, the ECERS average score is 4.63 while in 1989 it is 4.27. The average score in 1984 is 3.78. This shows improvement over the years. Although there is not a statistically significant improvement in the overall ECERS scores from 1989 to 1996, when we examine the individual subscales, there are some areas that improved significantly (see Figure 11). On individual subscales these three areas show significant improvement: social development, adult needs, and fine/gross motor. The specific subscale values for both 1996 and 1989 are:
ECERS Scores Subscales 1989 1996 SignificanceSocial development 3.46 4.20 p .05Creative activities 4.54 4.46 nsFurnishings/display 4.23 4.57 nsPersonal care routines 4.54 4.59 nsAdult needs 4.36 4.80 p .05Language/reasoning 4.43 4.82 nsFine/gross motor 4.54 5.11 p .05Total ECERS 4.27 4.63 ns
42

43

An analysis of the FDCRS scores shows a marked improvement from 1989 (see Figure 13). Comparing the 1996 data with that from the 1989 study, we see higher mean scores for each of the subscales in the FDCRS:
FDCRS ScoresSubscales 1989 1996 SignificanceSpace and furnishings 3.50 4.10 p < .05Learning activities 3.71 4.12 p < .05Language and reasoning 4.06 4.54 p < .05Social development 3.81 4.72 p < .01Basic care 3.65 4.84 p < .01Adult needs 4.35 5.17 p < .05Total FDCRS 3.80 4.47 p < .05
There are several observations that can be made in comparing the 1996 with the 1989 and the 1984 data sets. Overall, program quality scores on the ECERS and FDCRS have improved over the 12-year time frame. The bad news is that the quality scores, on the average, are still at the mediocre level on the ECERS and FDCRS. The ITERS is even worse and is a major concern. There are no comparable data for the ITERS from the 1989 or 1984 research studies. Overall, Pennsylvania child care has improved, but it is still not in the good or excellent range. National and international data from research studies are very similar with ranges from 3.70 for family child care homes with little training to 5.22 for child care centers that are accredited (Phillips 1987).
What are some reasons for the improvements? Two major interventions occurred during this 12-year time period. Both of them occurred at approximately around the same time so it is difficult to determine the contribution of each to the overall improvement in quality. In 1992 new child care regulations were promulgated; as well, the new comprehensive PA CC/ECD Training System was implemented. The new regulations were an improvement over the existing set of regulations, but the regulations deal with basic health and safety
44
issues and although this will contribute to overall quality, it will not be a major contributor (Fiene and Melnick 1991). What has been and continues to be a major contributor is the training system that has been implemented. When data are compared from the ECERS and FDCRS, the family child care homes improved significantly more than the child care centers. The home-based training system has been in place for twice as long as the center-based system. This is a very encouraging result.
6.4.2 Factors Associated with the Quality of Child Care
The analysis in section 5.4.1 presents an overall picture of the quality of child care in Pennsylvania and the progress made in improving quality. The analysis presented in this section examines the current data to determine what factors are significantly related to the quality of care.16 This analysis will be presented separately for each of the three environment rating scales.17
Table 9 provides a summary of the results of a series of bivariate correlations between the measure of quality (i.e., either the FDCRS, ITERS, or ECERS average score) and a set of factors hypothesized to be related to quality (e.g., caregiver background characteristics, training experience, and assessment of organizational climate; for family providers, in lieu of organizational climate, an indicator of their connectedness to a child care network is used).
The bivariate analysis of the FDCRS finds four factors that are significantly correlated with the quality of family child care. Family caregivers that are younger and have higher long-term educational goals are more likely to provide a higher quality of care. The other factors are measures of a family provider’s assessment of the current training system. Providers who evaluate the current system of training as inappropriate to their skill level and not useful for their work as a family caregiver are more likely to provide a higher quality of care. This is not as unexpected as it sounds. It is likely that those providers who are already providing quality care do not find as much benefit from the current training system that focuses most of its attention on entry level skills. In an attempt to further analyze this unusual finding, we examined the relationship between hours of training and the evaluation of training by providers. We see that providers who have more hours of training are also more likely to rate the current system positively in terms of goal achievement, appropriate skill level, and usefulness. 18
Table 9: Factors Associated with Quality of Care
Factor FDCRS ITERS ECERS
16 Part of this analysis will be based on a data set that has matched the environment rating scales with the child care providers that were observed. This data set establishes the most direct link between an indicator of quality and the set of factors that might be associated with it (e.g., the background characteristics of the caregiver, the level of training of the caregiver, and the caregiver’s assessment of organizational climate). Other parts of this analysis will be based on a site level data set where aggregate values for most of the variables have been created to represent the site, overall. 17 Where necessary, data have been weighted to adjust for the different probabilities of sample selection (i.e., the FDCRS included both family and group homes while the ECERS included both centers and group homes, necessitating that these analyses be based on weighted data).18 The correlation coefficients are: training hours/year and goal achievement ( = -.24, p .07); appropriate skill level ( = -.28, p .03); and usefulness ( = -.45, p .000). These coefficients are negative since a lower value on each of the evaluative factors indicates a more positive assessment.
45

(N=67) (N=36) (N=57)Caregiver Background Age Educational level Years in field Salary Long term educational goal
-.30** .003 -.20 .19
.27*
.13 .14 .25
.43** .07
.05 .11 .04
.36** -.09
Training Characteristics Annual educational goal Training hours per year CDA status Training helpful in work Evaluation of training system: a. appropriateness b. goal achievement c. usefulness d. applicability
.12 -.03 .05 .08
.29** .11
.28** -.02
.19 .02
.005 -.16
-.01.07 .08-.16
.14 -.09 .03 -.03
.03 -.10 -.05 -.08
Organizational Climate Overall commitment Collegiality Professional growth Supervisor support Clarity Reward system Decision making Goal consensus Task orientation Physical setting Innovativeness
N.A. .01 -.31 .15 -.29 .06 -.27 -.24 -.18 .05 .20 -.07
.14 -.005
.41** .22
.32* .29*
.17 .32* .30*
.21 .23
Connectedness (Family Child Care Only) -.10
N.A. N.A.
This is the weighted N since there were observations made in more than one type of child care (i.e., family, group, or center). N.A.= Not applicable * p .05 ** p . 01
46
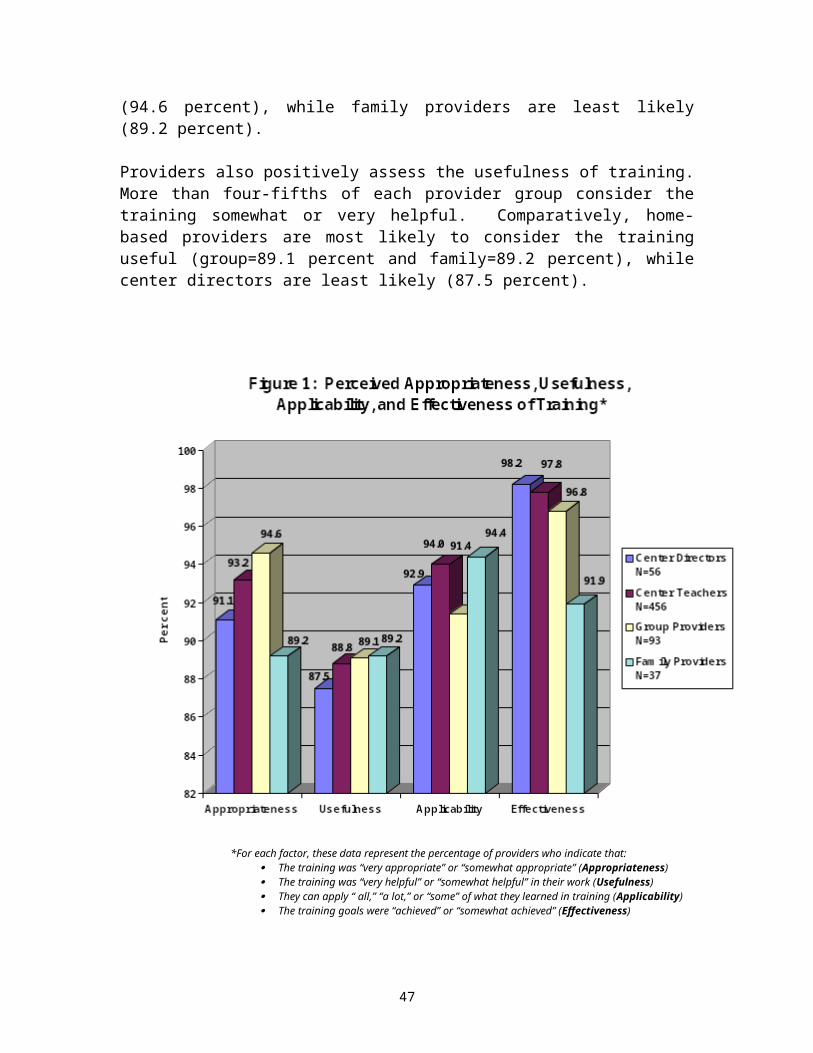
Our bivariate analysis of the ITERS finds only salary level of the caregiver to be significantly related to the quality of infant/toddler care. Caregivers with higher salaries provide higher quality infant/toddler care. The bivariate analysis of the ECERS reveals a number of factors that are significantly correlated with the quality of child care: salary and the organizational climate factors of professional growth, clarity, reward system, goal consensus, and task orientation. Thus, the caregivers that provide high quality early childhood care are more likely to:
have higher salaries; indicate that their center has opportunities for professional growth; feel that communication at their center is good and that work schedules, job
descriptions, and rules are clear and well-defined; indicate that the pay and fringe benefits are fair and equitably distributed in
their center; indicate that staff at their center agree on school philosophy, are united in
their approach, and are committed to program goals and objectives; believe that they work hard but still have time to relax, that program
procedures are efficient, and that meetings are productive.
In an analysis of the site level data set, we created an overall quality of care variable as an indicator of child care quality.19 In a multivariate analysis of these data, we then determined what site level factors significantly contribute to the variance in quality of care at the site level. Initially, we did not include any of the work environment variables (Bloom items) since that would result in excluding all home-based providers from the analysis. Our analysis reveals that size and turnover are significant factors and they explain 19 percent of the variance in quality of care.20 Thus, the sites with more classrooms and lower turnover have higher quality of care.
When we add the Bloom items on organizational climate (thereby eliminating all home-based providers from the analysis), we find that only opportunities for professional growth independently contributes to the variation of quality of care at child care sites (the majority of which are centers). Forty (40) percent of the variation is explained by this factor.21 As we hypothesize, child care facilities that have more opportunities for professional growth have a higher overall quality of care.
19 If there were two classrooms observed, the new overall quality measure was an average of the two scores (regardless of the type of classroom observed). If only one classroom was observed, then that score became of the site’s overall quality score. 20 The results from the regression analysis are: class number ( = .11, p .0053) and turnover ( = -1.08, p .0216). 21 The results from the regression analysis are: professional growth ( = .45, p .0000).
47

7.0 CONCLUSIONS AND POLICY IMPLICATIONS
What can we conclude as a result of this research and what are the implications for public policy? There are numerous issues addressed and volumes of data analyzed. First we can examine the overall conclusions with regard to the current training system–how it is evaluated and what the training needs are.
Overall, the training system is viewed positively by the provider groups, as evidenced by their response to questions about appropriateness, usefulness, applicability, and effectiveness in achieving learning objectives. Furthermore, providers express a high level of interest in the training and, for the most part, feel that additional training will help them in their work. When directors of centers and home-based providers are asked about the particular methods of training that they perceive to be most helpful to them and their staff, the training methods that provide direct contact with a trainer (e.g., on-site training and workshops) are viewed most helpful. The methods where the contact is indirect (e.g., video and satellite training) are viewed as least helpful. This is understandable, although the policy implications of this are not to abandon some of the more indirect, yet very cost effective methods of training like the learn-at-home videos and satellite training. A balance of methods is important in a system as massive as this one, where the ability to access training varies tremendously across providers and where resources are limited.
Regarding training needs, there is a high degree of consistency across provider groups in terms of the areas they perceive as most critical. They identify supervision/discipline of children, social development (dealing with conflict), child development, and developmentally appropriate practice as areas with the highest priority. Although, the providers do not identify any topic area as not a priority for training.
On the other hand, if we use the environment rating scales as an indicator where there are weaknesses in child care settings (hence, an area in need of training), we see a slightly different picture. Given the overall low score for the infant/toddler area (ITERS), any training in this area can be viewed as a priority. In addition, these items are consistently ranked low on all three environment rating scales: cultural awareness, personal grooming, dramatic (pretend) play, and sand and water play; furthermore, these areas are rated low in two out of the three environment rating scales: displays for children (FDCRS and ITERS), space alone (FDCRS and ECERS), helping infants/toddlers understand language (FDCRS and ITERS), art (ITERS and ECERS), and blocks (FDCRS and ITERS). Indeed, a number of these items from the environment rating scales fall under the broader categories of social development, child development, and developmentally appropriate practice. The information from the environment rating scales offers more specific areas of need.
One particularly interesting finding is the contradictory information related to the area of supervision/discipline of children. While providers identify this as a high priority area for training, the environment rating scales indicate an assessment in the good range for the discipline item. Again, this shows that providers are performing better in this area
48
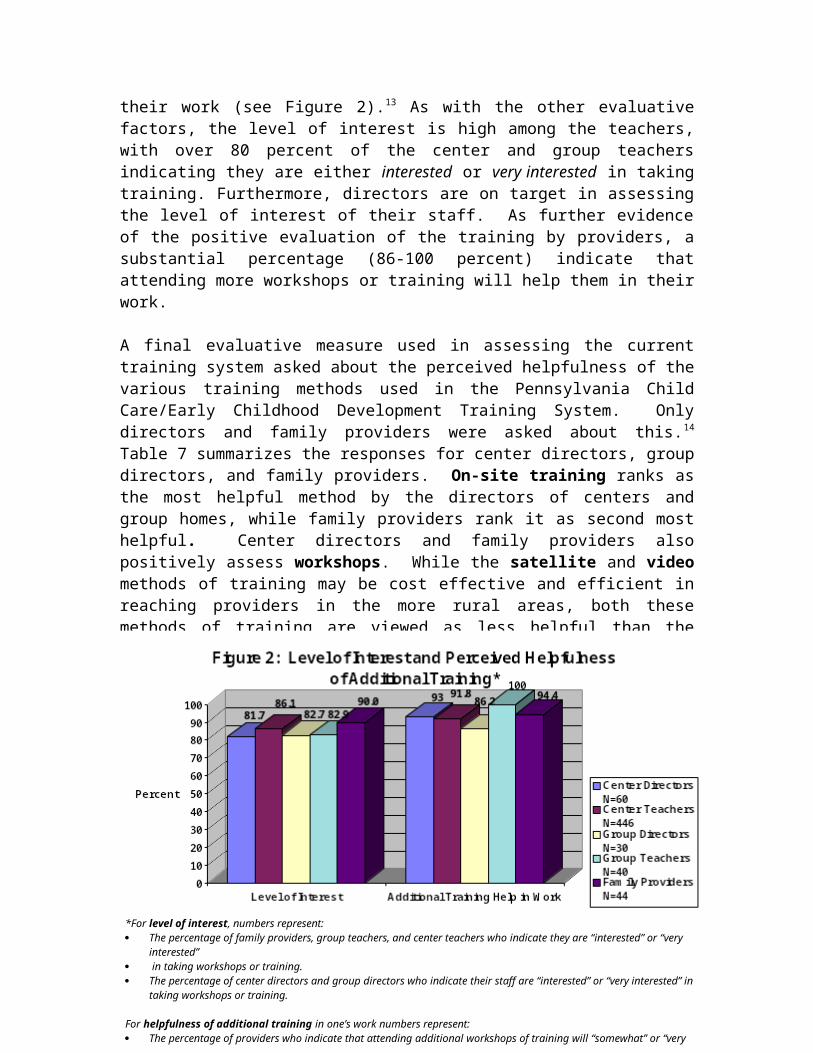
than they think and it reveals the extent to which this is viewed as one of the most challenging areas in child care.
Turning now to the issue of quality of care and the factors that are associated with it, we find that our results that examine the relationship between the level of training at a site and quality of care are not as predicted. We do not find that the number of hours of training is a significant predictor of quality. What we do see, however, is that the most significant change in the quality of care since 1989 has occurred in family child care sites. Although we are unable to definitively conclude that the training system has been instrumental in improving quality of care in family homes, we do note that the home-based training system has been in existence the longest–for 10 years. Furthermore, the intervention effort (i.e., the hours of training per year that staff at a site average), is still considerably low–on the average it is 8.5 hours, with 98 percent of the sample sites having fewer than 18 hours per year, on the average. A threshold for training to show some impact is around 18 hours according to other research (Howes, Smith & Galinsky 1995). Given this, it is not unexpected that we do not find a significant relationship between number of hours of training and quality of care–there simply is not enough intervention (i.e., training hours) to determine impact.22 What does this mean for public policy? A policy implication of this concerns the number of hours of training that are mandated in the state regulations for child care. It points to the need to increase the number of hours of training for child care providers if a significant impact of the training is to be detected.
This is further supported when we see the strong association between the organizational climate dimension of opportunities for professional growth and overall quality of care at the site level. Centers where staff report more opportunities for professional growth have a higher quality of care and this factor, alone, explains a considerable portion of the variation in quality (40 percent). This finding substantiates the importance of fostering professional growth opportunities for child care providers. But it also implies the importance of making sure that these opportunities are linked to a model of career development and progression–not just a few hours of training that providers haphazardly take because they have to or because they are offered at a time that fits their schedule.
Overall, these data have given us some solid evidence to guide the development of the training system in Pennsylvania. We have highlighted some very specific areas where there is a need for training and we have shown the clear association between opportunities for professional growth and the quality of care. Although there are some anomalies in the data and some unexpected findings, as a whole, these data are supportive of the efforts to implement a training system, one that fosters career development, in the prediction that these efforts will improve the quality of care for children in Pennsylvania.
22 There may also be measurement problems related to the quantity of training variable. Issues related to recall on the part of the provider and definitions of what constitutes training may vary–both of which can affect the reliability and validity of the reported hours of training.
49

REFERENCES
Bronfrenbrenner, U. (1979). The ecology of human development. Cambridge, MA: Harvard University Press.
Bredekamp, S. and Willer, B. (1994). “Introduction” in J. Johnson and J. McCracken (eds.), The early childhood career lattice: Perspectives on professional development. Washington, D.C.: National Association for the Education of Young Children.
Caffarella, R. (1994). Planning programs for adult learners: A practical guide for educators, trainers, and staff developers. San Francisco, CA: Jossey-Bass.
Children’s Defense Fund (1998). The state of America’s children. Washington, D.C.: Author.
Children’s Defense Fund (1994). The state of America’s children. Washington, D.C.: Author.
Chung, A., and Stoney, L. (1997). Using research to improve child care for low-income families. Washington, D.C.: Child Care Bureau, Administration for Children, Youth and Families, Department of Health and Human Services.
Fiene, R. (1995). “Utilizing a statewide training system to improve child day care quality.” Child Welfare 74(6):1189-1201.
Fiene, R. and Melnick, S. (1991). “Quality assessment of early childhood program: A multi dimensional approach.” Paper presented at the annual meeting of the American Educational Research Association, Chicago, Illinois.
Galinsky, E., Howes, C., Kontos, S., and Shinn, M. (1994). The study of children in family child care and relative care: Highlights of findings. New York, NY: Families and Work Institute.
Helburn, Culkin, Howes, Bryant, Clifford, Cryer, Peisner-Feinberg, and Kagan (1995). Cost, quality, and child outcomes in child care centers. Denver, CO: Center for Research in Economics and Social Policy, Department of Economics, University of Colorado.
Johnson, J. (1994). Child care training and developmentally appropriate beliefs and practices of child care employees in Pennsylvania. Harrisburg, PA: Center for Schools and Communities.
Jones, E. (ed.) (1993). Growing teachers: Partnerships in staff development. Washington, D.C.: National Association for the Education of Young Children.
Jorde-Bloom, P. (1988). “Assess the climate of your center: Use the early childhood work environment survey.” Day Care and Early Education , Summer , 1988:9-11.
50
Katz, L. (Nov. 1994). “Perspectives on the quality of early childhood programs. Phi Delta Kappan.
Kontos, S. and R. Fiene (1987). “Child care quality, compliance with regulations, and children's development: The Pennsylvania study,” in Phillips (ed.) Quality in child care: what does research tell us? Washington, D.C.: National Association for the Education of Young Children.
Lewin, K. (1935). A dynamic theory of personality: Selected paper. New York: McGraw-Hill.
Love, J., Schochet, P., and Meckstroth, A. (1996). Are they in any real danger? What research does—and doesn’t—tell us about child care quality and children’s well being. Princeton, NJ: Mathematica Policy Research, Inc.
McAllister, J. (1997). “The Children’s Crusade.” Time, August 25, 1997:36.
Morgan, G., Azer, S., Costley, J., Elliott, K., Genser, A., Goodman, I., and McGimsey, B. (1994). “Future pursuits: Building early care and education careers” in J. Johnson and J. McCracken (eds.), The early childhood career lattice: Perspectives on professional development. Washington, D.C.: National Association for the Education of Young Children.
Morgan, G., Costley, J.B., Genser, A., Goodman, I.F., Lombardi, J., and McGimsey, B. (1993). Making a career of it: The states of the states report on career development in early care and education. Boston: The Center for Career Development in Early Care and Education, Wheelock College.
Phillips, D.A. (1987). Quality in child care: What does research tell us? Washington, D.C.: National Association for the Education of Young Children.
Phillips, D.A., Howes, C., and Whiltebook, M. (1992). “The social policy context of child care: Effect on quality.” American Journal of Community Psychology, 20, 25-51.
Stoney, L., Elliott, K., Chung, A., Genser, A., & Raggozzine, D. (1997). Common Threads: Weaving a Training and Career Development System for 21st Century Pennsylvania. Boston, Massachusetts: The Center for Career Development in Early Care and Education, Wheelock College.
U.S. Department of Education (1990). A profile of child care settings: Early Education and care in 1990. A final report by Mathematica Policy Research. Washington, D.C.: author.
VanderVen, K. (1994). “Professional development: A contextual model” in J. Johnson and J. McCracken (eds.), The early childhood career lattice: Perspectives on professional development. Washington, D.C.: National Association for the Education of Young Children.
51

Willer, B. (1994). “A conceptual framework for early childhood professional development” in J. Johnson and J. McCracken (eds.), The early childhood career lattice: Perspectives on professional development. Washington, D.C.: National Association for the Education of Young Children.
52