5. Strategic Summary Report FINAL
31
Waste and recycling in Victoria Strategic summary report 2019–20 Report by: Sustainability Victoria November 2021
Transcript of 5. Strategic Summary Report FINAL

Waste and recycling in Victoria
Strategic summary report
2019–20
Report by: Sustainability Victoria
November 2021
2 Sustainability Victoria
Authorised and published by
Sustainability Victoria
Level 28, Urban Workshop
50 Lonsdale Street Melbourne
Victoria 3000 Australia
Waste and recycling in Victoria – Strategic summary report,
2019–20
© Sustainability Victoria 2021
November 2021
Accessibility
This document is available in PDF and Word format on the
internet at sustainability.vic.gov.au
While reasonable efforts have been made to ensure that the
contents of this publication are factually correct,
Sustainability Victoria gives no warranty regarding its
accuracy, completeness, currency or suitability for any
particular purpose and to the extent permitted by law, does
not accept any liability for loss or damages incurred as a
result of reliance placed upon the content of this publication.
This publication is provided on the basis that all persons
accessing it undertake responsibility for assessing the
relevance and accuracy of its content.
This report should be attributed to Sustainability Victoria.
This report is licensed under a Creative Commons
Attribution 4.0 International licence.
In essence, you are free to copy, distribute and adapt the
work, as long as you attribute the work and abide by the
other licence terms.
Go to http://creativecommons.org/licenses/by/4.0/ to view a
copy of this licence.
Data graphics were designed and developed with Little
Sketches as part of an SV funded data storytelling residency
Sustainability Victoria acknowledges Aboriginal and Torres Strait Islander people as the Traditional Custodians of
the land and acknowledges and pays respect to their Elders, past and present.
Waste and recycling in Victoria – Strategic summary report 3
Contents
Minister’s foreword 4
Waste management in Victoria, 2019–20 5
1 Introduction 7
2 Hazardous wastes 8
3 The Victorian sector is building resilience to local disruptions and change 10
3.1 SKM site closures and material storage 10
3.2 Waste management during COVID-19 pandemic 11
3.3 Policy changes impact material flows 12
4 Global shifts in manufacturing supply chains are changing the sector in Victoria 14
4.1 Material flow changes in local and export reprocessing 14
4.2 Commodity values in export markets 15
4.3 New reprocessing capacity to keep materials local 16
4.4 Innovation creating new local markets 17
4.5 Victorian Recycling Infrastructure Plan 17
5 SV is tracking Victoria’s performance towards a circular economy and against
Recycling Victoria’s targets 18
5.1 Measuring Victoria’s progress towards a circular economy 18
5.2 Performance against Recycling Victoria’s waste targets 18
6 Methods of collecting waste and resource recovery data in Victoria are improving 21
6.1 Method – Victorian Recycling Industry Annual Survey (VRIAS) 21
6.2 Method – Victorian Local Government Annual Waste Services Survey (VLGAWS) 22
6.3 What is the Victorian Government doing to improve our data? 23
7 References 24
8 Glossary 26
4 Sustainability Victoria
Minister’s foreword
Managing Victoria’s waste
The Waste and Recycling in Victoria Strategic summary report shows how our waste in
2019–20 was managed, recovered, and reprocessed to produce recycled materials and
products.
The Victorian Government has invested more than $515 million to deliver the biggest
reform and transformation of the waste and recycling system in our state’s history. This
includes $380 million to deliver Recycling Victoria, which outlines four key targets that we
remain on track to meet. These targets include:
» Diverting 80% of our waste from landfill by 2030
» Cutting total waste generation by 15% per capita by 2030
» Halving the volume of organics going to landfill between 2020 and 2030, and
» Ensuring every Victorian household has access to food and garden organic waste
recycling services or local composting by 2030.
Recycling Victoria is transforming our recycling sector, reducing waste, creating jobs and
setting Victoria up for a more sustainable future.
Already Recycling Victoria initiatives are enabling more local material recovery and
processing in Victoria. Within the year, a record amount of materials were diverted from
landfill and processed locally. A total of 11.05 million tonnes was recovered, and the state
was able to reprocess 91 per cent of these resources locally. By reprocessing these
materials at home, we are able to grow the local industry, create jobs and drive innovation
and new technologies while reducing our reliance on export markets.
With Victorian residents at home more often during 2019-20 period, local councils collected
more kerbside garbage, recyclables, and organics than ever before - 2.4 million tonnes.
This includes 0.57 million tonnes of organics. Collecting this record amount of organics was
possible thanks to a doubling of Victorian households provided with a kerbside food and
garden organic waste collection service in the 2019-20 period (from 13% to 26%), or
provided access to a council managed drop-off service.
Collecting organics separately from other waste can help us to reduce greenhouse gas
emissions, convert more of them to compost and allows us to use them as an alternative
energy source.
We are continuing to support local councils in their roll-out of new bin systems, with more
than a third of Victorian local governments now employing a 3-bin system to better dispose
of waste. We’re on track to make sure all Victorian households will have access to a 4-bin
system by 2030 where every household will have access to a glass bin collection service
and a food and garden organics collection service.
We continue to roll out plans as part of Recycling Victoria, engaging in new efforts to reuse,
repair and recycle – paving the way for increased investments in recycling projects and new
jobs.
Read more: vic.gov.au/transforming-recycling-victoria
The Hon. Lily D’Ambrosio MP
MP Minister for Energy, Environment and Climate Change
Minister for Solar Homes

Waste and recycling in Victoria – Strategic summary report 5
Waste management in Victoria, 2019–20

6 Sustainability Victoria
Kerbside waste in Victoria, 2019–20
Waste and recycling in Victoria – Strategic summary report 7
This Waste and Recycling in Victoria – Strategic Summary Report 2019–20 (SSR) is a
strategic report exploring the key insights of the Waste and Recycling in Victoria – Recycling
Industry Waste Report 2019–20 (RIWR) and the Waste and Recycling in Victoria – Local
Government Waste Services Report 2019–20 (LGWSR) in relation to broader sector
insights from a range of sources in order to provide a more comprehensive view of waste
management in Victoria. These sources include:
» Environment Protection Authority (EPA) Victoria data on quantities of:
– waste sent to landfill
– prescribed industrial waste (PIW), largely translated as ‘reportable priority waste’ from
1 July 2021 and includes wastes with hazarduous properties recorded via waste
transport certificates
» Australian Bureau of Statistics (ABS) commodity export data
» Australian Plastics Recycling Survey data on plastics consumption and recovery
» Recovered Resources Market Bulletin information on resource recovery markets
» government action plans, policies and programs
» general articles and papers on sector development.
This is the first time that Sustainability Victoria (SV) has released this strategic summary
report alongside these annual reports. The strategic summary report has been written to
deliver further insightful and accessible information that goes beyond the survey data and
delves into key developments in the waste and resource recovery sector for 2019–20. This
includes a chapter on the management of PIW (also known as hazardous waste) as well as
a chapter on measurements against the four key targets in the Victorian Government’s
Recycling Victoria: A New Economy policy released in 2020. For data and detailed specific
information for either the LGWSR or the RIWR please refer to the individual reports as well
as the data in the Waste and Recycling in Victoria – Recycling Industry Waste Workbook
2019–20 and the Waste and Recycling in Victoria – Local Government Waste Services
Workbook 2019–20. The workbooks provide public access to the underlying data and
include historically available figures. All reports and workbooks are available on the SV
website (sustainability.vic.gov.au).
1 Introduction

8 Sustainability Victoria
Hazardous wastes, a subset of reportable priority wastes where the most stringent duties
apply, come from commercial, industrial, construction, demolition and remediation activities
and have intrinsic characteristics that if not managed correctly could pose a significant risk
to public health, our communities and the environment. These wastes were previously
regulated under the Environment Protection (Industrial Waste Resource) Regulations 2009
as PIW. From 1 July 2021, the Environment Protection Regulations 2021 came into effect.
Under these regulations, PIW will now be regulated as reportable priority wastes.
The main source of data on hazardous wastes in Victoria comes from the Victorian EPA
waste tracking system. Each leg of a journey that a waste takes from a generating facility
requires a waste transport certificate (WTC), for example from a producer to a treatment
facility or from one management facility to another. Wastes that have generated a WTC are
termed as arisings, as they have ‘arisen’ into the system to be managed by infrastructure.
This is distinct from waste generation, as the management pathway for a waste stream may
involve several different treatments or management steps, each with their own distinct WTC.
Therefore hazarduous waste materials may be counted multiple times through WTCs.
An improved digital waste tracking system was developed by EPA Victoria and came into
effect under the Environment Protection Act 2017 (EP Act) on 1 July 2021.
In 2019–20, noting the potential for and efforts to avoid any double counting given the
generation of WTC at all management steps, approximately 1.72 million tonnes of
hazardous waste arisings were managed in Victoria (SV, 2020). This consisted of over 30
different types of hazardous wastes. As shown in Figure 1, seven waste types made up
89.8% of arisings. Additional information on the associated waste codes and descriptions of
these waste types is provided in Table 1. For a full list of waste types see EPA Victoria
publication 1967.2.
Figure 1: Hazarduous waste arisings in Victoria, 2019–20
* Other includes wastes such as clinical and pharmaceutical wastes, non-toxic salts, mercury
and zinc compounds
2 Hazardous wastes

Waste and recycling in Victoria – Strategic summary report 9
Table 1: Hazardous waste types, codes and descriptions
Strict controls regulate the movement and management of hazardous wastes to ensure the
protection of public health and the environment. These controls dictate how hazardous
wastes can be transported, the treatment required to enable reuse and what they can be
reused for, and for many wastes, the treatment required before they can be disposed of to
landfill.
Of the roughly 1.72 million tonnes of arisings managed in Victoria, approximately
0.19 million tonnes (11.2 per cent) was recovered, 0.09 million tonnes (5.5 per cent)
exported interstate for management and 1.43 million tonnes (83.3 per cent) safely disposed
of in Victoria after treatment (Figure 2).
Figure 2: Management and fate of hazardous waste arisings in Victoria, 2019–20
Waste type Waste code Waste description
Contaminated soils N codes Cat A, B & C contaminated soils
Abestos N220 Abestos-containing material
Grease trap K110 (K120) Grease trap wastes
Industrial washwaters L codes Industrial and vehicle washwaters
Waste oil / water J120 Waste oil / water mixtures
Putrescible Other K Putrescible / organic waste
Paints, resins, inks F codes Paints, resins, inks, organics sludge
Other Remaining
waste codes
Clinical and pharmaceutical wastes, non-
toxic salts, mercury and zinc compounds

10 Sustainability Victoria
In 2019–20, the waste and resource recovery sector experienced several disruptions
impacting on material flow and quantities recovered. In October 2019, major material
recovery facility operator SKM (a kerbside recycling sorter) went into liquidation,
immediately impacting the ability for 35 of Victoria’s 79 councils to sort their kerbside
recyclable collections. In March 2020, the sector had to adapt to changed operational
requirements and consumer disposal patterns associated with the Victorian Government’s
response to the COVID-19 pandemic. Despite 2019–20 being burdened with many unusual
situations, Victoria has managed to recover more material for reprocessing than any
previous period.
3.1 SKM site closures and material storage
In early 2019, EPA Victoria issued SKM with notices to stop accepting recyclable waste
materials at its Laverton North and Coolaroo sites. EPA Victoria issued these notices in
response to SKM’s large stockpiles of combustible recyclable material at these sites. In
October 2019, SKM was placed into liquidation (McMillan and Vedelago, 2019) and closed
permanently. As a result, 35 of the 79 Victorian local governments that had sorting contracts
with SKM sent recyclables directly to landfill until December 2019, impacting up to 3 months
of this 2019–20 reference period. From October 2019 onwards the facilities previously
owned and operated by SKM were purchased by Cleanaway Waste Management (Inside
Waste, 2019) and were re-operational by December 2019. The widespread practice of
councils sending kerbside collected recyclables directly to landfill ended from January 2020
onwards.
The impact of these actions is apparent from data submitted by councils to the SV Victorian
Local Government Annual Waste Services Survey. There was a significant increase in the
cost of providing a kerbside recyclables collection service for 2019–20. This year, the cost
increased considerably (for the second year in a row) to more than $147 million, $26 million
more (21.8 per cent) than the previous period. Concerningly, the cost to councils to provide
a recyclable collection service is now slightly more than the cost to provide a garbage
collection service. The cost per tonne of recyclables collected was also $48 per tonne higher
for SKM-affected councils ($282 per tonne) compared with councils not affected by the SKM
closure ($234 per tonne).
Furthermore, at the beginning of 2019–20 there was an estimated 280,000 tonnes of
kerbside recyclables in storage (including glass), mostly in metropolitan Melbourne,
accumulated through 2018 and early 2019 as a result of SKM sorting facility shutdowns due
to non-compliance with EPA Victoria site operating conditions and SKM’s eventual closure.
Prior to and during this period, there was a sustained practice of sending unsorted and
single stream recyclable material to storage with the intent that it would be sorted or sold
and reprocessed at a later date. However, by the end of 2019–20 all of this stored material
3 The Victorian sector is building resilience to local disruptions and change

Waste and recycling in Victoria – Strategic summary report 11
is now reported to have been removed (Sustainability Victoria, 2020). Figure 3 highlights the
change in storage material volumes over 2019–20, with most of the stored material sent to:
» landfill, due to material degredation in storage making it unrecoverable
» reprocessing, particularly glass reprocessing, which saw an increase of 54.5 per cent
from 2018–19 to 301,000 tonnes. This can be attributed to increases of glass
reprocessing into aggregate material for construction.
Figure 3: Estimated total recyclable material storage change in Victoria, 2019–20
3.2 Waste management during the COVID-19 pandemic
At the beginning of 2020 the coronavirus pandemic became a global issue. In March 2020
the sector had to adapt to changes associated with the Victorian Government’s response to
COVID-19. As with many other national and state jurisdictions, the Victorian Government
implemented COVID-19 restrictions in an attempt to protect human health. These measures
resulted in a shift of consumer waste and recycling disposal behaviours as well as changed
operational requirements for collectors and reprocessors. The movements of many
Victorians were restricted under stay-at-home orders and so individuals were unable to
attend places of work, high-density commercial areas
(e.g. shopping centres) or hospitality venues in large
numbers.
The impact of these lockdowns appears to have
slightly offset the expected impact of SKM closures
(where associated recyclables went to landfill) on the
total tonnes of recyclables collected in kerbside
services, which increased by 1.3 per cent compared
with 2018–19. The impact of these lockdowns is also
evident in the increased organics tonnes collected
from kerbside, which increased by 28.7 per cent and
set a new record high for Victoria, and the amount of
garbage collected from households, where
consumption shifted from the commercial and
industrial (C&I) sector and into the municipal solid
waste (MSW) sector.
The potential impact on sector operations can be seen
through the following observations:
Figure 4: Proportion of MSW
and C&I recovered, 2019–20
vs 5-year average (2014–19)
. .
. .
4
year avg 4
MSW

12 Sustainability Victoria
» Figure shows that, of the total tonnes of MSW and C&I recovered for reprocessing, the
proportion from MSW in 2019–20 was 7.9 percentage points more than the average from
the last 5 years
» Table 2 shows the increases in tonnages and costs associated with kerbside collection in
2019–20 compared with 2018–19.
This change in waste and recycling patterns required adaptation from the waste and
resource recovery sector.
Table 2: Kerbside collection (tonnes collected and sorted, annual service cost and cost per
tonne) in Victoria, 2018–19 and 2019–20
In relation to hazardous waste, the impact of COVID-19 pandemic required the continued
management of clinical waste. Clinical waste is waste associated with testing, monitoring of
treatment of patients suspected or suspected of having a communicable disease, like
coronavirus (COVID-19). This waste includes personal protective equipment (PPE) and
cytotoxic waste (e.g. needles, swabs, gloves) which are generally safely disposed of through
incineration. Compared with 2018–19, there was only a slight increase of 2.1 per cent (0.3
kt) of clinical waste managed. It is thought the anticipated rise in PPE gear due to the
pandemic was offset by the limitations of other clinical treatments and procedures.
3.3 Policy changes impact material flows
Recycling Victoria: A New Economy
Recycling Victoria is the Victorian Government’s circular economy policy and action
plan, released in early 2020 by the Department Environment, Land, Water and Planning
DELWP . An ambitious policy and framework to transition Victoria’s waste
management to a functioning circular economy by 2030, it sets out targets and
programs to be delivered against that will fundamentally reduce waste, boost jobs and
transform the waste and recycling sector in Victoria.
This policy comes with a Victorian Government investment of more that $300 million to
support industry, innovation and the Victorian community in this transformation.
As well as factors associated with SKM and COVID-19, the industry is also adapting to
changes associated with state and national policy. A number of policy settings will impact on
the flow of material recovered for reprocessing through the Victorian sector. Some examples
of these include:
» Under the Recycling Victoria policy, the programs most to relevant to changing material
flows within the sector are:
– the Victorian container deposit scheme (CDS), which will incentivise better recycling by
offering a cash reward for the return of beverage cans, cartons and bottles
– kerbside recycling systems reform, which will standardise household waste and
recycling services across the 79 local governments by 2030. All households will have
access to a collection service, including a glass bin collection service by 2027 and a
food and garden organics collection service by 2030.
2018–19 2019–20 Change
Annual service cost $488,205,008 $556,423,406 14.0%
Tonnes collected 2,189,248 2,365,992 8.1%
Tonnes sorted 949,341 1,065,008 12.2%
Cost per tonne $223 $235 5.5%

Waste and recycling in Victoria – Strategic summary report 13
– Household bin content standardisation which will set the materials accepted in each
bin at the household level for the entire state. This will allow consistent communication
and education campaigns and reduce confusion amongst residents between different
councils.
» The National Waste Policy Action Plan 2019, which sets targets and actions to implement
the 2018 National Waste Policy – for example target 6 (which was adopted by Recycling
Victoria and is tracked in Section 5.2 of this report) to halve the volume of organic waste
sent to landfill by 2030 (Department of Environment and Energy, 2019). The plan guides
investment and national efforts to 2030 and beyond, reflected in the Recycling Victoria
policy, and aims to address impediments to a circular economy in Australia. Some of the
actions most relevant to changing material flow within the sector are:
– The waste export bans, as agreed by the Council of Australian Governments (COAG)
and released in March 2020, fulfils an action to ban the export of plastic, paper, glass
and tyre wastes (COAG, 2020). The COAG export bans set out timelines for each
material, with bans for all materials to be in effect by 1 July 2024.
– The Australian Packaging Covenant Organisation Action Plan for Problematic and
Unnecessary Single-Use Plastic Packaging to phase out problematic materials
(Australian Packaging Covenant Organisation, 2020). It sets out to eliminate nine
priority materials1 by providing a practical framework and a range of resources to help
businesses and supply chains identify opportunities to eliminate, redesign, replace or
innovate on new packaging solutions and in doing so help drive progress to the target
of phasing out these problematic and unnecessary plastics by 2025.
While the above examples are not comprehensive it is evident that a range of policy actions
and targets at the national and state level will change the quality and quantity of material
flows through the Victorian waste management sector. The sector has demonstrated
resilience to dynamic changes and will face further challenges over the next decade.
1 Lightweight plastic shopping bags, fragmentable plastics, expanded polystyrene (EPS) packaging for food and
beverage service and retail fresh produce, EPS loose fill packaging, moulded EPS packaging for white / brown
goods and electronics, rigid polyvinyl chloride (PVC) packaging, rigid polystyrene (PS) packaging, opaque
polyethylene terephthalate (PET) bottles and rigid plastic packaging with carbon black

14 Sustainability Victoria
4.1 Material flow changes in local and export reprocessing
The 2018–19 financial year saw a national and global shift in how recyclable commodities
were utilised and traded. This shift continued into 2019–20, with many countries which
Victoria and other Australian jurisdictions traded recyclable commodities with instituting
restrictions or bans (China most notably, but also India, Indonesia, Malaysia, Taiwan,
Thailand and Vietnam). In addition to these foreign country import bans, the COAG
announced in 2020 that four waste materials, namely unprocessed glass (from January
2021), mixed resin / polymer plastics (from July 2021) and single resin / polymer plastics
(from July 2022), whole tyres (from December 2021), and mixed paper and cardboard (from
July 2024), would be banned from export from Australia (COAG, 2020).
Despite Victoria having a historical reliance on export markets for secondary reprocessing
and manufacturing, especially for materials from kerbside recycling bins (plastics, paper and
cardboard), Victoria has demonstrated an overall decline in the quantities of exported
materials over 2019–20, and an increase in the quantities of locally reprocessed material.
These trends point to a sector that is shifting away from export markets and towards local
markets for reprocessing. Table 3 presents the material volume changes between local and
export reprocessing in 2019–20 compared with 2018–19 as well as the quantities that will be
impacted by COAG material export bans.
Table 3: Material volume changes in local and export reprocessing in Victoria, 2019–20
(percentage change from 2018–19)
Material Recovered for
reprocessing
Locally
reprocessed
Exported for
reprocessing
Estimated amount
impacted by
export ban
Aggregates,
masonry and
soil
6,538,700 6,538,700 0
Not applicable up 3.5% up 3.5% No change
Glass 300,700 296,800 3,900 3,900
(1 Jan 21) up 54.5% up 64.6% down 72.8%
Metals 1,482,400 953,800 528,600
Not applicable up 0.5% down 3.4% up 8.6%
Organics 1,383,500 1,370,200 13,300
Not applicable up 5.1% up 5.2% down 2.6%
Paper /
cardboard
1,114,800 699,200 415,700 137,800
(1 Jul 21) down 10.8% down 8.7% down 14.1%
4 Global shifts in manufacturing supply chains are changing the sector in Victoria

Waste and recycling in Victoria – Strategic summary report 15
Plastics
140,100 87,600 52,500 54,000
(unsort: 1 Jul 21)
(unproc: 1 Jul 22) down 1.7% up 44.5% down 35.9%
Rubber 62,600 32,600 30,100 14,300
(1 Dec 21) down 13.0% up 8.4% down 28.3%
Numbers in table have been rounded and may not add up within the table or to other figures reported elsewhere in this document. The term ‘unsort’ refers to the ban on unsorted plastics and the term ‘unproc’ to the ban on unprocessed plastics.
1.04 million tonnes of material was exported from Victoria for reprocessing, which is
approximately 9.4 per cent of the total material recovered for reprocessing from Victorian
sources. Figure 4 shows the top 10 export destintions in 2019–20. These countries
accounted for 94.6 per cent of all materials exported from Victoria. The country receiving the
highest proportion of recovered materials from Victoria was Bangladesh, followed by
Indonesia and China, suggesting local sorters and reprocessors have been able to meet
strict import requirements related to contamination levels in materials exported to these
countries.
Figure 4: Major export destinations for recovered material from Victoria, 2019–20
4.2 Commodity values in export markets
Material commodity value plays an important role in ensuring material collected for recycling
is converted into new products. The following trends are reported for key recyclable
materials for 2019–20:
16 Sustainability Victoria
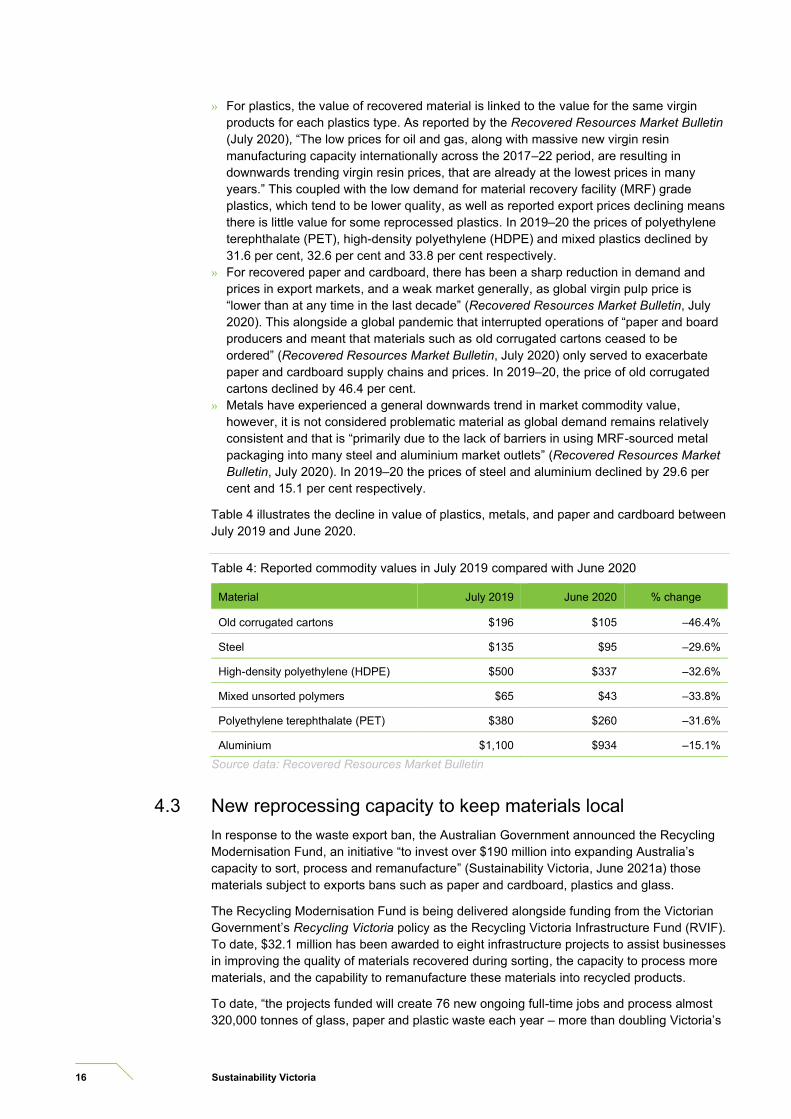
» For plastics, the value of recovered material is linked to the value for the same virgin
products for each plastics type. As reported by the Recovered Resources Market Bulletin
July , “The low prices for oil and gas, along with massive new virgin resin
manufacturing capacity internationally across the 2017–22 period, are resulting in
downwards trending virgin resin prices, that are already at the lowest prices in many
years.” This coupled with the low demand for material recovery facility (MRF) grade
plastics, which tend to be lower quality, as well as reported export prices declining means
there is little value for some reprocessed plastics. In 2019–20 the prices of polyethylene
terephthalate (PET), high-density polyethylene (HDPE) and mixed plastics declined by
31.6 per cent, 32.6 per cent and 33.8 per cent respectively.
» For recovered paper and cardboard, there has been a sharp reduction in demand and
prices in export markets, and a weak market generally, as global virgin pulp price is
“lower than at any time in the last decade” (Recovered Resources Market Bulletin, July
2020). This alongside a global pandemic that interrupted operations of “paper and board
producers and meant that materials such as old corrugated cartons ceased to be
ordered” Recovered Resources Market Bulletin, July 2020) only served to exacerbate
paper and cardboard supply chains and prices. In 2019–20, the price of old corrugated
cartons declined by 46.4 per cent.
» Metals have experienced a general downwards trend in market commodity value,
however, it is not considered problematic material as global demand remains relatively
consistent and that is “primarily due to the lack of barriers in using MRF-sourced metal
packaging into many steel and aluminium market outlets” (Recovered Resources Market
Bulletin, July 2020). In 2019–20 the prices of steel and aluminium declined by 29.6 per
cent and 15.1 per cent respectively.
Table 4 illustrates the decline in value of plastics, metals, and paper and cardboard between
July 2019 and June 2020.
Table 4: Reported commodity values in July 2019 compared with June 2020
Source data: Recovered Resources Market Bulletin
4.3 New reprocessing capacity to keep materials local
In response to the waste export ban, the Australian Government announced the Recycling
Modernisation Fund, an initiative “to invest over $190 million into expanding Australia’s
capacity to sort, process and remanufacture” Sustainability Victoria, June 2021a) those
materials subject to exports bans such as paper and cardboard, plastics and glass.
The Recycling Modernisation Fund is being delivered alongside funding from the Victorian
Government’s Recycling Victoria policy as the Recycling Victoria Infrastructure Fund (RVIF).
To date, $32.1 million has been awarded to eight infrastructure projects to assist businesses
in improving the quality of materials recovered during sorting, the capacity to process more
materials, and the capability to remanufacture these materials into recycled products.
To date, “the projects funded will create new ongoing full-time jobs and process almost
320,000 tonnes of glass, paper and plastic waste each year – more than doubling Victoria’s
Material July 2019 June 2020 % change
Old corrugated cartons $196 $105 –46.4%
Steel $135 $95 –29.6%
High-density polyethylene (HDPE) $500 $337 –32.6%
Mixed unsorted polymers $65 $43 –33.8%
Polyethylene terephthalate (PET) $380 $260 –31.6%
Aluminium $1,100 $934 –15.1%

Waste and recycling in Victoria – Strategic summary report 17
domestic glass recycling and boosting domestic plastics recycling by almost 40 per cent”
(Sustainability Victoria, June 2021b). The investment and installation of advanced paper
recycling technologies in Coolaroo, Melbourne, where a “$ million investment in a drum
pulping system, which eliminates contaminates like plastics from the waste paper stream,
will work to transform Victoria’s recycling and remanufacturing landscape and keep more
discarded paper out of local landfills” Waste Management Review, April 2021) is one such
project. This project in particular will target materials that have historically been exported.
The RVIF, with contributions from the Victorian and Australian governments, will continue to
improve the ability of the local market to process materials in Victoria, removing our reliance
on export markets.
4.4 Innovation creating new local markets
Over 2019–20, the Research, Development and Demonstration program (RD&D) at SV
invested $1.6 million and leveraged a further $8 million of investment. Funding has
supported partnerships between industry and research institutions to develop and test
innovative new ways to reuse waste materials. One such partnership between the University
of Melbourne and its project partners the North West Program Alliance, Hanson and
Department of Transport constructed a demonstration site in March 2020 at the completed
level crossing removal project at Reservoir Station. The site trialled two concrete mixes that
included both washed and unwashed glass. The trial concluded that when unwashed glass
fines are used as a replacement for sand (10% by mass), the mass of contaminants is within
the limits for fine aggregate according to Australian Standards. University of Melbourne
presented its research findings to Department of Transport, who are in the review process to
update Section 703 – General concrete paving, to enable the inclusion of unwashed glass.
A partnership led by Integrated Recycling and Monash Institute of Railway Technology and
supported by SV over nearly 4 years through the aforementioned RD&D fund led to the
installation of ground-breaking recycled plastic railway sleepers at Richmond train station as
part of maintenance work by Metro Trains Melbourne in June 2019. These “sleepers require
far less maintenance and have a lifespan of up to 50 years – three times longer than
traditional timber sleepers. At the end of their lifetime the sleepers will be recycled into new
sleepers, fulfilling the promise of a truly circular economy” Sustainability Victoria, .This
trial led to Metro Trains providing full type approval for Integrated Recycling’s composite
sleepers as a replacement for low-profile concrete sleepers and the direct replacement of
timber.
4.5 Victorian Recycling Infrastructure Plan
SV’s statutory roles are established under the Sustainability Victoria Act 2005 and the
Environment Protection Act 1970 and 2017. This includes the preparation of the Statewide
Waste and Resource Recovery Infrastructure Plan (SWRRIP).
There have been significant changes in the operating environment since the publication of
the 2018 SWRRIP. These include changes to policy settings internationally resulting in
significant changes in market value of recycled commodities, announcement of the
introduction of export bans of some materials, introduction of a new Environment Protection
Act 2017 (EP Act) (implemented in July 2021), publication of a national waste policy, and
Victorian Government commitment to purchase recycled materials.
Recycling Victoria requires that the Victorian Recycling Infrastructure Plan (VRIP) (the new
name of the SWRRIP) be developed, and that it should include planning for hazardous
waste infrastructure, planning for waste-to-energy facilities, improved statewide risk and
contingency planning, and alignment of land use planning systems with infrastructure
planning.

18 Sustainability Victoria
5.1 Measuring Victoria’s progress towards a circular economy
Key Commitment 11 of Recycling Victoria commits the Victorian Government to “establish a
framework for monitoring progress towards the circular economy, including the identification
of indicators and metrics.” New circular economy metrics will measure increases in materials
productivity and decreases in environmental impacts achieved through these reforms.
Circular economy indicators and metrics have been designed and are used by a range of
countries and states, mainly in Europe and North America, to track progress towards
circularity. As such, there is a set of common characteristics that help to define how
indicators and metrics are classified. In an Organisation for Economic Co-operation and
Development (OECD) 2020 report titled The OECD Inventory of Circular Economy
Indicators, metrics and indicators were grouped into:
» five main theme categories: environment, governance, economic and business,
infrastructure and technology, and jobs
» eleven sector categories: waste; resources and materials; repair, reuse and share; built
environment; energy; food; water; public administration; air; other; and non-sector specific
» three measurement scale categories: macro (indicators applicable at national / state
level); meso (indicators applicable at industry / sector level); and micro (indicators
applicable at business, government department, city, or municipality level).
SV has undertaken a circular economy metrics and indicators identification project in order
to understand the:
» scope of requirements for measuring circular economy metrics in Victorian Government –
What does the Victorian Government want to achieve by monitoring the circular
economy? What questions do we want to answer?
» level and breadth of circular economy metrics used in other jurisdictions locally, nationally
and globally – What level of reporting is used in other jurisdictions?
» types and availability of data required for measuring circular economy metrics – What do
we already know?
The output from the project has provided SV with recommendations for measuring circular
economy metrics in Victoria. From this work SV will also produce a circular economy metrics
measurement report.
5.2 Performance against Recycling Victoria’s waste targets
Recycling Victoria established four targets to measure the state’s performance on waste
management:
» Divert 80% of waste from landfill by 2030, with an interim target of 72% by 2025.
» Cut total waste generation by 15% per capita by 2030.
5 SV is tracking Victoria’s performance towards a circular economy and against Recycling Victoria’s targets

Waste and recycling in Victoria – Strategic summary report 19
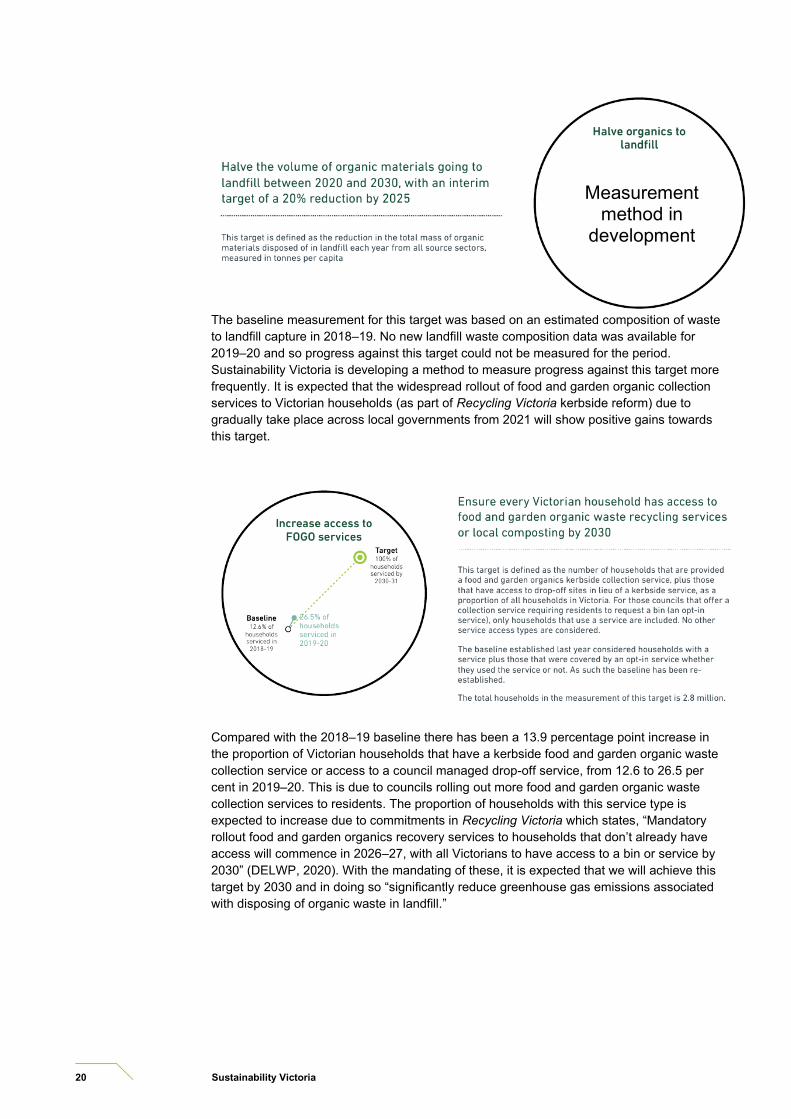
» Halve the volume of organics going to landfill between 2020 and 2030, with an interim
target of a 20% reduction by 2025.
» Ensure every Victorian household has access to food and garden organic waste recycling
services or local composting by 2030.
Figure 5: Tracking performance against Recycling Victoria targets
Compared with the 2018–19 baseline there has been a slight change in the percentage of
waste diverted from landfill in 2019–20, with 69.7 per cent of waste recovered. It is expected
that, as Recycling Victoria programs begin to roll out into the industry and community, the
diversion rate will increase.
Compared with the 2018–19 baseline there was a 5 per cent increase in total waste
generated per capita to 1.24 tonnes per person in 2019–20 (waste generation from the
MSW and C&I sectors only). This is likely to be due to increases in organics and municipal
construction material associated with increased garden and home renovation projects during
COVID-19 restrictions in Victoria.
If looking at all waste generated (including construction and demolition (C&D) waste) there
was a 1.9 per cent increase in the total waste generated per capita to 2.4 tonnes per person
compared with a baseline of 2.3 tonnes per capita.
20 Sustainability Victoria
The baseline measurement for this target was based on an estimated composition of waste
to landfill capture in 2018–19. No new landfill waste composition data was available for
2019–20 and so progress against this target could not be measured for the period.
Sustainability Victoria is developing a method to measure progress against this target more
frequently. It is expected that the widespread rollout of food and garden organic collection
services to Victorian households (as part of Recycling Victoria kerbside reform) due to
gradually take place across local governments from 2021 will show positive gains towards
this target.
Compared with the 2018–19 baseline there has been a 13.9 percentage point increase in
the proportion of Victorian households that have a kerbside food and garden organic waste
collection service or access to a council managed drop-off service, from 12.6 to 26.5 per
cent in 2019–20. This is due to councils rolling out more food and garden organic waste
collection services to residents. The proportion of households with this service type is
expected to increase due to commitments in Recycling Victoria which states, “Mandatory
rollout food and garden organics recovery services to households that don’t already have
access will commence in 2026–27, with all Victorians to have access to a bin or service by
” (DELWP, 2020). With the mandating of these, it is expected that we will achieve this
target by 2030 and in doing so “significantly reduce greenhouse gas emissions associated
with disposing of organic waste in landfill.”
Measurement method in
development

Waste and recycling in Victoria – Strategic summary report 21
The Victorian Recycling Industry and Victorian Local Government surveys and reports have
occurred annually since 2005–06 and 2001–02 respectively. They provide the Victorian
Government with a good understanding of waste management over a 12-month period in
relation to local government kerbside waste and the tonnages of waste managed by the
resource recovery sector.
While the data collected through these surveys is an invaluable source of insights into waste
collected, managed, recovered and reprocessed within Victoria – representing the official
statistics that inform much of industry and government decision-making and programs – it is
well recognised that there is some way to go to improve how and what information is
captured. Here we present the current methodologies used by each survey and the vision
towards expanding Victoria’s waste data system as committed by Recycling Victoria.
6.1 Method – Victorian Recycling Industry Annual Survey (VRIAS)
What data does the survey collect?
The VRIAS targets the collection of data on the amount of material recovered for
reprocessing by material type and source sector from companies processing Victorian
waste. Reprocessing recovered materials, typically an industrial process, results in a
material or product that can be productively used. Energy recovery is the process by which
embodied energy is captured for use. It is a form of resource recovery, but it is not
reprocessing. To avoid double counting, this survey only focuses on materials recovered for
reprocessing and no other stages of the resource recovery life cycle, such as collecting,
sorting and manufacturing. Additionally the survey does not target materials that have been
collected and baled only (unless they are exported) or materials that have been stockpiled. It
also does not include materials that have been resold in their original state for reuse, such
as clothing sold through second-hand or charity stores.
How does the survey collect data?
The VRIAS is voluntary and performed annually at the end of the financial year. The VRIAS
2019–20 was conducted between November 2020 and June 2021. It sought data from 99
Victorian waste reprocessing businesses (excluding plastics reprocessors) via a voluntary
online survey. The response rate, describing those that submitted a response or chose to
opt out of this year’s survey, was 85 per cent, a decrease of 1 percentage point compared
with 2018–19. The survey participation rate was 66 per cent as 19 businesses requested to
opt out of completing the survey. Only 15 businesses out of 99 contacted did not respond.
Please refer to Appendix A of the VRIAS technical report for further details.
Victorian plastic reprocessor data was obtained from the 2019–20 Australian Plastics
Recycling Survey prepared by Envisage Works. This survey aims to capture plastic
6 Methods of collecting waste and resource recovery data in Victoria are improving
22 Sustainability Victoria
consumption and recycling from surveying a combination of sources including resin
producers, resin importers, plastic reprocessors and plastic exporters.
How are data validated and reported?
The information is self-reported by the organisation before being validated by SV. Validation
is done by comparing responses to previous years’ data, by consulting with individual
organisations and by adjusting figures for double counts captured in the reported transfer of
materials between Victorian reprocessors.
The data are reported in aggregated form, which reduces the impact of statistical anomalies
on the findings. The findings are therefore more representative of trends in recovered
quantities and these are reported at an overall level as well as groupings by sector and by
material type.
Given the manual, voluntary and consultative nature of the survey data collected, it is not
surprising that the data may be liable to variability from year to year or errors (for example,
material flows subjected to unaccounted double counts or tonnages misappropriated to
sector or materials). The best efforts have been made by both respondents and SV to
mitigate these and to report representative trends and insights. As such, SV is confident that
the findings of these reports represent a good understanding of waste management and
recovery in Victoria.
6.2 Method – Victorian Local Government Annual Waste Services Survey (VLGAWS)
What data does the survey collect?
The VLGAWS collects information from each local government across a range of waste
services – household garbage collection and disposal, household recyclables collection and
sorting, household organics collection and processing, public litter bin and litter trap
collection and disposal, litter clean-up services, street sweeping, hard waste collection
services, and landfill and resource recovery centre / transfer station operations.
The data, level of detail and accuracy of data available varies per council. For example,
57 per cent of local governments were able to provide a detailed material composition for all
recyclables and contamination rate from either a bin audit or MRF reported audit. All local
governments were able to provide data on total tonnages for garbage, recyclables and
organics, which represents the key data points for reporting.
How does the survey collect data?
The VLGAWS is performed annually at the end of the financial year. The VLGAWS 2019–20
was conducted between November 2020 and June 2021. It sought data from all 79
municipalities in Victoria via a voluntary online survey. All 79 local governments participated
in the survey to some degree, representing an overall response rate of 100 per cent.
How is data validated and reported?
The information is self-reported by the local government before being validated by SV.
Validation is done using a hierarchical validation structure. First, an internal local
government approval process takes place. Two local government representatives participate
in the survey, with one respondent and another reviewer confirming submitted data. Second,
SV performs validation by calculating and comparing key metrics for each council and
comparing responses to previous years’ data for any historical anomalies and by consulting
with local governments and Waste and Resource Recovery Groups.
The data are presented in aggregated form, which reduces the impact of statistical
anomalies on the findings. The findings are therefore more representative of costs, yields
and trends in collection quantities. In various parts of the report, the data are grouped by

Waste and recycling in Victoria – Strategic summary report 23
service provision category, metro and non-metro classification, Waste and Resource
Recovery Group region, collection system type and collection frequency.
6.3 What is the Victorian Government doing to improve our data?
Similar to the many goals being committed to, not just in Victoria but in Australia and the rest
of the world, targets are being set to monitor and evaluate our progress towards a more
sustainable and circular economy. In Victoria these targets are set out in the Recycling
Victoria policy.
While both of these surveys capture vital components of the waste management life cycle
and are used for decision-making and to measure Victoria’s progress towards these targets,
it does not capture data at a high enough quality, detail, frequency or completeness to
provide entire transparency and accountability for what happens to our waste. “Data are the
lifeblood of decision-making and the raw material for accountability. Without high-quality
data providing the right information on the right things at the right time; designing, monitoring
and evaluating effective policies becomes almost impossible” (United Nations (IEAG)
Independent Expert Advisory Group on a Data Revolution for Sustainable Development,
2014). In order to address these issues the Recycling Victoria policy established Key
ommitment : Expand Victoria’s Waste Data Systems (DELWP, 2020). The aim of Key
Commitment 11 as stated in the policy is to “help businesses and government better
manage waste and make better investment decisions. It will also help the government track
Victoria’s progress towards a circular economy.”
Through Recycling Victoria, the Victorian Government is investing $7 million to modernise
our waste data system to improve decision-making and policy development and provide
more transparency about what happens to our waste.
This commitment comes following the Victorian Auditor-General’s Office report of 2019
documenting the inadequacies of current data collection systems and methodologies across
Victoria and their ability to accurately monitor and intervene in the waste sector (Victorian
Auditor-General’s Office, . The report made strong recommendations to strengthen
industry regulation by drafting a new Act that will mandate waste as an essential service; to
establish a waste authority whose purpose would be to oversee the performance of the
waste and recycling sector; and to generally improve the accuracy, completeness,
consistency, timeliness and reliability of data collected.
Already efforts are being made to better understand and transform our collection and use of
waste data. Products such as the SV Recovered Resources Market Bulletin, which detail the
latest developments for industry and government around on and off-shore markets for
recovered waste, or “the development of national standards and specifications” as set out in
the National Waste Policy Action Plan 2019, aim to establish consistency to facilitate
increased sharing of information across states and so improve performance. Developments
to improve tracking of materials such as the introduction of a digital waste tracking system
by EPA Victoria which came into effect under the Environment Protection Act 2017 (EP Act)
on 1 July 2021.
While these efforts continue and the sector has a way to go, what we do have is a
consistent data set, collecting the same information since the early 2000s and stored
securely, allowing us to view general trends over time. While it does not adhere to all the
data principles of timeliness and completeness, it does speak to consistency and conformity.
The gaps in these reports, described in more detail in Appendix B of the RIWR and the
LGWSR, give a good understanding of the similarities, differences and limitations to the
insights gained with these reports.
We can only work within what we know now, and we look forward to working with the waste
and resource recovery sector to establish a more granular, holistic and timely data system
that will improve the evidence base and provide a more detailed understanding of the
nature, volumes and destination of waste, for industry, government and the public.

24 Sustainability Victoria
Australian Packaging Covenant Organisation (2020) Action Plan for Problematic and
Unnecessary Single-Use Plastic Packaging, accessed 23 July 2021.
COAG (2020) Phasing Out Exports of Waste Plastic, Paper, Glass and Tyres, accessed 23
July 2021.
Department of Environment and Energy (2019) National Waste Policy Action Plan 2019,
accessed 23 July 2021.
Department of Environment, Land, Water and Planning (DELWP) (2020) Recycling Victoria:
A New Economy, accessed 25 June 2021.
Inside Waste (October, 2019), ‘Cleanaway acquires SKM facilities for 66 million’, Inside
Waste, accessed 23 July 2021.
McMillan and Vedelago (October, 2019), ‘Recycling firm SKM Industries goes into
liquidation, sale expected’, The Age, accessed 30 June 2021.
Organisation for Economic Co-operation and Development (OECD) (2020) The OECD
Inventory of Circular Economy Indicators, accessed 23 July 2021.
Sustainability Victoria (2019, 2020) Recovered Resources Market Bulletin, various dates,
accessed 6 June 2021.
Sustainability Victoria (2020), Hazardous Waste Infrastructure Profile, (Commercial-in-
confidence, Unpublished).
Sustainability Victoria (June, 2019), ‘Railway sleepers made from recycled plastic installed
at Richmond Train Station’, accessed 23 July 2021.
Sustainability Victoria (2021a) Waste and Recycling in Victoria – Recycling Industry Waste
Report 2019–20.
Sustainability Victoria (2021b) Waste and Recycling in Victoria – Recycling Industry Waste
Workbook 2019–20.
Sustainability Victoria (2021c) Waste and Recycling in Victoria – Local Government Waste
Services Report 2019–20.
Sustainability Victoria (2021d) Waste and Recycling in Victoria – Local Government Waste
Services Workbook 2019–20.
Sustainability Victoria (June, 2021a) ‘Recycling Victoria Infrastructure Fund’, accessed 25
June 2021.
Sustainability Victoria (June, 2021b) ‘Recycling Victoria Infrastructure Fund – Materials
(paper and cardboard, plastic, glass) grants’, accessed 25 June 2021.
7 References
Waste and recycling in Victoria – Strategic summary report 25
United Nations (IEAG) Independent Expert Advisory Group on a Data Revolution for
Sustainable Development. (November 2014). A World That Counts: Mobilising the Data
Revolution for Sustainable Development, accessed 27 May 2021.
Victorian Auditor-General’s Office Recovering and Reprocessing Resources from
Waste, accessed 23 July 2021.
Waste Management Review April, ‘Visy to install advanced paper recycling
technology through RMF’, Waste Management Review, accessed July .
26 Sustainability Victoria
Term Acronym(s)
(if applicable)
Description
Arisings Hazardous waste is said to ‘arise’ when it causes demand
for processing, storage, treatment or disposal
infrastructure.
Hazardous waste arisings are the appearance of waste in
a waste tracking system (typically measured in tonnes).
This is distinct from waste generation, as hazardous
waste sometimes arises more than once in Victoria’s
current waste tracking system. For example, a hazardous
waste consignment may be recorded as moving from a
waste generator to a treatment facility and later, treatment
outputs could be recorded separately, as moving to a
disposal facility.
Australian Bureau of
Statistics
ABS An independent statutory agency of the Australian
Government responsible for statistical collection and
analysis.
Commercial &
industrial waste
C&I Solid materials and waste generated from trade,
commercial and industrial activities, including the
government sector. It includes waste from offices,
manufacturing, factories, schools, universities, state and
government operations, and small to medium enterprises,
e.g. food organics.
Construction &
demolition waste
C&D Solid materials and waste generated from residential and
commercial construction and demolition activities, e.g.
bricks and concrete.
Container deposit
scheme
CDS A government scheme to incentivise more and better
recycling by offering a cash reward for the return of drink
cans, bottles and cartons.
Coronavirus disease
2019
COVID, COVID-19 Coronavirus, also known as COVID-19, is the contagious
respiratory disease that began in 2019 and has resulted
in an ongoing global pandemic.
Council of Australian
Governments
COAG An intergovernmental forum in Australia whose role is to
manage matters of national significance or matters that
need coordinated action by all Australian governments.
Department of
Environment, Land,
Water and Planning
DELWP Victorian Government department providing policy
planning, preparation of legislative amendments,
leadership coordination and oversight of the environment
portfolio.
8 Glossary

Waste and recycling in Victoria – Strategic summary report 27
Term Acronym(s)
(if applicable)
Description
Diversion rate The diversion rate is measured as the amount of waste
recovered (not landfilled) of waste that enters the waste
management system. It considers all recovered material
types presented in the RIWR across all sectors. The
landfill component is sourced from EPA Victoria’s landfill
levy returns on solid waste disposed of to licensed
landfills.
These reports also present two other diversion rates; the
Kerbside diversion rate presented in the LGWSR and the
MSW diversion rate presented in the RIWR.
These diversion rates are not directly comparable and as
such, please refer to Appendix B of both the LGWSR or
the RIWR for further information.
Environment
Protection Authority
EPA EPA Victoria’s role is to be an effective environmental
regulator and an influential authority on environmental
impacts.
Expanded
polystyrene
EPS See Polystyrene below.
Hazardous waste All waste streams currently regulated as prescribed
industrial waste in Victoria under the Environment
Protection Act 1970. Upon commencement of the new
Environment Protection Act 2017 (EP Act) (proposed for 1
July 2021), hazardous waste is the subset of reportable
priority wastes where the most stringent duties apply, as
stipulated in section 142 and section 143 of the new Act.
High-density
polyethylene
HDPE, PE-HD A member of the polyethylene family of plastics, typically
referred to as HDPE, used to make products such as milk
bottles, pipes and shopping bags. HDPE may be coloured
or opaque.
Kerbside collection Materials and waste collected by local councils, including
garbage, commingled recyclables and garden organics,
but excluding hard waste.
Kerbside diversion
rate
The diversion rate as calculated in the LGWSR. A
calculation that indicates the amount of kerbside waste
diverted from landfills. The kerbside diversion rate is
calculated by dividing the tonnes of recyclables and
organics collected (less contaminants) by the tonnes of
recyclables, organics and garbage collected from the
kerbside system (i.e. excludes transfer station and drop-
off materials). It is not comparable to the MSW diversion
rate as calculated in the RIWR, for further details on this
please refer the RIWR or the LGWSR, Appendix B:
Comparison of survey data.
Landfill A waste disposal site used for the controlled deposit of
solid waste onto or into land.
Material recovery
facility
MRF A centre for the receipt, sorting and transfer of materials
recovered from the waste stream before transporting to
another facility for recovery and management. At the
MRF, materials may undergo mechanical treatment for
sorting by characteristics such as weight, size, magnetism
and optical density and may include cleaning and
compression. Materials may be received as mixed
streams such as commingled recyclables from

28 Sustainability Victoria
Term Acronym(s)
(if applicable)
Description
households and businesses or single streams such as
metals.
Municipal solid waste MSW Solid waste managed predominantly from domestic
premises (residual and hard waste) and council activities
such as street sweeping, litter collection and street tree
lopping. Municipal waste also includes waste dropped off
at transfer stations and construction waste from
residential owner / occupier renovations.
MSW diversion rate The diversion rate of the municipal sector as calculated in
the RIWR. A calculation that indicates the amount of
municipal waste diverted from landfills. It considers a
subset of RIWR materials, namely excludes aggregates,
masonry and soil, textiles and rubber, to best fit materials
generated from kerbside in the LGWSR.
Please refer to Appendix B: Comparison of survey data
for details on the similarities and differences between
these in either the RIR or the LGWSR.
Organics Any combination of food materials discarded from
households or industry and / or organics dervied from
garden sources.
Food organics may include food processing waste, out-of-
date or off-specification food, meat, fruit and vegetable
scraps. Excludes liquid waste. Garden organics may
include grass clippings, tree prunings, etc.
Organisation for
Economic Co-
operation and
Development
OECD An intergovernmental economic organisation founded in
1961 to stimulate economic progress and world trade. It
provides a platform for member countries to compare
policy experiences, seek answers to common problems,
identify good practices and coordinate domestic and
international policies.
Packaging Material used for the containment, protection, marketing
or handling of product. Includes primary, secondary and
tertiary / freight packaging in both consumer and industrial
packaging applications.
Pathway Combines the various steps in the route between waste
generation and fate, potentially including transfer, storage
and / or treatment of hazarduous waste.
Polyethylene
terephthalate
PET A member of the polyethylene family of plastics, typically
referred to as PET, used to make products such as soft
drink bottles, film packaging and fabrics.
Polystyrene or
expanded
polystyrene
PS, PS-E, ESP A member of the styrene family of plastics, typically
referred to as PS. PS can be either a solid or foamed and
is used to make protective packaging like packing
peanuts as well as yoghurt containers and disposable
cutlery.
Polyvinyl chloride PVC A member of the polyvinyl family of plastics, typically
referred to as PVC. PVC can be made into either a rigid
form, used to make products such as construction pipe,
bottles and bank cards, or into a soft form used to make
products such as electrical cabling insulation, imitation
leather and vinyl records.

Waste and recycling in Victoria – Strategic summary report 29
Term Acronym(s)
(if applicable)
Description
Prescribed industrial
waste
PIW Wastes generated from commercial or industrial sources
that are potentially hazardous to humans or the
environment.
Priority waste Priority waste is any waste, including municipal waste and
industrial waste, that is prescribed to be priority waste for
the purposes of:
» eliminating or reducing risks of harm to human health
or the environment posed by the waste
» ensuring the priority waste is managed in accordance
with the Environment Protection Act 2017 (EP Act)
» facilitating waste reduction, resource recovery and
resource efficiency.
Recovered Materials recovered and diverted from landfill for
reprocessing or use.
Recycle / Recycling To convert waste into a reusable material. In common
practice, the term is used to cover a wide range of
activities, including collecting, sorting, reprocessing and
reuse.
Recycling Victoria RV Recycling Victoria (short for Recycling Victoria: A New
Economy) – a policy or framework of the Victorian
Government to transition the state to a circular economy.
Recycling Victoria
Infrastructure Fund
RVIF A government fund that provides assistance to
businesses to develop infrastructure that improves the
quality of materials recovered and increase the capacity
and capability of Victoria’s resource recovery sector.
Reportable priority
waste
A subset of priority waste that carries the highest levels of
controls / duties under the amended Environment
Protection Act 2017 (EP Act). These wastes are often
hazardous by nature and pose the greatest level of risk to
human health and the environment.2
Reprocess To put a material that has been used through an industrial
process to change it so it can be used again.
Reprocessor /
Reprocessing facility
Facility that uses an industrial process to change the
physical structure and properties of materials so they can
be used again. This can include facilities that dismantle
products, such as tyres, e-waste and mattresses and
waste-to-energy facilities that use materials to generate
energy.
Research,
Development and
Demonstration
program
RD&D A government program that provides grants for
partnerships between businesses, local government and
research institutes that are researching and developing
new products made from recycled materials such as
glass, plastic, organics, electronic waste, concrete, brick
and rubber.
Solid waste Non-hazardous, non-prescribed, solid waste ranging from
municipal garbage to industrial waste.
2 ‘Reportable priority waste’, Environment Protection Authority Victoria, accessed July .
30 Sustainability Victoria
Term Acronym(s)
(if applicable)
Description
Statewide Waste and
Resource Recovery
Infrastructure Plan
SWRRIP A 30-year roadmap to improve Victoria’s waste and
recycling infrastructure by working with business and
government to create an integrated waste and recycling
system that maximises the opportunities to reprocess and
use recycled materials, reduce the need for raw materials
and send less waste to landfill.
Stockpiling Storing of excess recovered / reprocessed materials.
Sustainability Victoria SV Statutory authority established in October 2005 under the
Sustainability Victoria Act 2005 with the key objective of
facilitating and promoting environmental sustainability in
the use of resources. SV works across the areas of
energy, waste and water with communities, industries and
government, applying the best ideas and encouraging
action to enable change in environmental practices.
Treatment Treatment of waste is the removal, reduction or
immobilisation of a hazardous characteristic to enable the
waste to be reused, recycled, sent to an energy-from-
waste facility or disposed.
Victorian Local
Government Annual
Waste Services
Survey
VLGAWS A survey carried out by SV that collects information on the
waste and tonnages manged by local government waste
services.
Victorian Recycling
Industry Annual
Survey
VRIAS A survey carried out by SV that collects information on the
tonnages of waste managed by the resource recovery
sector.
Victorian Recycling
Infrastructure Plan
VRIP Now known as the Statewide Waste and Resource
Recovery Infrastructure Plan (see above).
Waste Any discarded, rejected, unwanted, surplus or abandoned
matter, including where intended for recycling,
reprocessing, recovery, purification or sale. Anything that
is no longer valued by its owner for use or sale and which
is, or will be, discarded. n this document, the term ‘solid
waste’ refers to non-hazardous, non-prescribed, solid
waste materials ranging from municipal garbage to
industrial waste.
Waste and Recycling
in Victoria – Local
Government Waste
Services Report
LGWSR A technical report containing the complete data analysis
of waste management and recycling services by Victorian
local governments.
Waste and Recycling
in Victoria –
Recycling Industry
Waste Report
RIWR A technical report containing the complete data analysis
of waste management and recovery by the Victorian
recycling industry.
Waste and Recycling
in Victoria – Strategic
Summary Report
SSR A summary report containing highlights from this technical
report and the accompanying LGWSR and a broader
discussion of the state of waste in Victoria.
Waste arisings The volumes of waste (measured in tonnes) that have
generated a WTC and therefore arisen into the tracking
system to be managed by infrastructure.
Waste code A three-digit code used to describe wastes.

Waste and recycling in Victoria – Strategic summary report 31
Term Acronym(s)
(if applicable)
Description
Waste management Management is a broad term that encompasses both
waste fates (ultimate destination for a waste) and waste
pathways potentially multiple steps between a waste’s
generation and fate).
Waste transport
certificate
WTC Certificates that allow the tracking of hazardous waste
movements from waste producer to receiving facility as
prescribed by the EPA.