5. Medi-Cal Charts · Medi-Cal Charts 5. Medi-Cal Charts. 5.1 Property Limits. Number of Persons...
62
Update #17-03 Revised 01/24/2017 Chart Book page 5-1 Medi-Cal Charts 5. Medi-Cal Charts 5.1 Property Limits Number of Persons Whose Property is Considered Property Limit 1985 Property Limit 1986 Property Limit 1987 Property Limit 1988 Property Limit 1989-Present 1 person $1,600 $1,700 $1,800 $1,900 $2,000 2 persons 2,400 2,550 2,700 2,850 3,000 3 persons 2,550 2,700 2,850 3,000 3,150 4 persons 2,700 2,850 3,000 3,150 3,300 5 persons 2,850 3,000 3,150 3,300 3,450 6 persons 3,000 3,150 3,300 3,450 3,600 7 persons 3,150 3,300 3,450 3,600 3,750 8 persons 3,300 3,450 3,600 3,750 3,900 9 persons 3,450 3,600 3,750 3,900 4,050 10 or more persons 3,600 3,750 3,900 4,050 4,200 Property reserve must be equal to or below the limit for the appropriate MFBU. The client is eligible if he/she is within the property limit at any time during the month. If the property reserve exceeds the limit for the entire month, deny.
Transcript of 5. Medi-Cal Charts · Medi-Cal Charts 5. Medi-Cal Charts. 5.1 Property Limits. Number of Persons...

Chart Book page 5-1Medi-Cal Charts
5. Medi-Cal Charts
5.1 Property Limits
Number of Persons Whose Property is Considered
Property Limit 1985
Property Limit 1986
Property Limit 1987
Property Limit 1988
Property Limit 1989-Present
1 person $1,600 $1,700 $1,800 $1,900 $2,000
2 persons 2,400 2,550 2,700 2,850 3,000
3 persons 2,550 2,700 2,850 3,000 3,150
4 persons 2,700 2,850 3,000 3,150 3,300
5 persons 2,850 3,000 3,150 3,300 3,450
6 persons 3,000 3,150 3,300 3,450 3,600
7 persons 3,150 3,300 3,450 3,600 3,750
8 persons 3,300 3,450 3,600 3,750 3,900
9 persons 3,450 3,600 3,750 3,900 4,050
10 or more persons
3,600 3,750 3,900 4,050 4,200
Property reserve must be equal to or below the limit for the appropriate MFBU. The client is eligible if he/she is within the property limit at any time during the month. If the property reserve exceeds the limit for the entire month, deny.
Update #17-03 Revised 01/24/2017

page 5-2 Chart BookMedi-Cal Charts
5.2 Community Spouse Resource Allowance (CSRA)
Effective Date CSRA Effective Date CSRA
1/1/17 $120,900 1/1/05 $95,100
1/1/15 $119,220 1/1/03 $90,660
1/1/14 $117,240 1/1/02 $89,280
1/1/13 $115,920 1/1/01 $87,000
1/1/12 $113,640 1/1/00 $84,120
1/1/09-11 $109,560 1/1/99 $81,960
1/1/08 $104,400 1/1/98 $80,760
1/1/07 $101,640 1/1/97 $79,020
1/1/06 $99,540
5.3 Maximum Base Allocations - LTC Cases
5.3.1 Community Spouse Allocation
Effective Date Amount Effective Date Amount
2017 $3,023 2007 $95,100
2015 $2,981 2006 $2,489
2014 $2,931 2005 $2,378
2013 $2,898 2004 $2,319
2012 $2,841 2003 $2,267
2009-11 $2,739 2002 $2,232
Revised 01/24/2017 Update #17-03

Chart Book page 5-3Medi-Cal Charts
Family Member
Dependent Family Member (Living with the Community Spouse)
7/1/16 - 6/30/17 $2,003
7/1/15 - 6/30/16 $1,991
7/1/14 - 6/30/15 $1,967
7/1/13 - 6/30/14 $1,939
7/1/12 - 6/30/13 $1,891
7/1/11 - 6/30/12 $1,839
7/1/09 - 6/30/11 $1,822
7/1/08 - 6/30/09 $1,750
7/1/07 - 6/30/08 $1,712
7/1/06 - 6/30/07 $1,650
7/1/05 - 6/30/06 $1,604
7/1/04 - 6/30/05 $1,562
7/1/03 - 6/30/04 $1,515
7/1/02 - 6/30/03 $1,493
7/1/01 - 6/30/02 $1,452
7/1/00 - 6/30/01 $1,407
7/1/99 - 6/30/00 $1,383
7/1/98 - 6/30/99 $1,357
7/1/97 - 6/30/98 $1,327
7/1/96 - 6/30/97 $1,295
7/1/95 - 6/30/96 $1,254
7/1/94 - 6/30/95 $1,230
Base Allocation (FMBA)
Contact the Medi-Cal Program Coordinator if a base allocation for prior years is needed.
2008 $2,610 2001 $2,175
Effective Date Amount Effective Date Amount
Update #17-03 Revised 01/24/2017

page 5-4 Chart BookMedi-Cal Charts
5.3.2 Statewide Average Private Pay Rate (APPR)
Year APPR Year APPR Year APPR
2016 $8,189 2007 $5,101 1998 $3,460
2015 $8,092 2006 $5,031 1997 $3,402
2014 $7,628 2005 $4,812 1996 $3,262
2013 $7,549 2004 $4,477 1995 $3,211
2012 $7,092 2003 $4,415 1994 $3,031
2011 $6,840 2002 $4,322 1993 $2,911
2010 $6,311 2001 $4,163 1992 $2,791
2009 $5,698 2000 $3,836 1991 $2,628
2008 $5,496 1999 $3,882
Revised 01/24/2017 Update #17-03

Chart Book page 5-5Medi-Cal Charts
5.4 Current Maintenance Need
5.4.1 Maintenance Need Levels Effective July 1, 1989
Number of Persons in MFBU Maintenance Need
1 person in all situations $600
2 persons 750
2 adults 934
3 persons 934
4 persons 1,100
5 persons 1,259
6 persons 1,417
7 persons 1,550
8 persons 1,692
9 persons 1,825
10 persons 1,959
For each additional person add $14.00.
The maintenance need level for Medi-Cal Only beneficiaries in long-term care remains at $35.00. The maintenance need level for SSI recipients in long-term care is increased to $50.00 effective May 1, 2009.
The home upkeep allowance specified in Title 22, CAC Section 50605(c)(1) for a single person is $209.00. The home upkeep allowance specified in Title 22, CAC Section 50605(c)(2) and (3) in all other situations will be $138.00.
Update #17-03 Revised 01/24/2017

page 5-6 Chart BookMedi-Cal Charts
5.5 Historical Maintenance Needs
5.5.1 Maintenance Needs, LTC Patient Personal Needs Allowance [50603, 50605, MEM 11A-1]
Maintenance Needs Effective
7/1/88 7/1/87 7/1/86 7/1/85 7/1/84 7/1/83
1 person, when all other family members are PA or other PA
$575 $550 $534 $509 $484 $459
1 person in all other situations 575 550 534 509 484 459
2 persons 717 684 667 634 600 567
3 persons 892 850 825 784 742 709
4 persons 892 850 825 784 742 709
5 persons 1059 1009 984 934 884 834
6 persons 1200 1050 1117 1067 1009 959
7 persons 1484 1417 1384 1317 1242 1175
8 persons 1617 1542 1509 1434 1359 1284
9 persons 1742 1667 1625 1542 1467 1384
10 persons 1875 1792 1742 1659 1575 1492
Each additional person, add 13 12 12 11 10 9
1 person in LTC for entire calendar month
35 35 35 35 25 25
Upkeep of home allowance for certain LTC eligibles - 50605 (b)
1 person who had been living alone 200 192 183 154 154 154
1 person who has shared housing with persons for whom there was no legal responsibility to support
134 130 125 105 105 105
Each spouse, when both are LTC and both will return home within six months
134 130 125 105 105 105
Revised 01/24/2017 Update #17-03

Chart Book page 5-7Medi-Cal Charts
Allowance for support of disabled relative of LTC eligible - 50605 (d). Disabled relatives living alone or with persons not legally responsible for support
** ** ** ** ** **
Disabled relative living with persons legally responsible for his support
** ** ** ** ** **
** Effective 9/1/82 the amount allowed for the support of a disabled relative shall be the lesser of the amount contributed or (1) the AFDC payment level for one for the disabled relative who is living alone or with persons who have no legal responsibility for the support of the disabled relative minus the disabled relative’s net income or (2) the maintenance need level for one person when all other family members are PA or other PA for the disabled relative living with persons who have legal responsibility for the support of the disabled relative minus the disabled relative’s income.
** Effective 1/1/85
Maintenance Needs Effective
9/1/82* 2/1/83 11/1/81
7/1/81
7/1/80
7/1/79
7/1/78
7/1/77 1/1/77
1 person, when all other family members are PA or other PA
$272 $238 $275 $259 $221 $192 $192 $184
1 person in all other situations
331 309 369 336 291 253 253 240
2 persons 544 475 550 517 442 383 383 367
3 persons 544 475 550 517 442 383 383 367
4 persons 675 583 675 633 550 475 475 458
5 persons 801 692 808 758 650 567 567 542
6 persons 915 792 917 858 742 650 650 617
7 persons 1028 892 1033 967 833 725 725 692
8 persons 1128 975 1133 1058 917 800 800 758
9 persons 1328 1150 1333 1250 1083 942 942 892
10 persons 1428 1233 1433 1342 1158 1008 1008 958
Maintenance Needs Effective
7/1/88 7/1/87 7/1/86 7/1/85 7/1/84 7/1/83
Update #17-03 Revised 01/24/2017

page 5-8 Chart BookMedi-Cal Charts
Each additional person, add
7 9 9 10 8 7 7 7
1 person in LTC for entire calendar month
25 25 25 25 25 25 25 25
Upkeep of home allowance for certain LTC eligibles - 50605 (b)
1 person who had been living alone
148 128 148 139 120 104 104
1 person who has shared housing with persons for whom there was no legal responsibility to support
100 86 100 93 81 70 70
Each spouse, when both are LTC and both will return home within six months
100 86 100 93 81 70 70
Allowance for support of disabled relative of LTC eligible - 50605 (d) Disabled relatives living alone ore with persons not legally responsible for support
** 309 359 336 291 253 253
Disabled relative living with persons legally responsible for his support
** 238 275 259 221 192 192
* Effective 9/1/82 to 1/31/83 figures representative for only all ABD-MN PERSONS. Maintenance need determined by type of person in MFBU. See chart on next page.
** Effective 9/1/82 the amount allowed for the support of a disabled relative shall be the lesser of the amount contributed or (1) the AFDC payment level for one for the disabled relative who is living alone or with persons who have no legal responsibility for the support of the disabled relative minus the disabled relative’s net income or (2) the maintenance need level for one person when all other family members are PA or other PA for the disabled relative living with persons who have legal responsibility for the support of the disabled relative minus the disabled relative’s income.
Maintenance Needs Effective
9/1/82* 2/1/83 11/1/81
7/1/81
7/1/80
7/1/79
7/1/78
7/1/77 1/1/77
Revised 01/24/2017 Update #17-03

Chart Book page 5-9Medi-Cal Charts
5.5.2 Maintenance Need Chart 9/1/82 to 1/31/83 [50603,50605,MEM IIB-1]
ABD-MN Included
No. of Persons
Non-ABD-MN
AII ABD-MN 1 2 3 4 5 6 7 8 9
1 248 331
2 408 544 491
3 506 675 589 642
4 601 801 684 737 770
5 686 915 769 822 855 886
6 771 1,028 854 907 940 971 1,000
7 846 1,128 929 982 1,015 1,046 1,075 1,103
8 922 1,230 1,005 1,058 1,091 1,122 1,151 1,179 1,204
9 996 1,328 1.079 1,132 1,165 1,196 1,225 1,253 1,278 1,304
10 1,071 1,428 1,154 1,207 1,240 1,271 1,300 1,328 1,353 1,379 1,403
For MFBUs with more than 10 persons, add the appropriate maintenance need for 10 plus $7.00 for each additional person.
The maintenance need for 1 when all other persons are PA or other PA is $204.00.
The ABD-MN maintenance need for 1 when all other persons are PA or other PA is $272.00.
The maintenance need of $204 for a non-ABD-MN beneficiary when all other family members are PA recipients. This figure was computed by dividing the maintenance need for two non-ABD-MN persons ($408) in half.
If all needs (housing, food, utilities, and clothing) were provided to a beneficiary, he/she would have received $218 of in-kind income. However, if the beneficiary was a non-ABD person and all other family members were PA recipients, he/she would have had a share of cost of $14 even though he or she had no income other than income in kind.
Instead, per All County Welfare Directors Letter No. 82-46, Eligibility Workers must use one-half of the Income-in-Kind Chart value amount for a non-ABD-MN beneficiary when all other family members are PA recipients and all needs are provided.
Update #17-03 Revised 01/24/2017

page 5-10 Chart BookMedi-Cal Charts
5.6 Federal Poverty Level Programs 2016 Monthly Income Comparison Chart
100% • Qualified Medicare Beneficiary (QMB) Program
• Children Ages 6 Up to 19 Program (Pre-ACA)
• FPL Program for Aged and Disabled• Section 1931(b) for certain recipients
(Pre-ACA)
142% ACA Children Ages 1 - 6
150% Targeted Low Income Children’s Program (TLICP) (Premiums) (Pre-ACA)
108% ACA Expansion Children Ages 6 - 19 160% ACA Optional Targeted Low Income Children (OTLIC)
109% ACA Parents and Caretaker Relatives 185% Transitional Medi-Cal (TMC) (Pre-ACA)
114% ACA Parents and Caretaker Relatives not eligible for the ACA Adult Group due to enrollment in Medicare Part A or B
200% • Qualified Working Disabled Individuals
• Pregnant Women and Infants Up to Age 1 (disregard is in the 200% FPL) (Pre-ACA)
120% Specified Low Income Beneficiaries (SLMB) 208% ACA Infants Ages 0 - 1
128% Disabled Individuals in ACA Adult Group 213% ACA Pregnant Women and Infants Up to Age 1 (with 5% earned income disregard included)
133% • Children Ages 1 - 6 (Pre-ACA)• ACA Children and Expansion Children
Ages 6 - 19
250% Working Disabled Program (WDP)
135% Qualified Individual 1 (QI-1) Program 266% ACA OTLIC (Premiums)
138% • ACA Adult Group Ages 19 - 64• Full-scope coverage for ACA Pregnant
Women
322% • ACA MCAP Linked Infants • County Children’s Health Initiative
Program (CCHIP)
• Above 138% - 213% FPL = Pregnancy Related Medi-Cal• Above 213% - 322% FPL = Medi-Cal Access Program (MCAP)• Above 266% - 322% FPL = CCHIP
For applicants and recipients of the Medicare Savings Programs (MSP) including Qualified Medicare Beneficiary (QMB), Specified Low Income Beneficiary (SLMB), and Qualified Individuals 1 (QI-1), the effective date is dependent on receipt of Title II benefits as follows:
Population Affected FPL Effective Date
MSP applicants/recipients that do not receive RSDI Title II income January 25, 2016
MSP applicants/recipients that receive RSDI Title II income March 1, 2016
Revised 01/24/2017 Update #17-03

to 400%)
00% to 150% FPL)
Family Size
QI-1 Program
ACA Adults Ages 19-64 & Pregnant
Women
ACA Children Ages 1-6
TLICP (Pre-ACA)
135% 138% 142% 150%
1 1337 1367 1406 1485
2 1803 1843 1896 2003
2 Adults 1803 1843 1896 2003
3 2268 2319 2386 2520
4 2734 2795 2876 3038
5 3200 3271 3366 3555
6 3666 3747 3856 4073
7 4133 4224 4347 4592
8 4601 4703 4839 5112
9 5069 5181 5331 5632
10 5537 5660 5824 6152
11 6005 6138 6316 6672
12 6473 6616 6808 7192
Ea Add’l
+468 +479 +493 +520
Chart page 5-11Medi-Cal Charts
Revised 01/24/2017
2016 FPL CALCULATION CHART (Monthly Values)
Eligible for Advanced Premium Tax Credit (APTC) (100%
Enhanced Silver Benefits/Cost-Sharing Reduction (CSR) 94% (1
Children Ages 6-19 A&D FPL
QMB
Children Ages 6-19
ACA Expansion
ACA Parents/Care
taker Relatives
ACA Parents/Caretaker
Relatives enrolled in Medicare Part A/B SLMB
Disabled Individuals
Adult Group
Children Ages 1-6 Pre-ACA
100% 108% 109% 114% 120% 128% 133%
990 1070 1080 1129 1188 1268 1317
1335 1442 1456 1522 1602 1709 1776
1335 1442 1456 1522 1602 1709 1776
1680 1815 1832 1916 2016 2151 2235
2025 2187 2208 2309 2430 2592 2694
2370 2560 2584 2702 2844 3034 3153
2715 2933 2960 3096 3258 3476 3611
3061 3306 3337 3490 3673 3918 4071
3408 3681 3715 3885 4089 4362 4532
3755 4055 4093 4280 4505 4806 4994
4101 4429 4470 4675 4921 5250 5455
4448 4804 4848 5071 5337 5693 5916
4795 5178 5226 5466 5753 6137 6377
+347 +375 +378 +396 +416 +444 +462
Book
Update #17-03

Family Size
0%)
ACA OTLICHealthy
Kids
ACA MCAP
Infants & CCHIP
266% 300% 322% 400%
1 2634 2970 3188 3960
2 3552 4005 4299 5340
2 Adul 3552 4005 4299 5340
3 4469 5040 5410 6720
4 5387 6075 6521 8100
5 6305 7110 7632 9480
6 7222 8145 8743 10,860
7 8142 9183 9856 12,244
8 9064 10,223 10,973 13,630
9 9987 11,263 12,089 15,017
10 10,909 12,303 13,205 16,404
11 11,831 13,343 14,321 17,790
12 12,753 14,382 15,438 19,177
Ea Add +923 +1,041 +1,117 +1,387
Revised 01
page 5 Chart BookMedi-C
2016 FPL CALCULATION CHART (Monthly Values)
Eligible for Advanced Premium Tax Credit (APTC) (100% to 40
Enhanced Silver Benefits/Cost-Sharing Reduction (CSR)
87% (>150% to 200% FPL) 73% (> 200% to 250% FPL)
ACA OTLICTMC
(Pre-ACA)
Qualified WD Indiv. Infants Up to Age 1
(Pre-ACA) ACA Infants
Ages 0-1
ACA Pregnant Women & Infants
up to Age 1OTLIC (Pre-ACA)
WDP
160% 185% 200% 208% 213% 250%
1584 1832 1980 2060 2109 2475
2136 2470 2670 2777 2844 3338
ts 2136 2470 2670 2777 2844 3338
2688 3108 3360 3495 3579 4200
3240 3747 4050 4212 4314 5063
3792 4385 4740 4930 5049 5925
4344 5023 5430 5648 5783 6788
4898 5663 6122 6367 6520 7653
5452 6304 6815 7088 7258 8519
6007 6946 7509 7809 7997 9386
6562 7587 8202 8530 8735 10,253
7116 8228 8895 9251 9474 11,119
7671 8870 9589 9972 10,212 11,986
’l +555 +642 +694 +722 +739 +867
/24/2017 Update #17-03
-12al Charts

to 400%)
00% to 150% FPL)
Family Size
QI-1 rogram
ACA Adults Ages 19-64 & Pregnant
Women
ACA Children Ages 1-6
TLICP (Pre-ACA)
135% 138% 142% 150%
1 16,038 16,395 16,870 17,820
2 21,627 22,108 22,749 24,030
2 Adults 21,627 22,108 22,749 24,030
3 27,216 27,821 28,628 30,240
4 32,805 33,534 34,506 36,450
5 38,394 39,248 40,385 42,660
6 43,983 44,961 46,264 48,870
7 49,586 50,688 52,157 55,095
8 55,202 56,429 58,064 61,335
9 60,818 62,169 63,971 67,575
10 66,434 67,910 69,879 73,815
11 72,050 73,651 75,786 80,055
12 77,666 79,392 81,693 86,295
Ea Add’l +5,616 +5,741 +5,908 +6,240
Chart B page 5-13Medi-Cal Charts
Revised 01/24/2017
2016 FPL CALCULATION CHART (Annual Values)
Eligible for Advanced Premium Tax Credit (APTC) (100%
Enhanced Silver Benefits/Cost-Sharing Reduction (CSR) 94% (1
Children Ages 6-19 A&D FPL
QMB
Children Ages 6-19
ACA Expansion
ACA Parents/Care
taker Relatives
ACA Parents/Caretaker
Relatives enrolled in Medicare Part A/B SLMB
Disabled Individuals
Adult Group
Children Ages 1-6 Pre-ACA P
100% 108% 109% 114% 120% 128% 133%
11,880 12,831 12,950 13,544 14,256 15,207 15,801
16,020 17,302 17,462 18,263 19,224 20,506 21,307
16,020 17,302 17,462 18,263 19,224 20,506 21,307
20,160 21,773 21,975 22,983 24,192 25,805 26,813
24,300 26,244 26,487 27,702 29,160 31,104 32,319
28,440 30,716 31,000 32,422 34,128 36,404 37,826
32,580 35,187 35,513 37,142 39,096 41,703 43,332
36,730 39,669 40,036 41,873 44,076 47,015 48,851
40,890 44,162 44,571 46,615 49,068 52,340 54,384
45,050 48,654 49,105 51,357 54,060 57,664 59,917
49,210 53,147 53,639 56,100 59,052 62,989 65,450
53,370 57,640 58,174 60,842 64,044 68,314 70,983
57,530 62,133 62,708 65,585 69,036 73,639 76,515
+4,160 +4,493 +4,535 +4,743 +4,992 +5,325 +5,533
ook
Update #17-03

Family Size
ICHealthy
Kids
ACA MCAP Infants &
CCHIP
300% 322% 400%
1 35,640 38,254 47,520
2 48,060 51,585 64,080
2 Adul 48,060 51,585 64,080
3 60,480 64,916 80,640
4 72,900 78,246 97,200
5 85,320 91,577 113,760
6 97,740 104,908 130,320
7 110,190 118,271 146,920
8 8 122,670 131,666 163,560
9 3 135,150 145,061 180,200
10 9 147,630 158,457 196,840
11 5 160,110 171,852 213,480
12 0 172,590 185,247 230,120
Ea Add 6 +12,480 +13,396 +16,640
Compa ng back any deduction for private health coveragNote: CRevised 0
page 5 Chart BookMedi-C
2016 FPL CALCULATION CHART (Annual Values)
Eligible for Advanced Premium Tax Credit (APTC) (100% to 400%)
Enhanced Silver Benefits/Cost-Sharing Reduction (CSR)
87% (>150% to 200% FPL) 73% (> 200% to 250% FPL)
ACA OTLIC
TMC (Pre-ACA)
Qualified WD Indiv. Infants Up to Age 1
(Pre-ACA) ACA Infants
Ages 0-1
ACA Pregnant Women & Infants
up to Age 1OTLIC (Pre-ACA)
WDP ACA OTL
160% 185% 200% 208% 213% 250% 266%
19,008 21,978 23,760 24,711 25,305 29,700 31,601
25,632 29,637 32,040 33,322 34,123 40,050 42,614
ts 25,632 29,637 32,040 33,322 34,123 40,050 42,614
32,256 37,296 40,320 41,933 42,941 50,400 53,626
38,880 44,955 48,600 50,544 51,759 60,750 64,638
45,504 52,614 56,880 59,156 60,578 71,100 75,651
52,128 60,273 65,160 67,767 69,396 81,450 86,663
58,768 67,951 73,460 76,399 78,235 91,825 97,702
65,424 75,647 81,780 85,052 87,096 102,225 108,76
72,080 83,343 90,100 93,704 95,957 112,625 119,83
78,736 91,039 98,420 102,357 104,818 123,025 130,89
85,392 98,735 106,740 111,010 113,679 133,425 141,96
92,048 106,431 115,060 119,663 122,539 143,825 153,03
’l +6,656 +7,696 +8,320 +8,653 +8,861 +10,400 +11,06
re the monthly net non-exempt income of the entire family (AFDC-MN/MI MFBU with no Sneede Class Members), after addie. Only AFDC-MN/MI deductions are allowed. ontact the Medi-Cal Program Coordinator if prior FPL amounts are needed1/24/2017 Update #17-03
-14al Charts

Chart Book page 5-15Medi-Cal Charts
5.7 Targeted Low-Income Children’s Program (TLICP) and 250% Working Disabled Program (WDP)
5.7.1 Current Income Limits - Based on 250% of FPL Effective 04/01/16
Number of Persons in MFBU
CURRENT INCOME LIMITS (Effective: 04/01/16)
Birth through Age 1 Age 1 through Age 5 Age 6 through Age 19
Min. Max. Min. Max. Min. Max.
200% + $1
250% 133% + $1
150% + $1
250%** 100% + $1
150% + $1
250%**
1 $1,981 $2,475 $1,318 $1,486 $2,475 $991 $1,486 $2,475
2 $2,671 $3,338 $1,777 $2,004 $3,338 $1,336 $2,004 $3,338
3 $3,361 $4,200 $2,236 $2,521 $4,200 $1,681 $2,521 $4,200
4 $4,051 $5,063 $2,695 $3,039 $5,063 $2,026 $3,039 $5,063
5 $4,741 $5,925 $3,154 $3,556 $5,925 $2,371 $3,556 $5,925
6 $5,431 $6,788 $3,612 $4,074 $6,788 $2,716 $4,074 $6,788
7 $6,123 $7,653 $4,072 $4,593 $7,653 $3,062 $4,593 $7,653
8 $6,816 $8,519 $4,533 $5,113 $8,519 $3,409 $5,113 $8,519
9 $7,510 $9,386 $4,995 $5,633 $9,386 $3,756 $5,633 $9,386
10 $8,203 $10,253 $5,456 $6,153 $10,253 $4,101 $6,153 $10,253
ADD* +695 +867 +463 +521 +867 +348 +521 +867
* For each additional family member.
** Income limits for Monthly Premium TLICP $13 per child, $39 per family (maximum)
Update #17-03 Revised 01/24/2017

page 5-16 Chart BookMedi-Cal Charts
5.8 Healthy Kids Program
5.8.1 Current Income Limits - Based on 300% of FPL Effective 04/01/16
Family Size
300% FPL (Birth through Age 18)
1 $2,970
2 $4,005
3 $5,040
4 $6,075
5 $7,110
6 $8,145
7 $9,183
8 $10,223
9 $11,263
10 $12,303
ADD* +1,041
* For each additional family member.
Revised 01/24/2017 Update #17-03

Chart Book page 5-17Medi-Cal Charts
5.9 Medi-Cal Access Program
MCAP SUBSCRIBER CONTRIBUTION TABLE
1.5% OF ADJUSTED ANNUAL HOUSEHOLD INCOME 2016
Family Size Annual 2016
100% FPL200% FPL
+ $1 1.5% 300% FPL 1.5%
2 $16,020 $32,041 $481 $48,060 $721
3 $20,160 $40,321 $605 $60,480 $908
4 $24,300 $48,601 $730 $72,900 $1,094
5 $28,440 $56,881 $854 $85,320 $1,280
6 $32,580 $65,161 $978 $97,740 $1,467
7 $36,730 $73,461 $1,102 $110,190 $1,653
8 $40,890 $81,781 $1,227 $122,670 $1,841
9 $45,050 $90,101 $1,352 $135,150 $2,028
10 $49,210 $98,421 $1,477 $147,630 $2,215
Each Additional Family Member
+4,160 +8,321 +125 +12,480 +188
For purposes of the MCAP, a pregnant woman and her unborn are counted as a family size of two.
Note:Medi-Cal Access Program (MCAP) was formerly known as the Access for Infants and Mothers Program (AIM)
Update #17-03 Revised 01/24/2017

page 5-18 Chart BookMedi-Cal Charts
5.10 Current QMB/SLMB/QI Program Income/Property Limits
Qualified Medicare Beneficiary (QMB) Special Low Income Medicare Beneficiary (SLMB) Qualifying Individual (QI-1) Income Limits.
QMB SLMB QI-1
No. of Persons
100% of FPLEff. 4/1/16
120% of FPL Eff. 4/1/16
135% of FPL Eff. 4/1/16
1 $990 $1,188 $1,337
2 $1,335 $1,602 $1,803
3 $1,680 $2,016 $2,268
4 $2,025 $2,430 $2,734
5 $2,370 $2,844 $3,200
6 $2,715 $3,258 $3,666
7 $3,061 $3,673 $4,133
8 $3,408 $4,089 $4,601
9 $3,755 $4,505 $5,069
10 $4,101 $4,921 $5,537
*Add for each additional person
+347 +416 +468
FPL Effective Date Population
January 25, 2016 MSP applicants/recipients who are NOT receiving Retirement, Survivors, Disability, Insurance (RSDI) Title II income.
March 1, 2016 MSP applicants/recipients who ARE receiving RSDI Title II income.
Revised 01/24/2017 Update #17-03

Chart Book page 5-19Medi-Cal Charts
QMB/SLMB/QI eligible persons receive a $20 income disregard.
QMB income limit SLMB income limit QI income limit
= = =
Less than or Equal to 100% of Federal Poverty Level Less than 120% of Federal Poverty Level Less than or Equal to 135% of Federal Poverty Level
5.10.1 MSP Property Limits
Prior to 1/1/2010, the QMB/SLMB/QI property limit was twice the property limit for regular Medi-Cal.
Effective 1/1/2010, the MSP property limits are three times the SSI property limit, plus an annual percentage increase equal to the increase in Consumer Price Index.
Year Individual Couple
2016 $7,280 $10,930
2015 $7,160 $10,750
2014 $7,160 $10,750
2013 $7,080 $10,620
2012 $6,940 $10,410
2011 $6,680 $10,020
2010 $6,600 $9,910
Update #17-03 Revised 01/24/2017

page 5-20 Chart BookMedi-Cal Charts
5.11 Prior Year Medicare Savings Programs Income Limits
5.11.1 Prior Year QMB Program Income Limits
QMB Income Limits = 100% FPL
No. of Persons
Effective4/1/08 - 3/31/09
Effective4/1/09 - 3/31/11
Effective4/1/11 - 3/31/12
Effective4/1/12 - 3/31/13
Effective4/1/13 - 3/31/14
Effective4/1/14 - 3/31/15
Effective 4/1/15 - 3/31/16
1 $867 $903 $908 $931 $958 $973 $981
2 $1,167 $1,215 $1,226 $1,261 $1,293 $1,311 $1,328
3 $1,467 $1,526 $1,545 $1,591 $1,628 $1,650 $1,675
4 $1,767 $1,838 $1,863 $1,921 $1,963 $1,988 $2,021
5 $2,067 $2,150 $2,181 $2,251 $2,298 $2,326 $2,368
6 $2,367 $2,461 $2,500 $2,581 $2,633 $2,665 $2,715
7 $2,667 $2,773 $2,818 $2,911 $2,968 $3,003 $3,061
8 $2,967 $3,085 $3,136 $3,241 $3,303 $3,341 $3,408
9 $3,267 $3,396 $3,455 $3,571 $3,638 $3,680 $3,755
10 $3,567 $3,708 $3,774 $3,901 $3,973 $4,018 $4,101
* Add for each additional person
+300 +312 +319 +330 +335 +339 +347
Contact the Medi-Cal Program Coordinator if income limits for prior years are needed.
Revised 01/24/2017 Update #17-03

Chart Book page 5-21Medi-Cal Charts
5.11.2 Prior Year SLMB Program Income Limit
SLMB Income Limits = 120% FPL
No. of Persons
Effective 4/1/08 - 3/31/09
Effective4/1/09 - 3/31/11
Effective 4/1/11 - 3/31/12
Effective 4/1/11 - 3/31/13
Effective4/1/13 - 3/31/14
Effective4/1/14 - 3/31/15
Effective 4/1/15 - 3/31/16
1 $1,040 $1,083 $1,089 $1,117 $1,149 $1,167 $1,177
2 $1,400 $1,457 $1,471 $1,513 $1,551 $1,573 $1,593
3 $1,760 $1,831 $1,853 $1,909 $1,953 $1,979 $2,009
4 $2,120 $2,205 $2,235 $2,305 $2,355 $2,385 $2,425
5 $2,480 $2,579 $2,617 $2,701 $2,757 $2,791 $2,841
6 $2,840 $2,953 $2,999 $3,097 $3,159 $3,197 $3,257
7 $3,200 $3,327 $3,381 $3,493 $3,561 $3,603 $3,673
8 $3,560 $3,701 $3,763 $3,889 $3,963 $4,009 $4,089
9 $3,920 $4,075 $4,145 $4,285 $4,365 $4,415 $4,505
10 $4,280 $4,449 $4,427 $4,681 $4,767 $4,821 $4,921
* Add for each additional person
+360 +374 +382 +396 +402 +406 +416
Contact the Medi-Cal Program Coordinator if income limits for prior years are needed.
Update #17-03 Revised 01/24/2017

page 5-22 Chart BookMedi-Cal Charts
5.11.3 Prior Year QI-1 Program Income Limits
No. of Persons
QI-1 Income Limits = 135% FPL
Effective 4/1/08 - 3/31/09
Effective 4/1/09 - 3/31/11
Effective 4/1/11 - 3/31/12
Effective 4/1/12 - 3/31/13
Effective4/1/13 - 3/31/14
Effective4/1/14 - 3/31/15
Effective4/1/15 - 3/31/16
1 $1,170 $1,219 $1226 $1,257 $1,293 $1,313 $1,325
2 $1,575 $1,640 $1,655 $1,703 $1,745 $1,770 $1,793
3 $1,980 $2,060 $2,085 $2,148 $2,198 $2,227 $2,261
4 $2,385 $2,481 $2,515 $2,594 $2,650 $2,684 $2,729
5 $2,790 $2,902 $2,945 $3,039 $3,102 $3,140 $3,197
6 $3,195 $3,323 $3,374 $3,485 $3,554 $3,597 $3,665
7 $3,600 $3,743 $3,804 $3,930 $4,007 $4,054 $4,133
8 $4,005 $4,164 $4,234 $4,376 $4,459 $4,511 $4,601
9 $4,410 $4,585 $4,664 $4,821 $4,911 $4,967 $5,069
10 $4,815 $5,006 $5,094 $5,267 $5,363 $5,424 $5,537
* Add for each additional person
+405 +421 +430 +446 +453 +457 +468
Contact the Medi-Cal Program Coordinator if prior year income limits are needed.
5.11.4 QMB/SLMB Standard Allocation (SSI Standard Allocation)
SSI Standard Allocation
Effective Date Amount Effective Date Amount
2015-16 $367 2006 $301
2014 $361 2005 $290
2013 $356 2004 $282
2012 $350 2003 $277
2009-11 $337 2002 $272
Revised 01/24/2017 Update #17-03

Chart Book page 5-23Medi-Cal Charts
2008 $319 2001 $266
2007 $311
SSI Standard Allocation
Effective Date Amount Effective Date Amount
Update #17-03 Revised 01/24/2017

page 5-24 Chart BookMedi-Cal Charts
5.12 Federal Benefit Rate (FBR)
FBR Individual Couple
2017 $735 $1,103
2015-2016 $733 $1,100
2014 $721 $1082
2013 $710 $1,066
2012 $698 $1,048
2009 - 2011 $674 $1,011
2008 $637 $956
2007 $603 $934
2006 $579 $904
2005 $564 $869
2004 $552 $846
2003 $545 $829
2002 $530 $817
5.13 Tuberculosis (TB) Program Income and Resource Limits
5.13.1 TB Program Monthly Income Limits or “TB Income Standards”
Standard for Individuals (Whether Married or Unmarred)
2012 2009-11 2008 2007 2006 2005 2004 2003 2002 2001
$1,481 $1,433 $1,359 $1,331 $1,291 $1,243 $1,213 $1,189 $1,175 $1,145
Revised 01/24/2017 Update #17-03

Chart Book page 5-25Medi-Cal Charts
5.13.2 Tuberculosis (TB) Program Resource Limit
Individual $2,000
Exception: When determining a child’s property eligibility and two parents are in the home, allow the parents a $3000 property limit prior to deeming to the child. [Refer to Medi-Cal Handbook, “Property Determination and Examples,” page 37-10]
5.14 250% Working Disabled Program (WDP) Premium Amount Determination Chart
Net Countable Income* Premium Amount ForOne Eligible Individual
** Premium Amount For An Eligible CoupleFrom To
$1 $600 (Maintenance Need for One)
$20 $30
$601 $700 $25 $40
$701 $900 $50 $75
$901 $1,100 $75 $100
$1,101 $1,300 $100 $150
$1,301 $1,500 $125 $200
$1,501 $1,700 $150 $225
$1,701 $1,900 $175 $275
$1,901 $2,100 $200 $300
$2,101 250% of FPL for Two $250 $375
*This column is for an eligible child, an eligible single adult or a married individual with a spouse when the spouse is not eligible for the 250% WD Program. ** Eligibility is based on countable income of both spouses and tested against the FPL for two. [See Section 5.7 for current income limits based on 250% of FPL] Note: SOC provisions are not applicable to the 250% Working Disabled Program.
Update #17-03 Revised 01/24/2017

page 5-26 Chart BookMedi-Cal Charts
5.15 Aged & Disabled (A&D) FPL Program Chart
Income Disregard Amount - Effective date Category
100% FPL Levels
2008 2009 2011 2012 2013 2014 2015 2016
$230 01/01/01 Qualified Individual
$867 $903 $908 $931 $958 $973 $981 $990
$310
$364
$412
$357
$383
$361
$402
$372
$367
$381
$358
$372
$334
$337
05/01/09
04/01/09
01/01/09
04/01/08
01/01/08
04/01/07
01/01/07
04/01/06
04/01/05
01/01/05
04/01/04
06/01/03
04/01/03
04/01/02
QualifiedCouple
$1,167 $1,215 $1,226 $1,261 $1,293 $1,311 $1,328 $1,335
5.16 Blind FPL (FPL-B) Program Chart
Category Effective Date Disregard 100% FPL Income Limit
Individual 4/1/15 $230 $981 $1,211
Couple 5/1/09 (SSI/SSP Payment Rate) $1,751
One Individual is Blind
5/1/09 (SSI/SSP Payment Rate) $1,666
Revised 01/24/2017 Update #17-03

Chart Book page 5-27Medi-Cal Charts
5.17 Current Income In-Kind Values [50511, 50511, MEPM 10 F-1]
5.17.1 Income In-Kind Values Effective: 7/1/89
Housing
1 person $153
2 persons 206
3 persons 225
4 or more persons 236
Utilities, including Telephone
1 person $33
2 persons 38
3 persons 40
4 or more persons 41
Food
1 person $86
2 persons 182
3 persons 232
4 persons 286
5 persons 346
6 persons 401
7 persons 447
8 persons 490
9 persons 537
10 or more persons 582
Update #17-03 Revised 01/24/2017

page 5-28 Chart BookMedi-Cal Charts
Note:As of March 9, 2005, Clothing was eliminated from the definition of Income-in-Kind for the Medically Needy (MN) program and for Medi-Cal programs that follow SSI rules, including In-Kind Support and Maintenance (ISM) for Pickle programs.
Exception:Income-In-Kind for Clothing under the Section 1931(b) program remains the same.
Revised 01/24/2017 Update #17-03

Chart Book page 5-29Medi-Cal Charts
5.18 Income In-Kind: Historical Values [50509, 50511, MEM 10 F-1]
Value of Income In-Kind Effective: 7/1/77 7/1/79 7/1/80 1/1/81 *7/1/81
Housing
1 persons $78 $90 $104 $102 $111
2 persons 105 121 140 137 150
3 persons 115 132 152 149 163
4 or more persons 122 140 162 158 173
Utilities, including telephone
1 persons $17 $20 $23 $23 $25
2 persons 18 21 24 24 26
3 persons 20 23 27 26 28
4 or more persons 21 24 28 27 29
Food
1 person $43 $50 $58 $57 $62
2 persons 94 108 125 122 133
3 persons 119 137 158 155 169
4 persons 147 169 195 191 209
5 persons 177 204 236 231 252
6 persons 206 237 274 268 293
7 persons 230 265 306 299 327
8 persons 252 290 335 328 358
9 persons 275 317 366 358 391
10 or more persons 321 343 391 388 424
Clothing
1 person $14 $16 $18 $18 $20
2 persons 26 30 35 34 37
Update #17-03 Revised 01/24/2017
page 5-30 Chart BookMedi-Cal Charts
* NOTE:From September 1, 1982, to January 31, 1983, the income in-kind values for a non-ABD-MN recipient, when all other family members are PA, were as follows:
Housing — $75 Food — $67 Utilities — $13 Clothing — $19
3 persons 39 45 52 51 56
4 persons 52 60 69 68 74
5 persons 64 74 85 84 92
6 persons 77 89 103 101 110
7 persons 90 104 120 118 129
8 persons 102 117 135 132 144
9 persons 116 134 155 151 165
10 or more persons 128 147 170 166 181
Value Of Income In-Kind Effective: 3/1/86 7/1/86 7/1/87 7/1/88
Housing
1 person $128 $135 $139 $146
2 persons 174 183 188 197
3 persons 190 200 205 215
4 or more persons 201 211 216 226
Utilities, including telephone
1 person $29 $30 $31 $32
2 persons 31 33 34 36
3 persons 33 35 36 38
4 or more persons 34 36 37 39
Food
1 person $72 $76 $78 $82
2 persons 154 162 166 174
3 persons 197 207 212 222
4 persons 242 254 261 273
5 persons 293 308 316 331
Value of Income In-Kind Effective: 7/1/77 7/1/79 7/1/80 1/1/81 *7/1/81
Revised 01/24/2017 Update #17-03

Chart Book page 5-31Medi-Cal Charts
6 persons 340 357 399 383
7 persons 379 398 408 427
8 persons 415 436 447 468
9 persons 455 478 490 513
10 or more persons 493 518 531 556
Clothing
1 person $23 $24 $25 $26
2 persons 42 44 45 47
3 persons 64 67 69 72
4 persons 86 90 92 96
5 persons 107 112 115 120
6 persons 127 133 136 142
7 persons 150 158 162 170
8 persons 167 176 181 190
9 persons 192 202 207 217
10 or more persons 210 221 227 238
Value Of Income In-Kind Effective: 3/1/86 7/1/86 7/1/87 7/1/88
Update #17-03 Revised 01/24/2017

page 5-32 Chart BookMedi-Cal Charts
5.19 Social Security / Medicare Information
5.19.1 Medicare Premiums
Year Part A* InsuranceSupplemental Medical Insurance — Part B**
1/17 $413.00 $109.00
1/16 $411.00 $104.90
1/15 $407.00 $104.90
1/14 $426.00 $104.90
1/13 $441.00 $104.90
1/12 $451.00 $99.90
1/11 450.00 96.40
1/10 461.00 96.40
1/09 443.00 96.40
1/08 423.00 96.40
1/07 410.00 93.50
1/06 393.00 88.50
1/05 375.00 78.20
1/04 343.00 66.60
1/03 316.00 58.70
1/02 319.00 54.00
1/01 300.00 50.00
1/00 301.00 45.50
1/99 309.00 45.50
1/98 309.00 43.80
1/97 311.00 43.80
1/96 289.00 42.50
1/95 261.00 46.10
1/94 245.00 41.10
Revised 01/24/2017 Update #17-03

Chart Book page 5-33Medi-Cal Charts
* Part A: The monthly premium amount is paid only by those persons who are not otherwise eligible and have voluntarily enrolled. Certain individuals may qualify for a reduced premium; or, they may be required to pay a penalty charge due to delayed enrollment.
**Part B: The monthly premium amount can be more, e.g., individuals who do not apply when they first become eligible are charged a penalty for late enrollment.
Note:Some individuals with fewer than 30 quarters of coverage may buy Medicare Part A for a monthly premium of $411 for 2016. Individuals who have between 30-39 quarters may buy into Part A at a reduced rate of $226 for 2016.
Medicare Part B Premiums
The Medicare Part B Premium is based on an individual’s annual income. The Part B Premium for beneficiaries who file a Tax Return is below:
Annual Income Individual Tax Return
Annual Income Joint Tax Return
Monthly Part B Premium
$85,000 or Less $170,000 or Less $104.90
$85,000 to $107,000 $170,000 to $214,000 $146.90
$107,000 - $160,000 $214,000 - $320,000 $209.80
$160,000 - $214,000 $320,000 - $428,000 $272.70
$214,000 or More $428,000 or More $335.70
The Part B premium for individuals who are married but file a separate Tax Return from their spouse is below:
Annual Income Part B Premium
$85,000 or Less $104.90
$85,000 - $129,000 $272.70
$129,000 or More $335.70
1/93 221.00 36.60
1/92 192.00 31.80
1/91 177.00 29.90
Year Part A* InsuranceSupplemental Medical Insurance — Part B**
Update #17-03 Revised 01/24/2017

page 5-34 Chart BookMedi-Cal Charts
5.19.2 Medicare Part A and B Deductibles
2016 Deductible
Part A $1288 for the first 60 days of inpatient care
$322 per day for the 61st through 90th day
$644 per day beyond the 90th Day of the Benefit Period
$161 for skilled nursing for days 21 - 100
Note: There is no skilled nursing facility deductible assessed for the first 20 days of residency.
Part B $166
2015 Deductible
Part A $1260 for the first 60 days of inpatient care
$315 per day for the 61st through 90th day
$630 per day beyond the 90th Day of the Benefit Period
$157.50 for skilled nursing for days 21 - 100
Note: There is no skilled nursing facility deductible assessed for the first 20 days of residency.
Part B $147
2013-2014 Deductible
Part A $1184 for the first 60 days of inpatient care
$296 per day for the 61st through 90th day
$592 per day beyond the 90th Day of the Benefit Period
$148 for skilled nursing for days 21 - 100
Note: There is no skilled nursing facility deductible assessed for the first 20 days of residency.
Part B $147
Revised 01/24/2017 Update #17-03

Chart Book page 5-35Medi-Cal Charts
2012 Deductible
Part A $1156 for the first 60 days of inpatient care
$289 per day for the 61st through 90th day
$578per day beyond the 90th Day of the Benefit Period
$144.50 for skilled nursing for days 21 - 100
Note: There is no skilled nursing facility deductible assessed for the first 20 days of residency.
Part B $140
2008-2011 Deductible
Part A $1132 for the first 60 days of inpatient care
$283per day for the 61st through 90th day
$566 per day beyond the 90th Day of the Benefit Period
$141.50 for skilled nursing for days 21 - 100
Note: There is no skilled nursing facility deductible assessed for the first 20 days of residency.
Part B $162
5.19.3 Medicare Part D
Beneficiaries enrolled in Part D pay a monthly income-related adjustment amount according to their tax return:
Individual Tax Return With Income
Joint Tax Return With Income
Income-Related Adjustment Amount
$85,000 or less $170,000 or less $0.00
$85,000 to $107,000 $170,000 to $214,000 $11.60
$107,000 to $160,000 $214,000 to $320,000 $29.90
$160,000 to $214,000 $320,000 to $428,000 $48.30
$214,000 or more $428,000 or more $66.60
Update #17-03 Revised 01/24/2017

page 5-36 Chart BookMedi-Cal Charts
5.19.4 SSA Programs
Program Name Description
Title II - Social Security Retirement/Survivor/Disability Insurance (RSDI) Benefits
Social Security Retirement, Survivor and Disability Benefits based on quarters worked and earnings (FICA).
Title XVIII - Medicare Hospital Insurance (Part A)
Supplemental Medical Insurance (Part B)
Premium Health Insurance (for those who wish to purchase Part A)
Prescription Drug Coverage (Part D)
Title XVI - SSI/SSP Public Assistance based on “NEED”.
• Age• Blindness• Disability.
Program Name Description
Title XIX Medicaid (Medi-Cal) See Medi-Cal Handbook for information about the various Medi-Cal programs.
5.19.5 Social Security/Medicare Claim
1. The Medicare CLAIM NUMBER is made up of the individuals ACCOUNT NUMBER (SSN) plus a suffix. This suffix (a letter alone, or a letter plus a number) is called “CLAIMS SYMBOL”.
2. To the Social Security Administration employee, the claims symbols are part of their basic language. The claims symbols are a code:
a. To identify beneficiaries.
b. To indicate the type of Social Security benefits, if any.
c. To identify which of 7 different trust funds will pay the Medicare bill or the Social Security benefits.
Revised 01/24/2017 Update #17-03

Chart Book page 5-37Medi-Cal Charts
3. Claims Symbols for Retirement Benefits
1st Claimant
2nd Claimant
3rd Claimant
4th Claimant
5th Claimant
Wage Earner A
Wife age 62 or Older
B B3 B8 BA BD
Wife Under Age 62
B2 B5 B7 BK BL
Divorced Wife
B6 B9 BN BP BQ
Note:Wife under age 62 has an entitled child in her care.
4. Claims Symbols for Survivor Benefits
1st Claimant
2nd Claimant
3rd Claimant
4th Claimant
5th Claimant
Child (including Disabled or Student Child)
C “C” numbers are assigned by age of child.
C1 Youngest C2 Next older C3 Older than C2 C4 Through C9 CA Tenth child (not C-10) CB 11th child (not C-11) CC 12th child (not C-12), etc.
Widow Age 60 or older
D D2 D8 DD DG
Widow Remarried After Age 60
D4 D9 DA DL DN
Surviving Divorced Wife
D6 D7 DV DW DY
Mother (Widow)
E E2 E7 E8 EA
Surviving Divorced Mother
E1 E3 EB EC ED
Update #17-03 Revised 01/24/2017

page 5-38 Chart BookMedi-Cal Charts
5. Claims Symbols for Disability Benefits H — before any claims symbol listed in (C) above under “retirement benefits” tells you the person is receiving disability benefits under Social Security.
Example:HA Disabled Wage Earner HC1 Youngest child of disabled Wage Earner (HC2, etc.) HB2 “Young” wife of disabled Wage Earner with child in her care.
6. Claims symbols for persons, in relation to Health Insurance benefits (Part A, Medicare) — usually abbreviated “HIB.” Special age 72 Social Security benefits (Prouty Amendment)
Husband age 62 or Older
B1 B4 BG BH BJ
Divorced Husband
BR BT
Widower age 60 or Older
D1 D3 DH DJ DK
Widower Remarried
D5 DP DQ DR DT
Widowed Father
E4 E6 EF EG EH
Surviving Divorced Father
E5 E9 EJ EK EM
Father F1 F7
Mother F2 F8
Stepfather F3
Stepmother F4
Adopting Father
F5
Adopting Mother
F6
1st Claimant
2nd Claimant
3rd Claimant
4th Claimant
5th Claimant
Entitled to HIB (less than 3 QCs) J1
1st Claimant
2nd Claimant
3rd Claimant
4th Claimant
5th Claimant
Revised 01/24/2017 Update #17-03

Chart Book page 5-39Medi-Cal Charts
7. Claims symbols for Supplementary Medical Insurance Benefits (Part B, Medicare) abbreviated SMIB.
1st Claimant
2nd Claimant
3rd Claimant
4th Claimant
5th Claimant
Uninsured (not entitled to HIB, qualified for SMIB)
M
Uninsured (qualified for HIB, but requested only SMIB
M1
Uninsured (entitled to HIB under deemed insured provision)
T
Disabled widow W W2 W4 W9 WF
Disabled widower W1 W3 W5 WB WG
Disabled surviving divorced wife W6 W7 W8 WC WJ
8. Table of RRB (Railroad Retirement Board) Prefixes and Equivalent SSA BIC (Beneficiary Identification Code).
Entitled to HIB (3 QCs or more) J2
Not entitled to HIB (less than 3 QCs) J3
Not entitled to HIB (3 QCs or more) J4
Wife entitled to HIB (less than 3 QCs) K1 K5 K9 KD KH
Wife entitled to HIB (3 QCs or more) K2 K6 KA KE KJ
Wife not entitled to HIB (less than 3 QCs)
K3 K7 KB KF KL
Wife not entitled to HIB (3 Qcs or more)
K4 K8 KC KG KM
Black Lung miner LM
Black Lung miner's widow LW
RRB Claim Prefix Type RRB Beneficiary
A Retirement — employee or annuitant
H RR pensioner (age or disability)
MA Spouse of RR employee or annuitant (husband or wife)
1st Claimant
2nd Claimant
3rd Claimant
4th Claimant
5th Claimant
Update #17-03 Revised 01/24/2017

page 5-40 Chart BookMedi-Cal Charts
MH Spouse of RR pensioner
WCD 1 Child of RR employee
WCA 1 Child of RR annuitant
CA Disabled adult child of RR annuitant
WD Widow or widower of an RR employee
WA Widow or widower of an RR annuitant
WH Widow or widower of an RR pensioner
WCD 1 Widow of employee with a child in her care
WCA 1 Widow of annuitant with a child in her care
WCH Widow of pensioner with a child in her care
PD Parent of RR employee
PA Parent of RR annuitant
PH Parent of RR pensioner
JA Survivor joint annuitant — an annuitant who has taken a reduced amount of guarantee payments to a surviving spouse
1 WCD and WCA have two designations each.
RRB Claim Prefix Type RRB Beneficiary
Revised 01/24/2017 Update #17-03
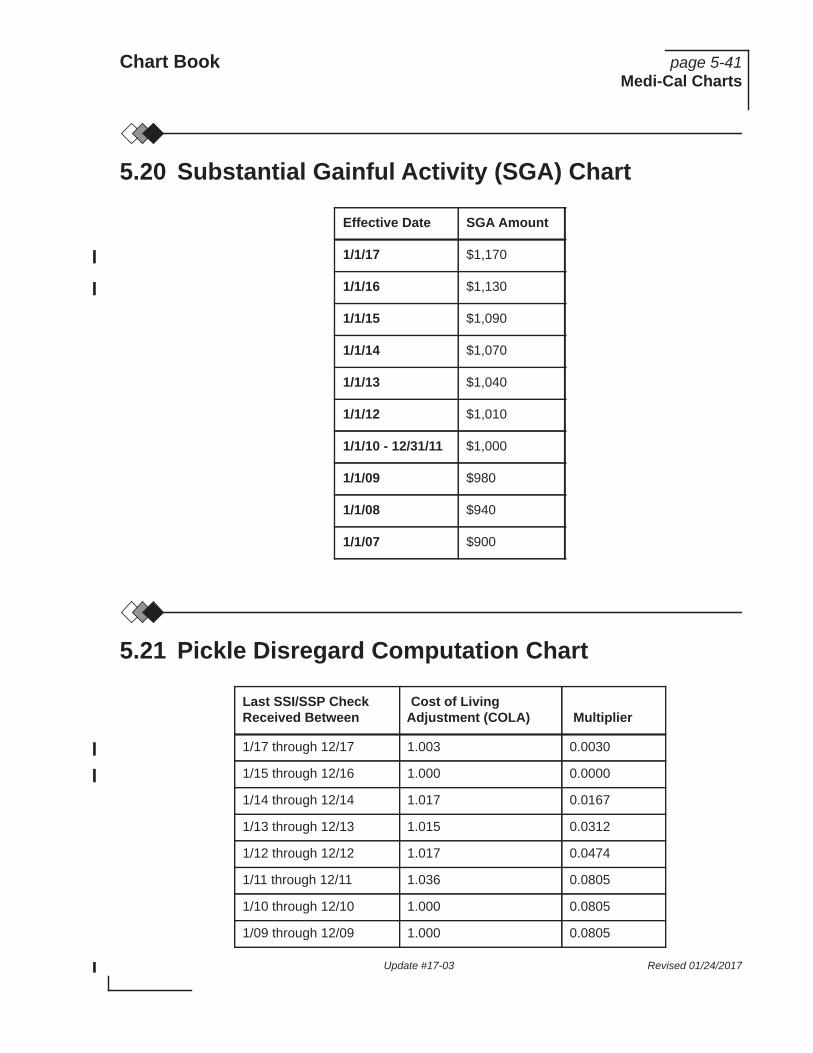
Chart Book page 5-41Medi-Cal Charts
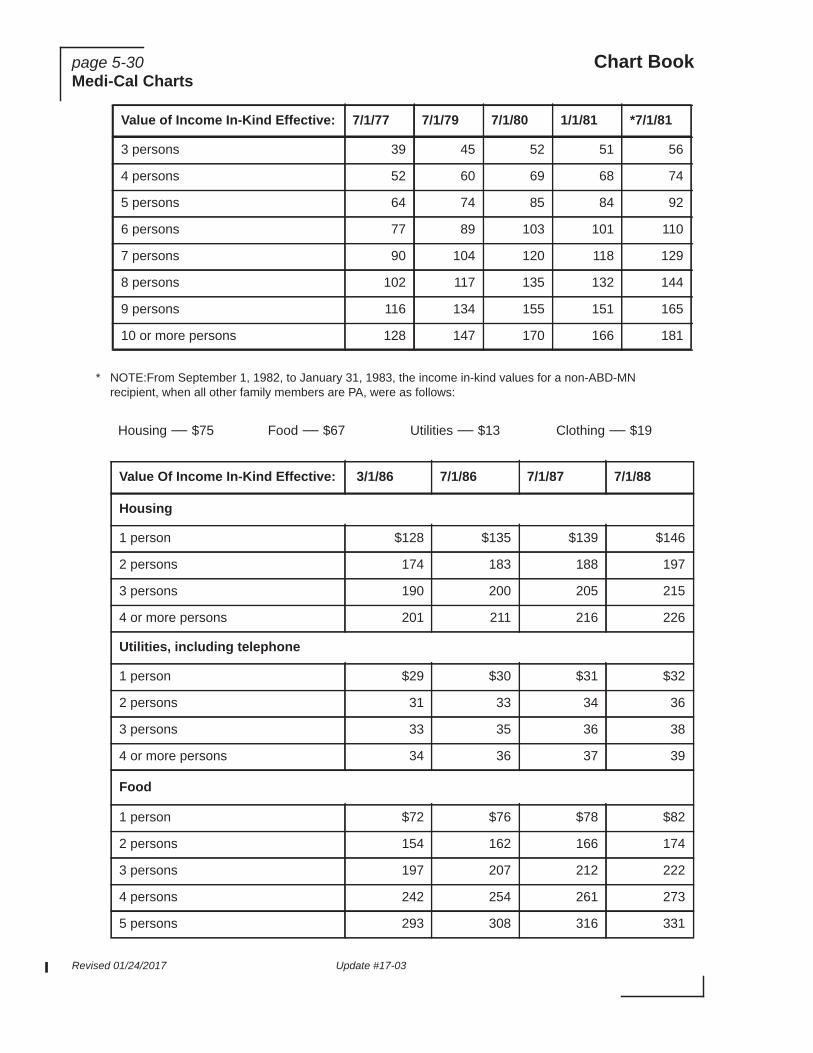
5.20 Substantial Gainful Activity (SGA) Chart
Effective Date SGA Amount
1/1/17 $1,170
1/1/16 $1,130
1/1/15 $1,090
1/1/14 $1,070
1/1/13 $1,040
1/1/12 $1,010
1/1/10 - 12/31/11 $1,000
1/1/09 $980
1/1/08 $940
1/1/07 $900
5.21 Pickle Disregard Computation Chart
Last SSI/SSP Check Received Between
Cost of Living Adjustment (COLA) Multiplier
1/17 through 12/17 1.003 0.0030
1/15 through 12/16 1.000 0.0000
1/14 through 12/14 1.017 0.0167
1/13 through 12/13 1.015 0.0312
1/12 through 12/12 1.017 0.0474
1/11 through 12/11 1.036 0.0805
1/10 through 12/10 1.000 0.0805
1/09 through 12/09 1.000 0.0805
Update #17-03 Revised 01/24/2017

page 5-42 Chart BookMedi-Cal Charts
1/08 through 12/08 1.058 0.1309
1/07 through 12/07 1.023 0.1505
1/06 through 12/06 1.033 0.1776
1/05 through 12/05 1.041 0.2100
1/04 through 12/04 1.027 0.2308
1/03 through12/03 1.021 0.2466
1/02 through 12/02 1.014 0.2570
1/01 through 12/01 1.026 0.2758
1/00 through 12/00 1.035 0.3003
1/99 through 12/99 1.024 0.3167
1/98 through 12/98 1.013 0.3255
1/97 through 12/97 1.021 0.3394
1/96 through 12/96 1.029 0.3580
1/95 through 12/95 1.026 0.3743
1/94 through 12/94 1.028 0.3913
1/93 through 12/93 1.026 0.4067
1/92 through 12/92 1.030 0.4240
1/91 through 12/91 1.037 0.4446
1/90 through 12/90 1.054 0.4730
1/89 through 12/89 1.047 0.4967
1/88 through 12/88 1.040 0.5160
1/87 through 12/87 1.042 0.5355
1/86 through 12/86 1.013 0.5415
1/85 through 12/85 1.031 0.5553
1/84 through 12/84 1.035 0.5703
7/82 through 12/83 1.035 0.5848
7/81 through 6/82 1.074 0.6135
7/80 through 6/81 1.112 0.6524
7/79 through 6/80 1.143 0.6959
7/78 through 6/79 1.099 0.7233
Last SSI/SSP Check Received Between
Cost of Living Adjustment (COLA) Multiplier
Revised 01/24/2017 Update #17-03

Chart Book page 5-43Medi-Cal Charts
Presumed Maximum Vale (PMV)
Value of One-Third Reduction (VTR)
Individual $245.00
Couple $367.66
7/77 through 6/78 1.065 0.7402
4/77 through 6/77 1.059 0.7546
Individual $265.00
Couple $387.66
Last SSI/SSP Check Received Between
Cost of Living Adjustment (COLA) Multiplier
Update #17-03 Revised 01/24/2017

page 5-44 Chart BookMedi-Cal Charts
5.22 Sneede Maintenance Need Income Levels (MNIL) and Property Limits
Sneede v KizerMaintenance Need Income Levels (MNIL) and Property Limits Effective: 1/1/90
MNIL and Property Limits
MNIL/Property Limits for Adults - No Children in Mini Budget Unit
Person Type MNIL Property
Single Parent 600 2,000
Single Parent with Unborn 750 3,000
Married Couple (two adults) 934 3,000
Married Couple with an unborn 934 3,150
Unmarried Couple-for each unmarried partner 600 2,000
MNIL/Property Limit for Mini Budget Unit (MBU) Which Contains Parent(s) and Child(ren)- May include an unborn.
Allow the full standard/non-Sneede MNIL/property limits for the MBU based upon the number of persons in the MBU.
MNIL/Property Limit for Caretaker Relative Household
Caretaker relative in same MFBU with children for whom care is provided. Each MBU receives full standard, non-Sneede MNIL/property limit based on the number of persons in each MBU. If there is a pregnant minor in MFBU, include unborn in pregnant minor's MBU.
MNIL/Property Limit for Mini Budget Unit Which Contains Only Child(ren) Living With Natural/Adoptive Parent(s). Do not include parents who are not in the MFBU. May include unborn of pregnant minor if unborn is the same MFBU.
No. of Children in MBU
One Parent Two Parents
MNIL Property MNIL Property
1 375 1,500 312 1,050
2 623 2,100 550 1,650
3 825 2,475 756 2,070
4 1,008 2,760 945 2,400
5 1,181 3,000 1,108 2,679
Revised 01/24/2017 Update #17-03

Chart Book page 5-45Medi-Cal Charts
6 1,329 3,215 1,269 2,925
7 1,481 3,413 1,420 3,150
8 1,623 3,600 1,568 3,360
9 1,764 3,780 1,615 3,436
10 1,794 3,818 1,656 3,500
11 1,822 3,850 1,694 3,554
12 1,848 3,877 1,728 3,600
13 1,872 3,900 1,759 3,640
Sneede v KizerMaintenance Need Income Levels (MNIL) and Property Limits Effective: 1/1/90
MNIL and Property Limits
Update #17-03 Revised 01/24/2017

page 5-46 Chart BookMedi-Cal Charts
5.23 Historical Section 1931(b) Charts
5.23.1 Section 1931(b) Income Limits
APPLICANTS for the Section 1931(b) program must pass the Applicant Test (based on the 100% FPL Test).
RECIPIENTS of the Section 1931(b) program must pass either the Applicant Test (based on the 100% FPL Test) or the Recipient Test (based on the CalWORKs Unemployable MAP).
SECTION 1931(b) INCOME LIMITS
Number of Persons in Section 1931(b) MFBU
Recipient Test(Effective 8/1/05)
Recipient Test (7/1/05-7/31/05)
Applicant Test(Effective 4/1/14)
Income Below: Income Below: Income At or Below:
1 $398 $414 $973 (FPL for 1)
2 $653 $680 $1,311
3 $808 $841 $1,650
4 $961 $1,000 $1,988
5 $1,094 $1,139 $2,326
6 $1,229 $1,279 $2,665
7 $1,350 $1,405 $3,003
8 $1,473 $1,533 $3,341
9 $1,591 $1,656 $3,680
10 $1,709 $1,779 $4,018
More than 10 +339
Revised 01/24/2017 Update #17-03

Chart Book page 5-47Medi-Cal Charts
5.23.2 Section 1931(b) Income-In-Kind
The Section 1931(b) income-in-kind values are the federally approved AFDC state plan values (as of 7/16/96) for In-kind income as follows.
Number of persons in Section 1931(b) MFBU Housing Utilities Food Clothing
1 161 34 90 27
2 217 39 191 52
3 237 42 244 79
4 248 44 301 105
5 248 44 363 133
6 248 44 422 157
7 248 44 470 187
8 248 44 515 209
9 248 44 565 239
10 248 44 612 261
5.23.3 Section 1931(b) Property Limits
The Section 1931(b) Property Limits are as follows:
MFBU Size Property Limit
1 Person $3,000
2 Persons $3,000
3 Persons $3,150
4 Persons $3,300
5 Persons $3,450
6 Persons $3,600
7 Persons $3,750
8 Persons $3,900
9 Persons $4,050
10 or more Persons $4,200
Update #17-03 Revised 01/24/2017
page 5-48 Chart BookMedi-Cal Charts
5.23.4 MBSAC TEST: Section 1931(b) Sneede v Kizer Prorated Income and Property Levels Effective 7/1/04-8/31/04 and 12/1/04 and Ongoing
I. MBU CONTAINS AT LEAST ONE ADULT (AND MAY ALSO INCLUDE AN UNBORN)
Person Type 1931(b) Income Property
Single Parent Single Parent with Unborn Married Couple-Two adults Married Couple with Unborn Unmarried Couple- Each Unmarried Partner
$398 $653 $653 $808 $398
$3000 $3000 $3000 $3150 $3000
II. MBU CONTAINS ADULT(S) AND CHILD(REN)
Allow the full non-Sneede Section 1931(b) income/property limits for the MBU based on the number of individuals in the MBU.
III. MBU CONTAINS A NON-PARENT CARETAKER RELATIVE OR CHILD(REN) WITH NO PARENT LIVING IN THE HOME, OR CHILD(REN) WHOSE PARENT IS PA/OTHER PA AND NOT IN THE MFBU.
Each MFBU receives the full Non-Sneede Section 1931(b) income/property limit based on the number of persons in each MBU. If there is a pregnant minor in the MFBU, include the unborn in the pregnant minor’s MBU
IV. MBU CONTAINS ONLY CHILDREN WHO LIVE WITH ONE OR BOTH PARENTS (NOT STEPPARENTS) AND THEY ARE IN THE SAME MFBU (DO NOT INCLUDE A PARENT WHO IS PA/OTHER PA AND NOT IN THE MFBU. IF THERE IS A PREGNANT MINOR IN THE MFBU, HER UNBORN IS CONSIDERED AS ANOTHER CHILD IN THE PREGNANT MINOR’S MBU)
No. of Children In MBU
ONE PARENT TWO PARENT
Prorated Income Prorated Property Prorated Income Prorated Property
1 $327 $1,500 $270 $1,050
2 539 2,100 481 1,650
3 721 2,475 657 2,070
4 876 2,760 820 2,400
5 1,025 3,000 965 2,679
6 1,158 3,215 1,105 2,925
7 1, 289 3,413 1,238 3,150
8 1,415 3,600 1,368 3,360
9 1 539 3,780 1,399 3,437
10 1,554 3,819 1,425 3,500
Revised 01/24/2017 Update #17-03

Chart Book page 5-49Medi-Cal Charts
5.23.5 100% FPL TEST: Section 1931(b) Sneede v Kizer Prorated FPL Income Standard and Property Levels Effective 4/1/14
I. MBU CONTAINS AT LEAST ONE ADULT (AND MAY ALSO INCLUDE AN UNBORN)
Person Type 1931(b) Income Property
Single Parent Single Parent with Unborn Married Couple-Two adults Married Couple with Unborn Unmarried Couple- Each Unmarried Partner
$973 $1,311 $1,311 $1,650 $973
$3,000 $3,000 $3,000 $3,150 $3,000
II. MBU CONTAINS ADULT(S) AND CHILD(REN)
Allow the full non-Sneede Section 1931(b) income/property limits for the MBU based on the number of individuals in the MBU.
III. MBU CONTAINS A NON-PARENT CARETAKER RELATIVE OR CHILD(REN) WITH NO PARENT IN THE HOME, OR CHILD WHOSE PARENT IS PA/OTHER PA OR NOT IN THE MFBU.
Each MFBU receives the full non-Sneede income/property limit based on the number of persons in the MBU. If there is a pregnant minor in the MFBU, include the unborn in the pregnant minor’s MBU
IV. MBU CONTAINS ONLY CHILDREN WHO LIVE WITH ONE OR BOTH PARENTS (NOT STEPPARENTS) AND THEY ARE IN THE SAME MFBU (DO NOT INCLUDE A PARENT WHO IS PA/OTHER PA AND NOT IN THE MFBU. IF THERE IS A PREGNANT MINOR IN THE MFBU, HER UNBORN IS CONSIDERED AS ANOTHER CHILD IN THE PREGNANT MINOR’S MBU).
No. of Children In MBU
ONE PARENT TWO PARENT
Prorated Income Prorated Property Prorated Income Prorated Property
1 $656 $1,500 $550 $1,050
2 1,100 2,100 994 1,650
3 1,491 2,475 1,396 2,070
4 1,861 2,760 1,777 2,400
5 2,221 3,000 2,145 2,679
6 2,574 3,215 2,506 2,925
7 2,924 3,413 2,863 3,150
8 3,272 3,600 3,215 3,360
9 3,617 3,780 3,564 3,437
10 3,960 3,819 3,913 3,500
Update #17-03 Revised 01/24/2017

page 5-50 Chart BookMedi-Cal Charts
5.23.6 MBSAC TEST: Section 1931(b) Income Limits (Effective 12/01/04 - 06/30/05)
SECTION 1931(b) INCOME LIMITS
Number of Persons in Section 1931(b) MFBU
Recipient Test
Income Below:
1 $ 398
2 $ 653
3 $ 808
4 $ 961
5 $1,094
6 $1,229
7 $1,350
8 $1,473
9 $1,591
10 $1,709
More than 10 $1,709
Revised 01/24/2017 Update #17-03

Chart Book page 5-51Medi-Cal Charts
5.23.7 MBSAC TEST: Section 1931(b) Income Limits (Effective 7/1/99 - 11/30/04).
SECTION 1931(b) INCOME LIMITS
Number of Persons in Section 1931(b) MFBU
MBSAC TESTEffective 7/1/99-6/30/04
MBSAC TEST(Effective 7/1/04-8/31/04)
MBSAC TEST(Effective 9/1/04-11/30/04)
Income Below: Income Below: Income Below:
1 $ 390 (MBSAC for 1) $ 398 $ 390 (MBSAC for 1)
2 $ 639 $ 653 $ 639
3 $ 793 $ 808 $ 793
4 $ 942 $ 961 $ 942
5 $1,074 $1,094 $1,074
6 $1,208 $1,229 $1,208
7 $1,327 $1,350 $1,327
8 $1,445 $1,473 $1,445
9 $1,567 $1,591 $1,567
10 $1,701* $1,709 $1,701*
*Add for each additional person
+14 $1,709 (more than 10)
+14
Update #17-03 Revised 01/24/2017
page 5-52 Chart BookMedi-Cal Charts
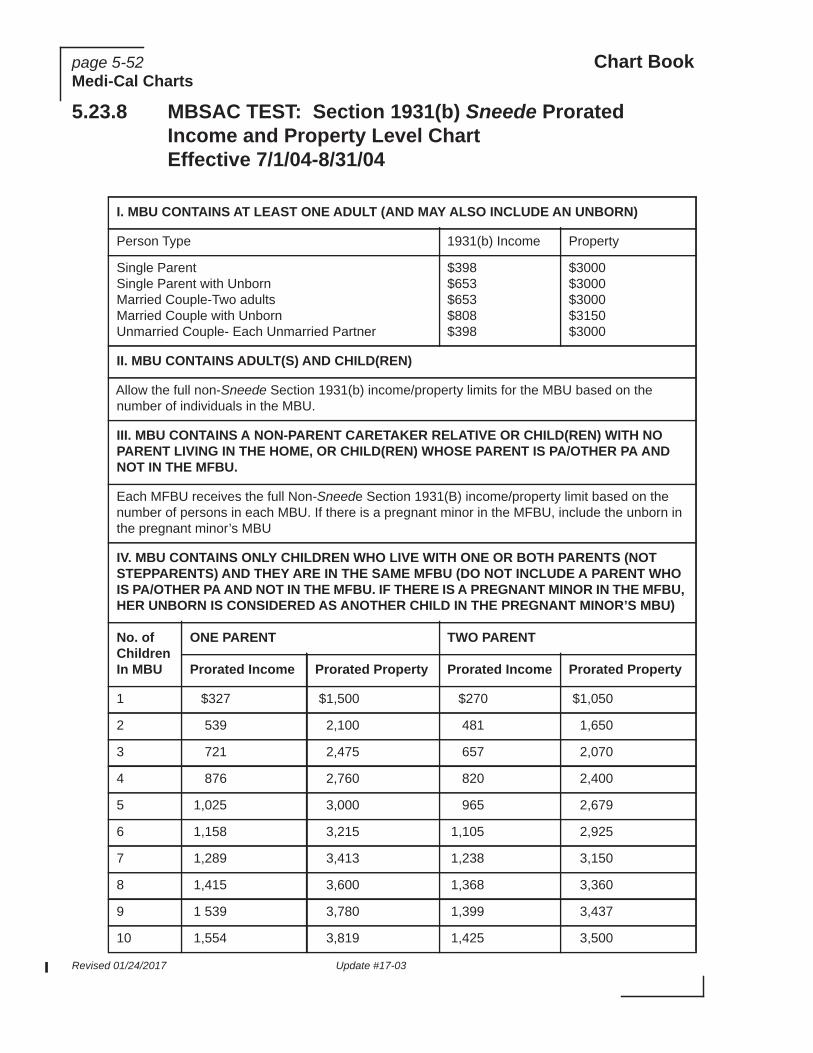
5.23.8 MBSAC TEST: Section 1931(b) Sneede Prorated Income and Property Level Chart Effective 7/1/04-8/31/04
I. MBU CONTAINS AT LEAST ONE ADULT (AND MAY ALSO INCLUDE AN UNBORN)
Person Type 1931(b) Income Property
Single Parent Single Parent with Unborn Married Couple-Two adults Married Couple with Unborn Unmarried Couple- Each Unmarried Partner
$398 $653 $653 $808 $398
$3000 $3000 $3000 $3150 $3000
II. MBU CONTAINS ADULT(S) AND CHILD(REN)
Allow the full non-Sneede Section 1931(b) income/property limits for the MBU based on the number of individuals in the MBU.
III. MBU CONTAINS A NON-PARENT CARETAKER RELATIVE OR CHILD(REN) WITH NO PARENT LIVING IN THE HOME, OR CHILD(REN) WHOSE PARENT IS PA/OTHER PA AND NOT IN THE MFBU.
Each MFBU receives the full Non-Sneede Section 1931(B) income/property limit based on the number of persons in each MBU. If there is a pregnant minor in the MFBU, include the unborn in the pregnant minor’s MBU
IV. MBU CONTAINS ONLY CHILDREN WHO LIVE WITH ONE OR BOTH PARENTS (NOT STEPPARENTS) AND THEY ARE IN THE SAME MFBU (DO NOT INCLUDE A PARENT WHO IS PA/OTHER PA AND NOT IN THE MFBU. IF THERE IS A PREGNANT MINOR IN THE MFBU, HER UNBORN IS CONSIDERED AS ANOTHER CHILD IN THE PREGNANT MINOR’S MBU)
No. of Children In MBU
ONE PARENT TWO PARENT
Prorated Income Prorated Property Prorated Income Prorated Property
1 $327 $1,500 $270 $1,050
2 539 2,100 481 1,650
3 721 2,475 657 2,070
4 876 2,760 820 2,400
5 1,025 3,000 965 2,679
6 1,158 3,215 1,105 2,925
7 1,289 3,413 1,238 3,150
8 1,415 3,600 1,368 3,360
9 1 539 3,780 1,399 3,437
10 1,554 3,819 1,425 3,500
Revised 01/24/2017 Update #17-03

Chart Book page 5-53Medi-Cal Charts
5.23.9 MBSAC TEST: Section 1931(b) Sneede Prorated Income and Property Level Chart Effective 9/1/04 - 11/30/04
I. MBU CONTAINS AT LEAST ONE ADULT (AND MAY ALSO INCLUDE AN UNBORN)
Person Type 1931(b) Income Property
Single Parent Single Parent with Unborn Married Couple-Two adults Married Couple with Unborn Unmarried Couple- Each Unmarried Partner
$390 $639 $639 $793 $390
$3000 $3000 $3000 $3150 $3000
II. MBU CONTAINS ADULT(S) AND CHILD(REN)
Allow the full non-Sneede Section 1931(b) income/property limits for the MBU based on the number of individuals in the MBU.
III. MBU CONTAINS A NON-PARENT CARETAKER RELATIVE OR CHILD(REN) WITH NO PARENT LIVING IN THE HOME, OR CHILD(REN) WHOSE PARENT IS PA/OTHER PA AND NOT IN THE MFBU.
Each MFBU receives the full Non-Sneede Section 1931(b) income/property limit based on the number of persons in each MBU. If there is a pregnant minor in the MFBU, include the unborn in the pregnant minor’s MBU
IV. MBU CONTAINS ONLY CHILDREN WHO LIVE WITH ONE OR BOTH PARENTS (NOT STEPPARENTS) AND THEY ARE IN THE SAME MFBU (DO NOT INCLUDE A PARENT WHO IS PA/OTHER PA AND NOT IN THE MFBU. IF THERE IS A PREGNANT MINOR IN THE MFBU, HER UNBORN IS CONSIDERED AS ANOTHER CHILD IN THE PREGNANT MINOR’S MBU)
No. of Children In MBU
ONE PARENT TWO PARENT
Prorated Income Prorated Property Prorated Income Prorated Property
1 $320 $1,500 $265 $1,050
2 529 2,100 471 1,650
3 707 2,475 645 2,070
4 860 2,760 806 2,400
5 1,007 3,000 948 2,679
6 1,138 3,215 1,084 2,925
7 1, 265 3,413 1,219 3,150
8 1,393 3,600 1,361 3,360
9 1 531 3,780 1,404 3,437
10 1,560 3,819 1,441 3,500
Update #17-03 Revised 01/24/2017

page 5-54 Chart BookMedi-Cal Charts
5.23.10 MBSAC TEST: Section 1931(b) Sneede Prorated Income and Property Level Charts Effective 7/1/98 - 6/30/99
Effective July 1, 1998, the current Section 1931(b) Sneede Prorated Income and Property Levels for One Parent households are as follows:
No. of Children In MBU
ONE PARENT TWO PARENT
Prorated Income Prorated Property Prorated Income Prorated Property
1 312 $1,500 259 $1,050
2 517 2,100 460 1,650
3 690 2,475 630 2,070
4 840 2,760 787 2,400
5 984 3,000 926 2,679
6 1,111 3,215 1,059 2,925
7 1,236 3,413 1,191 3,150
8 1,361 3,600 1,330 3,360
9 1,496 3,780 1,372 3,437
10 1,524 3,819 1,409 3,500
Revised 01/24/2017 Update #17-03

Chart Book page 5-55Medi-Cal Charts
5.23.11 100% FPL TEST: Section 1931(b) Sneede Prorated FPL Income Standard and Property Levels Effective 4/1/05 - 3/31/06
I. MBU CONTAINS AT LEAST ONE ADULT (AND MAY ALSO INCLUDE AN UNBORN)
Person Type 1931(b) Income Property
Single Parent Single Parent with Unborn Married Couple-Two adults Married Couple with Unborn Unmarried Couple- Each Unmarried Partner
$798 $1,070 $1,070 $1,341 $798
$3000 $3000 $3000 $3150 $3000
II. MBU CONTAINS ADULT(S) AND CHILD(REN)
Allow the full non-Sneede Section 1931(b) income/property limits for the MBU based on the number of individuals in the MBU.
III. MBU CONTAINS A NON-PARENT CARETAKER RELATIVE OR CHILD(REN) WITH NO PARENT LIVING IN THE HOME, OR CHILD(REN) WHOSE PARENT IS PA/OTHER PA AND NOT IN THE MFBU.
Each MFBU receives the full non-Sneede income/property limit based on the number of persons in the MBU. If there is a pregnant minor in the MFBU, include the unborn in the pregnant minor’s MBU
IV. MBU CONTAINS ONLY CHILDREN WHO LIVE WITH ONE OR BOTH PARENTS (NOT STEPPARENTS) AND THEY ARE IN THE SAME MFBU (DO NOT INCLUDE A PARENT WHO IS PA/OTHER PA AND NOT IN THE MFBU. IF THERE IS A PREGNANT MINOR IN THE MFBU, HER UNBORN IS CONSIDERED AS ANOTHER CHILD IN THE PREGNANT MINOR’S MBU)
No. of Children In MBU
ONE PARENT TWO PARENT
Prorated Income Prorated Property Prorated Income Prorated Property
1 $535 $1,500 $447 $1,050
2 894 2,100 807 1,650
3 1,210 2,475 1,131 2,070
4 1,508 2,760 1,438 2,400
5 1,797 3,000 1,735 2,679
6 2,082 3,215 2,025 2,925
7 2,363 3,413 2,311 3,150
8 2,641 3,600 2,595 3,360
9 2,919 3,780 2,876 3,437
10 3,196 3,819 3,156 3,500
Update #17-03 Revised 01/24/2017

page 5-56 Chart BookMedi-Cal Charts
5.23.12 100% FPL TEST: Section 1931(b) Sneede Prorated FPL Income Standard and Property Levels Effective 4/1/05 - 3/31/06
I. MBU CONTAINS AT LEAST ONE ADULT (AND MAY ALSO INCLUDE AN UNBORN)
Person Type 1931(b) Income Property
Single Parent Single Parent with Unborn Married Couple-Two adults Married Couple with Unborn Unmarried Couple- Each Unmarried Partner
$798 $1,070 $1,070 $1,341 $798
$3000 $3000 $3000 $3150 $3000
II. MBU CONTAINS ADULT(S) AND CHILD(REN)
Allow the full non-Sneede Section 1931(b) income/property limits for the MBU based on the number of individuals in the MBU.
III. MBU CONTAINS A NON-PARENT CARETAKER RELATIVE OR CHILD(REN) WITH NO PARENT LIVING IN THE HOME, OR CHILD(REN) WHOSE PARENT IS PA/OTHER PA AND NOT IN THE MFBU.
Each MFBU receives the full non-Sneede income/property limit based on the number of persons in the MBU. If there is a pregnant minor in the MFBU, include the unborn in the pregnant minor’s MBU
IV. MBU CONTAINS ONLY CHILDREN WHO LIVE WITH ONE OR BOTH PARENTS (NOT STEPPARENTS) AND THEY ARE IN THE SAME MFBU (DO NOT INCLUDE A PARENT WHO IS PA/OTHER PA AND NOT IN THE MFBU. IF THERE IS A PREGNANT MINOR IN THE MFBU, HER UNBORN IS CONSIDERED AS ANOTHER CHILD IN THE PREGNANT MINOR’S MBU)
No. of Children In MBU
ONE PARENT TWO PARENT
Prorated Income Prorated Property Prorated Income Prorated Property
1 $535 $1,500 $447 $1,050
2 894 2,100 807 1,650
3 1,210 2,475 1,131 2,070
4 1,508 2,760 1,438 2,400
5 1,797 3,000 1,735 2,679
6 2,082 3,215 2,025 2,925
7 2,363 3,413 2,311 3,150
8 2,641 3,600 2,595 3,360
9 2,919 3,780 2,876 3,437
10 3,196 3,819 3,156 3,500
Revised 01/24/2017 Update #17-03

Chart Book page 5-57Medi-Cal Charts
5.23.13 100% FPL TEST: Section 1931(b) Sneede Prorated FPL Income Standard and Property Levels Effective 4/1/04
I. MBU CONTAINS AT LEAST ONE ADULT (AND MAY ALSO INCLUDE AN UNBORN)
Person Type 1931(b) Income Property
Single Parent Single Parent with Unborn Married Couple-Two adults Married Couple with Unborn Unmarried Couple- Each Unmarried Partner
$776 $1,041 $1,041 $1,306 $776
$3000 $3000 $3000 $3150 $3000
II. MBU CONTAINS ADULT(S) AND CHILD(REN)
Allow the full non-Sneede Section 1931(b) income/property limits for the MBU based on the number of individuals in the MBU.
III. MBU CONTAINS A NON-PARENT CARETAKER RELATIVE OR CHILD(REN) WITH NO PARENT LIVING IN THE HOME, OR CHILD(REN) WHOSE PARENT IS PA/OTHER PA AND NOT IN THE MFBU.
Each MFBU receives the full non-Sneede Section 1931(B) income/property limit based on the number of persons in each MBU. If there is a pregnant minor in the MFBU, include the unborn in the pregnant minor’s MBU
IV. MBU CONTAINS ONLY CHILDREN WHO LIVE WITH ONE OR BOTH PARENTS (NOT STEPPARENTS) AND THEY ARE IN THE SAME MFBU (DO NOT INCLUDE A PARENT WHO IS PA/OTHER PA AND NOT IN THE MFBU. IF THERE IS A PREGNANT MINOR IN THE MFBU, HER UNBORN IS CONSIDERED AS ANOTHER CHILD IN THE PREGNANT MINOR’S MBU)
No. of Children In MBU
ONE PARENT TWO PARENT
Prorated Income Prorated Property Prorated Income Prorated Property
1 $521 $1,500 $436 $1,050
2 871 2,100 786 1,650
3 1,179 2,475 1,102 2,070
4 1,469 2,760 1,401 2,400
5 1,751 3,000 1,690 2,679
6 2,028 3,215 1,974 2,925
7 2,303 3,413 2,253 3,150
8 2,575 3,600 2,529 3,360
9 2,845 3,780 2,801 3,437
10 3,112 3,819 3,071 3,500
- 3/31/05
Update #17-03 Revised 01/24/2017

page 5-58 Chart BookMedi-Cal Charts
5.23.14 100% FPL TEST: Section 1931(b) Sneede Prorated FPL Income Standard and Property Levels Effective 4/1/03 - 3/31/04
I. MBU CONTAINS AT LEAST ONE ADULT (AND MAY ALSO INCLUDE AN UNBORN)
Person Type 1931(b) Income Property
Single Parent Single Parent with Unborn Married Couple-Two adults Married Couple with Unborn Unmarried Couple- Each Unmarried Partner
$749 $1,010 $1,010 $1,272 $749
$3000 $3000 $3000 $3150 $3000
II. MBU CONTAINS ADULT(S) AND CHILD(REN)
Allow the full non-Sneede Section 1931(b) income/property limits for the MBU based on the number of individuals in the MBU.
III. MBU CONTAINS A NON-PARENT CARETAKER RELATIVE OR CHILD(REN) WITH NO PARENT LIVING IN THE HOME, OR CHILD(REN) WHOSE PARENT IS PA/OTHER PA AND NOT IN THE MFBU.
Each MFBU receives the full non-Sneede Section 1931(B) income/property limit based on the number of persons in each MBU. If there is a pregnant minor in the MFBU, include the unborn in the pregnant minor’s MBU
IV. MBU CONTAINS ONLY CHILDREN WHO LIVE WITH ONE OR BOTH PARENTS (NOT STEPPARENTS) AND THEY ARE IN THE SAME MFBU (DO NOT INCLUDE A PARENT WHO IS PA/OTHER PA AND NOT IN THE MFBU. IF THERE IS A PREGNANT MINOR IN THE MFBU, HER UNBORN IS CONSIDERED AS ANOTHER CHILD IN THE PREGNANT MINOR’S MBU)
No. of Children In MBU
ONE PARENT TWO PARENT
Prorated Income Prorated Property Prorated Income Prorated Property
1 $505 $1,500 $424 $1,050
2 848 2,100 767 1,650
3 1,151 2,475 1,077 2,070
4 1,436 2,760 1,372 2,400
5 1,715 3,000 1,657 2,679
6 1,988 3,215 1,935 2,925
7 2,258 3,413 2,211 3,150
8 2,527 3,600 2,484 3,360
9 2,794 3,780 2,754 3,437
10 3,060 3,819 3,024 3,500
Revised 01/24/2017 Update #17-03

Chart Book page 5-59Medi-Cal Charts
5.23.15 100% FPL TEST: Section 1931(b) Sneede Prorated FPL Income Standard and Property Levels Effective 4/1/02
I. MBU CONTAINS AT LEAST ONE ADULT (AND MAY ALSO INCLUDE AN UNBORN)
Person Type 1931(b) Income Property
Single Parent Single Parent with Unborn Married Couple-Two adults Married Couple with Unborn Unmarried Couple- Each Unmarried Partner
$739 $995 $995 $1,252 $739
$3000 $3000 $3000 $3150 $3000
II. MBU CONTAINS ADULT(S) AND CHILD(REN)
Allow the full non-Sneede Section 1931(b) income/property limits for the MBU based on the number of individuals in the MBU.
III. MBU CONTAINS A NON-PARENT CARETAKER RELATIVE OR CHILD(REN) WITH NO PARENT LIVING IN THE HOME, OR CHILD(REN) WHOSE PARENT IS PA/OTHER PA AND NOT IN THE MFBU.
Each MFBU receives the full non-Sneede Section 1931(B) income/property limit based on the number of persons in each MBU. If there is a pregnant minor in the MFBU, include the unborn in the pregnant minor’s MBU
IV. MBU CONTAINS ONLY CHILDREN WHO LIVE WITH ONE OR BOTH PARENTS (NOT STEPPARENTS) AND THEY ARE IN THE SAME MFBU (DO NOT INCLUDE A PARENT WHO IS PA/OTHER PA AND NOT IN THE MFBU. IF THERE IS A PREGNANT MINOR IN THE MFBU, HER UNBORN IS CONSIDERED AS ANOTHER CHILD IN THE PREGNANT MINOR’S MBU)
No. of Children In MBU
ONE PARENT TWO PARENT
Prorated Income Prorated Property Prorated Income Prorated Property
1 $498 $1,500 $418 $1,050
2 835 2,100 755 1,650
3 1,132 2,475 1,059 2,070
4 1,412 2,760 1,348 2,400
5 1,685 3,000 1,628 2,679
6 1,954 3,215 1,902 2,925
7 2,219 3,413 2,172 3,150
8 2,482 3,600 2,440 3,360
9 2,745 3,780 2,705 3,437
10 3,006 3,819 2,970 3,500
- 3/31/03
Update #17-03 Revised 01/24/2017

page 5-60 Chart BookMedi-Cal Charts
5.23.16 100% FPL TEST: Section 1931(b) Sneede Prorated FPL Income Standard and Property Levels Effective 4/1/01 - 3/31/02
I. MBU CONTAINS AT LEAST ONE ADULT (AND MAY ALSO INCLUDE AN UNBORN)
Person Type 1931(b) Income Property
Single Parent Single Parent with Unborn Married Couple-Two adults Married Couple with Unborn Unmarried Couple- Each Unmarried Partner
$716 $968 $938 $1,220 $716
$3000 $3000 $3000 $3150 $3000
II. MBU CONTAINS ADULT(S) AND CHILD(REN)
Allow the full non-Sneede Section 1931(b) income/property limits for the MBU based on the number of individuals in the MBU.
III. MBU CONTAINS A NON-PARENT CARETAKER RELATIVE OR CHILD(REN) WITH NO PARENT LIVING IN THE HOME, OR CHILD(REN) WHOSE PARENT IS PA/OTHER PA AND NOT IN THE MFBU.
Each MFBU receives the full non-Sneede Section 1931(B) income/property limit based on the number of persons in each MBU. If there is a pregnant minor in the MFBU, include the unborn in the pregnant minor’s MBU
IV. MBU CONTAINS ONLY CHILDREN WHO LIVE WITH ONE OR BOTH PARENTS (NOT STEPPARENTS) AND THEY ARE IN THE SAME MFBU (DO NOT INCLUDE A PARENT WHO IS PA/OTHER PA AND NOT IN THE MFBU. IF THERE IS A PREGNANT MINOR IN THE MFBU, HER UNBORN IS CONSIDERED AS ANOTHER CHILD IN THE PREGNANT MINOR’S MBU)
No. of Children In MBU
ONE PARENT TWO PARENT
Prorated Income Prorated Property Prorated Income Prorated Property
1 $484 $1,500 $407 $1,050
2 814 2,100 736 1,650
3 1,104 2,475 1,034 2,070
4 1,379 2,760 1,317 2,400
5 1,648 3,000 1,590 2,679
6 1,908 3,215 1,859 2,925
7 2,169 3,413 2,124 3,150
8 2,427 3,600 2,385 3,360
9 2,683 3,780 2,646 3,437
10 2,940 3,819 2,905 3,500
Revised 01/24/2017 Update #17-03

Chart Book page 5-61Medi-Cal Charts
5.23.17 100% FPL TEST: Section 1931(b) Sneede Prorated FPL Income Standard and Property Levels Effective 4/1/00 - 3/31/01
I. MBU CONTAINS AT LEAST ONE ADULT (AND MAY ALSO INCLUDE AN UNBORN)
Person Type 1931(b) Income Property
Single Parent Single Parent with Unborn Married Couple-Two adults Married Couple with Unborn Unmarried Couple- Each Unmarried Partner
$696 $938 $938 $1,180 $696
$3000 $3000 $3000 $3150 $3000
II. MBU CONTAINS ADULT(S) AND CHILD(REN)
Allow the full non-Sneede Section 1931(b) income/property limits for the MBU based on the number of individuals in the MBU.
III. MBU CONTAINS A NON-PARENT CARETAKER RELATIVE OR CHILD(REN) WITH NO PARENT LIVING IN THE HOME, OR CHILD(REN) WHOSE PARENT IS PA/OTHER PA AND NOT IN THE MFBU.
Each MFBU receives the full non-Sneede Section 1931(B) income/property limit based on the number of persons in each MBU. If there is a pregnant minor in the MFBU, include the unborn in the pregnant minor’s MBU
IV. MBU CONTAINS ONLY CHILDREN WHO LIVE WITH ONE OR BOTH PARENTS (NOT STEPPARENTS) AND THEY ARE IN THE SAME MFBU (DO NOT INCLUDE A PARENT WHO IS PA/OTHER PA AND NOT IN THE MFBU. IF THERE IS A PREGNANT MINOR IN THE MFBU, HER UNBORN IS CONSIDERED AS ANOTHER CHILD IN THE PREGNANT MINOR’S MBU)
No. of Children In MBU
ONE PARENT TWO PARENT
Prorated Income Prorated Property Prorated Income Prorated Property
1 $469 $1,500 $393 $1,050
2 787 2,100 711 1,650
3 1,066 2,475 998 2,070
4 1,331 2,760 1,270 2,400
5 1,588 3,000 1,533 2,679
6 1,840 3,215 1,791 2,925
7 2,090 3,413 2,046 3,150
8 2,338 3,600 2,297 3,360
9 2,584 3,780 2,547 3,437
10 2,830 3,819 2,796 3,500
Update #17-03 Revised 01/24/2017

page 5-62 Chart BookMedi-Cal Charts
5.23.18 100% FPL TEST: Section 1931(b) Sneede Prorated Income and Property Level Chart Effective 3/1/00 - 3/31/00
I. MBU CONTAINS AT LEAST ONE ADULT (AND MAY ALSO INCLUDE AN UNBORN)
Person Type 1931(b) Income Property
Single Parent Single Parent with Unborn Married Couple-Two adults Married Couple with Unborn Unmarried Couple- Each Unmarried Partner
$687 $922 $922 $1,157 $687
$3000 $3000 $3000 $3150 $3000
II. MBU CONTAINS ADULT(S) AND CHILD(REN)
Allow the full non-Sneede Section 1931(b) income/property limits for the MBU based on the number of individuals in the MBU.
III. MBU CONTAINS A NON-PARENT CARETAKER RELATIVE OR CHILD(REN) WITH NO PARENT LIVING IN THE HOME, OR CHILD(REN) WHOSE PARENT IS PA/OTHER PA AND NOT IN THE MFBU.
Each MFBU Receives the full Non-Sneede Section 1931(B) income/property limit based on the number of persons in each MBU. If there is a pregnant minor in the MFBU, include the unborn in the pregnant minor’s MBU
IV. MBU CONTAINS ONLY CHILDREN WHO LIVE WITH ONE OR BOTH PARENTS (NOT STEPPARENTS) AND THEY ARE IN THE SAME MFBU (DO NOT INCLUDE A PARENT WHO IS PA/OTHER PA AND NOT IN THE MFBU. IF THERE IS A PREGNANT MINOR IN THE MFBU, HER UNBORN IS CONSIDERED AS ANOTHER CHILD IN THE PREGNANT MINOR’S MBU)
No. of Children In MBU
ONE PARENT TWO PARENT
Prorated Income Prorated Property Prorated Income Prorated Property
1 $461 $1,500 $386 $1,050
2 772 2,100 696 1,650
3 1,044 2,475 977 2,070
4 1,302 2,760 1,242 2,400
5 1,552 3,000 1,498 2,679
6 1798 3,215 1,749 2,925
7 2,041 3,413 1,997 3,150
8 2,282 3,600 2,242 3,360
9 2,522 3,780 2,485 3,437
10 2,761 3,819 2,727 3,500
Revised 01/24/2017 Update #17-03