5 Influence of Pore Pressure at Tunnel face - Start · Bezuijen: Influence of Pore pressures at...
8
Bezuijen: Influence of Pore pressures at Tunnel Face BAW-Workshop: Boden- und Sohl-Stabilität – Betrachtungen an der Schnittstelle zwischen Geotechnik und Wasserbau 5-1 5 Influence of Pore Pressure at Tunnel face Einfluss des Porenwasserdrucks auf die Stabilität der Tunnelbrust A. Bezuijen GeoDelft, Delft, Niederlande GeoDelft, Delft, The Netherlands ABSTRACT: The influence of groundwater flow in front of a tunnel face is investigated for a tunnel bored in saturated sand. It is shown that groundwater flow hampers the plastering of the bentonite slurry in front of a slurry shield. Consequences for the stability of the tunnel face for minimum and maximum face pressure are discussed. Groundwater flow increases the minimum allowable pressure and decreases the maximum allowable pressure and thus decreases the ‘pressure window’ that can be used by boring a tunnel. Groundwater flow also has an influence during the grouting process for a tunnel drilled in sand. The consolidation of the grout, determines the pressures on the lining. Consolidation of grout is measured in an element test. Traditional calculation methods over predict the stresses on the lining for a tunnel drilled in stiff sand (up to a factor of 5) by not taking into account the consolidation of the grout. KURZFASSUNG: Für den Bau eines Tunnels wurde der Einfluß der Grundwasserströmung auf die Stabilität der Tunnelbrust untersucht, der in gesättigtem Sand gebohrt wurde. Der Grundwasserzufluß hemmt die Filter- kuchenbildung der Bentonitsuspension vor dem Hydroschild. Die Konsequenzen für die Stabilität der Tunnel- brust bei minimalem und maximalem Stützdruck werden beschrieben. Der Grundwasserzufluß erhöht den kleinsten zulässigen Stützdruck und verringert den größten zulässigen Stützdruck. Folglich wird der Bereich des anwendbaren Stützdruckes (das ‘Stützdruckfenster') verringert, mit dem der Tunnel gebohrt werden kann. Die Grundwasserströmung hat auch Einfluß während das Einbringen des Verpressmörtels. Die Konsolidation des Verpressmörtels bestimmt den Druck auf die Tunnelwandung. In einem Laborversuch wurde die Konsoli- dierung des Verpressmörtels getestet und gemessen. Traditionelle Berechnungsmethoden überschätzen die Spannungen auf die Wandung eines in steifem Sand gebohrten Tunnels (bis zum 5-fachen Wert), wenn die Konsolidationswirkung des Verpressmörtels nicht beachtet wird.
Transcript of 5 Influence of Pore Pressure at Tunnel face - Start · Bezuijen: Influence of Pore pressures at...

Bezuijen: Influence of Pore pressures at Tunnel Face
BAW-Workshop: Boden- und Sohl-Stabilität – Betrachtungen an der Schnittstelle zwischen Geotechnik und Wasserbau5-1
5 Influence of Pore Pressure at Tunnel faceEinfluss des Porenwasserdrucks auf die Stabilität der Tunnelbrust
A. BezuijenGeoDelft, Delft, NiederlandeGeoDelft, Delft, The Netherlands
ABSTRACT: The influence of groundwater flow in front of a tunnel face is investigated for a tunnel bored insaturated sand. It is shown that groundwater flow hampers the plastering of the bentonite slurry in front of aslurry shield. Consequences for the stability of the tunnel face for minimum and maximum face pressure arediscussed. Groundwater flow increases the minimum allowable pressure and decreases the maximum allowablepressure and thus decreases the ‘pressure window’ that can be used by boring a tunnel.
Groundwater flow also has an influence during the grouting process for a tunnel drilled in sand. Theconsolidation of the grout, determines the pressures on the lining. Consolidation of grout is measured in anelement test. Traditional calculation methods over predict the stresses on the lining for a tunnel drilled in stiffsand (up to a factor of 5) by not taking into account the consolidation of the grout.
KURZFASSUNG: Für den Bau eines Tunnels wurde der Einfluß der Grundwasserströmung auf die Stabilitätder Tunnelbrust untersucht, der in gesättigtem Sand gebohrt wurde. Der Grundwasserzufluß hemmt die Filter-kuchenbildung der Bentonitsuspension vor dem Hydroschild. Die Konsequenzen für die Stabilität der Tunnel-brust bei minimalem und maximalem Stützdruck werden beschrieben. Der Grundwasserzufluß erhöht denkleinsten zulässigen Stützdruck und verringert den größten zulässigen Stützdruck. Folglich wird der Bereich desanwendbaren Stützdruckes (das ‘Stützdruckfenster') verringert, mit dem der Tunnel gebohrt werden kann.
Die Grundwasserströmung hat auch Einfluß während das Einbringen des Verpressmörtels. Die Konsolidationdes Verpressmörtels bestimmt den Druck auf die Tunnelwandung. In einem Laborversuch wurde die Konsoli-dierung des Verpressmörtels getestet und gemessen. Traditionelle Berechnungsmethoden überschätzen dieSpannungen auf die Wandung eines in steifem Sand gebohrten Tunnels (bis zum 5-fachen Wert), wenn dieKonsolidationswirkung des Verpressmörtels nicht beachtet wird.

Bezuijen: Influence of Pore pressures at Tunnel Face
BAW-Workshop: Boden- und Sohl-Stabilität – Betrachtungen an der Schnittstelle zwischen Geotechnik und Wasserbau5-2
5.1 IntroductionThe soil is incorporated in the design of tunnels bycalculating the soil pressures that are exerted on thetunnel and pressures necessary to have a stabletunnel face. Pore pressures are taken into account,but generally only a hydrostatic pressure distributionis assumed. However, the construction of a tunneluses liquids pressurized with pressures differentfrom the hydrostatic pressure: bentonite slurry at thetunnel face and grout mortar at the tail void. This willlead to excess pore pressures. Knowledge of theseexcess pore pressures appears to be of importancefor the stability of the tunnel face and the finalpressures on the lining.
This contribution describes the origin of the excesspore pressures in front of the tunnel face and alsodeals briefly with the influence of water flow in thegrout mortar on the final pressures on a tunnellining.
5.2 Pore pressures at the tunnelface
5.2.1 BackgroundShield tunneling started only recently in theNetherlands, the soft soil conditions and the highwater table in most of the country are difficultconditions for this technique. The first tunnel boredwas the 2nd Heinenoord tunnel, just south ofRotterdam. To increase the knowledge of theprocesses involved when boring a tunnel in soft soil,a measurement campaign was set-up. Part of thiscampaign was measuring the pore pressures in frontof the tunnel face.
5.2.2 MeasurementsPore pressure gauges (PPTs) were mounted in thetunnel track as a part of the measurement campaign.The total instrumentation, measuring deformationsand pressures, in one of the measurement fields isshown in Figure 5.1. The PPTs in the tunnel trackwere in use until their destruction by the TBM.Results will be discussed for a PPT located in sand.Excess pore pressures were measured in front of theTBM during drilling. However, the pore pressuredecreased until hydrostatic pressure when thedrilling stopped.
The result of one of the gauges is shown in Figure5.2. When the TBM reaches the PPTs, the passingof the cutters on the TBM can be seen in themeasured pore pressures as variations in thepressure. The pressure decrease during a stand stillcan be seen in the 3-D plot, Figure 5.3, where thepressure is presented as a function of both thedistance form the tunnel and the time. From this plotit is clear that when there is no progress in thedrilling (the distance remains constant) the pressuredecreases. The pressure starts to increase when
drilling started en the distance between the gaugeand the tunnel decreases.
Figure 5.1: Artist impression measurement field. The arrowindicates the pore pressure gauges in front ofthe TBM. Results of the gauge in the middleare used this paper. /Bakker et al. 1999/
100
110
120130
140150160
170
180190
200
pres
sure
(kPa
)
0 5 10 15 20 25 30 35distance from tunnel face (m)
measurement PPT 5calculation
PPTdistancetunnel
during drilling
during stand still
)/)/(1( 20 RxRx −+=φ φ
Figure 5.2: Measured excess pore pressure in front of aslurry shield and approximation
2,170
2,175
2,180time (hours)
0
12
34
56
distance from TBM (m)
100
120
140
160
180
200
pres
sure
(kP
a)
Figure 5.3: 3D presentation of the measured excess porepressure in front of a slurry shield
The measurements show that there is a plastering ofthe tunnel face by bentonite when drilling stops, but
Bezuijen: Influence of Pore pressures at Tunnel Face
BAW-Workshop: Boden- und Sohl-Stabilität – Betrachtungen an der Schnittstelle zwischen Geotechnik und Wasserbau5-3
that there is no plastering during drilling. The reasonfor that will be explained in the next section.
5.2.4 Pressure calculationsIf there is no plastering of the tunnel face at all, it ispossible to calculate the excess pore pressure bymeans of groundwater flow computations. The actual3D-boundary value problem reduces to a rathersimple problem if we calculate the pressure in frontof the tunnel at the tunnel axis, assuming a constantexcess pore pressure over the tunnel face, ahomogenous soil and no influence of the surface.For such a situation the solution of the piezometrichead at the tunnel axis leads to:
)/)/(1( 20 RxRx −+= φφ (5-1)
Where φ is the excess piezometric head above thehydrostatic level at a distance x from the tunnel face.φ0 the excess piezometric head at the tunnel faceand R the radius of the tunnel. This solution isplotted with the measurements in Figure 5.2 andshowed good agreement.
With this solution it is also possible to understandwhy the bentonite at the tunnel face cannot provideplastering during drilling. The hydraulic gradient infront of the tunnel can be calculated by taking thederivative of Equation (5-1). At the tunnel face (x=0)this leads to the equation with i the hydraulicgradient. The pore water velocity (vp) in front of thetunnel can be written as::
Ri /0φ= (5-2)
with i the hydraulic gradient. The pore water velocity(vp) in front of the tunnel can be written as:
nkivp = (5-3)
where k is the permeability of the sand an n theporosity. When a tunnel with a diameter of 10 m (5 mradius) is drilled in sand with a permeability of 10-4
m/s and a porosity of 40% (average values for thistunnel), the velocity of the pore water will be 2.5 10-4
m/s. Bentonite cannot penetrate faster than thevelocity of the pore water. If the drilling advanceswith 1 mm/s, this means that the drilling goes fasterthan the bentonite penetrates. Bentonite willpenetrate, but every time a cutter of the rotor passes,it will take away all bentonite and there is nopossibility to form a filter cake.
This means that the excess pore pressure measuredis not caused because the bentonite does not plasterwell enough. It is caused because drilling goes fasterthan bentonite penetration into the sand for thistunnel.
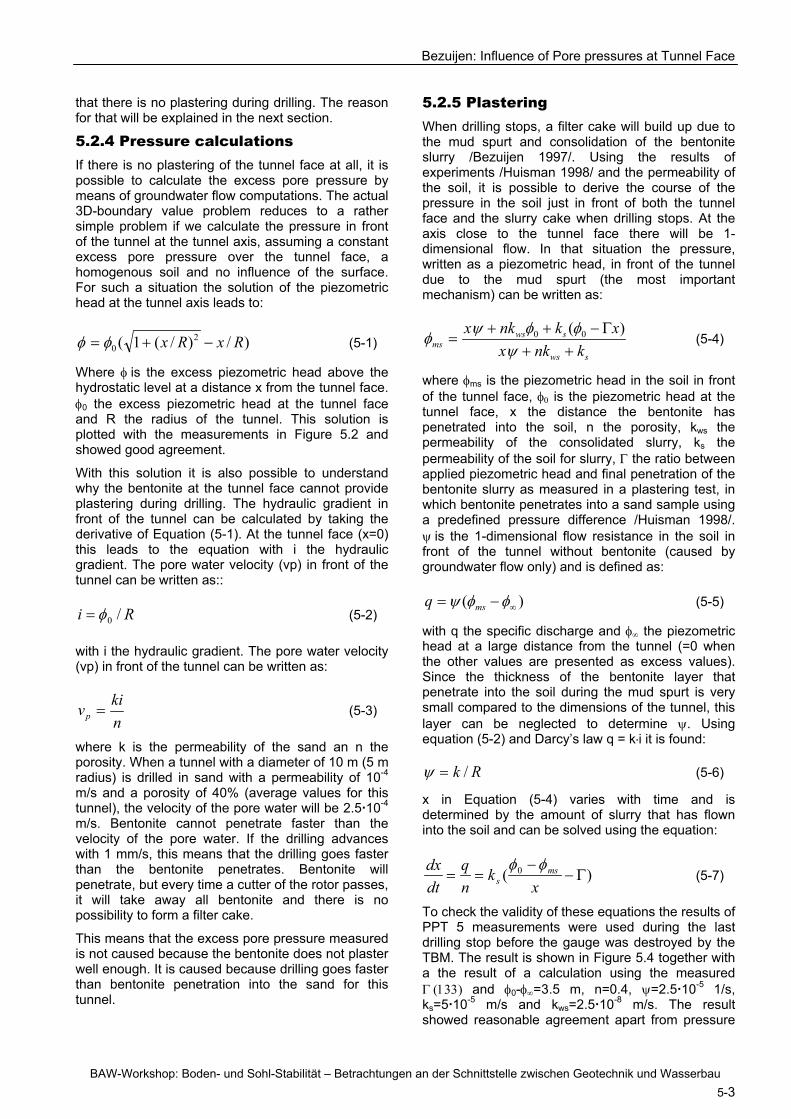
5.2.5 PlasteringWhen drilling stops, a filter cake will build up due tothe mud spurt and consolidation of the bentoniteslurry /Bezuijen 1997/. Using the results ofexperiments /Huisman 1998/ and the permeability ofthe soil, it is possible to derive the course of thepressure in the soil just in front of both the tunnelface and the slurry cake when drilling stops. At theaxis close to the tunnel face there will be 1-dimensional flow. In that situation the pressure,written as a piezometric head, in front of the tunneldue to the mud spurt (the most importantmechanism) can be written as:
sws
swsms knkx
xknkx++
Γ−++=
ψφφψφ )( 00 (5-4)
where φms is the piezometric head in the soil in frontof the tunnel face, φ0 is the piezometric head at thetunnel face, x the distance the bentonite haspenetrated into the soil, n the porosity, kws thepermeability of the consolidated slurry, ks thepermeability of the soil for slurry, Γ the ratio betweenapplied piezometric head and final penetration of thebentonite slurry as measured in a plastering test, inwhich bentonite penetrates into a sand sample usinga predefined pressure difference /Huisman 1998/.ψ is the 1-dimensional flow resistance in the soil infront of the tunnel without bentonite (caused bygroundwater flow only) and is defined as:
)( ∞−= φφψ msq (5-5)
with q the specific discharge and φ∞ the piezometrichead at a large distance from the tunnel (=0 whenthe other values are presented as excess values).Since the thickness of the bentonite layer thatpenetrate into the soil during the mud spurt is verysmall compared to the dimensions of the tunnel, thislayer can be neglected to determine ψ. Usingequation (5-2) and Darcy’s law q = k i it is found:
Rk /=ψ (5-6)
x in Equation (5-4) varies with time and isdetermined by the amount of slurry that has flowninto the soil and can be solved using the equation:
)( 0 Γ−−
==x
knq
dtdx ms
sφφ
(5-7)
To check the validity of these equations the results ofPPT 5 measurements were used during the lastdrilling stop before the gauge was destroyed by theTBM. The result is shown in Figure 5.4 together witha the result of a calculation using the measuredΓ (133) and φ0-φ∞=3.5 m, n=0.4, ψ=2.5 10-5 1/s,ks=5 10-5 m/s and kws=2.5 10-8 m/s. The resultshowed reasonable agreement apart from pressure

Bezuijen: Influence of Pore pressures at Tunnel Face
BAW-Workshop: Boden- und Sohl-Stabilität – Betrachtungen an der Schnittstelle zwischen Geotechnik und Wasserbau5-4
peaks that are present in the measured signal,probably because the rotor is still turning. Analysinglaboratory results /Huisman 1998/ found that betteragreement between measurements and calculationscould be obtained if also the blocking of the pores bybentonite particles is taken into account by anempirical blocking factor. These field data do notclearly prove the need for such a factor.
120
130
140
150
160
170
180
Pres
sure
(kPa
)
0 100 200 300 400 500
time (s)
PPT 5press. calc
Figure 5.4: Measured and calculated pressure in the soil infront of a tunnel face during a stop in the drillingwhen a filter cake is built
5.3 Consequences for stabilityCalculation methods for the stability of the tunnelface normally do not take into account the influenceof excess pore pressure on the stability. It isgenerally assumed that the pressure at the tunnelface is directly applied to the grains, which meansthat implicitly a perfect plastering is assumed. Usingthe wedge shape failure mechanism as suggestedby /Horn 1961/, /Anagnostou & Kovári 1994/ and/Jancsecz & Steiner 1994/, the influence of theexcess pore water can be explained, see Figure 5.5.The figure shows a 3-dimensional plot of the failuresurface and two 2-dimensional cross-sections. In theleft 2-dimensional cross-section the situation asassumed in the various calculation methods ispresented, the cross-section at the right presents thesituation with excess pore pressures in the sand.Stability is obtained because the tunnel facepressure supports the triangle column ABCDEF.
It is clear that this support is less effective in thesituation with excess pore pressure. As indicated inthe figure, the net force to support the triangle isless. On the other hand, the excess pore pressurewill also create a vertical gradient over the blockCDEFGHIJ resulting in a reduction of the force fromthis block on the triangle.
To investigate the influence of the excess porepressure on the stability, the analytical calculationmethods as described by /Anagnostou & Kovári1994/ and /Jancsecz & Steiner 1994/ has beenadapted by /Broere 2000/ and as described in/CUR/COB 2000/. Both models showed comparableresults, a significant increase in the minimum
allowable tunnel face pressure to achieve a stablefront.
Numerical calculations /Bezuijen et al. 2001/ haveconfirmed the results of these analytical calculations.
5.4 Consequences for max.pressure
The section above has dealt with the consequencesfor the face stability at minimum pressure. However,depending on the situation it is possible that theexcess pore pressure influence the maximumallowable drilling pressure. An example of such asituation is discussed below.
In view of the excess pore pressures measured atthe 2nd Heinenoord tunnel it was decided todetermine the possible risks of these excess porepressures for another Dutch tunnelling project. Thehypothesis that there might be a large risk involvedarises from the geohydrological conditions in thispolder area of Holland: relatively high piezometriclevels compared to a low surface level. Calculationswere made to check this in the design phase for alarge tunnel project (14.9 m diameter) crossing adeep polder (Surface level = SL – 5 m; groundwaterhead average = SL – 3.5 m, maximum = SL – 3 m).The depth of the tunnel is shown in Figure 5.6. In thenormal situation the weight of the (semi)confining topsoil layer, consisting of only 7 m of peat and softclay, just equals the upward forces from thegroundwater underneath. A surplus of waterpressure can disturb this vulnerable equilibrium state(bursting of the top layer).
The minimum slurry pressures, which are needed fora stable tunnel face during drilling were for thissituation calculated using the analytical model of/Broere 2000/. As minimum excess pore pressure infront of the cake a value of 28.3 kPa was determined(2.83 m surplus water head).
The slurry pressure can only be transmitted to thegroundwater in the period that the slurry cake is cutfrom the soil face by the rotating cutting wheel of theTBM. As argued before, there will be no cakeformation during drilling and drilling of one ring takesbetween 0.5 and 1.5 hours. However, the waterpressure will not adapt directly to the slurry pressureduring drilling due to the time dependent dampingeffect in the groundwater aquifer caused by theelastic storage capacity.
The groundwater effects just below the(semi)confining top were calculated with the finitedifference groundwater program MODFLOW. The10 5 km2 axial symmetrical model was multilayered(13 anisotropic model layers for the aquifer) and theinput was: flow resistance top aquifer c= 10000 days,total transmissivity aquifer kD = 1600 m2/day, storagecapacity S = 1 10-3 [-], anisotropy factor kh/kv = 3.

Bezuijen: Influence of Pore pressures at Tunnel Face
BAW-Workshop: Boden- und Sohl-Stabilität – Betrachtungen an der Schnittstelle zwischen Geotechnik und Wasserbau5-5
Figure 5.6: Geotechnical profile tunnel in polder
The calculated surplus water pressure depended onthe duration of the drilling period as shown in Figure5.7. The calculated extra water head below theconfining layer is 1.05 m. The calculation results ledto the conclusion that the stated hypothesisconcerning bursting risk is true. Measures toovercome problems, e.g. by monitoring andadaptation of the drilling procedure or evenhydrological solutions must be considered in thissituation.
0510152025303540
0 0.5 1 1.5 2duration of drilling period [hrs]
riseofwaterpressurebelowconfining
layerrelativetopressureinfrontof
TBM
axis[%]
Figure 5.7: Calculated pressure build up when drillingstarts
5.5 Pore pressures and grouting5.5.1 DescriptionGrouting of the tail void is a critical process duringthe boring of a tunnel. It determines the loading onthe lining of the tunnel and on the soil around thetunnel. Changing the grouting procedure can makethe difference between a problematic and asuccessful project. Grout pressures to be applied arepart of the regular design calculations for a tunnelproject. Calculations are based on the stressdistribution in the soil before the tunnelling starts,see for example Figure 5.8.
A
B
C
D E
F
G
HI
J
force on wedgeby tunnel facepressure
tunnelface
failure surface according to Jancsecz
tunnel tunnel
force by tunnelface pressure
excess pore pressureexcess pore pressure
force by excess pore pressureon diagonal of triangle
P P P
nettoeffectiveforceon wedge
X
Area with excess pore pressure is smallerthan the wedge. Approx. Jancsecz is valid
force by tunnelface pressure
Area with excess pore pressure is largerthan the wedge. Jancsecz has to be adapted
Figure 5.5: Sketch, influence of pore pressure on stability tunnel face. What is mentioned about the approach of Janceczis also valid for the other “wedge shaped solutions” mentioned in the text

Bezuijen: Influence of Pore pressures at Tunnel Face
BAW-Workshop: Boden- und Sohl-Stabilität – Betrachtungen an der Schnittstelle zwischen Geotechnik und Wasserbau5-6
Earth pressure
Water pressure
Earth & water pressure
Soil reaction by dead weight
Water pressure
Soil reactiong1
4545
Re
R0
Ri
0
0
Figure 5.8: Conventional lining design method in Japan(from Hashimoto et al.2004)
However, it was found that for a tunnel in sand themeasured pressures around the lining at some ringsfrom the TBM are close to the pore pressure /Bezui-jen et al. 2003/ and furthermore that the measuredloading on the tunnel in sand is much lower thancalculated, see Figure 5.9 /Hashimoto et al. 2004/.
40 50 60 70 80 90 1000
20
40
60
80
Coefficient of soil reaction k(kN/m 3)
Bendingmomentatcrown(kNm/ring)
Observation
Original design
effective stress condition=0.35=0.4
=0.5=0.6
Coefficient of soil reaction (MN/m3)
λλ λ
λ
Figure 5.9: Discrepancy between design and calculation.The point to which the arrow points is theoriginal design for a tunnel in sand. Changingof parameters does not result in a better fit
To understand this behaviour it is necessary to lookmore into detail into the properties of the groutmortar. This mortar is injected as a liquid. As long asit is a liquid there will be no direct interactionbetween de soil and the tunnel lining. The averagegrout pressure will be determined by the pore
pressure plus the grain stresses and the pressuredistribution in the grout by the properties of the groutand the weight of the lining /Bezuijen et al. 2004/.
Due to the excess pore pressure in the grout it willconsolidate and looses its water to the soil aroundthe tunnel. The speed of consolidation depends onthe permeability of the grout in case the tunnel isbored in sand but on the permeability of the subsoilfor a tunnel bored in less permeable subsoil as clay.This consolidation leads to a volume reduction of thegrout and therefore also to a reduction of theeffective stresses in the soil. A sandy soil will reactvery stiff to unloading and therefore a small reductionof the grout volume (a reduction of 5 to 10 % of thegrout volume was measured in consolidation tests),leads to a considerable reduction of the effectivestresses in the sand and thus also to a reduction ofthe loading on the tunnel.
5.5.2 Measurements5.5.2.1 Laboratory measurements
It is difficult to measure the consolidation of grout ina traditional oedometer test, because theconsolidation is fast compared to the consolidation ofclay or peat. Furthermore it is possible that there willbe hardening of the grout during the consolidationprocess. Therefore consolidation experiments wereperformed in a cylindrical cell with a diameter of 0.3m in which a grout layer was made of 0.2 m,comparable to the average thickness of a grout layerin the tail void for tunnels with diameters in the rangeof 6 to 11 m.
The test set-up is shown in Figure 5.10 and Figure5.11. The grout sample is loaded with air pressure tothe desired pressure. The test measures theconsolidation properties of the grout assumingrelatively permeable subsoil and consolidation in onedirection (water can flow into the soil not to the liningof the tunnel). The flow resistance of the sand ismuch lower than that of the grout. After severalminutes of consolidation the sample was unloadedand the shear strength of the grout was measured atdifferent locations in the grout.
An example of results of such a test is shown inFigure 5.12 and Figure 5.13. Figure 5.12 shows theamount of expelled pore water as a function of timeand the applied pressure. In this test a pressure of300 kPa was applied. Pressure was relieved severaltimes to be able to take the vane tests. Figure 5.13shows the measured shear strength as a function ofdepth after for different times of applied pressure. Inthis test it was focussed on the lower values of theshear strength. Therefore only shear strengths up to6 kPa were measured and presented in the plot.
The type of grout tested here was tested before atatmospheric pressure /Bezuijen et al. 2002/. In thattest it appeared that the measured shear strengthremained more or less constant until 5.5 hours andafter that time the hardening of the grout started.

Bezuijen: Influence of Pore pressures at Tunnel Face
BAW-Workshop: Boden- und Sohl-Stabilität – Betrachtungen an der Schnittstelle zwischen Geotechnik und Wasserbau5-7
Comparing the result from the test at atmosphericpressure with the results of the tests at 1 - 3 bar overpressure it became clear that the increase instrength in the over pressure case is caused byconsolidation of the grout and not by the hardeningof the grout. To understand the grout properties justafter injection in the tail void it is therefore necessaryto understand consolidation. If the grout layer isconsolidated, it will have certain strength to act as afoundation for the tunnel lining, even beforehardening of the grout commences. If it is notconsolidated it is possible that the shear strength istoo low to counterbalance the buoyancy forces of thetunnel. Another important consequence ofconsolidation is an increase of flow resistance, whichdirectly affects the pressure distribution behind theTBM when drilling.
Consolidation of grout, sometimes called bleeding,cannot be described by linear consolidation theory. Itcan be approximated assuming it behaves as agrain-water mixture with little strength until the wateris expelled from the grout and there is an effectivestress between the grains. A description is presentedin /Bezuijen & Talmon 2003/.
5.5.1.2 Field tests
Grout pressures during injection and after injectionwere measured during tunnel projects in the
Netherlands. Characteristic results are shown inFigure 5.14.
200
225
250
275
300
325
350
375
400
425
450
grou
tpre
ssur
e(k
Pa)
12:00:00 12:30:00 13:00:00 13:30:00 14:00:00
time
botleksophia
boring
boringSophia
stand still
Figure 5.14: Grout pressure measured at the Botlek Railtunnel and the Sophia Rail Tunnel. Data isshifted so that drilling stops at the same point(first ring after the instruments came out ofthe lining)
The grout pressure increases during drilling anddecreases to values that are close to the porepressure of water during stand still due toconsolidation of the grout and decrease of theeffective stress due to unloading of the soil. Thepressure distribution around the tunnel, measured onthe lining appears to increase linearly with depth.
d
sand
grout
watercollection
air pressure
plate
loadcell
valve
Figure 5.10: Measurement principle Figure 5.11: Experimental setup
-2
0
2
4
6
8
10
12
Vol
.los
s(%
)
0
100
200
300
400
500
pres
sure
(kPa
)
0 100 200 300time (min)
Figure 5.12: Test result: volume loss as a functionof time and applied pressure
0 2 4 6strength (kPa)
0
2
4
6
8
10
12
14
16
18
20
heig
ht(c
m)
10 min20 min30 min
Figure 5.13: Strength development asmeasured with a vane
Bezuijen: Influence of Pore pressures at Tunnel Face
BAW-Workshop: Boden- und Sohl-Stabilität – Betrachtungen an der Schnittstelle zwischen Geotechnik und Wasserbau5-8
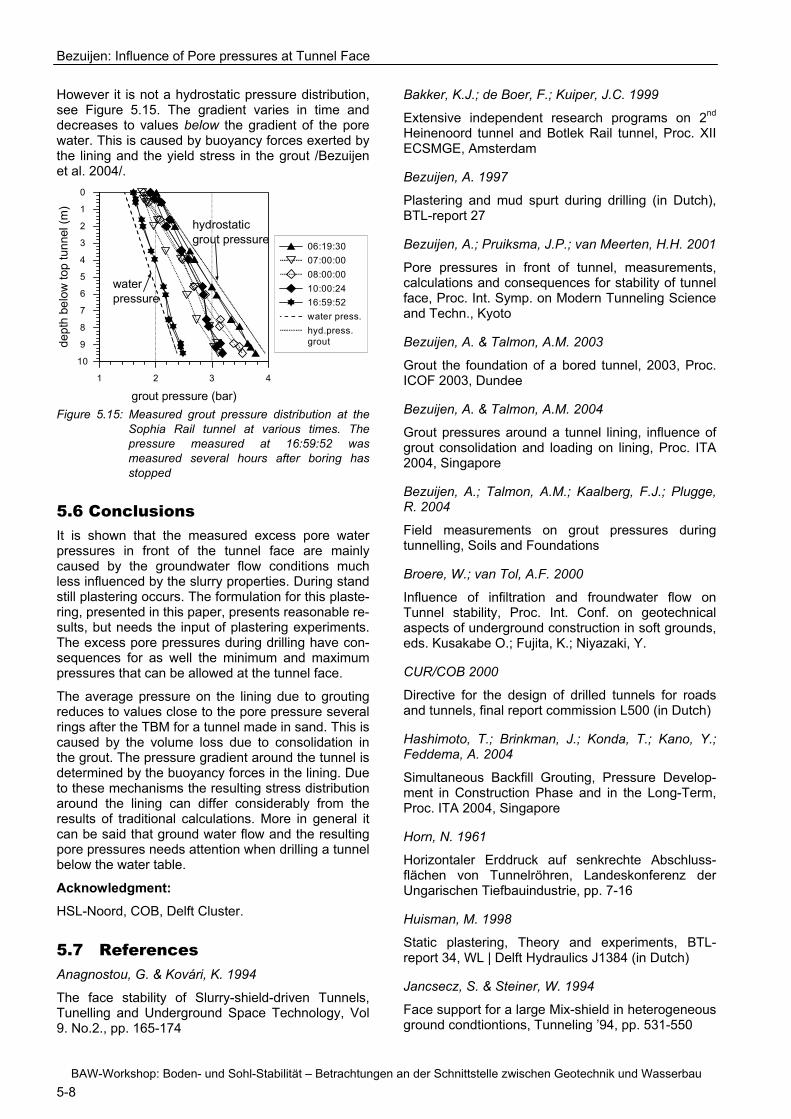
However it is not a hydrostatic pressure distribution,see Figure 5.15. The gradient varies in time anddecreases to values below the gradient of the porewater. This is caused by buoyancy forces exerted bythe lining and the yield stress in the grout /Bezuijenet al. 2004/.
1 2 3 4
grout pressure (bar)
10
9
8
7
6
5
4
3
2
1
0
dept
hbe
low
top
tunn
el(m
)
06:19:3007:00:0008:00:0010:00:2416:59:52water press.hyd.press.grout
waterpressure
hydrostaticgrout pressure
Figure 5.15: Measured grout pressure distribution at theSophia Rail tunnel at various times. Thepressure measured at 16:59:52 wasmeasured several hours after boring hasstopped
5.6 ConclusionsIt is shown that the measured excess pore waterpressures in front of the tunnel face are mainlycaused by the groundwater flow conditions muchless influenced by the slurry properties. During standstill plastering occurs. The formulation for this plaste-ring, presented in this paper, presents reasonable re-sults, but needs the input of plastering experiments.The excess pore pressures during drilling have con-sequences for as well the minimum and maximumpressures that can be allowed at the tunnel face.
The average pressure on the lining due to groutingreduces to values close to the pore pressure severalrings after the TBM for a tunnel made in sand. This iscaused by the volume loss due to consolidation inthe grout. The pressure gradient around the tunnel isdetermined by the buoyancy forces in the lining. Dueto these mechanisms the resulting stress distributionaround the lining can differ considerably from theresults of traditional calculations. More in general itcan be said that ground water flow and the resultingpore pressures needs attention when drilling a tunnelbelow the water table.
Acknowledgment:
HSL-Noord, COB, Delft Cluster.
5.7 ReferencesAnagnostou, G. & Kovári, K. 1994
The face stability of Slurry-shield-driven Tunnels,Tunelling and Underground Space Technology, Vol9. No.2., pp. 165-174
Bakker, K.J.; de Boer, F.; Kuiper, J.C. 1999
Extensive independent research programs on 2nd
Heinenoord tunnel and Botlek Rail tunnel, Proc. XIIECSMGE, Amsterdam
Bezuijen, A. 1997
Plastering and mud spurt during drilling (in Dutch),BTL-report 27
Bezuijen, A.; Pruiksma, J.P.; van Meerten, H.H. 2001
Pore pressures in front of tunnel, measurements,calculations and consequences for stability of tunnelface, Proc. Int. Symp. on Modern Tunneling Scienceand Techn., Kyoto
Bezuijen, A. & Talmon, A.M. 2003
Grout the foundation of a bored tunnel, 2003, Proc.ICOF 2003, Dundee
Bezuijen, A. & Talmon, A.M. 2004
Grout pressures around a tunnel lining, influence ofgrout consolidation and loading on lining, Proc. ITA2004, Singapore
Bezuijen, A.; Talmon, A.M.; Kaalberg, F.J.; Plugge,R. 2004
Field measurements on grout pressures duringtunnelling, Soils and Foundations
Broere, W.; van Tol, A.F. 2000
Influence of infiltration and froundwater flow onTunnel stability, Proc. Int. Conf. on geotechnicalaspects of underground construction in soft grounds,eds. Kusakabe O.; Fujita, K.; Niyazaki, Y.
CUR/COB 2000
Directive for the design of drilled tunnels for roadsand tunnels, final report commission L500 (in Dutch)
Hashimoto, T.; Brinkman, J.; Konda, T.; Kano, Y.;Feddema, A. 2004
Simultaneous Backfill Grouting, Pressure Develop-ment in Construction Phase and in the Long-Term,Proc. ITA 2004, Singapore
Horn, N. 1961
Horizontaler Erddruck auf senkrechte Abschluss-flächen von Tunnelröhren, Landeskonferenz derUngarischen Tiefbauindustrie, pp. 7-16
Huisman, M. 1998
Static plastering, Theory and experiments, BTL-report 34, WL | Delft Hydraulics J1384 (in Dutch)
Jancsecz, S. & Steiner, W. 1994
Face support for a large Mix-shield in heterogeneousground condtiontions, Tunneling ’94, pp. 531-550