5 Improving real-time deformation monitoring … real-time deformation monitoring quality ... Single...
34
Improving real-time deformation monitoring quality by network RTK Vincent LUI Leica Geosystems Limited 4 th Feb 2010 - Workshop on the Hong Kong Satellites Positioning Reference Station Data Service Application
Transcript of 5 Improving real-time deformation monitoring … real-time deformation monitoring quality ... Single...

Improving real-time deformation monitoring quality by network RTK Vincent LUI
Leica Geosystems Limited
4th Feb 2010 - Workshop on the Hong Kong Satellites Positioning Reference Station Data Service Application

2
We are living in a dynamic world, to protect our life, property and infrastructures, we need continuously monitoring
Landslide (Hong Kong)
Rail settlement
Bridge vibration &
health monitoring
EarthquakeWater dam stability
High rise building
Open pit mine

3
Conventional surveying methods for monitoringX, Y, Z
X, Y, Z
X, Y, Z
X, Y, Z
X, Y, Z
High precision Total StationReflective prism sit on monitoring object
Precise Leveling using optical or digital level with invar staffto measure height value of settlement ground point
(A)
(B)
• Line of sight problem
• Labor intensive
• High long term cost
• Time consuming
• Only Small area coverage
• Non-automatic, low efficiency
4
Solution: Applying GNSS RTK in monitoring(Conventional single baseline RTK approach)
Baseline VectorBaseline VectorBAA
Time (0)
Ambiguity
InitialPhase Measurement
at Time (0)
Ambiguity
Time (1)
MeasuredPhase Observable
at Time (1)
• Setup at least one GNSS base station on a stable area with accurate coordinates (control point)
• The GNSS base station track the same group of satellites as the monitoring GNSS station, so the base station calculate the GNSS correction data and transmit to monitoring station
• Monitoring station GNSS receiver resolve integer ambiguity to get 3D coordinates. RTK accuracy to around 10mm + 1ppm (horizontal), 20mm + 1ppm (vertical)

5
Advantages of applying GNSS RTK in monitoring
Fully Automatic, less human interference
All weather operation, 7 x 24 round the clock
Achieve Real-Time, 3D absolute coordinates of monitoring points
No need line of sight to monitoring point targets
high measurement rate (upto 20Hz)
Can detect sudden movement / changes, enable quick alert mechanism to engineers (e.g. SMS, email message, etc)
Can measure over long baselines, large monitoring area coverage
No concurrent payment for receiving GPS data from satellites
low maintenance and a long service life

6
Example – HK Tsing Ma Bridge adopted conventional GPS RTK for bridge health monitoring

7
GPS Base & Monitoring Stations with result display
RTK Correction
NMEA GGA
NMEA GGA
Base Station Monitoring Station
Monitoring Station

8
Centralized GNSS RTK Monitoring ApproachPrinciples :
Only one way data streaming from all GNSS receivers (no matter base stations or monitoring stations) to a central data processing facility. (no need to send GNSS correction data from base to monitoring receivers)
Defining baselines and RTK integer ambiguity resolution are performed by software with RTK algorithm at the data processing facility BUT NOT at the GNSS receivers. (GNSS receivers don’t need RTK computation capability, it’s only a data streaming machine)
Each monitoring point is now possible to be computed by multiple base stations simultaneously. >> cross-checking, redundant measurements to increase monitoring reliability

9
A typical case using centralized GNSS RTK in HKSeawall Monitoring, CEDD Ports Work
Project Objectives :
Ensure safety of seawalls in HK
Replace monitoring by traditional manual methods because they are time consuming and manpower involvedwith human life risk in typhoon periods.
Real-time displacement presentation
Multiple levels auto alert to engineers
Fully automatic, day and night, 24/7Seawall infrastructure in Hong Kong

10
AX1202 GG antenna
GMX902 GG GNSS receiver
GPRS modems with fixed IP
DC batteries
Lightning rod and surge counter to grounding
Check Point A
Modem cables
AX1202 GG antenna
GMX902 GG GNSS receiver
GPRS modems with fixed IP
DC batteries
Lightning rod and surge counter to grounding
Check Point B
Modem cables
Lands Dept SatRef GPS Network Data
Control Center with fixed IP Internet Connection
Data Processing Software computes RTK baselines from Base 1 and 2 to the check point A and B individually.
3D Displacement time series of check point A and B are plotted and send alarm message if result is over defined tolerance
TCP/IP transfer GPS raw data stream
TCP/IP transfer GPS raw data stream
Lands Dept SatRef GPS Network output TWO reference stations data streams via NTRIP to Control Center
GNSS Seawall Monitoring System Diagram

11
GNSS equipment with cabinet being installed at the remote seawall in Hong Kong

12
GNSS equipment, GPRS modem, power supply being installed
inside a cabinet

13
7 days RTK displacement time series. We have a problem !!
RTK Baseline length: 4.86km HKOH – TKO2

14
7 days RTK displacement time series. We have a problem !!
HKOH – TKO2 RTK Baseline length : 4.86km
Hong Kong is located at 22°16’latitude North and then in the low latitude band where in the afternoon the ionosphere is severely altering the GNSS signals. Accuracy and Ambiguities fixing are not guaranteed.

15
Trial of setting up a RTK base station (Trig 604) close to monitoring points (less than 1km) – 24 hours measurement
Northing Displacement Easting Displacement
Height Displacement
Blue line: HKOH – TKO2
Pink line: 604 – TKO2

16
Effect of Ionosphere turbulences in Hong Kong

17
Solution: GNSS Network RTK Approach in Monitoring
Longitude and Latitude of the Rover ( x,y )
Residuals are used to derive an interpolation model
Typically ~ 80 km
Phase and Code Corrections
RRRr EN cos000
RRRr ENH cos111
rk RR
NMEA GGA
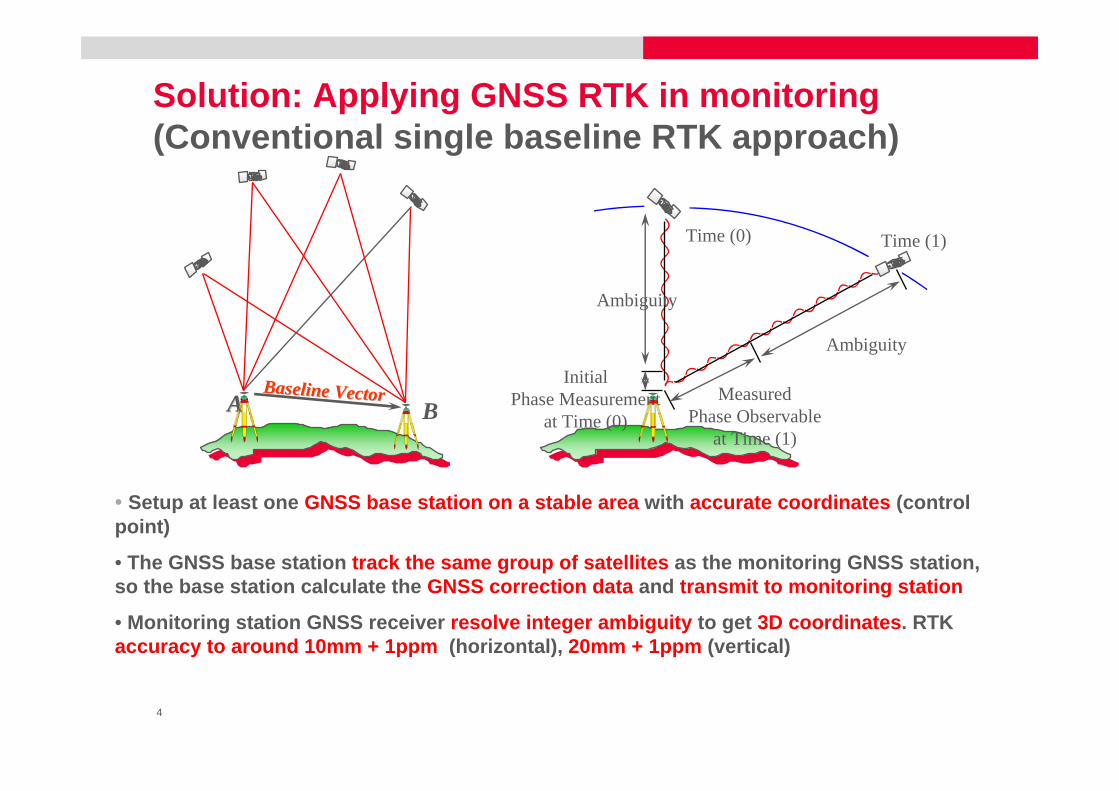
18
Receiving Corrections(1003) for
Master and Correction
Differences for the Auxiliary;
e.g. interpolating the corrections
...
Correction Differencesof the Aux. relative to
the Master
Principle of The Master Auxiliary Concept
One Master Reference StationSome Auxiliary Reference Stations One Network Cell
Monitoring point
Network Processing Facility
Network Estimation process incl. Ambiguity Resolution to achieve “Common Ambiguity Level” of all stations within a Cluster, forming
messages of proposed type; transmission of Corrections (1003)
for Master and of Correction Differences for each Auxiliary.
Auxiliary Reference Station C
Auxiliary Reference Station D
Auxiliary Reference Station B
Master Reference Station A
Auxiliary Reference Station X

19
Proof Of Concept :Simulation Test using Reference Station Data from HK SatRef Network

20
Simulation Test of generating MAX network RTK correction form a cluster of 6 CORS of SatRef and apply it to fix simulated monitoring point - HKSCProcessing in Real Time “L1 & L2” and “L1 only” GPS data
Leica GNSS SpiderNET is processing a cluster of 6 Reference Stations and is deriving the MAX corrections for the cell composed by all those stations.
HKSC suppose to be very stableand no movement. Now, different stations are selected as Master to compute coordinates of HKSC and compare the displacements

21
Real-time computation result screen of simulation test – by Spider softwareProcessing in Real Time L1 & L2 , L1 only GPS data
Compare different baselines result using Single RTK mode and the MAX mode !
Leica GNSS Spider Site Server with the Positioning option allows the operator to process any combination of baselines between the reference stations and the monitoring stations by using L1 & L2 or L1 only and by using different real-time ambiguities fixing strategies.
L1 + L2
L1 Only

22
2D Scatter Plot – HKPC to HKSC (11.4km baseline)12:00pm – 12:00am HK Time (12 hours measurement)
GPS L1 + L2 Processing
Blue: Single RTK mode
Yellow: Network RTK MAX mode

23
2D Displacement – HKPC to HKSC (11.4km baseline)12:00pm – 12:00am HK Time (12 hours measurement)
GPS L1 + L2 Processing
Blue: Single RTK mode
Yellow: Network RTK MAX mode

24
Height Displacement – HKPC to HKSC (11.4km baseline)12:00pm – 12:00am HK Time (12 hours measurement)
GPS L1 + L2 Processing
Blue: Single RTK mode
Yellow: Network RTK MAX mode
25
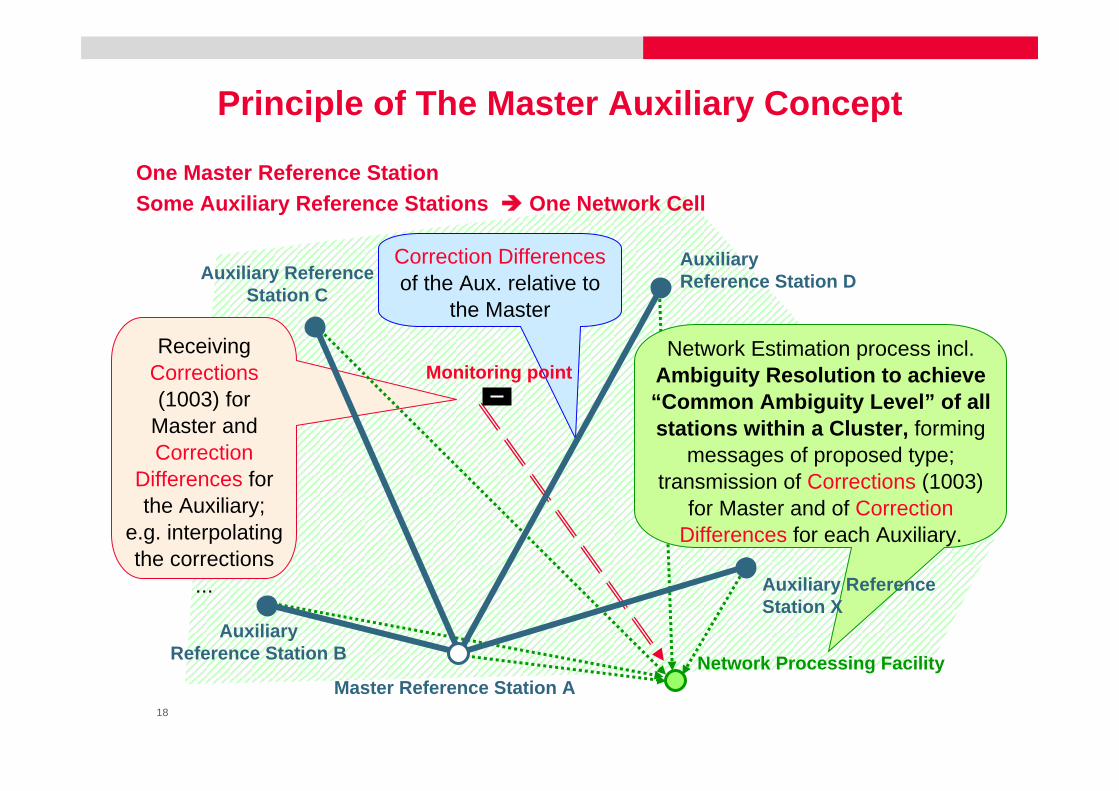
Single GPS RTK vs GPS Network RTK MAXProcessing in Real Time L1 only GPS data2D Scatter Plot – HKOH to HKSC (12.2km baseline)12:00pm – 12:00am HK Time (12 hours measurement)
GPS L1 Only Processing
Green: Single RTK mode
Red: Network RTK MAX mode

26
Single GPS RTK vs GPS Network RTK MAXProcessing in Real Time L1 only GPS data2D Displacement Plot – HKOH to HKSC (12.2km baseline)12:00pm – 12:00am HK Time (12 hours measurement)
GPS L1 Only Processing
Green: Single RTK mode
Red: Network RTK MAX mode

27
Single GPS RTK vs GPS Network RTK MAXProcessing in Real Time L1 only GPS dataHeight Displacement Plot – HKOH to HKSC (12.2km baseline)12:00pm – 12:00am HK Time (12 hours measurement)
GPS L1 Only Processing
Green: Single RTK mode
Red: Network RTK MAX mode

28
AX1202 GG antenna
GMX902 GG receiver
GPRS modems with fixed IP
DC batteries
Lightning rod and surge counter to grounding
Check Point A
Modem cables
AX1202 GG antenna
GMX902 GG receiver
GPRS modems with fixed IP
DC batteries
Lightning rod and surge counter to grounding
Check Point B
Modem cables
Lands Dept SatRef GPS Network Data
Control Center with fixed IP Internet Connection
Leica GNSS SpiderNET software process the sub network of Reference Stations provided by the Lands Dept SatRef GPS and derives the MAX corrections for a Master Station.
Leica GNSS Spider Software computes coordinates of Check Point A and B by using the Master Station.
GNSS QC software can be operated in the computer for data presentation & alarming
TCP/IP transfer GPS raw data stream
TCP/IP transfer GPS raw data stream
Lands Dept SatRef GPS Network output 6 reference stations data streams via NTRIP to Control Center
GNSS Network RTK aided Seawall Monitoring System Diagram
Lands Dept SatRef GPS Network Data
Lands Dept SatRef GPS
Network Data

29
Trial test of modifying the seawall monitoring system using Centralized Network RTK – MAX correction approach
2 GNSS receivers share one antenna in the test. One receiver stream raw data to SpiderNet software via GPRS for centralized Network RTK monitoring. Another receiver receive act as a normal rover to get SatRef RTK correction for fixing the point on site
A cluster of 7 stations of SatRef network is formed to create MAX
correction for computing the seawall monitoring point
RTK NetworkExtrapolation to
measure monitoring point
SpiderNetsoftware operational interface during this testing

30
2D Scatter Plot – HKOH to TKO3 (4.86km baseline)10:30am – 05:00pm HK Time (6.5 hours measurement)
Blue: Single RTK mode
Yellow: Network RTK MAX mode
GPS L1 + L2 Processing

31
2D Displacement Plot – HKOH to TKO3 (4.86km baseline)10:30am – 05:00pm HK Time (6.5 hours measurement)
GPS L1 + L2 Processing
Blue: Single RTK mode
Yellow: Network RTK MAX mode

32
Height Displacement Plot – HKOH to TKO3 (4.86km baseline)10:30am – 05:00pm HK Time (6.5 hours measurement)
GPS L1 + L2 Processing
Blue: Single RTK mode
Yellow: Network RTK MAX mode

33
Summary of Key FindingsThe practical results are demonstrating that the combination of GNSS Network RTK resources within a GNSS Monitoring projects have outstanding advantages :
Users can achieve very consistent and homogeneous accurate monitoring data result over the whole GNSS network area (even outside the network region by extrapolation)
Higher chance and quicker RTK initialization for monitoring points
The distance dependent error is mitigated and is especially beneficial for monitoring projects located in the low latitude band where the ionosphere turbulences are affecting seriously on the GNSS signals processing
Possibility to mix dual frequency receivers (GNSS Network) with affordable single frequency receivers for slow motion monitoring
No need to establish single base station for monitoring task if there is a GNSS network service available, save cost
Multiple reference stations in a network provide good redundancy and high availability for continuously monitoring tasks

34
Thank You Very Much for Your Attention
Vincent LuiLeica Geosystems Ltd
Tel: +852 2161 3882Mobile: +852 9684 8571
Email: [email protected]