5 HAZARD TO LIFE 5.1 INTRODUCTION€¦ · Merchant Shipping (Local Vessels) Ordinance (Cap. 548)...
428
ENVIRONMENTAL RESOURCES MANAGEMENT CLP POWER HONG KONG LIMITED 0359722_HKOLNG EIA_05_HTL_REV 3.DOCX JUNE 2018 5-1 5 HAZARD TO LIFE 5.1 INTRODUCTION This Section presents the findings of the Hazard to Life Quantitative Risk Assessment (QRA) undertaken for the Project. The assessment includes an evaluation of the risks associated with storage, transfer, handling and use of LNG and natural gas and other dangerous goods, marine transport and activities of LNG carriers and FSRU Vessel and natural gas subsea pipelines within Hong Kong waters in normal and adverse weather or tidal situations, and accidental spillage or leakage of LNG or natural gas. The risks during the construction and operations phases of the Project are also assessed in consideration of other potential contributors to risk in the vicinity of the Project’s facilities. 5.2 LEGISLATIVE REQUIREMENTS AND EVALUATION CRITERIA The key legislation and guidelines which are considered relevant to the QRA Study for the Project are as follows: Environmental Impact Assessment Ordinance (EIAO), Cap. 499; Technical Memorandum on EIA Process (EIAO-TM); Gas Safety Ordinance, Cap. 51; Dangerous Goods Ordinance, Cap. 295; Merchant Shipping (Safety) Ordinance (Cap. 369) and its subsidiary regulations such as Merchant Shipping (Safety) (Gas Carriers) Regulations (Cap. 369Z); Merchant Shipping (Local Vessels) Ordinance (Cap. 548) and its subsidiary regulations. 5.2.1 Risk Criteria Section 2 of Annex 4 of the EIAO-TM specifies the individual risk and societal risk guidelines that will apply to the Project. Individual risk is the predicted increase in the chance of fatality per year to a hypothetical individual who remains at a given stationary point for 100% of the time. The individual risk guidelines specify that the maximum level of off-site individual risk associated with a hazardous installation should not exceed 1 in 100,000 per year, i.e. 1 × 10 -5 per year. Societal risk expresses the risks to the surrounding off-site population in the vicinity of a hazardous installation. The societal risk guidelines for acceptable risk levels are presented graphically in Figure 5.2. The societal risk is expressed in terms of frequency (F) of fatalities against number of fatalities (N)
Transcript of 5 HAZARD TO LIFE 5.1 INTRODUCTION€¦ · Merchant Shipping (Local Vessels) Ordinance (Cap. 548)...
ENVIRONMENTAL RESOURCES MANAGEMENT CLP POWER HONG KONG LIMITED 0359722_HKOLNG EIA_05_HTL_REV 3.DOCX JUNE 2018
5-1
5 HAZARD TO LIFE
5.1 INTRODUCTION
This Section presents the findings of the Hazard to Life Quantitative Risk Assessment (QRA) undertaken for the Project. The assessment includes an evaluation of the risks associated with storage, transfer, handling and use of LNG and natural gas and other dangerous goods, marine transport and activities of LNG carriers and FSRU Vessel and natural gas subsea pipelines within Hong Kong waters in normal and adverse weather or tidal situations, and accidental spillage or leakage of LNG or natural gas. The risks during the construction and operations phases of the Project are also assessed in consideration of other potential contributors to risk in the vicinity of the Project’s facilities.
5.2 LEGISLATIVE REQUIREMENTS AND EVALUATION CRITERIA
The key legislation and guidelines which are considered relevant to the QRA Study for the Project are as follows:
Environmental Impact Assessment Ordinance (EIAO), Cap. 499;
Technical Memorandum on EIA Process (EIAO-TM);
Gas Safety Ordinance, Cap. 51;
Dangerous Goods Ordinance, Cap. 295;
Merchant Shipping (Safety) Ordinance (Cap. 369) and its subsidiary regulations such as Merchant Shipping (Safety) (Gas Carriers) Regulations (Cap. 369Z);
Merchant Shipping (Local Vessels) Ordinance (Cap. 548) and its subsidiary regulations.
5.2.1 Risk Criteria
Section 2 of Annex 4 of the EIAO-TM specifies the individual risk and societal risk guidelines that will apply to the Project.
Individual risk is the predicted increase in the chance of fatality per year to a hypothetical individual who remains at a given stationary point for 100% of the time. The individual risk guidelines specify that the maximum level of off-site individual risk associated with a hazardous installation should not exceed 1 in
100,000 per year, i.e. 1 × 10⁻⁵ per year.
Societal risk expresses the risks to the surrounding off-site population in the vicinity of a hazardous installation. The societal risk guidelines for acceptable risk levels are presented graphically in Figure 5.2. The societal risk is expressed in terms of frequency (F) of fatalities against number of fatalities (N)

ENVIRONMENTAL RESOURCES MANAGEMENT CLP POWER HONG KONG LIMITED 0359722_HKOLNG EIA_05_HTL_REV 3.DOCX JUNE 2018
5-2
in the population from incidents at a hazardous installation. Two F-N risk lines are used to demark “Acceptable” or “Unacceptable” regions. The region between the two F-N risk lines indicates the acceptability of the societal risk is borderline and should be reduced to As Low As Reasonably Practicable (ALARP) level. This seeks to ensure that all practicable and cost-effective mitigation measures which can reduce societal risk are considered. In order to avoid major incidents resulting in more than 1,000 fatalities, there is a vertical cut-off line at the 1,000 fatalities level extending down to a frequency of 1 in a billion years.
5.3 ASSESSMENT METHODOLOGY
5.3.1 Components for QRA Study
With due consideration of the Project key components and activities and to address requirements of the EIA Study Brief, the remainder of this Section has been divided into four components of the QRA Study. Sections 5.4 to Section 5.7 detail the four components. The key hazardous materials assessed in each section are illustrated in Table 5.1.
Table 5.1 QRA Study Components and Associated Hazard Evaluations
QRA Study Components: Description of Hazard Evaluation
Associated Hazards Section LNG Natural
Gas Other Dangerous Goods
Evaluation of risks associated with LNGC and FSRU Vessel transit routes within Hong Kong waters to the LNG Terminal (including transits for temporary sheltering under adverse weather condition), as well as emergency transits of LNGC and FSRU Vessel
Section 5.4: LNGC / FSRU Vessel Transits to the LNG Terminal
Evaluation of risks of LNG / natural gas / other dangerous goods associated with the LNG Terminal operation
Section 5.5: LNG Terminal Operation
Evaluation of risks of natural gas associated with subsea pipelines connecting the Jetty and the proposed GRSs at the BPPS and the LPS
N/A N/A Section 5.6 : Subsea Pipelines
Evaluation of risks of natural gas associated with the proposed GRSs at the BPPS and the LPS
N/A Section 5.7 : GRS Facilities
Notes: : Applicable, N/A: Not Applicable
Other risk factors which could induce potential risk on the Project components, as specified in Section 3.4.5 and Appendix B of the EIA Study Brief, are also assessed in the corresponding sections illustrated in Table 5.2.

ENVIRONMENTAL RESOURCES MANAGEMENT CLP POWER HONG KONG LIMITED 0359722_HKOLNG EIA_05_HTL_REV 3.DOCX JUNE 2018
5-3
Table 5.2 Other Assessed Risk Factors
Section Description Risk of Collision from
High Speed Ferries
Adverse Weather (e.g. typhoon, storm surge, extreme tide)
Risk from Operation of Helicopters /
Aircrafts
Risk Associated
with Existing GRSs
Section 5.4: Marine Transits of LNGC / FSRU Vessel to the LNG Terminal
N/A
Section 5.5: LNG Terminal Operation
N/A
Section 5.6: Subsea Pipelines
N/A N/A N/A N/A
Section 5.7: GRS Facilities
N/A
Notes: : Applicable, N/A: Not Applicable.
It should be noted that during the construction of the Jetty and both subsea pipelines, LNG, natural gas and other dangerous goods will not be present other than for commissioning purposes. Therefore, construction phase associated risk has not been further assessed.
During the construction of the proposed GRSs at the BPPS and LPS, the hazards arising from the associated construction works may impact the existing neighbouring GRS facilities, leading to natural gas potential loss of containment. The associated risk has been assessed in Section 5.7.6.
5.3.2 General Approach
The overall assessment approach is illustrated in Figure 5.1. The methodology adopted for the QRA Study is consistent with other studies that have been approved by the EPD and other relevant authorities, including both EIA and safety case studies, such as:
ERM, EIA for 1,800 MW Gas-fired Power Station at Lamma Extension (Register No.: AEIAR-010/1999), February 1999;
ERM, EIA for Liquefied Natural Gas (LNG) Receiving Terminal and Associated Facilities (Register No.: AEIAR-106/2007), December 2006;
ERM, EIA for Black Point Gas Supply Project, Revision 3 (Register No.: AEIAR-150/2010), February 2010; and
ERM, EIA for Additional Gas-fired Generation Units Project (Register No.: AEIAR-197/2016), June 2016.
The assumptions and methodology used for the QRA Study are in line with the Method Statement that was approved by EPD on 28 September 2017.
The general approach taken for each step of the QRA Study is provided below.

ENVIRONMENTAL RESOURCES MANAGEMENT CLP POWER HONG KONG LIMITED 0359722_HKOLNG EIA_05_HTL_REV 3.DOCX JUNE 2018
5-4
Information Collection and Review
Relevant information on the Jetty, Subsea Pipelines and GRS such as layout drawings, design basis, weather data, surrounding off-site population data, etc. were collected, reviewed and incorporated in the QRA Study.
Hazard Identification
A Hazard Identification (HAZID) analysis including a HAZID workshop for the Project components was conducted to identify all potential hazards. A review of literature and incident / accident database was also conducted to identify all potential hazardous scenarios for consideration in the QRA Study.
Frequency Analysis
The failure frequencies / likelihood of the various hazardous scenarios outcomes were derived from historical failure databases and by using event tree analysis. Where necessary and applicable, fault tree analysis was also conducted to take into account Project specific factors.
Consequence Analysis
All identified hazardous materials (LNG, natural gas, and other dangerous goods) were assessed in the QRA Study. The consequence modelling for these hazardous materials was performed using an internationally recognized consequence modelling package, PHAST.
Cumulative Risk Assessment
The consequence and frequency data, together with surrounding off-site population data, was subsequently combined using approved software packages, SAFETITM and RiskplotTM, which is in line with previous EIA studies that have been approved by EPD and other relevant authorities (1) (2) and as stated in the Method Statement for the QRA Study. The results from the cumulative risk assessment were compared against the risk criteria stipulated in Section 2 of Annex 4 of the EIAO-TM.
Risk Mitigation
Practicable and cost-effective risk mitigation measures were proposed, as required based on the findings of the QRA Study.
5.3.3 Assessment Basis
Proposed Assessment Years for QRA Study
The proposed assessment years adopted for the QRA Study are as follows:
(1) ERM, EIA for Liquefied Natural Gas (LNG) Receiving Terminal and Associated Facilities (Register No.: AEIAR-106/2007),
December 2006.
(2) ERM, EIA for Black Point Gas Supply Project (Register No.: AEIAR-150/2010), February 2010.

ENVIRONMENTAL RESOURCES MANAGEMENT CLP POWER HONG KONG LIMITED 0359722_HKOLNG EIA_05_HTL_REV 3.DOCX JUNE 2018
5-5
Year 2020: Target year for the Project to start commercial operations; and
Year 2030: Future scenario for the Project.
In addition, the proposed GRS facilities at the BPPS and LPS are expected to be under peak construction time in the beginning of 2020. The GRS construction works may induce additional risks to the neighbouring operating GRS facilities. Therefore, Year 2020 has been also adopted as the assessment year for the construction activities at both GRS locations.
Surrounding Population
Surrounding Marine Vessel Population Estimation
The marine traffic data in the vicinity of the Project components was collected and used to estimate the marine vessel population for consideration in the QRA Study.
The marine traffic that was identified in the vicinity of the Project components included fishing vessels, river trade, ocean-going vessels, fast ferries, and other types of smaller vessels. A forecasting exercise for marine traffic was also conducted and the increment in marine traffic volume was derived by trend analysis for each vessel class so that a representative pattern was developed for the 2020 and 2030 timeframes.
The population of all marine vessels was treated as an area averaged density, except for fast ferries which were treated as point receptors. The approach to estimate the marine vessel population for the proposed assessment years was consistent with the previous EIA studies that have been approved by the EPD and other relevant authorities (1) (2) and as included in the Method Statement for the QRA Study.
The detailed marine traffic data and marine vessel population estimation assumptions and methodology are summarised in Annex 5A.
Surrounding Land Population Estimation
Based on a review of the GeoInfo Map (3), there is no land based population in the vicinity of any of the Project components, and the detailed discussion on the land population is summarised in Annex 5A.
Surrounding Road Traffic Population Estimation
There is no road traffic population in the vicinity of the GRS at the LPS. Road traffic population was identified in the vicinity of the GRS at the BPPS. The detailed discussion on the road traffic population is summarised in Annex 5A.
(1) ERM, EIA for Liquefied Natural Gas (LNG) Receiving Terminal and Associated Facilities (Register No.: AEIAR-106/2007),
December 2006.
(2) ERM, EIA for Black Point Gas Supply Project (Register No.: AEIAR-150/2010), February 2010.
(3) GeoInfo Map, http://www.map.gov.hk (accessed 7th August 2017)
ENVIRONMENTAL RESOURCES MANAGEMENT CLP POWER HONG KONG LIMITED 0359722_HKOLNG EIA_05_HTL_REV 3.DOCX JUNE 2018
5-6
Land On-site Population
Safety management measures will be put in place to minimize the potential risk exposure to all personnel at the BPPS and LPS facilities, including operational staff during the operation phase and construction workers during the construction phase.
The key safety management measures for all personnel at the BPPS and LPS will include:
All personnel within the BPPS shall comply with CLP safety policy and requirements;
All personnel within the LPS shall comply with HK Electric safety policy and requirements;
All operation work procedures shall be complied with the operating plant procedures or guidelines and regulatory requirements;
All personnel shall be equipped with appropriate personal protective equipment (PPE) when working at the BPPS and LPS facilities;
Safety training and briefings shall be provided to all personnel; and
Regular site safety inspections/ audits shall be conducted.
The key safety management measures to manage the risk associated with construction workers during the construction phase will include:
Method statements and risk assessments shall be prepared and safety control measures shall be in place before the commencement of construction works;
Work permit system, on-site pre-work risk assessment and emergency response procedure shall be in place before commencement of construction works; and
All construction workers shall be under close site supervision during the construction phase of the GRSs.
With the implementation of the above safety management measures at the BPPS and LPS, the potential risks to all personnel on-site, including operational staff during the operation phase and construction workers during the construction phase in the BPPS and LPS, are expected to be insignificant; hence they were not considered as off-site population and has not be taken into account in the QRA Study.
LNG Terminal On-site Population
Safety management measures will also be put in place to minimize the potential risk exposure to all personnel at the LNG Terminal, including operational staff

ENVIRONMENTAL RESOURCES MANAGEMENT CLP POWER HONG KONG LIMITED 0359722_HKOLNG EIA_05_HTL_REV 3.DOCX JUNE 2018
5-7
during the operation phase and construction workers during the construction phase.
The key safety management measures for all personnel at the LNG Terminal will include:
All personnel within the LNG Terminal shall comply with relevant safety policy and requirements;
All operation work procedures shall be complied with relevant codes and standards (e.g. SIGTTO) and regulatory requirements;
Work permit system and emergency response procedure shall be in place;
Robust and extended process control system, safety control system, fire-fighting system and security system shall be provided;
Sufficient and trained / competent staff shall be provided to operate the LNG Terminal; and
Regular safety inspections/audits shall be conducted.
The key safety management measures to manage the risk associated with construction workers during the construction phase of the LNG Terminal will include:
Method statements and risk assessments shall be prepared and safety control measures should be in place before the commencement of construction works;
Work permit system, on-site pre-work risk assessment and emergency response procedure shall be in place before commencement of construction works; and
All construction workers shall be under close site supervision during the construction phase of the LNG Terminal.
With the implementation of the above safety management measures at the LNG Terminal, the potential risks to all personnel on-site, including operational staff during the operation phase and construction workers during the construction phase in the LNG Terminal, are expected to be insignificant; hence they were not considered as off-site population and has not be taken into account in the QRA Study.
Meteorological Data
The 5-year meteorological data from Year 2012 to Year 2016 from the Hong Kong Observatory (HKO) has been selected to represent local meteorological conditions including wind speed, wind direction, atmospheric stability class, temperature, and relative humidity.

ENVIRONMENTAL RESOURCES MANAGEMENT CLP POWER HONG KONG LIMITED 0359722_HKOLNG EIA_05_HTL_REV 3.DOCX JUNE 2018
5-8
The weather stations in the vicinity of the Project components were reviewed, and the following weather stations listed in Table 5.3 were selected for the QRA Study.
Table 5.3 Selected Weather Stations for the QRA Study
Component / Weather Station Cheung Chau Sha Chau Lamma Island LNGC / FSRU Vessel Transits to the LNG Terminal
N/A N/A
FSRU Vessel, the Jetty and LNGC Unloading at the LNG Terminal
N/A N/A
Subsea BPPS Pipeline N/A N/A Subsea LPS Pipeline N/A N/A GRS Facility at the BPPS N/A N/A GRS Facility at the LPS N/A N/A
Notes: : Applicable, N/A: Not Applicable.
The meteorological data of these selected weather stations are summarised in Annex 5A.
5.4 QRA FOR MARINE TRANSITS OF LNGC AND FSRU VESSEL TO THE LNG
TERMINAL
This Section presents the QRA Study for the evaluation of the risks associated with the LNGC and FSRU Vessel along the transit routes to the LNG Terminal during normal operations (including transits for temporary sheltering under adverse weather condition), as well as emergency transits of the LNGC and FSRU Vessel.
5.4.1 Description of the Marine Transits for LNGC and FSRU Vessel
Type of LNGC
Two (2) types of LNGC with double hull are typically used in the market to deliver LNG cargoes, namely:
Membrane type; and
MOSS type (spherical LNG storage tank).
More than 90% LNGCs are membrane type at the current LNGC market, as such, the LNGC of membrane type was selected as the representative case for the QRA Study.
Size of LNGC
The QRA Study was conducted based on two (2) sizes of LNGC (each with five (5) membrane-type LNG Cargo Tanks):
Small LNGC (170,000 m3 capacity, with each LNG storage tank capacity of about 34,000 m3); and
ENVIRONMENTAL RESOURCES MANAGEMENT CLP POWER HONG KONG LIMITED 0359722_HKOLNG EIA_05_HTL_REV 3.DOCX JUNE 2018
5-9
Large LNGC (270,000 m3, capacity, with each LNG storage tank capacity of about 54,000 m3).
The typical safeguards for LNGC design and operations have been summarised in Section 3 of the EIA Report.
Description of LNGC Process System
Typically, an LNGC has the following main process systems:
LNG Storage System;
LNG Unloading Arms;
Diesel Storage System;
Lubricating Oil System; and
Fuel Oil Storage System.
The detailed description of the above process systems is summarised in Annex 5B, while the key description of FSRU Vessel is summarised in Section 5.5.1.
LNGC Transit Routes
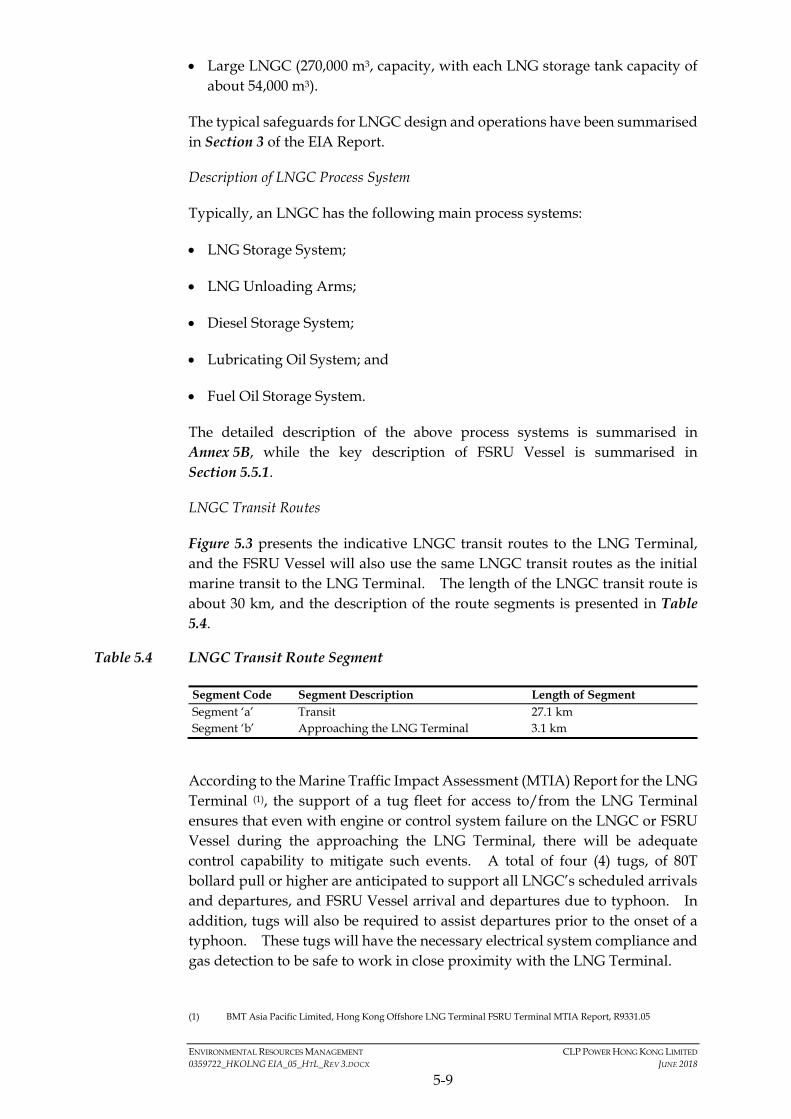
Figure 5.3 presents the indicative LNGC transit routes to the LNG Terminal, and the FSRU Vessel will also use the same LNGC transit routes as the initial marine transit to the LNG Terminal. The length of the LNGC transit route is about 30 km, and the description of the route segments is presented in Table 5.4.
Table 5.4 LNGC Transit Route Segment
Segment Code Segment Description Length of Segment Segment ‘a’ Transit 27.1 km Segment ‘b’ Approaching the LNG Terminal 3.1 km
According to the Marine Traffic Impact Assessment (MTIA) Report for the LNG Terminal (1), the support of a tug fleet for access to/from the LNG Terminal ensures that even with engine or control system failure on the LNGC or FSRU Vessel during the approaching the LNG Terminal, there will be adequate control capability to mitigate such events. A total of four (4) tugs, of 80T bollard pull or higher are anticipated to support all LNGC’s scheduled arrivals and departures, and FSRU Vessel arrival and departures due to typhoon. In addition, tugs will also be required to assist departures prior to the onset of a typhoon. These tugs will have the necessary electrical system compliance and gas detection to be safe to work in close proximity with the LNG Terminal.
(1) BMT Asia Pacific Limited, Hong Kong Offshore LNG Terminal FSRU Terminal MTIA Report, R9331.05

ENVIRONMENTAL RESOURCES MANAGEMENT CLP POWER HONG KONG LIMITED 0359722_HKOLNG EIA_05_HTL_REV 3.DOCX JUNE 2018
5-10
LNGC Transit Frequency
Based on the estimated LNG Terminal throughput, it is envisaged that the frequency of LNGC visits on average will be one LNGC arriving every five to eight days. As a conservative approach, the QRA Study was conducted based on the following maximum annual visit frequency:
75 visits per year (equivalent to every 4.8 days) for Small LNGC; and
50 visits per year (equivalent to every 7.3 days) for Large LNGC.
With regard to the LNGC transit to the LNG Terminal, the following transit conditions were considered in the QRA Study:
The LNGC transit is conducted by the Small LNGC as the worst-case scenario since the number of LNGC transit and associated transit risk is higher; and
The maximum annual visit frequency of the Small LNGC to the LNG Terminal is seventy five (75) visits per year.
Initial Transit of FSRU Vessel to the LNG Terminal
For the initial transit to the LNG Terminal, the FSRU Vessel will transit and approach the LNG Terminal on the same route as the LNGC normal transit route shown in Figure 5.3.
Transit of LNGC under Adverse Weather Condition
Prior to the transit of an LNGC to the LNG Terminal for LNG unloading operation, the transit route and the weather forecast for the transit area will be reviewed and analyzed to determine the suitability and safety of the LNGC transit. It is expected that the LNGC will only be allowed to transit and enter Hong Kong waters if the forecasted weather condition is within an agreed weather envelope. Therefore, it is highly unlikely that an LNGC will be at berth at the Jetty when a typhoon is predicted. Nevertheless, a frequency of once per five (5) years was conservatively assumed to be adopted in the QRA Study.
In case the on-set of a typhoon occurs during the LNG unloading operation at the Jetty, the LNGC will, depending on weather conditions and at the discretion of the Master head, depart the berth to an area of open sea outside HKSAR waters. Once the weather conditions have returned to acceptable operating limits for berthing, the LNGC will return to the LNG Terminal using the same LNGC normal transit route as presented in Figure 5.3.
Transit of the FSRU Vessel under Adverse Weather Condition
In case of adverse weather condition (e.g. typhoon, monsoon), the FSRU Vessel berthed at the Jetty will also, depending on weather conditions and at the

ENVIRONMENTAL RESOURCES MANAGEMENT CLP POWER HONG KONG LIMITED 0359722_HKOLNG EIA_05_HTL_REV 3.DOCX JUNE 2018
5-11
discretion of the Master head, depart the berth to an area of open sea outside HKSAR waters.
Although it was identified from the prior mooring capability assessment that the FSRU Vessel could maintain at the LNG Terminal in winds associated with Typhoon Signal 3 (sustained speeds of 41-62 km/hr) (1), it was conservatively assumed that departure of the FSRU Vessel would be required upon Typhoon Signal No. 3 or higher for the QRA Study.
According to the HKO, the average number of days per year with Typhoon Signal No. 3 or higher in Hong Kong between 1961 and 2010 is 9.56 days (2), and the average annual frequency of Typhoon Signal No. 3 or higher in Hong Kong between 1956 and 2014 is 8.7 times (2). With the aim to build conservatism in this study, the FSRU Vessel’s departure frequency from the Jetty under adverse weather condition was conservatively selected as ten (10) times per year.
Once the weather conditions have returned to acceptable operating limits for berthing, the FSRU Vessel will return to the LNG Terminal using the same LNGC normal transit route as presented in Figure 5.3.
A Typhoon Departure Plan will be put in place (and agreed with Marine Department). The plan will fully document the procedure to be followed in the event of a typhoon affecting LNG Terminal operation.
Transit of the LNGC and FSRU Vessel under Emergency Situation
In the case of an emergency situation (e.g. uncontrolled fire event at the Jetty), the FSRU Vessel berthed at the Jetty and any LNGC that may be on berth at the time of the emergency will be required to depart the berth to an area of open sea outside HKSAR waters. In addition, a standby vessel is available to provide an emergency response and will have the capability to assist the FSRU Vessel and LNGC depart the berth. The frequency of this scenario was conservatively assumed as once every five (5) years for the QRA Study.
Once the emergency situation is over and the Jetty is made safe, the LNGC and FSRU Vessel will return to the LNG Terminal using the same LNGC transit route as presented in Figure 5.3.
An emergency response plan will be put in place which fully documents the procedures to be followed in the event of an emergency.
5.4.2 Hazard Identification
The hazardous scenarios associated with the marine transits of the LNGC and FSRU Vessel to the LNG Terminal were identified though the following tasks:
Review of hazardous materials;
(1) BMT Asia Pacific Limited, Hong Kong Offshore LNG Terminal FSRU Terminal MTIA Report, R9331.05
(2) HK Observatory, http://www.hko.gov.hk
ENVIRONMENTAL RESOURCES MANAGEMENT CLP POWER HONG KONG LIMITED 0359722_HKOLNG EIA_05_HTL_REV 3.DOCX JUNE 2018
5-12
Review of potential Major Accident Events (MAEs);
Review of relevant industry incidents;
Review of potential initiating events leading to MAEs; and
HAZID Workshop.
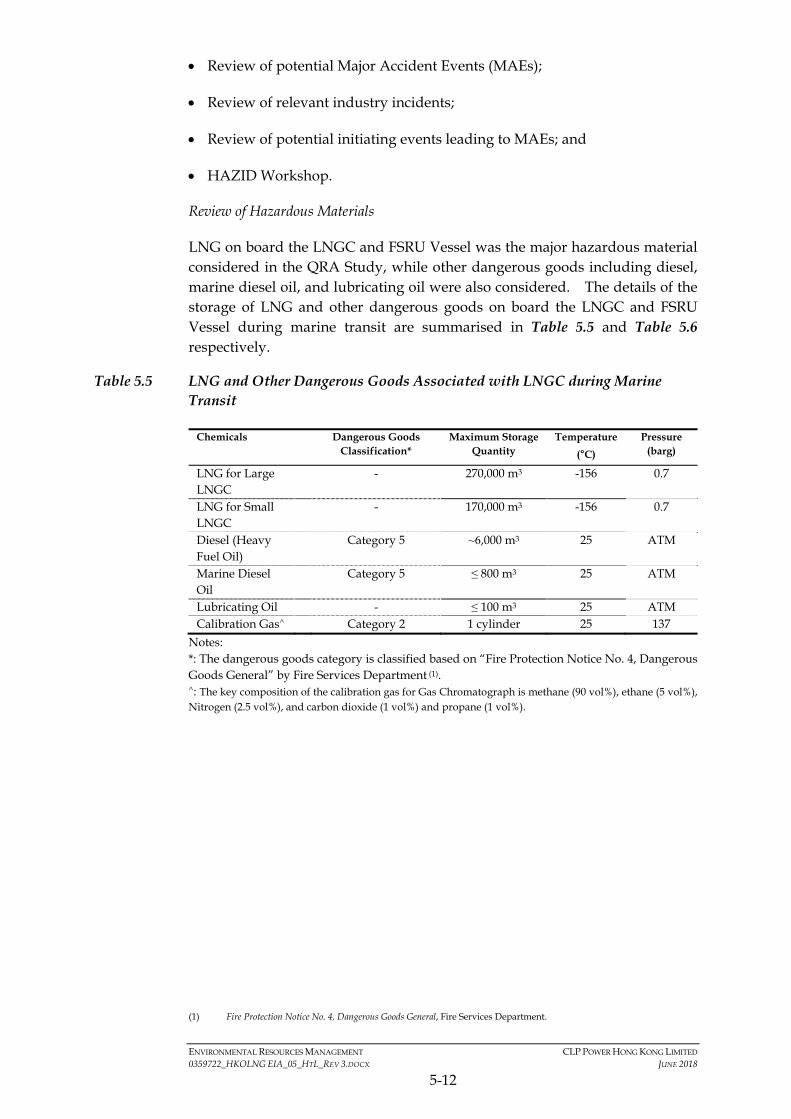
Review of Hazardous Materials
LNG on board the LNGC and FSRU Vessel was the major hazardous material considered in the QRA Study, while other dangerous goods including diesel, marine diesel oil, and lubricating oil were also considered. The details of the storage of LNG and other dangerous goods on board the LNGC and FSRU Vessel during marine transit are summarised in Table 5.5 and Table 5.6 respectively.
Table 5.5 LNG and Other Dangerous Goods Associated with LNGC during Marine Transit
Chemicals Dangerous Goods Classification*
Maximum Storage Quantity
Temperature
(°C)
Pressure (barg)
LNG for Large LNGC
- 270,000 m3 -156 0.7
LNG for Small LNGC
- 170,000 m3 -156 0.7
Diesel (Heavy Fuel Oil)
Category 5 ~6,000 m3 25 ATM
Marine Diesel Oil
Category 5 ≤ 800 m3 25 ATM
Lubricating Oil - ≤ 100 m3 25 ATM Calibration Gas^ Category 2 1 cylinder 25 137
Notes: *: The dangerous goods category is classified based on “Fire Protection Notice No. 4, Dangerous Goods General” by Fire Services Department (1). ^: The key composition of the calibration gas for Gas Chromatograph is methane (90 vol%), ethane (5 vol%), Nitrogen (2.5 vol%), and carbon dioxide (1 vol%) and propane (1 vol%).
(1) Fire Protection Notice No. 4, Dangerous Goods General, Fire Services Department.
ENVIRONMENTAL RESOURCES MANAGEMENT CLP POWER HONG KONG LIMITED 0359722_HKOLNG EIA_05_HTL_REV 3.DOCX JUNE 2018
5-13
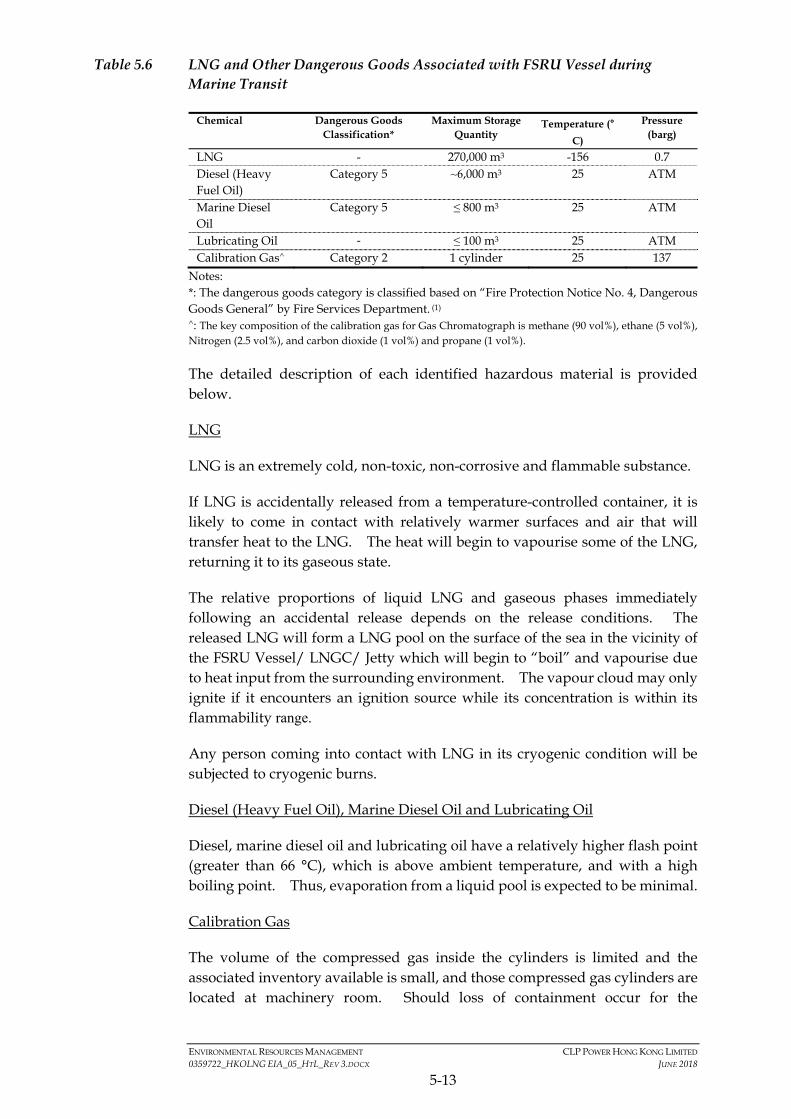
Table 5.6 LNG and Other Dangerous Goods Associated with FSRU Vessel during Marine Transit
Chemical Dangerous Goods Classification*
Maximum Storage Quantity
Temperature (°C)
Pressure (barg)
LNG - 270,000 m3 -156 0.7 Diesel (Heavy Fuel Oil)
Category 5 ~6,000 m3 25 ATM
Marine Diesel Oil
Category 5 ≤ 800 m3 25 ATM
Lubricating Oil - ≤ 100 m3 25 ATM Calibration Gas^ Category 2 1 cylinder 25 137
Notes: *: The dangerous goods category is classified based on “Fire Protection Notice No. 4, Dangerous Goods General” by Fire Services Department. (1)
^: The key composition of the calibration gas for Gas Chromatograph is methane (90 vol%), ethane (5 vol%), Nitrogen (2.5 vol%), and carbon dioxide (1 vol%) and propane (1 vol%).
The detailed description of each identified hazardous material is provided below.
LNG
LNG is an extremely cold, non-toxic, non-corrosive and flammable substance.
If LNG is accidentally released from a temperature-controlled container, it is likely to come in contact with relatively warmer surfaces and air that will transfer heat to the LNG. The heat will begin to vapourise some of the LNG, returning it to its gaseous state.
The relative proportions of liquid LNG and gaseous phases immediately following an accidental release depends on the release conditions. The released LNG will form a LNG pool on the surface of the sea in the vicinity of the FSRU Vessel/ LNGC/ Jetty which will begin to “boil” and vapourise due to heat input from the surrounding environment. The vapour cloud may only ignite if it encounters an ignition source while its concentration is within its flammability range.
Any person coming into contact with LNG in its cryogenic condition will be subjected to cryogenic burns.
Diesel (Heavy Fuel Oil), Marine Diesel Oil and Lubricating Oil
Diesel, marine diesel oil and lubricating oil have a relatively higher flash point (greater than 66 °C), which is above ambient temperature, and with a high boiling point. Thus, evaporation from a liquid pool is expected to be minimal.
Calibration Gas
The volume of the compressed gas inside the cylinders is limited and the associated inventory available is small, and those compressed gas cylinders are located at machinery room. Should loss of containment occur for the
ENVIRONMENTAL RESOURCES MANAGEMENT CLP POWER HONG KONG LIMITED 0359722_HKOLNG EIA_05_HTL_REV 3.DOCX JUNE 2018
5-14
compressed gas cylinders, there is no off-site impact on surrounding marine population. Hence, it is not further assessed in the QRA Study.
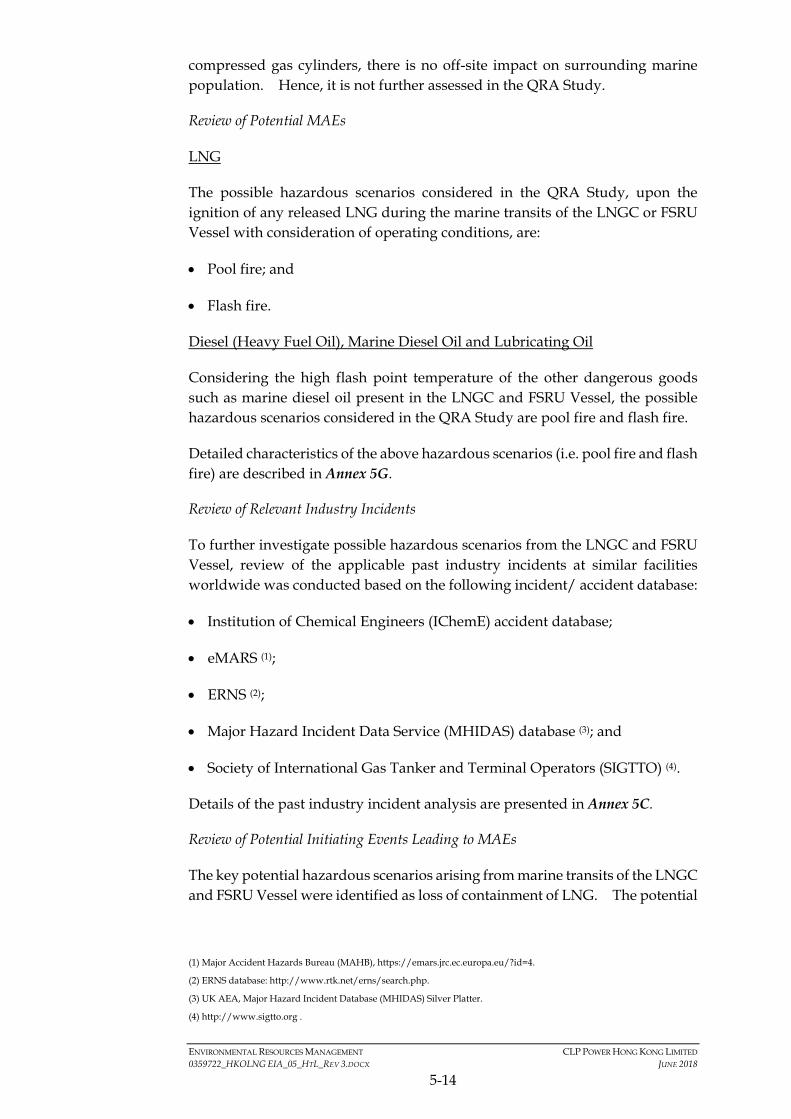
Review of Potential MAEs
LNG
The possible hazardous scenarios considered in the QRA Study, upon the ignition of any released LNG during the marine transits of the LNGC or FSRU Vessel with consideration of operating conditions, are:
Pool fire; and
Flash fire.
Diesel (Heavy Fuel Oil), Marine Diesel Oil and Lubricating Oil
Considering the high flash point temperature of the other dangerous goods such as marine diesel oil present in the LNGC and FSRU Vessel, the possible hazardous scenarios considered in the QRA Study are pool fire and flash fire.
Detailed characteristics of the above hazardous scenarios (i.e. pool fire and flash fire) are described in Annex 5G.
Review of Relevant Industry Incidents
To further investigate possible hazardous scenarios from the LNGC and FSRU Vessel, review of the applicable past industry incidents at similar facilities worldwide was conducted based on the following incident/ accident database:
Institution of Chemical Engineers (IChemE) accident database;
eMARS (1);
ERNS (2);
Major Hazard Incident Data Service (MHIDAS) database (3); and
Society of International Gas Tanker and Terminal Operators (SIGTTO) (4).
Details of the past industry incident analysis are presented in Annex 5C.
Review of Potential Initiating Events Leading to MAEs
The key potential hazardous scenarios arising from marine transits of the LNGC and FSRU Vessel were identified as loss of containment of LNG. The potential
(1) Major Accident Hazards Bureau (MAHB), https://emars.jrc.ec.europa.eu/?id=4.
(2) ERNS database: http://www.rtk.net/erns/search.php.
(3) UK AEA, Major Hazard Incident Database (MHIDAS) Silver Platter.
(4) http://www.sigtto.org .

ENVIRONMENTAL RESOURCES MANAGEMENT CLP POWER HONG KONG LIMITED 0359722_HKOLNG EIA_05_HTL_REV 3.DOCX JUNE 2018
5-15
initiating events which could result in the loss of containment of LNG are listed below:
Ship Collision;
Groundings;
Sinking or foundering;
General equipment/piping failure (due to corrosion, construction defects etc.);
LNG containment system failure; and
External effects - adverse weather (typhoon, poor visibility, storm surge, extreme tide), tsunami, and lightning.
Descriptions of these potential initiating events are presented in Annex 5D.
HAZID Workshop
A HAZID workshop was conducted to confirm and further identify the potential initiating events which may lead to MAEs along the LNGC and FSRU Vessel transit route based on the HAZID team representatives’ experience, past industry accidents, lessons learnt and guideword checklists. The HAZID workshop worksheet is presented in Annex 5E. The HAZID workshop output served as a basis for the identification of potential initiating events and hazardous scenarios for the QRA Study.
Development of Hazardous Sections
A number of hazardous sections for detailed analysis in the QRA Study based on location of emergency shutdown valves and process conditions were developed. The details of each hazardous section are presented in Annex 5D.
5.4.3 Frequency Analysis
Ship Collision Frequency Analysis
A ship collision frequency analysis was conducted following the approach adopted in the previous EIA Report that was approved by the EPD ( 1 ). DYMTRI (Dynamic Marine Traffic simulation) model (2) was adopted as the platform for the marine traffic simulation to predict the collision frequencies along the LNGC and FSRU Vessel transit route.
The key steps of the ship collision frequency analysis included:
(1) ERM, EIA for Liquefied Natural Gas (LNG) Receiving Terminal and Associated Facilities (Register No.: AEIAR-106/2007),
December 2006.
(2) BMT Asia Pacific Limited, Hong Kong Offshore LNG Terminal Marine Impact Assessment

ENVIRONMENTAL RESOURCES MANAGEMENT CLP POWER HONG KONG LIMITED 0359722_HKOLNG EIA_05_HTL_REV 3.DOCX JUNE 2018
5-16
Identification of Modelled Marine Traffic;
Hazard Identification;
Model Validation;
Marine Traffic Forecasts;
Scenario Development ;
Collision Frequency Assessment; and
Collision Energy Distribution.
The description of these key steps is described in Annex 5F.
The total collision frequencies leading to the loss of containment of LNG are provided in Table 5.7 and Table 5.8.
Table 5.7 Total Ship Collision Frequency Leading to Loss of Containment of LNG (Year 2020)
Type of LNGC Release Frequency in Sub-Segment “a” (/m/year)
Release Frequency in Sub-Segment “b” (/m/year)
Small LNGC 1.6 × 10⁻⁸ 1.5 × 10⁻⁹
Large LNGC 1.6 × 10⁻⁸ 1.5 × 10⁻⁹
Table 5.8 Total Ship Collision Frequency Leading to Loss of Containment of LNG (Year 2030)
Type of LNGC Release Frequency in Sub-Segment “a” (/m/year)
Release Frequency in Sub-Segment “b” (/m/year)
Small LNGC 1.7 × 10⁻⁸ 4.9 × 10⁻¹⁰
Large LNGC 1.8 × 10⁻⁸ 5.2 × 10⁻¹⁰
Grounding Frequency Analysis
The anticipated grounding frequency for the LNGC and FSRU Vessel during their transits to and from the LNG Terminal has been developed from a review of historical incidents in Hong Kong waters associated with vessels over 200 m Length Overall (LOA). Considering the number of marine transits per year and the probability of loss of LNG containment due to grounding events, the
grounding release frequency adopted in the QRA Study was 1.2 × 10⁻⁹ per m
per year. The derivation of this grounding frequency is provided in Annex 5F.
ENVIRONMENTAL RESOURCES MANAGEMENT CLP POWER HONG KONG LIMITED 0359722_HKOLNG EIA_05_HTL_REV 3.DOCX JUNE 2018
5-17
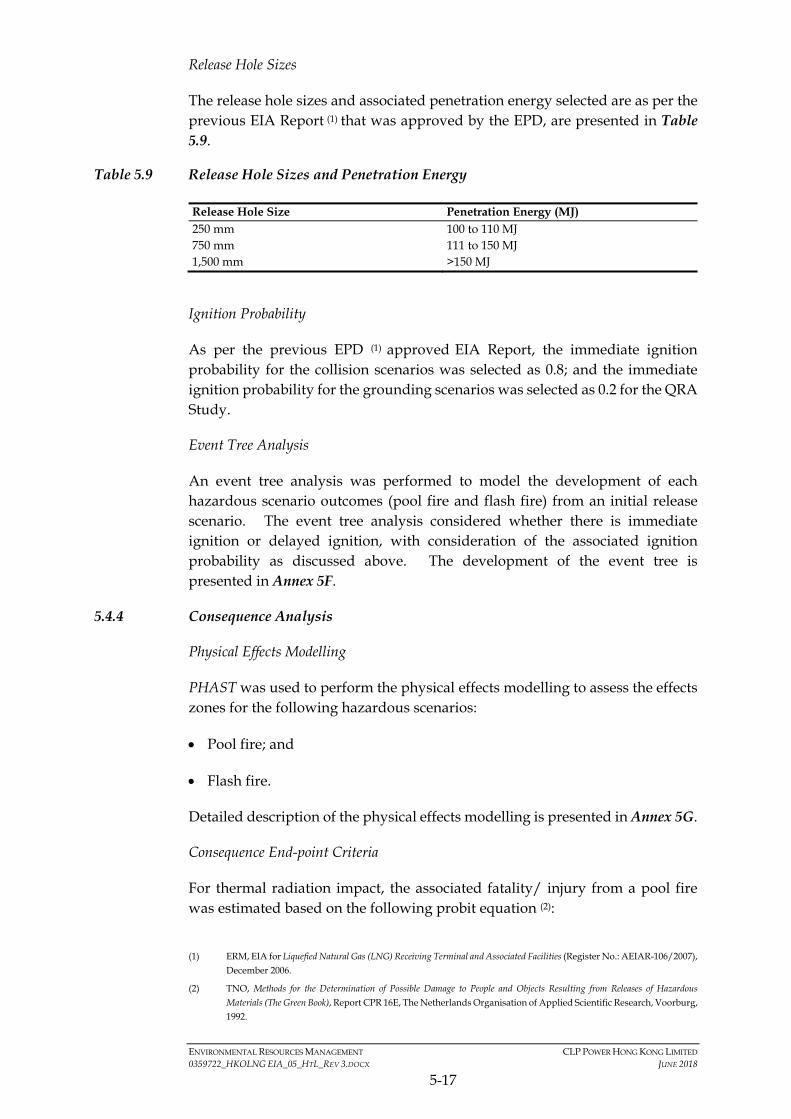
Release Hole Sizes
The release hole sizes and associated penetration energy selected are as per the previous EIA Report (1) that was approved by the EPD, are presented in Table 5.9.
Table 5.9 Release Hole Sizes and Penetration Energy
Release Hole Size Penetration Energy (MJ) 250 mm 100 to 110 MJ 750 mm 111 to 150 MJ 1,500 mm >150 MJ
Ignition Probability
As per the previous EPD (1) approved EIA Report, the immediate ignition probability for the collision scenarios was selected as 0.8; and the immediate ignition probability for the grounding scenarios was selected as 0.2 for the QRA Study.
Event Tree Analysis
An event tree analysis was performed to model the development of each hazardous scenario outcomes (pool fire and flash fire) from an initial release scenario. The event tree analysis considered whether there is immediate ignition or delayed ignition, with consideration of the associated ignition probability as discussed above. The development of the event tree is presented in Annex 5F.
5.4.4 Consequence Analysis
Physical Effects Modelling
PHAST was used to perform the physical effects modelling to assess the effects zones for the following hazardous scenarios:
Pool fire; and
Flash fire.
Detailed description of the physical effects modelling is presented in Annex 5G.
Consequence End-point Criteria
For thermal radiation impact, the associated fatality/ injury from a pool fire was estimated based on the following probit equation (2):
(1) ERM, EIA for Liquefied Natural Gas (LNG) Receiving Terminal and Associated Facilities (Register No.: AEIAR-106/2007),
December 2006.
(2) TNO, Methods for the Determination of Possible Damage to People and Objects Resulting from Releases of Hazardous
Materials (The Green Book), Report CPR 16E, The Netherlands Organisation of Applied Scientific Research, Voorburg, 1992.

ENVIRONMENTAL RESOURCES MANAGEMENT CLP POWER HONG KONG LIMITED 0359722_HKOLNG EIA_05_HTL_REV 3.DOCX JUNE 2018
5-18
Y = -36.38 + 2.56 ln (t I 4/3)
where: Y is the probit I is the radiant thermal flux (W m-2) t is duration of exposure (s)
The exposure time, t, is limited to a maximum of twenty (20) seconds.
With regard to a flash fire, the criterion chosen is that a 100% fatality was adopted for any person outdoor within the flash fire envelope, which was conservatively selected as 0.85 of the Lower Flammable Limit (LFL).
Details of the consequence modelling results are presented in Annex 5G.
5.4.5 Risk Summation
The risk summation for the LNGC and FSRU Vessel transits was modelled using SAFETI, which is in line with the previous EIA Report that was approved by EPD (1).
Individual Risk Results
The individual risk contours associated with the LNGC and FSRU Vessel transits are shown in Figure 5.4 and Figure 5.5.
The individual risk contour of 1 × 10⁻⁵ per year was not reached for the LNGC
and FSRU Vessel transit route in the Operational Year in 2020 and Future Scenario Year in 2030, as such the individual risk criterion stipulated in Section 2 of Annex 4 of the EIAO-TM is met.
Societal Risk Results
The societal risk for the LNGC and FSRU Vessel transits, in terms of F-N curve, was calculated based on the surrounding off-site marine vessel populations in the vicinity of the transit route. The societal risks in terms of F-N curves for the Operational Year in 2020 and Future Scenario Year in 2030, as shown in Figure 5.6, lie within the Acceptable Region, as such the societal risk criteria stipulated in Section 2 of Annex 4 of the EIAO-TM are met.
5.4.6 Conclusions of QRA Study for Marine Transits of LNGC and FSRU Vessel
Both individual risk and societal risk associated with the transits of the LNGC and FSRU Vessel are in compliance with the risk criteria stipulated in Section 2 of Annex 4 of the EIAO-TM.
(1) ERM, EIA for Liquefied Natural Gas (LNG) Receiving Terminal and Associated Facilities (Register No.: AEIAR-106/2007),
December 2006.

ENVIRONMENTAL RESOURCES MANAGEMENT CLP POWER HONG KONG LIMITED 0359722_HKOLNG EIA_05_HTL_REV 3.DOCX JUNE 2018
5-19
5.5 QRA STUDY FOR THE LNG TERMINAL
This Section presents the QRA Study for the risks evaluation associated with the LNG Terminal, including FSRU Vessel, the Jetty, and the LNGC unloading operation at the Jetty.
5.5.1 Description of the LNG Terminal and its Unloading Operations
The Jetty
The Jetty is designed for simultaneous mooring of both the FSRU Vessel and an LNGC, and is a typical double berth marine structure that uses mooring / fender facilities to safely moor the FSRU Vessel and LNGC.
The LNGC at the Jetty transfers LNG at 5 barg and -156 °C via unloading arms across the Jetty to the FSRU Vessel, and the LNG unloading rate is a maximum of 12,000 m3/hr. For the LNG unloading operation, the unloading arm configuration between the Jetty and the LNGC as well as between the Jetty and the FSRU Vessel consist of two (2) unloading arms dedicated for LNG service, one (1) hybrid arm normally transferring LNG but also capable of transferring LNG vapour, and one (1) dedicated vapour return arm. Upon completion of the LNG unloading operation, all unloading arms will be isolated, de-inventorised and purged with nitrogen inert gas before being disconnected.
The LNG transferred from the LNGC is stored in the FSRU Vessel’s storage tanks.
FSRU Vessel
The LNG in the FSRU Vessel’s storage tanks is pumped to the regasification unit by LNG Storage Tank Pumps and LNG Booster Pumps. The regasification unit comprises of regasification trains, with a maximum installed capacity of 1,000 mmscfd.
The natural gas at 5 °C and 88 barg is then sent from the regasification trains, via the metering system, to the Jetty at a maximum flow rate of 800 mmscfd to two (2) high pressure (HP) Gas Send-out Arms (1 duty and 1 standby) that supply the natural gas to the GRS at the BPPS via the 30” BPPS Pipeline, and to the GRS at the LPS via the 20” LPS Pipeline.
The LNG Terminal has the capability to receive LNG from LNGC while simultaneously sending out natural gas, and the FSRU Vessel also has the capability to reload LNG onto an LNGC or, in future, onto a LNG bunker vessel or barge.
Type of FSRU Vessel
Two (2) types of FSRU Vessel with double hull are typically used in the market to receive, store, regasify and send out natural gas, namely:
Membrane type; and

ENVIRONMENTAL RESOURCES MANAGEMENT CLP POWER HONG KONG LIMITED 0359722_HKOLNG EIA_05_HTL_REV 3.DOCX JUNE 2018
5-20
MOSS type (spherical LNG storage tank).
Membrane type storage tanks are favoured for new build FSRU Vessels, as their configuration provides a higher storage capacity for a given ship size due to no space between the storage tanks, as well as flat deck providing a better platform for the regasification facilities.
As such, membrane-type FSRU Vessel with LNG storage capacity of 270,000 m3 and five (5) LNG Cargo Tanks was selected as the representative case for the QRA Study.
FSRU Vessel Process Systems
Typically, an FSRU Vessel has the following main process systems:
LNG Regasification: LNG Send-out Booster Pump System;
LNG Regasification: LNG Vapourisation System;
BOG Handling and Recovery System;
Seawater Intake System;
Sodium Hypochlorite System;
Diesel Storage System;
Lubricating Oil System;
Fuel Oil Storage System; and
Nitrogen Generation System.
Detailed process description of the above process systems is summarised in Annex 5B.
Key Safety Systems for the FSRU Vessel and the Jetty
The following safety systems are typically provided on the FSRU Vessel, the Jetty and on the visiting LNGC:
Emergency Release Coupling System for Unloading Arms;
Process Overpressure Protection System;
Emergency Shutdown System;
Fire and Gas Detection System;
LNG Spillage Protection System;
Escape Routes / Paths and Escape System; and

ENVIRONMENTAL RESOURCES MANAGEMENT CLP POWER HONG KONG LIMITED 0359722_HKOLNG EIA_05_HTL_REV 3.DOCX JUNE 2018
5-21
Security Control System.
Detailed description of the above safety systems is summarised in Annex 5B.
LNGC Unloading Operations at the LNG Terminal
With regard to the LNGC unloading operations at the LNG Terminal, the following operating conditions were considered in the QRA Study:
The LNG unloading operation is conducted by the Small LNGC as the worst-case scenario since the unloading operation frequency and associated process risk is higher;
The maximum annual visit frequency of the Small LNGC to the LNG Terminal is seventy five (75) visits per year;
The maximum unloading time for the Small LNGC at the LNG Terminal is twenty four (24) hours; and
The maximum staying time of the Small LNGC at the LNG Terminal is forty eight (48) hours.
Marine Diesel Oil Bunkering Operations at the LNG Terminal
As per previous project experience for similar facilities, the number of bunkering operations for marine diesel oil using marine service vessels is typically three (3) times per year. As such, it was conservatively assumed that the bunkering operation of marine diesel oil for the LNG Terminal will be performed three (3) times per year and that each operation is up to six (6) hours duration. The risks associated with marine diesel bunkering operation as well as the associated escalation effect have been considered in the QRA hazard to life assessment. The associated risk impacts to the off-site population is insignificant.
5.5.2 Hazard Identification
Hazardous scenarios associated with the operation of the LNG Terminal, including an LNGC unloading at the LNG Terminal and sending out natural gas were identified through the following tasks:
Review of hazardous materials;
Review of potential MAEs;
Review of relevant industry incidents;
Review of potential initiating events leading to MAEs; and
HAZID Workshop.
ENVIRONMENTAL RESOURCES MANAGEMENT CLP POWER HONG KONG LIMITED 0359722_HKOLNG EIA_05_HTL_REV 3.DOCX JUNE 2018
5-22
Review of Hazardous Materials
LNG on board the LNGC and FSRU Vessel, and natural gas associated with the LNG Terminal were the major hazardous material considered in the QRA Study, while the other dangerous goods including diesel, marine diesel oil, lubricating oil, sodium hypochlorite, hydrogen and nitrogen were also taken into account in the QRA Study.
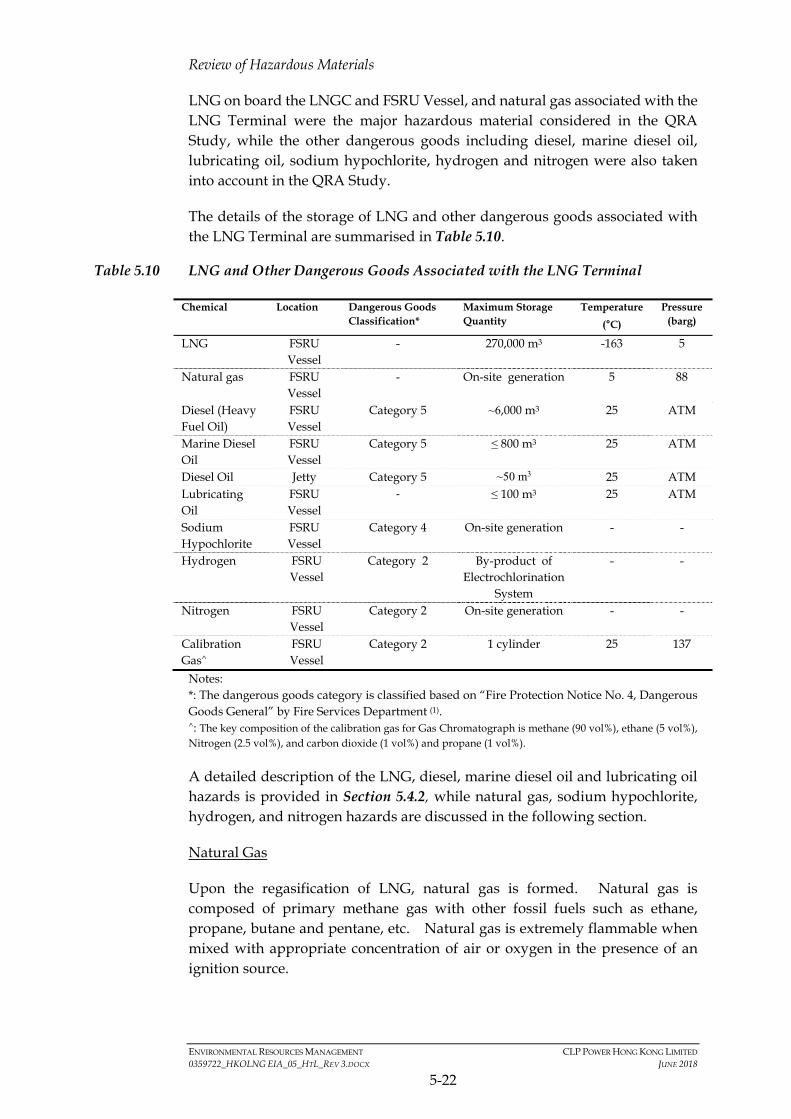
The details of the storage of LNG and other dangerous goods associated with the LNG Terminal are summarised in Table 5.10.
Table 5.10 LNG and Other Dangerous Goods Associated with the LNG Terminal
Chemical Location Dangerous Goods Classification*
Maximum Storage Quantity
Temperature
(°C)
Pressure (barg)
LNG FSRU Vessel
- 270,000 m3 -163 5
Natural gas FSRU Vessel
- On-site generation 5 88
Diesel (Heavy Fuel Oil)
FSRU Vessel
Category 5 ~6,000 m3 25 ATM
Marine Diesel Oil
FSRU Vessel
Category 5 ≤ 800 m3 25 ATM
Diesel Oil Jetty Category 5 ~50 m3 25 ATM Lubricating Oil
FSRU Vessel
- ≤ 100 m3 25 ATM
Sodium Hypochlorite
FSRU Vessel
Category 4 On-site generation - -
Hydrogen FSRU Vessel
Category 2 By-product of Electrochlorination
System
- -
Nitrogen FSRU Vessel
Category 2 On-site generation - -
Calibration Gas^
FSRU Vessel
Category 2 1 cylinder 25 137
Notes: *: The dangerous goods category is classified based on “Fire Protection Notice No. 4, Dangerous Goods General” by Fire Services Department (1). ^: The key composition of the calibration gas for Gas Chromatograph is methane (90 vol%), ethane (5 vol%), Nitrogen (2.5 vol%), and carbon dioxide (1 vol%) and propane (1 vol%).
A detailed description of the LNG, diesel, marine diesel oil and lubricating oil hazards is provided in Section 5.4.2, while natural gas, sodium hypochlorite, hydrogen, and nitrogen hazards are discussed in the following section.
Natural Gas
Upon the regasification of LNG, natural gas is formed. Natural gas is composed of primary methane gas with other fossil fuels such as ethane, propane, butane and pentane, etc. Natural gas is extremely flammable when mixed with appropriate concentration of air or oxygen in the presence of an ignition source.
ENVIRONMENTAL RESOURCES MANAGEMENT CLP POWER HONG KONG LIMITED 0359722_HKOLNG EIA_05_HTL_REV 3.DOCX JUNE 2018
5-23
Not only is the maximum surface emissive power of pure methane higher, but the consequence distances for both flash fire and jet fire hazardous scenarios associated with pure methane is larger than that of natural gas. Therefore, pure methane has been conservatively selected as representative material for natural gas in the consequence modelling conducted using PHAST.
The major hazards arising from loss of containment of natural gas may lead to hazardous scenarios including jet fire, flash fire, and vapour cloud explosion (VCE).
Sodium Hypochlorite (NaOCl)
Chemical Abstracts Service (CAS) number of NaOCl is 7681-52-9, and NaOCl solution is a corrosive liquid with the appearance of colourless to yellowish, and with a chlorine-like odour. NaOCl is not flammable, but it can decompose and release corrosive chorine gas if in contact with acids. NaOCl is produced by an electrochlorination system on board the FSRU Vessel which is a continuous process and does not rely on any stored chlorine gas or hypochlorite brought from off-site.
The expected off-site impact associated with decomposition of the solution is limited. Also, once generated on board the FSRU Vessel, NaOCl is consumed immediately for treatment of seawater. Therefore, NaOCl was not further assessed in the QRA Study.
Hydrogen
CAS number of hydrogen is 1333-74-0, and hydrogen is a colourless and odourless gas at ambient temperature and pressure. It has a boiling point of -253 °C at 1 bara, critical temperature of -240 °C and critical pressure of 13 bara.
Hydrogen gas, produced as by-product during the sodium hypochlorite generation process, flows through the outlet header to the hydrocyclones. Hydrogen degassing happens in the hydrocyclones, and hydrogen is diluted by an air blower before venting to atmosphere. Considering no heat source in the vicinity of the vent stack, the likelihood for small amount of hydrogen to be ignited is limited and any risk impact will only be localized. As such, the risks associated with sodium hypochlorite generation process have not been modelled in the QRA Study.
Hydrogen gas is extremely flammable in oxygen and air, and has the widest range of flammable concentrations in air among all common gaseous hydrocarbons. A limited amount of hydrogen is generated on-board and hence not foreseen to have risk impact on off-site population. Therefore, hydrogen gas was not further assessed in the QRA Study.
Nitrogen
CAS number of nitrogen is 7727-37-9, nitrogen is a nontoxic, odourless, colorless, non-flammable compressed gas generated on board the FSRU Vessel. However,
ENVIRONMENTAL RESOURCES MANAGEMENT CLP POWER HONG KONG LIMITED 0359722_HKOLNG EIA_05_HTL_REV 3.DOCX JUNE 2018
5-24
it can cause rapid suffocation when concentrations are sufficient to reduce oxygen levels below 19.5%.
The expected off-site impact associated with nitrogen is limited as nitrogen is generated for the purpose of inert gas purging after LNG unloading operation. Therefore, nitrogen was not further assessed in the QRA Study.
Calibration Gas
The volume of the compressed gas inside the cylinders is limited and the associated inventory available is small, and also those compressed gas cylinders are located at machinery room. Should loss of containment occur for compressed gas cylinders, there is no off-site impact on the surrounding marine population. Hence, it is not further assessed in the QRA Study.
Review of Potential MAEs
LNG
The possible hazardous scenarios considered in the QRA Study upon the release of LNG with consideration of operating conditions are:
Jet fire;
Pool fire;
Flash fire; and
VCE.
Natural Gas
The possible hazardous scenarios considered in the QRA Study upon the release of high pressure natural gas with consideration of operating conditions are:
Jet fire;
Flash fire;
Fireball; and
VCE.
Considering that the Jetty and the regasification unit on board the FSRU Vessel are relatively congested, a VCE may potentially occur if flammable gas cloud accumulate in these congested areas and is ignited, leading to damaging overpressure.
ENVIRONMENTAL RESOURCES MANAGEMENT CLP POWER HONG KONG LIMITED 0359722_HKOLNG EIA_05_HTL_REV 3.DOCX JUNE 2018
5-25
Other Dangerous Goods
Considering the high flash point temperature of other dangerous goods such as marine diesel oil present in the FSRU Vessel, the possible hazardous scenarios considered in the QRA Study are a pool fire and flash fire.
Detailed characteristics and modelling of the above hazardous scenarios are described in Annex 5G.
Review of Relevant Industry Incidents
To investigate further the possible hazardous scenarios from the FSRU Vessel, the Jetty and the LNGC unloading operation, a review of the applicable past industry incidents at similar facilities worldwide was conducted based on the following incident/ accident database:
Institution of Chemical Engineers (IChemE) accident database;
eMARS (1);
ERNS (2);
MHIDAS database (3); and
SIGTTO (4).
Details of the past industry incident analysis are presented in Annex 5C.
Review of Potential Initiating Events Leading to MAEs
The potential hazardous scenarios arising from the LNG Terminal were identified as loss of containment of LNG, natural gas and other dangerous goods. The potential initiating events which could result in the loss of containment of flammable material including LNG, natural gas and diesel are listed below:
Collision with other passing / visiting marine vessels;
Mooring line failure;
Dropped objects from crane operations on FSRU Vessel;
General equipment/piping failure (due to corrosion, construction defects etc.);
Sloshing;
(1) Major Accident Hazards Bureau (MAHB), https://emars.jrc.ec.europa.eu/?id=4.
(2) ERNS database: http://www.rtk.net/erns/search.php.
(3) UK AEA, Major Hazard Incident Database (MHIDAS) Silver Platter.
(4) http://www.sigtto.org .
ENVIRONMENTAL RESOURCES MANAGEMENT CLP POWER HONG KONG LIMITED 0359722_HKOLNG EIA_05_HTL_REV 3.DOCX JUNE 2018
5-26
LNG containment system failure; and
External effects - adverse weather (typhoon, poor visibility, storm surge, extreme tide), tsunami, lightning, aircraft crash and helicopter crash.
Descriptions of the potential initiating events are presented in Annex 5D.
HAZID Workshop
A HAZID workshop was conducted to confirm and further identify the potential initiating events which may lead to MAEs at the LNG Terminal based on the HAZID team representative’s experience, past industry accidents, lessons learnt and guideword checklists. The HAZID workshop worksheet is summarised in Annex 5E. The HAZID workshop output served as a basis for the identification of potential initiating events and hazardous scenarios for the QRA Study.
Jetty Collision Analysis
The collision frequency at the Jetty was estimated based on the frequency of marine vessels that are likely to be in the vicinity of the LNG Terminal. As a conservative approach, the ship collision frequency in Segment “b” in Table 5.4 (Approaching the LNG Terminal) was adopted as the Jetty collision frequency in the QRA Study.
Identification of Hazardous Sections
A total of twenty five (25) hazardous sections were identified from the LNG Terminal, with consideration of the location of emergency shutdown valves and process conditions (e.g. operating temperature and pressure). The details of each hazardous section (including temperature, pressure, flow rate, etc.) are summarised in Annex 5D. These hazardous sections formed the basis for the development of loss of containment scenarios.
5.5.3 Frequency Analysis
Release Frequency Database
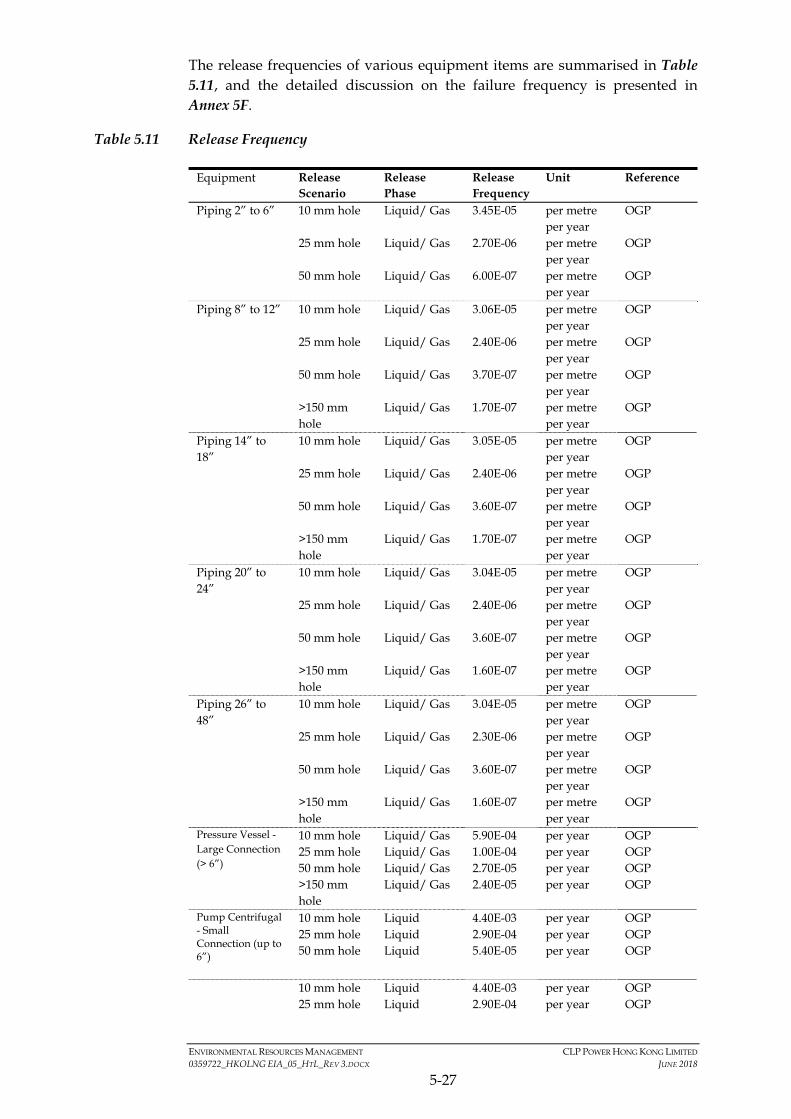
The historical database from the International Association of Oil and Gas Producers (OGP) (1) was adopted in the QRA Study for estimating the release frequency of hazardous scenarios associated with the LNG Terminal. The release frequency in OGP is based on the analysis of the HSE hydrocarbon release database (HCRD) which collected all offshore releases of hydrocarbon in the UK (including the North Sea) reported to the HSE Offshore Division from 1992-2006. Considering that the LNG Terminal is located in an offshore environment in HKSAR waters, this database was considered adequate for purpose of this QRA Study.
(1) OGP, Risk Assessment Data Directly, Report No. 434-.1, March 2010.
ENVIRONMENTAL RESOURCES MANAGEMENT CLP POWER HONG KONG LIMITED 0359722_HKOLNG EIA_05_HTL_REV 3.DOCX JUNE 2018
5-27
The release frequencies of various equipment items are summarised in Table 5.11, and the detailed discussion on the failure frequency is presented in Annex 5F.
Table 5.11 Release Frequency
Equipment Release Scenario
Release Phase
Release Frequency
Unit Reference
Piping 2” to 6” 10 mm hole Liquid/ Gas 3.45E-05 per metre per year
OGP
25 mm hole Liquid/ Gas 2.70E-06 per metre per year
OGP
50 mm hole Liquid/ Gas 6.00E-07 per metre per year
OGP
Piping 8” to 12” 10 mm hole Liquid/ Gas 3.06E-05 per metre per year
OGP
25 mm hole Liquid/ Gas 2.40E-06 per metre per year
OGP
50 mm hole Liquid/ Gas 3.70E-07 per metre per year
OGP
>150 mm hole
Liquid/ Gas 1.70E-07 per metre per year
OGP
Piping 14” to 18”
10 mm hole Liquid/ Gas 3.05E-05 per metre per year
OGP
25 mm hole Liquid/ Gas 2.40E-06 per metre per year
OGP
50 mm hole Liquid/ Gas 3.60E-07 per metre per year
OGP
>150 mm hole
Liquid/ Gas 1.70E-07 per metre per year
OGP
Piping 20” to 24”
10 mm hole Liquid/ Gas 3.04E-05 per metre per year
OGP
25 mm hole Liquid/ Gas 2.40E-06 per metre per year
OGP
50 mm hole Liquid/ Gas 3.60E-07 per metre per year
OGP
>150 mm hole
Liquid/ Gas 1.60E-07 per metre per year
OGP
Piping 26” to 48”
10 mm hole Liquid/ Gas 3.04E-05 per metre per year
OGP
25 mm hole Liquid/ Gas 2.30E-06 per metre per year
OGP
50 mm hole Liquid/ Gas 3.60E-07 per metre per year
OGP
>150 mm hole
Liquid/ Gas 1.60E-07 per metre per year
OGP
Pressure Vessel - Large Connection (> 6”)
10 mm hole Liquid/ Gas 5.90E-04 per year OGP 25 mm hole Liquid/ Gas 1.00E-04 per year OGP 50 mm hole Liquid/ Gas 2.70E-05 per year OGP >150 mm hole
Liquid/ Gas 2.40E-05 per year OGP
Pump Centrifugal - Small Connection (up to 6”)
10 mm hole Liquid 4.40E-03 per year OGP 25 mm hole Liquid 2.90E-04 per year OGP 50 mm hole Liquid 5.40E-05 per year OGP
10 mm hole Liquid 4.40E-03 per year OGP 25 mm hole Liquid 2.90E-04 per year OGP

ENVIRONMENTAL RESOURCES MANAGEMENT CLP POWER HONG KONG LIMITED 0359722_HKOLNG EIA_05_HTL_REV 3.DOCX JUNE 2018
5-28
Equipment Release Scenario
Release Phase
Release Frequency
Unit Reference
Pump Centrifugal - Large Connection (> 6”)
50 mm hole Liquid 3.90E-05 per year OGP >150 mm hole
Liquid 1.50E-05 per year OGP
Compressor Reciprocating - Large Connection (> 6”)
10 mm hole Gas 3.22E-02 per year OGP 25 mm hole Gas 2.60E-03 per year OGP 50 mm hole Gas 4.00E-04 per year OGP >150 mm hole
Gas 4.08E-04 per year OGP
Shell and Tube Heat Exchanger - Large Connection (> 6”)
10 mm hole Liquid/Gas 1.20E-03 per year OGP 25 mm hole Liquid/Gas 1.80E-04 per year OGP 50 mm hole Liquid/Gas 4.30E-05 per year OGP >150 mm hole
Liquid/Gas 3.30E-05 per year OGP
Unloading Arm 10 mm hole Liquefied Gas
4.00E-06* per transfer operation
UK HSE (1)
25 mm hole Liquefied Gas
4.00E-06* per transfer operation
UK HSE (1)
>150 mm hole
Liquefied Gas
7.00E-06 per transfer operation
UK HSE (1)
Riser 10 mm hole Gas 7.2E-05 per year OGP 25 mm hole Gas 1.8E-05 per year OGP >150 mm
hole Gas 3.0E-05 per year OGP
Diesel Storage Tank
10 mm hole Liquid 1.6E-03 per year OGP 25 mm hole Liquid 4.6E-04 per year OGP 50 mm hole Liquid 2.3E-04 per year OGP Rupture Liquid 3.0E-05 per year OGP
Unloading Hose
10 mm hole Liquid 1.3E-05# per hour Purple Book (2)
25 mm hole Liquid 1.3E-05 per hour Purple Book
50 mm hole Liquid 1.3E-05 per hour Purple Book
Rupture Liquid 4.0E-06 per hour Purple Book
LNG Storage Tank
10 mm hole Liquid 3.3E-06! per year OGP
25 mm hole Liquid 3.3E-06! per year OGP 50 mm hole Liquid 3.3E-06! per year OGP Rupture Liquid 2.5E-08 per year OGP
*Notes: The leak frequency of unloading arm, presented in the UK HSE (1), has been evenly distributed into 10 mm and 25 mm hole sizes. #Notes: The leak frequency of unloading hose, presented in the Purple Book (2), has been evenly distributed into 10 mm, 25 mm and 50 mm hole sizes. !Notes: The leak frequency of LNG storage tank, presented in OGP, has been evenly distributed into 10 mm, 25 mm and 50 mm hole sizes.
(1) UK HSE, Failure Rate and Event Data for use within Risk Assessment, 28 June 2012.
(2) Guidelines for Quantitative Risk Assessment, “Purple Book”, 2005.
ENVIRONMENTAL RESOURCES MANAGEMENT CLP POWER HONG KONG LIMITED 0359722_HKOLNG EIA_05_HTL_REV 3.DOCX JUNE 2018
5-29
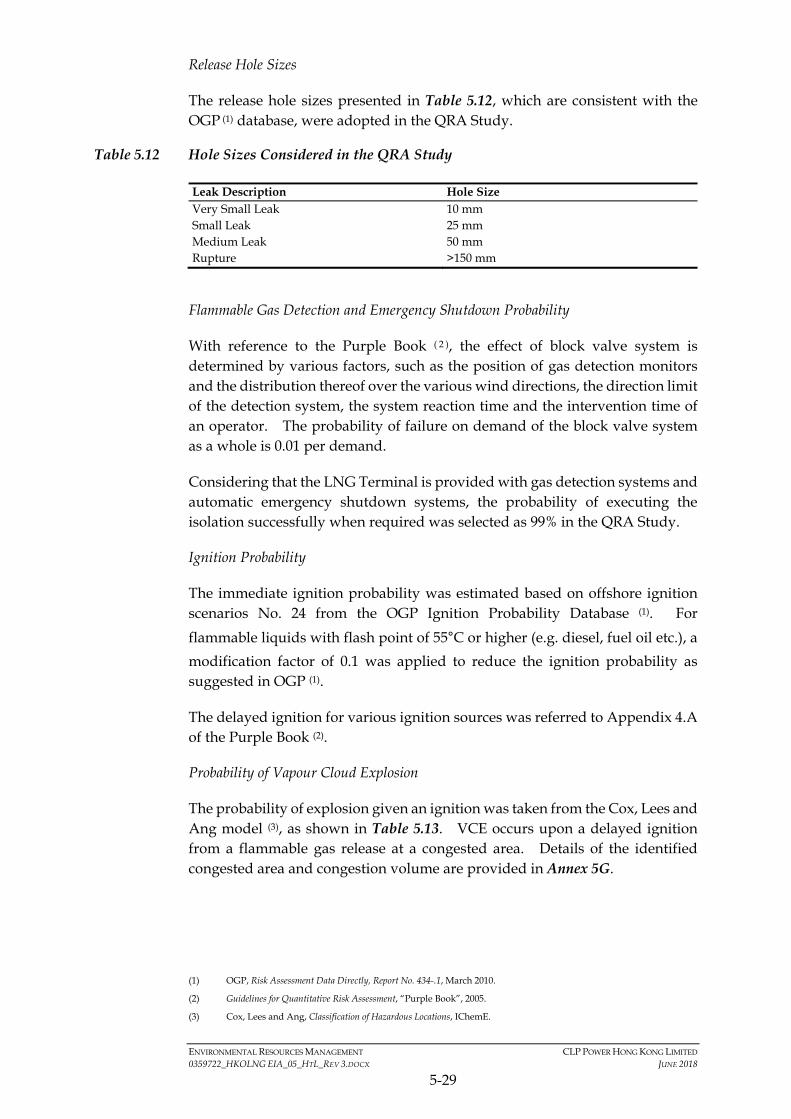
Release Hole Sizes
The release hole sizes presented in Table 5.12, which are consistent with the OGP (1) database, were adopted in the QRA Study.
Table 5.12 Hole Sizes Considered in the QRA Study
Leak Description Hole Size Very Small Leak 10 mm Small Leak 25 mm Medium Leak 50 mm Rupture >150 mm
Flammable Gas Detection and Emergency Shutdown Probability
With reference to the Purple Book ( 2 ), the effect of block valve system is determined by various factors, such as the position of gas detection monitors and the distribution thereof over the various wind directions, the direction limit of the detection system, the system reaction time and the intervention time of an operator. The probability of failure on demand of the block valve system as a whole is 0.01 per demand.
Considering that the LNG Terminal is provided with gas detection systems and automatic emergency shutdown systems, the probability of executing the isolation successfully when required was selected as 99% in the QRA Study.
Ignition Probability
The immediate ignition probability was estimated based on offshore ignition scenarios No. 24 from the OGP Ignition Probability Database (1). For
flammable liquids with flash point of 55°C or higher (e.g. diesel, fuel oil etc.), a
modification factor of 0.1 was applied to reduce the ignition probability as suggested in OGP (1).
The delayed ignition for various ignition sources was referred to Appendix 4.A of the Purple Book (2).
Probability of Vapour Cloud Explosion
The probability of explosion given an ignition was taken from the Cox, Lees and Ang model (3), as shown in Table 5.13. VCE occurs upon a delayed ignition from a flammable gas release at a congested area. Details of the identified congested area and congestion volume are provided in Annex 5G.
(1) OGP, Risk Assessment Data Directly, Report No. 434-.1, March 2010.
(2) Guidelines for Quantitative Risk Assessment, “Purple Book”, 2005.
(3) Cox, Lees and Ang, Classification of Hazardous Locations, IChemE.

ENVIRONMENTAL RESOURCES MANAGEMENT CLP POWER HONG KONG LIMITED 0359722_HKOLNG EIA_05_HTL_REV 3.DOCX JUNE 2018
5-30
Table 5.13 Probability of Explosion
Leak Size (Release Rate) Explosion Probability Minor (< 1 kg s-1) 0.04 Major (1 – 50 kg s-1) 0.12 Massive (> 50 kg s-1) 0.30
Escalation
An initially small release may escalate into a larger, more serious event if a jet fire or pool fire impinges on neighbouring equipment/ piping for an extended time. This is taken into account in the modelling for isolation fail branch of the event tree, depicted in Figure 5F.3.
If neighbouring equipment/ piping is within range of the jet fire event flame zone, an escalation probability of 1/6 (1) (2) has been taken to conservatively estimate the directional probability and chance of impingement. In case pool fire events, the escalation probability was conservatively estimated without considering any directional probability.
Escalation has been assumed to cause only a full bore rupture of the affected equipment and piping, leading to fireball event as the worst-case scenario.
Event Tree Analysis
An event tree analysis was performed to model the development of each hazardous scenario outcome (jet fire, pool fire, flash fire, fireball and VCE) from an initial release scenario. The event tree analysis considered whether there is immediate ignition, delayed ignition or no ignition, with consideration of the associated ignition probability as discussed above. The development of the event tree is presented in Annex 5F.
5.5.4 Consequence Analysis
Source Term Modelling
PHAST was used to estimate the release rates, which were used to determine the ignition probability. Source term modelling was carried out to determine the maximum (e.g. initial) release rate that may be expected should a loss of containment occur.
Release Duration
With reference to the Purple Book (3), the closing time of an automatic block valve system is two (2) minutes; hence a release duration of two (2) minutes was adopted for isolation success case in the QRA Study. Detection and shutdown
(1) ERM, EIA for Liquefied Natural Gas (LNG) Receiving Terminal and Associated Facilities (Register No.: AEIAR-106/2007),
December 2006.
(2) ERM, EIA for Black Point Gas Supply Project (Register No.: AEIAR-150/2010), February 2010.
(3) Guidelines for Quantitative Risk Assessment, “Purple Book”, 2005.

ENVIRONMENTAL RESOURCES MANAGEMENT CLP POWER HONG KONG LIMITED 0359722_HKOLNG EIA_05_HTL_REV 3.DOCX JUNE 2018
5-31
system may however fail due to some reasons. As per the Purple Book (3), the release duration is limited to a maximum of thirty (30) minutes, therefore this was conservatively adopted for the isolation failure case in the QRA Study.
Release Direction
The orientation of a release can have some effects on the hazard footprint calculated by PHAST. The models take into account the momentum of the release, air entrainment, vapourisation rate and liquid rainout fraction.
“Horizontal non-impinging” was selected for modelling the jet fire and flash fire scenarios since the associated hazard footprint is more conservative. “Downward impinging” was selected for modelling the pool fire scenario since the momentum of the release is reduced, thereby increasing the liquid rainout fraction.
Physical Effects Modelling
PHAST was used to perform the physical effects modelling to assess the effects zones for the following hazardous scenarios:
Jet fire;
Pool fire;
Flash fire;
Fireball; and
VCE.
Detailed description of the physical effects modelling is presented in Annex 5G.
Consequence End-Point Criteria
Similarly, as stated in Section 5.4.4, the probit equation was used for assessing the thermal radiation impact and the end point criteria for flash fire, were also adopted in the QRA Study for the LNG Terminal.
The fatality rate within the fireball diameter is assumed to be 100%.
In terms of overpressure, a relatively high overpressure is necessary to lead to significant fatalities for persons outdoor. Indoor population tends to have a higher harm probability due to the risk of structural collapse and flying debris such as breaking windows. Table 5.14 presents the explosion overpressure levels from the Purple Book (1), which were adopted in the QRA Study.
(1) Guidelines for Quantitative Risk Assessment, “Purple Book”, 2005.

ENVIRONMENTAL RESOURCES MANAGEMENT CLP POWER HONG KONG LIMITED 0359722_HKOLNG EIA_05_HTL_REV 3.DOCX JUNE 2018
5-32
Table 5.14 Effect of Overpressure - Purple Book
Explosion Overpressure (barg) Fraction of People Dying Indoor Outdoor > 0.3 1.000 1.000 > 0.1 to 0.3 0.025 0.000
Details of the consequence modelling results are presented in Annex 5G.
5.5.5 Risk Summation
The risk summation for the LNG Terminal was modelled using SAFETI, which is in line with the previous EIA Report that was approved by EPD (1). The hazardous scenarios, the associated frequencies, meteorological data, surrounding off-site population data, and suitable modelling parameters identified were input into SAFETI.
Individual Risk Results
Before commissioning, no LNG, natural gas and other dangerous goods are present at the LNG Terminal in the baseline condition (Year 2017); therefore, the baseline condition assessment was not considered in the QRA Study. In addition, there is no other hazardous installation such as a Potentially Hazardous Installation (PHI) in the vicinity of the LNG Terminal which leads to an increase in cumulative risk.
The cumulative risk was calculated by summing various types of process risks from the LNG Terminal, including the FSRU Vessel, the Jetty and LNGC unloading operation as summarised in Table 5.15.
Table 5.15 Potential Risks Considered in the Cumulative Risk Assessment
Potential Risk 2020 2030 FSRU Vessel, covering LNG, natural gas, other dangerous goods, for all operating modes
Yes Yes
Jetty with topsides equipment, for all operating modes Yes Yes LNGC during LNG unloading operations Yes Yes
The individual risk contours for the LNG Terminal are shown in Figure 5.7 to
Figure 5.8. The individual risk contour of 1 × 10⁻⁵ per year in the Operational
Year in 2020 and Future Scenario Year in 2030 is identified to be within the Safety Zone within the Project Site (Section 3.3). All access into the Project Site must be authorized by the Terminal Operator such that no off-site population will be present within the Project Site. Consequently, the maximum level of off-site individual risk (i.e. outside Safety Zone of the LNG Terminal) associated
with the Hong Kong Offshore LNG Terminal Project would not exceed 1×10⁻⁵
(1) ERM, EIA for Liquefied Natural Gas (LNG) Receiving Terminal and Associated Facilities (Register No.: AEIAR-106/2007),
December 2006.

ENVIRONMENTAL RESOURCES MANAGEMENT CLP POWER HONG KONG LIMITED 0359722_HKOLNG EIA_05_HTL_REV 3.DOCX JUNE 2018
5-33
per year and the individual risk criterion stipulated in Section 2 of Annex 4 of the EIAO-TM is met.
Societal Risk Results
The societal risk for the LNG Terminal was calculated based on the associated process risks and the surrounding off-site marine traffic populations in the vicinity of the Project Site. The societal risk, in terms of F-N curves, for Operational Year in 2020 and Future Scenario Year in 2030, as shown in Figure 5.9, lie within the Acceptable Region, as such the societal risk criteria stipulated in Section 2 of Annex 4 of the EIAO-TM are met.
The key risk contributors, in terms of potential loss of life, associated with the LNG Terminal are summarised in Annex 5H.
5.5.6 Conclusions of QRA Study for the LNG Terminal
The individual risk associated with the LNG Terminal is in compliance with the individual risk criterion stipulated in Section 2 of Annex 4 of the EIAO-TM.
The societal risks, in terms of F-N curves, are within the Acceptable Region and are in compliance with societal risk criteria stipulated in Section 2 of Annex 4 of the EIAO-TM.
5.6 QRA STUDY FOR THE SUBSEA PIPELINES
This Section presents the QRA Study for the evaluation of the risks associated with the subsea BPPS and LPS Pipelines from the Jetty to the proposed GRS facilities at the BPPS and the LPS.
5.6.1 Description of Subsea Pipelines
Subsea BPPS Pipeline
The 30” diameter subsea BPPS Pipeline route commences at the tie-in point to the pig launcher on the Jetty and ends at the proposed GRS at the BPPS. The length of the subsea BPPS pipeline is approximately 45 km.
Subsea LPS Pipeline
The 20” diameter subsea LPS Pipeline route commences at the tie-in point to the pig launcher on the Jetty and ends at the proposed GRS at the LPS. The length of the subsea LPS pipeline is approximately 18 km.
Segmentation of Pipeline Route
In order to examine the risks along the BPPS and LPS Pipeline, it is first necessary to identify the types of vessel that will traverse across the pipeline then segregate the alignment accordingly for assessment and this has been defined as “segment”. This has been done on the basis of water depth which is linked with marine traffic activity (summarised from Table 5A.7 to Table

ENVIRONMENTAL RESOURCES MANAGEMENT CLP POWER HONG KONG LIMITED 0359722_HKOLNG EIA_05_HTL_REV 3.DOCX JUNE 2018
5-34
5A.10 of Annex 5A), as water depth (indicated in Figure 1.2 of Annex 7B) is a constraint to navigation. The water depth along both BPPS and LPS Pipeline route was reviewed within a GIS system based on Hong Kong Electronic Navigational Chart.
The segmentation is also used for trench design of pipeline routes; the principle being that the busier pipeline sections with the larger vessels (hence larger anchor size) required a greater level of trench design and rock berm pipeline protection in these BPPS Pipeline and LPS Pipeline segments.
Based on above considerations, the BPPS and LPS Pipeline routes were divided into eleven (11) and four (4) segments respectively as shown in Figure 5.10 and are presented in Table 5.16 and Table 5.17 respectively.
Table 5.16 BPPS Pipeline Segmentation*
Segment KP- From (km)
KP- To (km)
Water Depth#
(m)
Length (km)
Trench type*
Protection Anchor
Size (T) (1)
X Jetty Approach to South of Soko Islands
0.0 8.9 15 9.2 8.9 4 <24
A Southwest of Soko Islands
8.9 12.1 9.2 12.0 3.2 5 <5
B Southwest of Fan Lau
12.1 15.6 12.0 12.9 3.5 5 <5
C Southwest Lantau 15.6 21.3 12.9 10.6 5.7 2 < 7.3 D West of Tai O 21.3 26.2 10.6 7.7 4.9 5 <5 E West of HKIA 26.2 31.5 7.7 4.6 5.3 5 <5 F West of Sha Chau 31.5 36.0 4.6 6.0 4.5 5 <5 G West of Lung
Kwu Chau 36.0 37.5 6.0 3.1 1.5 3
< 10.6
H Lung Kwu Chau to Urmston Anchorage
37.5 41.1 3.1 4.8 3.6 5 <5
I Urmston Road 41.1 42.9 4.8 5.6 1.8 4 < 24 J West of BPPS 42.9 45.0 5.6 1.6 2.1 5/1 <5
*Proposed pipeline construction methods and trench types are subject to further review with government departments. The lowest protection anchor size for each segment was used for the risk modelling. #:Source: 2016, Charts for Local Vessels, The Hydrographic Office Marine Department; depths are measured at KP Point in meters and are reduced to Chart Datum
(1) Worley Parsons, Pipeline Construction Report.

ENVIRONMENTAL RESOURCES MANAGEMENT CLP POWER HONG KONG LIMITED 0359722_HKOLNG EIA_05_HTL_REV 3.DOCX JUNE 2018
5-35
Table 5.17 Subsea LPS Pipeline Segmentation*
Segment KP- From (km)
KP- To
(km)
Water Depth#
(m)
Length (km)
Trench type*
Protection Anchor
Size (T) (1)
A Jetty Approach to South of Shek Kwu Chau
0.0 5.0 15.0 14.4 5.0 4 <24
B South of Cheung Chau
5.0 14.5 14.4 15.5 9.5 5 <5
C West Lamma Channel
14.5 17.4 15.5 15.7 2.9 5 <5
D Alternative Shore Approach
17.4 18.2 15.7 2.6 0.8 1 <5
*Proposed pipeline construction methods and trench types are subject to further review with government departments. #:Source: 2016, Charts for Local Vessels, The Hydrographic Office Marine Department; depths are measured at KP Point in meters and are reduced to Chart Datum
Pipeline Protection
Different levels of armour rock protection will be provided for each segment of the proposed BPPS and LPS Pipelines based on the identified potential anchor drag and drop hazards. The cross sections of the trench designs and associated armour rock protection are illustrated in Section 3 of the EIA Report.
With consideration of the armour rock protection for the subsea pipelines, the following pipeline protection factors (1) were adopted in the QRA Study:
99.99% is applied, if the vessel anchor size is smaller than the intended design capacity of the pipeline protection; and
0% is applied, if the vessel anchor size is larger than the intended design capacity of the pipeline protection.
5.6.2 Hazard Identification
The hazardous scenarios associated with the two subsea pipelines were identified through the following tasks:
Review of hazardous materials;
Review of potential MAEs;
Review of relevant industry incidents;
Review of potential initiating events leading to MAEs; and
(1) Worley Parsons, Pipeline Construction Report

ENVIRONMENTAL RESOURCES MANAGEMENT CLP POWER HONG KONG LIMITED 0359722_HKOLNG EIA_05_HTL_REV 3.DOCX JUNE 2018
5-36
HAZID Workshop.
Review of Hazardous Materials
The high pressure natural gas is sent out from the LNG Terminal through the BPPS and LPS subsea Pipelines to the GRSs at the BPPS and the LPS. The only identified hazard arising from loss of containment of high pressure natural gas from these subsea pipelines is flash fire. The properties of natural gas have been described in Section 5.5.2.
Review of Potential MAEs
In the event of any leakage or rupture of either the BPPS or LPS Pipelines leading to loss of containment, the flammable gas will bubble to the surface of the sea, and then disperse. The only possible hazardous scenario associated with any leakage or rupture of either of the subsea pipelines is flash fire if the dispersing flammable gas cloud comes in contact with an ignition source, most likely from a passing marine vessel.
Detailed characteristics of the above hazardous effect are described in Annex 5G.
Review of Relevant Industry Incidents
To investigate further the possible hazardous scenarios related to BPPS and LPS pipelines, a review of the applicable past industry incidents at similar facilities worldwide was conducted based on following incident/ accident database:
MHIDAS database;
Institution of Chemical Engineers (IChemE) accident database;
US Gas Pipeline Incident Database;
Pipeline and Riser Loss of Containment (PARLOC); and
Incident Records for Subsea Pipelines in Hong Kong waters.
Details of the past industry incident analysis are presented in Annex 5C.
Review of Potential Initiating Events Leading to MAEs
The key potential hazardous scenarios arising from the subsea pipelines were identified as the loss of containment of natural gas. The potential initiating events which could result in the loss of containment of natural gas are listed below:
Anchor drop and drag;
Grounding;
Vessel sinking;
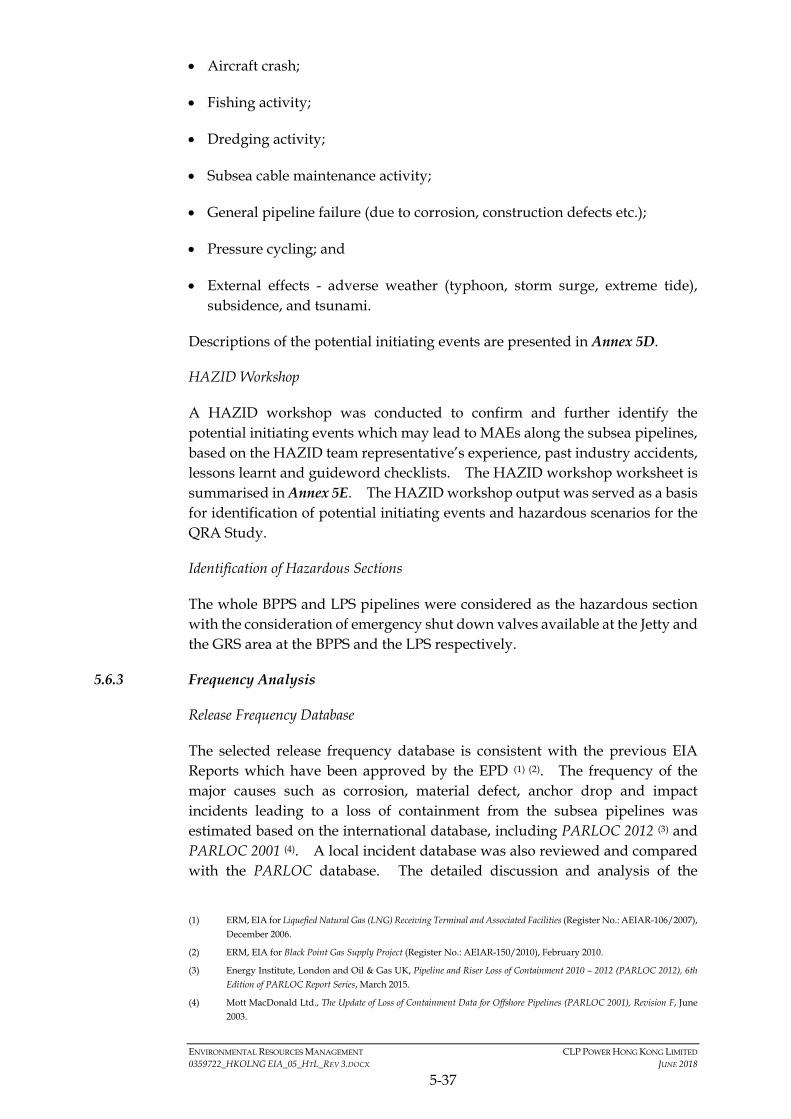
ENVIRONMENTAL RESOURCES MANAGEMENT CLP POWER HONG KONG LIMITED 0359722_HKOLNG EIA_05_HTL_REV 3.DOCX JUNE 2018
5-37
Aircraft crash;
Fishing activity;
Dredging activity;
Subsea cable maintenance activity;
General pipeline failure (due to corrosion, construction defects etc.);
Pressure cycling; and
External effects - adverse weather (typhoon, storm surge, extreme tide), subsidence, and tsunami.
Descriptions of the potential initiating events are presented in Annex 5D.
HAZID Workshop
A HAZID workshop was conducted to confirm and further identify the potential initiating events which may lead to MAEs along the subsea pipelines, based on the HAZID team representative’s experience, past industry accidents, lessons learnt and guideword checklists. The HAZID workshop worksheet is summarised in Annex 5E. The HAZID workshop output was served as a basis for identification of potential initiating events and hazardous scenarios for the QRA Study.
Identification of Hazardous Sections
The whole BPPS and LPS pipelines were considered as the hazardous section with the consideration of emergency shut down valves available at the Jetty and the GRS area at the BPPS and the LPS respectively.
5.6.3 Frequency Analysis
Release Frequency Database
The selected release frequency database is consistent with the previous EIA Reports which have been approved by the EPD (1) (2). The frequency of the major causes such as corrosion, material defect, anchor drop and impact incidents leading to a loss of containment from the subsea pipelines was estimated based on the international database, including PARLOC 2012 (3) and PARLOC 2001 (4). A local incident database was also reviewed and compared with the PARLOC database. The detailed discussion and analysis of the
(1) ERM, EIA for Liquefied Natural Gas (LNG) Receiving Terminal and Associated Facilities (Register No.: AEIAR-106/2007),
December 2006.
(2) ERM, EIA for Black Point Gas Supply Project (Register No.: AEIAR-150/2010), February 2010.
(3) Energy Institute, London and Oil & Gas UK, Pipeline and Riser Loss of Containment 2010 – 2012 (PARLOC 2012), 6th Edition of PARLOC Report Series, March 2015.
(4) Mott MacDonald Ltd., The Update of Loss of Containment Data for Offshore Pipelines (PARLOC 2001), Revision F, June 2003.

ENVIRONMENTAL RESOURCES MANAGEMENT CLP POWER HONG KONG LIMITED 0359722_HKOLNG EIA_05_HTL_REV 3.DOCX JUNE 2018
5-38
release frequency estimation are presented in Annex 5F. The release frequencies adopted in the QRA Study are summarized in Table 5.18 and Table 5.19.
Table 5.18 Summary of Release Frequency along BPPS Pipeline
Pipeline Section Trench Type
Anchor Impact
(/km/yr)
Corrosion/ Defects (/km/yr)
Others (/km/yr)
Total (/km/yr)*
Jetty Approach to South of Soko Islands (X)
4 1.25E-05 1.18E-06 7.90E-07 2.30E-06
Southwest of Soko Islands (A) 5 1.25E-05 1.18E-06 7.90E-07 2.69E-06 Southwest of Fan Lau (B) 5 1.77E-04 1.18E-06 7.90E-07 1.99E-06 Southwest Lantau (C) 2 9.49E-05 1.18E-06 7.90E-07 5.85E-06 West of Tai O (D) 5 9.49E-05 1.18E-06 7.90E-07 1.98E-06 West of HKIA (E) 5 9.49E-05 1.18E-06 7.90E-07 1.98E-06 West of Sha Chau (F) 5 9.49E-05 1.18E-06 7.90E-07 1.98E-06 West of Lung Kwu Chau (G) 3 1.77E-04 1.18E-06 7.90E-07 1.99E-06 Lung Kwu Chau to Urmston Anchorage (H)
5 1.77E-04 1.18E-06 7.90E-07 1.99E-06
Urmston Road (I) 4 1.77E-04 1.18E-06 7.90E-07 1.99E-06 West of BPPS (J) 5/1 9.49E-05 1.18E-06 7.90E-07 1.98E-06
Note: The armour rock protection factor for the subsea pipeline has been taken into account in the total release frequency.
Table 5.19 Summary of Release Frequency along LPS Pipeline
Pipeline Section Trench Type
Anchor Impact
(/km/yr)
Corrosion/ Defects (/km/yr)
Others (/km/yr)
Total (/km/yr) *
Jetty Approach to South of Shek Kwu Chau (A)
4 1.32E-05 1.18E-06 7.90E-07 1.97E-06
South of Cheung Chau (B) 5 1.32E-05 1.18E-06 7.90E-07 1.97E-06 West Lamma Channel (C) 5 1.32E-05 1.18E-06 7.90E-07 1.97E-06 Alternative Shore Approach (D) 1 5.95E-05 1.18E-06 7.90E-07 1.98E-06
Note: The armour rock protection factor for the subsea pipeline has been taken into account in the total release frequency.
Hole Size Distribution
The international databases (such as PARLOC 2012 and PARLOC 2001) were reviewed. The hole size distributions for anchor impact scenarios and corrosion/other scenarios are given in Table 5.20 and Table 5.21, are consistent with previous EIA Reports which have been approved by the EPD (1). Detailed analysis of the derivation of the hole size distribution is provided in Annex 5F.
(1) ERM, EIA for Liquefied Natural Gas (LNG) Receiving Terminal and Associated Facilities (Register No.: AEIAR-106/2007),
December 2006.

ENVIRONMENTAL RESOURCES MANAGEMENT CLP POWER HONG KONG LIMITED 0359722_HKOLNG EIA_05_HTL_REV 3.DOCX JUNE 2018
5-39
Table 5.20 Hole Size Distribution for Anchor Impact Cases
Category Hole Size (Subsea BPPS Pipeline)
Hole Size (Subsea LPS Pipeline)
Proportion
Rupture (Full Bore) Full Bore Full Bore 10% Major 15”or 381 mm (Half Bore) 10”or 254 mm (Half Bore) 20% Minor 4”or 100 mm 4” or 100 mm 70%
Table 5.21 Hole Size Distribution for Corrosion and Other Failure Cases
Category Hole Size (Subsea BPPS Pipeline)
Hole Size (Subsea LPS Pipeline)
Proportion
Rupture (Half Bore) 15” or 381 mm 10” or 254 mm 5% Puncture 4”or 100 mm 4”or 100 mm 15% Hole 2”or 50 mm 2”or 50 mm 30% Leak <25 mm <25 mm 50%
Ignition Probability
The ignition of any release natural gas is expected only from passing vessels in the vicinity of either subsea pipeline. The ignition probabilities consistent with previous EIA Reports which have been approved by the EPD (1) (2), were adopted in the QRA Study and are summarised in Table 5.22.
Table 5.22 Ignition Probability for Subsea Pipeline
Release Case Ignition Probability Passing Vessels* Vessels in Vicinity# <25 mm 0.01 n/a 50 mm 0.05 n/a 100 mm 0.10 0.15 Half bore 0.20 0.30 Full bore 0.30 0.40
Note: *: Values applied to passing vessels for all types of incidents, i.e. corrosion, others and anchor impact.
#: Values applied only to scenarios where the vessel causing pipeline damage due to anchor impact is still in the vicinity.
Event Tree Analysis
An event tree analysis was performed to model the development of each hazardous scenario outcome (flash fire) from an initial release scenario. The event tree analysis considered whether there is delayed ignition or no ignition, with consideration of the associated ignition probability as discussed above. The development of the event tree analysis is presented in Annex 5F.
(1) ERM, EIA for Liquefied Natural Gas (LNG) Receiving Terminal and Associated Facilities (Register No.: AEIAR-106/2007),
December 2006.
(2) ERM, EIA for Black Point Gas Supply Project (Register No.: AEIAR-150/2010), February 2010.

ENVIRONMENTAL RESOURCES MANAGEMENT CLP POWER HONG KONG LIMITED 0359722_HKOLNG EIA_05_HTL_REV 3.DOCX JUNE 2018
5-40
5.6.4 Consequence Analysis
Source Term Modelling
The release rate was estimated based on standard equations for discharge through an orifice. As per previous EIA Reports which have been approved by the EPD (1) (2), for large release with hole size greater than 100 mm, the empirical correlation developed by Bell and modified by Wilson (3) was adopted in the QRA Study. Detailed explanation of source term modelling is provided in Annex 5G.
Dispersion Modelling For Subsea Pipeline Releases
In the event of a flammable gas release from the subsea pipelines, the flammable gas will bubble to the sea surface and disperse. As per previous EIA Reports (1) (2) which have been approved by the EPD, a simple cone model was adopted to determine the release area on the sea surface. For the deepest water depth (i.e. about 25 m around Southwest of Fan Lau) along the subsea pipelines, it was predicted by the cone model that the diameter of the release area was about 10 m. Detailed explanation of the cone model is provided in Annex 5G.
Dispersion above Sea Surface
The flammable gas disperses into atmosphere upon reaching the sea surface. The distance to which the flammable gas envelope extends depends on ambient conditions such as wind speed and atmospheric stability as well as source conditions. As per previous EIA Reports which have been approved by the EPD (1) (2), the extent of the flammable area was taken as the distance to 0.85 LFL. PHAST was used to model the plume dispersion as an area source on the sea surface. Detailed explanation of the dispersion modelling above sea surface is provided in Annex 5G.
Consequence and Impact Assessment
The consequence and impact assessment, as described below, was conducted as per previous EIA Reports which have been approved by the EPD (1) (2).
Impact on Marine Vessel Population
A flash fire could cause injury to personnel on marine vessels. It may also cause secondary fires on the marine vessel. If a marine vessel passes close to the ‘release area’ (where bubbles of natural gas break through the sea surface), the consequences will be more severe and a 100% fatality probability was taken for this scenario. Once a fire has ignited, it is presumed that no further marine vessels will be involved because the fire will be visible and other marine vessels
(1) ERM, EIA for Liquefied Natural Gas (LNG) Receiving Terminal and Associated Facilities (Register No.: AEIAR-106/2007),
December 2006.
(2) ERM, EIA for Black Point Gas Supply Project (Register No.: AEIAR-150/2010), February 2010.
(3) P J Rew, P Gallagher, D M Deaves, Dispersion of Subsea Release: Review of Prediction Methodologies, Health and Safety Executive, 1995.

ENVIRONMENTAL RESOURCES MANAGEMENT CLP POWER HONG KONG LIMITED 0359722_HKOLNG EIA_05_HTL_REV 3.DOCX JUNE 2018
5-41
can take action to avoid the area. In other words, at most only one marine vessel may be affected.
The hazardous impact area of the flammable cloud was taken to be the distance to 0.85 LFL. Taking into account the protection factors of various types of marine vessel, the fatalities adopted in the QRA Study are as given in Table 5.23.
Table 5.23 Fatality Probability for Subsea Pipelines’ MAEs
Marine Vessel Class Fatality Probability Release Area Cloud Area Fishing vessels 1 0.9 Rivertrade coastal vessel 1 0.3 Ocean-going vessels 1 0.1 Fast launches 1 0.9 Fast ferries 1 0.4 Others 1 0.3
Note: Release area indicates the area where gas bubbles break through the sea surface; and cloud area indicates the hazardous distance of 0.85 LFL of the flammable gas cloud.
In addition, the probability that a marine vessel will pass through the flammable plume was calculated based on the size of the plume (obtained from dispersion modelling) and the marine traffic density.
Detailed discussion on the estimation of the above probabilities is presented in Annex 5G.
Impact on Road Traffic Population on Hong Kong Link Road
The BPPS Pipeline will pass under the Hong Kong Link Road (HKLR) at a location within the West of Tai O Section. The transient road traffic population on the bridge may be affected if a flammable gas cloud is ignited under / in the vicinity of the bridge area. This hazardous scenario was considered in the consequence analysis for the West of Tai O Section of the BPPS Pipeline. The associated risk impact did not make a significant contribution to the overall risk results. Detailed assessment result is presented in Annex 5G.
Impact of Aircraft approaching Hong Kong International Airport
The West of HKIA Section of the BPPS Pipeline is located in the vicinity of the Hong Kong International Airport (HKIA). Large gas releases from the BPPS Pipeline, such as those that occur from a full bore or half bore rupture, may have the potential to produce a flammable gas cloud that extends higher than 200 m. It is therefore possible that an aircraft on its approach to landing may pass through a gas cloud within the flammability limits. This scenario was considered in the consequence analysis and it was observed that the associated risk did not make a significant contribution to the overall risk results. Detailed assessment result is presented in Annex 5G.

ENVIRONMENTAL RESOURCES MANAGEMENT CLP POWER HONG KONG LIMITED 0359722_HKOLNG EIA_05_HTL_REV 3.DOCX JUNE 2018
5-42
Impact on Macau Helicopters
Helicopters shuttling to and from Macau pass over the Southwest of Fan Lau Section of the BPPS Pipeline at about 500 feet (150 m) altitude. Similarly, the above large gas releases may impact on the helicopters. The hazard distance was taken to be the maximum width of the gas cloud above 150 m altitude. The associated risk did not make a significant contribution to the overall risk results. Detailed assessment result is presented in Annex 5G.
Consequence Results
The hazard distances that were used in the QRA Study were determined from the gas dispersion modelling. The hazard distance for marine vessels was defined as the maximum width of the gas cloud below a height of 50 m above sea level. Similarly, the hazard distance for aircraft was defined above as 200 m and for helicopters was defined as above 150 m from sea level. The hazard distances obtained from dispersion modelling are summarised in Annex 5G.
5.6.5 Risk Summation
The risk summation for the BPPS and LPS Pipelines combines the estimation of the consequences of an event with the event probabilities to give an estimate of the resulting frequency of varying levels of fatalities. Risk summation was implemented in ERM’s proprietary risk integration package, which took into account input data for initiating event frequency, event frequency, event tree branch probabilities, number of exposed persons and fatality probability.
Individual Risk Results
The individual risk contours associated with the BPPS Pipeline and LPS Pipeline are shown in Table 5.24, Table 5.25, Table 5.26 and Table 5.27 respectively for Operational Year in 2020 and Future Scenario Year in 2030.
The individual risk contour of 1 × 10⁻⁵ per year was not reached for all
sections of the subsea BPPS and LPS Pipelines in both assessment years, as such the individual risk criterion stipulated in Section 2 of Annex 4 of the EIAO-TM is met for the current proposed subsea pipeline design.
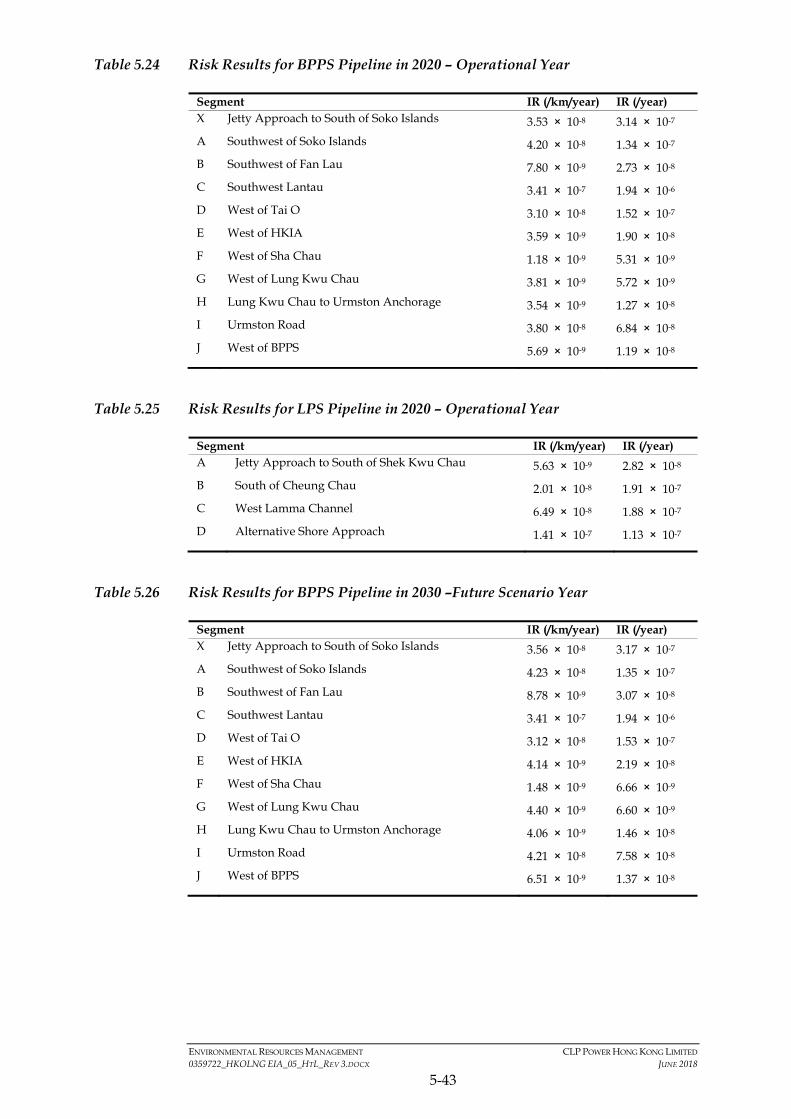
ENVIRONMENTAL RESOURCES MANAGEMENT CLP POWER HONG KONG LIMITED 0359722_HKOLNG EIA_05_HTL_REV 3.DOCX JUNE 2018
5-43
Table 5.24 Risk Results for BPPS Pipeline in 2020 – Operational Year
Segment IR (/km/year) IR (/year) X Jetty Approach to South of Soko Islands 3.53 × 10⁻⁸ 3.14 × 10⁻⁷
A Southwest of Soko Islands 4.20 × 10⁻⁸ 1.34 × 10⁻⁷
B Southwest of Fan Lau 7.80 × 10⁻⁹ 2.73 × 10⁻⁸
C Southwest Lantau 3.41 × 10⁻⁷ 1.94 × 10⁻⁶
D West of Tai O 3.10 × 10⁻⁸ 1.52 × 10⁻⁷
E West of HKIA 3.59 × 10⁻⁹ 1.90 × 10⁻⁸
F West of Sha Chau 1.18 × 10⁻⁹ 5.31 × 10⁻⁹
G West of Lung Kwu Chau 3.81 × 10⁻⁹ 5.72 × 10⁻⁹
H Lung Kwu Chau to Urmston Anchorage 3.54 × 10⁻⁹ 1.27 × 10⁻⁸
I Urmston Road 3.80 × 10⁻⁸ 6.84 × 10⁻⁸
J West of BPPS 5.69 × 10⁻⁹ 1.19 × 10⁻⁸
Table 5.25 Risk Results for LPS Pipeline in 2020 – Operational Year
Segment IR (/km/year) IR (/year) A Jetty Approach to South of Shek Kwu Chau 5.63 × 10⁻⁹ 2.82 × 10⁻⁸
B South of Cheung Chau 2.01 × 10⁻⁸ 1.91 × 10⁻⁷
C West Lamma Channel 6.49 × 10⁻⁸ 1.88 × 10⁻⁷
D Alternative Shore Approach 1.41 × 10⁻⁷ 1.13 × 10⁻⁷
Table 5.26 Risk Results for BPPS Pipeline in 2030 –Future Scenario Year
Segment IR (/km/year) IR (/year) X Jetty Approach to South of Soko Islands 3.56 × 10⁻⁸ 3.17 × 10⁻⁷
A Southwest of Soko Islands 4.23 × 10⁻⁸ 1.35 × 10⁻⁷
B Southwest of Fan Lau 8.78 × 10⁻⁹ 3.07 × 10⁻⁸
C Southwest Lantau 3.41 × 10⁻⁷ 1.94 × 10⁻⁶
D West of Tai O 3.12 × 10⁻⁸ 1.53 × 10⁻⁷
E West of HKIA 4.14 × 10⁻⁹ 2.19 × 10⁻⁸
F West of Sha Chau 1.48 × 10⁻⁹ 6.66 × 10⁻⁹
G West of Lung Kwu Chau 4.40 × 10⁻⁹ 6.60 × 10⁻⁹
H Lung Kwu Chau to Urmston Anchorage 4.06 × 10⁻⁹ 1.46 × 10⁻⁸
I Urmston Road 4.21 × 10⁻⁸ 7.58 × 10⁻⁸
J West of BPPS 6.51 × 10⁻⁹ 1.37 × 10⁻⁸

ENVIRONMENTAL RESOURCES MANAGEMENT CLP POWER HONG KONG LIMITED 0359722_HKOLNG EIA_05_HTL_REV 3.DOCX JUNE 2018
5-44
Table 5.27 Risk Results for LPS Pipeline in 2030 – Future Scenario Year
Segment IR (/km/year) IR (/year) A Jetty Approach to South of Shek Kwu Chau 6.93 × 10⁻⁹ 3.47 × 10⁻⁸
B South of Cheung Chau 2.23 × 10⁻⁸ 2.12 × 10⁻⁷
C West Lamma Channel 6.62 × 10⁻⁸ 1.92 × 10⁻⁷
D Alternative Shore Approach 1.51 × 10⁻⁷ 1.21 × 10⁻⁷
Societal Risk Results
The societal risk in terms of F-N curves for all sections of the BPPS and LPS Pipelines in Operational Year 2020 and Future Scenario Year 2030 lie within the Acceptable Region, as shown from Figure 5.11 to Figure 5.14. Therefore, the societal risk criteria stipulated in Section 2 of Annex 4 of the EIAO-TM are met.
The societal risk, in terms of potential loss of life, associated with each segment of the BPPS and LPG subsea pipelines are summarised in Annex 5H.
5.6.6 Uncertainty Analysis
An uncertainty analysis was conducted to assess the sensitivity of the subsea pipeline protection factors adopted in the QRA Study. In the uncertainty analysis, the subsea pipeline protection factors adopted in previous EIA Report that has been approved by the EPD (1) were adopted as shown in Table 5.28. This effectively considers a worst case protection factor for the subsea pipeline protection factor.
Table 5.28 Subsea Pipeline Protection Factors for Uncertainty Analysis
Anchor Size Trench Type Design Subsea Pipeline Protection Factor <2 tonnes Protect against 20 tonnes 99.9% >2 tonnes Protect against 20 tonnes 99.0% <2 tonnes Protect against 2 tonnes 99.0% >2 tonnes Protect against 2 tonnes 50.0%
BPPS Pipeline
Based on the uncertainty analysis results, even if a worst case protection factor
is assumed, the individual risk remains less than 1 × 10⁻⁵ per year for all
segments of the BPPS Pipeline. The societal risk remains within the Acceptable Region in Year 2020 (Figure 5.15) for the uncertainty analysis. In Year 2030 the societal risk generally remains within the Acceptable Region (Figure 5.16) for the uncertainty analysis. Therefore the risk criteria stipulated in Section 2 of Annex 4 of the EIAO-TM are met.
(1) ERM, EIA for Liquefied Natural Gas (LNG) Receiving Terminal and Associated Facilities (Register No.: AEIAR-106/2007),
December 2006.
ENVIRONMENTAL RESOURCES MANAGEMENT CLP POWER HONG KONG LIMITED 0359722_HKOLNG EIA_05_HTL_REV 3.DOCX JUNE 2018
5-45
The BPPS Pipeline segments, including Southwest of Fan Lau and Lung Kwu Chau to Urmston Anchorage, were identified as the highest risk because of those segments are with high marine traffic (high failure frequency) and high marine traffic population.
LPS Pipeline
Based on the uncertainty analysis results, even if a worst case protection factor
is assumed, the individual risk remains less than 1 × 10⁻⁵ per year for all
segments of the LPS Pipeline. The societal risk was within the Acceptable Region in Year 2020 and Year 2030, as shown in Figure 5.17 and Figure 5.18. Therefore the risk criteria stipulated in Section 2 of Annex 4 of the EIAO-TM are met.
The LPS Pipeline segments, Alternative Shore Approach and West Lamma Channel, were identified as the relatively high risk because this segments are with relatively high failure frequency considering marine traffic and segment length.
5.6.7 Conclusions of QRA Study for Subsea Pipelines
It is concluded that the risks associated with the BPPS and LPS Pipelines in terms of individual risk and societal risk are in compliance with risk criteria stipulated in Section 2 of Annex 4 of the EIAO-TM for the current proposed subsea pipeline design.
5.7 QRA STUDY FOR THE GAS RECEIVING STATIONS AT THE BPPS AND LPS
This section presents the QRA Study for the evaluation of the risks associated with the GRSs at the BPPS and the LPS.
5.7.1 Description of the BPPS Gas Receiving Station
The GRS at the BPPS receives high pressure natural gas (at the maximum
allowable operating pressure of 88 barg at 5 °C) transported through the 30”
subsea BPPS Pipeline from the Jetty. The maximum flow rate is 700 mmscfd, and the GRS controls the pressure that the natural gas enters the BPPS, prior to entering the gas turbines for power generation. The section of the interconnecting onshore gas pipeline within the GRS site boundary was also considered in the QRA Study.
The major equipment items associated with the GRS include (the detailed process description is provided in Annex 5B):
Pig Receiver;
Gas Filter;
Gas Metering;

ENVIRONMENTAL RESOURCES MANAGEMENT CLP POWER HONG KONG LIMITED 0359722_HKOLNG EIA_05_HTL_REV 3.DOCX JUNE 2018
5-46
Pipeline Gas Heater;
Pressure Reduction Skid; and
Mixing Station.
5.7.2 Description of the LPS Gas Receiving Station
The GRS at the LPS receives high pressure natural gas (at the maximum
allowable operating pressure of 88 barg at 5 °C) transported through the 20”
subsea LPS Pipeline from the Jetty. The maximum total flow rate is 254 mmscfd. Four (4) natural gas conditioning trains are provided at the GRS, with maximum flow rate of 63.5 mmscfd for each train. The GRS allows final natural gas conditioning prior to entering the gas turbines for power generation. The section of the interconnecting onshore gas pipeline within the GRS site boundary was also considered in the QRA Study.
The major equipment items associated with the GRS include the detailed process description is provided in Annex 5B.
Pig Receiver;
Gas Filter;
Gas Metering;
Mixer;
Water Bath Heater; and
Pressure Reduction Skid.
Key Safety Systems for GRSs at the BPPS and the LPS
The following safety systems are provided at the GRSs at the BPPS and LPS, and the detailed description of the safety system is provided in Annex 5B.
Emergency Shutdown System;
Blowdown System;
Overpressure Protection System; and
Fire and Gas Detection System.
5.7.3 Hazard Identification
The hazardous scenarios associated with the operation of the GRSs at the BPPS and LPS were identified through the following tasks:
Review of hazardous materials;
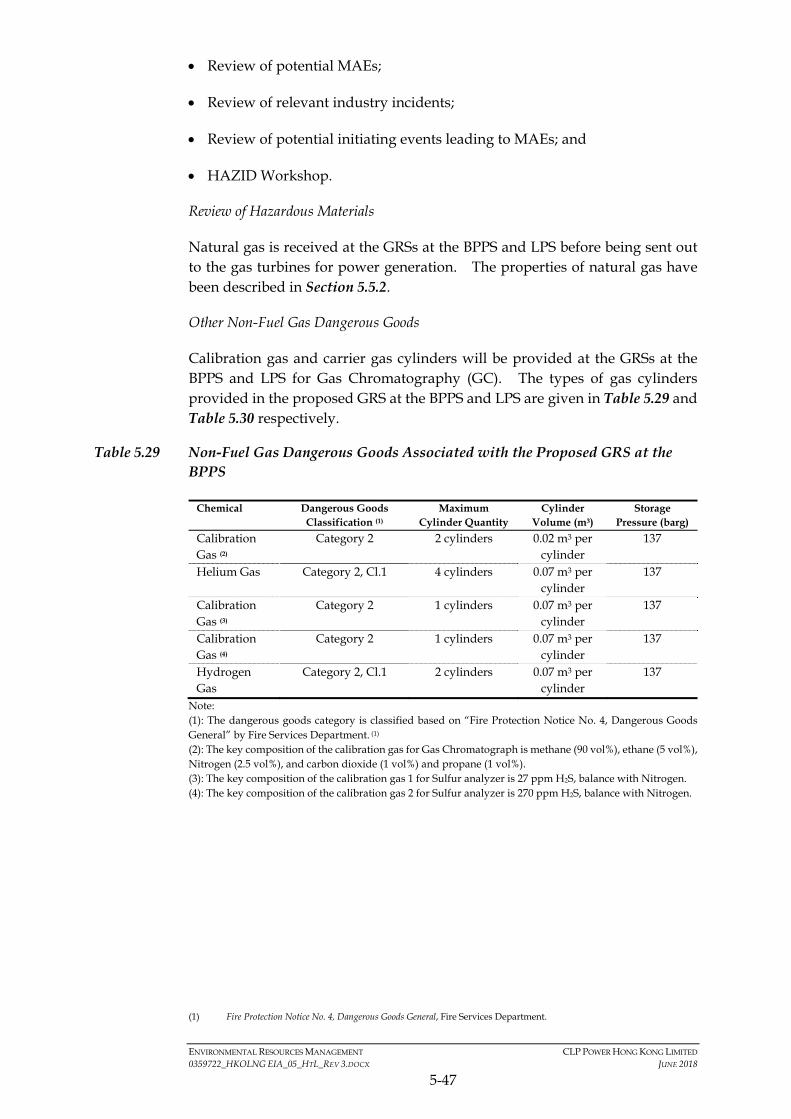
ENVIRONMENTAL RESOURCES MANAGEMENT CLP POWER HONG KONG LIMITED 0359722_HKOLNG EIA_05_HTL_REV 3.DOCX JUNE 2018
5-47
Review of potential MAEs;
Review of relevant industry incidents;
Review of potential initiating events leading to MAEs; and
HAZID Workshop.
Review of Hazardous Materials
Natural gas is received at the GRSs at the BPPS and LPS before being sent out to the gas turbines for power generation. The properties of natural gas have been described in Section 5.5.2.
Other Non-Fuel Gas Dangerous Goods
Calibration gas and carrier gas cylinders will be provided at the GRSs at the BPPS and LPS for Gas Chromatography (GC). The types of gas cylinders provided in the proposed GRS at the BPPS and LPS are given in Table 5.29 and Table 5.30 respectively.
Table 5.29 Non-Fuel Gas Dangerous Goods Associated with the Proposed GRS at the BPPS
Chemical Dangerous Goods Classification (1)
Maximum Cylinder Quantity
Cylinder Volume (m3)
Storage Pressure (barg)
Calibration Gas (2)
Category 2 2 cylinders 0.02 m3 per cylinder
137
Helium Gas Category 2, Cl.1 4 cylinders 0.07 m3 per cylinder
137
Calibration Gas (3)
Category 2 1 cylinders 0.07 m3 per cylinder
137
Calibration Gas (4)
Category 2 1 cylinders 0.07 m3 per cylinder
137
Hydrogen Gas
Category 2, Cl.1 2 cylinders 0.07 m3 per cylinder
137
Note: (1): The dangerous goods category is classified based on “Fire Protection Notice No. 4, Dangerous Goods General” by Fire Services Department. (1)
(2): The key composition of the calibration gas for Gas Chromatograph is methane (90 vol%), ethane (5 vol%), Nitrogen (2.5 vol%), and carbon dioxide (1 vol%) and propane (1 vol%). (3): The key composition of the calibration gas 1 for Sulfur analyzer is 27 ppm H2S, balance with Nitrogen. (4): The key composition of the calibration gas 2 for Sulfur analyzer is 270 ppm H2S, balance with Nitrogen.
(1) Fire Protection Notice No. 4, Dangerous Goods General, Fire Services Department.
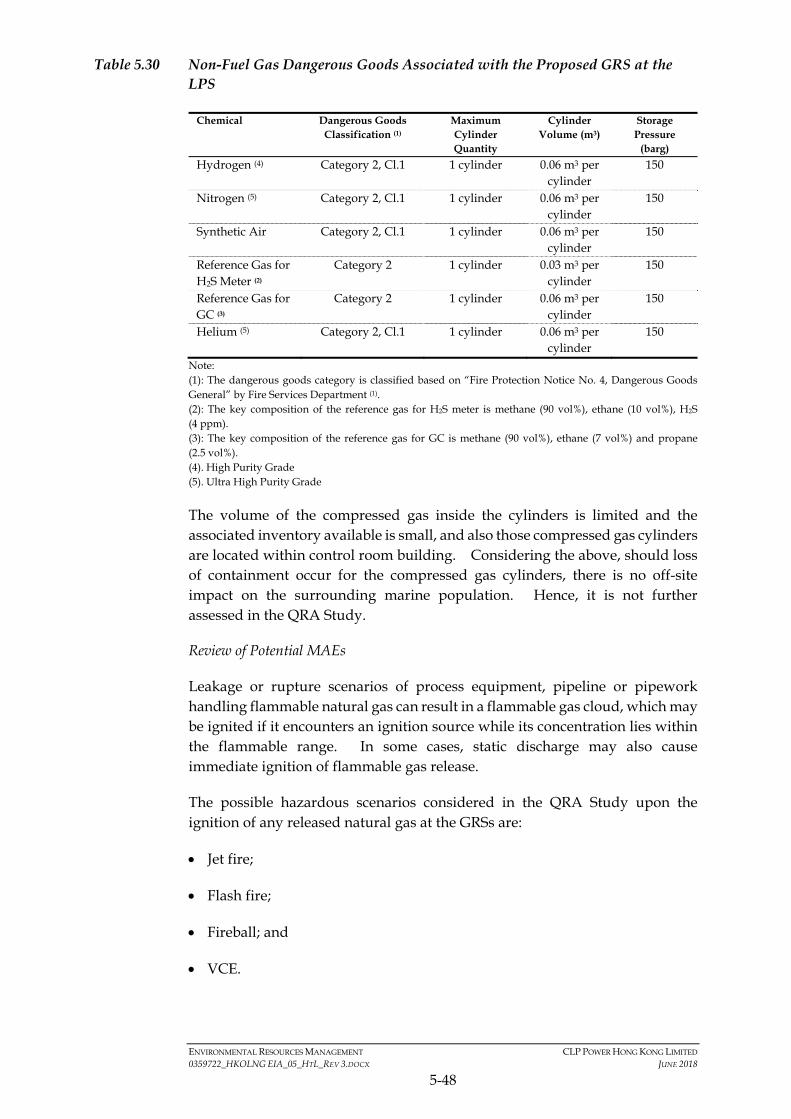
ENVIRONMENTAL RESOURCES MANAGEMENT CLP POWER HONG KONG LIMITED 0359722_HKOLNG EIA_05_HTL_REV 3.DOCX JUNE 2018
5-48
Table 5.30 Non-Fuel Gas Dangerous Goods Associated with the Proposed GRS at the LPS
Chemical Dangerous Goods Classification (1)
Maximum Cylinder Quantity
Cylinder Volume (m3)
Storage Pressure
(barg)
Hydrogen (4) Category 2, Cl.1 1 cylinder 0.06 m3 per cylinder
150
Nitrogen (5) Category 2, Cl.1 1 cylinder 0.06 m3 per cylinder
150
Synthetic Air Category 2, Cl.1 1 cylinder 0.06 m3 per cylinder
150
Reference Gas for H2S Meter (2)
Category 2 1 cylinder 0.03 m3 per cylinder
150
Reference Gas for GC (3)
Category 2 1 cylinder 0.06 m3 per cylinder
150
Helium (5) Category 2, Cl.1 1 cylinder 0.06 m3 per cylinder
150
Note: (1): The dangerous goods category is classified based on “Fire Protection Notice No. 4, Dangerous Goods General” by Fire Services Department (1).
(2): The key composition of the reference gas for H2S meter is methane (90 vol%), ethane (10 vol%), H2S (4 ppm). (3): The key composition of the reference gas for GC is methane (90 vol%), ethane (7 vol%) and propane (2.5 vol%). (4). High Purity Grade (5). Ultra High Purity Grade
The volume of the compressed gas inside the cylinders is limited and the associated inventory available is small, and also those compressed gas cylinders are located within control room building. Considering the above, should loss of containment occur for the compressed gas cylinders, there is no off-site impact on the surrounding marine population. Hence, it is not further assessed in the QRA Study.
Review of Potential MAEs
Leakage or rupture scenarios of process equipment, pipeline or pipework handling flammable natural gas can result in a flammable gas cloud, which may be ignited if it encounters an ignition source while its concentration lies within the flammable range. In some cases, static discharge may also cause immediate ignition of flammable gas release.
The possible hazardous scenarios considered in the QRA Study upon the ignition of any released natural gas at the GRSs are:
Jet fire;
Flash fire;
Fireball; and
VCE.

ENVIRONMENTAL RESOURCES MANAGEMENT CLP POWER HONG KONG LIMITED 0359722_HKOLNG EIA_05_HTL_REV 3.DOCX JUNE 2018
5-49
Detailed characteristics of the above hazardous effect are described in Annex 5G.
Review of Relevant Industry Incidents
To investigate further the possible hazardous scenarios, a review of the applicable past industry incidents at similar facilities worldwide was conducted based on the following incident/ accident database:
IChemE accident database
eMARS;
ERNS; and
MHIDAS database.
Details of the past industry incident analysis are presented in Annex 5C.
Review of Potential Initiating Events leading to MAEs
The potential hazardous scenarios arising from the operation of the GRSs at the BPPS and LPS was identified as the loss of containment of natural gas. The potential initiating events which could result in loss of containment of natural gas are listed below:
General equipment/piping failure (due to corrosion, construction defects etc.); and
External effects - earthquake, subsidence, tsunami, lightning, hill fire, storm surge and flooding, aircraft crash and helicopter crash.
Descriptions of the potential initiating events are presented in Annex 5D.
HAZID Workshop
A HAZID workshop was conducted to confirm and further identify the potential initiating events which may lead to MAEs at the GRSs, based on the HAZID team representatives’ experience, past industry accidents, lessons learnt and guideword checklists. The HAZID workshop worksheet is summarised in Annex 5E. The HAZID workshop output was served as a basis for the identification of potential initiating events and hazardous scenarios for the QRA Study.
External Hazards of Construction Activities
During the peak construction period of the GRSs in the beginning of 2020, the associated construction activities may cause potential external hazards on the existing GRSs facilities located in the nearby area. The construction activities considered in the QRA Study are listed below:

ENVIRONMENTAL RESOURCES MANAGEMENT CLP POWER HONG KONG LIMITED 0359722_HKOLNG EIA_05_HTL_REV 3.DOCX JUNE 2018
5-50
Movement of large equipment/ construction vehicles in the vicinity of the existing GRS facilities area;
Dropped object from crane operation;
General construction hazards such as hot work, drilling, etc.; and
Tie-in works to existing facilities.
Detailed analysis of each identified construction activities are presented in Annex 5D.
Development of Hazardous Sections
The new GRSs and existing GRSs at the BPPS and LPS were divided into a number of hazardous sections for detailed analysis in the QRA Study based on location of emergency shutdown valves and process conditions (e.g. operating temperature and pressure). The details of each hazardous section (including temperature, pressure, flow rate, inventory etc.) are presented in Annex 5D.
5.7.4 Frequency Analysis
As per previous EIA Reports that have been approved by EPD (1) (2) (3), the release frequencies from Hawksley, as summarised in Table 5.31, were adopted in the QRA Study.
Table 5.31 Release Event Frequencies
Equipment Release Scenario Release Phase Release Frequency
Unit Reference
Pipe size 600 mm to 750 mm
i) 10 & 25 mm hole Liquid/ Gas 1.00E-07 per metre-year Hawksley (4) ii) 50 & 100 mm hole Liquid/ Gas 7.00E-08 per metre-year Hawksley iii) Full bore rupture Liquid/ Gas 3.00E-08 per metre-year Hawksley
Pipe size 150 mm to 500 mm
i) 10 & 25 mm hole Liquid/ Gas 3.00E-07 per metre-year Hawksley ii) 50 & 100 mm hole Liquid/ Gas 1.00E-07 per metre-year Hawksley iii) Full bore rupture Liquid/ Gas 5.00E-08 per metre-year Hawksley
In addition, in accordance with the methodology used in previous EIA Reports that have been approved by EPD (2) a fault tree analysis was conducted to calculate the frequency of construction vehicles impacting the existing GRS facilities during the construction phase of the GRSs at the BPPS and LPS. The frequency of construction vehicle impact on the existing BPPS GRS and LPS
GRS was estimated as 1.53 × 10⁻⁶ per year and 9.20 × 10⁻⁷ per year
(1) ERM, EIA for Additional Gas-fired Generation Units Project (Register No.: AEIAR-197/2016), June 2016.
(2) ERM, EIA for Black Point Gas Supply Project (Register No.: AEIAR-150/2010), February 2010.
(3) ERM, EIA for Liquefied Natural Gas (LNG) Receiving Terminal and Associated Facilities (Register No.: AEIAR-106/2007),
December 2006.
(4) Hawksley, J.L., Some Social, Technical and Economic Aspects of the Risks of Large Plants, CHEMRAWN III, 1984.

ENVIRONMENTAL RESOURCES MANAGEMENT CLP POWER HONG KONG LIMITED 0359722_HKOLNG EIA_05_HTL_REV 3.DOCX JUNE 2018
5-51
respectively. Detailed discussion on the above failure frequencies are presented in Annex 5F.
Release Hole Sizes
As per previous EIA Reports that have been approved by EPD (1) (2) (3), the hole sizes in Table 5.32 were considered in the QRA Study:
Table 5.32 Release Hole Sizes
Leak Description Hole Size Very Small Leak 10 mm Small Leak 25 mm Medium Leak 50 mm Large Leak 100 mm Line Rupture Pipeline Diameter
Flammable Gas Detection and Emergency Shutdown Probability
As discussed in Section 5.5.3, the probability of executing the isolation successfully when required during emergency shutdown was adopted as 99%. However, as a conservative approach, the probability of failure on demand for all detection and shutdown system was adopted as 100% in the QRA Study for GRSs, as per previous EIA Reports that have been approved by EPD (2).
Ignition Probability
Table 5.33 summarises the ignition probabilities adopted in the QRA Study as per previous EIA Reports that have been approved by EPD. The total ignition probability is 0.32 for large leaks/ruptures, and 0.07 for other leaks. These ignition probabilities are consistent with the model of Cox, Lees and Ang. The ignition probabilities were distributed between immediate ignition and delayed ignition. Delayed ignition was further divided between delayed ignition 1 and delayed ignition 2 to take into account that a dispersing gas cloud may be ignited at different points during dispersion.
Delayed ignition 1 results in a flash fire and takes into account the possibility that an ignition could occur within the GRS facilities area due to the presence of ignition sources on-site. Delayed ignition 2 gives a flash fire after the gas cloud has expanded to its maximum (steady state) extent. If both delayed ignition 1 and 2 do not occur, the gas cloud disperses with no hazardous effect.
(1) ERM, EIA for Additional Gas-fired Generation Units Project (Register No.: AEIAR-197/2016), June 2016.
(2) ERM, EIA for Black Point Gas Supply Project (Register No.: AEIAR-150/2010), February 2010.
(3) ERM, EIA for Liquefied Natural Gas (LNG) Receiving Terminal and Associated Facilities (Register No.: AEIAR-106/2007), December 2006.

ENVIRONMENTAL RESOURCES MANAGEMENT CLP POWER HONG KONG LIMITED 0359722_HKOLNG EIA_05_HTL_REV 3.DOCX JUNE 2018
5-52
Table 5.33 Ignition Probably Adopted in the QRA Study for GRSs at the BPPS and LPS
Leak Immediate Ignition
Delayed Ignition 1
Delayed Ignition 2
Delayed Ignition Probability
Total Ignition Probability
a) Large/ Rupture
0.10 0.200 0.020 0.22 0.32
b) Leaks other than Large/ Rupture
0.02 0.045 0.005 0.05 0.07
Vapour Cloud Explosion
It is noted that a VCE could explosion could potentially occur at the BPPS and LPS GRS areas where the flammable gas cloud could accumulate. Nevertheless, based on the consequence modelling, the explosion effect is localized; hence flash fire with larger hazard footprint was conservatively modelled in the QRA Study. Detailed comparison of the consequences is presented in Annex 5G.
Escalation Effects
An initially small release may escalate into a larger, more serious event if a jet fire impinges on neighbouring equipment/ piping for an extended time. This is taken into account in the modelling for the isolation fail branch of the event tree, depicted in Figure 5F.8). If neighbouring equipment and piping is within range of the flame zone of a jet fire, an escalation probability of 1/6 has been taken to conservatively estimate the directional probability and chance of impingement. Escalation has been assumed to only cause a full bore rupture of the affected equipment and piping, leading to fireball event as the worst-case scenario.
Event Tree Analysis
An event tree analysis was performed to model the development of each hazardous scenario outcome (jet fire, flash fire, fireball, and VCE) from an initial release scenario. The event tree analysis considered whether there is immediate ignition, delayed ignition or no ignition, with consideration of the associated ignition probability as discussed above. The development of the event tree is presented in Annex 5F.
5.7.5 Consequence Analysis
Source Term Modelling
The modelling assumptions, as illustrated in Section 5.5.4, were also adopted in the QRA Study on the GRSs at the BPPS and the LPS.
Physical Effects Modelling
PHAST was used to perform the physical effects modelling to assess the effects zones for the following hazardous scenarios:

ENVIRONMENTAL RESOURCES MANAGEMENT CLP POWER HONG KONG LIMITED 0359722_HKOLNG EIA_05_HTL_REV 3.DOCX JUNE 2018
5-53
Jet fire;
Flash fire;
Fireball; and
VCE.
Detailed description of the physical effects modelling is presented in Annex 5G.
Consequence End-Point Criteria
The same consequence end-point criteria, as illustrated in Section 5.5.4, were also adopted in the QRA Study for the GRSs at the BPPS and the LPS.
5.7.6 Risk Summation
The risk summation for the GRS facilities was modelled using ERM’s proprietary risk integration package Riskplot™, as per previous EIA Reports that have been approved by the EPD (1) (2).
Cumulative Risk Assessment
Since the existing GRSs at the BPPS and LPS are located in the vicinity of the new GRSs, the existing GRSs could be impacted by the hazardous events arising from the new GRSs.
The construction activities of the GRSs could induce additional risks to the existing neighbouring GRS facilities. Therefore, in the proposed assessment year of 2020 for the peak construction phase, additional risk arising from the construction of the GRSs was considered in the QRA Study.
It is noted that an additional CCGT unit at the BBPS and LPS may also be under construction concurrently. However considering the locations of the additional CCGT units and GRS facilities, the risk of construction hazards arising from the new CCGT units impacting on the new GRS facilities is considered insignificant and hence not further assessed in the QRA Study.
The existing oil tanks with relative large inventory are separated from GRSs area by more than 300 m while the non-fuel gas dangerous storage areas are within buildings and separated from GRSs area by more than 50 m. The individual risk impacts from GRSs area facilities to the existing dangerous goods facilities are in the order of magnitude from 1E-07 to 1E-06 per year without consideration any obstacle between them. The likelihood of escalation effects from GRSs area facilities on those existing oil tanks and non-fuel gas dangerous storage areas is not considered as significant and indeed
(1) ERM, EIA for Black Point Gas Supply Project (Register No.: AEIAR-150/2010), February 2010.
(2) ERM, EIA for Liquefied Natural Gas (LNG) Receiving Terminal and Associated Facilities (Register No.: AEIAR-106/2007), December 2006.

ENVIRONMENTAL RESOURCES MANAGEMENT CLP POWER HONG KONG LIMITED 0359722_HKOLNG EIA_05_HTL_REV 3.DOCX JUNE 2018
5-54
already included in the generic failure database. As such, they are not required in the cumulative risk assessment for the QRA Study.
When in full operation, the associated process risk of the existing and new GRS facilities was assessed in the proposed assessment years of 2020 and 2030.
The details of the cumulative risk assessment considered in each of the proposed assessment years are summarised in Table 5.34.
Table 5.34 Details of Cumulative Risk Assessment
Potential Risk 2019 2020 2030 a) Existing GRS facilities at the BPPS and the LPS (Baseline Condition) Yes Yes Yes b) Construction activities for proposed GRS facilities leading to potential
impact on nearby existing GRS facilities at the BPPS and the LPS, respectively
Yes
c) Proposed GRS facilities at the BPPS and the LPS for natural gas intake from the LNG Terminal
Yes Yes
Individual Risk Results for GRS at the BPPS
Construction Year (Beginning of 2020)
As shown in Figure 5.19, the individual risk contour of 1 × 10⁻⁵ per year was
not identified, therefore the individual risk criteria stipulated in Section 2 of Annex 4 of the EIAO-TM is met.
Operational Year (Year 2020) and Future Scenario Year (Year 2030)
As shown in Figure 5.20 and Figure 5.21, the individual risk contour of
1 × 10⁻⁵ per year is mostly within the proposed GRS site boundary, with slight
overlap in the sea area. Nevertheless, when considering the exposure factor for the surrounding off-site population, the individual risk criteria stipulated in Section 2 of Annex 4 of the EIAO-TM is met.
Societal Risk Results for GRS at the BPPS
As shown in Figure 5.22, the societal risks in terms of F-N curves for Construction Year in the beginning of 2020, Operational Year in 2020 and Future Scenario Year in 2030 lie within the Acceptable Region; as such the societal risk criteria stipulated in Section 2 of Annex 4 of the EIAO-TM are met.
The key risk contributors, in terms of potential loss of life, associated with the GRS at the BPPS are summarised in Annex 5H.

ENVIRONMENTAL RESOURCES MANAGEMENT CLP POWER HONG KONG LIMITED 0359722_HKOLNG EIA_05_HTL_REV 3.DOCX JUNE 2018
5-55
Individual Risk Results for GRS at the LPS
Construction Year (Beginning of 2020)
As shown in Figure 5.23, the individual risk of 1 × 10⁻⁵ per year was not
identified, therefore the individual risk criteria stipulated in Section 2 of Annex 4 of the EIAO-TM is met.
Operational Year (Year 2020) and Future Scenario Year (Year 2030)
As shown in Figure 5.24 and Figure 5.25, the individual risk contour of 1 × 10-
5 per year is confined with the proposed GRS site boundary, therefore the individual risk criteria stipulated in Section 2 of Annex 4 of the EIAO-TM is met.
Societal Risk Results for GRS at the LPS
As shown in Figure 5.26, the societal risks in terms of F-N curves for Construction Year in the beginning of 2020, Operational Year in 2020 and Future Scenario Year in 2030 lie within the Acceptable Region; as such the societal risk criteria stipulated in Section 2 of Annex 4 of the EIAO-TM are met.
The key risk contributors, in terms of potential loss of life, associated with the GRS at the LPS are summarised in Annex 5H.
5.7.7 Conclusion of GRS QRA Study
It is concluded that the risks associated with the GRSs at the BPPS and LPS, in terms of individual and societal risks, are in compliance with risk criteria stipulated in Section 2 of Annex 4 of the EIAO-TM.
5.8 OVERALL CONCLUSION
A QRA Study was conducted to evaluate the risk level associated with the following activities and facilities of the Project with consideration of the identified LNG, natural gas and other dangerous goods:
Marine Transits of LNGC and FSRU Vessel to The LNG Terminal;
The LNG Terminal, including the FSRU Vessel, the Jetty and LNGC Unloading Operations;
Subsea BPPS and LPS Pipelines; and
GRSs at the BPPS and LPS.
ENVIRONMENTAL RESOURCES MANAGEMENT CLP POWER HONG KONG LIMITED 0359722_HKOLNG EIA_05_HTL_REV 3.DOCX JUNE 2018
5-56
The assessment methodology and assumptions were based EIA Reports that have been approved by EPD (1) (2).
For marine transits of LNGC and FSRU Vessel, subsea BPPS and LPS Pipelines, the LNG Terminal, and the GRSs at the BPPS and LPS, the individual risk is in compliance with the risk criteria in Section 2 of Annex 4 of the EIAO-TM.
In terms of societal risk, the F-N curves for all Project components have been developed and shown to be in compliance with risk criteria stipulated in Section 2 of Annex 4 of the EIAO-TM.
(1) ERM, EIA for Liquefied Natural Gas (LNG) Receiving Terminal and Associated Facilities (Register No.: AEIAR-106/2007),
December 2006.
(2) ERM, EIA for Black Point Gas Supply Project (Register No.: AEIAR-150/2010), February 2010.

Environmental Resources Management
Figure 5.1
If required
Schematic Diagram of Hazard to Life QRA Study
Process
Weather Data
Impact Criteria
Source Term
Modelling
Physical Effects
Modelling
Hazard Zone of
Consequence
Initiating Event
Frequency
Event Tree Analysis
Outcome Frequency
Impact Summation
Historical Leak Data
Hazard Identification
&
Failure Case Definition
Process Data
Collection
Impact Assessment
&
Uncertainty Analysis
Mitigation Measures
Consequence Analysis Frequency Analysis

Societal Risk Guidelines for Acceptable Risk Levels
Figure 5.2 Environmental Resources Management

Environmental Resources Management
LNGC Transit RouteFigure 5.3
Transit
Approaching to the Offshore Terminal
Marine Park Area
Open Sea Disposal Area

Environmental Resources Management
Individual Risk of the LNGC and FSRU Vessel Transit
in the Operational Year in 2020
Figure 5.4
Transit Route Segment B
HK Waters Boundary
10-6 per year
10-7 per year
Transit Route Segment A

Environmental Resources Management
Individual Risk of the LNGC and FSRU Vessel Transit
in the Future Scenario Year in 2030
Figure 5.5
Transit Route Segment B
HK Waters Boundary
10-6 per year
10-7 per year
Transit Route Segment A

Societal Risk for the LNGC and FSRU
Vessel Transit
Figure 5.6 Environmental Resources Management

Proposed South Lantau Marine Park
Open Sea Disposal Area
Environmental
Resources
Management
Individual Risk of the LNG Terminal in the Operational Year in 2020
Figure 5.7
File: T:\GIS\CONTRACT\0359722\Mxd\0359722_Risk_Contour.mxdDate: 3/5/2018
Legend
HKSAR Boundary
Proposed Site for LNG Terminal
Individual Risk for 10-5 per year
Individual Risk for 10-6 per year
Individual Risk for 10-7 per year
LNG Terminal Safety Zone
Open Sea Disposal Area
Proposed Marine Park 0 200 400100Metres´

Proposed South Lantau Marine Park
Open Sea Disposal Area
Environmental
Resources
Management
Individual Risk of the LNG Terminal in the Future Scenario Year in 2030
Figure 5.8
File: T:\GIS\CONTRACT\0359722\Mxd\0359722_Risk_Contour.mxdDate: 3/5/2018
Legend
HKSAR Boundary
Proposed Site for LNG Terminal
Individual Risk for 10-5 per year
Individual Risk for 10-6 per year
Individual Risk for 10-7 per year
LNG Terminal Safety Zone
Open Sea Disposal Area
Proposed Marine Park 0 200 400100Metres´

Societal Risk for the FSRU Vessel, the
Jetty and LNGC Unloading Operation at
the Offshore Terminal
Figure 5.9 Environmental Resources Management

Environmental Resources Management
Segmentation of Subsea BPPS and LPS PipelinesFigure 5.10
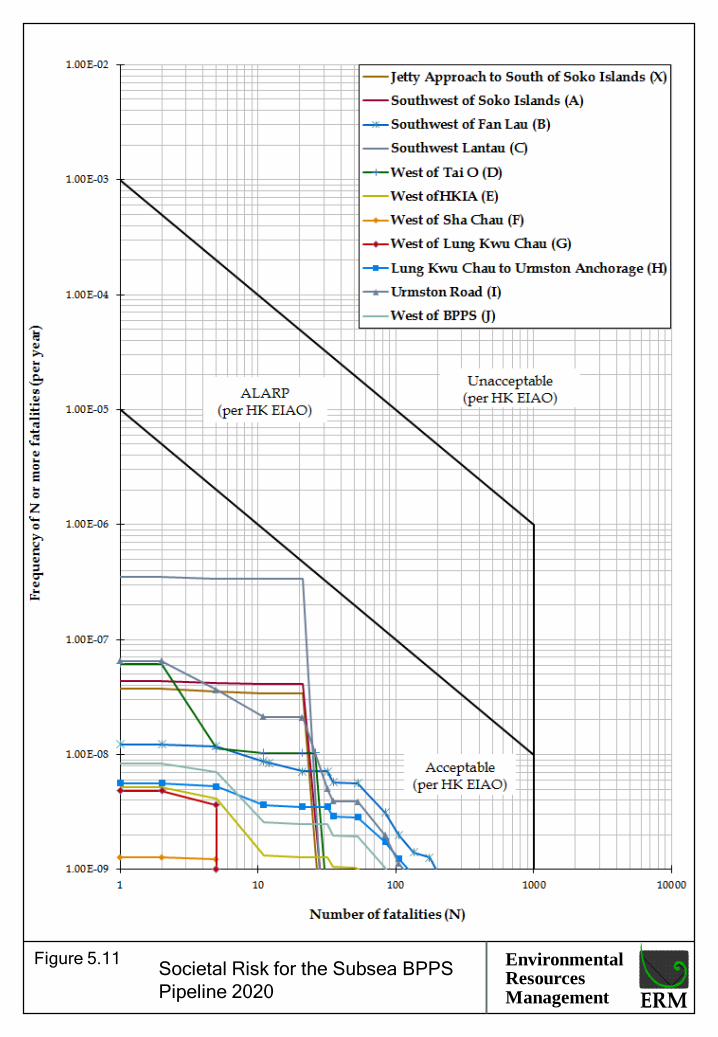
Societal Risk for the Subsea BPPS
Pipeline 2020
Figure 5.11 Environmental Resources Management

Societal Risk for the Subsea BPPS
Pipeline 2030
Figure 5.12 Environmental Resources Management
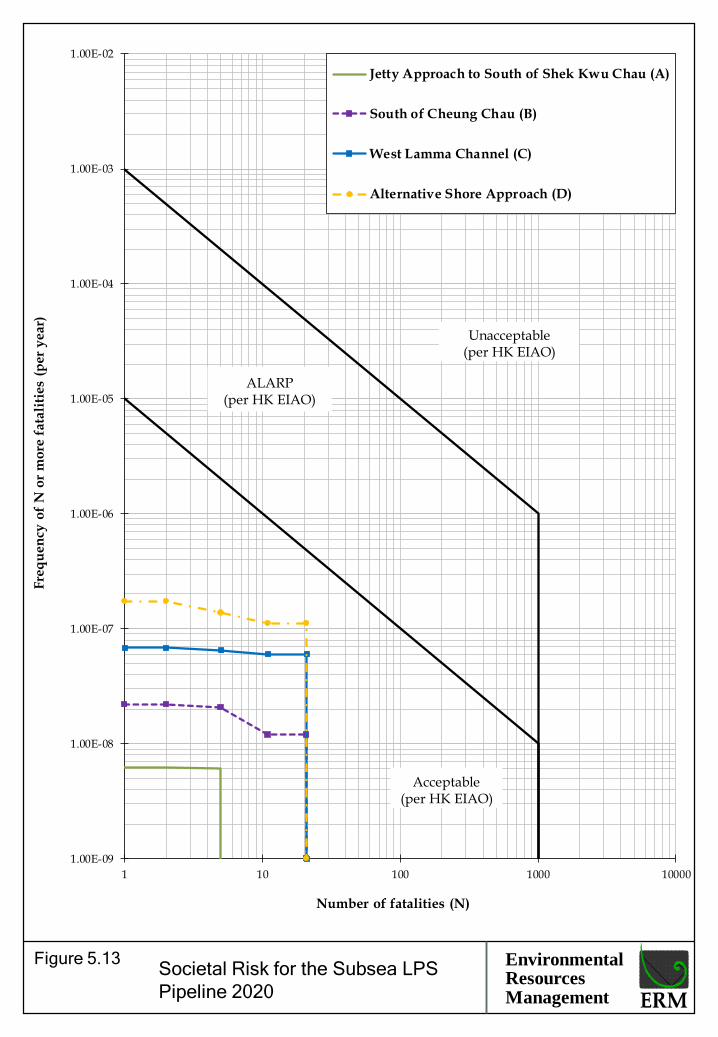
Societal Risk for the Subsea LPS
Pipeline 2020
Figure 5.13 Environmental Resources Management
1.00E-09
1.00E-08
1.00E-07
1.00E-06
1.00E-05
1.00E-04
1.00E-03
1.00E-02
1 10 100 1000 10000
Fre
qu
en
cy o
f N
or
mo
re f
ata
liti
es
(per
year)
Number of fatalities (N)
Jetty Approach to South of Shek Kwu Chau (A)
South of Cheung Chau (B)
West Lamma Channel (C)
Alternative Shore Approach (D)
Unacceptable (per HK EIAO)
Acceptable (per HK EIAO)
ALARP (per HK EIAO)
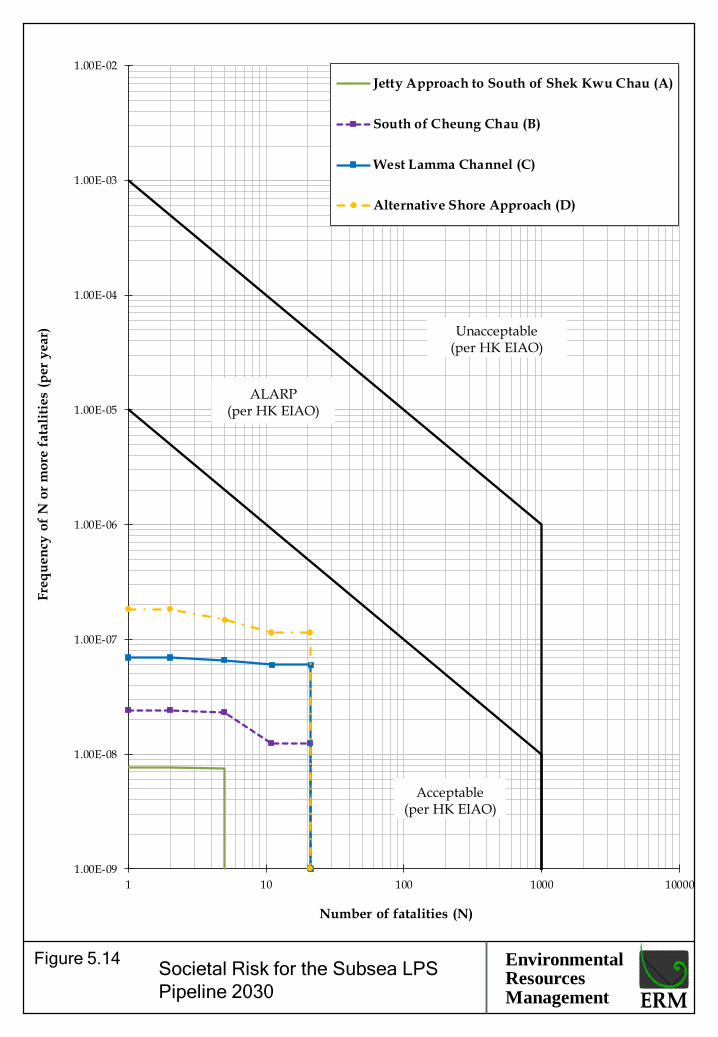
Societal Risk for the Subsea LPS
Pipeline 2030
Figure 5.14 Environmental Resources Management
1.00E-09
1.00E-08
1.00E-07
1.00E-06
1.00E-05
1.00E-04
1.00E-03
1.00E-02
1 10 100 1000 10000
Fre
qu
en
cy o
f N
or
mo
re f
ata
liti
es
(per
year)
Number of fatalities (N)
Jetty Approach to South of Shek Kwu Chau (A)
South of Cheung Chau (B)
West Lamma Channel (C)
Alternative Shore Approach (D)
Unacceptable (per HK EIAO)
Acceptable (per HK EIAO)
ALARP (per HK EIAO)

Societal Risk for the Subsea BPPS
Pipeline (Uncertainty Case 2020)
Figure 5.15 Environmental Resources Management
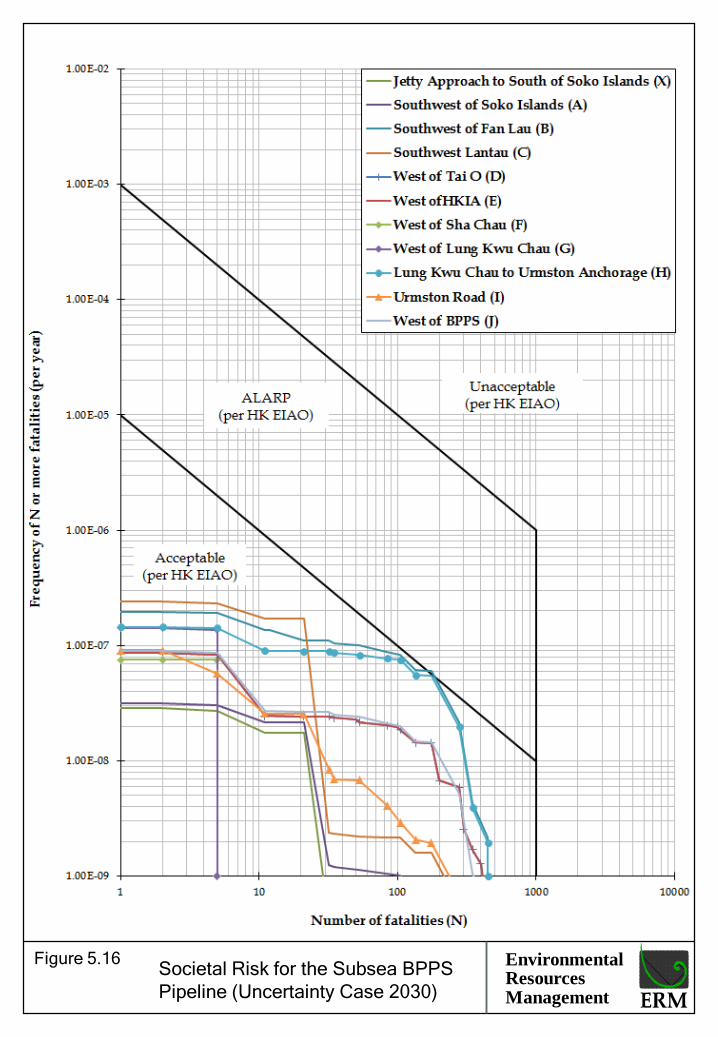
Societal Risk for the Subsea BPPS
Pipeline (Uncertainty Case 2030)
Figure 5.16 Environmental Resources Management

Societal Risk for the Subsea LPS
Pipeline (Uncertainty Case 2020)
Figure 5.17 Environmental Resources Management
1.00E-09
1.00E-08
1.00E-07
1.00E-06
1.00E-05
1.00E-04
1.00E-03
1.00E-02
1 10 100 1000 10000
Fre
qu
en
cy o
f N
or
mo
re f
ata
liti
es
(per
year)
Number of fatalities (N)
Jetty Approach to South of Shek Kwu Chau (A)
South of Cheung Chau (B)
West Lamma Channel (C)
Alternative Shore Approach (D)
Unacceptable (per HK EIAO)
Acceptable (per HK EIAO)
ALARP (per HK EIAO)

Societal Risk for the Subsea LPS
Pipeline (Uncertainty Case 2030)
Figure 5.18 Environmental Resources Management
1.00E-09
1.00E-08
1.00E-07
1.00E-06
1.00E-05
1.00E-04
1.00E-03
1.00E-02
1 10 100 1000 10000
Fre
qu
en
cy o
f N
or
mo
re f
ata
liti
es
(per
year)
Number of fatalities (N)
Jetty Approach to South of Shek Kwu Chau (A)
South of Cheung Chau (B)
West Lamma Channel (C)
Alternative Shore Approach (D)
Unacceptable (per HK EIAO)
Acceptable (per HK EIAO)
ALARP (per HK EIAO)

Environmental Resources Management
Individual Risk of the GRS at the BPPS (Construction
Year in 2020)
Figure 5.19

Environmental Resources Management
Individual Risk of the GRS at the BPPS (Operational
Year in 2020)
Figure 5.20
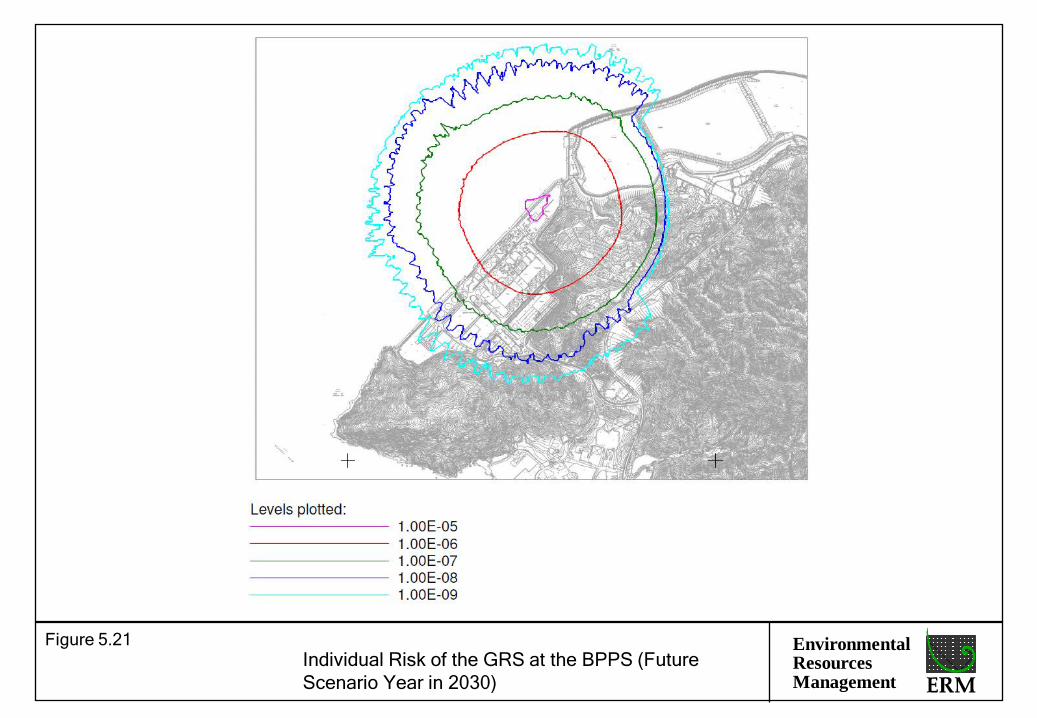
Environmental Resources Management
Individual Risk of the GRS at the BPPS (Future
Scenario Year in 2030)
Figure 5.21

Societal Risk for the GRS at the BPPS Figure 5.22 Environmental
Resources Management
1.00E-09
1.00E-08
1.00E-07
1.00E-06
1.00E-05
1.00E-04
1.00E-03
1.00E-02
1 10 100 1000 10000
Fre
qu
en
cy o
f N
or
mo
re f
ata
liti
es
(per
year)
Number of fatalities (N)
Construction Year in 2020
Operational Year in 2020
Future Scenario Year in 2030
Unacceptable (per HK EIAO)
Acceptable (per HK EIAO)
ALARP (per HK EIAO)

Environmental Resources Management
Individual Risk of the GRS at the LPS (Construction
Year in 2020)
Figure 5.23

Environmental Resources Management
Individual Risk of the GRS at the LPS (Operational
Year in 2020)
Figure 5.24

Environmental Resources Management
Individual Risk of the GRS at the LPS (Future
Scenario Year in 2030)
Figure 5.25

Societal Risk for the GRS at the LPS Figure 5.26 Environmental
Resources Management
1.00E-09
1.00E-08
1.00E-07
1.00E-06
1.00E-05
1.00E-04
1.00E-03
1.00E-02
1 10 100 1000 10000
Fre
qu
en
cy o
f N
or
mo
re f
ata
liti
es
(per
year)
Number of fatalities (N)
Construction Year in 2020
Operational Year in 2020
Future Scenario Year in 2030
Unacceptable (per HK EIAO)
Acceptable (per HK EIAO)
ALARP (per HK EIAO)

Annex 5A
Key Input Data for the QRA Study

ENVIRONMENTAL RESOURCES MANAGEMENT CLP POWER HONG KONG LIMITED ANNEX 5A_QRA STUDY INPUT DATA.DOC JUNE 2018
5A-1
5A KEY INPUT DATA FOR THE QRA STUDY
This Annex summarises the key input data for the QRA Study as follows:
Section 5A.1 – Surrounding Population;
Section 5A.2 – Meteorological Data;
Section 5A.3 – Failure Frequency;
Section 5A.4 – Ignition Probability;
Section 5A.5 – Explosion Probability; and
Section 5A.6 – Consequence End-Point Criteria.
5A.1 SURROUNDING POPULATION
5A.1.1 QRA Study for Marine Transit of the LNGC and FSRU Vessel to the LNG Terminal
Surrounding Marine Vessel Population
Population in Marine Vessels
The marine traffic in the vicinity of the transit route of LNGC and FSRU Vessel includes fishing vessels, rivertrade coastal vessels, ocean-going vessels, fast launches, fast ferries, and other types of smaller vessels.
The marine vessel population used in the QRA Study are given in Table 5A.1. The figures are based on Marine Traffic Impact Assessment (MTIA) Report (1)
except for fast ferries. The maximum population of fast ferries is assumed to be 450, based on the maximum capacity of the largest ferry operating in the area. However, the average load factors for fast ferries to Macau and Pearl Rivers ports are 62% and 47% respectively (2). Hence, a distribution in ferry population was assumed as indicated in Table 5A.1. This distribution gives an overall load factor of about 58% which is conservative and covers any future increase in marine vessel population. There is an additional category in the traffic volume data called “Others”. These are assumed to be small marine vessels with a population of 5.
(1) BMT Asia Pacific Ltd., Marine Impact Assessment for Black Point & Soko islands LNG Receiving Terminal &
Associated Facilities, Pipeline Issues, Working Paper #3, Issue 6, May 2006.
(2) Passenger Arrivals/Departures and Passenger Load Factors at Cross-Boundary Ferry Terminals, January to December 2014, Marine Department, Hong Kong SAR.

ENVIRONMENTAL RESOURCES MANAGEMENT CLP POWER HONG KONG LIMITED ANNEX 5A_QRA STUDY INPUT DATA.DOC JUNE 2018
5A-2
Table 5A.1 Marine Vessel Population
Type of Marine Vessel Average Population per Vessel Ocean-Going Vessel 21 Rivertrade Coastal Vessel 5 Fast Ferries 450 (largest ferries with max population) 350 (typical ferry with max population) 280 (typical ferry at 80% capacity) 175 (typical ferry at 50% capacity) 105 (typical ferry at 30% capacity) 35 (typical ferry at 10% capacity) Tug and Tow 5 Others 5
Protection Factors for Marine Vessel
Population on marine vessels is considered to be provided with some protection from the vessel structure. The degree of protection offered depends on factors such as:
Size of vessel;
Construction material and likelihood of secondary fires;
Speed of vessel and hence its exposure time to the flammable cloud;
The proportion of passengers likely to be on deck or in the interior of the vessel; and
The ability of gas to penetrate into the interior of the vessel and form a flammable mixture.
Small vessels such as fishing boats provide little protection while larger vessels such as ocean-going vessels provide greater protection. Fast ferries are air conditioned and have limited rate of air exchange with outside environment. Based on these considerations, the fatality probabilities and the population at risk adopted for each type of marine vessel are given in Table 5A.2, in line with the previous studies that have been approved by EPD and other relevant authorities (1) (2).
(1) ERM, EIA for Liquefied Natural Gas (LNG) Receiving Terminal and Associated Facilities (Register No.: AEIAR-106/2007),
December 2006.
(2) ERM, EIA for Black Point Gas Supply Project (Register No.: AEIAR-150/2010), February 2010.

ENVIRONMENTAL RESOURCES MANAGEMENT CLP POWER HONG KONG LIMITED ANNEX 5A_QRA STUDY INPUT DATA.DOC JUNE 2018
5A-3
Table 5A.2 Population at Risk
Marine Vessel Type Population Fatality Probability(1)(2) Population at Risk (1)(2)
Ocean-Going Vessel Rivertrade Coastal Vessel Fast Ferries
21 5
0.1 0.3
2 2
(largest ferries with max population) 450 0.3 135 (typical ferry with max population) 350 0.3 105 (typical ferry at 80% capacity) 280 0.3 84 (typical ferry at 50% capacity) 175 0.3 53 (typical ferry at 30% capacity) 105 0.3 32 (typical ferry at 10% capacity) 35 0.3 11 Tug and Tow 5 0.9 5 Others 5 0.9 5
Estimation of Number of Marine Vessels per Day
In the QRA Study, the marine traffic population in the vicinity of the Project components has been considered as both point receptors and average density values. The population of all marine vessels was treated as an area average density except for fast ferries which are treated as point receptors.
As shown in Figure 5A.1, the marine area in the vicinity of the Project components has been divided into 12.67 km2 grid cells, each grid being approximately 3.6 km × 3.6 km. The time for a marine vessel to traverse a grid was calculated based on the travel distance divided by the marine vessel’s average speed. The average speed and transit time for different vessel types are presented in Table 5A.3, in line with the previous EIA Reports that were approved by the EPD and other relevant authorities (1) (2).
Table 5A.3 Average Speed and Transit Time of Different Marine Vessel Type
Marine Vessel Type Typical Speed (m s-1) (1)(2) Transit Time (min) (1)(2) Ocean-Going Vessel 6.0 9.9 Rivertrade Coastal Vessel 6.0 9.9 Fast Ferries 15.0 4.0 Tug and Tow 2.5 23.7 Others 6.0 9.9
The number of marine vessels traversing each grid daily (3) are given in Table 5A.4, where the grid cell reference numbers are defined according to Figure 5A.1.
(1) ERM, EIA for Liquefied Natural Gas (LNG) Receiving Terminal and Associated Facilities (Register No.: AEIAR-106/2007),
December 2006.
(2) ERM, EIA for Black Point Gas Supply Project (Register No.: AEIAR-150/2010), February 2010.
(3) BMT Asia Pacific Limited, Hong Kong Offshore LNG Terminal FSRU Terminal MTIA Report, R9331.05

ENVIRONMENTAL RESOURCES MANAGEMENT CLP POWER HONG KONG LIMITED ANNEX 5A_QRA STUDY INPUT DATA.DOC JUNE 2018
5A-4
The number of marine vessels present within each grid cell at any instant in time was then calculated from:
Number of vessels = No. of vessels per day × Grid length / 86,400 / Speed (Equation 1)
The values obtained represent the number of marine vessels present within a grid cell at any instant in time. Values of less than one are interpreted as the probability of a vessel being present. The number of marine vessels per day is summarised in Table 5A.4.
Table 5A.4 Number of Marine Vessels per Day
Grid No.
Average Number of Marine Vessel per Day 2020 2030
OG RT TT FF(*) OTH OG RT TT FF(*) OTH 1 1 6 6 0 87 1 7 7 0 104 2 1 8 9 0 135 1 8 9 0 163 3 1 14 10 0 184 1 14 10 0 221 4 1 20 9 0 151 1 20 9 0 182 5 3 26 14 0 103 3 26 14 0 124 6 18 45 21 0 205 19 46 21 0 247 7 23 31 10 0 211 25 32 10 0 254 8 167 27 8 0 114 178 27 8 0 137 9 116 24 11 0 130 124 25 11 0 156
10 3 6 4 0 87 3 7 4 0 104
OG: Ocean-Going Vessel RT: Rivertrade Costal Vessel TT: Tug & Tow Vessels FF: Fast Ferries OTH: Others (*): Fast ferries are treated separately
Estimation of Marine Populations (Average Density Approach)
The average marine population for each grid was calculated by combining the number of marine vessels in each grid as per Equation 1 with the population at risk for each marine vessel shown in Table 5A.2. The estimated marine populations for the assessment years is summarised in Table 5A.5. This grid population is assumed to apply to all time periods.
Table 5A.5 Estimated Marine Populations for the Assessment Years
Marine Grid No. 2020 2030 Grid No. 1 4.31 5.09 Grid No. 2 6.51 7.59 Grid No. 3 8.73 10.15 Grid No. 4 7.59 8.79 Grid No. 5 6.76 7.57 Grid No. 6 14.51 16.33 Grid No. 7 13.99 16.01 Grid No. 8 33.24 35.91 Grid No. 9 25.76 28.09 Grid No. 10 6.51 7.59
ENVIRONMENTAL RESOURCES MANAGEMENT CLP POWER HONG KONG LIMITED ANNEX 5A_QRA STUDY INPUT DATA.DOC JUNE 2018
5A-5
It is noted however that fast ferries are excluded since they were treated separately in the analysis (see below).
When simulating a possible release scenario, the impact area was calculated from dispersion modelling. In general, only a fraction of the grid area was affected and hence the number of fatalities within a grid was calculated using the following equation, in line with the previous studies that have been approved by the EPD and other relevant authorities (1) (2):
Number of Fatality = Grid Population × Impact Area / Grid Area (Equation 2)
Estimation of Fast Ferry Population (Point Receptor Approach)
The average density approach, described above, effectively dilutes the population over the area of the grid. Given that fast ferries have a much higher population than other classes of vessel, combined with a relatively low presence factor due to their higher speed, the average density approach would not adequately address the impact of fast ferries on the F-N curves. Fast ferries were therefore treated differently in the QRA Study.
In reality, if a fast ferry is affected by an accident scenario, the whole ferry will likely be affected. The likelihood that the ferry is affected, however, depends on the size of the hazard area and the density of ferry vessels. To model this, the population is treated as a concentrated point receptor, i.e. the entire population of the ferry is assumed to remain focused at the ferry location. The ferry density is calculated the same way as described above (Equation 1), giving the number of ferries per grid at any instant in time, or equivalent a “presence factor”. A hazard scenario, however, will not affect a whole grid, but some fraction determined by the area ratio of the hazard footprint area and the grid area.
In line with the previous studies that have been approved by the EPD and other relevant authorities (1) (2), the presence factor corrected by this area ratio was then used to modify the frequency of the hazard scenario using the following equation:
Probability that ferry is affected = Presence Factor × Impact Area / Grid Area (Equation 3)
The fast ferry population distribution adopted is described in Table 5A.6. Information from the main ferry operators suggested that 25% of ferry trips take place at night time (between 7 pm and 7 am), while 75% occur during daytime. Day and night ferries are therefore assessed separately in the QRA Study. This
(1) ERM, EIA for Liquefied Natural Gas (LNG) Receiving Terminal and Associated Facilities (Register No.: AEIAR-106/2007),
December 2006.
(2) ERM, EIA for Black Point Gas Supply Project (Register No.: AEIAR-150/2010), February 2010.

ENVIRONMENTAL RESOURCES MANAGEMENT CLP POWER HONG KONG LIMITED ANNEX 5A_QRA STUDY INPUT DATA.DOC JUNE 2018
5A-6
approach is consistent with the previous EIA studies that were approved by the EPD and other relevant authorities (1) (2).
Table 5A.6 Fast Ferry Population Distribution for Day and Night Time Periods
Population Population at Risk
% of Day Trips % of Night Trips % of All Trips (= 0.75 × day + 0.25 × night)
450a 350b 280c 175d 105e
35f
135 105 84 53 32 11
5 5
30 60
- -
- - -
30 50 20
3.75 3.75
22.50 52.50 12.50 5.00
Note: a: largest ferries with max population b: typical ferry with max population c: typical ferry at 80% capacity d: typical ferry at 50% capacity e: typical ferry at 30% capacity f: typical ferry at 10% capacity
The ferry presence factor (Equation 1) and probability that a ferry is affected by a release scenario (Equation 2) were calculated for each ferry occupancy category and each time period.
Surrounding Land and Road Traffic Population
Based on the detailed consequence analysis for marine transit of LNGC and FSRU Vessel to the LNG Terminal, all potential hazardous consequence for the marine transit of LNGC and FSRU Vessel could not reach any land based population (building development) and road traffic population. Therefore, land based population (building development) and road traffic population do not affect the societal risk levels and therefore are not considered in the QRA Study.
5A.1.2 QRA Study for the LNG Terminal
Surrounding Marine Vessel Population
The marine traffic population in the vicinity of the LNG Terminal was estimated using the same approach as described in Section 5A.1.1. The number of marine vessels per day and the estimated marine population in the vicinity of the LNG Terminal are referred to Grid No. 1, 2 and 3, as summarised in Table 5A.4 and Table 5A.5.
(1) ERM, EIA for Liquefied Natural Gas (LNG) Receiving Terminal and Associated Facilities (Register No.: AEIAR-106/2007),
December 2006.
(2) ERM, EIA for Black Point Gas Supply Project (Register No.: AEIAR-150/2010), February 2010.

ENVIRONMENTAL RESOURCES MANAGEMENT CLP POWER HONG KONG LIMITED ANNEX 5A_QRA STUDY INPUT DATA.DOC JUNE 2018
5A-7
Surrounding Land and Road Traffic Population
Based on the detailed consequence analysis, all potential hazardous consequence does not reach any land based population (building development) and road traffic population. Therefore, land based population (building development) and road traffic population do not affect the societal risk levels and therefore are not considered in the QRA Study.
5A.1.3 QRA Study for the Subsea Pipelines
Surrounding Marine Vessel Population
The marine traffic population in the vicinity of the BPPS and LPS Pipelines was estimated using the same approach as described in Section 5A.1.1. The marine traffic data (1) (2) for the BPPS and LPS Pipelines are summarised in Table 5A.7 to Table 5A.10 for each assessment year.
Table 5A.7 Traffic Volume for BPPS Pipeline in 2020 – Operational Year
Traffic Volume (Ships/day) Segment Fishing River-
trade Ocean-going
Fast Ferry
Others Total
X Jetty Approach to South of Soko Islands
2 34 5 5 68 114
A Southwest of Soko Islands 2 9 2 5 20 38 B Southwest of Fan Lau 2 15 0 179 68 264 C Southwest Lantau 2 27 3 2 18 52 D West of Tai O 3 9 0 0 9 21 E West of HKIA 15 51 0 47 74 187 F West of Sha Chau 2 2 0 0 20 24 G West of Lung Kwu Chau 10 16 0 0 17 43 H Lung Kwu Chau to
Urmston Anchorage 8 12 0 81 24 125
I Urmston Road 15 206 61 70 154 506 J West of BPPS 20 26 0 39 42 127
Table 5A.8 Traffic Volume for BPPS Pipeline in 2030 – Future Scenario Year
Traffic Volume (Ships/day) Segment Fishing River-
trade Ocean-going
Fast Ferry
Others Total
X Jetty Approach to South of Soko Islands
4 35 5 5 82 131
A Southwest of Soko Islands 4 9 2 5 24 44 B Southwest of Fan Lau 4 15 0 198 82 299 C Southwest Lantau 4 28 3 2 22 59 D West of Tai O 5 9 0 0 11 25 E West of HKIA 17 53 0 52 90 212 F West of Sha Chau 4 2 0 0 24 30 G West of Lung Kwu Chau 12 17 0 0 20 49
(1) BMT Asia Pacific Limited, Black Point Pipeline MTIA Report, R.9331.03
(2) BMT Asia Pacific Limited, Lamma Pipeline MTIA Report, R.9331.02

ENVIRONMENTAL RESOURCES MANAGEMENT CLP POWER HONG KONG LIMITED ANNEX 5A_QRA STUDY INPUT DATA.DOC JUNE 2018
5A-8
Traffic Volume (Ships/day) Segment Fishing River-
trade Ocean-going
Fast Ferry
Others Total
H Lung Kwu Chau to Urmston Anchorage
10 13 0 88 30 141
I Urmston Road 17 214 65 76 188 560 J West of BPPS 22 27 0 43 51 143
Table 5A.9 Traffic Volume for LPS Pipeline in 2020 – Operational Year
Traffic Volume (Ships/day) Segment Fishing River-
trade Ocean-going
Fast Ferry
Others Total
A Jetty Approach to South of Shek Kwu Chau
5 2 0 0 67 74
B South of Cheung Chau 6 10 3 0 188 207 C West Lamma Channel 3 6 3 0 29 41 D Alternative Shore Approach 6 16 2 0 45 69
Table 5A.10 Traffic Volume for LPS Pipeline in 2030 – Future Scenario Year
Traffic Volume (Ships/day) Segment Fishing River-
trade Ocean-going
Fast Ferry
Others Total
A Jetty Approach to South of Shek Kwu Chau
7 4 0 0 81 92
B South of Cheung Chau 9 12 3 0 229 253 C West Lamma Channel 5 9 3 0 35 52 D Alternative Shore Approach 9 19 2 0 55 85
Surrounding Land and Road Traffic Population
Based on the detailed consequence analysis, all potential hazardous consequence could not reach any land based population (building development) and road traffic population. Therefore, land based population (building development) and road traffic population do not affect the societal risk levels and therefore are not considered in the QRA Study.
5A.1.4 QRA Study for the GRSs at the BPPS and the LPS
Surrounding Marine Vessel Population
The marine traffic population in the vicinity of the GRSs at the BPPS and LPS was estimated using the same approach as described in Section 5A.1.1. The grid cell reference numbers are defined according to Figure 5A.2.
The number of marine vessels per day (1) in the vicinity of the GRSs at the BPPS and LPS is summarised in Table 5A.11. The estimated marine population at each marine grid for the assessment years are summarised in Table 5A.12.
(1) BMT Asia Pacific Limited, HOLD
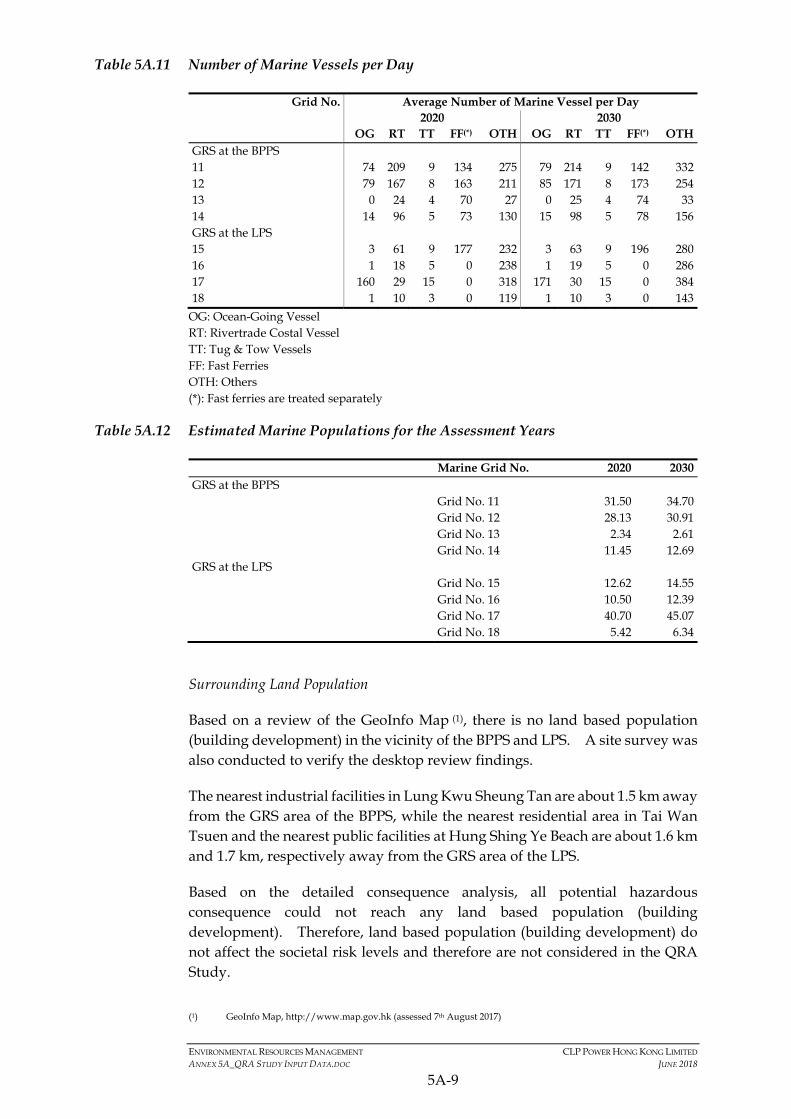
ENVIRONMENTAL RESOURCES MANAGEMENT CLP POWER HONG KONG LIMITED ANNEX 5A_QRA STUDY INPUT DATA.DOC JUNE 2018
5A-9
Table 5A.11 Number of Marine Vessels per Day
Grid No. Average Number of Marine Vessel per Day 2020 2030
OG RT TT FF(*) OTH OG RT TT FF(*) OTH GRS at the BPPS 11 74 209 9 134 275 79 214 9 142 332 12 79 167 8 163 211 85 171 8 173 254 13 0 24 4 70 27 0 25 4 74 33 14 14 96 5 73 130 15 98 5 78 156 GRS at the LPS 15 3 61 9 177 232 3 63 9 196 280 16 1 18 5 0 238 1 19 5 0 286 17 160 29 15 0 318 171 30 15 0 384 18 1 10 3 0 119 1 10 3 0 143
OG: Ocean-Going Vessel RT: Rivertrade Costal Vessel TT: Tug & Tow Vessels FF: Fast Ferries OTH: Others (*): Fast ferries are treated separately
Table 5A.12 Estimated Marine Populations for the Assessment Years
Marine Grid No. 2020 2030 GRS at the BPPS Grid No. 11 31.50 34.70 Grid No. 12 28.13 30.91 Grid No. 13 2.34 2.61 Grid No. 14 11.45 12.69 GRS at the LPS Grid No. 15 12.62 14.55 Grid No. 16 10.50 12.39 Grid No. 17 40.70 45.07 Grid No. 18 5.42 6.34
Surrounding Land Population
Based on a review of the GeoInfo Map (1), there is no land based population (building development) in the vicinity of the BPPS and LPS. A site survey was also conducted to verify the desktop review findings.
The nearest industrial facilities in Lung Kwu Sheung Tan are about 1.5 km away from the GRS area of the BPPS, while the nearest residential area in Tai Wan Tsuen and the nearest public facilities at Hung Shing Ye Beach are about 1.6 km and 1.7 km, respectively away from the GRS area of the LPS.
Based on the detailed consequence analysis, all potential hazardous consequence could not reach any land based population (building development). Therefore, land based population (building development) do not affect the societal risk levels and therefore are not considered in the QRA Study.
(1) GeoInfo Map, http://www.map.gov.hk (assessed 7th August 2017)
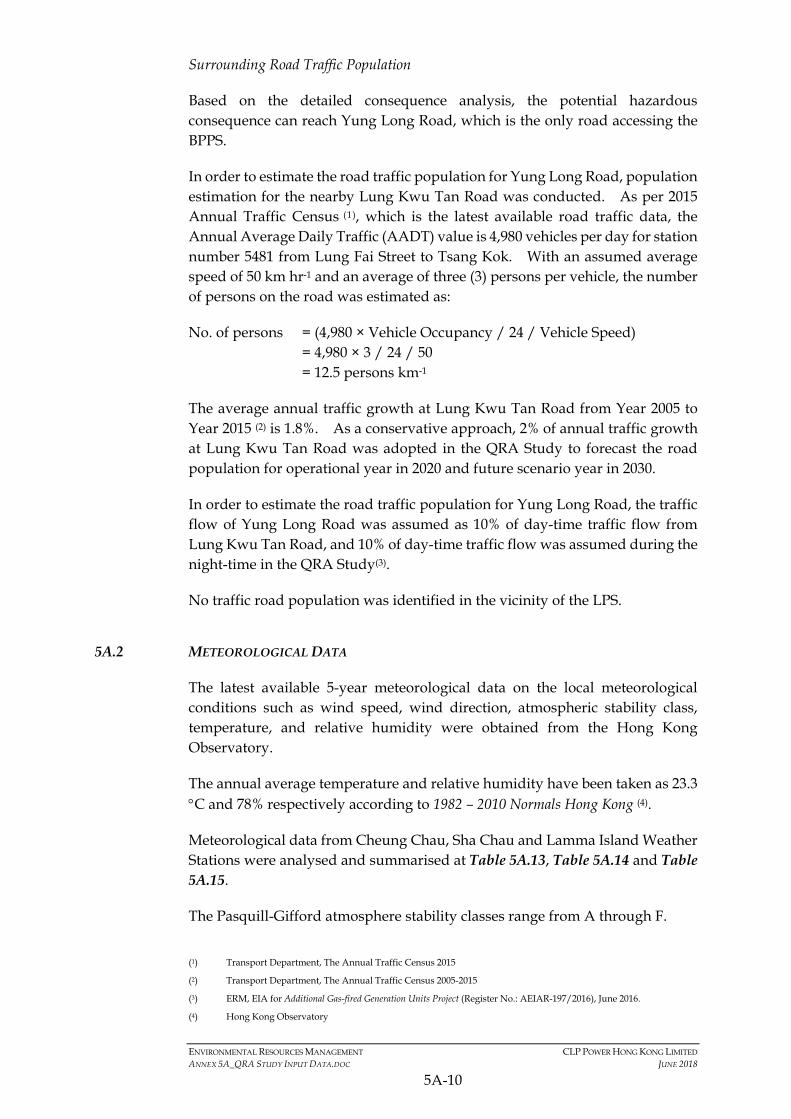
ENVIRONMENTAL RESOURCES MANAGEMENT CLP POWER HONG KONG LIMITED ANNEX 5A_QRA STUDY INPUT DATA.DOC JUNE 2018
5A-10
Surrounding Road Traffic Population
Based on the detailed consequence analysis, the potential hazardous consequence can reach Yung Long Road, which is the only road accessing the BPPS.
In order to estimate the road traffic population for Yung Long Road, population estimation for the nearby Lung Kwu Tan Road was conducted. As per 2015 Annual Traffic Census (1), which is the latest available road traffic data, the Annual Average Daily Traffic (AADT) value is 4,980 vehicles per day for station number 5481 from Lung Fai Street to Tsang Kok. With an assumed average speed of 50 km hr-1 and an average of three (3) persons per vehicle, the number of persons on the road was estimated as:
No. of persons = (4,980 × Vehicle Occupancy / 24 / Vehicle Speed) = 4,980 × 3 / 24 / 50 = 12.5 persons km-1
The average annual traffic growth at Lung Kwu Tan Road from Year 2005 to Year 2015 (2) is 1.8%. As a conservative approach, 2% of annual traffic growth at Lung Kwu Tan Road was adopted in the QRA Study to forecast the road population for operational year in 2020 and future scenario year in 2030.
In order to estimate the road traffic population for Yung Long Road, the traffic flow of Yung Long Road was assumed as 10% of day-time traffic flow from Lung Kwu Tan Road, and 10% of day-time traffic flow was assumed during the night-time in the QRA Study(3).
No traffic road population was identified in the vicinity of the LPS.
5A.2 METEOROLOGICAL DATA
The latest available 5-year meteorological data on the local meteorological conditions such as wind speed, wind direction, atmospheric stability class, temperature, and relative humidity were obtained from the Hong Kong Observatory.
The annual average temperature and relative humidity have been taken as 23.3 C and 78% respectively according to 1982 – 2010 Normals Hong Kong (4).
Meteorological data from Cheung Chau, Sha Chau and Lamma Island Weather Stations were analysed and summarised at Table 5A.13, Table 5A.14 and Table 5A.15.
The Pasquill-Gifford atmosphere stability classes range from A through F.
(1) Transport Department, The Annual Traffic Census 2015
(2) Transport Department, The Annual Traffic Census 2005-2015
(3) ERM, EIA for Additional Gas-fired Generation Units Project (Register No.: AEIAR-197/2016), June 2016.
(4) Hong Kong Observatory
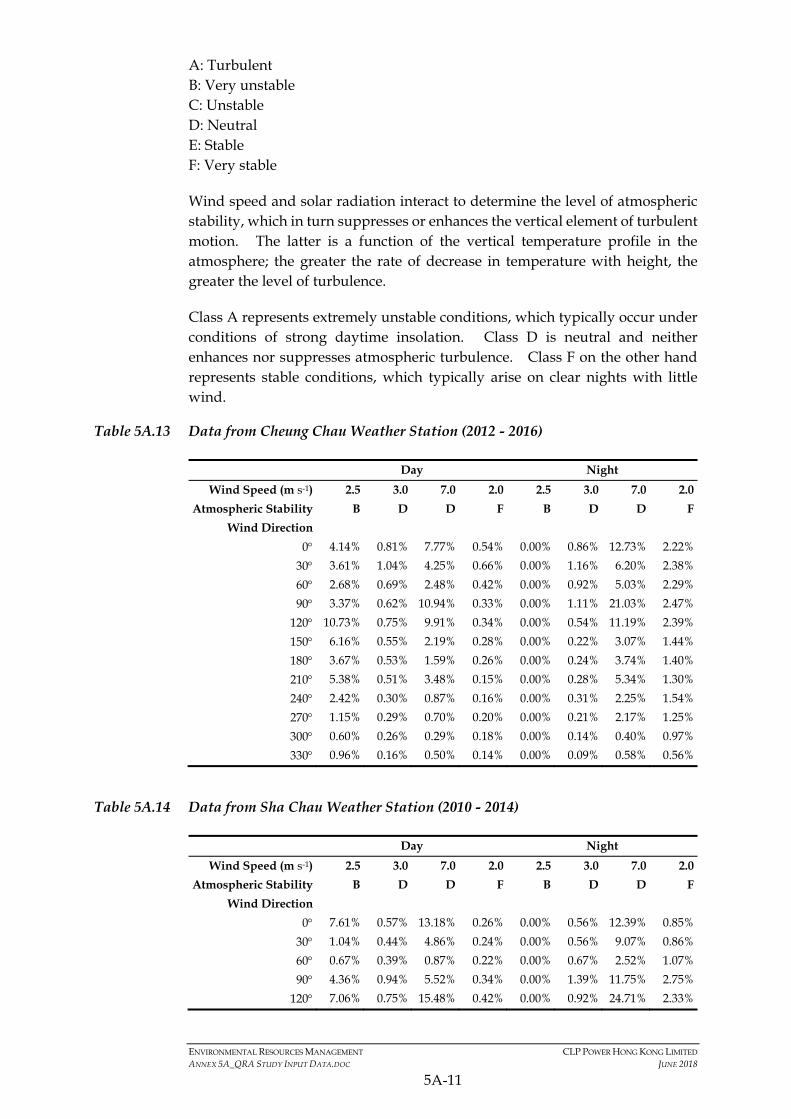
ENVIRONMENTAL RESOURCES MANAGEMENT CLP POWER HONG KONG LIMITED ANNEX 5A_QRA STUDY INPUT DATA.DOC JUNE 2018
5A-11
A: Turbulent B: Very unstable C: Unstable D: Neutral E: Stable F: Very stable
Wind speed and solar radiation interact to determine the level of atmospheric stability, which in turn suppresses or enhances the vertical element of turbulent motion. The latter is a function of the vertical temperature profile in the atmosphere; the greater the rate of decrease in temperature with height, the greater the level of turbulence.
Class A represents extremely unstable conditions, which typically occur under conditions of strong daytime insolation. Class D is neutral and neither enhances nor suppresses atmospheric turbulence. Class F on the other hand represents stable conditions, which typically arise on clear nights with little wind.
Table 5A.13 Data from Cheung Chau Weather Station (2012 - 2016)
Day Night
Wind Speed (m s-1) 2.5 3.0 7.0 2.0 2.5 3.0 7.0 2.0
Atmospheric Stability B D D F B D D F
Wind Direction
0 4.14% 0.81% 7.77% 0.54% 0.00% 0.86% 12.73% 2.22%
30 3.61% 1.04% 4.25% 0.66% 0.00% 1.16% 6.20% 2.38%
60 2.68% 0.69% 2.48% 0.42% 0.00% 0.92% 5.03% 2.29%
90 3.37% 0.62% 10.94% 0.33% 0.00% 1.11% 21.03% 2.47%
120 10.73% 0.75% 9.91% 0.34% 0.00% 0.54% 11.19% 2.39%
150 6.16% 0.55% 2.19% 0.28% 0.00% 0.22% 3.07% 1.44%
180 3.67% 0.53% 1.59% 0.26% 0.00% 0.24% 3.74% 1.40%
210 5.38% 0.51% 3.48% 0.15% 0.00% 0.28% 5.34% 1.30%
240 2.42% 0.30% 0.87% 0.16% 0.00% 0.31% 2.25% 1.54%
270 1.15% 0.29% 0.70% 0.20% 0.00% 0.21% 2.17% 1.25%
300 0.60% 0.26% 0.29% 0.18% 0.00% 0.14% 0.40% 0.97%
330 0.96% 0.16% 0.50% 0.14% 0.00% 0.09% 0.58% 0.56%
Table 5A.14 Data from Sha Chau Weather Station (2010 - 2014)
Day Night
Wind Speed (m s-1) 2.5 3.0 7.0 2.0 2.5 3.0 7.0 2.0
Atmospheric Stability B D D F B D D F
Wind Direction
0 7.61% 0.57% 13.18% 0.26% 0.00% 0.56% 12.39% 0.85%
30 1.04% 0.44% 4.86% 0.24% 0.00% 0.56% 9.07% 0.86%
60 0.67% 0.39% 0.87% 0.22% 0.00% 0.67% 2.52% 1.07%
90 4.36% 0.94% 5.52% 0.34% 0.00% 1.39% 11.75% 2.75%
120 7.06% 0.75% 15.48% 0.42% 0.00% 0.92% 24.71% 2.33%
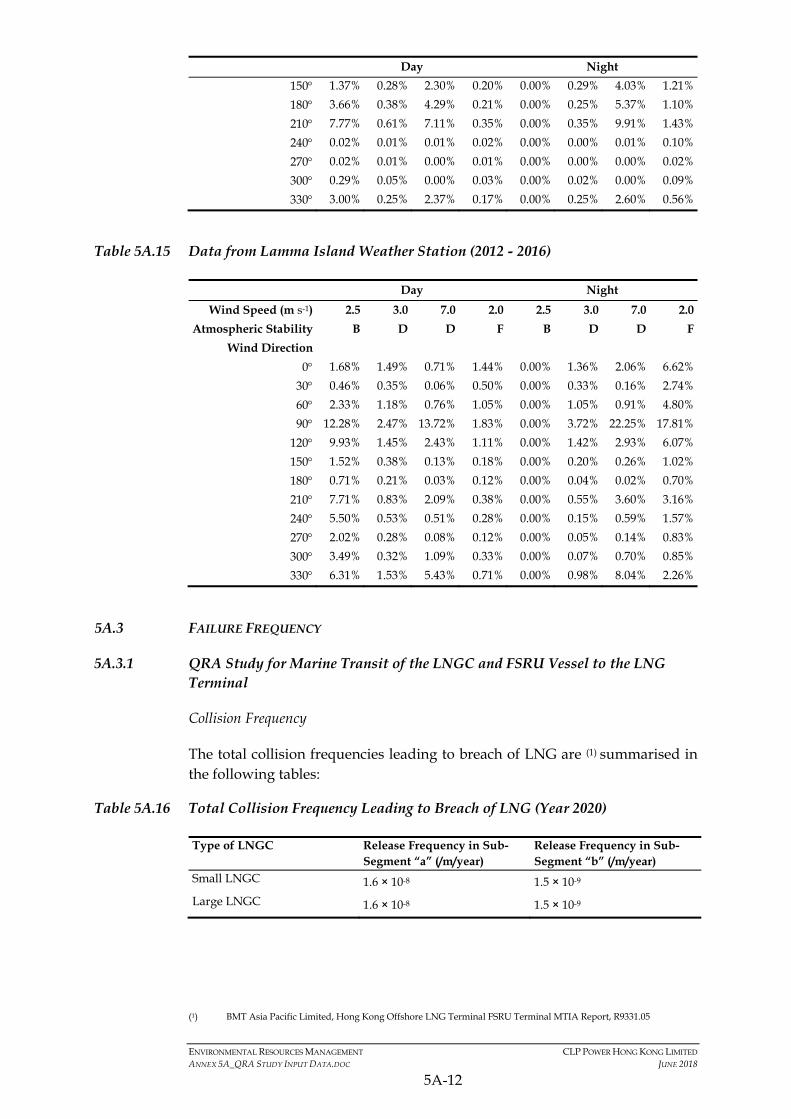
ENVIRONMENTAL RESOURCES MANAGEMENT CLP POWER HONG KONG LIMITED ANNEX 5A_QRA STUDY INPUT DATA.DOC JUNE 2018
5A-12
Day Night
150 1.37% 0.28% 2.30% 0.20% 0.00% 0.29% 4.03% 1.21%
180 3.66% 0.38% 4.29% 0.21% 0.00% 0.25% 5.37% 1.10%
210 7.77% 0.61% 7.11% 0.35% 0.00% 0.35% 9.91% 1.43%
240 0.02% 0.01% 0.01% 0.02% 0.00% 0.00% 0.01% 0.10%
270 0.02% 0.01% 0.00% 0.01% 0.00% 0.00% 0.00% 0.02%
300 0.29% 0.05% 0.00% 0.03% 0.00% 0.02% 0.00% 0.09%
330 3.00% 0.25% 2.37% 0.17% 0.00% 0.25% 2.60% 0.56%
Table 5A.15 Data from Lamma Island Weather Station (2012 - 2016)
Day Night
Wind Speed (m s-1) 2.5 3.0 7.0 2.0 2.5 3.0 7.0 2.0
Atmospheric Stability B D D F B D D F
Wind Direction
0 1.68% 1.49% 0.71% 1.44% 0.00% 1.36% 2.06% 6.62%
30 0.46% 0.35% 0.06% 0.50% 0.00% 0.33% 0.16% 2.74%
60 2.33% 1.18% 0.76% 1.05% 0.00% 1.05% 0.91% 4.80%
90 12.28% 2.47% 13.72% 1.83% 0.00% 3.72% 22.25% 17.81%
120 9.93% 1.45% 2.43% 1.11% 0.00% 1.42% 2.93% 6.07%
150 1.52% 0.38% 0.13% 0.18% 0.00% 0.20% 0.26% 1.02%
180 0.71% 0.21% 0.03% 0.12% 0.00% 0.04% 0.02% 0.70%
210 7.71% 0.83% 2.09% 0.38% 0.00% 0.55% 3.60% 3.16%
240 5.50% 0.53% 0.51% 0.28% 0.00% 0.15% 0.59% 1.57%
270 2.02% 0.28% 0.08% 0.12% 0.00% 0.05% 0.14% 0.83%
300 3.49% 0.32% 1.09% 0.33% 0.00% 0.07% 0.70% 0.85%
330 6.31% 1.53% 5.43% 0.71% 0.00% 0.98% 8.04% 2.26%
5A.3 FAILURE FREQUENCY
5A.3.1 QRA Study for Marine Transit of the LNGC and FSRU Vessel to the LNG Terminal
Collision Frequency
The total collision frequencies leading to breach of LNG are (1) summarised in the following tables:
Table 5A.16 Total Collision Frequency Leading to Breach of LNG (Year 2020)
Type of LNGC Release Frequency in Sub-Segment “a” (/m/year)
Release Frequency in Sub-Segment “b” (/m/year)
Small LNGC 1.6 × 10⁻⁸ 1.5 × 10⁻⁹
Large LNGC 1.6 × 10⁻⁸ 1.5 × 10⁻⁹
(1) BMT Asia Pacific Limited, Hong Kong Offshore LNG Terminal FSRU Terminal MTIA Report, R9331.05

ENVIRONMENTAL RESOURCES MANAGEMENT CLP POWER HONG KONG LIMITED ANNEX 5A_QRA STUDY INPUT DATA.DOC JUNE 2018
5A-13
Table 5A.17 Total Collision Frequency Leading to Breach of LNG (Year 2030)
Type of LNGC Release Frequency in Sub-Segment “a” (/m/year)
Release Frequency in Sub-Segment “b” (/m/year)
Small LNGC 1.7 × 10⁻⁸ 4.9 × 10⁻¹⁰
Large LNGC 1.8 × 10⁻⁸ 5.2 × 10⁻¹⁰
Grounding Frequency
Considering the number of marine transits per year and the probability of LNG breach upon grounding events, the grounding release frequency adopted in the
QRA Study was 1.2 × 10⁻⁶ per km per year. The derivation of this grounding
frequency is provided in Annex 5F.
Release Hole Sizes
The selected release hole sizes and associated penetration energy are presented in the following table, which is in line with the previous EIA Report that has been approved by the EPD (1).
Table 5A.18 Release Hole Sizes and Penetration Energy
Release Hole Size Penetration Energy (MJ) 250 mm 100 to 110 MJ 750 mm 111 to 150 MJ 1500 mm >150 MJ
5A.3.2 QRA Study for LNG Terminal
The release event frequencies are referred from OGP (2) and summarised in Table 5A.19.
Table 5A.19 Release Event Frequencies
Equipment Release Scenario
Release Phase
Release Frequency
Unit Reference
Piping 2” to 6” 10 mm hole Liquid/ Gas 3.45E-05 per metre per year
OGP
25 mm hole Liquid/ Gas 2.70E-06 per metre per year
OGP
50 mm hole Liquid/ Gas 6.00E-07 per metre per year
OGP
Piping 8” to 12” 10 mm hole Liquid/ Gas 3.06E-05 per metre per year
OGP
25 mm hole Liquid/ Gas 2.40E-06 per metre per year
OGP
50 mm hole Liquid/ Gas 3.70E-07 per metre per year
OGP
(1) ERM, EIA for Liquefied Natural Gas (LNG) Receiving Terminal and Associated Facilities (Register No.: AEIAR-106/2007),
December 2006.
(2) OGP, Risk Assessment Data Directly, Report No. 434-.1, March 2010.
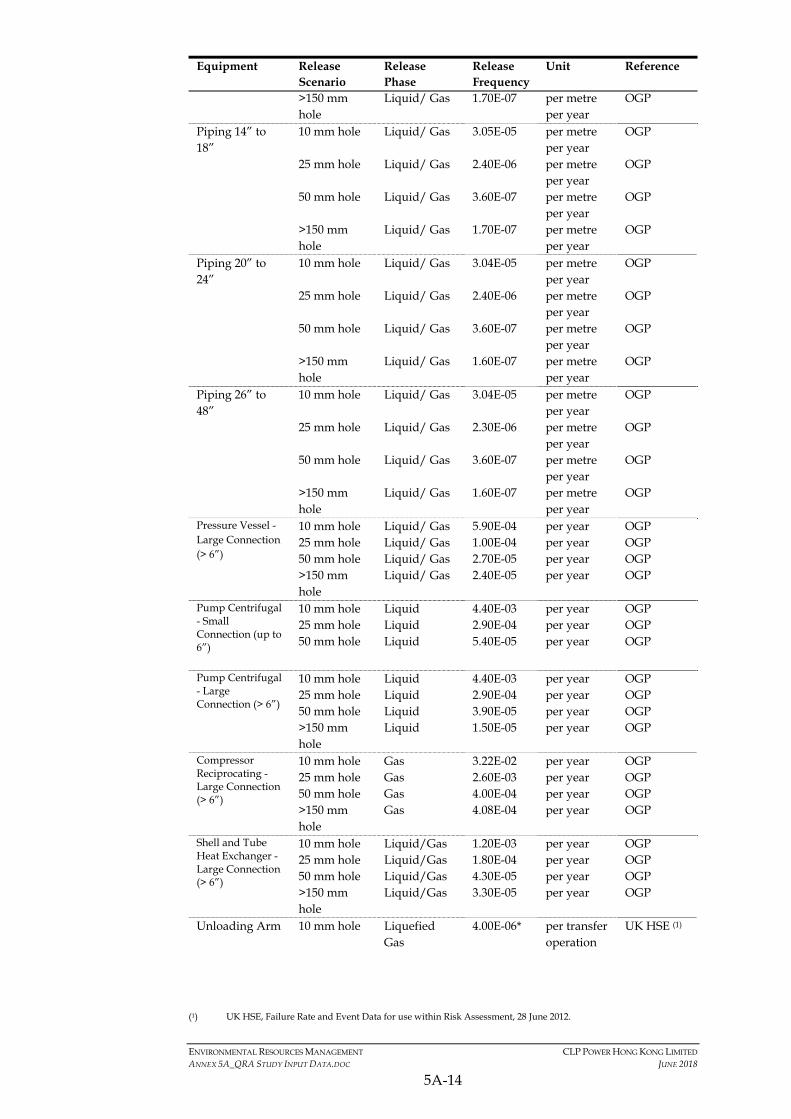
ENVIRONMENTAL RESOURCES MANAGEMENT CLP POWER HONG KONG LIMITED ANNEX 5A_QRA STUDY INPUT DATA.DOC JUNE 2018
5A-14
Equipment Release Scenario
Release Phase
Release Frequency
Unit Reference
>150 mm hole
Liquid/ Gas 1.70E-07 per metre per year
OGP
Piping 14” to 18”
10 mm hole Liquid/ Gas 3.05E-05 per metre per year
OGP
25 mm hole Liquid/ Gas 2.40E-06 per metre per year
OGP
50 mm hole Liquid/ Gas 3.60E-07 per metre per year
OGP
>150 mm hole
Liquid/ Gas 1.70E-07 per metre per year
OGP
Piping 20” to 24”
10 mm hole Liquid/ Gas 3.04E-05 per metre per year
OGP
25 mm hole Liquid/ Gas 2.40E-06 per metre per year
OGP
50 mm hole Liquid/ Gas 3.60E-07 per metre per year
OGP
>150 mm hole
Liquid/ Gas 1.60E-07 per metre per year
OGP
Piping 26” to 48”
10 mm hole Liquid/ Gas 3.04E-05 per metre per year
OGP
25 mm hole Liquid/ Gas 2.30E-06 per metre per year
OGP
50 mm hole Liquid/ Gas 3.60E-07 per metre per year
OGP
>150 mm hole
Liquid/ Gas 1.60E-07 per metre per year
OGP
Pressure Vessel - Large Connection (> 6”)
10 mm hole Liquid/ Gas 5.90E-04 per year OGP 25 mm hole Liquid/ Gas 1.00E-04 per year OGP 50 mm hole Liquid/ Gas 2.70E-05 per year OGP >150 mm hole
Liquid/ Gas 2.40E-05 per year OGP
Pump Centrifugal - Small Connection (up to 6”)
10 mm hole Liquid 4.40E-03 per year OGP 25 mm hole Liquid 2.90E-04 per year OGP 50 mm hole Liquid 5.40E-05 per year OGP
Pump Centrifugal - Large Connection (> 6”)
10 mm hole Liquid 4.40E-03 per year OGP 25 mm hole Liquid 2.90E-04 per year OGP 50 mm hole Liquid 3.90E-05 per year OGP >150 mm hole
Liquid 1.50E-05 per year OGP
Compressor Reciprocating - Large Connection (> 6”)
10 mm hole Gas 3.22E-02 per year OGP 25 mm hole Gas 2.60E-03 per year OGP 50 mm hole Gas 4.00E-04 per year OGP >150 mm hole
Gas 4.08E-04 per year OGP
Shell and Tube Heat Exchanger - Large Connection (> 6”)
10 mm hole Liquid/Gas 1.20E-03 per year OGP 25 mm hole Liquid/Gas 1.80E-04 per year OGP 50 mm hole Liquid/Gas 4.30E-05 per year OGP >150 mm hole
Liquid/Gas 3.30E-05 per year OGP
Unloading Arm 10 mm hole Liquefied Gas
4.00E-06* per transfer operation
UK HSE (1)
(1) UK HSE, Failure Rate and Event Data for use within Risk Assessment, 28 June 2012.

ENVIRONMENTAL RESOURCES MANAGEMENT CLP POWER HONG KONG LIMITED ANNEX 5A_QRA STUDY INPUT DATA.DOC JUNE 2018
5A-15
Equipment Release Scenario
Release Phase
Release Frequency
Unit Reference
25 mm hole Liquefied Gas
4.00E-06* per transfer operation
UK HSE (1)
>150 mm hole
Liquefied Gas
7.00E-06 per transfer operation
UK HSE (1)
Riser 10 mm hole Gas 7.2E-05 per year OGP 25 mm hole Gas 1.8E-05 per year OGP >150 mm
hole Gas 3.0E-05 per year OGP
Diesel Storage Tank
10 mm hole Liquid 1.6E-03 per year OGP 25 mm hole Liquid 4.6E-04 per year OGP 50 mm hole Liquid 2.3E-04 per year OGP Rupture Liquid 3.0E-05 per year OGP
Unloading Hose
10 mm hole Liquid 1.3E-05# per hour Purple Book (1)
25 mm hole Liquid 1.3E-05 per hour Purple Book
50 mm hole Liquid 1.3E-05 per hour Purple Book
Rupture Liquid 4.0E-06 per hour Purple Book
LNG Storage Tank
10 mm hole Liquid 3.3E-06! per year OGP
25 mm hole Liquid 3.3E-06! per year OGP 50 mm hole Liquid 3.3E-06! per year OGP Rupture Liquid 2.5E-08 per year OGP
*Notes: The leak frequency of unloading arm, presented in the UK HSE, has been evenly distributed into 10 mm and 25 mm hole sizes. #Notes: The leak frequency of unloading hose, presented in the Purple Book, has been evenly distributed into 10 mm, 25 mm and 50 mm hole sizes. !Notes: The leak frequency of LNG storage tank, presented in OGP, has been evenly distributed into 10 mm, 25 mm and 50 mm hole sizes.
5A.3.3 QRA Study for Subsea Pipelines
The release frequencies adopted in the QRA Study are summarised in the Table 5A.20 and Table 5A.21:
Table 5A.20 Summary of Release Frequency along the BPPS Pipeline
Pipeline Section Trench Type
Anchor Impact
(/km/yr)
Corrosion/ Defects (/km/yr)
Others (/km/yr)
Total (/km/yr)*
Jetty Approach to South of Soko Islands (X)
4 1.25E-05 1.18E-06 7.90E-07 2.30E-06
Southwest of Soko Islands (A) 5 1.25E-05 1.18E-06 7.90E-07 2.69E-06 Southwest of Fan Lau (B) 5 1.77E-04 1.18E-06 7.90E-07 1.99E-06 Southwest Lantau (C) 2 9.49E-05 1.18E-06 7.90E-07 5.85E-06 West of Tai O (D) 5 9.49E-05 1.18E-06 7.90E-07 1.98E-06 West of HKIA (E) 5 9.49E-05 1.18E-06 7.90E-07 1.98E-06 West of Sha Chau (F) 5 9.49E-05 1.18E-06 7.90E-07 1.98E-06 West of Lung Kwu Chau (G) 3 1.77E-04 1.18E-06 7.90E-07 1.99E-06
(1) Guidelines for Quantitative Risk Assessment, “Purple Book”, 2005.

ENVIRONMENTAL RESOURCES MANAGEMENT CLP POWER HONG KONG LIMITED ANNEX 5A_QRA STUDY INPUT DATA.DOC JUNE 2018
5A-16
Pipeline Section Trench Type
Anchor Impact
(/km/yr)
Corrosion/ Defects (/km/yr)
Others (/km/yr)
Total (/km/yr)*
Lung Kwu Chau to Urmston Anchorage (H)
5 1.77E-04 1.18E-06 7.90E-07 1.99E-06
Urmston Road (I) 4 1.77E-04 1.18E-06 7.90E-07 1.99E-06 West of BPPS (J) 5/1 9.49E-05 1.18E-06 7.90E-07 1.98E-06
*The armour rock protection for the subsea pipeline and the associated protection factors were applied to reduce the anchor impact frequency. Refer to chapter
Table 5A.21 Summary of Release Frequency along the LPS Pipeline
Pipeline Section Trench Type
Anchor Impact
(/km/yr)
Corrosion/ Defects (/km/yr)
Others (/km/yr)
Total (/km/yr) *
Jetty Approach to South of Shek Kwu Chau (A)
4 1.32E-05 1.18E-06 7.90E-07 1.97E-06
South of Cheung Chau (B) 5 1.32E-05 1.18E-06 7.90E-07 1.97E-06 West Lamma Channel (C) 5 1.32E-05 1.18E-06 7.90E-07 1.97E-06 Alternative Shore Approach (D) 1 5.95E-05 1.18E-06 7.90E-07 1.98E-06
*The armour rock protection for the subsea pipeline and the associated protection factors were applied to reduce the anchor impact frequency.
5A.3.4 QRA Study for GRSs at the BPPS and the LPS
The release event frequencies were adopted from Hawksley (1), and summarised in Table 5A.22.
Table 5A.22 Release Event Frequencies for the GRSs at the BPPS and the LPS
Equipment Release Scenario Release Phase Release Frequency
Unit Reference
Pipe size 600 mm to 750 mm
i) 10 & 25 mm hole Liquid/ Gas 1.00E-07 per metre-year
Hawksley (1)
ii) 50 & 100 mm hole Liquid/ Gas 7.00E-08 per metre-year
Hawksley
iii) Full bore rupture Liquid/ Gas 3.00E-08 per metre-year
Hawksley
Pipe size 150 mm to 500 mm
i) 10 & 25 mm hole Liquid/ Gas 3.00E-07 per metre-year
Hawksley
ii) 50 & 100 mm hole Liquid/ Gas 1.00E-07 per metre-year
Hawksley
iii) Full bore rupture Liquid/ Gas 5.00E-08 per metre-year
Hawksley
(1) Hawksley, J.L., Some Social, Technical and Economic Aspects of the Risks of Large Plants, CHEMRAWN III, 1984.
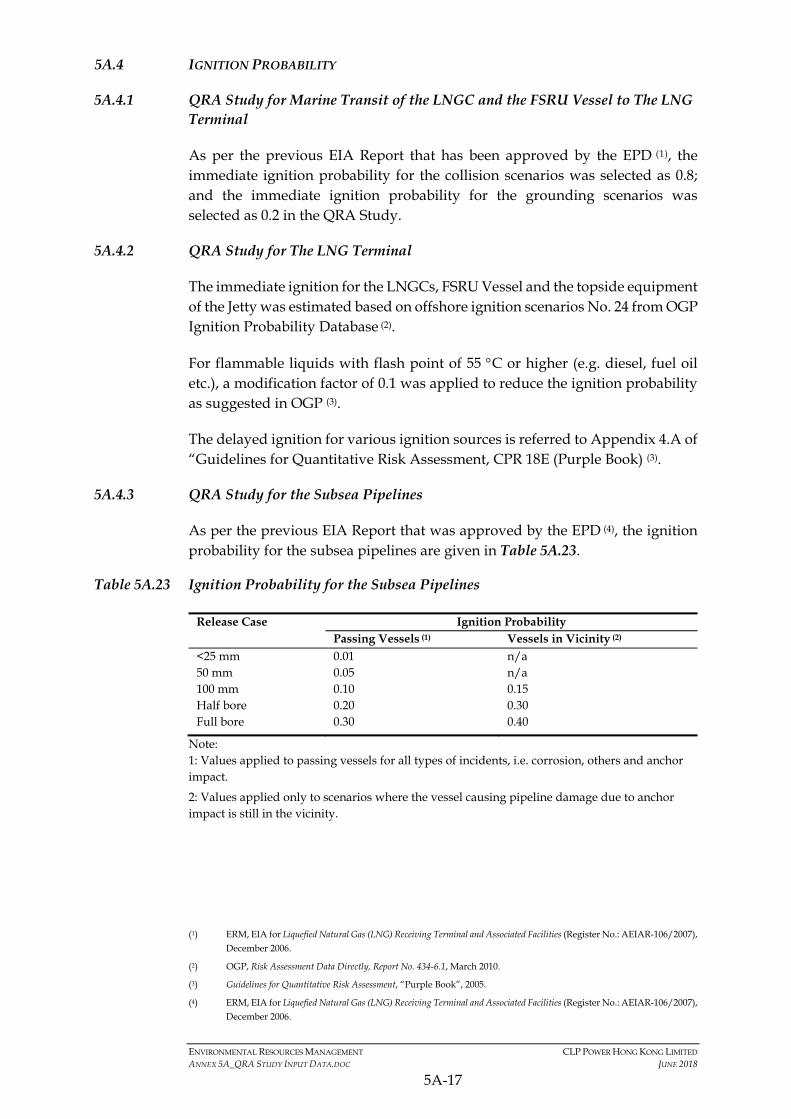
ENVIRONMENTAL RESOURCES MANAGEMENT CLP POWER HONG KONG LIMITED ANNEX 5A_QRA STUDY INPUT DATA.DOC JUNE 2018
5A-17
5A.4 IGNITION PROBABILITY
5A.4.1 QRA Study for Marine Transit of the LNGC and the FSRU Vessel to The LNG Terminal
As per the previous EIA Report that has been approved by the EPD (1), the immediate ignition probability for the collision scenarios was selected as 0.8; and the immediate ignition probability for the grounding scenarios was selected as 0.2 in the QRA Study.
5A.4.2 QRA Study for The LNG Terminal
The immediate ignition for the LNGCs, FSRU Vessel and the topside equipment of the Jetty was estimated based on offshore ignition scenarios No. 24 from OGP Ignition Probability Database (2).
For flammable liquids with flash point of 55 C or higher (e.g. diesel, fuel oil etc.), a modification factor of 0.1 was applied to reduce the ignition probability as suggested in OGP (3).
The delayed ignition for various ignition sources is referred to Appendix 4.A of “Guidelines for Quantitative Risk Assessment, CPR 18E (Purple Book) (3).
5A.4.3 QRA Study for the Subsea Pipelines
As per the previous EIA Report that was approved by the EPD (4), the ignition probability for the subsea pipelines are given in Table 5A.23.
Table 5A.23 Ignition Probability for the Subsea Pipelines
Release Case Ignition Probability Passing Vessels (1) Vessels in Vicinity (2) <25 mm 0.01 n/a 50 mm 0.05 n/a 100 mm 0.10 0.15 Half bore 0.20 0.30 Full bore 0.30 0.40
Note: 1: Values applied to passing vessels for all types of incidents, i.e. corrosion, others and anchor impact.
2: Values applied only to scenarios where the vessel causing pipeline damage due to anchor impact is still in the vicinity.
(1) ERM, EIA for Liquefied Natural Gas (LNG) Receiving Terminal and Associated Facilities (Register No.: AEIAR-106/2007),
December 2006.
(2) OGP, Risk Assessment Data Directly, Report No. 434-6.1, March 2010.
(3) Guidelines for Quantitative Risk Assessment, “Purple Book”, 2005.
(4) ERM, EIA for Liquefied Natural Gas (LNG) Receiving Terminal and Associated Facilities (Register No.: AEIAR-106/2007), December 2006.

ENVIRONMENTAL RESOURCES MANAGEMENT CLP POWER HONG KONG LIMITED ANNEX 5A_QRA STUDY INPUT DATA.DOC JUNE 2018
5A-18
5A.4.4 QRA Study for the GRSs at the BPPS and the LPS
Table 5A.24 summarises the ignition probabilities adopted in the QRA Study for the GRS facilities, as per the previous EIA Report that was approved by the EPD and relevant authorities (1).
Table 5A.24 Ignition Probability for the GRS
Immediate Ignition
Delayed Ignition 1
Delayed Ignition 2
Delayed Ignition Probability
Total Ignition Probability
Small leak 0.02 0.045 0.005 0.05 0.07 Large leak/ rupture
0.10 0.200 0.020 0.22 0.32
5A.5 EXPLOSION PROBABILITY
The probability of explosion given ignition is taken from Cox, Lees and Ang model (1) and summarised in Table 5A.25.
Table 5A.25 Probability of Explosion Given Ignition
Leak Size (Release Rate) Explosion Probability Given Ignition Minor (< 1 kg s-1) 0.04 Major (1 – 50 kg s-1) 0.12 Massive (> 50 kg s-1) 0.30
5A.6 CONSEQUENCE END-POINT CRITERIA
The same consequence end-point criteria are applicable to the QRA Study for all Project components, and are summarised following sections.
5A.6.1 Thermal Radiation of Jet Fire, Fireball and Pool Fire
For thermal radiation impact, the associated fatality/ injury from fire events was estimated based on the following probit equation (2):
Y = -36.38 + 2.56 ln (t I 4/3)
where: Y is the probit I is the radiant thermal flux (W m-2) t is duration of exposure (s)
The exposure time, t, is limited to maximum of twenty (20) seconds.
(1) Cox, Lees and Ang, Classification of Hazardous Locations, IChemE.
(2) TNO, Methods for the Determination of Possible Damage to People and Objects Resulting from Releases of Hazardous
Materials (The Green Book), Report CPR 16E, The Netherlands Organisation of Applied Scientific Research, Voorburg, 1992.

ENVIRONMENTAL RESOURCES MANAGEMENT CLP POWER HONG KONG LIMITED ANNEX 5A_QRA STUDY INPUT DATA.DOC JUNE 2018
5A-19
Table 5A.26 Levels of Harm for 20 seconds Exposure to Heat Fluxes
Incident Thermal Flux (kW m-2)
Fatality Probability for 20 s Exposure
Equivalent Fatality Probability for Area between Radiation Flux Contours
9.8
1.0%
}
}
}
17.0%
19.5
50.0% 77.0%
28.3 35.5
90.0% 99.9%
97.0%
5A.6.2 Flash Fire
With regard to a flash fire, the criterion chosen is that a 100% fatality was adopted for any person outdoors within the flash fire envelope, which was conservatively selected as 0.85 of the LFL.
5A.6.3 Overpressure
The fraction of people in fatality given an explosion is taken from the Purple Book, and summarised in Table 5A.27.
Table 5A.27 Effect of Overpressure
Explosion Overpressure Fraction of People in Fatality Indoor Outdoor > 0.3 barg 1.000 1.000 > 0.1 to 0.3 barg 0.025 0.000
5A.6.4 Fireball
The flammable mass for fireball modelling was conservatively estimated by the initial flow rate continuing for ten (10) seconds even though the initial release rate decreases rapidly in case of a pipeline full-bore rupture scenario.
The fatality rate within the fireball diameter are assumed be 100%.

Environmental Resources Management
Figure 5A.1
Grid Cell Scheme for LNGC/FSRU Vessel Transit and
the Offshore Terminal
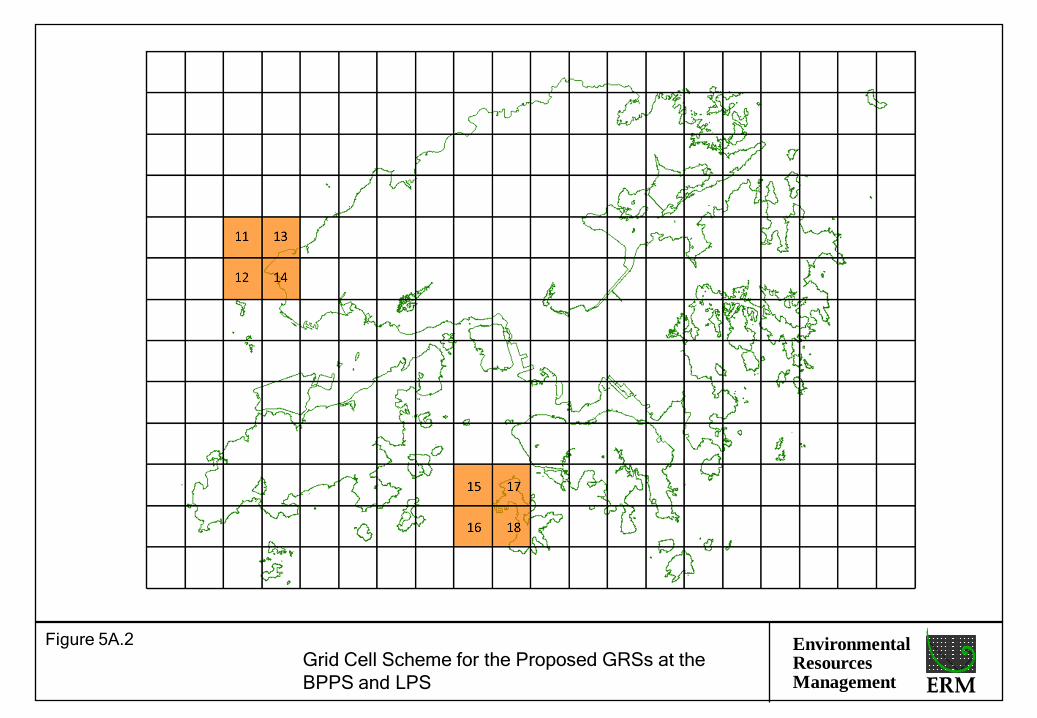
Environmental Resources Management
Figure 5A.2
Grid Cell Scheme for the Proposed GRSs at the
BPPS and LPS

Annex 5B
Detailed Operation and Process Description

ENVIRONMENTAL RESOURCES MANAGEMENT CLP POWER HONG KONG LIMITED ANNEX 5B_DETAILED PROCESS DESCRIPTION.DOC MAY 2018
5B-1
5B DETAILED OPERATION AND PROCESS DESCRIPTION
This Annex presents a detailed description of the process systems and operation of the Project components from the QRA Study point of view as follows:
Section 5B.1 – LNGC Operation
Process and Utility Systems within the LNGC
LNGC Approach to the LNG Terminal
Key Safety Systems for the LNGC
Section 5B.2 – FSRU Vessel Operation
Process and Utility Systems within the FSRU Vessel
Key Safety Systems for the FSRU Vessel
Section 5B.3 – LNG Terminal Operation
LNG Unloading Operation and High Pressure Natural Gas Send-out at the LNG Terminal
Key Safety Systems for the LNG Terminal
Section 5B.4 – Operation of the New GRS at the BPPS
Key Safety Systems for the New GRS at the BPPS
Section 5B.5 – Operation of the New GRS at the LPS
Key Safety Systems for the New GRS at the LPS
5B.1 LNGC OPERATION
5B.1.1 Process and Utility Systems within LNGC
The following process and utility systems are typically provided on the LNGC:
LNG Storage and Unloading System;
Utility System – Power Generation System;
Utility System – Diesel Oil Storage System;
Utility System - Lubricating Oil Storage System;
Utility System – Nitrogen Generation System;

ENVIRONMENTAL RESOURCES MANAGEMENT CLP POWER HONG KONG LIMITED ANNEX 5B_DETAILED PROCESS DESCRIPTION.DOC MAY 2018
5B-2
Utility System – Seawater System;
Utility System – Sodium Hypochlorite Package;
Utility System – Instrument Air System;
Utility System – Fuel Gas System; and
Utility System – Fresh Water and Demineralised Water System.
LNG Storage and Unloading System
Two (2) types of LNGC are considered in the QRA Study:
Small LNGC (170,000 m3 capacity, with each LNG storage tank capacity of about 34,000 m3); and
Large LNGC (270,000 m3, capacity, with each LNG storage tank capacity of about 54,000 m3).
Membrane type double containment system for the LNG cargo storage tanks are provided for the LNGC. The containment system will be designed as per international standards including the International Code for the Construction and Equipment of Ships Carrying Liquefied Gases in Bulk (IGC Code) ( 1 ). The containment system will be provided with a full secondary liquid-tight barrier capable of safely containing all potential leakages through the primary barrier and, in conjunction with the thermal insulation system, of preventing lowering of the temperature of the ship structure to an unsafe level.
In-tank LNG storage pumps are submerged in the LNG cargo tanks. During LNG unloading operation at the LNG Terminal, the LNG in the cargo tanks of the LNGC will be pumped through the unloading arms, via the Jetty, to the LNG cargo tanks of the FSRU Vessel. Detailed description of the LNG unloading operation is presented in Section 5B.3.1 below.
Utility System – Power Generation System
The FSRU Vessel is provided with its own dedicated power generation system. The dual fuel type power generators can operate on both boil off gas as fuel gas and diesel oil (HFO). Under normal circumstances power generation will consume Boil-Off Gas (BOG) as fuel gas. However, under start-up or special maintenance repair circumstances as well as under emergency conditions, the fuel gas may not be available and diesel oil will be the fuel supply to the power generator. In addition, a dedicated emergency diesel power generator is also provided on the FSRU Vessel for back-up power generation and black start-up.
(1) International Code for the Construction and Equipment of Ships Carrying Liquefied Gases in Bulk, Resolution MSC.370 (93)

ENVIRONMENTAL RESOURCES MANAGEMENT CLP POWER HONG KONG LIMITED ANNEX 5B_DETAILED PROCESS DESCRIPTION.DOC MAY 2018
5B-3
Utility System – Diesel Oil Storage System
Diesel oil (HFO) is used for power generation (for both duel fuel main power generator and back-up emergency generator), for supply crane operation, as well as for the diesel driven firewater pumps. Diesel oil storage tanks, settling tank and service tanks are provided for the FSRU Vessel. The maximum capacity of the diesel storage tank was considered as 6,000 m3 in the QRA Study.
Bunkering of diesel oil will be conducted within reach of the supply crane on the FSRU Vessel to handle bunker hoses. A bunker hose reel will be provided. In the QRA Study, it was conservatively considered that the bunkering operation will be performed three (3) times a year with duration of six (6) hours for each operation.
Utility System – Lubricating Oil Storage System
Lube oil storage and settling tanks are typically provided for the FSRU Vessel. Lube oil is used for the power generation prime movers and for major rotating equipment. The maximum capacity of the lube oil storage tank was considered as 100 m3.
Utility System – Nitrogen Generation System
Membrane type nitrogen generators will be typically provided for the FSRU Vessel to generate nitrogen for the purpose of inert gas purging.
Utility System – Seawater System
Seawater will be used to vaporize LNG in the heat exchanger. The seawater will be filtered by intake screens, chlorinated with sodium hypochlorite solution and pumped by seawater pumps. The seawater used from the LNG vaporisation system will return to the sea via gravity discharge off the FSRU Vessel.
Utility System – Sodium Hypochlorite Package
The Sodium Hypochlorite Package provides the on-board generation of sodium hypochlorite by partial electrolysis of sodium chloride contained in the seawater. The electro-chlorination system produces and feeds sodium hypochlorite solution to the seawater intake system to inhibit the growth of marine organisms, bacterial slime, and algae which would otherwise clog the suction and equipment and affect the surface heat transfer of the vaporisation system.
The produced sodium hypochlorite solution, together with the by-product hydrogen, flows through the outlet header to the Hydrocyclones. Hydrogen degassing happens in the Hydrocyclones, and hydrogen is diluted by an air blower before venting to atmosphere. The generated hypochlorite is then injected into the seawater intake structure. During hypochlorite generation, some cations present in seawater will form hydroxides and carbonates resulting in suspended solids depositing on the electrode surface. Hence an acid

ENVIRONMENTAL RESOURCES MANAGEMENT CLP POWER HONG KONG LIMITED ANNEX 5B_DETAILED PROCESS DESCRIPTION.DOC MAY 2018
5B-4
cleaning system is provided to periodically clean the electrode surface with diluted hydrochloric acid. The acid used for electrode cleaning will be neutralized with diluted caustic soda solution. The maximum capacity of the acid and caustic soda solution storage age tanks are 20 L.
Utility System – Instrument Air System
Redundant air compressors will be provided to generate the utility and instrument air for the FSRU Vessel. An instrument air receiver will also be provided for a specified hold up volume.
Utility System – Fuel Gas System
The BOG from the LNG storage tanks will be sent to BOG Compressor. Part of the compressed BOG will be used for fuel gas for power generation. In addition, a small LNG vaporisation unit is also provided for forced BOG generation to provide fuel gas for the FSRU Vessel. Under normal circumstances, power generation will consume BOG treated by the fuel gas skid and delivered at approximately 6 barg.
Utility System – Fresh Water and Demineralised Water System
Fresh water generation system and sterilization system for domestic water will be provided for the FSRU Vessel. A demineralised water system will be required for the boilers. Demineralised water generator will be provided to ensure sufficient demineralised water is available for the boilers.
5B.1.2 LNGC Approach to the LNG Terminal
In the final segment of the approach transit, tugboats will assist in controlling the heading and speed of the LNGC while entering into and manoeuvring within the turning area as well as for the final approach towards the LNG Terminal. The tugboats will continue to assist until the mooring operation has been completed. The number and bollard pull of tugboats for such operations will be based on the findings of a simulation study for the safe manoeuvring of the LNGC.
5B.1.3 Key Safety Systems for the LNGC
Navigation System
The LNGC is equipped with advanced navigational systems such as Digital Global Positioning System (DGPS), radar and communication system. The marine traffic is monitored by the Vessel Traffic System (VTS), providing an active monitoring and navigational advice for vessels.
Also, the LNGC’s navigation is constantly monitored by well trained and experienced master and the officers to make good use of the navigation system for the LNGC transit to the LNG Terminal.

ENVIRONMENTAL RESOURCES MANAGEMENT CLP POWER HONG KONG LIMITED ANNEX 5B_DETAILED PROCESS DESCRIPTION.DOC MAY 2018
5B-5
Double Containment System
The containment system is designed as per international standards including the International Code for the Construction and Equipment of Ships Carrying Liquefied Gases in Bulk (IGC Code) (1). The containment system is provided with a full secondary liquid-tight barrier capable of safely containing all potential leakages through the primary barrier and, in conjunction with the thermal insulation system, preventing the lowering of ship structure temperature to an unsafe level.
Leak detection system is provided between the primary and secondary containment barriers. In addition, the LNG cargo tanks are provided with pressure relief valves which connect to a designated vent piping system.
Process Control System
Process control valves (e.g. pressure control, temperature control etc.) are provided in the process facility in order to continuously maintain the stability of the overall process operation. Process deviation alarms are also provided to alert the operators to take necessary actions.
Emergency Shutdown System
ESD System is provided at the LNGC to stop LNG flow in the event of an emergency and to return the system to a safe, static condition so that remedial action can be taken. The ESD system can be activated automatically through various initiators (e.g. power failure, cargo tank overfill etc.) and manually through push buttons.
The ESD system is generally divided into two levels:
ESD-1: Shuts down the cargo transfer operation in a quick controlled manner by closing the shutdown valves and stopping the transfer pumps and other relevant equipment in ship;
2nd stage: Activates the Powered Emergency Release Coupling (PERC) System installed on the unloading arms (ESD-2).
According to the IGC Code requirements (2), the following protection systems are required to be installed in the LNGC:
Overfill protection in the LNG cargo tanks;
Vacuum protection in the LNG Cargo tanks; and
Excess flow protection in the LNG unloading lines and vapour return lines.
(1) International Code for the Construction and Equipment of Ships Carrying Liquefied Gases in Bulk, Resolution MSC.370 (93)
(2) International Code for the Construction and Equipment of Ships Carrying Liquefied Gases in Bulk, Resolution MSC.370 (93)

ENVIRONMENTAL RESOURCES MANAGEMENT CLP POWER HONG KONG LIMITED ANNEX 5B_DETAILED PROCESS DESCRIPTION.DOC MAY 2018
5B-6
Overpressure Protection System
The boil-off vapour in the cargo tanks can be sent to BOG system to maintain the vapour pressure inside the cargo tanks. Pressure relief system is also provided for the LNG cargo tanks. The cargo tank and interbarrier space are fitted with pressure relief valve(s) which connect to a venting system. The setting of the pressure relief valves will be lower than the vapour pressure adopted in the design of the cargo tanks.
Emergency Flare System
The LNGC is equipped with an emergency flare stack that is use only for the release of vaporized LNG in the event of an emergency.
Custody Transfer Measurement System
The LNGC is provided with an automatic system for the calculation of LNG and gas volumes in each cargo tank. The use of such system, commonly referred to as the ship’s custody transfer measurement system (CTMS) will facilitate the process of determining quantities transferred during loading and unloading. The CTMS processes data from tank level, temperature, pressure sensors, etc. in real time, taking into account the required corrections and certified gauge table, to produce a calculation of volumes before, during and after LNG transfer operation.
Fire Detection and Protection System
Flammable gas and fire detectors are provided at the LNGC to detect leakage of natural gas and fire events respectively. The detectors will be positioned at strategic locations to provide adequate detection coverage for the facility.
Typically the following fire-fighting systems are provided in the LNGC:
Deluge/water spray system;
Dry chemical power system; and
Foam system to cover deck.
5B.2 FSRU VESSEL OPERATION
The schematic diagram for the LNG Terminal, including FSRU Vessel, LNGC is depicted in Figure 5B.1.
5B.2.1 Process and Utility Systems within the FSRU Vessel
The LNG cargo tanks, process and utility systems described in Section 5B.1 for the Large LNGC are applicable to the FSRU Vessel as well. The following additional process systems are provided for the FSRU Vessel:
LNG Send-out Booster Pump System;

ENVIRONMENTAL RESOURCES MANAGEMENT CLP POWER HONG KONG LIMITED ANNEX 5B_DETAILED PROCESS DESCRIPTION.DOC MAY 2018
5B-7
LNG Regasification System; and
BOG Handling and Recovery System.
LNG Booster Pump System
The LNG from the discharge of the In-Tank LNG Storage Pump is pumped at 5 barg to the LNG Booster Pump Suction Drum which acts as a buffer volume. The LNG inside the Suction Drum is then pumped via the LNG Booster Pumps, at a capacity of 250 m3 for each Booster pump, to the Regasification System at 90 barg.
LNG Regasification System
Regasification trains are provided at the Regasification Module of the FSRU Vessel, with a maximum installed capacity of 1,000 mmscfd.
The LNG from the discharge of the LNG Booster Pumps is re-gasified and superheated to the required send-out temperature of 5 C. The LNG is re-gasified by a simple heat exchange process using seawater. Common types of vaporizers for an FSRU Vessel include generic Intermediate Fluid Vaporizer (IFV) and Shell & Tube Vaporisers (STV) which are both compatible with wave motions experienced by the FSRU Vessel.
BOG Handling and Recovery System
The FSRU Vessel is equipped with a BOG Recovery System to handle the BOG generated by heat ingress during normal operations as well as BOG generated during unloading and reloading operations. Typically the BOG Recovery System consists of the following equipment items:
BOG Compressor Suction Drum;
BOG Compressors; and
BOG Recondenser.
During LNGC unloading, the displacement vapour from the FSRU Vessel LNG storage tanks flows back to the LNGC via the vapour return loading arm to replace the displaced LNG volume in the LNGC storage tanks. Excess displacement vapour flows to the BOG Compressor (2 x 100%) where it is compressed and sent to the BOG Recondenser at 6 barg. The LNG cargo tank boil off rate is selected as 0.13 vol% per day in the QRA Study. A BOG Compressor Suction Drum is provided to prevent any liquid entering the BOG Compressors.
The BOG Recondenser has two primary functions: the top section of the BOG Recondenser houses a packed bed in which BOG is contacted with sub-cooled LNG for liquefying the BOG; and the lower section of the BOG Recondenser serves as a liquid holdup drum for the LNG Booster Pumps.

ENVIRONMENTAL RESOURCES MANAGEMENT CLP POWER HONG KONG LIMITED ANNEX 5B_DETAILED PROCESS DESCRIPTION.DOC MAY 2018
5B-8
Sub-cooled LNG for recondensing BOG is taken from the LNG send-out line and the operating pressure of the BOG Recondenser ensures that LNG remains at sub-cooled conditions. LNG in excess of the recondensation requirements is routed through the BOG Recondenser bypass line and mixed with the LNG stream leaving the bottom of the BOG Recondenser. This mixed stream of LNG is then routed to the LNG Booster Pumps.
When the FSRU Vessel is not connected to the double berth jetty (e.g. during adverse weather conditions), BOG which cannot be held in the FSRU Vessel LNG storage tanks and is not required for power generation (i.e. excess BOG) will be routed to an oxidizer. The BOG will then undergo combustion before being vented to the atmosphere via the FSRU Vessel cold vent.
5B.2.2 Key Safety Systems for the FSRU Vessel
The safety systems described above for the LNGC are also applicable for the FSRU Vessel.
5B.3 LNG TERMINAL OPERATION
5B.3.1 LNG Unloading Operation and High Pressure Natural Gas Send-out at the LNG Terminal
The maximum LNG unloading rate of 12,000 m3/hr was conservatively considered in the QRA Study. The LNG unloading time from Small LNGC (170,000 m3) to FSRU Vessel is a maximum of 24 hours, and the LNG unloading time from Large LNGC (270,000 m3) to FSRU Vessel is a maximum of 36 hours.
The LNG from LNGC is unloaded via four (4) standard 16 inch loading arms on the jetty head (2 for LNG unloading; 1 for vapour return; 1 hybrid for spare). During cargo discharge the vapour pressure in the LNGC cargo tanks will be maintained by returning vapour from the FSRU Vessel. With this balanced system, under normal circumstances, no hydrocarbons will be released to the atmosphere from ship.
At the end of unloading, pressurised nitrogen gas will be used to purge the unloading arms of LNG before disconnecting.
Ballasting operations (i.e. taking on seawater to compensate for the unloaded mass of LNG) will be concurrent with the LNG unloading. The maximum LNGC staying time at the LNG Terminal is 48 hours after arrival. This includes allowances for the pre-cooling operations, arrival cargo measurements, unloading operations, cargo measurements on completion of discharge and nitrogen displacement of unloading arms prior to disconnection.
Once the LNG in the FSRU Vessel is re-gasified, the send-out high pressure natural gas is delivered to the LNG Terminal via three (3) standard 12 inch loading arms on the jetty head (2 working and 1 spare).
The LNG Terminal will operate in two main modes of operation:

ENVIRONMENTAL RESOURCES MANAGEMENT CLP POWER HONG KONG LIMITED ANNEX 5B_DETAILED PROCESS DESCRIPTION.DOC MAY 2018
5B-9
Unloading Mode – The unloading mode is the period when an LNGC is moored on the double berth jetty and is connected to the FSRU Vessel storage tank by means of unloading and loading arms on the jetty platform. The pumps on the LNGC will transfer the LNG in both the unloading and the re-circulation lines to the FSRU Vessel storage tanks. At the end of unloading, pressurised nitrogen gas will be used to purge the arms of LNG before disconnecting.
Holding Mode – The holding mode is the period when no unloading takes place, while send-out to the subsea gas pipelines continues. The purpose of the holding mode is to allow cryogenic conditions to be maintained in the unloading and circulation system. In order to maintain these conditions LNG will be circulated via the unloading line to the double berth jetty head and back to the FSRU Vessel storage tanks or the send-out system via the re-circulation line.
5B.3.2 Key Safety Systems for the LNG Terminal
Jetty monitoring and management system is provided at the LNG terminal, which serves to closely monitor the mooring line tension and vessel motion. Excessive mooring line tension and vessel motion will activate alarm and subsequent ESD system to shutdown the LNG cargo transfer operation.
5B.4 OPERATION OF GRS AT THE BPPS
The schematic diagram for the GRS facilities at the BPPS is depicted in Figure 5B.2.
The maximum flow rate at the new GRS at the BPPS is 700 mmscfd. The inlet emergency shutdown valve (ESDV) defines the transition between the 30” BPPS Pipeline and the new GRS at the BPPS. A pig receiver receives maintenance and inspection pigs from the BPPS Pipeline connecting to the LNG Terminal.
The high pressure natural gas at 88 barg and 20 °C first enters the Gas Filter Skid (3 operational filters and 1 spare filter) to remove traces of liquid mist and solid particles in the incoming gas. The filtered gas then flows through the Gas Metering Skid (3 operational meters and 1 spare meter). Flow signals are transmitted to the control room at the BPPS. A composite sampler is provided to gather samples for gas chromatography testing.
The gas is then heated in the Pipeline Gas Heaters (1 operational heater and 1 spare heater) to 60 °C, before entering the Pressure Control Skid. The Pressure Control Skid consists of three (3) parallel pressure reduction stations and one (1) standby pressure reduction station, in order to adjust the delivery sales gas pressure to 38 barg.
The natural gas at 38 barg and 20 °C then flows through the HIPPS Skid and mixes with the sales gas from the existing BPPS GRS at the existing Mixing Station, before entering the BPPS power generation facilities.

ENVIRONMENTAL RESOURCES MANAGEMENT CLP POWER HONG KONG LIMITED ANNEX 5B_DETAILED PROCESS DESCRIPTION.DOC MAY 2018
5B-10
5B.4.1 Key Safety Systems for the New GRS at the BPPS
Process Control System
Process control valves (e.g. pressure control, temperature control etc.) are provided in the new GRS area in order to continuously maintain the stability of the overall process operation. Process deviation alarms are also provided to alert the operators to take necessary actions.
Emergency Shutdown System
ESD system is provided at the new GRS area in the event of an emergency and to return the system to a safe, static condition so that any remedial action can be taken. The ESD system can be activated automatically through various process initiators and manually through push buttons.
ESDV are provided in the new GRS to isolate the inventory in the event of emergency situation as such the leakage of the hazardous material can be controlled and minimized.
Overpressure and Blowdown System
Pressure control valves are provided at the new GRS area to maintain the pressure of natural gas in the process system. However, in the event of overpressure, the blowdown system is designed to vent automatically from a point downstream of the pressure reduction station to a vent stack. A CO2 snuffing system is installed to extinguish the vent if the gas is ignited by lightning or other causes.
Fire and Gas Detection System
Fire and flammable gas detectors are provided at the new GRS area to detect events of fire and flammable gas leakage.
Fire Protection System
Firewater ring main system, firewater monitors, fire hydrants and hose reels are provided at the new GRS area.
5B.5 OPERATION OF THE NEW GRS AT THE LPS
The schematic diagram for the GRS facilities at the LPS is depicted in Figure 5B.3.
Four (4) trains of gas receiving units are provided at the new GRS at the LPS. Four (4) natural gas conditioning trains are provided at the GRS, with maximum flow rate of 63.5 mmscfd for each train. The total maximum flow rate for the new GRS is approximately 254 mmscfd. Each train is dedicated to one CCGT unit.
ENVIRONMENTAL RESOURCES MANAGEMENT CLP POWER HONG KONG LIMITED ANNEX 5B_DETAILED PROCESS DESCRIPTION.DOC MAY 2018
5B-11
The inlet emergency shutdown valve (ESDV) defines the transition between the 20” LPS Pipeline and the new GRS at the LPS. A pig receiver receives maintenance and inspection pigs from the LPS Pipeline connecting to the LNG Terminal.
The high pressure natural gas at 82 barg and 6 °C flows through the common header of the incoming gas, which connects to four (4) trains of gas receiving systems. In each of the gas receiving trains, there is a Gas Filter Skid (1 operational filter and 1 spare filter) to remove traces of liquid mist and solid particles in the incoming gas. Then the filtered gas flows through the Gas Metering Skid (1 operational meter and no spare). Flow signals are transmitted to the control room at the LPS. A composite sampler is provided to gather samples for gas chromatography testing.
In addition, part of the natural gas from the existing pipeline for the existing GRS is diverted to the proposed GRS at the LPS. A dedicated Gas Filter Skid (1 operational filter and 1 spare filter) and Gas Metering Skid (1 operational meter and no spare) are provided in each of the proposed GRS Trains to receive the natural gas from the existing natural gas subsea pipeline.
The natural gas from the outlet of the two metering skids in each GRS train is then mixed at the Mixer (1 operational meter and no spare) and then enters the Water Bath Heater (1 operational meter and no spare) to heat up the gas to 51 °C. The heated gas then flows through the Pressure Reduction Skid, in order to adjust the delivery sales gas pressure to 41 barg. The natural gas at 41 barg and 20 °C is then sent to the CCGT facilities at the LPS.
5B.5.1 Key Safety Systems for the Proposed GRS at the LPS
Major safety systems described above for the proposed GRS at the BPPS are also applicable for the proposed GRS at the LPS.

Environmental Resources Management
Figure 5B.1
Schematic Diagram for the LNG Terminal
LNG Carrier Storage LNG Storage
Shell & Tube Vaporizer
LNG Booster Pump
LNGLoading Arm
LNGLoading Arm
High PressureGas Arm
Double Berth Jetty
Sea Water Out
Sea Water In
M
Power Plants
Gas Meter
LNG Pump LNG Pump
-162oC -162oC
Δ9oC
0-5oC
LNG
NG
Jetty FSRU Vessel

Environmental Resources Management
Figure 5B.2
Schematic Diagram for GRS facilities at the BPPS
FILTERSPIG RECEIVER
PC
PC
PC
HT011
HT021
HEATERS PRESSIRE REDUCTION STATION
From
pipeline
Distribution header
PC
METERING HIPPS

Environmental Resources Management
Figure 5B.3
Schematic Diagram for GRS facilities at the LPS
FILTERSPIG RECEIVER HEATER PRESSIRE REDUCTION STATION
GAS MIXER
From
HKOLNG
LPS Pipeline
From Dapeng
Gas Pipeline
Header
PC
PC
To CCGT
HTMIXER
To Other
Unitized GRS
Stream
To Other
Unitized GRS
Stream

Annex 5C
Summary of Industry Incidents Review

ENVIRONMENTAL RESOURCES MANAGEMENT CLP POWER HONG KONG LIMITED ANNEX 5C_REVIEW OF INDUSTRY INCIDENTS.DOC MAY 2018
5C-1
5C SUMMARY OF INDUSTRY INCIDENT REVIEW
A review of the past industry incidents at similar facilities worldwide has been conducted to further investigate the possible hazards from the Project’s facilities. This Annex summarises the findings on the past industry incidents based on the review of comprehensive incidents/ accidents database.
5C.1 INCIDENTS RELATED TO LNGC AND FSRU VESSEL
Incidents/ accidents related to LNGC are summarised in Table 5C.1.
Based on the listed sources in the table below, no safety incident has been recorded for FSRU Vessels since the world’s first FSRU Vessel began operation more than 10 years ago.
Table 5C.1 Summary of Incident Review for LNGC
Date, place Cause Description Source
Negeshi, Japan (1970) External Event
A few hours out of Japan heavy seas caused sloshing of cargo tanks in LNG ship steaming from Japan to Alaska. A thin membrane wall bent in four places and a half inch crack formed in a weld seam.
MHIDAS
Boston, Massachusetts, USA (1971)
Mechanical-Failure
LNG ship “Descartes” had gas leak from tank, faulty connection between tank dome and membrane wall, crew reportedly tried to conceal leak from authorities.
MHIDAS
Terneuzen; Algeria (1974)
Collision LNG ship “Euclides” sustained contact damage with another vessel, causing damage to bulwark plating and roller fairlead.
MHIDAS
Canvey Island; Essex; UK (1974)
Collision The coaster “Tower Princess” struck the “Methane Progress” as it was tied up at the LNG jetty tearing a 3 ft gash in its stern. No LNG was spilled & no fire
MHIDAS
El Paso Paul Kayser (1979)
Grounding While loaded with 99,500 m3 of LNG, the ship ran at speed onto rocks and grounded in the Straits of Gibraltar. She suffered heavy bottom damage over almost the whole length of the cargo spaces resulting in flooding of her starboard double bottom and wing ballast tanks. Despite this extensive damage, the inner bottom and the membrane cargo containment maintained their integrity. Five days after grounding, the ship was refloated on a rising tide by discharge of
SIGTTO (Society of International Gas Tankers Terminal and Operators Ltd.)

ENVIRONMENTAL RESOURCES MANAGEMENT CLP POWER HONG KONG LIMITED ANNEX 5C_REVIEW OF INDUSTRY INCIDENTS.DOC MAY 2018
5C-2
Date, place Cause Description Source
ballast by the ships’ own pumps and by air pressurisation of the flooded ballast spaces.
Libra (1980) Mechanical Failure
While on passage from Indonesia to Japan, the propeller tail shaft fractured, leaving the ship without propulsion. The Philippine authorities granted a safe haven in Davao Gulf to which the ship was towed. Here, with the ship at anchor in sheltered water, the cargo was transferred in thirty two (32) hours of uneventful pumping to a sister ship moored alongside. The LNG Libra was then towed to Singapore, gas-freeing itself on the way and was repaired there. In this casualty, there was, of course, no damage to the ship’s hull and no immediate risk to the cargo containment.
SIGTTO (Society of International Gas Tankers Terminal and Operators Ltd.)
Taurus (1980) Grounding Approaching Tobata Port, Japan to discharge, the ship grounded in heavy weather with extensive bottom damage and flooding of some ballast tanks. After off-loading some bunkers and air pressurising the ruptured ballast spaces, the ship was refloated four days grounding. Despite the extent of bottom damage, the inner hull remained intact and the spherical cargo containment was undistributed. After a diving inspection at a safe anchorage, the ship proceeded under its own power to the adjacent LNG reception terminal and discharged its cargo normally.
SIGTTO (Society of International Gas Tankers Terminal and Operators Ltd.)
Thurley, United Kingdom (1989)
Human Error
While cooling down vaporisers in preparation for sending
out natural gas, low-point drain valves were opened. One of these valves was not closed when pumps were started and LNG entered the vaporisers. LNG was released into the atmosphere and the resulting vapor cloud ignited, causing a flash fire that burned two operators.
Cabrillo Port Liquefied Natural Gas Deepwater Port Final EIS/EIR
Bachir Chihani (1990) Mechanical Failure
Sustained structural cracks allegedly caused by stressing and fatigue in inner hull.
Cabrillo Port Liquefied Natural Gas Deepwater Port Final EIS/EIR

ENVIRONMENTAL RESOURCES MANAGEMENT CLP POWER HONG KONG LIMITED ANNEX 5C_REVIEW OF INDUSTRY INCIDENTS.DOC MAY 2018
5C-3
Date, place Cause Description Source
BOSTON, MASSACHUSETTS, USA (1996)
External Fire Event
Loaded LNG carrier sustained electrical fire in main engine room whilst tied up alongside terminal. Fire extinguished by crew using dry chemicals. Cargo discharged at reduced rate (over 90 h instead of 20 h) & vessel sailed under own power.
MHIDAS
SAKAI SENBOKU, Japan (1997)
Collision LNG tanker sustained damage to shell plating on contact with mooring dolphin at pier. No spillage or damage to cargo system.
MHIDAS
BOSTON, MASSACHUSETTS, USA (1998)
Human Factor
LNG carrier was discharging cargo when arcs of electricity shorted out two of her generators. The US coast guard removed the vessel's certification of compliance as this incident was the latest in a series of deficiencies on the vessel.
MHIDAS
POINT FORTIN, TRINIDAD (1999)
Collision A LNG carrier collided with a pier after it suffered an engine failure. There was no pollution or any injuries. The pier was closed for 2 weeks. $330,000 of damage done.
MHIDAS
EVERETT, MASSACHUSSETTS, USA (2001)
Mechanical Suspected overpressurisation of No. 4 cargo tank resulted in some cracking of the outer tank dome. A minor leakage resulted in offloading being temporarily suspended. The tank itself was not damaged and offloading was completed. Vessel not detained.
MHIDAS
East of the Strait of Gibraltar (2002)
Collision Collision with a U.S. Navy nuclear-powered attack submarine, the U.S.S Oklahoma City. In ballast condition. Ship suffered a leakage of seawater into the double bottom dry tank area.
Cabrillo Port Liquefied Natural Gas Deepwater Port Final EIS/EIR
5C.2 INCIDENT RELATED TO SUBSEA PIPELINES
The representative incidents/ accidents related to the subsea pipelines are summarised in Table 5C.2.
Table 5C.2 Summary of Incident Review for the Subsea Pipelines
Date, place Cause Description Source
2006, St. Mary Parish, Louisiana
Dropped object
In a recent accident, a ruptured high-pressure natural gas pipeline was struck by a 5-ton mooring spud, dropped from a towing vessel Miss Megan. The uninspected vessel was pushing two barges, a construction barge, Athena 106, and the unmanned deck barge,
National Transportation Safety Board (2007)

ENVIRONMENTAL RESOURCES MANAGEMENT CLP POWER HONG KONG LIMITED ANNEX 5C_REVIEW OF INDUSTRY INCIDENTS.DOC MAY 2018
5C-4
Date, place Cause Description Source
IBR 234, through the West Cote Blanche Bay oil field in St. Mary Parish, Louisiana. The aft spud on Athena 106 was released from its fully raised position and struck the buried gas pipeline in the northwest area of the oil field. (Spuds were used to keep the barges stationary and hold them in place during marine construction work). The released gas was ignited and the subsequent fire engulfed both the towing vessel and the two barges. Five out of eight people onboard, including the master and four barge workers were killed and one barge worker was reported missing. Following the investigation conducted by NTSB, the cause of the accident was ascribed to the failure of the owner of Athena 106, Athena Construction and the master and owner of Miss Megan, Central Boat Rentals to ensure the spuds were pinned securely on its barges before getting under way
1996, Tiger Pass, Louisiana
Dropped object
On 23 October 1996, in Tiger Pass, Louisiana, the crew of the dredge Dave Blackburn dropped a stern spud (a spud is a large steel shaft that is dropped into the river bottom to serve as an anchor and a pivot during dredging operations) into the bottom of the channel in preparation for continued dredging operations. The spud struck and ruptured a 12” diameter submerged natural gas steel pipeline. The pressurised (about 930 psig) natural gas released from the pipeline enveloped the stern of the dredge and an accompanying tug. Within seconds of reaching the surface, the natural gas ignited and the resulting fire destroyed the dredge and the tug. All 28 crew members from the dredge and tug escaped into water or onto nearby vessels. No fatalities resulted. The incident occurred due to incorrect information on the location of the gas pipeline that was passed on by the gas company to the dredging operator. The investigation report on the incident (by the NTSB) recommended that all pipelines crossing navigable waterways are accurately located and marked permanently.
National Transportation Safety Board (1998)
1989, Sabina Pass, Texas,
Dropped object
The menhaden vessel Northumberland struck a 16” gas pipeline in shallow water near Sabina Pass, Texas. The vessel was engulfed in flames; 11 of the 14 crew members died. The pipeline, installed in 1974 with 8 to 10 feet of cover, was found to be lying on the bottom, with no cover at all.
National Research Council (1994)

ENVIRONMENTAL RESOURCES MANAGEMENT CLP POWER HONG KONG LIMITED ANNEX 5C_REVIEW OF INDUSTRY INCIDENTS.DOC MAY 2018
5C-5
Date, place Cause Description Source
1987, Louisiana
Unknown In July 1987, while working in shallow waters off Louisiana, a fishing vessel, the menhaden purse seiner Sea Chief struck and ruptured an 8” natural gas liquids pipeline operating at 480 psi. The resulting explosion killed two crew members. Divers investigating found that the pipe, installed in 1968, was covered with only 6” of soft mud, having lost its original 3-foot cover of sediments.
National Research Council (1994)
5C.3 INCIDENT RELATED TO NATURAL GAS FACILITIES
Incidents/ accidents related to natural gas facilities, which are similar to the GRSs at the BPPS and LPS, are summarised in Table 5C.3.
Table 5C.3 Summary of Incident Review for Natural Gas Facilities
Date, place Cause Description Source
25/06/2001, Kazakhstan
Corrosion Six metres of a one metre diameter pipe was thrown forty metres in the blast. Corrosion of the pipeline is thought to have led to the leak that caused the blast. Fire quickly extinguished and supplies resumed through an alternative pipe after three hours.
MHIDAS
10/04/2001, USA Mechanical failure Residents were evacuated for about three hours after a volatile gas cloud formed over a natural gas facility. The source of the leak was tracked down to a section of pipe, which was repaired.
MHIDAS
28/12/2000, Canada
Unknown Explosion at a natural gas pumping station rattled windows 1.5 miles away. There was no rupture of the pipeline itself and the cause of the incident remains unknown. One man severely injured and gas pressure to customers affected
MHIDAS
28/05/2000, Canada
Mechanical failure A section of the forty two inches pipeline ruptured during pressure-testing of the pipe.
MHIDAS
18/11/1998, UK Impact Workmen caused a main gas pipeline to fracture, sending a 30 ft plume of gas into the air. Local residents were evacuated and roads sealed off. It was
MHIDAS

ENVIRONMENTAL RESOURCES MANAGEMENT CLP POWER HONG KONG LIMITED ANNEX 5C_REVIEW OF INDUSTRY INCIDENTS.DOC MAY 2018
5C-6
Date, place Cause Description Source
several hours before the pressure had dropped enough for the pipe to be sealed off. No one was injured.
14/08/1998, USA External events Lightning strike set fire to a natural gas compressor station. The resulting explosions sent a fireball 600 ft into the air. Five people were injured. Gas supplies to the whole of the Florida peninsula were shut off. Residents within two miles were evacuated.
MHIDAS
02/04/1998, Russia
Unknown The metering unit of the natural gas distribution station was rocked by an explosion. A fire also occurred.
MHIDAS
27/06/1997, USA Human factor Gas escaped from a pipeline when equipment being used to take a metering station out of commission fractured a valve. No injuries were reported. People within a mile of the rupture were evacuated. No fire or explosion occurred.
MHIDAS
18/12/1995, Russia
Mechanical failure Section of pipeline exploded due to high pressure in pipe.
MHIDAS
19/03/1995, USA Unknown Thirty six inches gas pipe ruptured. Leak caught fire & damaged reported 300 ft section. Gas rerouted to two parallel lines
MHIDAS
29/07/1993, UK Impact 1,000 workers were evacuated as building contractors ruptured a mains pipe sending 40 ft gas into the air. Roads were sealed off for about an hour while the leak was brought under control.
MHIDAS
18/05/1989, Germany
General maintenance
Repairs to product pipeline possibly caused explosions/fires which destroyed refinery pumping/mixing station. Blaze burned for four hours as fire fed by 100 tonnes of fuel leaking from broken pipe system.
MHIDAS
10/10/2012, EU Operation Error The explosion occurred on 10 October 2012, just before midday, when the unit was being restarted. Earlier that morning, we had switched over to oil fuel in order to scan for defective non-return valves on the water-injection purging circuit. A transfer from
eMARS

ENVIRONMENTAL RESOURCES MANAGEMENT CLP POWER HONG KONG LIMITED ANNEX 5C_REVIEW OF INDUSTRY INCIDENTS.DOC MAY 2018
5C-7
Date, place Cause Description Source
natural gas to oil fuel takes place every 15 days in the period mid-October to March to prevent problems with fuel solidifying in ducts due to colder external temperatures. After the test we switched back to natural gas and proceeded to restart the unit at approximately 11:48. During each start-up, the gas valves (regulating valve SRV and on-off valves VS4, GCV1, GCV2 and GCV4) are tested for tightness. The test did not detect any problems. We therefore proceeded with the start-up by opening the gas supply and activating the spark plugs. At approximately 11:58, excessive vibrations were detected, corresponding to the time of the explosion (methane deflagration) in the boiler. This triggered the shutdown of the gas turbine and the whole unit.
13/10/2008, EU Operation Error Explosion and fire caused by an unexpected and incidental flow of unburned Syngas in the room of the waste-heat boiler of the "Module 1" unit, for a wrong operation during the procedures of stop and purging for the maintenance of the turbogas (TG) of “Module 1”. The operation was controlled by subcontracted person and directed and coordinated by a shift head in the control room.
eMARS
15/11/2007, USA Unknown An explosion occurred at around 11.30 am in a natural gas treatment facility. It resulted in four injuries, two of them were severe.
ARIA
23/09/2002, USA Unknown In a natural gas treatment facility, a flash fire like event occurred in the central part where the raw natural gas is washed to remove impurities. Four of the nearby employees are injured, three suffered severe burns and intoxication.
ARIA
28/05/2000, Canada
Overpressure A forty two inches pipe transporting natural gas
ARIA

ENVIRONMENTAL RESOURCES MANAGEMENT CLP POWER HONG KONG LIMITED ANNEX 5C_REVIEW OF INDUSTRY INCIDENTS.DOC MAY 2018
5C-8
Date, place Cause Description Source
ruptured during a pressure test. Authorities indicated that the gas inlet was promptly shut down; environmental effects were therefore assumed to be zero.
04/01/1999, USA Unknown In a substation of a natural gas pipeline, a leakage led to an explosion and a fire destroying a house and workshop. The incident, visible from thirty kilometres was taken care of by firemen and controlled within four hours. Two firemen suffered mild injuries.
ARIA
08/02/1997, USA Unknown A leakage occurred on a natural gas pipeline of 660 mm diameter. The gas cloud exploded and a 100 m high flame occurred. Nearby houses were shaken by the deflagration.
ARIA
01/01/1997, Turkey
Human error A natural gas leak occurred on a badly closed valve on a pipe (pressure= 20 bar). This incident led to death by asphyxiation of the two employees who entered in the room, one equipped with an inappropriate mask and the other without equipment.
ARIA
22/11/1995, Russia
Corrosion An explosion followed by a fire occurred on a 0.5 m diameter natural gas pipe. Corrosion is at the origin of the accident. 240 m of pipes were destroyed.
ARIA
Annex 5D
Discussion on Potential Initiating Events and Hazardous Scenario Development

ENVIRONMENTAL RESOURCES MANAGEMENT CLP POWER HONG KONG LIMITED ANNEX 5D_HAZARDOUS SCENARIOS.DOC JUNE 2018
5D-1
5D DISCUSSION ON POTENTIAL INITIATING EVENTS AND HAZARDOUS SCENARIO DEVELOPMENT
This Annex summarises the discussion on potential initiating events and hazardous scenarios development as follows:
Section 5D.1 – Potential Initiating Events;
Section 5D.2 – Natural Hazards;
Section 5D.3 – Aircraft Crash;
Section 5D.4 – Helicopter Crash; and
Section 5D.5 – Hazardous Scenario Development.
5D.1 POTENTIAL INITIATING EVENTS
Based on the review of industry incidents and the HAZID workshop, the potential initiating events for the Project components are presented below.
5D.1.1 QRA Study for Marine Transit of the LNGC and the FSRU Vessel to the LNG Terminal
Ship Collision
Although the marine traffic level is considered low in the vicinity of the LNGC or FSRU Vessel transit route, the LNGC or FSRU Vessel may collide with other passing vessels due to various reasons (e.g. loss of navigation, failure of propulsion equipment, environmental factors etc.). Although the inherent design of the LNGC/FSRU Vessel (including forward collision bulkhead and double hull) could absorb part of the collision energy, the remaining collision energy may still be sufficient to penetrate and cause a hole in the outer hull. This will lead to potential breach of LNG cargo containment and subsequent safety/environmental impact.
Marine traffic simulation ( 1 ) was conducted to determine the ship collision frequency and associated LNG release frequency for further assessment in the QRA Study.
Grounding
Grounding of the LNGC or FSRU Vessel may occur along the transit route due to various reasons (e.g. loss of navigation, failure of propulsion equipment, environmental factors etc.). The grounding frequency along the transit route has been estimated (1) for further assessment in the QRA Study.
(1) BMT Asia Pacific Limited, Hong Kong Offshore LNG Terminal Marine Impact Assessment, R.9331.08, Issue 1.

ENVIRONMENTAL RESOURCES MANAGEMENT CLP POWER HONG KONG LIMITED ANNEX 5D_HAZARDOUS SCENARIOS.DOC JUNE 2018
5D-2
Sinking or Foundering
Extreme weather conditions, such as high wave, may lead to difficulty in controlling the LNGC or FSRU Vessel. The chance of vessel collision and grounding events may increase leading to damage to structural hull, potential breach of LNG cargo containment and subsequent safety/environmental impact. Nevertheless, typical LNGC and FSRU Vessel are designed according to significant wave height and period criteria. For overall strength, a ship’s hull must be capable of withstanding design values of still water and wave induced loads within specified stress criteria. The capability of modern weather prediction would also enable avoidance of LNGC and FSRU Vessel transition in severe conditions above the design criteria. Given the 40 years of operation of LNGC and FSRU Vessel, a sinking event has never occurred.
In addition, cargo mismanagement or operational failure of the ballast system may also lead to potential sinking event. However, the LNGC and FSRU Vessel are provided with computerized cargo management system and ballast water transfer is not anticipated during approach and berthing at the LNG Terminal. The vessels are also designed in accordance with the vessel class codes which allow for excessive trim and list without capsizing or sinking. Hence the associated risk of grounding was not considered as a significant contributor to the overall risk and not further assessed in the QRA Study.
LNG Storage Containment Failure
The LNG storage containment in the LNGC and FSRU Vessel may deteriorate due to material degradation and construction defects etc., leading to potential piping or flange leak and subsequent loss of LNG storage containment. However, the cargo tanks are designed with double containment barrier, where the secondary containment is able to contain the whole volume of the primary containment should it fail.
As per OGP database( 1 ), the catastrophic rupture frequency of double
containment tank is 2.5 × 10⁻⁸ per tank per year. Since five (5) LNG cargo
tanks are provided in the LNGC and FSRU Vessel, the total catastrophic rupture
frequency of double containment tanks in the LNGC and FSRU Vessel is 1.25 × 10⁻⁷ per year. It is expected that the LNGC or FSRU Vessel will transit within Hong Kong waters for a maximum duration of 3 hours. Therefore the presence factor of the LNGC or FSRU Vessel in Hong Kong waters was estimated as:
75 trips per year × 3 hours / 8,760 hours per year = 2.6×10⁻²
The total failure frequency of a double containment cargo tanks in Hong Kong
waters during transit was estimated to be 3.25 × 10⁻⁹ per year, which was
subsequently modelled and assessed in the QRA Study.
(1) OGP Risk Assessment Data Directory, Report No. 434-3, March 2010

ENVIRONMENTAL RESOURCES MANAGEMENT CLP POWER HONG KONG LIMITED ANNEX 5D_HAZARDOUS SCENARIOS.DOC JUNE 2018
5D-3
Sloshing
Under high wind or sea conditions, excessive motion while operating partially-filled LNG cargo tanks may lead to membrane damage and loss of membrane structural integrity. In addition, boil off gas will be vented to atmosphere, where safety impact may occur if the vent gas is ignited. The cargo tanks are generally either full (inbound voyage) or empty (outbound voyage), hence the chance of sloshing during transit is minimized. In case of the unforeseen need to depart the berth before fully unloading of LNG, the LNGC or FSRU Vessel can conduct an internal cargo transfer between tanks such that sloshing would not be a potential hazard. Annulus between membrane and ship structure is also monitored for hydrocarbon presence, with vent to safe location. Flame arrestors are also provided at vent location to minimize the chance of vent gas ignition. Therefore, considering adequate safety systems are in place to minimize the chance of sloshing, this scenario was not considered as a significant contributor to the overall risk and not further assessed in the QRA Study.
5D.1.2 QRA Study for the LNG Terminal
Ship Collision
Passing vessels and service vessels may collide with the LNGC and FSRU Vessel at the Jetty, leading to loss of containment of LNG and natural gas. Similarly, as described in Section 5D.1.1, the ship collision frequency and associated LNG release frequency at the LNG Terminal were calculated for further assessment in the QRA Study.
Grounding
Similar to the description in Section 5D.1.1, the grounding frequency was calculated for further assessment in the QRA Study.
Mooring Line Failure
The mooring lines at the Jetty may fail due to various reasons such as extreme loads, fatigue, corrosion and wear, and improper selection of mooring lines etc. Upon failure of the mooring lines, drifting of LNGC or FSRU Vessel may occur leading to potential failure of unloading arms and collision impact with the Jetty or another vessel, with ultimately potential release of LNG or natural gas. Mechanical integrity program (including testing and maintenance) for the mooring lines, as well as tension monitoring system for the mooring lines are provided at the Jetty. The mooring line failure has been taken into account in the unloading arm failure frequency, as suggested in the UK HSE (1), which was incorporated and assessed in the QRA Study.
(1) UK HSE, Failure Rate and Event Data for use within Risk Assessment, 28 June 2012.

ENVIRONMENTAL RESOURCES MANAGEMENT CLP POWER HONG KONG LIMITED ANNEX 5D_HAZARDOUS SCENARIOS.DOC JUNE 2018
5D-4
Dropped Objects from Supply Crane Operation
Supply cranes are provided at the Jetty and FSRU Vessel for lifting operations. Swinging or dropped objects from crane operation may lead to potential damage on the LNG or natural gas pipework and subsequent loss of containment. Generally, lifting activity is not expected at the Jetty and FSRU Vessel during normal operation. However, during certain circumstances where lifting is required; safety management system will be in place to minimize the dropped object hazard.
Even with supply crane operation, the lifting equipment operation procedure will be in place to ensure that any lifting operation near or over live equipment should be strictly minimised. If such lifting operation cannot be avoided, lifting activities will be assessed. Also, adequate protection covers will be provided on the existing facilities in case the operation of lifting equipment has a potential to impact live equipment at the Jetty and FSRU. Process isolation will also be achieved in case that live equipment protection becomes impractical.
A Job Safety Analysis will be conducted for the supply crane operation, to identify and anlayse hazards associated with the lifting operation. Also, risk from lifting operation will be minimised through the work permit system, strict supervision and adequate protection covers on live equipment. The potential for a dropped object to cause damage on the live equipment and cause a release event is therefore considered included in the generic leak frequency in Table 5F.9.
General Equipment/ Piping Failure
Loss of integrity of the equipment and piping may occur because of material defects, construction defects, external corrosion etc., and leading to loss of containment of LNG and natural gas. Material defect may occur due to wrong materials being used during construction. Construction defect may result from poor welding. The generic failure frequency of the equipment and piping for the QRA Study was obtained from the International Association of Oil and Gas Producers (OGP) (1), which was subsequently incorporated and assessed in the QRA Study.
LNG Storage Containment Failure
As illustrated in Section 5D.1.1, the total catastrophic rupture frequency of
double containment tanks in the FSRU Vessel is 1.25 × 10⁻⁷ per year.
With regard to the LNGC at the LNG Terminal, considering that the maximum stay-over time of LNGC at the LNG Terminal is 48 hours and the maximum annual transit frequency is 75 times, the total catastrophic rupture frequency of
double containment tanks in the LNGC at the LNG Terminal is 5.14 × 10⁻⁸ per
(1) OGP, Risk Assessment Data Directly, Report No. 434-.1, March 2010.

ENVIRONMENTAL RESOURCES MANAGEMENT CLP POWER HONG KONG LIMITED ANNEX 5D_HAZARDOUS SCENARIOS.DOC JUNE 2018
5D-5
year, which was already included in identified hazardous section HKLONG_02 “LNG Storage Tanks” for the LNG Terminal and assessed in the QRA Study.
5D.1.3 QRA Study for the Subsea Pipelines
Anchor Drop
The decision for a mariner when to drop an anchor depends on the particular circumstances and the proximity of the pipeline route to the flow of marine traffic, port/harbour areas and designated anchorage locations. In fairways, traffic will normally be underway where the necessity to drop anchor is expected to be low. The pipeline route will be identified on nautical charts as per normal practice. The mariner is then provided with the necessary information to avoid anchor drop where the pipeline could be damaged. Emergency situations may arise such as machinery failure, adverse weather condition, or collision; thereby limiting the choice where to drop anchor. Anchor drop along the subsea pipeline route was taken into consideration in the QRA Study when assigning failure frequencies for anchor damage.
Anchor Drag
Anchor drag occurs due to poor holding ground or adverse environmental conditions affecting the holding power of the anchor. The drag distance depends on properties of the seabed soil, the mass of ship and anchor and the speed of the vessel. If there is a subsea pipeline along the anchor drag path, anchor dragging onto the pipeline may result in localised buckling or denting of the pipeline, or over-stressing from bending if the tension on the anchor is sufficient to laterally displace the pipeline. A dragged anchor may also hook onto a pipeline during retrieval causing damage as a result of lifting the pipeline. Anchor dragging was taken into consideration in the QRA Study when assigning failure frequencies for anchor damage.
Vessel Sinking
Vessel sinking in the vicinity of the pipeline may cause damage to the pipeline resulting in loss of containment. Vessel sinking depends on the intensity of marine activity in the given area. For the years of 1996 to 2016, there were 551 incidents of vessel sinking in Hong Kong waters (1) which gives an average of about 26 cases per year. Most of the recorded incidents occurred in Victoria Harbour and the Ma Wan Channel and involved mainly smaller vessels of less than 1,000 dwt, which will have less impact on a pipeline buried 3 m below the seabed. The probability that a vessel sinking incident will impact the proposed pipeline was therefore considered to be low, in comparison to anchor impact damage. Additionally, pipeline damage due to vessel sinking was included in the historical pipeline failure data (2) used in the QRA Study.
(1) Marine Department, Hong Kong Government, Statistics on Marine Accidents, 1990-2016, www.mardep.gov.hk
(2) Mott MacDonald Ltd., The Update of Loss of Containment Data for Offshore Pipelines (PARLOC 2001), Revision F, June 2003.

ENVIRONMENTAL RESOURCES MANAGEMENT CLP POWER HONG KONG LIMITED ANNEX 5D_HAZARDOUS SCENARIOS.DOC JUNE 2018
5D-6
Fishing Activity
Fishing activity is identified along the proposed subsea pipeline routes to the BPPS and LPS. Many of the techniques involves deployment of a variety of equipment close to the seabed. Pipelines damage from fishing gear can occur due to impact, snagging of nets on the pipeline or a “pull over” sequence. Impact loads mainly cause damage to the coating whilst pull over situations can cause much higher loads, which could lead to damage of steel pipeline itself.
Considering the size and weight of marine vessels for fishing activity and since the pipeline will be lowered to at least one (1) meters below seabed and protected by rock armour for the entire route, pipeline damage due to fishing activity is not possible and not considered further in the QRA Study.
Dredging Activity
Dredging vessels could cause damage due to dredging operations involving cutting heads. They could also cause damage to the subsea pipeline by anchor drop. Nevertheless, it is assumed that dredging operations will be closely monitored and controlled and therefore there is no potential for pipeline damage due to dredging.
Subsea Cable Maintenance Activity
Subsea cables are located in the vicinity of the subsea pipelines to the BPPS and LPS. During maintenance activities of the subsea cable, there could be potential of damaging the subsea pipeline. Nevertheless, it is assumed that maintenance activity will be closely monitored and controlled and therefore there is no potential for pipeline damage due to cable maintenance activity.
General Pipeline Failure
Corrosion is one of the main contributors to pipeline failures. Corrosion is attributed mainly to the environment in which they are installed (external) and the substances they carry (internal). Mechanical failure of the pipeline could occur for various reasons, including material defect, weld failure, etc. Stringent procedures for pipeline material procurement, welding and hydrotesting should largely mitigate against these hazards.
The frequency of subsea pipeline failure due to external corrosion and mechanical failure was estimated based on PARLOC 2012 (1) and PARLOC 2001 (2) database for further assessment in the QRA Study.
(1) Energy Institute, London and Oil & Gas UK, Pipeline and Riser Loss of Containment 2010 – 2012 (PARLOC 2012), 6th
Edition of PARLOC Report Series, March 2015.
(2) Mott MacDonald Ltd., The Update of Loss of Containment Data for Offshore Pipelines (PARLOC 2001), Revision F, June 2003.
ENVIRONMENTAL RESOURCES MANAGEMENT CLP POWER HONG KONG LIMITED ANNEX 5D_HAZARDOUS SCENARIOS.DOC JUNE 2018
5D-7
5D.1.4 QRA Study for the GRSs at the BPPS and LPS
General Equipment/Piping Failure
Loss of integrity of the equipment and piping may occur because of material defects, construction defects, external corrosion etc., and leading to loss of containment of natural gas. Material defect may occur due to wrong construction materials being used. Construction defect may result due to poor welding. The generic failure frequency of the equipment and piping for the QRA Study was obtained from Hawsley ( 1 ), which was subsequently incorporated and assessed in the QRA Study.
5D.2 NATURAL HAZARDS
5D.2.1 Earthquake
Studies by the Geotechnical Engineering Office ( 2 ) and Civil Engineering Development Department (3) conducted in the last decades indicate that Hong Kong is a region of low seismicity. The seismicity in the vicinity of Hong Kong is considered similar to that of the areas of Central Europe and the Eastern areas of the U.S. (4). As Hong Kong is a region of low seismicity, an earthquake is an unlikely event.
An earthquake has the potential to cause damage to the LNG Terminal, subsea pipelines, and proposed GRSs at the BPPS and LPS, due to ground movement and vibration.
It is noted that the generic failure frequencies (5) (6) adopted in the QRA Study are based on historical incidents that included earthquakes in the causes of failure. With consideration that Hong Kong is not at disproportionate risk from earthquakes compared to other similar facilities worldwide, it is deemed appropriate to use these generic frequencies (1) (2) without adjustment. Hence, separate assessment of earthquakes in the QRA Study was not considered.
5D.2.2 Subsidence
The GRSs at the BPPS and LPS may be impacted from subsidence. For subsidence which would result in failure of process pipework, the ground movement must be relatively sudden and severe. Normal subsidence events occur gradually over a period of months and thus appropriate mitigation action
(1) Hawksley, J.L., Some Social, Technical and Economic Aspects of the Risks of Large Plants, CHEMRAWN III, 1984.
(2) GEO Publication No. 1/2012, Review of Earthquake Data for the Hong Kong Region, Geotechnical Engineering Office, Civil Engineering and Development Department, The Government of the Hong Kong Special Administrative
Region, September 2012.
(3) GCO, Review of Earthquake Data for the Hong Kong Region, GCO Publication No. 1/91, Civil Engineering Services Department, Hong Kong Government, 1991.
(4) Scott, D.N., Pappin, J.W., Kwok, M.K.Y., Seismic Design of Buildings in Hong Kong, Hong Kong Institution of Engineers, Transactions, Vol. 1, No. 2, p.37-50, 1994.
(5) OGP, Risk Assessment Data Directly, Report No. 434-.1, March 2010.
(6) Hawksley, J.L., Some Social, Technical and Economic Aspects of the Risks of Large Plants, CHEMRAWN III, 1984.
ENVIRONMENTAL RESOURCES MANAGEMENT CLP POWER HONG KONG LIMITED ANNEX 5D_HAZARDOUS SCENARIOS.DOC JUNE 2018
5D-8
can be taken to prevent failures. In the worst cases, the GRSs could be shut down with relevant equipment isolated and depressurised. The GRS facilities are built on coastal land with solid foundation. No undue risk from subsidence is foreseen; therefore it is deemed that the failure due to subsidence has been included in generic failure frequencies (1) (2) adopted in the QRA Study.
5D.2.3 Tidal Waves, Storm Surges and Flooding
The impact of tidal waves and storm surge on LNGC and FSRU Vessel during marine transit is not envisaged due to sufficient water depth along the transit route. At the LNG Terminal, tidal waves and storm surge may create excessive movement, impacting the mooring lines and unloading arm operation. The failure frequency of mooring lines and unloading arm has been estimated based on UK HSE (1), which was incorporated and assessed in the QRA Study.
For the subsea pipelines to the BPPS and LPS, the tidal waves may have more impact on the pipelines located in shallower water area (near the shore) where the subsea pipeline attracts a higher level of environmental loads. Nevertheless, the subsea pipelines will be designed to withstand these environmental loads and the subsea pipelines in the seabed will not be exposed directly to 100 year return wave loads. Hence it is considered that there is no disproportionate risk of tidal waves/storm surge to the subsea pipelines. These causes of failure are in any case included in the generic failure frequency (1) (2) derived from the historical database.
For GRSs at the BPPS and LPS, flooding from heavy rainfall is considered not possible due to the coastal location of the GRS facilities. The slopes of the natural terrain will channel water to the sea. In general, storm surges are limited to several metres. The GRS facilities, which are located at +6 mPD above sea level, are therefore protected against any risk from storm surges, waves and other causes of flooding. As a result, storm surges and flooding were not further assessed in the QRA Study.
5D.2.4 Tsunami
Similar to storm surges, the main hazard from tsunamis is the rise in sea level and possible floatation of process equipment and pipework. The highest rise in sea level ever recorded in Hong Kong due to a tsunami was 0.3 m (2), and occurred as a result of the 1960 earthquake in Chile, the largest earthquake ever recorded in history at magnitude 9.5 on the Richter scale. The GRS facilities are approximately at +6 mPD and hence the effect of tsunami on GRS facilities is considered negligible.
The reason for the low impact of tsunamis on Hong Kong may be explained by the extended continental shelf in the South China Sea which effectively
(1) K HSE, Failure Rate and Event Data for use within Risk Assessment, 28 June 2012.
(2) Hong Kong Observatory.

ENVIRONMENTAL RESOURCES MANAGEMENT CLP POWER HONG KONG LIMITED ANNEX 5D_HAZARDOUS SCENARIOS.DOC JUNE 2018
5D-9
dissipates the energy of a tsunami. Moreover, presence of the Philippine Islands and Taiwan acts as an effective barrier against seismic activity in the Pacific (1). Secondary waves that pass through the Luzon Strait diffract and lose energy as they traverse the South China Sea.
Seismic activity with the South China Sea area may also produce tsunamis. Earthquakes on the western coast of Luzon in the Philippines have produced localised tsunamis but there is no record of any observable effects in Hong Kong. Also, with the shelter effects offered by Lamma Island, Lantau Island and Hong Kong islands, tsunami comes from South East of Hong Kong cannot affect the BPPS and LPS. As a result, tsunami was not taken into account in the QRA Study.
5D.2.5 Lightning
Lightning strikes have led to a number of major accidents worldwide. For example, a contributory cause towards the major fire at the Texaco refinery in the UK in 1994 was thought to be an initial lightning strike on process pipework. The Project components will be protected with lightning conductors connected the Earth. The grounding will be inspected regularly. The potential for a lightning strike to hit the Project components leading to a release event is therefore deemed to be unlikely. Failures due to lightning strikes have been included in the generic failure frequencies (2) (3) adopted in the QRA Study.
5D.2.6 Hill Fire
Hill fires are relatively common in Hong Kong, and could potentially occur near the GRS facilities at the BPPS and LPS. Recent statistics for hill fires in Hong Kong country parks have been reviewed. Although the GRSs at the BPPS and LPS are not located in a country park, some of the surrounding terrain and vegetation are similar to those typically found in country parks. According to Agriculture, Fisheries and Conservation Department (AFCD) statistics (4), the average number of hill fires is 27.6 per year during the ten years 2007-2016 (range: 16 to 49). The area affected by fire each year is available from AFCD annual reports for 2008-2015, see Table 5D.1. These are compared to the total area of country parks in Hong Kong of 44,004 – 44,239 ha.
Averaging the data for the 8-year period suggests that about 1% of vegetation areas are affected by fire each year, or equivalently, the frequency of a hill fire affected a specific site is 0.01 per year.
(1) Lee, B. Y., Report of Hong Kong in the International Tsunami Seminar in the Western Pacific Region, International Tsunami
Seminar in the Western Pacific Region, Tokyo, Japan, 7-12 March 1988.
(2) OGP, Risk Assessment Data Directly, Report No. 434-.1, March 2010.
(3) Hawksley, J.L., Some Social, Technical and Economic Aspects of the Risks of Large Plants, CHEMRAWN III, 1984.
(4) Agriculture, Fisheries and Conservation Department, Hong Kong Government, Useful Statistics, 2007-2016, www.afcd.gov.hk

ENVIRONMENTAL RESOURCES MANAGEMENT CLP POWER HONG KONG LIMITED ANNEX 5D_HAZARDOUS SCENARIOS.DOC JUNE 2018
5D-10
Table 5D.1 Hill Fire Data for Hong Kong (1)
Year Area Affected (ha) Country Park Area (ha) % of Total Country Park Affected 2015 147 44,300 0.06 2014 97 44,300 0.06 2013 546 44,300 0.06 2012 79 44,239 0.18 2011 27 44,239 0.06 2010 897 44,239 2.03 2009 275 44,004 0.62 2008 501 44,004 1.14
The GRS at the BPPS is protected from external fires (e.g. hill fire) by a firebreak line in BPPS Landscape Plan and regular inspection to ensure the firebreak line is properly maintained, while the GRS at the LPS is also protected from external fires by locating far away from any hill area.
Also, the vicinity of GRS area is patrolled by station security, who will report to Fire Services Department and central control room immediately in case of hill fires.
Moreover, there are no incident record of any hill fire in the vicinity of the BPPS and the LPS, as well as the safety management measures, hill fire leading to impact at GRS facilities was considered unlikely and thus not taken into account in the QRA Study.
5D.3 AIRCRAFT CRASH
The BPPS and LPS site do not lie within the flight path of Chek Lap Kok, being more than 10 km from the nearest runway. The frequency of aircraft crash was estimated using the methodology of the HSE (2), as per the EIA Report (3) that was previously approved by the EPD. The model takes into account specific factors such as the target area of the proposed hazard site and its longitudinal (x) and perpendicular (y) distances from the runway threshold. The crash frequency per unit ground area (per km2) is calculated as:
yxNRFyxg ,,
(Equation 1)
where: N is the number of runway movements per year R is the probability of an accident per movement (landing or take-off)
F(x,y) gives the spatial distribution of crashes and is given by:
(1) ERM, EIA for Liquefied Natural Gas (LNG) Receiving Terminal and Associated Facilities (Register No.: AEIAR-106/2007),
December 2006.
(2) Byrne, J. P., The Calculation of Aircraft Crash Risk in the UK, HSE\R150, 1997.
(3) ERM, EIA for Liquefied Natural Gas (LNG) Receiving Terminal and Associated Facilities (Register No.: AEIAR-106/2007), December 2006.
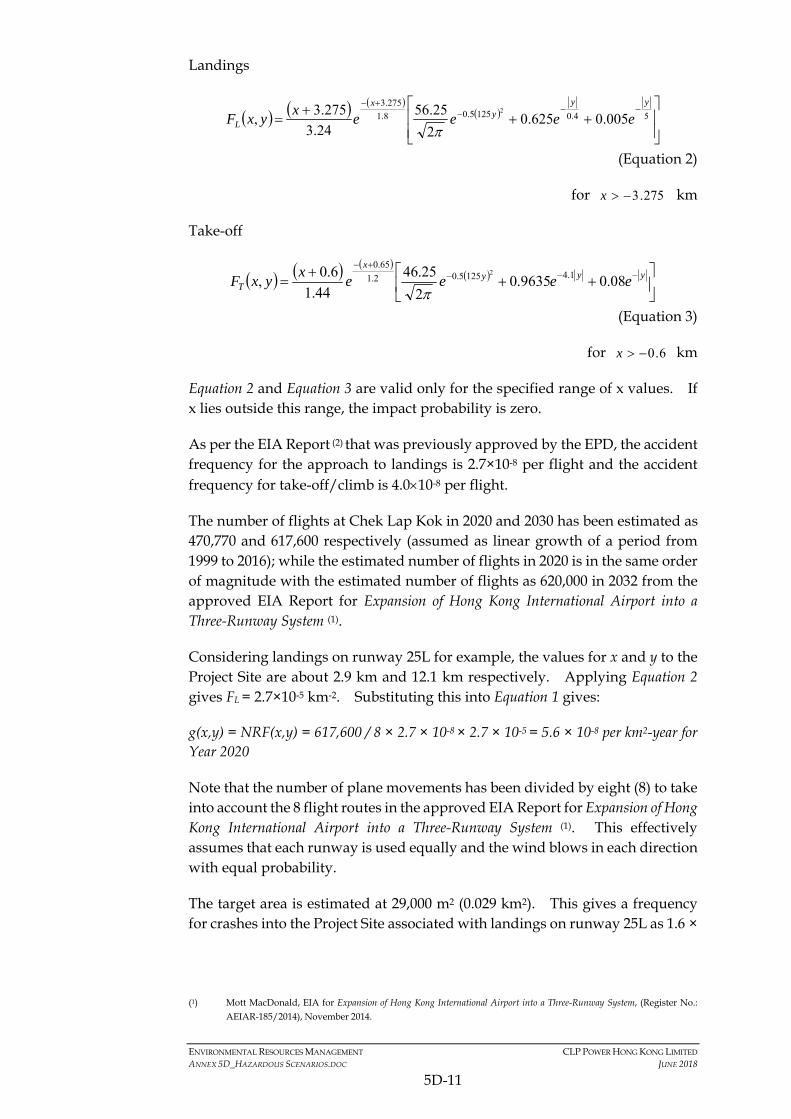
ENVIRONMENTAL RESOURCES MANAGEMENT CLP POWER HONG KONG LIMITED ANNEX 5D_HAZARDOUS SCENARIOS.DOC JUNE 2018
5D-11
Landings
54.01255.08.1
275.3
005.0625.02
25.56
24.3
275.3,
2yy
yx
L eeeex
yxF
(Equation 2)
for 275.3x km
Take-off
yyy
x
T eeeex
yxF 08.09635.02
25.46
44.1
6.0, 1.41255.02.1
65.02
(Equation 3)
for 6.0x km
Equation 2 and Equation 3 are valid only for the specified range of x values. If x lies outside this range, the impact probability is zero.
As per the EIA Report (2) that was previously approved by the EPD, the accident frequency for the approach to landings is 2.7×10⁻⁸ per flight and the accident frequency for take-off/climb is 4.010-8 per flight.
The number of flights at Chek Lap Kok in 2020 and 2030 has been estimated as 470,770 and 617,600 respectively (assumed as linear growth of a period from 1999 to 2016); while the estimated number of flights in 2020 is in the same order of magnitude with the estimated number of flights as 620,000 in 2032 from the approved EIA Report for Expansion of Hong Kong International Airport into a Three-Runway System (1).
Considering landings on runway 25L for example, the values for x and y to the Project Site are about 2.9 km and 12.1 km respectively. Applying Equation 2 gives FL = 2.7×10⁻⁵ km-2. Substituting this into Equation 1 gives:
g(x,y) = NRF(x,y) = 617,600 / 8 × 2.7 × 10-8 × 2.7 × 10-5 = 5.6 × 10⁻⁸ per km2-year for Year 2020
Note that the number of plane movements has been divided by eight (8) to take into account the 8 flight routes in the approved EIA Report for Expansion of Hong Kong International Airport into a Three-Runway System (1). This effectively assumes that each runway is used equally and the wind blows in each direction with equal probability.
The target area is estimated at 29,000 m2 (0.029 km2). This gives a frequency for crashes into the Project Site associated with landings on runway 25L as 1.6 ×
(1) Mott MacDonald, EIA for Expansion of Hong Kong International Airport into a Three-Runway System, (Register No.:
AEIAR-185/2014), November 2014.

ENVIRONMENTAL RESOURCES MANAGEMENT CLP POWER HONG KONG LIMITED ANNEX 5D_HAZARDOUS SCENARIOS.DOC JUNE 2018
5D-12
10-9 per year. Repeating the calculation for landings and take-offs from all runways gives the results shown in Table 5D.2 to Table 5D.4.
Table 5D.2 Aircraft Crash Frequency for proposed GRS at the BPPS
Runway Year 2020 Year 2030 Landing (per year) Take-off (per year) Landing (per year) Take-off (per year)
07R - 1.28×10⁻¹⁰ - 1.69×10⁻¹⁰ 07C - 7.54×10⁻¹⁰ - 9.90×10⁻¹⁰ 07L - No take off at 07L* - No take off at 07L* 25L 4.27×10⁻⁸ - 5.61×10⁻⁸ - 25C No landing at 25C* - No landing at 25C* - 25R 8.18×10⁻⁸ - 1.07×10⁻⁷ - Total 1.25×10⁻⁷ 8.83×10⁻¹⁰ 1.63×10⁻⁷ 1.16×10⁻⁹
*: The preferred operation mode is referred to the approved EIA Report (1).
Table 5D.3 Aircraft Crash Frequency for proposed GRS at the LPS
Runway Year 2020 Year 2030 Landing (per year) Take-off (per year) Landing (per year) Take-off (per year)
07R - 1.46×10⁻¹⁵ - 1.91×10⁻¹⁵ 07C - 2.48×10⁻¹⁶ - 3.26×10⁻¹⁶ 07L - No take off at 07L* - No take off at 07L* 25L 1.06×10⁻¹⁰ - 1.40×10⁻¹⁰ - 25C No landing at 25C* - No landing at 25C* - 25R 5.55×10⁻¹¹ - 7.29×10⁻¹¹ - Total 1.62×10⁻¹⁰ 1.71×10⁻¹⁵ 2.12×10⁻¹⁰ 2.24×10⁻¹⁵
*: The preferred operation mode is referred to the approved EIA Report (1).
Table 5D.4 Aircraft Crash Frequency for the LNG Terminal
Runway Year 2020 Year 2030 Landing (per year) Take-off (per year) Landing (per year) Take-off (per year)
07R - 1.11×10⁻¹² - 1.46×10⁻¹² 07C - 2.53×10⁻¹³ - 3.31×10⁻¹³ 07L - No take off at 07L* - No take off at 07L* 25L 2.93×10⁻⁸ - 3.84×10⁻⁸ - 25C No landing at 25C* - No landing at 25C* - 25R 1.63×10⁻⁸ - 2.14×10⁻⁸ - Total 4.56×10⁻⁸ 1.36×10⁻¹² 5.99×10⁻⁸ 1.79×10⁻¹²
*: The preferred operation mode is referred to the approved EIA Report (1).
5D.4 HELICOPTER CRASH
Helicopter accidents during take-off and landings are confined to small area around the helipad. 93% of accidents occur within 100 m of the helipad and remaining 7% occur between 100 m and 200 m of the helipad (2). Since there is
(1) Mott MacDonald, EIA for Expansion of Hong Kong International Airport into a Three-Runway System, (Register No.:
AEIAR-185/2014), November 2014.
(2) Byrne, J. P., The Calculation of Aircraft Crash Risk in the UK, HSE\R150, 1997.
ENVIRONMENTAL RESOURCES MANAGEMENT CLP POWER HONG KONG LIMITED ANNEX 5D_HAZARDOUS SCENARIOS.DOC JUNE 2018
5D-13
no helipad within 200 m of the Project components, the helicopter crash was therefore not considered in the QRA Study.
Regarding passing helicopters, there are no helicopter flight paths in the vicinity of the Project components, except the proposed LNG Terminal in vicinity of “Hong Kong – Macau Helicopter Routes” (depicted at Figure 5D.1), as per Hong Kong Aeronautical Information Services (1).
Only one (1) helicopter flight path, “Route B”, is identified to have potential crash impact on the proposed LNG Terminal based on proximity consideration from HSE (1).
Based on HSE (1), the helicopter crash rate per area was proposed to estimate based on following equations:
CA = NA × RA × afac / alt
where: CA: Helicopter Crash Rate (per yr km2) NA: Annual Number of Helicopter Flight RA: Reliability (1 × 10⁻⁷ per flight km as per HSE (1)) afac: Refer to Table 9 “Area Factors Used in Airway Calculations” of HSE (1), 0.03 alt: Mean Altitude of the Airway (259 m)
According to online available information (2), the mean altitude for “Route B” airway is 259 m and the minimum separation distance between “Route B” flight path and the proposed LNG Terminal is 635 m. As such, the estimated number of helicopter crash rate per area is 1,016 × 10-7 × 0.03 / 259 = 1.18E-08 per km2-year. Considering the proposed LNG Terminal area as 0.04 km2, the impact frequency due to passing helicopter failures is 4.71E-10 per year.
The failure rate due to passing helicopter crashes are still insignificant compared with generic failure frequencies (in an order of magnitude at 1E-06 to 1E-05), as such, it was not considered separately but are deemed to be included in the generic failure frequencies.
5D.5 HAZARDOUS SCENARIO DEVELOPMENT
Based on the above analysis, the hazardous scenarios for the Project components were identified for further assessment in the QRA Study. The Project components were divided into a number of hazardous sections for detailed analysis in the QRA Study based on the location of emergency shutdown valves and process conditions (e.g. operating temperature and pressure).
(1) https://www.ais.gov.hk/HK_AIP/AIP/ENR/HK_ENR3.4.pdf.

ENVIRONMENTAL RESOURCES MANAGEMENT CLP POWER HONG KONG LIMITED ANNEX 5D_HAZARDOUS SCENARIOS.DOC JUNE 2018
5D-14
5D.5.1 Marine Transit of the LNGC and the FSRU Vessel to the LNG Terminal
Two (2) scenarios (collision release and grounding release) were modelled and the release parameters for these scenarios are listed in the following table:
Table 5D.5 Inventory Release Details for Marine Transit of the LNGC and FSRU Vessel to the LNG Terminal
Parameter Collision Release Grounding Release Large LNGC and FSRU Vessel (270,000 m3) LNG Inventory (kg) 2.2×10⁷ 2.2×10⁷
Pressure (barg) 0.7 0.7
Temperature (°C) -156 -156
Density (kg/m3) 414.2 414.2 Small LNGC (170,000 m3) LNG Inventory (kg) 1.2×10⁷ 1.2×10⁷
Pressure (barg) 0.7 0.7
Temperature (°C) -156 -156
Density (kg/m3) 414.2 414.2
5D.5.2 FSRU Vessel, the Jetty, and the LNGC Unloading at the LNG Terminal
A total of twenty-five (25) hazardous sections were identified for the FSRU Vessel, the Jetty and LNGC unloading at the LNG Terminal. The details of the identified hazardous sections are presented in Table 5D.6.

ENVIRONMENTAL RESOURCES MANAGEMENT CLP POWER HONG KONG LIMITED ANNEX 5D_HAZARDOUS SCENARIOS.DOC JUNE 2018
5D-15
Table 5D.6 Hazardous Section Details for the FSRU Vessel, the Jetty and the LNGC Unloading Operation at the LNG Terminal
Hazardous Section Code
Description Fluid Phase Temperature (degC)
Pressure (barg)
Density (kg/m3)
Length of Pipe (m)
Pipe Diameter (inch)
Flow Rate (kg/hr)
Isolation Success Case (120 seconds): Iso-Section Inventory (1) (kg)
Isolation Failure Case (1,800 seconds): Iso-Section Inventory (1) (kg)
HKOLNGT_01 LNG Loadout from LNGC, via Jetty, to LNG Storage Tank in FSRU Vessel
Liquid -156 5 414 290 24 (3) 5,000,000 77,000 201,000
HKOLNGT_02 LNG Storage Tanks Liquid -156 0.7 414 N/A N/A N/A N/A 22,148,063(6) HKOLNGT_03 LNG Transfer from LNG Storage Tank
Pump to LNG Booster Pump Liquid -156 7 414 300 10 2,000,000 82,000 1,000,000
HKOLNGT_04 LNG Booster Pump to Regasification Unit Liquid -140 90 388 80 10 485,000 18,000 244,000 HKOLNGT_05 Regasification Trains Vapour 3 90 77 400 12 214,000 9,000 109,000 HKOLNGT_06 Natural gas from Regasification Unit, via
metering, to Jetty (including HP Gas Loading Arm)
Vapour 5 88 74 200 12 713,000 25,000 357,000
HKOLNGT_07 Natural gas in Jetty to ESDV of Riser for BPPS Subsea Pipeline
Vapour 5 88 74 170 30 713,000 30,000 362,000
HKOLNGT_08 Riser for BPPS Subsea Pipeline Vapour 5 88 74 0 30 713,000 1,000,000 1,000,000 HKOLNGT_10 Natural gas in Jetty to ESDV of Riser for
LPS Subsea Pipeline Vapour 5 88 74 170 20 713,000 26,000 359,000
HKOLNGT_11 Riser for LPS Subsea Pipeline Vapour 5 88 74 0 20 713,000 299,000 632,000 HKOLNGT_13 LNG Transfer from LNG Storage Tank to
Vaporisation Unit Liquid -156 7 414 270 12 166,000 14,000 91,000
HKOLNGT_14 Natural gas in Vaporisation Unit for Fuel Gas Generation
Vapour 5 6 5 80 6 13,000 500 7,000
HKOLNGT_15 BOG from LNG Storage Tank to BOG Compressor
Vapour -120 0.5 2 270 20 30 177,000 (4) 177,000 (4)
HKOLNGT_16 Compressed BOG for fuel gas use in power generation
Vapour 10 6 5 80 12 70 30 60
HKOLNGT_17 Compressor BOG to Reliquefyer Vapour -60 6 7 80 12 100 40 90 HKOLNGT_18 LNG from Reliquefyer to LNG Storage
Tank Liquid -156 6 174 270 12 43,000 5,000 25,000
HKOLNGT_19 BOG in Gas Combustion Unit Vapour -120 0.5 2 30 20 30 10 30

ENVIRONMENTAL RESOURCES MANAGEMENT CLP POWER HONG KONG LIMITED ANNEX 5D_HAZARDOUS SCENARIOS.DOC JUNE 2018
5D-16
Hazardous Section Code
Description Fluid Phase Temperature (degC)
Pressure (barg)
Density (kg/m3)
Length of Pipe (m)
Pipe Diameter (inch)
Flow Rate (kg/hr)
Isolation Success Case (120 seconds): Iso-Section Inventory (1) (kg)
Isolation Failure Case (1,800 seconds): Iso-Section Inventory (1) (kg)
HKOLNGT_20 LNGC Vapour (BOG) return line during loadout operation
Vapour -120 2 2 60 16 30 20 30
HKOLNGT_21 FSRU Vapour (BOG) return line during loadout operation
Vapour -120 2 2 60 16 30 20 30
HKOLNGT_22 Fuel gas line from Regasification Unit Vapour 5 6 5 80 6 13,000 500 7,000 HKOLNGT_23 Diesel (Heavy Fuel Oil) Storage System Liquid 25 1 745(7) 0 - N/A (5) 3,000,000 3,000,000 HKOLNGT_24 Marine Diesel Oil Storage System Liquid 25 1 745(7) 0 - N/A (5) 596,000 596,000 HKOLNGT_25 Lubricating Oil Storage System Liquid 25 1 745(7) 0 - N/A (5) 75,000 75,000
Note:
(1): For Hazardous Section HKOLNGT_01, a shorter release time (i.e. 30 seconds) for isolation success case was adopted due to the presence of operators in the vicinity who can initiate emergency shutdown of the unloading arm (in addition to the fire and gas detection system), and also due to the provision of detectors for excessive movement of the unloading arm which will initiate an automatic shutdown. (2): For Hazardous Section HKOLNGT_01, a shorter release time (i.e. 2 minutes) for isolation failure case of one unloading arm was adopted. Duration longer than 2 minutes is not considered significant given that the transfer pumps on the LNG Carrier can be tripped, which will stop any further release.
(3): 24" (i.e. LNG unloading arm for FSRU connection) was selected as the representative pipe diameter for the Hazardous Section HKOLNGT_01. (4): Partial vaporization of LNG in one LNG Cargo Tank, upon leakage of Hazardous Section HKOLNGT_15, was also considered in the inventory estimation.
(5): Release from the storage tanks of Diesel/Marine Diesel Oil/Lubricating Oil was modelled in the QRA Study. (6): Only isolation failure case was consideration for Hazardous Section HKOLNGT_02 “LNG Storage Tanks” in the QRA Study, and the estimated mass for one LNG storage tank at FSRU Vessel is 22,148,063 kg. (7): Diesel, marine diesel (typically containing between C8 and C21) and lubricating oil (generally with high viscosity petroleum, typically C12+) are conservatively assumed as Dodecance (C12) which has the density of about 745 kg/m3 for consequence modelling modelled in the QRA Study.

ENVIRONMENTAL RESOURCES MANAGEMENT CLP POWER HONG KONG LIMITED ANNEX 5D_HAZARDOUS SCENARIOS.DOC JUNE 2018
5D-17
5D.5.3 Subsea Pipelines to the BPPS and LPS
The subsea pipelines were modelled and the release parameters for these subsea pipelines are listed in Table 5D.7.
Table 5D.7 Hazardous Section Details for the Subsea Pipelines to the BPPS and LPS
Parameter 30” BPPS Pipeline 20” LPS Pipeline Pressure (barg) 88 88
Temperature (°C) 16 16
Density (kg/m3) 70 70 Length of Pipeline (km) 45 18 Natural Gas Inventory (kg) 1.43×10⁶ 2.58×10⁵
5D.5.4 GRSs at the BPPS and LPS
Eight (8) hazardous sections were identified for the proposed GRS at the BPPS and nineteen (19) hazardous sections were identified for the existing GRS at the BPPS. The details of the identified hazardous sections are presented in Table 5D.8.
In addition, thirty-five (35) hazardous sections were identified for the proposed GRS at the LPS and ten (10) hazardous sections were identified for the existing GRS at the LPS. The details of the identified hazardous sections are presented in Table 5D.9.

ENVIRONMENTAL RESOURCES MANAGEMENT CLP POWER HONG KONG LIMITED ANNEX 5D_HAZARDOUS SCENARIOS.DOC JUNE 2018
5D-18
Table 5D.8 Hazardous Section Details for the GRS at the BPPS
Hazardous Section Code
Description Fluid Phase
Temperature (degC)
Pressure (barg)
Density (kg/m3)
Length of Pipe (m)
Pipe Diameter (mm)
Flow Rate (kg/hr)
Isolation Success Case (120 seconds): Iso-Section Inventory (kg)
Isolation Failure Case (1800 seconds): Iso-Section Inventory (kg)
BPPS_NGRS_01 Above ground piping from shore end to pig receiver of New GRS
Vapour 20 88 68 40 762 624,000 22,000 313,000
BPPS_NGRS_02 Piping from Pig Receiving Station to Gas Filter of New GRS
Vapour 20 88 68 20 711 624,000 21,000 312,000
BPPS_NGRS_03 Piping from Gas Filter to Metering Station of New GRS
Vapour 20 88 68 65 711 624,000 23,000 314,000
BPPS_NGRS_04 Piping from Metering Station to WBH of New GRS Vapour 20 88 68 104 711 624,000 24,000 315,000 BPPS_NGRS_05 WBH piping of New GRS Vapour 20 88 68 114 508 624,000 22,000 313,000 BPPS_NGRS_06 Piping from WBH to Pressure Reduction Station of
New GRS Vapour 60 88 56 52 508 624,000 21,000 312,000
BPPS_NGRS_07 Piping from Pressure Reduction Station to Mixing Station of New GRS
Vapour 20 38 27 220 711 624,000 23,000 314,000
BPPS_NGRS_08 Pig Receiver of New GRS Vapour 20 88 68 9 813 624,000 21,000 312,000 BPPS_GRS_01 Above ground piping from shore end to pig receiver
of Y13-1 GRS Vapour 21 150 118 160 700 364,000 19,000 189,000
BPPS_GRS_02 Piping from receiver to slug catcher of Y13-1 GRS Vapour 21 150 118 35 700 364,000 14,000 183,000 BPPS_GRS_03 Piping from slug catcher to inlet gas filter separators
of Y13-1 GRS Vapour 21 150 118 40 700 364,000 14,000 184,000
BPPS_GRS_04 Piping from inlet gas filter separator to gas heater of Y13-1 GRS
Vapour 21 150 118 105 700 364,000 17,000 187,000
BPPS_GRS_05 Piping from gas heaters to pressure reduction station, including PRS of Y13-1 GRS
Vapour 21 150 118 95 700 364,000 16,000 186,000
BPPS_GRS_06 Piping from pressure reduction station to outlet gas filter separator of Y13-1 GRS
Vapour 21 150 118 20 700 364,000 13,000 183,000
BPPS_GRS_07 Piping from outlet gas filter separator to manifold, including sales gas meter unit of Y13-1 GRS
Vapour 21 38 25 45 700 364,000 13,000 182,000
BPPS_GRS_08 Pig receiver of Y13-1 GRS Vapour 21 150 118 9 700 364,000 13,000 182,000 BPPS_GRS_11 Above ground piping from shore end to pig receiver
of Dachan GRS Vapour 20 55 41 70 700 364,000 13,000 183,000
BPPS_GRS_12 Piping from receiver to gas filter of Dachan GRS Vapour 20 55 41 95 700 364,000 14,000 183,000

ENVIRONMENTAL RESOURCES MANAGEMENT CLP POWER HONG KONG LIMITED ANNEX 5D_HAZARDOUS SCENARIOS.DOC JUNE 2018
5D-19
Hazardous Section Code
Description Fluid Phase
Temperature (degC)
Pressure (barg)
Density (kg/m3)
Length of Pipe (m)
Pipe Diameter (mm)
Flow Rate (kg/hr)
Isolation Success Case (120 seconds): Iso-Section Inventory (kg)
Isolation Failure Case (1800 seconds): Iso-Section Inventory (kg)
BPPS_GRS_13 Filter & inlet/outlet piping of Dachan GRS Vapour 20 55 41 15 400 364,000 12,000 182,000 BPPS_GRS_14 Piping from filter to metering station of Dachan GRS Vapour 20 55 41 45 700 364,000 13,000 183,000 BPPS_GRS_15 Piping from metering station to heaters, including
metering runs of Dachan GRS Vapour 20 55 41 80 700 364,000 13,000 183,000
BPPS_GRS_16 Heater Piping of Dachan GRS Vapour 20 55 41 40 350 364,000 12,000 182,000 BPPS_GRS_17 Piping from heater to PRS, including PRS of Dachan
GRS Vapour 20 55 41 35 700 364,000 13,000 182,000
GRS_18 Piping from PRS to manifold, including HIPPS of Dachan GRS
Vapour 41 38 26 265 700 364,000 15,000 184,000
GRS_19 Pig receiver of Dachan GRS Vapour 20 55 41 8.71 800 364,000 12,000 182,000

ENVIRONMENTAL RESOURCES MANAGEMENT CLP POWER HONG KONG LIMITED ANNEX 5D_HAZARDOUS SCENARIOS.DOC JUNE 2018
5D-20
Table 5D.9 Hazardous Section Details for the GRS at the LPS
Hazardous Section Code
Description Fluid Phase
Temperature (degC)
Pressure (barg)
Density (kg/m3)
Length of Pipe (m)
Pipe Diameter (mm)
Flow Rate (kg/hr)
Isolation Success Case (120 seconds): Iso-Section Inventory (kg)
Isolation Failure Case (1800 seconds): Iso-Section Inventory (kg)
LPS_NGRS_01 Above ground 20" piping from shore to Inlet of each New GRS Metering Train A
Vapour 16 88 70 311 508 226,000 12,000 118,000
LPS_NGRS_02 Piping from Existing Gas Header to Inlet ESDVs of each New GRS Metering Train B
Vapour 16 88 70 273 457 226,000 11,000 116,000
LPS_NGRS_03 Piping from Filter Skid to Metering Skid of New GRS (Train 1A)
Vapour 16 88 70 54 219 57,000 2,000 28,000
LPS_NGRS_04 Piping from Filter Skid to Metering Skid of New GRS (Train 1B)
Vapour 16 88 70 53 219 57,000 2,000 28,000
LPS_NGRS_05 Piping from Metering Skids to Mixer of New GRS (Train 1)
Vapour 16 88 70 23 219 57,000 2,000 28,000
LPS_NGRS_06 Piping from Mixer to Water Bath Heater of New GRS (Train 1)
Vapour 16 88 70 28 219 57,000 2,000 28,000
LPS_NGRS_07 Piping from Water Bath Heater to Pressure Reduction Station of New GRS (Train 1)
Vapour 51 88 58 35 219 57,000 2,000 28,000
LPS_NGRS_08 Piping from Pressure Reduction Station of New GRS (Train 1) to associated CCGT
Vapour 20 41 29 42 356 57,000 2,000 28,000
LPS_NGRS_09 Piping from Filter Skid to Metering Skid of New GRS (Train 2A)
Vapour 16 88 70 54 219 57,000 2,000 28,000
LPS_NGRS_10 Piping from Filter Skid to Metering Skid of New GRS (Train 2B)
Vapour 16 88 70 53 219 57,000 2,000 28,000
LPS_NGRS_11 Piping from Metering Skids to Mixer of New GRS (Train 2)
Vapour 16 88 70 23 219 57,000 2,000 28,000
LPS_NGRS_12 Piping from Mixer to Water Bath Heater of New GRS (Train 2)
Vapour 16 88 70 28 219 57,000 2,000 28,000
LPS_NGRS_13 Piping from Water Bath Heater to Pressure Reduction Station of New GRS (Train 2)
Vapour 51 88 58 35 219 57,000 2,000 28,000
LPS_NGRS_14 Piping from Pressure Reduction Station of New GRS (Train 2) to associated CCGT
Vapour 20 41 29 42 356 57,000 2,000 28,000
LPS_NGRS_15 Piping from Filter Skid to Metering Skid of New GRS (Train 3A)
Vapour 16 88 70 54 219 57,000 2,000 28,000

ENVIRONMENTAL RESOURCES MANAGEMENT CLP POWER HONG KONG LIMITED ANNEX 5D_HAZARDOUS SCENARIOS.DOC JUNE 2018
5D-21
Hazardous Section Code
Description Fluid Phase
Temperature (degC)
Pressure (barg)
Density (kg/m3)
Length of Pipe (m)
Pipe Diameter (mm)
Flow Rate (kg/hr)
Isolation Success Case (120 seconds): Iso-Section Inventory (kg)
Isolation Failure Case (1800 seconds): Iso-Section Inventory (kg)
LPS_NGRS_16 Piping from Filter Skid to Metering Skid of New GRS (Train 3B)
Vapour 16 88 70 53 219 57,000 2,000 28,000
LPS_NGRS_17 Piping from Metering Skids to Mixer of New GRS (Train 3)
Vapour 16 88 70 23 219 57,000 2,000 28,000
LPS_NGRS_18 Piping from Mixer to Water Bath Heater of New GRS (Train 3)
Vapour 16 88 70 28 219 57,000 2,000 28,000
LPS_NGRS_19 Piping from Water Bath Heater to Pressure Reduction Station of New GRS (Train 3)
Vapour 51 88 58 35 219 57,000 2,000 28,000
LPS_NGRS_20 Piping from Pressure Reduction Station of New GRS (Train 3) to associated CCGT
Vapour 20 41 29 42 356 57,000 2,000 28,000
LPS_NGRS_21 Piping from Filter Skid to Metering Skid of New GRS (Train 4A)
Vapour 16 88 70 54 219 57,000 2,000 28,000
LPS_NGRS_22 Piping from Filter Skid to Metering Skid of New GRS (Train 4B)
Vapour 16 88 70 53 219 57,000 2,000 28,000
LPS_NGRS_23 Piping from Metering Skids to Mixer of New GRS (Train 4)
Vapour 16 88 70 23 219 57,000 2,000 28,000
LPS_NGRS_24 Piping from Mixer to Water Bath Heater of New GRS (Train 4)
Vapour 16 88 70 28 219 57,000 2,000 28,000
LPS_NGRS_25 Piping from Water Bath Heater to Pressure Reduction Station of New GRS (Train 4)
Vapour 51 88 58 35 219 57,000 2,000 28,000
LPS_NGRS_26 Piping from Pressure Reduction Station of New GRS (Train 4) to associated CCGT
Vapour 20 41 29 42 356 57,000 2,000 28,000
LPS_NGRS_27 Pig Receiver of New GRS Vapour 20 88 68 62 508 226,000 8,000 114,000 LPS_NGRS_28 Piping from Existing Gas Header to Inlet ESDV (L10
Stream A) Vapour 16 88 70 29 457 226,000 8,000 113,000
LPS_NGRS_29 Piping from Inlet ESDV to Filter Skid (L10 Stream A) Vapour 16 88 70 12 219 57,000 2,000 28,000 LPS_NGRS_30 Piping from Filter Skid, via Metering Skid and
Mixer, to Heater (L10 Stream A) Vapour 16 88 70 48 219 57,000 2,000 28,000
LPS_NGRS_31 Piping from Heater to Pressure Reduction Station (L10 Stream)
Vapour 41 88 61 39 219 57,000 2,000 28,000
LPS_NGRS_32 Piping from Pressure Reduction Station (L10 Stream) to L10
Vapour >10 41 31 26 356 57,000 2,000 28,000

ENVIRONMENTAL RESOURCES MANAGEMENT CLP POWER HONG KONG LIMITED ANNEX 5D_HAZARDOUS SCENARIOS.DOC JUNE 2018
5D-22
Hazardous Section Code
Description Fluid Phase
Temperature (degC)
Pressure (barg)
Density (kg/m3)
Length of Pipe (m)
Pipe Diameter (mm)
Flow Rate (kg/hr)
Isolation Success Case (120 seconds): Iso-Section Inventory (kg)
Isolation Failure Case (1800 seconds): Iso-Section Inventory (kg)
LPS_NGRS_33 Piping from New Gas Header to Inlet ESDV (L10 Stream B)
Vapour 16 88 70 17 457 57,000 2,000 28,000
LPS_NGRS_34 Piping from Inlet ESDV to Filter Skid (L10 Stream B) Vapour 16 88 70 12 219 57,000 2,000 28,000 LPS_NGRS_35 Piping from Filter Skid, via Metering Skid to Mixer
(L10 Stream B) Vapour 16 88 70 28 219 57,000 2,000 28,000
LPS_GRS_01 Above ground existing piping from shore to existing GRS Trains
Vapour 16 88 70 80 508 339,000 12,000 171,000
LPS_GRS_02 Piping from Filter Skid to Metering Skid (GT57 Stream)
Vapour 16 88 70 40 219 57,000 2,000 28,000
LPS_GRS_03 Piping from Metering Skid to Heater (GT57 Stream) Vapour 16 88 70 30 219 57,000 2,000 28,000 LPS_GRS_04 Piping from Heater to Pressure Reduction Station
(GT57 Stream) Vapour 50 88 58 60 273 57,000 2,000 29,000
LPS_GRS_05 Piping from Pressure Reduction Station (GT57 Stream) to GT57
Vapour >10 29 21 45 356 57,000 2,000 28,000
LPS_GRS_06 Piping from Filter Skid to Metering Skid (L9 Stream) Vapour 16 88 70 60 219 57,000 2,000 29,000 LPS_GRS_07 Piping from Metering Skid to Heater (L9 Stream) Vapour 16 88 70 45 273 57,000 2,000 29,000 LPS_GRS_08 Piping from Heater to Pressure Reduction Station
(L9 Stream) Vapour 41 88 61 65 273 57,000 2,200 29,000
LPS_GRS_09 Piping from Pressure Reduction Station (L9 Stream) to L9
Vapour >10 41 31 120 356 57,000 2,000 29,000
LPS_GRS_10 Pig Receiver of the existing GRS Vapour 16 88 70 35 508 339,000 12,000 170,000
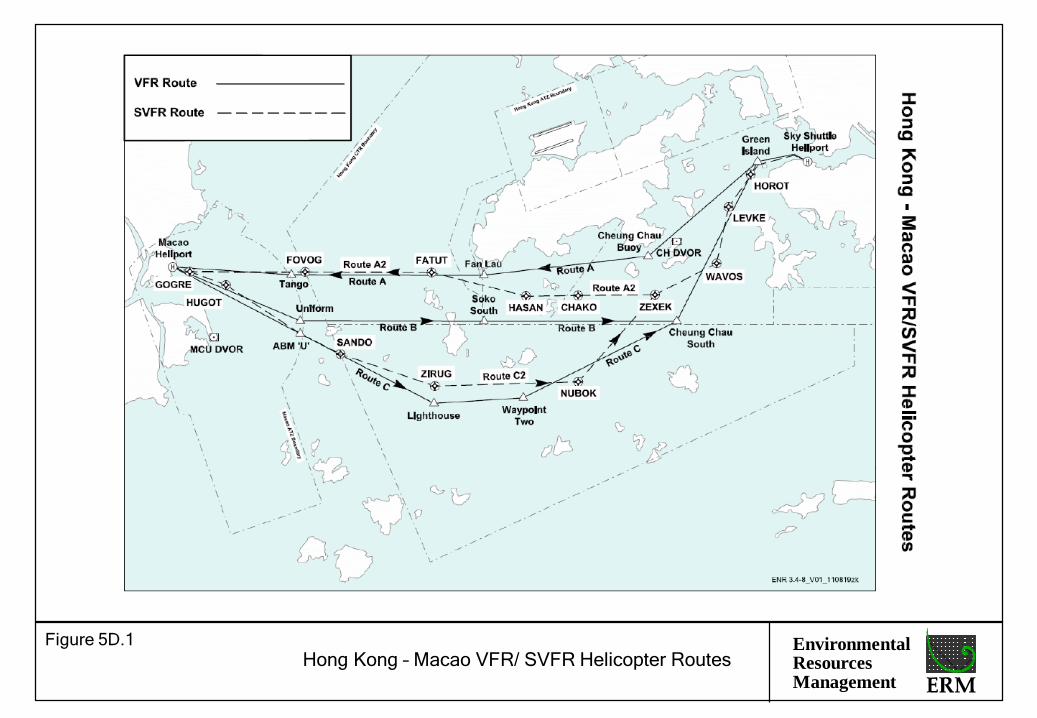
Environmental Resources Management
Figure 5D.1
Hong Kong – Macao VFR/ SVFR Helicopter Routes

Annex 5E
Hazard Identification
Worksheets
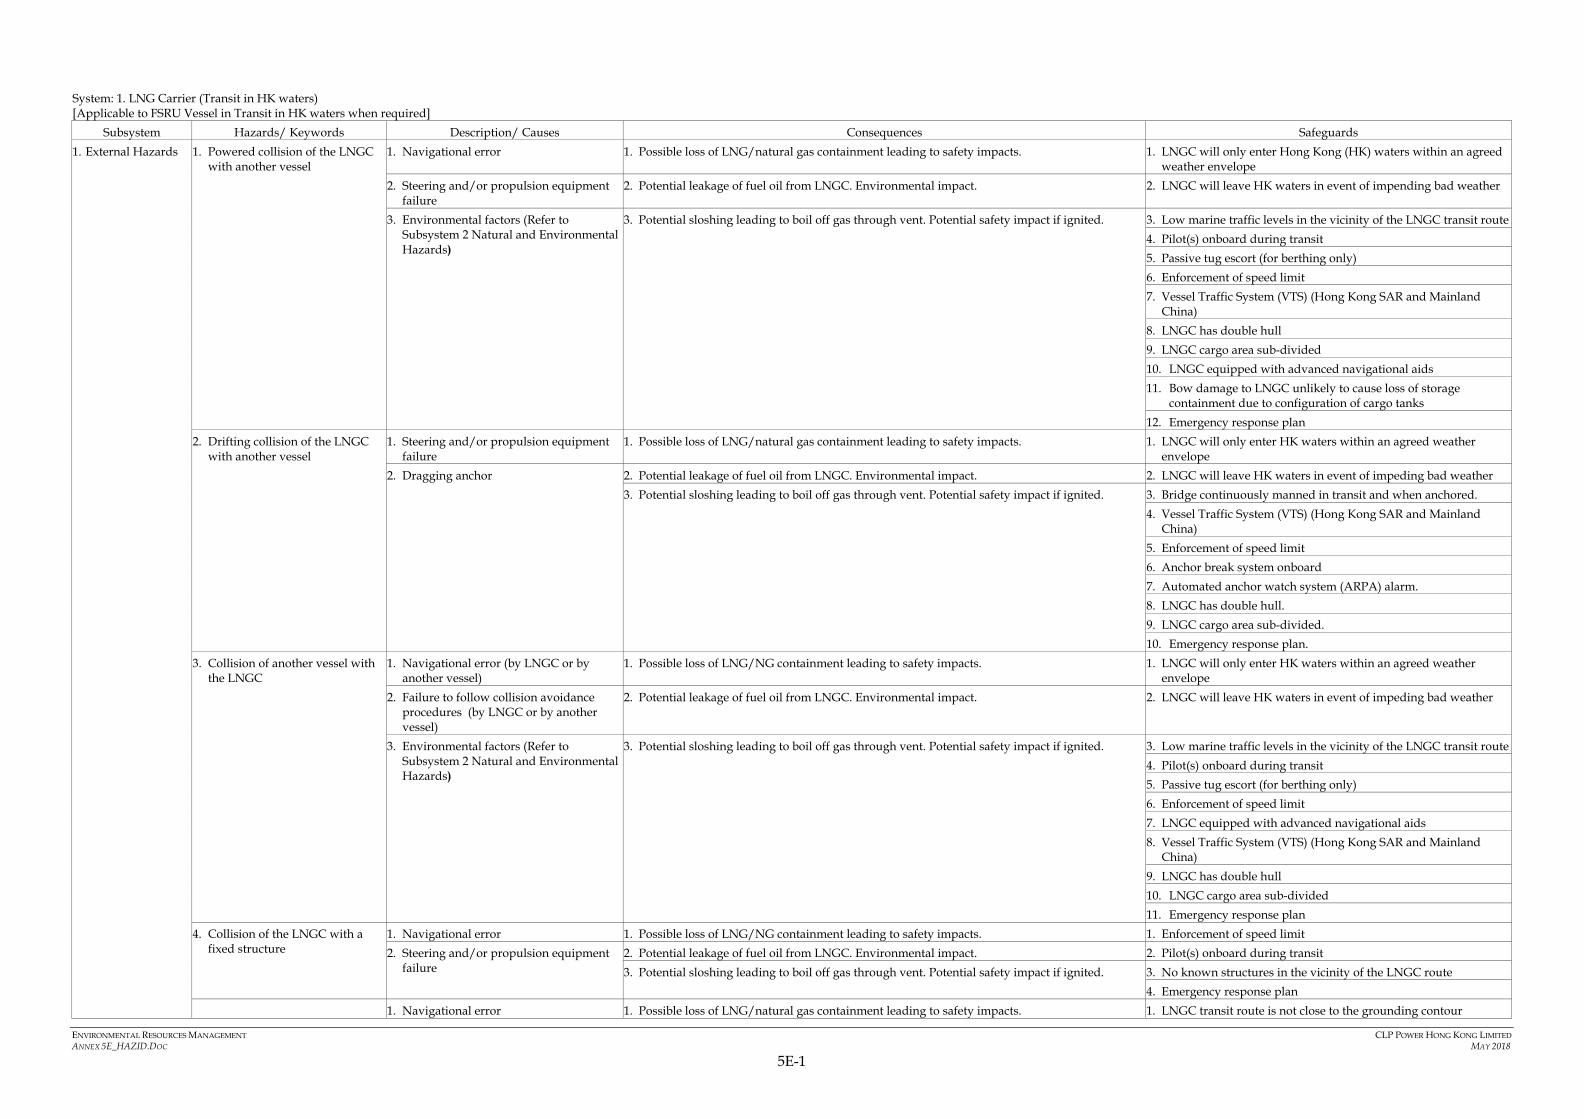
ENVIRONMENTAL RESOURCES MANAGEMENT CLP POWER HONG KONG LIMITED
ANNEX 5E_HAZID.DOC MAY 2018 5E-1
System: 1. LNG Carrier (Transit in HK waters) [Applicable to FSRU Vessel in Transit in HK waters when required]
Subsystem Hazards/ Keywords Description/ Causes Consequences Safeguards
1. External Hazards
1. Powered collision of the LNGC with another vessel
1. Navigational error
1. Possible loss of LNG/natural gas containment leading to safety impacts.
1. LNGC will only enter Hong Kong (HK) waters within an agreed weather envelope
2. Steering and/or propulsion equipment failure
2. Potential leakage of fuel oil from LNGC. Environmental impact.
2. LNGC will leave HK waters in event of impending bad weather
3. Environmental factors (Refer to Subsystem 2 Natural and Environmental Hazards)
3. Potential sloshing leading to boil off gas through vent. Potential safety impact if ignited.
3. Low marine traffic levels in the vicinity of the LNGC transit route
4. Pilot(s) onboard during transit
5. Passive tug escort (for berthing only)
6. Enforcement of speed limit
7. Vessel Traffic System (VTS) (Hong Kong SAR and Mainland China)
8. LNGC has double hull
9. LNGC cargo area sub-divided
10. LNGC equipped with advanced navigational aids
11. Bow damage to LNGC unlikely to cause loss of storage containment due to configuration of cargo tanks
12. Emergency response plan
2. Drifting collision of the LNGC with another vessel
1. Steering and/or propulsion equipment failure
1. Possible loss of LNG/natural gas containment leading to safety impacts.
1. LNGC will only enter HK waters within an agreed weather envelope
2. Dragging anchor
2. Potential leakage of fuel oil from LNGC. Environmental impact.
2. LNGC will leave HK waters in event of impeding bad weather
3. Potential sloshing leading to boil off gas through vent. Potential safety impact if ignited.
3. Bridge continuously manned in transit and when anchored.
4. Vessel Traffic System (VTS) (Hong Kong SAR and Mainland China)
5. Enforcement of speed limit
6. Anchor break system onboard
7. Automated anchor watch system (ARPA) alarm.
8. LNGC has double hull.
9. LNGC cargo area sub-divided.
10. Emergency response plan.
3. Collision of another vessel with the LNGC
1. Navigational error (by LNGC or by another vessel)
1. Possible loss of LNG/NG containment leading to safety impacts.
1. LNGC will only enter HK waters within an agreed weather envelope
2. Failure to follow collision avoidance procedures (by LNGC or by another vessel)
2. Potential leakage of fuel oil from LNGC. Environmental impact.
2. LNGC will leave HK waters in event of impeding bad weather
3. Environmental factors (Refer to Subsystem 2 Natural and Environmental Hazards)
3. Potential sloshing leading to boil off gas through vent. Potential safety impact if ignited.
3. Low marine traffic levels in the vicinity of the LNGC transit route
4. Pilot(s) onboard during transit
5. Passive tug escort (for berthing only)
6. Enforcement of speed limit
7. LNGC equipped with advanced navigational aids
8. Vessel Traffic System (VTS) (Hong Kong SAR and Mainland China)
9. LNGC has double hull
10. LNGC cargo area sub-divided
11. Emergency response plan
4. Collision of the LNGC with a fixed structure
1. Navigational error
1. Possible loss of LNG/NG containment leading to safety impacts.
1. Enforcement of speed limit
2. Steering and/or propulsion equipment failure
2. Potential leakage of fuel oil from LNGC. Environmental impact.
2. Pilot(s) onboard during transit
3. Potential sloshing leading to boil off gas through vent. Potential safety impact if ignited.
3. No known structures in the vicinity of the LNGC route
4. Emergency response plan
1. Navigational error
1. Possible loss of LNG/natural gas containment leading to safety impacts.
1. LNGC transit route is not close to the grounding contour
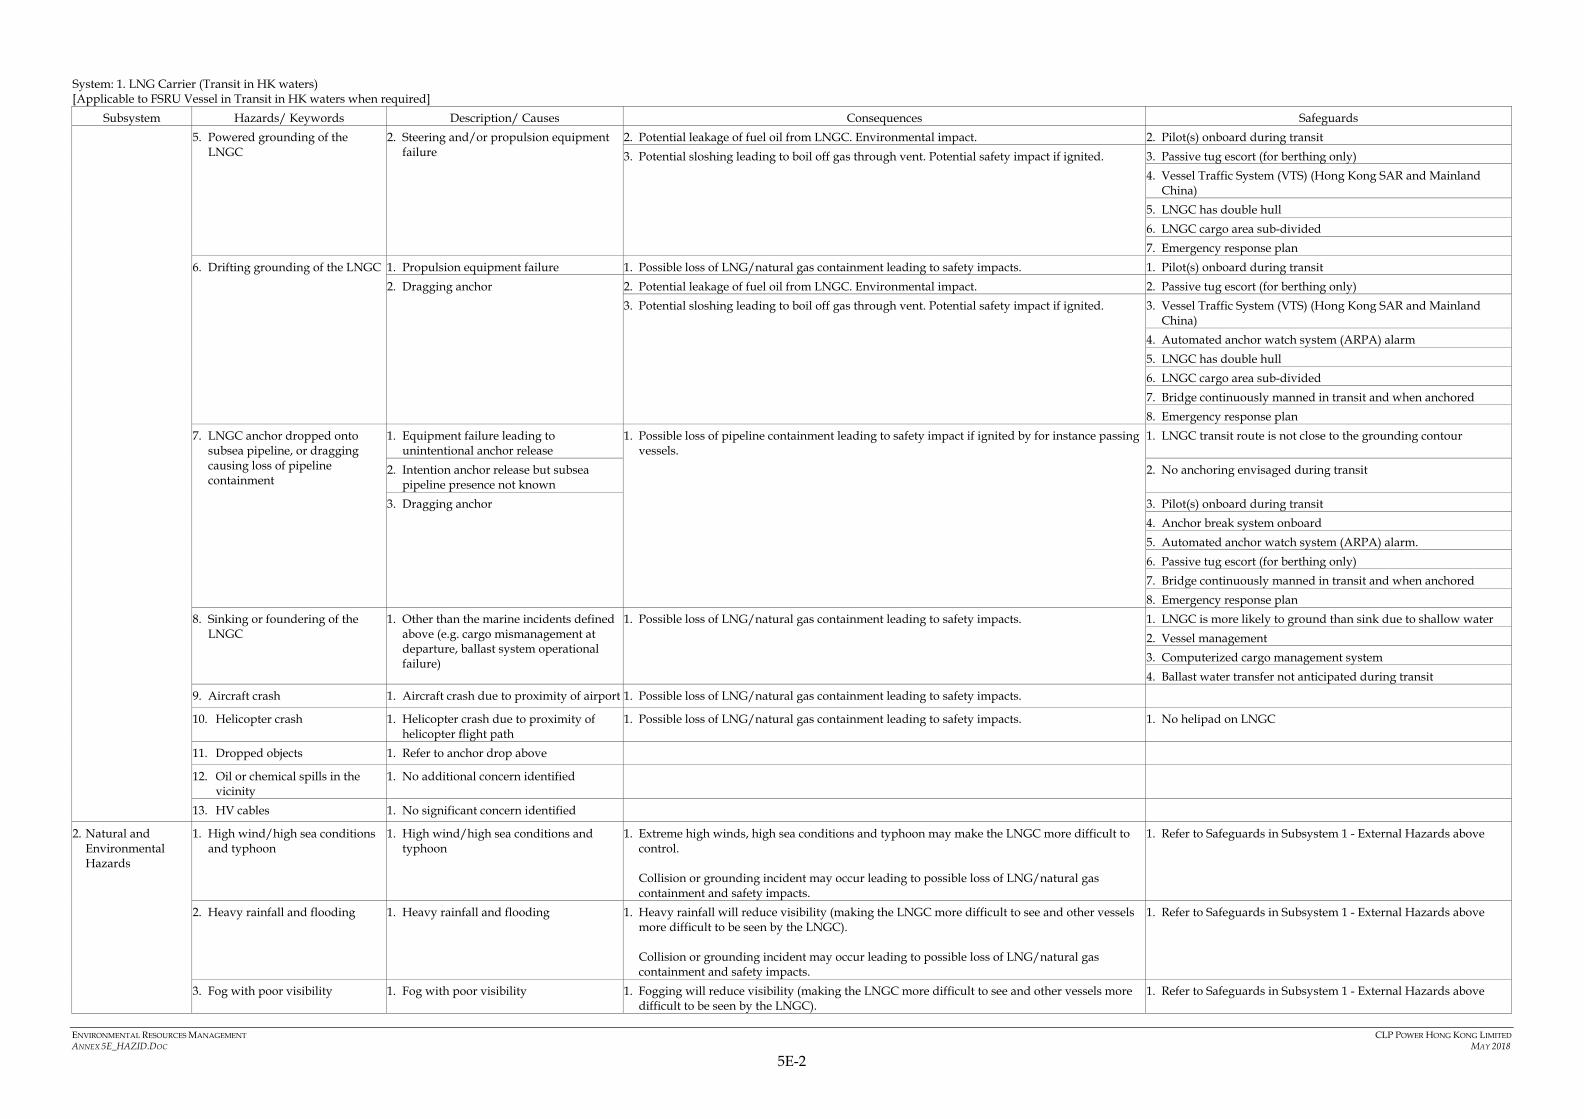
ENVIRONMENTAL RESOURCES MANAGEMENT CLP POWER HONG KONG LIMITED
ANNEX 5E_HAZID.DOC MAY 2018 5E-2
System: 1. LNG Carrier (Transit in HK waters) [Applicable to FSRU Vessel in Transit in HK waters when required]
Subsystem Hazards/ Keywords Description/ Causes Consequences Safeguards
5. Powered grounding of the LNGC
2. Steering and/or propulsion equipment failure
2. Potential leakage of fuel oil from LNGC. Environmental impact.
2. Pilot(s) onboard during transit
3. Potential sloshing leading to boil off gas through vent. Potential safety impact if ignited.
3. Passive tug escort (for berthing only)
4. Vessel Traffic System (VTS) (Hong Kong SAR and Mainland China)
5. LNGC has double hull
6. LNGC cargo area sub-divided
7. Emergency response plan
6. Drifting grounding of the LNGC
1. Propulsion equipment failure
1. Possible loss of LNG/natural gas containment leading to safety impacts.
1. Pilot(s) onboard during transit
2. Dragging anchor
2. Potential leakage of fuel oil from LNGC. Environmental impact.
2. Passive tug escort (for berthing only)
3. Potential sloshing leading to boil off gas through vent. Potential safety impact if ignited.
3. Vessel Traffic System (VTS) (Hong Kong SAR and Mainland China)
4. Automated anchor watch system (ARPA) alarm
5. LNGC has double hull
6. LNGC cargo area sub-divided
7. Bridge continuously manned in transit and when anchored
8. Emergency response plan
7. LNGC anchor dropped onto subsea pipeline, or dragging causing loss of pipeline containment
1. Equipment failure leading to unintentional anchor release
1. Possible loss of pipeline containment leading to safety impact if ignited by for instance passing vessels.
1. LNGC transit route is not close to the grounding contour
2. Intention anchor release but subsea pipeline presence not known
2. No anchoring envisaged during transit
3. Dragging anchor
3. Pilot(s) onboard during transit
4. Anchor break system onboard
5. Automated anchor watch system (ARPA) alarm.
6. Passive tug escort (for berthing only)
7. Bridge continuously manned in transit and when anchored
8. Emergency response plan
8. Sinking or foundering of the LNGC
1. Other than the marine incidents defined above (e.g. cargo mismanagement at departure, ballast system operational failure)
1. Possible loss of LNG/natural gas containment leading to safety impacts.
1. LNGC is more likely to ground than sink due to shallow water
2. Vessel management
3. Computerized cargo management system
4. Ballast water transfer not anticipated during transit
9. Aircraft crash
1. Aircraft crash due to proximity of airport
1. Possible loss of LNG/natural gas containment leading to safety impacts.
10. Helicopter crash
1. Helicopter crash due to proximity of helicopter flight path
1. Possible loss of LNG/natural gas containment leading to safety impacts.
1. No helipad on LNGC
11. Dropped objects
1. Refer to anchor drop above
12. Oil or chemical spills in the vicinity
1. No additional concern identified
13. HV cables
1. No significant concern identified
2. Natural and Environmental Hazards
1. High wind/high sea conditions and typhoon
1. High wind/high sea conditions and typhoon
1. Extreme high winds, high sea conditions and typhoon may make the LNGC more difficult to control. Collision or grounding incident may occur leading to possible loss of LNG/natural gas containment and safety impacts.
1. Refer to Safeguards in Subsystem 1 - External Hazards above
2. Heavy rainfall and flooding
1. Heavy rainfall and flooding
1. Heavy rainfall will reduce visibility (making the LNGC more difficult to see and other vessels more difficult to be seen by the LNGC). Collision or grounding incident may occur leading to possible loss of LNG/natural gas containment and safety impacts.
1. Refer to Safeguards in Subsystem 1 - External Hazards above
3. Fog with poor visibility
1. Fog with poor visibility
1. Fogging will reduce visibility (making the LNGC more difficult to see and other vessels more difficult to be seen by the LNGC).
1. Refer to Safeguards in Subsystem 1 - External Hazards above

ENVIRONMENTAL RESOURCES MANAGEMENT CLP POWER HONG KONG LIMITED
ANNEX 5E_HAZID.DOC MAY 2018 5E-3
System: 1. LNG Carrier (Transit in HK waters) [Applicable to FSRU Vessel in Transit in HK waters when required]
Subsystem Hazards/ Keywords Description/ Causes Consequences Safeguards
Collision or grounding incident may occur leading to possible loss of LNG/natural gas containment and safety impacts.
4. Lightning
1. Lightning strike
1. Ignition on vent can lead to potential localized safety impact.
1. Flame arrestors provided on vents
5. Earthquakes
1. No significant concern identified
6. Landslide
1. No significant concern identified
7. Subsidence/ movement
1. No significant concern identified
8. Tsunami
1. Tsunami
1. Tsunami impact on LNGC during transit is not envisaged due to sufficient water depth.
9. Tidal waves/storm surge
1. Tidal waves/storm surge
1. Tidal waves/storm surge impact on LNGC during transit is not envisaged due to sufficient water depth.
10. Seawater - seasonal variations in salinity and suspended solids
1. No significant concern identified
3. Material Hazards
1. Loss of LNG/natural gas - Marine Incidents
1. Marine Incidents (Refer to Subsystem #1 External Hazards above)
1. Possible loss of LNG/natural gas containment leading to safety impacts.
1. Refer to Safeguards in Subsystem 1 - External Hazards above
2. Loss of LNG/natural gas - Other Causes
1. Membrane and piping/flange failure due to degradation, construction/material defects, operational (human) errors and non-marine incident impacts (sloshing)
1. Possible loss of LNG/natural gas containment leading to safety impacts.
1. Limited active cargo operational activity during transit
2. Membrane material has very high corrosion resistance
3. LNGC inspection, testing and maintenance (ITM)
4. Annulus between membrane and ship structure monitored for hydrocarbon presence and vented to safe location
5. Cargo tanks either full (inbound) or empty (outbound) so potential for sloshing is minimized.
6. Leak detection system
7. Fire and gas detection system
8. Emergency shutdown system
9. Spill containment system
10. Water spray system for rapid vaporization
11. Fire fighting system
12. Emergency response plan
3. Diesel oil
1. Refer to Subsystem 5 Layout Hazard below
4. Marine Fuel oil
1. Refer to Subsystem 5 Layout Hazard below
5. Lubricating oil
1. No significant hazard envisaged, considering the small quantity of lubricating oil for machinery
6. Urea
1. No significant hazard envisaged, considering the small quantity of urea generated
7. Nitrogen
1. Potential asphyxiation hazard, no off-site impact is expected.
8. CO2 - inert gas
1. Potential asphyxiation hazard, no off-site impact is expected.
9. Sodium Hypochlorite
1. Sodium Hypochlorite
1. Release of chlorine if subjected to fire. However, no significant hazard is envisaged given the limited quantity of generated chlorine expected.
10. Water Glycol
1. No significant issue
4. Loss of Utilities
1. Loss of power supply
1. Loss of propulsion and/or steering
1. Marine Incidents (Refer to Subsystem #1 External Hazards above).
1. Refer to Safeguards in Subsystem 1 - External Hazards above
2. Loss of instrument air supply
1. Not applicable

ENVIRONMENTAL RESOURCES MANAGEMENT CLP POWER HONG KONG LIMITED
ANNEX 5E_HAZID.DOC MAY 2018 5E-4
System: 1. LNG Carrier (Transit in HK waters) [Applicable to FSRU Vessel in Transit in HK waters when required]
Subsystem Hazards/ Keywords Description/ Causes Consequences Safeguards
3. Loss of nitrogen
1. No significant hazard identified
4. Loss of fuel gas supply
1. Refer to Loss of Power Supply above
5. Loss of fuel oil supply
1. Refer to Loss of Power Supply above
6. Loss of fresh water supply
1. No significant hazard identified
5. Layout Hazard
1. Escalation of Engine Room Fire
1. Escalation of Engine Room Fire
1. Potential fire escalation to other areas.
1. Engine room separated from cargo storage area to prevent fire propagation
2. Engine room designed to Class rules to minimize likelihood of fire and provide adequate fire-fighting and containment
2. Escalation of Accommodation Fire
1. Escalation of Accommodation Fire
1. Potential fire escalation to other areas.
1. Accommodation separated from cargo storage area to prevent firepropagation
2. Accommodation designed to Class rules to minimize likelihood of fire and provide adequate fire-fighting and containment
6. Interface with Existing Facility
1. Not applicable
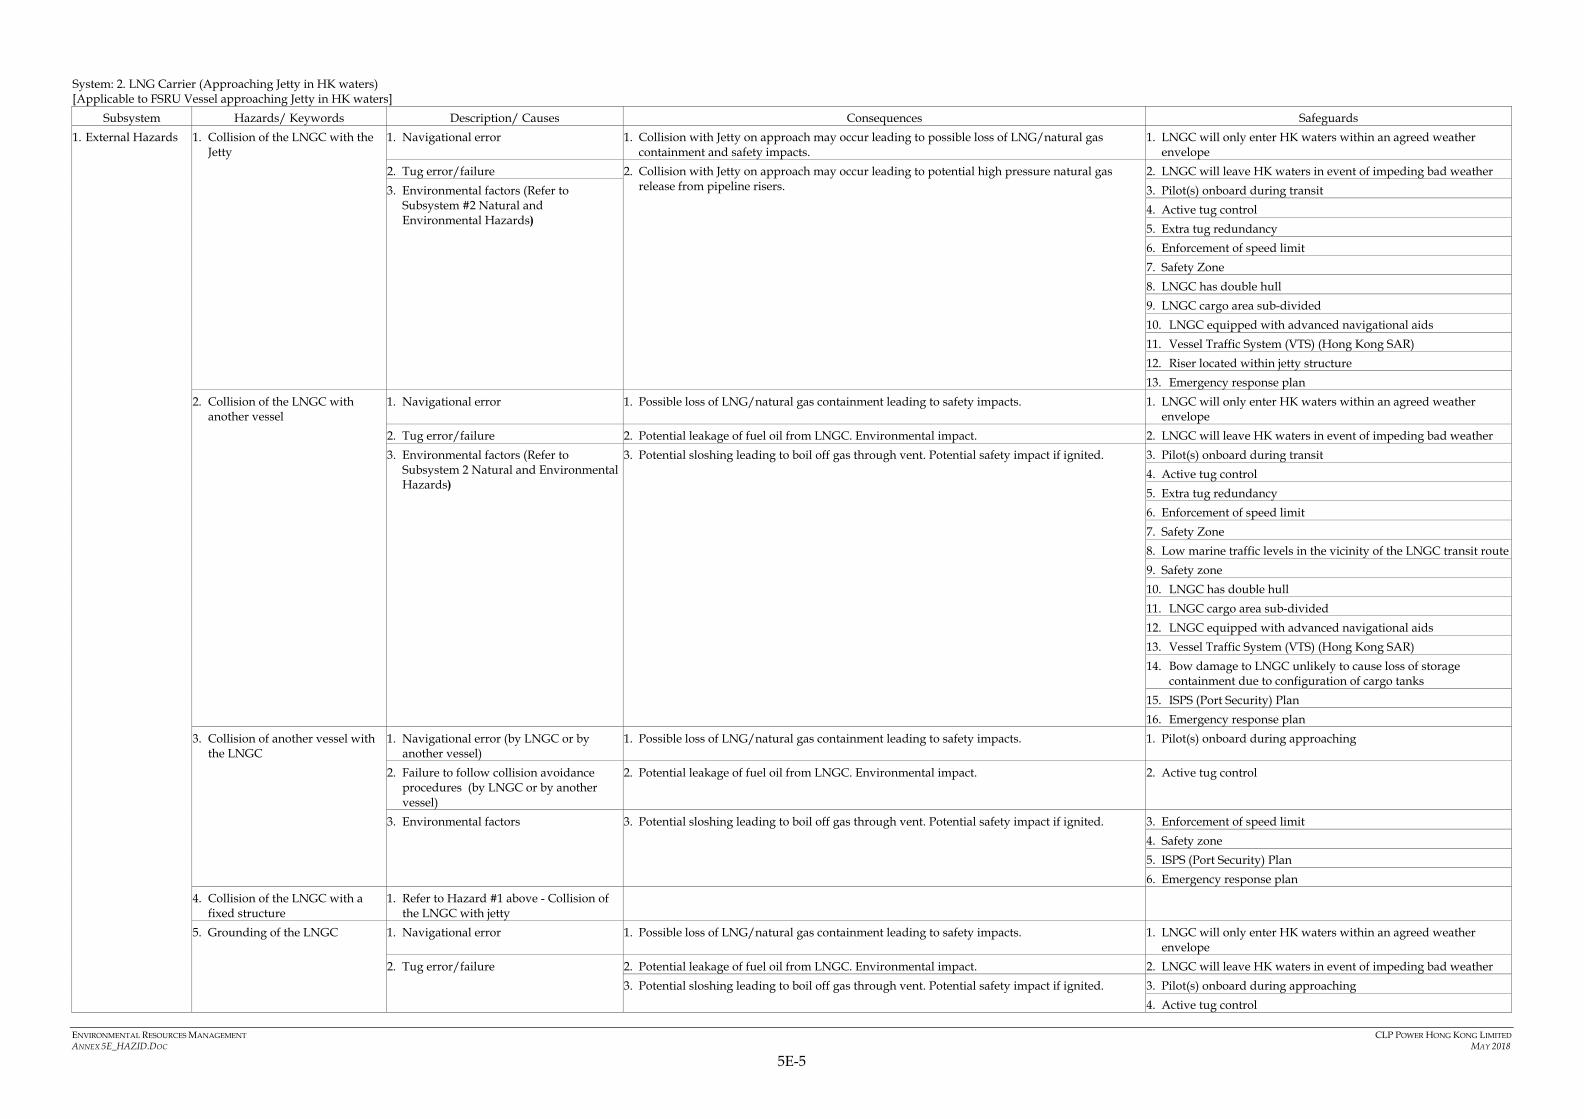
ENVIRONMENTAL RESOURCES MANAGEMENT CLP POWER HONG KONG LIMITED
ANNEX 5E_HAZID.DOC MAY 2018 5E-5
System: 2. LNG Carrier (Approaching Jetty in HK waters) [Applicable to FSRU Vessel approaching Jetty in HK waters]
Subsystem Hazards/ Keywords Description/ Causes Consequences Safeguards
1. External Hazards
1. Collision of the LNGC with the Jetty
1. Navigational error
1. Collision with Jetty on approach may occur leading to possible loss of LNG/natural gas containment and safety impacts.
1. LNGC will only enter HK waters within an agreed weather envelope
2. Tug error/failure
2. Collision with Jetty on approach may occur leading to potential high pressure natural gas release from pipeline risers.
2. LNGC will leave HK waters in event of impeding bad weather
3. Environmental factors (Refer to Subsystem #2 Natural and Environmental Hazards)
3. Pilot(s) onboard during transit
4. Active tug control
5. Extra tug redundancy
6. Enforcement of speed limit
7. Safety Zone
8. LNGC has double hull
9. LNGC cargo area sub-divided
10. LNGC equipped with advanced navigational aids
11. Vessel Traffic System (VTS) (Hong Kong SAR)
12. Riser located within jetty structure
13. Emergency response plan
2. Collision of the LNGC with another vessel
1. Navigational error
1. Possible loss of LNG/natural gas containment leading to safety impacts.
1. LNGC will only enter HK waters within an agreed weather envelope
2. Tug error/failure
2. Potential leakage of fuel oil from LNGC. Environmental impact.
2. LNGC will leave HK waters in event of impeding bad weather
3. Environmental factors (Refer to Subsystem 2 Natural and Environmental Hazards)
3. Potential sloshing leading to boil off gas through vent. Potential safety impact if ignited.
3. Pilot(s) onboard during transit
4. Active tug control
5. Extra tug redundancy
6. Enforcement of speed limit
7. Safety Zone
8. Low marine traffic levels in the vicinity of the LNGC transit route
9. Safety zone
10. LNGC has double hull
11. LNGC cargo area sub-divided
12. LNGC equipped with advanced navigational aids
13. Vessel Traffic System (VTS) (Hong Kong SAR)
14. Bow damage to LNGC unlikely to cause loss of storage containment due to configuration of cargo tanks
15. ISPS (Port Security) Plan
16. Emergency response plan
3. Collision of another vessel with the LNGC
1. Navigational error (by LNGC or by another vessel)
1. Possible loss of LNG/natural gas containment leading to safety impacts.
1. Pilot(s) onboard during approaching
2. Failure to follow collision avoidance procedures (by LNGC or by another vessel)
2. Potential leakage of fuel oil from LNGC. Environmental impact.
2. Active tug control
3. Environmental factors
3. Potential sloshing leading to boil off gas through vent. Potential safety impact if ignited.
3. Enforcement of speed limit
4. Safety zone
5. ISPS (Port Security) Plan
6. Emergency response plan
4. Collision of the LNGC with a fixed structure
1. Refer to Hazard #1 above - Collision of the LNGC with jetty
5. Grounding of the LNGC
1. Navigational error
1. Possible loss of LNG/natural gas containment leading to safety impacts.
1. LNGC will only enter HK waters within an agreed weather envelope
2. Tug error/failure
2. Potential leakage of fuel oil from LNGC. Environmental impact.
2. LNGC will leave HK waters in event of impeding bad weather
3. Potential sloshing leading to boil off gas through vent. Potential safety impact if ignited.
3. Pilot(s) onboard during approaching
4. Active tug control
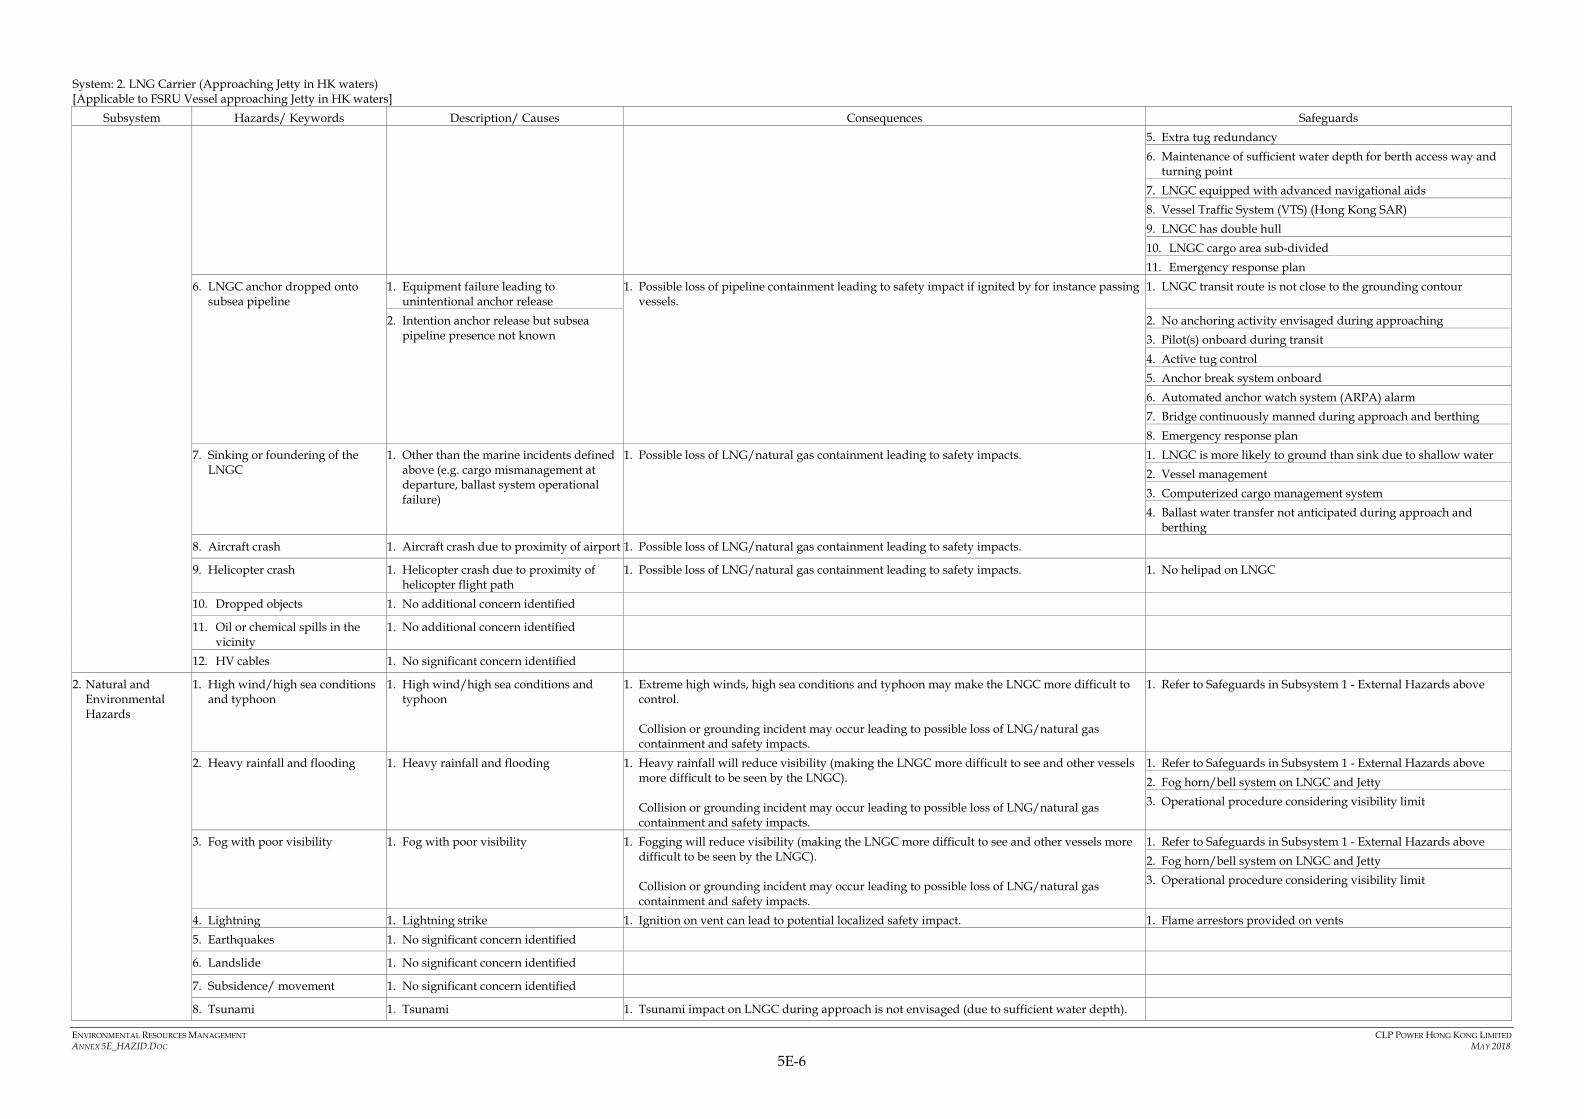
ENVIRONMENTAL RESOURCES MANAGEMENT CLP POWER HONG KONG LIMITED
ANNEX 5E_HAZID.DOC MAY 2018 5E-6
System: 2. LNG Carrier (Approaching Jetty in HK waters) [Applicable to FSRU Vessel approaching Jetty in HK waters]
Subsystem Hazards/ Keywords Description/ Causes Consequences Safeguards
5. Extra tug redundancy
6. Maintenance of sufficient water depth for berth access way and turning point
7. LNGC equipped with advanced navigational aids
8. Vessel Traffic System (VTS) (Hong Kong SAR)
9. LNGC has double hull
10. LNGC cargo area sub-divided
11. Emergency response plan
6. LNGC anchor dropped onto subsea pipeline
1. Equipment failure leading to unintentional anchor release
1. Possible loss of pipeline containment leading to safety impact if ignited by for instance passing vessels.
1. LNGC transit route is not close to the grounding contour
2. Intention anchor release but subsea pipeline presence not known
2. No anchoring activity envisaged during approaching
3. Pilot(s) onboard during transit
4. Active tug control
5. Anchor break system onboard
6. Automated anchor watch system (ARPA) alarm
7. Bridge continuously manned during approach and berthing
8. Emergency response plan
7. Sinking or foundering of the LNGC
1. Other than the marine incidents defined above (e.g. cargo mismanagement at departure, ballast system operational failure)
1. Possible loss of LNG/natural gas containment leading to safety impacts.
1. LNGC is more likely to ground than sink due to shallow water
2. Vessel management
3. Computerized cargo management system
4. Ballast water transfer not anticipated during approach and berthing
8. Aircraft crash
1. Aircraft crash due to proximity of airport
1. Possible loss of LNG/natural gas containment leading to safety impacts.
9. Helicopter crash
1. Helicopter crash due to proximity of helicopter flight path
1. Possible loss of LNG/natural gas containment leading to safety impacts.
1. No helipad on LNGC
10. Dropped objects
1. No additional concern identified
11. Oil or chemical spills in the vicinity
1. No additional concern identified
12. HV cables
1. No significant concern identified
2. Natural and Environmental Hazards
1. High wind/high sea conditions and typhoon
1. High wind/high sea conditions and typhoon
1. Extreme high winds, high sea conditions and typhoon may make the LNGC more difficult to control. Collision or grounding incident may occur leading to possible loss of LNG/natural gas containment and safety impacts.
1. Refer to Safeguards in Subsystem 1 - External Hazards above
2. Heavy rainfall and flooding
1. Heavy rainfall and flooding
1. Heavy rainfall will reduce visibility (making the LNGC more difficult to see and other vessels more difficult to be seen by the LNGC). Collision or grounding incident may occur leading to possible loss of LNG/natural gas containment and safety impacts.
1. Refer to Safeguards in Subsystem 1 - External Hazards above
2. Fog horn/bell system on LNGC and Jetty
3. Operational procedure considering visibility limit
3. Fog with poor visibility
1. Fog with poor visibility
1. Fogging will reduce visibility (making the LNGC more difficult to see and other vessels more difficult to be seen by the LNGC). Collision or grounding incident may occur leading to possible loss of LNG/natural gas containment and safety impacts.
1. Refer to Safeguards in Subsystem 1 - External Hazards above
2. Fog horn/bell system on LNGC and Jetty
3. Operational procedure considering visibility limit
4. Lightning
1. Lightning strike
1. Ignition on vent can lead to potential localized safety impact.
1. Flame arrestors provided on vents
5. Earthquakes
1. No significant concern identified
6. Landslide
1. No significant concern identified
7. Subsidence/ movement
1. No significant concern identified
8. Tsunami
1. Tsunami
1. Tsunami impact on LNGC during approach is not envisaged (due to sufficient water depth).

ENVIRONMENTAL RESOURCES MANAGEMENT CLP POWER HONG KONG LIMITED
ANNEX 5E_HAZID.DOC MAY 2018 5E-7
System: 2. LNG Carrier (Approaching Jetty in HK waters) [Applicable to FSRU Vessel approaching Jetty in HK waters]
Subsystem Hazards/ Keywords Description/ Causes Consequences Safeguards
9. Tidal waves/storm surge
1. Tidal waves/storm surge
1. Tidal waves/storm surge impact on LNGC during approach is not envisaged (due to sufficient water depth).
10. Seawater - seasonal variations in salinity and suspended solids
1. No significant concern identified
3. Material Hazards
1. Loss of LNG/natural gas - Marine Incidents
1. Marine Incidents (refer to Subsystem #1 External Hazards)
1. Possible loss of LNG/natural gas containment leading to safety impacts.
1. Refer to Safeguards in Subsystem 1 - External Hazards above
2. Loss of LNG/natural gas - Other Causes
1. Membrane and piping/flange failure due to degradation, construction/material defects, operational (human) errors and non-marine incident impacts (sloshing)
1. Possible loss of LNG/natural gas containment leading to safety impacts.
1. Limited active cargo operational activity during transit
2. Annulus between membrane and ship structure monitored for hydrocarbon presence and vented to safe location
3. Membrane material has very high corrosion resistance
4. LNGC inspection, testing and maintenance (ITM)
5. Cargo tanks either full (inbound) or empty (outbound) so potential for sloshing is minimized.
6. Leak detection system
7. Fire and gas detection system
8. Emergency shutdown system
9. Spill containment system
10. Water spray system for rapid vaporization
11. Fire fighting system
12. Emergency response plan
3. Diesel oil
1. Refer to Subsystem 5 Layout Hazard below
4. Marine Fuel oil
1. Refer to Subsystem 5 Layout Hazard below
5. Lubricating oil
1. No significant hazard envisaged, considering the small quantity of lubricating oil for machinery
6. Urea
1. No significant hazard envisaged, considering the small quantity of urea generated
7. Nitrogen
1. Potential asphyxiation hazard, no off-site impact is expected.
8. CO2 - inert gas
1. Potential asphyxiation hazard, no off-site impact is expected.
9. Sodium Hypochlorite
1. Sodium Hypochlorite
1. Release of chlorine if subjected to fire. However, no significant hazard is envisaged given the limited quantity of generated chlorine expected.
10. Water Glycol
1. No significant issue
4. Loss of Utilities
1. Loss of power supply
1. Loss of propulsion and/or steering
1. Marine Incidents (Refer to Subsystem #1 External Hazards)
1. Refer to Safeguards in Subsystem 1 - External Hazards above
2. Loss of instrument air supply
1. Not applicable
3. Loss of nitrogen
1. No significant hazard identified
4. Loss of fuel gas supply
1. Refer to Loss of Power Supply above
5. Loss of fuel oil supply
1. Refer to Loss of Power Supply above
6. Loss of fresh water supply
1. No significant hazard identified
5. Layout Hazard
1. Escalation of Engine Room Fire
1. Escalation of Engine Room Fire
1. Potential fire escalation to other areas.
1. Engine room separated from cargo storage area to prevent fire propagation
2. Engine room designed to Class rules to minimize likelihood of fire and provide adequate fire-fighting and containment
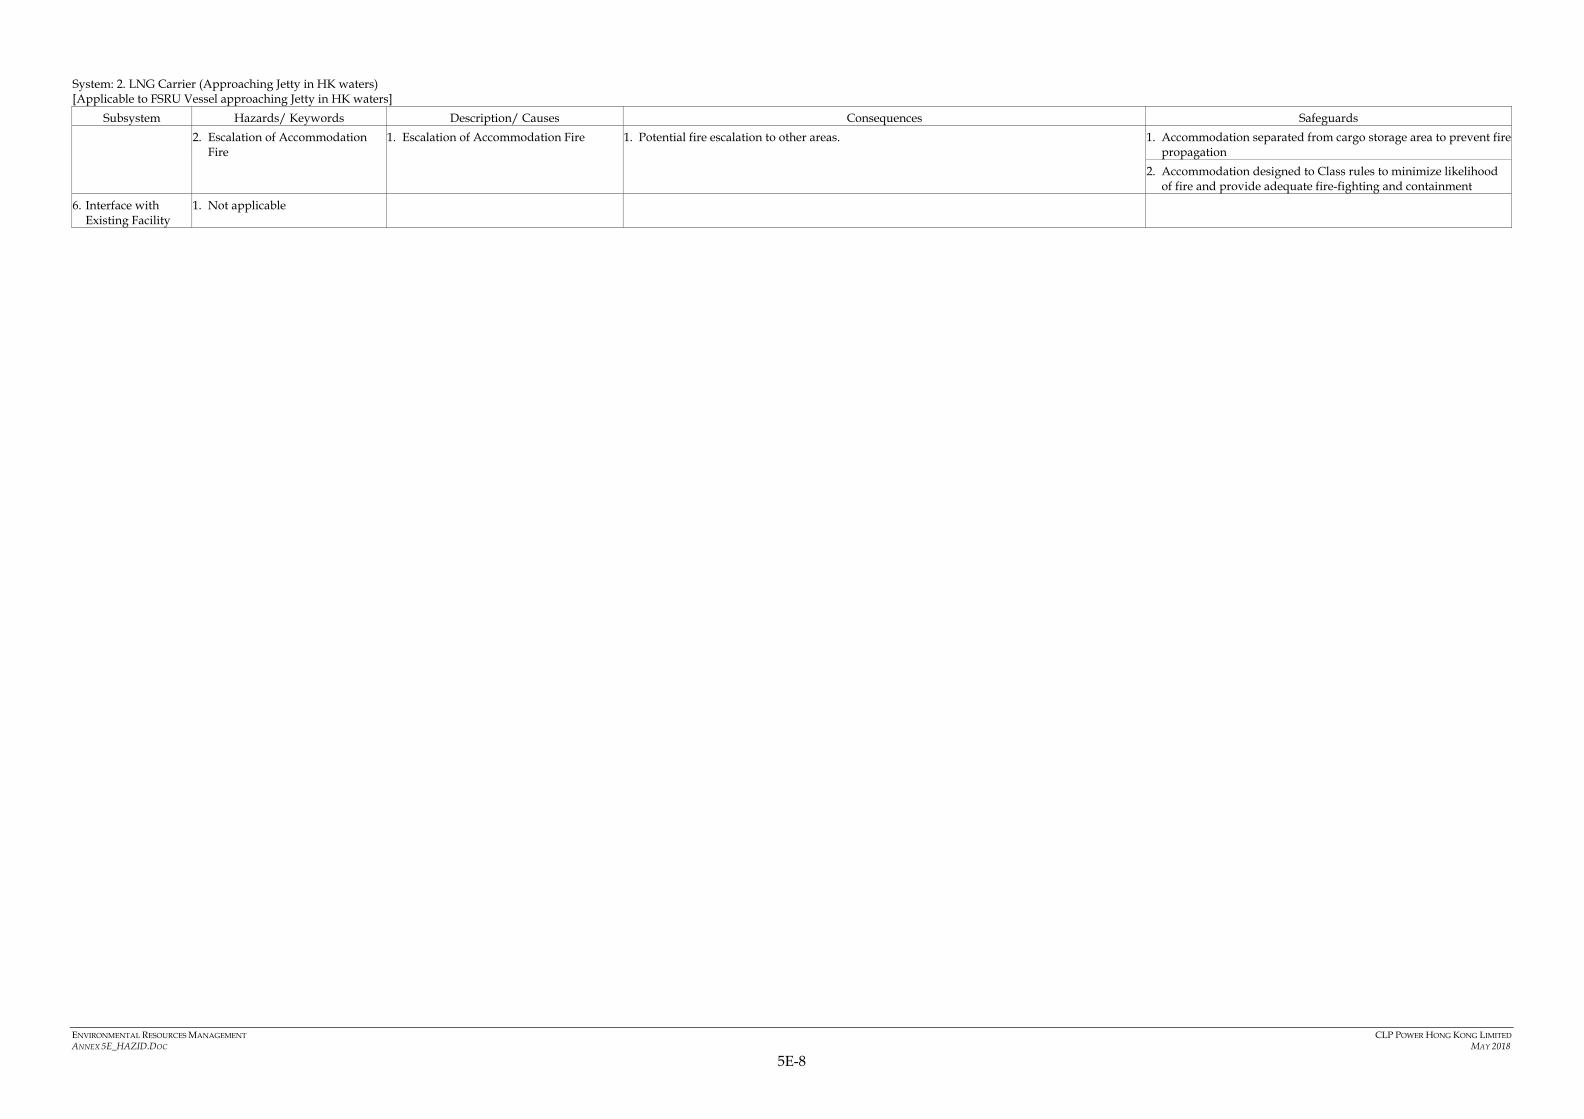
ENVIRONMENTAL RESOURCES MANAGEMENT CLP POWER HONG KONG LIMITED
ANNEX 5E_HAZID.DOC MAY 2018 5E-8
System: 2. LNG Carrier (Approaching Jetty in HK waters) [Applicable to FSRU Vessel approaching Jetty in HK waters]
Subsystem Hazards/ Keywords Description/ Causes Consequences Safeguards
2. Escalation of Accommodation Fire
1. Escalation of Accommodation Fire
1. Potential fire escalation to other areas.
1. Accommodation separated from cargo storage area to prevent fire propagation
2. Accommodation designed to Class rules to minimize likelihood of fire and provide adequate fire-fighting and containment
6. Interface with Existing Facility
1. Not applicable

ENVIRONMENTAL RESOURCES MANAGEMENT CLP POWER HONG KONG LIMITED
ANNEX 5E_HAZID.DOC MAY 2018 5E-9
System: 3. LNG Carrier (LNG Unloading at Jetty up to FSRU Storage)
Subsystem Hazards/ Keywords Description/ Causes Consequences Safeguards
1. External Hazards
1. Collision of passing vessel, service vessel and support vessel (including refueling barge operation, maintenance barge, supply vessel and tug) with LNGC/Jetty/FSRU Vessel
1. Navigational error of the passing vessel
1. Possible loss of LNG/natural gas containment due to breach of cargo, leading to safety impact (fire/explosion) with possible escalation.
1. Enforcement of speed limit
2. Propulsion or steering equipment failure of the passing vessel
2. Possible loss of LNG/natural gas containment due to unloading arm failure, leading to safety impact (fire/explosion) with possible escalation.
2. Navigation aid system
3. Environmental factors (See Subsystem #2)
3. Possible loss of natural gas containment due to high pressure natural gas arm failure, leading to safety impact (fire/explosion) with possible escalation.
3. Safety zone
4. Possible loss of natural gas containment due to higher pressure natural gas riser failure, leading to safety impact (fire/explosion) with possible escalation.
4. Bridge will be always manned
5. Jetty will be manned during unloading operation
6. Standby tug (with impact characteristic less than the design criteria of LNGC and FSRU Vessel)
7. Routing of high pressure natural gas pipework above impact elevation for most vessels
8. Standard SIGTTO ship to shore connections in place
9. Provision of fenders with considering angled berthing
10. LNGC cargo area sub-divided
11. Emergency shutdown system with PERC activation
12. Shut-off valves on loading arm connections
13. Jetty designed to allow for emergency departure
14. ISPS (Port Security) Plan
15. Emergency response plan
2. Mooring line failure
1. Extreme loads
1. Potential drifting of LNGC or FSRU Vessel leading to potential grounding, impact on structure, impact with another vessel. Ultimately release of LNG/natural gas and safety impacts.
1. LNGC will only enter HK waters within an agreed weather envelope.
2. Fatigue
2. LNGC will leave HK waters in event of impeding bad weather.
3. Corrosion and wear
3. Testing and maintenance program for mooring lines
4. Improper selection of mooring lines
4. Line tension monitoring
5. Vetting procedures for LNGC
6. Vetting procedures by supplier
7. Built in redundancy in the mooring configuration
8. Load monitoring and mooring hooks
9. DGPS
10. Standby tug (with impact characteristic less than the design criteria of LNGC and FSRU Vessel)
11. Emergency response plan
3. Aircraft crash
1. Similar to System 2 - LNG Carrier Approaching Jetty in HK waters
4. Helicopter crash
1. Similar to System 2 - LNG Carrier Approaching Jetty in HK waters
5. Oil or chemical spills in the vicinity
1. No additional concern identified
6. Grounding
1. No additional concern identified
7. Dropped objects - from supply crane operation
1. Swinging/dropped objects from crane operation
1. Potential damage to high pressure natural gas pipeworks leading to safety impacts (fire/explosion).
8. Dropped objects - for jetty maintenance
1. Swinging/dropped objects during jetty maintenance due to for instance unloading arm maintenance
1. Potential damage to high pressure natural gas pipeworks leading to safety impacts (fire/explosion).
9. HV cables
1. No additional concern identified
10. Anchor drop/ drag of service and support vessel (including refueling barge operation,
1. Equipment failure leading to unintentional anchor release
1. Possible loss of subsea high pressure natural gas pipeline containment leading to safety impact if ignited by for instance passing vessels.
1. Safety zone
2. Intention anchor release
2. Automatic Identification System (AIS) to enable monitoring of nearby vessels

ENVIRONMENTAL RESOURCES MANAGEMENT CLP POWER HONG KONG LIMITED
ANNEX 5E_HAZID.DOC MAY 2018 5E-10
System: 3. LNG Carrier (LNG Unloading at Jetty up to FSRU Storage)
Subsystem Hazards/ Keywords Description/ Causes Consequences Safeguards maintenance barge, supply vessel and tug)
3. Extreme weather
3. Automated anchor watch system (ARPA) alarm.
4. Improper anchoring
4. Emergency response plan
2. Natural and Environmental Hazards
1. High wind/high sea conditions
1. High wind/high sea conditions
1. Extreme high winds and high sea conditions may create excessive movements and impact unloading arm operation. Refer to Material Hazard - LNG/natural gas above.
1. Refer to Safeguards in Subsystem 1 - External Hazards above
2. Potential impact on mooring lines. Refer to External Hazard - Failure of mooring lines.
2. Heavy rainfall and flooding
1. No significant concern identified
3. Fog with poor visibility
1. No significant concern identified
4. Tidal waves/storm surge
1. Tidal waves/storm surge
1. Tidal waves/ storm surge may create excessive movements and impact unloading arm operation. Refer to Material Hazard - LNG/natural gas above.
1. Refer to Safeguards in Subsystem 1 - External Hazards above
2. Potential impact on mooring lines. Refer to External Hazard - Failure of mooring lines.
5. Lightning
1. Lightning strike
1. Ignition on vent at jetty can lead to potential localized safety impact. Potential gas release and possible fire if ignited leading to safety impact.
1. Flame arrestors provided on vents
6. Earthquakes
1. Earthquakes of high intensity
1. Differential movement between the jetty and carrier( FSRU Vessel/LNGC) leading to potential disconnection of unloading arm. Refer to Material Hazard - LNG/natural gas above.
1. Basis of Design considers seismic activity
7. Landslide
1. No significant concern identified
8. Subsidence/ movement
1. No significant concern identified
9. Tsunami
1. Tsunami
1. Tsunami impact is expected in the worst case of disconnection of unloading arm. No further impact is envisaged due to sufficient water depth.
10. Seawater - seasonal variations in salinity and suspended solids
1. No significant concern identified
3. Material Hazards
1. LNG/natural gas
1. Excessive LNGC/FSRU Vessel movement
1. Possible loss of LNG/natural gas containment due to unloading arm failure, leading to safety impact (fire/explosion) with possible escalation.
1. Terminal, FSRU Vessel, LNGC inspection, testing and maintenance (ITM).
2. Loading arm failure
2. Possible loss of natural gas containment due to high pressure natural gas arm failure, leading to safety impact (fire/explosion) with possible escalation.
2. Unloading operation is supervised and bridge is always manned
3. Flange failure
3. Possible loss of natural gas containment due to higher pressure natural gas riser failure, leading to safety impact (fire/explosion) with possible escalation.
3. Jetty structures would be provided cryo bar to withstand any cryogenic impact
4. External corrosion
4. Potential cryogenic impact leading to safety issue. However this will be localized.
4. Operation procedure will be in place
5. Process upset due to equipment failure/ human error
5. Potential rapid phase transition when LNG comes in contact with water.
5. Process control systems and alarms (DCS)
6. Vessel collisions (Refer to Subsystem 1 - External Hazards above)
6. Emergency shutdown system to trip the unloading system including pumps shutdown valves to initiate the closing of PERC valves
7. Dropped Objects
7. Pressure safety devices
8. PERC system provided for unloading arms for quick disconnection and isolation, in case of excessive movement
9. Fire and gas detection
10. Water spray curtain provided at manifold, which is in operation during unloading operation to minimize cryogenic impact on the jetty structure
11. LNG spill tray system under the manifold
12. Fire fighting system (hydrants, monitors)
13. Standby tug with fire fighting equipment
14. Emergency response plan
2. Fuel oil/ lubricating oil/ hydraulic oil
1. Refer to Subsystem 5 Layout Hazard below

ENVIRONMENTAL RESOURCES MANAGEMENT CLP POWER HONG KONG LIMITED
ANNEX 5E_HAZID.DOC MAY 2018 5E-11
System: 3. LNG Carrier (LNG Unloading at Jetty up to FSRU Storage)
Subsystem Hazards/ Keywords Description/ Causes Consequences Safeguards
3. Calibration gas for analyzers
1. No significant hazard envisaged. Only localized hazard envisaged due to small inventory.
4. Urea
1. No significant hazard envisaged, considering the small quantity of urea generated
5. Nitrogen
1. Potential asphyxiation hazard, no off-site impact is expected.
6. CO2 - inert gas
1. Potential asphyxiation hazard, no off-site impact is expected.
7. Sodium Hypochlorite
1. Sodium Hypochlorite
1. Release of chlorine if subjected to fire. However, no significant hazard is envisaged given the limited quantity of generated chlorine expected.
8. Water Glycol
1. No significant issue
9. Pressurized air
1. No significant concern identified
4. Loss of Utilities
1. Loss of power supply
1. No significant concern identified, since all systems will revert to safe conditions.
2. Loss of hydraulic system
1. Unable to operate unloading arms. No significant concern identified
3. Loss of instrument air supply
1. Unable to operate unloading arms. No significant concern identified
4. Loss of nitrogen
1. Loss of nitrogen for prolonged duration
1. Potential impact on unloading arm joints leading to minor leakage of LNG/natural gas
1. Redundant compressor system
2. Potential impact on compressor seals leading to minor leakage of gas
2. High reliability of nitrogen generation package (membrane type)
3. Loss of nitrogen will lead to potential vacuum in the inter space between the membranes. This will lead to air ingress with moisture ingress. Moisture can freeze leading to potential loss of mechanical integrity of the membranes.
3. FSRU Vessel tanks can tolerate days without any impact in case of loss of nitrogen
5. Loss of fuel gas supply
1. Refer to Loss of Power Supply above
6. Loss of fuel oil supply
1. Refer to Loss of Power Supply above
7. Loss of fresh water supply
1. No significant hazard identified
5. Layout Hazard
1. Escalation of Engine Room Fire
1. Escalation of Engine Room Fire
1. Potential fire escalation to other areas.
1. Engine room separated from cargo storage area to prevent fire propagation
2. Engine room designed to Class rules to minimize likelihood of fire and provide adequate fire-fighting and containment
2. Escalation of Accommodation Fire
1. Escalation of Accommodation Fire
1. Potential fire escalation to other areas.
1. Accommodation separated from cargo storage area to prevent firepropagation
2. Accommodation designed to Class rules to minimize likelihood of fire and provide adequate fire-fighting and containment
6. Interface with Existing Facility
1. Not applicable

ENVIRONMENTAL RESOURCES MANAGEMENT CLP POWER HONG KONG LIMITED
ANNEX 5E_HAZID.DOC MAY 2018 5E-12
System: 4. FSRU Vessel (HP Gas Send-out, FSRU Vessel Process and Non-Process Systems)
Subsystem Hazards/ Keywords Description/ Causes Consequences Safeguards
1. External Hazards
1. Collision of passing vessel, service vessel and support vessel (including refueling barge operation, maintenance barge, supply vessel and tug) with FSRU Vessel
1. Navigational error of the passing vessel
1. Possible loss of LNG/natural gas containment due to breach of cargo, leading to safety impact (fire/explosion) with possible escalation.
1. Enforcement of speed limit
2. Propulsion or steering equipment failure of the passing vessel
2. Possible loss of LNG/natural gas containment due to unloading arm failure, leading to safety impact (fire/explosion) with possible escalation.
2. Safety zone
3. Environmental factors (See Subsystem #2 Natural and Environmental Hazards)
3. Possible loss of natural gas containment due to high pressure natural gas arm failure, leading to safety impact (fire/explosion) with possible escalation.
3. Navigation aid system
4. Possible loss of natural gas containment due to higher pressure natural gas riser failure, leading to safety impact (fire/explosion) with possible escalation.
4. FSRU Vessel will be always manned
5. Standby tug (with impact characteristic less than the design criteria of LNGC and FSRU Vessel)
6. Routing of high pressure natural gas pipework above impact elevation for most vessels
7. Standard SIGTTO ship to shore connections in place
8. Provision of fenders with considering angled berthing
9. LNGC cargo area sub-divided
10. Emergency shutdown system with PERC activation
11. Shut-off valves on loading arm connections
12. ISPS (Port Security) Plan
13. Emergency response plan
2. Mooring line failure
1. Extreme loads
1. Potential drifting of FSRU Vessel leading to potential grounding, impact on structure, impact with another vessel. Ultimately release of LNG/natural gas and safety impacts.
1. LNGC will only enter HK waters within an agreed weather envelope
2. Fatigue
2. LNGC will leave HK waters in event of impeding bad weather
3. Corrosion and wear
3. Testing and maintenance program for mooring lines
4. Improper selection of mooring lines
4. Line tension monitoring
5. Vetting procedures for LNGC
6. Ability to start main propulsion system to compensate drifting
7. Vetting procedures by supplier
8. Built in redundancy in the mooring configuration
9. Load monitoring and mooring hooks
10. DGPS
11. Standby tug (with impact characteristic less than the design criteria of LNGC and FSRU Vessel)
12. Emergency response plan
3. Aircraft crash
1. Similar to System 2 - LNG Carrier Approaching Jetty in HK waters
4. Helicopter crash
1. Similar to System 2 - LNG Carrier Approaching Jetty in HK waters
5. Oil or chemical spills in the vicinity
1. No additional concern identified
6. Grounding
1. No additional concern identified
7. Dropped objects - from crane operation
1. Swinging/dropped objects from crane operation
1. Potential damage to LNG/natural gas pipeworks and process equipment, leading to safety impacts (fire/explosion).
2. Natural and Environmental Hazards
1. High wind/high sea conditions
1. High wind/high sea conditions
1. Potential sloshing leading to boil off gas through vent. Potential safety impact if ignited.
1. Cargo management
2. Potential sloshing leading to damage to membrane.
2. Strengthened containment system
3. PSV system
4. Emergency response plan to depart before extreme condition
2. Heavy rainfall and flooding
1. No significant concern identified
3. Fog with poor visibility
1. No significant concern identified
4. Tidal waves/storm surge
1. Refer to High wind/high sea conditions above

ENVIRONMENTAL RESOURCES MANAGEMENT CLP POWER HONG KONG LIMITED
ANNEX 5E_HAZID.DOC MAY 2018 5E-13
System: 4. FSRU Vessel (HP Gas Send-out, FSRU Vessel Process and Non-Process Systems)
Subsystem Hazards/ Keywords Description/ Causes Consequences Safeguards
5. Lightning
1. Lightning strike
1. Ignition on vent can lead to potential localized safety impact. Potential gas release and possible fire if ignited leading to safety impact.
1. Flame arrestors provided on vents
6. Earthquakes
1. No significant concern identified
7. Landslide
1. No significant concern identified
8. Subsidence/ movement
1. No significant concern identified
9. Tsunami
1. Tsunami
1. Tsunami impact is expected in the worst case of disconnection of unloading arm. No further impact is envisaged due to sufficient water depth.
10. Seawater - seasonal variations in salinity and suspended solids
1. No significant concern identified
3. Material Hazards
1. LNG/natural gas - Process Equipment
1. Excessive LNGC/FSRU Vessel movement
1. Possible loss of LNG/natural gas containment, leading to safety impact (fire/explosion) with possible fire escalation.
1. Terminal, FSRU Vessel, LNGC ITM
2. High pressure gas arm connection failure
2. Potential cryogenic impact leading to safety issue. However this will be localized.
2. Operation procedure will be in place
3. Flange/piping failure
3. Potential rapid phase transition when LNG comes in contact with water.
3. Check valve provided on HP gas send-out line to prevent reverse flow
4. Valves/seals failure
4. Process control systems and alarms (DCS)
5. Internal corrosion/ erosion (in vaporizer area and send-out system)
5. Emergency shutdown system to trip the unloading system including pumps shutdown valves to initiate the closing of PERC valves
6. External corrosion
6. PERC system provided for unloading arms for quick disconnection and isolation, in case of excessive movement
7. Process upset due to equipment failure/ human error
7. Pressure safety devices
8. Loss of structural integrity of piping, process equipment support
8. Fire and gas detection with automatic actuation of ESD system
9. Cargo mismanagement affecting hull integrity
9. LNG spill tray system (cargo area and regasification process area and reliquefyer area)
10. Excessive vibration (compressor area and pumps)
10. Fire fighting system (hydrants, monitors)
11. Dropped Objects
11. Standby tug with fire fighting equipment
12. Emergency response plan
2. LNG/natural gas - Storage Containment
1. Flange/piping failure
1. Possible loss of LNG/natural gas containment, leading to safety impact (fire/explosion) with possible escalation.
1. Terminal, FSRU Vessel, LNGC inspection, testing and maintenance (ITM)
2. External corrosion
2. Possible roll over leading to overpressure and loss of LNG/natural gas containment, leading to safety impact (fire/explosion) with possible escalation.
2. Operation procedure will be in place
3. Process upset due to equipment failure/ human error
3. Potential cryogenic impact leading to safety issue. However this will be localized.
3. Process control systems and alarms (DCS)
4. Dropped Objects
4. Potential rapid phase transition when LNG comes in contact with water.
4. LNG eductor system to allow transfer of LNG in case of power failure and emergency condition
5. Containment failure (membrane)
5. Emergency shutdown system
6. Pressure safety devices
7. Fire and gas detection
8. Secondary barrier for spill containment for full inventory (applicable for each storage compartment)
9. Fire fighting system (hydrants, monitors)
10. Standby tug with fire fighting equipment
11. Emergency response plan
3. Fuel oil/ lubricating oil/ hydraulic oil
1. Refer to Subsystem 5 Layout Hazard below
4. Calibration gas for analyzers
1. Only localized hazard envisaged due to small inventory
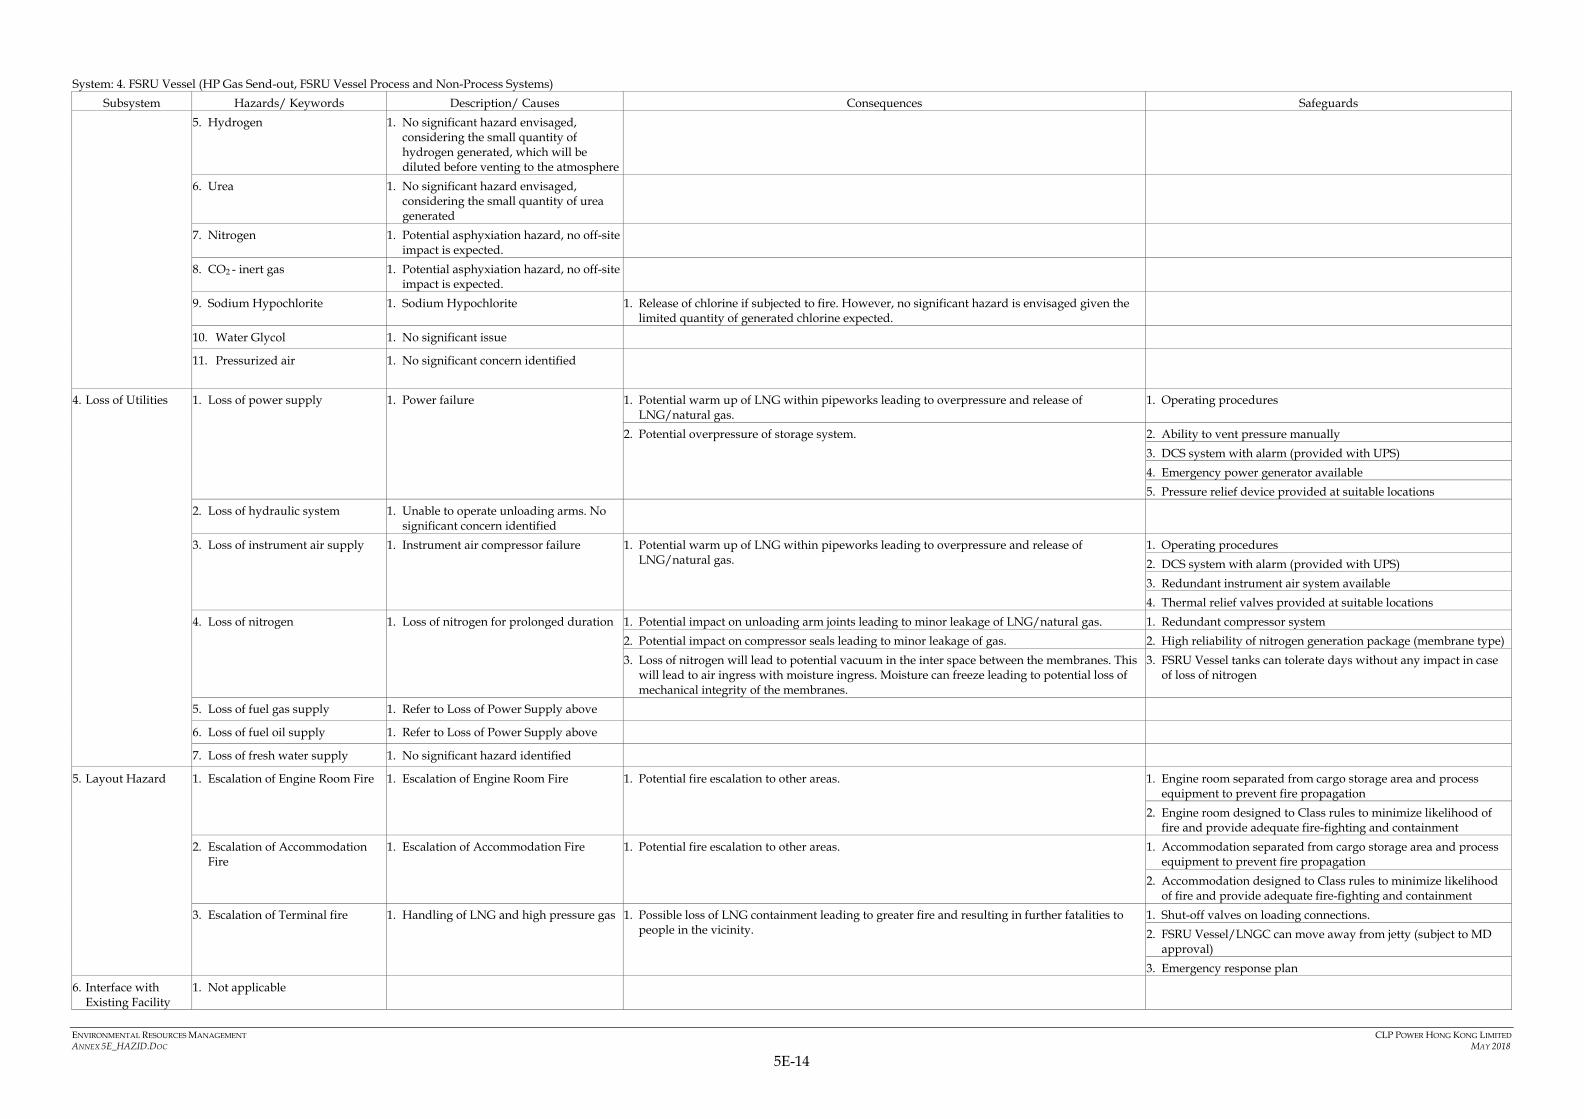
ENVIRONMENTAL RESOURCES MANAGEMENT CLP POWER HONG KONG LIMITED
ANNEX 5E_HAZID.DOC MAY 2018 5E-14
System: 4. FSRU Vessel (HP Gas Send-out, FSRU Vessel Process and Non-Process Systems)
Subsystem Hazards/ Keywords Description/ Causes Consequences Safeguards
5. Hydrogen
1. No significant hazard envisaged, considering the small quantity of hydrogen generated, which will be diluted before venting to the atmosphere
6. Urea
1. No significant hazard envisaged, considering the small quantity of urea generated
7. Nitrogen
1. Potential asphyxiation hazard, no off-site impact is expected.
8. CO2 - inert gas
1. Potential asphyxiation hazard, no off-site impact is expected.
9. Sodium Hypochlorite
1. Sodium Hypochlorite
1. Release of chlorine if subjected to fire. However, no significant hazard is envisaged given the limited quantity of generated chlorine expected.
10. Water Glycol
1. No significant issue
11. Pressurized air
1. No significant concern identified
4. Loss of Utilities
1. Loss of power supply
1. Power failure
1. Potential warm up of LNG within pipeworks leading to overpressure and release of LNG/natural gas.
1. Operating procedures
2. Potential overpressure of storage system.
2. Ability to vent pressure manually
3. DCS system with alarm (provided with UPS)
4. Emergency power generator available
5. Pressure relief device provided at suitable locations
2. Loss of hydraulic system
1. Unable to operate unloading arms. No significant concern identified
3. Loss of instrument air supply
1. Instrument air compressor failure
1. Potential warm up of LNG within pipeworks leading to overpressure and release of LNG/natural gas.
1. Operating procedures
2. DCS system with alarm (provided with UPS)
3. Redundant instrument air system available
4. Thermal relief valves provided at suitable locations
4. Loss of nitrogen
1. Loss of nitrogen for prolonged duration
1. Potential impact on unloading arm joints leading to minor leakage of LNG/natural gas.
1. Redundant compressor system
2. Potential impact on compressor seals leading to minor leakage of gas.
2. High reliability of nitrogen generation package (membrane type)
3. Loss of nitrogen will lead to potential vacuum in the inter space between the membranes. This will lead to air ingress with moisture ingress. Moisture can freeze leading to potential loss of mechanical integrity of the membranes.
3. FSRU Vessel tanks can tolerate days without any impact in case of loss of nitrogen
5. Loss of fuel gas supply
1. Refer to Loss of Power Supply above
6. Loss of fuel oil supply
1. Refer to Loss of Power Supply above
7. Loss of fresh water supply
1. No significant hazard identified
5. Layout Hazard
1. Escalation of Engine Room Fire
1. Escalation of Engine Room Fire
1. Potential fire escalation to other areas.
1. Engine room separated from cargo storage area and process equipment to prevent fire propagation
2. Engine room designed to Class rules to minimize likelihood of fire and provide adequate fire-fighting and containment
2. Escalation of Accommodation Fire
1. Escalation of Accommodation Fire
1. Potential fire escalation to other areas.
1. Accommodation separated from cargo storage area and process equipment to prevent fire propagation
2. Accommodation designed to Class rules to minimize likelihood of fire and provide adequate fire-fighting and containment
3. Escalation of Terminal fire
1. Handling of LNG and high pressure gas
1. Possible loss of LNG containment leading to greater fire and resulting in further fatalities to people in the vicinity.
1. Shut-off valves on loading connections.
2. FSRU Vessel/LNGC can move away from jetty (subject to MD approval)
3. Emergency response plan
6. Interface with Existing Facility
1. Not applicable

ENVIRONMENTAL RESOURCES MANAGEMENT CLP POWER HONG KONG LIMITED
ANNEX 5E_HAZID.DOC MAY 2018 5E-15
System: 5. Two Subsea Pipelines to BPPS & LPS
Subsystem Hazards/ Keywords Description/ Causes Consequences Safeguards
1. External Hazards
1. Aircraft crash
1. No significant concern identified
2. Helicopter crash
1. No significant concern identified
3. Anchor Drag/ Drop from third party vessels onto new pipelines
1. Emergency anchoring for vessel underway due to loss of steerage, power or control, either due to mechanical problems or due to collision events
1. Possibility of damage to external coating, damage to pipe requiring remedial action.
1. Engineered rock protection with respect to anchor size of different vessel types
2. Drag from anchorage areas
2. Potential loss of containment leading to natural gas release. Impact on passing vessels and shore population. Vessel involved in the incidents may sink due to loss of buoyancy cause by the gas bubbling.
2. Depth of cover
3. Disturbance to the rock cover protection. Possible exposure of the pipe.
3. Route avoiding anchorage areas
4. Concrete external coating
5. Marking marine charts of the pipeline route
4. Anchor Drag/ Drop from construction vessels near the landing point onto existing CLP pipelines
1. Emergency anchoring for vessel underway due to loss of steerage, power or control, either due to mechanical problems or due to collision events
1. Possibility of damage to external coating, damage to pipe requiring remedial action.
1. Engineered rock protection for existing pipelines with respect to anchor size of different vessel types
2. Drag from anchorage areas
2. Potential loss of containment leading to gas release. Impact on passing vessels and shore population. Vessel involved in the incidents may sink due to loss of buoyancy cause by the gas bubbling.
2. Proper anchoring procedures during construction
3. Disturbance to the rock cover protection. Possible exposure of the pipe.
3. Anchor position monitoring
4. Cofferdam near the shore to further protect the existing pipelines
5. Anchor Drag/ Drop from construction vessels near the landing point onto existing HKE pipelines
1. Emergency anchoring for vessel underway due to loss of steerage, power or control, either due to mechanical problems or due to collision events
1. Possibility of damage to external coating, damage to pipe requiring remedial action.
1. Engineered rock protection with respect to anchor size of different vessel types
2. Drag from anchorage areas
2. Potential loss of containment leading to natural gas release. Impact on passing vessels and shore population. Vessel involved in the incidents may sink due to loss of buoyancy cause by the gas bubbling.
2. Proper anchoring and construction procedures during construction
3. Disturbance to the rock cover protection. Possible exposure of the pipe.
3. Anchor position monitoring
4. Cofferdam near the shore to further protect the existing pipelines, or tie-in with existing pre-installed section of the pipe
6. Dropped Object
1. Refer to Anchor Drag/ Drop above. No other relevant dropped objects identified
7. Dumping
1. Dumping of construction waste and other bulk materials outside of designated dumping grounds
1. Minor surface damage.
1. Engineered rock protection with respect to anchor size of different vessel types
2. Depth of cover
3. Concrete external coating
8. Grounding
1. Navigation error, loss of control due to mechanical or adverse weather
1. Same as consequence 1,2 & 3 of anchor drag hazard.
1. Burial depth appropriate to the type of shipping activities based on Marine Department and CEDD guidelines
2. Displacement of the pipeline leading to exposure.
2. Pipeline is buried below the seabed with rock cover flush with seabed
9. Vessel Sinking
1. Vessel Sinking
1. Same as consequence 1, 2 & 3 of anchor drag hazard but less severe.
1. Depth of cover
2. Concrete external coating
3. Burial depth appropriate to the type of shipping activities based on Marine Department and CEDD guidelines
10. Fishing & Trawling
1. Operation of trawl board and other fishing/trawl gear
1. No damage to the pipeline.
1. Pipeline is buried below the seabed with rock cover flush with seabed
11. Dredging
1. Impact from dredge bucket or drag head
1. Same as consequence 1, 2 & 3 of anchor drag hazard but less severe.
1. Burial depth appropriate to the type of shipping activities based on Marine Department and CEDD guidelines
2. Engineered rock protection with respect to anchor size of different vessel types
3. Depth of cover

ENVIRONMENTAL RESOURCES MANAGEMENT CLP POWER HONG KONG LIMITED
ANNEX 5E_HAZID.DOC MAY 2018 5E-16
System: 5. Two Subsea Pipelines to BPPS & LPS
Subsystem Hazards/ Keywords Description/ Causes Consequences Safeguards
12. Service crossing or other services in the vicinity
1. Cable crossing - repair of cables potentially impacting pipeline
1. Potential loss of containment leading to natural gas release. Impact on passing vessels and shore population. Vessel involved in the incidents may sink due to loss of buoyancy cause by the gas bubbling.
1. Utility crossing agreement (between pipeline operator and utility supplier) ensures that there is an adequate mechanism to prevent damage to the pipelines in case of repair activities and the risk is acceptable
13. HV cables
1. No significant concern identified
14. Oil or chemical spills in the vicinity
1. No significant concern identified
2. Natural and Environmental Hazards
1. Scouring
1. Current and wave actions
1. Possible reduction of cover.
1. Pipeline is buried below the seabed with rock cover flush with seabed
2. Engineered rock cover
2. High wind and typhoon
1. No significant concern identified
3. Heavy rainfall and flooding
1. Not applicable
4. Fog with poor visibility
1. Not applicable
5. Lightning
1. No significant concern identified
6. Earthquakes
1. No significant concern identified considering the pipelines are located in low seismic activity area
7. Landslide
1. Not applicable
8. Subsidence/ movement
1. No significant concern identified
9. Tsunami
1. No significant concern identified
10. Seawater - seasonal variations in salinity and suspended solids
1. No significant concern identified
11. Tidal waves
1. No significant concern identified
3. Material Hazards
1. Internal corrosion
1. No issue for non corrosive, clean and dry gas
2. External corrosion
1. Sea-water; corrosive environment
1. Loss of wall thickness leading to potential leak.
1. Coating system
2. Sacrificial anode system
3. Designed for intelligent pigging
3. Pressure cycling
1. Pipeline pressure will vary with time of day, loads etc.
1. Metal fatigue leading to crack.
1. Design will consider pressure cycles
4. Material defect/ construction defect
1. Material defect/ construction defect
1. Possible leaks.
1. Quality control during manufacture and construction
4. Loss of Utilities
1. Loss of power supply
1. No concern identified
2. Loss of instrument air supply
1. No concern identified
3. Loss of nitrogen
1. No concern identified
4. Loss of fuel gas supply
1. No concern identified
5. Loss of diesel supply
1. No concern identified
5. Layout Hazard
1. Refer to Subsystem #1 - External Hazard above
6. Interface with Existing Facility
1. Refer to Subsystem #1 - External Hazard above
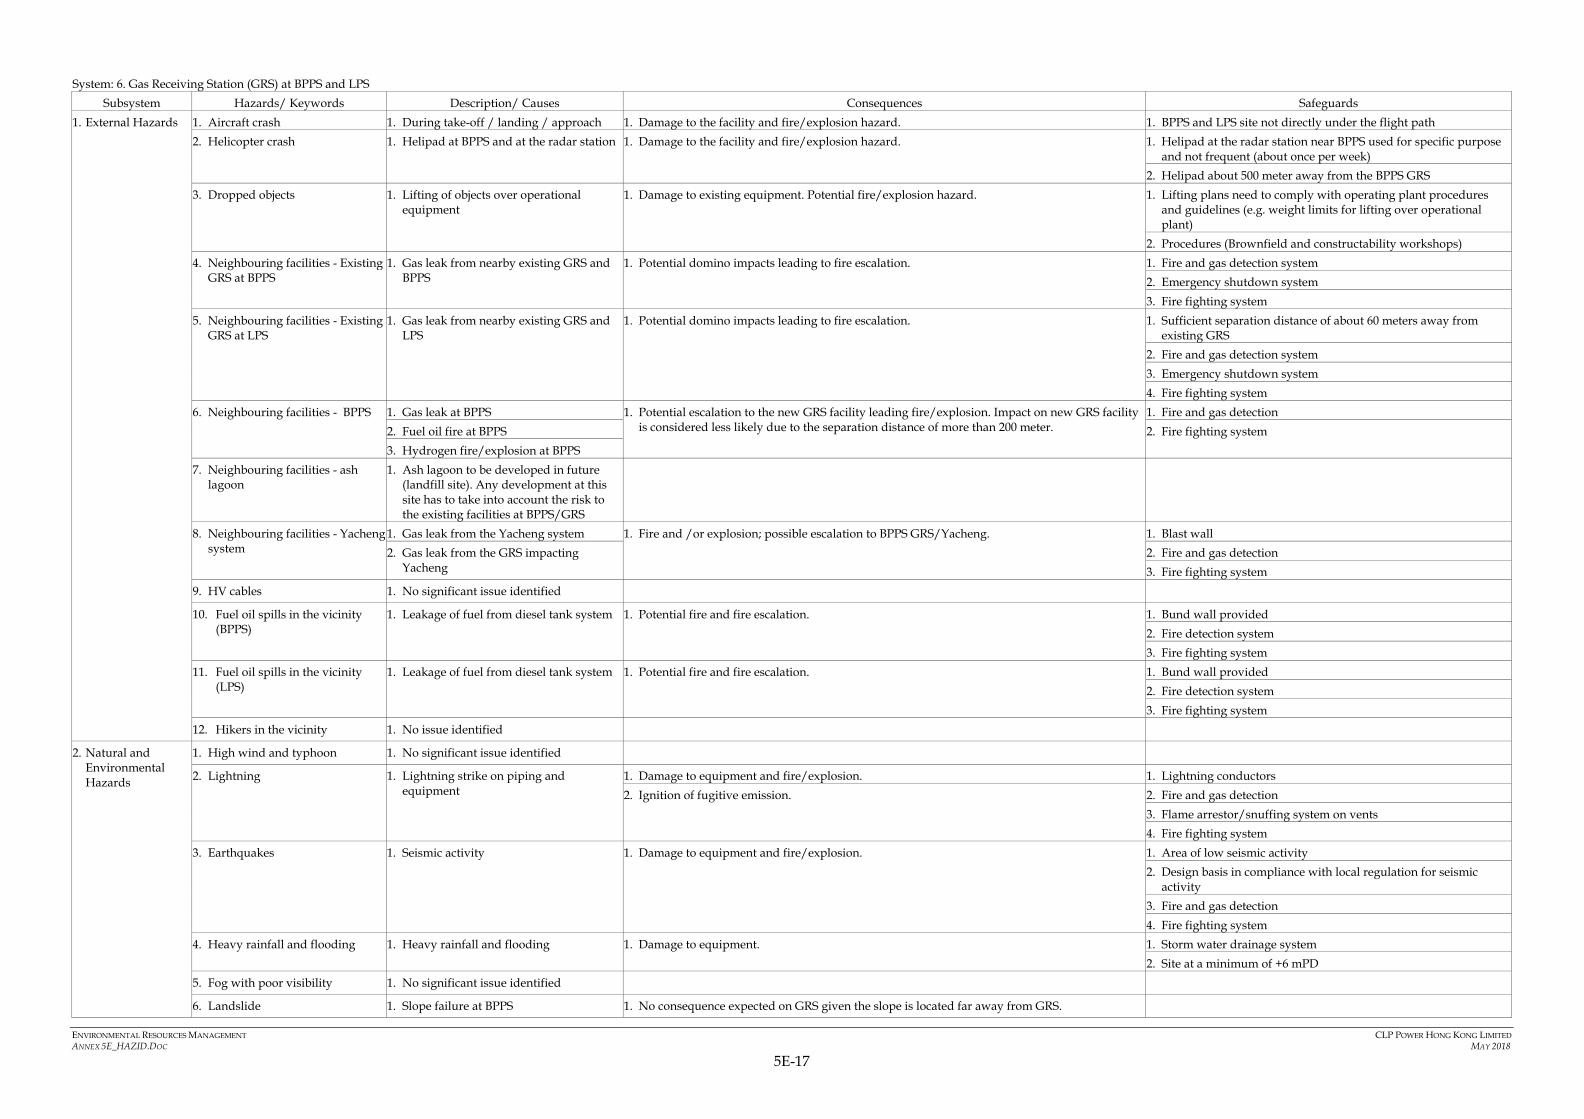
ENVIRONMENTAL RESOURCES MANAGEMENT CLP POWER HONG KONG LIMITED
ANNEX 5E_HAZID.DOC MAY 2018 5E-17
System: 6. Gas Receiving Station (GRS) at BPPS and LPS
Subsystem Hazards/ Keywords Description/ Causes Consequences Safeguards
1. External Hazards
1. Aircraft crash
1. During take-off / landing / approach
1. Damage to the facility and fire/explosion hazard.
1. BPPS and LPS site not directly under the flight path
2. Helicopter crash
1. Helipad at BPPS and at the radar station
1. Damage to the facility and fire/explosion hazard.
1. Helipad at the radar station near BPPS used for specific purpose and not frequent (about once per week)
2. Helipad about 500 meter away from the BPPS GRS
3. Dropped objects
1. Lifting of objects over operational equipment
1. Damage to existing equipment. Potential fire/explosion hazard.
1. Lifting plans need to comply with operating plant procedures and guidelines (e.g. weight limits for lifting over operational plant)
2. Procedures (Brownfield and constructability workshops)
4. Neighbouring facilities - Existing GRS at BPPS
1. Gas leak from nearby existing GRS and BPPS
1. Potential domino impacts leading to fire escalation.
1. Fire and gas detection system
2. Emergency shutdown system
3. Fire fighting system
5. Neighbouring facilities - Existing GRS at LPS
1. Gas leak from nearby existing GRS and LPS
1. Potential domino impacts leading to fire escalation.
1. Sufficient separation distance of about 60 meters away from existing GRS
2. Fire and gas detection system
3. Emergency shutdown system
4. Fire fighting system
6. Neighbouring facilities - BPPS
1. Gas leak at BPPS
1. Potential escalation to the new GRS facility leading fire/explosion. Impact on new GRS facility is considered less likely due to the separation distance of more than 200 meter.
1. Fire and gas detection
2. Fuel oil fire at BPPS
2. Fire fighting system
3. Hydrogen fire/explosion at BPPS
7. Neighbouring facilities - ash lagoon
1. Ash lagoon to be developed in future (landfill site). Any development at this site has to take into account the risk to the existing facilities at BPPS/GRS
8. Neighbouring facilities - Yacheng system
1. Gas leak from the Yacheng system
1. Fire and /or explosion; possible escalation to BPPS GRS/Yacheng.
1. Blast wall
2. Gas leak from the GRS impacting Yacheng
2. Fire and gas detection
3. Fire fighting system
9. HV cables
1. No significant issue identified
10. Fuel oil spills in the vicinity (BPPS)
1. Leakage of fuel from diesel tank system
1. Potential fire and fire escalation.
1. Bund wall provided
2. Fire detection system
3. Fire fighting system
11. Fuel oil spills in the vicinity (LPS)
1. Leakage of fuel from diesel tank system
1. Potential fire and fire escalation.
1. Bund wall provided
2. Fire detection system
3. Fire fighting system
12. Hikers in the vicinity
1. No issue identified
2. Natural and Environmental Hazards
1. High wind and typhoon
1. No significant issue identified
2. Lightning
1. Lightning strike on piping and equipment
1. Damage to equipment and fire/explosion.
1. Lightning conductors
2. Ignition of fugitive emission.
2. Fire and gas detection
3. Flame arrestor/snuffing system on vents
4. Fire fighting system
3. Earthquakes
1. Seismic activity
1. Damage to equipment and fire/explosion.
1. Area of low seismic activity
2. Design basis in compliance with local regulation for seismic activity
3. Fire and gas detection
4. Fire fighting system
4. Heavy rainfall and flooding
1. Heavy rainfall and flooding
1. Damage to equipment.
1. Storm water drainage system
2. Site at a minimum of +6 mPD
5. Fog with poor visibility
1. No significant issue identified
6. Landslide
1. Slope failure at BPPS
1. No consequence expected on GRS given the slope is located far away from GRS.

ENVIRONMENTAL RESOURCES MANAGEMENT CLP POWER HONG KONG LIMITED
ANNEX 5E_HAZID.DOC MAY 2018 5E-18
System: 6. Gas Receiving Station (GRS) at BPPS and LPS
Subsystem Hazards/ Keywords Description/ Causes Consequences Safeguards
7. Boulders
1. No significant issue identified
1. No consequence expected on GRS given the boulders are located far away from GRS.
8. Subsidence/ movement
1. Subsidence/ movement
1. Damage to equipment and fire/explosion.
1. Design basis in compliance with local regulation for subsidence
2. Fire and gas detection
3. Fire fighting system
9. Tsunami
1. Waves higher than predicted
1. Possible damage to structures / facilities due to high wave and associated flooding.
1. Black Point not susceptible to tsunami
2. LPS site not susceptible to tsunami
3. Site at a minimum of +6 mPD
10. Tidal waves
1. Same as Tsunami above
11. Seawater - seasonal variations in salinity and suspended solids
1. No significant issue identified
12. Hill fire
1. Hill fire
1. Potential fire escalation.
1. Vegetation control to prevent hill fire escalation
3. Material Hazards
1. Leak from tapings, flanges, valves and piping
1. Corrosion, mechanical failure, etc.
1. Potential loss of containment leading to fire/explosion.
1. Operating and maintenance procedures
2. Misoperation
2. Area classification
3. Maintenance error (including dropped object and pigging)
3. Fire and gas detection
4. Shutdown system
5. Fire fighting system
2. Fugitive emission
1. Leaks from seals / valves / analysers, operational losses
1. Environmental emission, potential ignition and fire
1. Well ventilated area
2. Area classification
3. Fire and gas detection
4. Fire fighting system
3. Overpressure downstream of letdown valve
1. Control valve malfunction
1. Potential overpressurization and loss of containment leading to fire/explosion.
1. Active/monitor and slam shut system
2. HIPPS provided
3. Fire and gas detection
4. Shutdown system
5. Fire fighting system
4. Pigging operations
1. PIG stuck in the pipeline
1. Operational interruption.
1. Operating procedures
2. Possible damage to facility.
2. Pigging is not a frequent operation, 1 in 5 years
5. Ignition of gases from vent / PSVs
1. Lightning strike
1. Fire/explosion.
1. Stack height will be determined based on thermal radiation threshold on adjoining equipment
2. Sparks / static / smoking
2. Potential thermal radiation effects on adjoining equipment.
2. Snuffing system
3. Area classification
4. Enforcement of protocol (no smoking on site)
5. All PSV releases are routed to vent stack
6. Metering section including Gas Analyzer
1. Regular discharge of small quantity of gas
1. Potential localized fire. No offsite consequence possible.
1. Area classification
2. Well ventilated area
3. Piping design vent to safe locations / vent header
4. Fire and gas detection
5. Fire fighting system
7. Calibration gas
1. Leakage
1. Potential localized fire. No offsite consequence possible.
8. Carrier gas
1. Leakage
1. Potential localized fire. No offsite consequence possible.
9. Nitrogen
1. No significant hazard identified
10. CO2
1. No significant hazard identified
11. Corrosion Inhibitor (minor quantity)
1. Use of corrosion inhibitor in BPPS GRS (water bath heater)
1. Potential localized fire. No offsite consequence possible.
12. Pressurized air
1. No significant hazard identified

ENVIRONMENTAL RESOURCES MANAGEMENT CLP POWER HONG KONG LIMITED
ANNEX 5E_HAZID.DOC MAY 2018 5E-19
System: 6. Gas Receiving Station (GRS) at BPPS and LPS
Subsystem Hazards/ Keywords Description/ Causes Consequences Safeguards
13. Dry chemical powders
1. No significant hazard identified
4. Loss of Utilities
1. Loss of Power supply
1. No significant concern identified, since all systems will revert to safe conditions.
2. Loss of Instrument air supply
1. No significant concern identified, since all systems will revert to safe conditions.
3. Loss of nitrogen
1. No significant hazard identified
4. Loss of fuel gas supply
1. No significant hazard identified
5. Loss of diesel supply
1. No significant hazard identified
6. Loss of fresh water supply
1. No significant hazard identified
5. Layout Hazard
1. Layout
1. No significant hazard identified.
6. Interface with Existing Facility
1. Tie-ins
1. Unplanned events during tie-in
1. Loss of containment leading to fire/explosion.
1. Procedures and emergency response plan (Brownfield and constructability review)
2. Access for installation / construction/ Brownfield activities/ General construction hazards
1. Possible interference with existing equipment
1. Damage to existing equipment. Potential leaks and fire/explosion.
1. Procedures (Brownfield and constructability review)
2. Permit to work, procedures need to comply with operating plant procedures and guidelines (e.g. weight limits for lifting over operational plant)
3. Construction safety plan (PPE, training, briefings, etc.)
3. Dropped objects
1. Lifting of objects over operational equipment
1. Damage to existing equipment. Potential fire/explosion.
1. Procedures (Brownfield and constructability review)
Annex 5F
Frequency Analysis

ENVIRONMENTAL RESOURCES MANAGEMENT CLP POWER HONG KONG LIMITED ANNEX 5F_FREQUENCY ANALYSIS.DOC JUNE 2018
5F-1
5F FREQUENCY ANALYSIS
This Annex summarises the frequency analysis as follows:
Section 5F.1 – Frequency Analysis for Marine Transit of the LNGC and FSRU Vessel to the LNG Terminal;
Section 5F.2 – Frequency Analysis for the LNG Terminal;
Section 5F.3 –Frequency Analysis for the Subsea Pipelines; and
Section 5F.4 –Frequency Analysis for the GRS at the BPPS and LPS.
5F.1 FREQUENCY ANALYSIS FOR MARINE TRANSIT OF THE LNGC AND FSRU VESSEL
TO THE LNG TERMINAL
5F.1.1 Ship Collision Frequency
The ship collision frequency analysis was conducted following the approach adopted under the previous EIA study that was approved by the EPD ( 1 ). DYMTRI (Dynamic Marine Traffic simulation) model (2) was adopted as the platform for the traffic simulation to predict the collision and grounding frequencies along the LNGC and FSRU Vessel transit route. The details of the ship collision frequency assessment are provided in the Marine Traffic Impact Assessment Report (2).
The key steps associated with the assessment, include:
Identification of Modelled Traffic – All vessel activity associated with ships with Length (LOA) greater than 75 m and transits within 2.5 km of the LNGC route were included in the marine traffic model that contains database of radar and AIS records collected during 2016. Traffic data were organized into a series of representative routes with a variety of ship classes;
Hazard Identification – The distribution of historical collision incidents was mapped for Hong Kong waters for a six (6) year period from 2008 to 2013;
Model Validation – The model was run for the 2016 traffic activity and the linkage between model output of “encounters” and historic collisions along the proposed route waterspace confirmed.
Traffic Forecasts – An extensive forecasting exercise was conducted based on various principal sources including Hong Kong, Mainland Port and ShenZhen West Port statistics data. The increase in traffic volume was
(1) ERM, EIA for Liquefied Natural Gas (LNG) Receiving Terminal and Associated Facilities (Register No.: AEIAR-106/2007),
December 2006.
(2) BMT Asia Pacific Limited, Hong Kong Offshore LNG Terminal Marine Impact Assessment, R.9331.08, Issue 1.

ENVIRONMENTAL RESOURCES MANAGEMENT CLP POWER HONG KONG LIMITED ANNEX 5F_FREQUENCY ANALYSIS.DOC JUNE 2018
5F-2
derived by trend analysis for each vessel class so that a representative pattern could be developed for the 2020 and 2030 timeframes ;
Scenario Development – A series of scenarios were developed to examine traffic activity at 2016 (baseline) and 2020 and 2030. The scenarios adopted for consequence examination were those that considered the initial operation of the terminal in 2020, and a span of traffic for 2030.
Collision Frequency Assessment – The DYMITRI model was run for all scenarios with the LNGC/ FSRU Vessel introduced into the simulation in order to ensure that transits were conducted across the full spectrum of daylight arrivals, and providing the LNGC/ FSRU Vessel the opportunity to interact with all ships within the traffic “mix”. The following data was output:
Anticipated collision location and timing; and
Vessel details, including route and vessel class identifier, vessel speed at point that avoidance maneuver is initiated, and vessel headings and encounter type (i.e. Overtaking, Crossing, or Headings).
The collision data was then processed and the encounter data was rationalized and the total collision frequency identified on a per transit basis, for each individual route segments.
Collision Energy Distribution – Having identified the collision frequency associated with the LNGC/ FSRU Vessel transit it was then necessary to characterize the collision energy associated with each encounter. The detailed data extracted for key scenarios took account of
The colliding vessel’s displacement (assuming an upper-bound envelope of vessel size);
The potential for the vessels to collide at a series of angles deviated from the initial encounter angle;
Impact energy absorbed by the colliding vessel during collision with the double hulled LNGC/ FSRU Vessel;
Nominal reduction in speed by the colliding vessel prior to impact; and
Perpendicular penetration energy component into the LNGC/FSRU Vessel hull.
The total collision frequencies leading to breach of LNG containment (1) are provided in Table 5F.1, Table 5F.2 and Table 5F.3.
(1) BMT Asia Pacific Limited, Hong Kong Offshore LNG Terminal Marine Impact Assessment, R.9331.08, Issue 1.
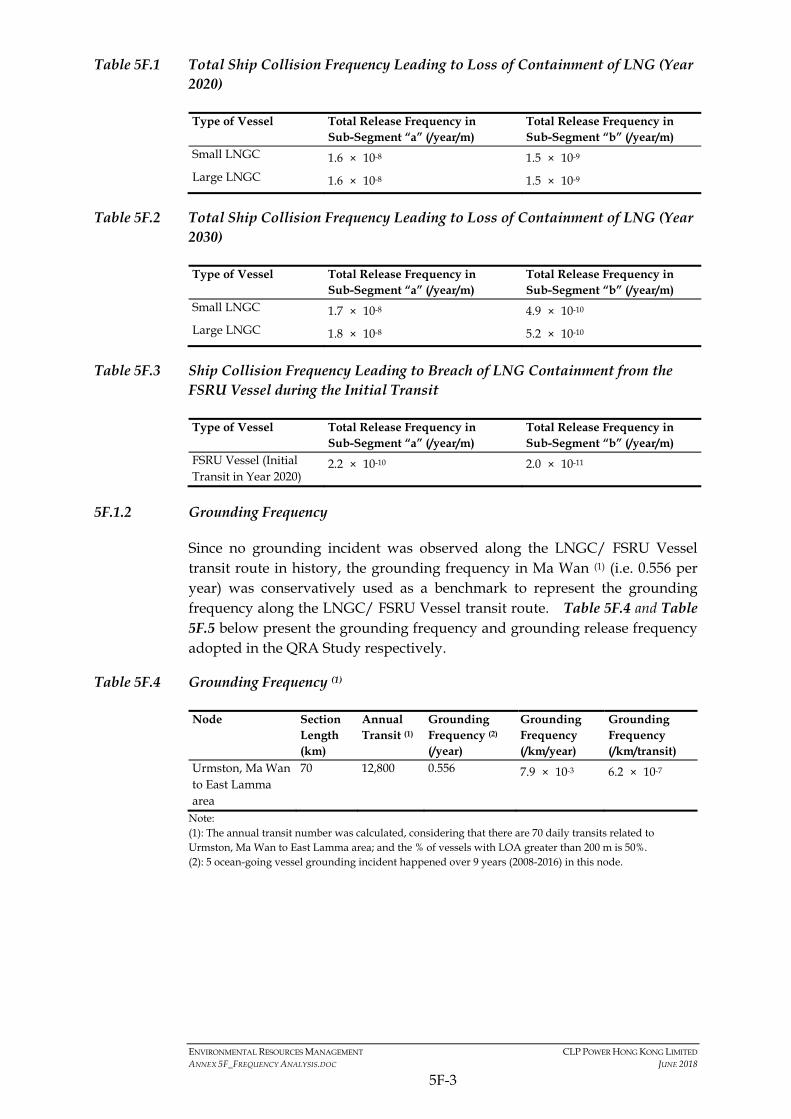
ENVIRONMENTAL RESOURCES MANAGEMENT CLP POWER HONG KONG LIMITED ANNEX 5F_FREQUENCY ANALYSIS.DOC JUNE 2018
5F-3
Table 5F.1 Total Ship Collision Frequency Leading to Loss of Containment of LNG (Year 2020)
Type of Vessel Total Release Frequency in Sub-Segment “a” (/year/m)
Total Release Frequency in Sub-Segment “b” (/year/m)
Small LNGC 1.6 × 10⁻⁸ 1.5 × 10⁻⁹
Large LNGC 1.6 × 10⁻⁸ 1.5 × 10⁻⁹
Table 5F.2 Total Ship Collision Frequency Leading to Loss of Containment of LNG (Year 2030)
Type of Vessel Total Release Frequency in Sub-Segment “a” (/year/m)
Total Release Frequency in Sub-Segment “b” (/year/m)
Small LNGC 1.7 × 10⁻⁸ 4.9 × 10⁻¹⁰
Large LNGC 1.8 × 10⁻⁸ 5.2 × 10⁻¹⁰
Table 5F.3 Ship Collision Frequency Leading to Breach of LNG Containment from the FSRU Vessel during the Initial Transit
Type of Vessel Total Release Frequency in Sub-Segment “a” (/year/m)
Total Release Frequency in Sub-Segment “b” (/year/m)
FSRU Vessel (Initial Transit in Year 2020)
2.2 × 10⁻¹⁰ 2.0 × 10⁻¹¹
5F.1.2 Grounding Frequency
Since no grounding incident was observed along the LNGC/ FSRU Vessel transit route in history, the grounding frequency in Ma Wan (1) (i.e. 0.556 per year) was conservatively used as a benchmark to represent the grounding frequency along the LNGC/ FSRU Vessel transit route. Table 5F.4 and Table 5F.5 below present the grounding frequency and grounding release frequency adopted in the QRA Study respectively.
Table 5F.4 Grounding Frequency (1)
Node Section Length (km)
Annual Transit (1)
Grounding Frequency (2) (/year)
Grounding Frequency (/km/year)
Grounding Frequency (/km/transit)
Urmston, Ma Wan to East Lamma area
70 12,800 0.556 7.9 × 10⁻³ 6.2 × 10⁻⁷
Note: (1): The annual transit number was calculated, considering that there are 70 daily transits related to Urmston, Ma Wan to East Lamma area; and the % of vessels with LOA greater than 200 m is 50%. (2): 5 ocean-going vessel grounding incident happened over 9 years (2008-2016) in this node.

ENVIRONMENTAL RESOURCES MANAGEMENT CLP POWER HONG KONG LIMITED ANNEX 5F_FREQUENCY ANALYSIS.DOC JUNE 2018
5F-4
Table 5F.5 Grounding Release Frequency for LNGC and FSRU Vessel Type of Vessel Grounding
Frequency (/km/transit)
LNG Transits (/year)
Grounding Frequency (/km/year)
Grounding Release Frequency (1) (/km/year)
Small/ Large LNGC
6.2 × 10⁻⁷ 75 4.7 × 10⁻⁵ 1.2 × 10⁻⁶
Note: (1): A conditional probability of 0.025 was applied to calculate the LNG release frequency upon grounding events, as per the approved EIA Report.
The initial transit of the FSRU vessel to the LNG Terminal was also considered
in the QRA Study. The associated grounding frequency was adopted as 6.2 × 10⁻⁷ per km along the transit route.
5F.1.3 Ignition Probability
As per the previous EIA Report that was approved by the EPD (1), the immediate ignition probability for the collision scenarios was selected as 0.8; and the immediate ignition probability for the grounding scenarios was selected as 0.2 for the QRA Study.
5F.1.4 Event Tree Analysis
The LNG release frequencies upon ship collision and grounding events were calculated as illustrated in the above section. An event tree analysis, as shown in Figure 5F.1, was then conducted to calculate the hazardous scenario frequency with consideration of the ignition probability, as shown in Table 5F.6 to Table 5F.8.
Table 5F.6 Hazardous Scenario Frequency due to Collision Events (Year 2020)
Type of Vessel
Hole Size Hazardous Scenario Frequency in Sub-Segment “a” (/year/m)
Hazardous Scenario Frequency in Sub-Segment “b” (/year/m)
Pool Fire Flash Fire Pool Fire Flash Fire Small LNGC Small 3.3 × 10⁻¹² 4.1 × 10⁻¹³ 1.1 × 10⁻¹⁰ 1.4 × 10⁻¹¹
Small LNGC Medium 3.3 × 10⁻⁹ 4.1 × 10⁻¹⁰ 2.2 × 10⁻¹⁰ 2.8 × 10⁻¹¹
Small LNGC Large 5.2 × 10⁻⁹ 6.5 × 10⁻¹⁰ 4.6 × 10⁻¹⁰ 5.8 × 10⁻¹¹
Large LNGC Small 1.6 × 10⁻¹² 2.0 × 10⁻¹³ 5.4 × 10⁻¹³ 6.8 × 10⁻¹⁴
Large LNGC Medium 8.5 × 10⁻¹¹ 1.1 × 10⁻¹¹ 4.2 × 10⁻¹⁰ 4.2 × 10⁻¹¹
Large LNGC Large 8.4 × 10⁻⁹ 1.0 × 10⁻⁹ 5.8 × 10⁻¹⁰ 5.8 × 10⁻¹¹
FSRU Vessel* Small 2.2 × 10⁻¹⁴ 2.7 × 10⁻¹⁵ 7.2 × 10⁻¹⁵ 9.0 × 10⁻¹⁶
FSRU Vessel* Medium 1.1 × 10⁻¹² 1.4 × 10⁻¹³ 4.4 × 10⁻¹² 5.6 × 10⁻¹³
FSRU Vessel* Large 1.1 × 10⁻¹⁰ 1.4 × 10⁻¹¹ 6.2 × 10⁻¹² 7.7 × 10⁻¹³
*Note: The initial transit of FSRU Vessel to the LNG Terminal was considered.

ENVIRONMENTAL RESOURCES MANAGEMENT CLP POWER HONG KONG LIMITED ANNEX 5F_FREQUENCY ANALYSIS.DOC JUNE 2018
5F-5
Table 5F.7 Hazardous Scenario Frequency due to Collision Events (Year 2030)
Type of Vessel
Hole Size Hazardous Scenario Frequency in Sub-Segment “a” (/year/m)
Hazardous Scenario Frequency in Sub-Segment “b” (/year/m)
Pool Fire Flash Fire Pool Fire Flash Fire Small LNGC Small 1.0 × 10⁻¹⁰ 2.5 × 10⁻¹¹ 1.5 × 10⁻¹¹ 3.7 × 10⁻¹²
Small LNGC Medium 5.2 × 10⁻¹⁰ 1.3 × 10⁻¹⁰ 1.2 × 10⁻¹⁰ 2.9 × 10⁻¹¹
Small LNGC Large 8.4 × 10⁻⁹ 2.1 × 10⁻⁹ 1.3 × 10⁻¹⁰ 3.1 × 10⁻¹¹
Large LNGC Small 1.4× 10⁻¹⁰ 1.7 × 10⁻¹¹ 1.5 × 10⁻¹¹ 3.7 × 10⁻¹²
Large LNGC Medium 3.7 × 10⁻¹⁰ 4.6 × 10⁻¹¹ 1.3 × 10⁻¹⁰ 3.3 × 10⁻¹¹
Large LNGC Large 8.7 × 10⁻⁹ 1.1 × 10⁻⁹ 1.3 × 10⁻¹⁰ 3.2 × 10⁻¹¹
Table 5F.8 Hazardous Scenario Frequency due to Grounding Events
Type of Vessel Hole Size Hazardous Scenario Frequency (/year/m) Pool Fire Flash Fire Small/ Large LNGC Small 9.3 × 10⁻⁷ 1.2 × 10⁻⁷
5F.2 FREQUENCY ANALYSIS FOR THE LNG TERMINAL
5F.2.1 Release Frequency Database
Historical database from the International Association of Oil and Gas Producers (OGP) (1) was adopted in the QRA Study for estimating the release frequency of hazardous scenarios in the LNG Terminal. The primary source of OGP data is the Hydrocarbon Release Database (HCRD) form UK HSE, which is based on approximately 4,000 recorded leaks recorded between October 1992 and March 2010 from UK section of the North Sea. Considering that the LNG Terminal is located in an offshore environment in Hong Kong, this database was considered adequate for the purpose of the QRA Study. The release frequencies of various equipment items are summarised in Table 5F.9.
For the unloading arm sections, the associated failure frequency suggested by UK HSE (2) was adopted. The following causes of unloading arm failure have been taken into account in the failure frequency:
Connection failures (arm and coupler);
Operator error;
Mooring fault; and
Impact from passing ships.
(1) OGP, Risk Assessment Data Directly, Report No. 434-.1, March 2010.
(2) UK HSE, Failure Rate and Event Data for use within Risk Assessment, 28 June 2012.

ENVIRONMENTAL RESOURCES MANAGEMENT CLP POWER HONG KONG LIMITED ANNEX 5F_FREQUENCY ANALYSIS.DOC JUNE 2018
5F-6
Table 5F.9 Release Frequency
Equipment Release Scenario
Release Phase
Release Frequency
Unit Reference
Piping 2” to 6” 10 mm hole Liquid/ Gas 3.45E-05 per metre per year
OGP
25 mm hole Liquid/ Gas 2.70E-06 per metre per year
OGP
50 mm hole Liquid/ Gas 6.00E-07 per metre per year
OGP
Piping 8” to 12” 10 mm hole Liquid/ Gas 3.06E-05 per metre per year
OGP
25 mm hole Liquid/ Gas 2.40E-06 per metre per year
OGP
50 mm hole Liquid/ Gas 3.70E-07 per metre per year
OGP
>150 mm hole
Liquid/ Gas 1.70E-07 per metre per year
OGP
Piping 14” to 18”
10 mm hole Liquid/ Gas 3.05E-05 per metre per year
OGP
25 mm hole Liquid/ Gas 2.40E-06 per metre per year
OGP
50 mm hole Liquid/ Gas 3.60E-07 per metre per year
OGP
>150 mm hole
Liquid/ Gas 1.70E-07 per metre per year
OGP
Piping 20” to 24”
10 mm hole Liquid/ Gas 3.04E-05 per metre per year
OGP
25 mm hole Liquid/ Gas 2.40E-06 per metre per year
OGP
50 mm hole Liquid/ Gas 3.60E-07 per metre per year
OGP
>150 mm hole
Liquid/ Gas 1.60E-07 per metre per year
OGP
Piping 26” to 48”
10 mm hole Liquid/ Gas 3.04E-05 per metre per year
OGP
25 mm hole Liquid/ Gas 2.30E-06 per metre per year
OGP
50 mm hole Liquid/ Gas 3.60E-07 per metre per year
OGP
>150 mm hole
Liquid/ Gas 1.60E-07 per metre per year
OGP
Pressure Vessel - Large Connection (> 6”)
10 mm hole Liquid/ Gas 5.90E-04 per year OGP 25 mm hole Liquid/ Gas 1.00E-04 per year OGP 50 mm hole Liquid/ Gas 2.70E-05 per year OGP >150 mm hole
Liquid/ Gas 2.40E-05 per year OGP
Pump Centrifugal - Small Connection (up to 6”)
10 mm hole Liquid 4.40E-03 per year OGP 25 mm hole Liquid 2.90E-04 per year OGP 50 mm hole Liquid 5.40E-05 per year OGP
Pump Centrifugal - Large Connection (> 6”)
10 mm hole Liquid 4.40E-03 per year OGP 25 mm hole Liquid 2.90E-04 per year OGP 50 mm hole Liquid 3.90E-05 per year OGP >150 mm hole
Liquid 1.50E-05 per year OGP
Compressor Reciprocating -
10 mm hole Gas 3.22E-02 per year OGP 25 mm hole Gas 2.60E-03 per year OGP
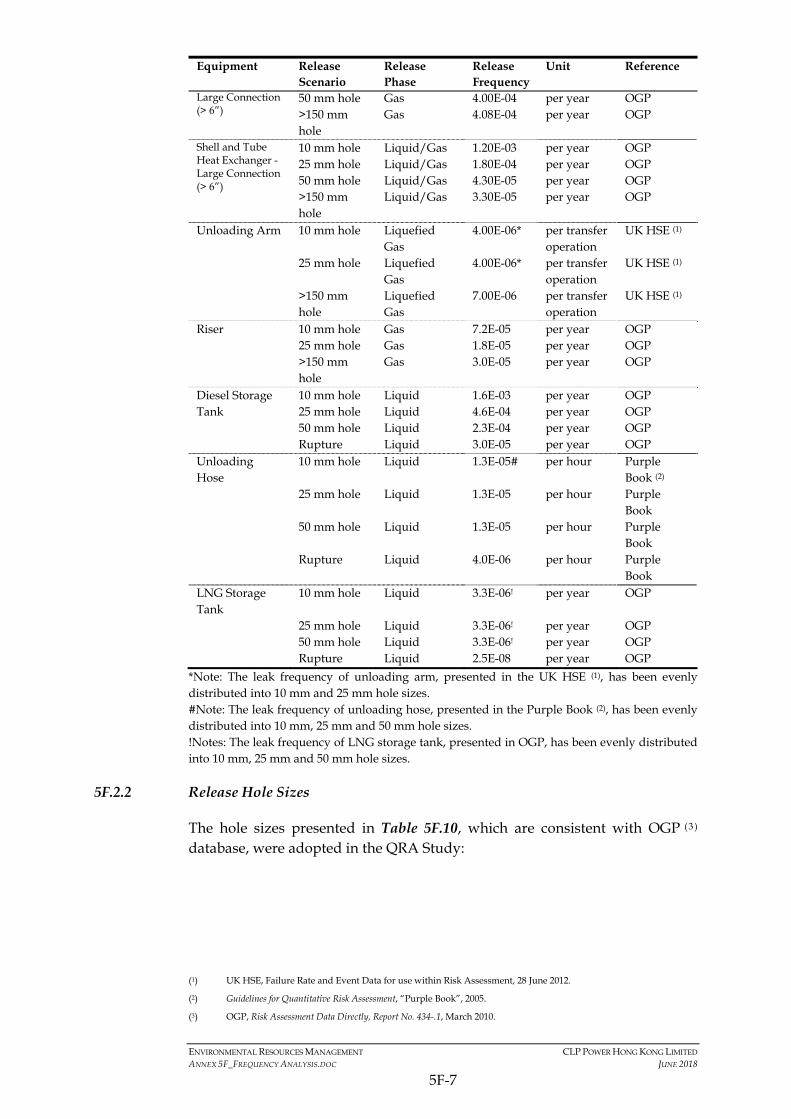
ENVIRONMENTAL RESOURCES MANAGEMENT CLP POWER HONG KONG LIMITED ANNEX 5F_FREQUENCY ANALYSIS.DOC JUNE 2018
5F-7
Equipment Release Scenario
Release Phase
Release Frequency
Unit Reference
Large Connection (> 6”)
50 mm hole Gas 4.00E-04 per year OGP >150 mm hole
Gas 4.08E-04 per year OGP
Shell and Tube Heat Exchanger - Large Connection (> 6”)
10 mm hole Liquid/Gas 1.20E-03 per year OGP 25 mm hole Liquid/Gas 1.80E-04 per year OGP 50 mm hole Liquid/Gas 4.30E-05 per year OGP >150 mm hole
Liquid/Gas 3.30E-05 per year OGP
Unloading Arm 10 mm hole Liquefied Gas
4.00E-06* per transfer operation
UK HSE (1)
25 mm hole Liquefied Gas
4.00E-06* per transfer operation
UK HSE (1)
>150 mm hole
Liquefied Gas
7.00E-06 per transfer operation
UK HSE (1)
Riser 10 mm hole Gas 7.2E-05 per year OGP 25 mm hole Gas 1.8E-05 per year OGP >150 mm
hole Gas 3.0E-05 per year OGP
Diesel Storage Tank
10 mm hole Liquid 1.6E-03 per year OGP 25 mm hole Liquid 4.6E-04 per year OGP 50 mm hole Liquid 2.3E-04 per year OGP Rupture Liquid 3.0E-05 per year OGP
Unloading Hose
10 mm hole Liquid 1.3E-05# per hour Purple Book (2)
25 mm hole Liquid 1.3E-05 per hour Purple Book
50 mm hole Liquid 1.3E-05 per hour Purple Book
Rupture Liquid 4.0E-06 per hour Purple Book
LNG Storage Tank
10 mm hole Liquid 3.3E-06! per year OGP
25 mm hole Liquid 3.3E-06! per year OGP 50 mm hole Liquid 3.3E-06! per year OGP Rupture Liquid 2.5E-08 per year OGP
*Note: The leak frequency of unloading arm, presented in the UK HSE (1), has been evenly distributed into 10 mm and 25 mm hole sizes. #Note: The leak frequency of unloading hose, presented in the Purple Book (2), has been evenly distributed into 10 mm, 25 mm and 50 mm hole sizes. !Notes: The leak frequency of LNG storage tank, presented in OGP, has been evenly distributed into 10 mm, 25 mm and 50 mm hole sizes.
5F.2.2 Release Hole Sizes
The hole sizes presented in Table 5F.10, which are consistent with OGP (3 ) database, were adopted in the QRA Study:
(1) UK HSE, Failure Rate and Event Data for use within Risk Assessment, 28 June 2012.
(2) Guidelines for Quantitative Risk Assessment, “Purple Book”, 2005.
(3) OGP, Risk Assessment Data Directly, Report No. 434-.1, March 2010.

ENVIRONMENTAL RESOURCES MANAGEMENT CLP POWER HONG KONG LIMITED ANNEX 5F_FREQUENCY ANALYSIS.DOC JUNE 2018
5F-8
Table 5F.10 Hole Sizes Considered in the QRA Study for The LNG Terminal
Leak Description Hole Size Very Small Leak 10 mm Small Leak 25 mm Medium Leak 50 mm Rupture >150 mm
5F.2.3 Flammable Gas Detection and Emergency Shutdown Probability
With reference to Purple Book ( 1 ), the effect of blocking valve system is determined by various factors, such as the position of gas detection monitors and the distribution thereof over the various wind directions, the direction limit of the detection system, the system reaction time and the intervention time of an operator. The probability of failure on demand of the system as a whole is 0.01 per demand.
Considering that the FSRU vessel and the Jetty are provided with gas detection system and automatic emergency shutdown system, the probability of executing the isolation successfully when required was selected as 99% in the QRA Study.
5F.2.4 Ignition Probability
The immediate ignition was estimated based on offshore ignition scenarios No. 24 from OGP Ignition Probability Database (2).
For flammable liquids with flash point of 55 C or higher (e.g. diesel, fuel oil etc.), a modification factor of 0.1 was applied to reduce the ignition probability as suggested in OGP (2).
The delayed ignition for various ignition sources was referred from Appendix 4.A of the Purple Book (1).
5F.2.5 Vapour Cloud Explosion (VCE) Probability
The explosion probability given an ignition was taken from Cox, Lees and Ang model (3), as shown in Table 5F.11. VCE occurs upon a delayed ignition from a flammable gas release at a congested area. Details of the identified congested area and congestion volume are provided in Annex 5G.
Table 5F.11 Probability of Explosion
Leak Size (Release Rate) Explosion Probability Minor (< 1 kg s-1) 0.04 Major (1 – 50 kg s-1) 0.12 Massive (> 50 kg s-1) 0.30
(1) Guidelines for Quantitative Risk Assessment, “Purple Book”, 2005.
(2) OGP, Risk Assessment Data Directly, Report No. 434-6.1, March 2010.
(3) Cox, Lees and Ang, Classification of Hazardous Locations, IChemE.

ENVIRONMENTAL RESOURCES MANAGEMENT CLP POWER HONG KONG LIMITED ANNEX 5F_FREQUENCY ANALYSIS.DOC JUNE 2018
5F-9
5F.2.6 Escalation
If neighbouring equipment and piping is within range of the flame zone of a fire event, an escalation probability of 1/6 (1) (2) has been taken to conservatively estimate the directional probability and chance of impingement if applicable. Escalation has been assumed to cause a full bore rupture of the affected equipment and piping only.
5F.2.7 Event Tree Analysis
An event tree analysis was performed to model the development of each hazardous scenario (jet fire, pool fire, flash fire, fireball and VCE) from an initial release scenario. The event tree analysis was considered whether there is immediate ignition, delayed ignition or no ignition, with consideration of the associated ignition probability as discussed above.
The generic event tree diagrams for the LNG release, natural gas and diesel release on the FSRU Vessel and the Jetty are illustrated from Figure 5F.2 to Figure 5F.4 respectively. The full list of event tree diagrams for identified hazardous sections of the LNG Terminal are summarised in Annex 5F-1.
The hazardous event frequency is summarised in Table 5F.12 and Table 5F.13.
(1) ERM, EIA for Liquefied Natural Gas (LNG) Receiving Terminal and Associated Facilities (Register No.: AEIAR-106/2007),
December 2006.
(2) ERM, EIA for Black Point Gas Supply Project (Register No.: AEIAR-150/2010), February 2010.

ENVIRONMENTAL RESOURCES MANAGEMENT CLP POWER HONG KONG LIMITED ANNEX 5F_FREQUENCY ANALYSIS.DOC JUNE 2018
5F-10
Table 5F.12 Hazardous Event Frequency: QRA Study for the LNG Terminal (Isolation Success Case)
Hazardous Section Leak Size (mm) Release Frequency * (per year)
Hazardous Event Frequency (per year)
Jet Fire Pool Fire Flash Fire Vapour Cloud Explosion Fireball HKOLNGT_01 10 2.98E-03 1.93E-06 - 1.85E-06 7.72E-08 -
25 1.25E-03 7.14E-06 - 6.29E-06 8.57E-07 -
50 2.22E-05 6.86E-07 - 6.04E-07 8.23E-08 -
150 1.82E-03 - 1.37E-04 9.57E-05 4.10E-05 -
HKOLNGT_03 10 9.67E-03 7.36E-06 7.36E-06 6.47E-06 8.83E-07 -
25 8.12E-04 5.71E-06 5.71E-06 5.02E-06 6.85E-07 -
50 1.37E-04 5.17E-06 5.17E-06 4.55E-06 6.20E-07 -
150 7.43E-05 - 5.57E-06 3.90E-06 1.67E-06 -
HKOLNGT_04 10 2.42E-02 8.41E-05 - 7.40E-05 1.01E-05 -
25 1.63E-03 5.22E-05 - 4.60E-05 6.27E-06 -
50 2.22E-04 1.67E-05 - 1.17E-05 5.00E-06 -
150 8.77E-05 6.58E-06 - 4.60E-06 1.97E-06 -
HKOLNGT_05 10 1.69E-02 1.45E-05 - 1.28E-05 1.74E-06 -
25 1.66E-03 1.32E-05 - 1.16E-05 1.59E-06 -
50 3.17E-04 1.35E-05 - 1.19E-05 1.63E-06 -
150 1.98E-04 - - 1.04E-05 4.46E-06 1.49E-05
HKOLNGT_06 10 1.15E-02 6.48E-05 - 5.70E-05 7.78E-06 -
25 5.96E-03 4.55E-05 - 4.01E-05 5.73E-06 -
50 7.33E-05 3.01E-06 - 2.65E-06 3.61E-07 -
150 9.10E-03 - - 4.78E-04 2.05E-04 6.83E-04
HKOLNGT_07 10 8.11E-03 6.69E-06 - 5.89E-06 8.03E-07 -
25 6.05E-04 4.62E-06 - 4.06E-06 5.54E-07 -
50 9.33E-05 3.83E-06 - 3.37E-06 4.60E-07 -

ENVIRONMENTAL RESOURCES MANAGEMENT CLP POWER HONG KONG LIMITED ANNEX 5F_FREQUENCY ANALYSIS.DOC JUNE 2018
5F-11
Hazardous Section Leak Size (mm) Release Frequency * (per year)
Hazardous Event Frequency (per year)
Jet Fire Pool Fire Flash Fire Vapour Cloud Explosion Fireball 150 4.08E-05 - - 2.14E-06 9.18E-07 3.06E-06
HKOLNGT_08 10 7.13E-05 5.88E-08 - 5.18E-08 7.06E-09 -
25 1.78E-05 1.36E-07 - 1.20E-07 1.63E-08 -
150 2.97E-05 - - 1.56E-06 6.68E-07 2.23E-06
HKOLNGT_10 10 8.11E-03 6.69E-06 - 5.89E-06 8.03E-07 -
25 6.22E-04 4.75E-06 - 4.18E-06 5.70E-07 -
50 9.33E-05 3.83E-06 - 3.37E-06 4.60E-07 -
150 4.08E-05 - - 2.14E-06 9.18E-07 3.06E-06
HKOLNGT_11 10 7.13E-05 5.88E-08 - 5.18E-08 7.06E-09 -
25 1.78E-05 1.36E-07 - 1.20E-07 1.63E-08 -
150 2.97E-05 - - 1.56E-06 6.68E-07 2.23E-06
HKOLNGT_13 10 8.13E-03 6.18E-06 6.18E-06 5.44E-06 7.42E-07 -
25 6.42E-04 4.51E-06 4.51E-06 3.97E-06 5.41E-07 -
50 9.62E-05 3.64E-06 3.64E-06 3.20E-06 4.37E-07 -
150 4.28E-05 - 3.21E-06 2.25E-06 9.62E-07 -
HKOLNGT_14 10 3.92E-03 2.13E-06 - 2.04E-06 8.51E-08 -
25 3.92E-04 2.43E-07 - 2.33E-07 9.73E-09 -
50 9.01E-05 1.44E-07 - 1.26E-07 1.72E-08 -
150 3.27E-05 7.49E-07 - 6.59E-07 8.99E-08 -
HKOLNGT_15 10 8.13E-03 4.06E-06 - 3.90E-06 1.63E-07 -
25 6.42E-04 3.57E-07 - 3.43E-07 1.43E-08 -
50 9.62E-05 5.92E-08 - 5.68E-08 2.37E-09 -
150 4.28E-05 1.60E-07 - 1.41E-07 1.92E-08 -
HKOLNGT_16 10 6.46E-03 3.51E-06 - 3.37E-06 1.40E-07 -
25 3.19E-04 1.98E-07 - 1.90E-07 7.90E-09 -

ENVIRONMENTAL RESOURCES MANAGEMENT CLP POWER HONG KONG LIMITED ANNEX 5F_FREQUENCY ANALYSIS.DOC JUNE 2018
5F-12
Hazardous Section Leak Size (mm) Release Frequency * (per year)
Hazardous Event Frequency (per year)
Jet Fire Pool Fire Flash Fire Vapour Cloud Explosion Fireball 50 3.92E-05 6.17E-08 - 5.43E-08 7.41E-09 -
150 1.59E-05 3.61E-07 - 3.18E-07 4.34E-08 -
HKOLNGT_17 10 2.42E-03 1.33E-06 - 1.28E-06 5.32E-08 -
25 1.90E-04 1.19E-07 - 1.14E-07 4.77E-09 -
50 2.93E-05 5.57E-08 - 4.90E-08 6.69E-09 -
150 1.35E-05 3.69E-07 - 3.24E-07 4.42E-08 -
HKOLNGT_18 10 8.76E-03 4.81E-06 4.81E-06 4.62E-06 1.92E-07 -
25 7.41E-04 4.64E-07 4.64E-07 4.46E-07 1.86E-08 -
50 1.26E-04 2.39E-07 2.39E-07 2.10E-07 2.87E-08 -
150 6.92E-05 - 5.19E-06 3.63E-06 1.56E-06 -
HKOLNGT_19 10 2.41E-03 1.20E-06 - 1.16E-06 4.82E-08 -
25 1.90E-04 1.06E-07 - 1.02E-07 4.23E-09 -
50 2.85E-05 1.75E-08 - 1.68E-08 7.02E-10 -
150 1.27E-05 4.75E-08 - 4.18E-08 5.70E-09 -
HKOLNGT_20 10 2.36E-03 1.21E-06 - 1.16E-06 4.83E-08 -
25 6.92E-04 4.05E-07 - 3.89E-07 1.62E-08 -
50 2.14E-05 1.38E-08 - 1.33E-08 5.54E-10 -
150 9.16E-04 8.05E-06 - 7.08E-06 9.66E-07 -
HKOLNGT_21 10 2.36E-03 1.21E-06 - 1.16E-06 4.83E-08 -
25 6.92E-04 4.05E-07 - 3.89E-07 1.62E-08 -
50 2.14E-05 1.38E-08 - 1.33E-08 5.54E-10 -
150 9.16E-04 8.05E-06 - 7.08E-06 9.66E-07 -
HKOLNGT_22 10 2.73E-03 1.48E-06 - 1.42E-06 5.93E-08 -
25 2.14E-04 1.33E-07 - 1.27E-07 5.30E-09 -
50 4.75E-05 7.57E-08 - 6.66E-08 9.09E-09 -
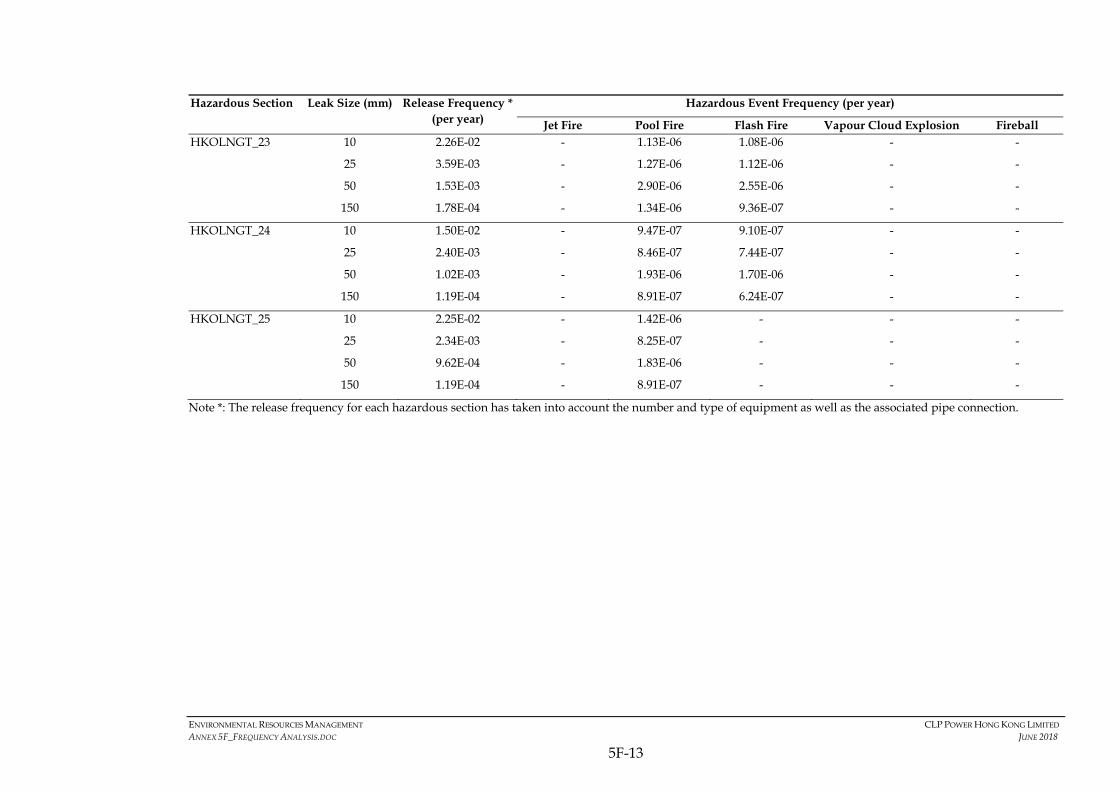
ENVIRONMENTAL RESOURCES MANAGEMENT CLP POWER HONG KONG LIMITED ANNEX 5F_FREQUENCY ANALYSIS.DOC JUNE 2018
5F-13
Hazardous Section Leak Size (mm) Release Frequency * (per year)
Hazardous Event Frequency (per year)
Jet Fire Pool Fire Flash Fire Vapour Cloud Explosion Fireball HKOLNGT_23 10 2.26E-02 - 1.13E-06 1.08E-06 - -
25 3.59E-03 - 1.27E-06 1.12E-06 - -
50 1.53E-03 - 2.90E-06 2.55E-06 - -
150 1.78E-04 - 1.34E-06 9.36E-07 - -
HKOLNGT_24 10 1.50E-02 - 9.47E-07 9.10E-07 - -
25 2.40E-03 - 8.46E-07 7.44E-07 - -
50 1.02E-03 - 1.93E-06 1.70E-06 - -
150 1.19E-04 - 8.91E-07 6.24E-07 - -
HKOLNGT_25 10 2.25E-02 - 1.42E-06 - - -
25 2.34E-03 - 8.25E-07 - - -
50 9.62E-04 - 1.83E-06 - - -
150 1.19E-04 - 8.91E-07 - - -
Note *: The release frequency for each hazardous section has taken into account the number and type of equipment as well as the associated pipe connection.

ENVIRONMENTAL RESOURCES MANAGEMENT CLP POWER HONG KONG LIMITED ANNEX 5F_FREQUENCY ANALYSIS.DOC JUNE 2018
5F-14
Table 5F.13 Hazardous Event Frequency: QRA Study for the LNG Terminal (Isolation Failure Case)
Hazardous Section Leak Size (mm) Release Frequency* (per year)
Hazardous Event Frequency (per year)
Jet Fire Pool Fire Flash Fire Vapour Cloud Explosion Fireball
HKOLNGT_01 10 3.01E-05 1.95E-08 - 1.87E-08 7.80E-10 - 25 1.26E-05 7.22E-08 - 6.35E-08 8.66E-09 - 50 2.25E-07 6.93E-09 - 6.10E-09 8.32E-10 -
150 1.84E-05 - 1.38E-06 9.66E-07 4.14E-07 -
HKOLNGT_02 10 3.33E-06 - 2.01E-09 1.93E-09 8.05E-11 -
25 3.33E-06 - 5.80E-09 5.10E-09 6.96E-10 -
50 3.33E-06 - 3.11E-08 2.74E-08 3.74E-09 -
Catastrophic Rupture 2.50E-08 - - 1.31E-09 5.63E-10 -
HKOLNGT_03 10 9.77E-05 7.43E-08 7.43E-08 6.54E-08 8.92E-09 - 25 8.20E-06 5.77E-08 5.77E-08 5.08E-08 6.92E-09 - 50 1.38E-06 5.22E-08 5.22E-08 4.60E-08 6.27E-09 -
150 7.50E-07 - 5.63E-08 3.94E-08 1.69E-08 -
HKOLNGT_04 10 2.44E-04 8.49E-07 8.49E-07 7.47E-07 1.02E-07 - 25 1.64E-05 5.27E-07 5.27E-07 4.64E-07 6.33E-08 - 50 2.25E-06 1.68E-07 1.68E-07 1.18E-07 5.05E-08 -
150 8.86E-07 6.65E-08 6.65E-08 4.65E-08 1.99E-08 -
HKOLNGT_05 10 1.70E-04 1.46E-07 - 1.29E-07 1.76E-08 - 25 1.68E-05 1.34E-07 - 1.17E-07 1.60E-08 - 50 3.20E-06 1.37E-07 - 1.20E-07 1.64E-08 -
150 2.00E-06 - - 1.05E-07 4.50E-08 1.50E-07
HKOLNGT_06 10 1.17E-04 8.75E-06 - 6.12E-06 2.62E-06 - 25 6.02E-05 4.60E-07 - 4.05E-07 5.52E-08 - 50 7.40E-07 3.04E-08 - 2.67E-08 3.65E-09 -
150 9.20E-05 - - 4.83E-06 2.07E-06 6.90E-06
HKOLNGT_07 10 8.19E-05 6.76E-08 - 5.95E-08 8.11E-09 - 25 6.11E-06 4.66E-08 - 4.10E-08 5.60E-09 - 50 9.42E-07 3.87E-08 - 3.40E-08 4.64E-09 -
150 4.12E-07 - - 2.16E-08 9.27E-09 3.09E-08

ENVIRONMENTAL RESOURCES MANAGEMENT CLP POWER HONG KONG LIMITED ANNEX 5F_FREQUENCY ANALYSIS.DOC JUNE 2018
5F-15
Hazardous Section Leak Size (mm) Release Frequency* (per year)
Hazardous Event Frequency (per year)
Jet Fire Pool Fire Flash Fire Vapour Cloud Explosion Fireball
HKOLNGT_08 10 7.20E-07 5.94E-10 - 5.23E-10 7.13E-11 - 25 1.80E-07 1.37E-09 - 1.21E-09 1.65E-10 -
150 3.00E-07 - - 1.58E-08 6.75E-09 2.25E-08
HKOLNGT_10 10 8.19E-05 6.76E-08 - 5.95E-08 8.11E-09 - 25 6.28E-06 4.79E-08 - 4.22E-08 5.75E-09 - 50 9.42E-07 3.87E-08 - 3.40E-08 4.64E-09 -
150 4.12E-07 - - 2.16E-08 9.27E-09 3.09E-08
HKOLNGT_11 10 7.20E-07 5.94E-10 - 5.23E-10 7.13E-11 - 25 1.80E-07 1.37E-09 - 1.21E-09 1.65E-10 -
150 3.00E-07 - - 1.58E-08 6.75E-09 2.25E-08
HKOLNGT_13 10 8.21E-05 6.24E-08 6.24E-08 5.49E-08 7.49E-09 - 25 6.48E-06 4.56E-08 4.56E-08 4.01E-08 5.47E-09 - 50 9.72E-07 3.68E-08 3.68E-08 3.24E-08 4.41E-09 -
150 4.32E-07 - 3.24E-08 2.27E-08 9.72E-09 -
HKOLNGT_14 10 3.96E-05 2.15E-08 - 2.06E-08 8.60E-10 - 25 3.96E-06 2.46E-09 - 2.36E-09 9.82E-11 - 50 9.10E-07 1.45E-09 - 1.28E-09 1.74E-10 -
150 3.30E-07 7.57E-09 - 6.66E-09 9.08E-10 -
HKOLNGT_15 10 8.21E-05 4.10E-08 - 3.94E-08 1.64E-09 - 25 6.48E-06 3.61E-09 - 3.46E-09 1.44E-10 - 50 9.72E-07 5.98E-10 - 5.74E-10 2.39E-11 -
150 4.32E-07 1.62E-09 - 1.42E-09 1.94E-10 -
HKOLNGT_16 10 6.53E-05 3.54E-08 - 3.40E-08 1.42E-09 - 25 3.22E-06 2.00E-09 - 1.92E-09 7.98E-11 - 50 3.96E-07 6.24E-10 - 5.49E-10 7.48E-11 -
150 1.61E-07 3.65E-09 - 3.21E-09 4.38E-10 -
HKOLNGT_17 10 2.45E-05 1.34E-08 - 1.29E-08 5.37E-10 - 25 1.92E-06 1.20E-09 - 1.16E-09 4.81E-11 - 50 2.96E-07 5.63E-10 - 4.95E-10 6.76E-11 -
150 1.36E-07 3.72E-09 - 3.28E-09 4.47E-10 -

ENVIRONMENTAL RESOURCES MANAGEMENT CLP POWER HONG KONG LIMITED ANNEX 5F_FREQUENCY ANALYSIS.DOC JUNE 2018
5F-16
Hazardous Section Leak Size (mm) Release Frequency* (per year)
Hazardous Event Frequency (per year)
Jet Fire Pool Fire Flash Fire Vapour Cloud Explosion Fireball
HKOLNGT_18 10 8.85E-05 4.86E-08 4.86E-08 4.66E-08 1.94E-09 - 25 7.48E-06 4.69E-09 4.69E-09 4.50E-09 1.88E-10 - 50 1.27E-06 2.41E-09 2.41E-09 2.12E-09 2.90E-10 -
150 6.99E-07 - 5.24E-08 3.67E-08 1.57E-08 -
HKOLNGT_19 10 2.43E-05 1.22E-08 - 1.17E-08 4.86E-10 - 25 1.92E-06 1.07E-09 - 1.03E-09 4.27E-11 - 50 2.88E-07 1.77E-10 - 1.70E-10 7.09E-12 -
150 1.28E-07 4.79E-10 - 4.22E-10 5.75E-11 -
HKOLNGT_20 10 2.38E-05 1.22E-08 - 1.17E-08 4.88E-10 - 25 6.99E-06 4.09E-09 - 3.93E-09 1.64E-10 - 50 2.16E-07 1.40E-10 - 1.34E-10 5.60E-12 -
150 9.25E-06 8.13E-08 7.15E-08 9.76E-09 -
HKOLNGT_21 10 2.38E-05 1.22E-08 - 1.17E-08 4.88E-10 - 25 6.99E-06 4.09E-09 - 3.93E-09 1.64E-10 - 50 2.16E-07 1.40E-10 - 1.34E-10 5.60E-12 -
150 9.25E-06 8.13E-08 - 7.15E-08 9.76E-09 -
HKOLNGT_22 10 2.76E-05 1.50E-08 - 1.44E-08 5.99E-10 - 25 2.16E-06 1.34E-09 - 1.29E-09 5.36E-11 - 50 4.80E-07 7.65E-10 - 6.73E-10 9.18E-11 -
HKOLNGT_23 10 2.28E-04 - 1.14E-07 1.09E-07 - - 25 3.63E-05 - 1.28E-07 1.13E-07 - - 50 1.54E-05 - 2.93E-07 2.58E-07 - -
150 1.80E-06 - 1.35E-07 9.45E-08 - -
HKOLNGT_24 10 1.52E-04 - 9.57E-08 9.19E-08 - - 25 2.42E-05 - 8.54E-08 7.52E-08 - - 50 1.03E-05 - 1.95E-07 1.72E-07 - -
150 1.20E-06 - 9.00E-08 6.30E-08 - -
HKOLNGT_25 10 2.27E-04 - 1.43E-07 - - - 25 2.36E-05 - 8.33E-08 - - - 50 9.72E-06 - 1.85E-07 - - -

ENVIRONMENTAL RESOURCES MANAGEMENT CLP POWER HONG KONG LIMITED ANNEX 5F_FREQUENCY ANALYSIS.DOC JUNE 2018
5F-17
Hazardous Section Leak Size (mm) Release Frequency* (per year)
Hazardous Event Frequency (per year)
Jet Fire Pool Fire Flash Fire Vapour Cloud Explosion Fireball 150 1.20E-06 - 9.00E-08 - - -
Note *: The release frequency for each hazardous section has taken into account the number and type of equipment as well as the associated pipe connection.

ENVIRONMENTAL RESOURCES MANAGEMENT CLP POWER HONG KONG LIMITED ANNEX 5F_FREQUENCY ANALYSIS.DOC JUNE 2018
5F-18
5F.3 SUBSEA PIPELINES
5F.3.1 Release Frequency Database
The international databases considered in the QRA Study are PARLOC 2012 (1) and PARLOC 2001 (2). The PARLOC 2012 updates the loss of containment failure rate data for subsea pipelines and risers from 2001 through the end of 2012; however, it does not include any incident data covered by the PARLOC 2001 study, which has coverage of incidents from 1960s until year 2000.
In the QRA Study, both PARLOC 2001 and PARLOC 2012 database have been considered to cover the incidents from the 1960s until the end of 2012 for all offshore pipelines and risers operating in the UK North Sea, Eastern Irish Sea, West of Shetland, and Norwegian, Danish and Dutch sectors of the North Sea.
Incidents recorded in the database have been classified according to several categories, including:
Failure location: The database includes risers, pipelines within 500 m of an offshore platform, pipelines within 500 m of a subsea well and mid-line (pipelines located more than 500 m from a platform or a subsea well). It is noted that the failure data pertaining to risers is not relevant to the QRA Study for subsea pipelines and therefore excluded;
Pipeline contents: The database includes both oil and gas pipelines. Where the contents in the pipeline have an impact on failure rate, such as corrosion, only incidents pertaining to gas pipelines were considered; and
Pipeline type: The database includes steel pipelines (both pipe body and fittings) and flexible lines. Only failures involving the pipe body of steel pipelines were considered.
A breakdown of the incidents by failure location is presented in Table 5F.14.
Table 5F.14 Subsea Pipeline Failure Rate Based on PARLOC 2012 and PARLOC 2001
Region of Pipeline Operating Experience^
No. of Incidents^
Failure Rate^
Mid-line 506,603 km-years 43 8.5 × 10⁻⁵ /km/year
Platform safety zone 28,774 years (14,387 km-years)*
26 9.0 × 10⁻⁴ /year
(1.8 × 10⁻³ /km/year)
Subsea well safety zone
10,842 years# (5,421 km-years)*
8 7.4 × 10⁻⁴ /year
(1.5 × 10⁻³ /km/year)
(1) Energy Institute, London and Oil & Gas UK, Pipeline and Riser Loss of Containment 2010 – 2012 (PARLOC 2012), 6th
Edition of PARLOC Report Series, March 2015.
(2) Mott MacDonald Ltd., The Update of Loss of Containment Data for Offshore Pipelines (PARLOC 2001), Revision F, June 2003.
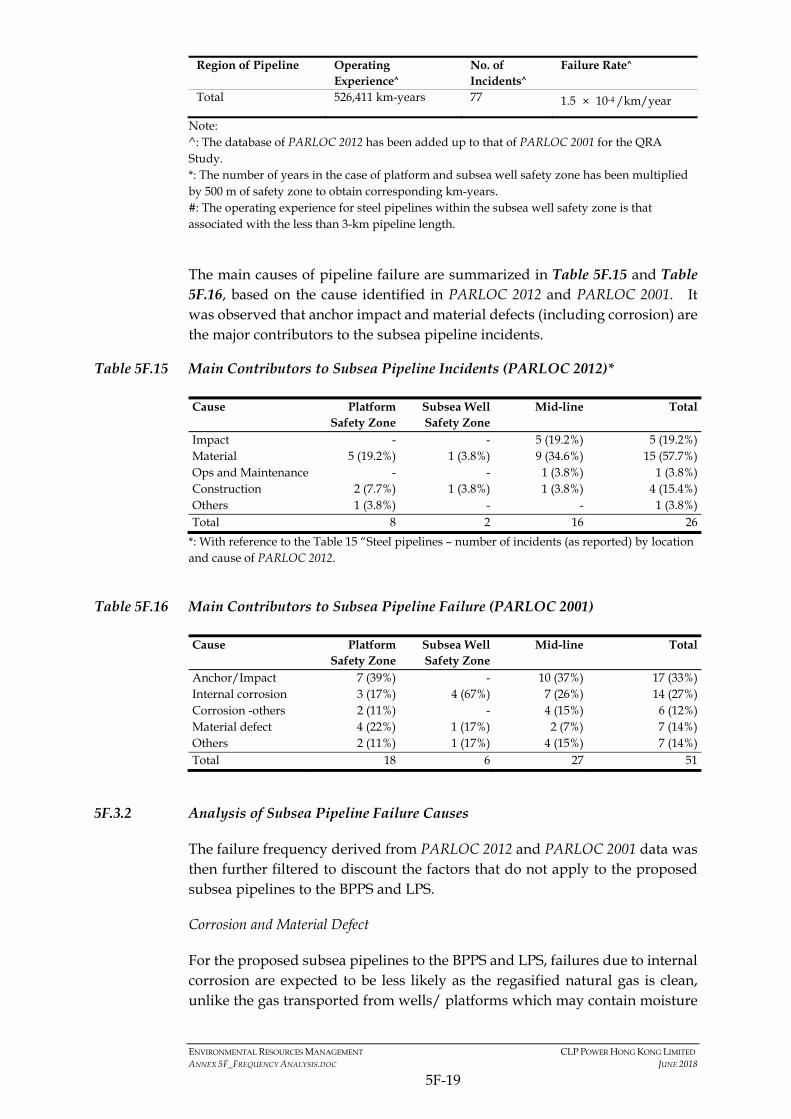
ENVIRONMENTAL RESOURCES MANAGEMENT CLP POWER HONG KONG LIMITED ANNEX 5F_FREQUENCY ANALYSIS.DOC JUNE 2018
5F-19
Region of Pipeline Operating Experience^
No. of Incidents^
Failure Rate^
Total 526,411 km-years 77 1.5 × 10⁻⁴ /km/year
Note: ^: The database of PARLOC 2012 has been added up to that of PARLOC 2001 for the QRA Study. *: The number of years in the case of platform and subsea well safety zone has been multiplied by 500 m of safety zone to obtain corresponding km-years. #: The operating experience for steel pipelines within the subsea well safety zone is that associated with the less than 3-km pipeline length.
The main causes of pipeline failure are summarized in Table 5F.15 and Table 5F.16, based on the cause identified in PARLOC 2012 and PARLOC 2001. It was observed that anchor impact and material defects (including corrosion) are the major contributors to the subsea pipeline incidents.
Table 5F.15 Main Contributors to Subsea Pipeline Incidents (PARLOC 2012)*
Cause Platform Safety Zone
Subsea Well Safety Zone
Mid-line Total
Impact - - 5 (19.2%) 5 (19.2%) Material 5 (19.2%) 1 (3.8%) 9 (34.6%) 15 (57.7%) Ops and Maintenance - - 1 (3.8%) 1 (3.8%) Construction 2 (7.7%) 1 (3.8%) 1 (3.8%) 4 (15.4%) Others 1 (3.8%) - - 1 (3.8%) Total 8 2 16 26
*: With reference to the Table 15 “Steel pipelines – number of incidents (as reported) by location and cause of PARLOC 2012.
Table 5F.16 Main Contributors to Subsea Pipeline Failure (PARLOC 2001)
Cause Platform Safety Zone
Subsea Well Safety Zone
Mid-line Total
Anchor/Impact 7 (39%) - 10 (37%) 17 (33%) Internal corrosion 3 (17%) 4 (67%) 7 (26%) 14 (27%) Corrosion -others 2 (11%) - 4 (15%) 6 (12%) Material defect 4 (22%) 1 (17%) 2 (7%) 7 (14%) Others 2 (11%) 1 (17%) 4 (15%) 7 (14%) Total 18 6 27 51
5F.3.2 Analysis of Subsea Pipeline Failure Causes
The failure frequency derived from PARLOC 2012 and PARLOC 2001 data was then further filtered to discount the factors that do not apply to the proposed subsea pipelines to the BPPS and LPS.
Corrosion and Material Defect
For the proposed subsea pipelines to the BPPS and LPS, failures due to internal corrosion are expected to be less likely as the regasified natural gas is clean, unlike the gas transported from wells/ platforms which may contain moisture

ENVIRONMENTAL RESOURCES MANAGEMENT CLP POWER HONG KONG LIMITED ANNEX 5F_FREQUENCY ANALYSIS.DOC JUNE 2018
5F-20
and hydrogen sulphide. Also, the condition of the subsea pipeline is expected to be monitored periodically and maintenance work will be carried out when necessary.
The PARLOC 1996 (1) provides a breakdown of loss of containment incidents due to corrosion and material defect for gas pipelines greater than 5 km in length. The failure rate for gas pipelines is 5.9 × 10⁻⁶ /km/year (based on 0.7 failures in 119,182 km-years). In PARLOC 2012 and PARLOC 2001, the failure rate for gas pipelines due to corrosion and material defects cannot be directly extracted due to a difference in the presentation format of the data.
In addition, a downward trend in failure frequency is expected due to improvement in technology. There have been significant improvements in pipeline material and welding over the last 10 to 20 years. Hence, as per the previous EIA Report that was approved by the EPD (2), a 80% reduction factor has been applied for all forms of corrosion and material defects. As a result, the corrosion/material defect frequency for subsea gas pipelines adopted in the QRA Study is 1.18 × 10⁻⁶ /km/year.
Anchor Drop and Impact Incidents
According to PARLOC 2012 and PARLOC 2001, the failure frequency for 20” and 30” subsea pipelines due to anchor/ impact are presented in Table 5F.17.
Table 5F.17 Frequency of Loss of Containment Incidents due to Anchor/ Impact
Failure Frequency (per km per year)* Location 20“ diameter 30” diameter Mid-line 1.32 × 10⁻⁵ 1.25 × 10⁻⁵
Safety zone 1.06 × 10⁻⁴ 1.77 × 10⁻⁴
*: The database of PARLOC 2012 has been added up to that of PARLOC 2001 for the QRA Study.
It is considered that the likelihood of subsea pipeline damage due to anchor/ impact incidents may be related to the level of marine activity (this is taken to be a combination of marine traffic and anchor drop). The frequency of subsea pipeline failure due to these causes has therefore been derived as a function of three levels of marine activity: high, medium and low. The associated failure frequencies for different levels of marine activities are presented in Table 5F.18.
(1) Health and Safety Executive UK, PARLOC 96: The Update of Loss of Containment Data for Offshore Pipelines.
(2) ERM, EIA for Liquefied Natural Gas (LNG) Receiving Terminal and Associated Facilities (Register No.: AEIAR-106/2007), December 2006.
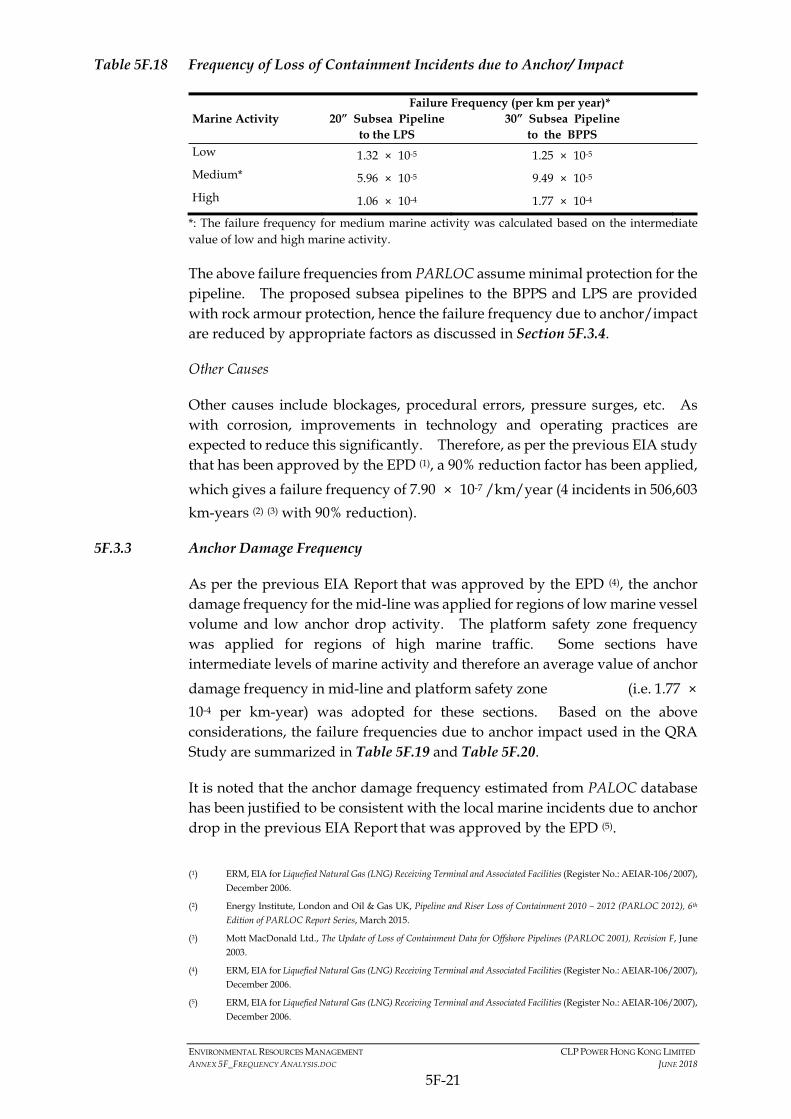
ENVIRONMENTAL RESOURCES MANAGEMENT CLP POWER HONG KONG LIMITED ANNEX 5F_FREQUENCY ANALYSIS.DOC JUNE 2018
5F-21
Table 5F.18 Frequency of Loss of Containment Incidents due to Anchor/ Impact
Failure Frequency (per km per year)* Marine Activity 20” Subsea Pipeline
to the LPS 30” Subsea Pipeline
to the BPPS
Low 1.32 × 10⁻⁵ 1.25 × 10⁻⁵
Medium* 5.96 × 10⁻⁵ 9.49 × 10⁻⁵
High 1.06 × 10⁻⁴ 1.77 × 10⁻⁴
*: The failure frequency for medium marine activity was calculated based on the intermediate value of low and high marine activity.
The above failure frequencies from PARLOC assume minimal protection for the pipeline. The proposed subsea pipelines to the BPPS and LPS are provided with rock armour protection, hence the failure frequency due to anchor/impact are reduced by appropriate factors as discussed in Section 5F.3.4.
Other Causes
Other causes include blockages, procedural errors, pressure surges, etc. As with corrosion, improvements in technology and operating practices are expected to reduce this significantly. Therefore, as per the previous EIA study
that has been approved by the EPD (1), a 90% reduction factor has been applied,
which gives a failure frequency of 7.90 × 10⁻⁷ /km/year (4 incidents in 506,603
km-years (2) (3) with 90% reduction).
5F.3.3 Anchor Damage Frequency
As per the previous EIA Report that was approved by the EPD (4), the anchor damage frequency for the mid-line was applied for regions of low marine vessel volume and low anchor drop activity. The platform safety zone frequency was applied for regions of high marine traffic. Some sections have intermediate levels of marine activity and therefore an average value of anchor
damage frequency in mid-line and platform safety zone (i.e. 1.77 ×
10-4 per km-year) was adopted for these sections. Based on the above considerations, the failure frequencies due to anchor impact used in the QRA Study are summarized in Table 5F.19 and Table 5F.20.
It is noted that the anchor damage frequency estimated from PALOC database has been justified to be consistent with the local marine incidents due to anchor drop in the previous EIA Report that was approved by the EPD (5).
(1) ERM, EIA for Liquefied Natural Gas (LNG) Receiving Terminal and Associated Facilities (Register No.: AEIAR-106/2007),
December 2006.
(2) Energy Institute, London and Oil & Gas UK, Pipeline and Riser Loss of Containment 2010 – 2012 (PARLOC 2012), 6th
Edition of PARLOC Report Series, March 2015.
(3) Mott MacDonald Ltd., The Update of Loss of Containment Data for Offshore Pipelines (PARLOC 2001), Revision F, June 2003.
(4) ERM, EIA for Liquefied Natural Gas (LNG) Receiving Terminal and Associated Facilities (Register No.: AEIAR-106/2007), December 2006.
(5) ERM, EIA for Liquefied Natural Gas (LNG) Receiving Terminal and Associated Facilities (Register No.: AEIAR-106/2007), December 2006.

ENVIRONMENTAL RESOURCES MANAGEMENT CLP POWER HONG KONG LIMITED ANNEX 5F_FREQUENCY ANALYSIS.DOC JUNE 2018
5F-22
Table 5F.19 Anchor Damage Frequencies for Subsea Pipelines to the BPPS
Section Number
Section Description Anchor Damage Frequencies (/km-year)
Marine Traffic/ Comment
X Jetty Approach to South of Soko Islands
1.25 × 10⁻⁵ Low
A Southwest of Soko Islands 1.25 × 10⁻⁵ Low
B Southwest of Fan Lau 1.77 × 10⁻⁴ High (considering high marine Incident rate)
C Southwest Lantau 9.48 × 10⁻⁵ Medium
D West of Tai O 9.48 × 10⁻⁵ Medium
E West of HKIA 9.48 × 10⁻⁵ Medium
F West of Sha Chau 9.48 × 10⁻⁵ Medium
G West of Lung Kwu Chau 1.77 × 10⁻⁴ High
H Lung Kwu Chau to Urmston Anchorage
1.77 × 10⁻⁴ High (considering high marine Incident rate)
I Urmston Road 1.77 × 10⁻⁴ High (considering high traffic volume)
J West of BPPS 9.48 × 10⁻⁵ Medium
Table 5F.20 Anchor Damage Frequencies for Subsea Pipelines to the LPS
Section Number
Section Description Anchor Damage Frequencies (/km-year)
Marine Traffic
A Jetty Approach to South of Shek Kwu Chau
1.32 × 10⁻⁵ Low
B South of Cheung Chau 1.32 × 10⁻⁵ Low
C West Lamma Channel 1.32 × 10⁻⁵ Low
D Alternative Shore Approach 5.95 × 10⁻⁵ Medium
5F.3.4 Pipeline Protection Factors
Different levels of armour rock protection have been proposed by the Pipeline Engineering Consultant for each segment of the proposed BPPS and LPS subsea pipelines based on the potential anchor drag and drop hazards. The cross sections of the trench designs and associated armour rock protection are illustrated in Section 3 of the EIA Report.
With consideration of the armour rock protection for the subsea pipeline, the following pipeline protection factors (1)(2) were adopted in the QRA Study:
99.99% is applied, if the vessel anchor size is smaller than the intended design capacity of the pipeline protection; and
(1) Worley Parsons, BPPS Pipeline Construction Method Report, 402012-00392-MX-REP-0005, 25 Jan 2017
(2) Worley Parsons, LPS Pipeline Construction Method Report, 402012-00392-MX-REP-0004, 25 Jan 2017

ENVIRONMENTAL RESOURCES MANAGEMENT CLP POWER HONG KONG LIMITED ANNEX 5F_FREQUENCY ANALYSIS.DOC JUNE 2018
5F-23
0% is applied, if the vessel anchor size is larger than the intended design capacity of the pipeline protection.
5F.3.5 Summary of Failure Frequency for Proposed Subsea Pipelines
Based on the above discussions, the failure frequencies proposed to be adopted in the QRA Study are summarised in Table 5F.21 and Table 5F.22.
Table 5F.21 Summary of Release Frequency along Subsea BPPS Pipeline
Pipeline Section Trench Type
Anchor Impact
(/km/yr)
Corrosion/ Defects (/km/yr)
Others (/km/yr)
Total (/km/yr)*
Jetty Approach to South of Soko Islands (X)
4 1.25E-05 1.18E-06 7.90E-07 2.30E-06
Southwest of Soko Islands (A) 5 1.25E-05 1.18E-06 7.90E-07 2.69E-06 Southwest of Fan Lau (B) 5 1.77E-04 1.18E-06 7.90E-07 1.99E-06 Southwest Lantau (C) 2 9.49E-05 1.18E-06 7.90E-07 5.85E-06 West of Tai O (D) 5 9.49E-05 1.18E-06 7.90E-07 1.98E-06 West of HKIA (E) 5 9.49E-05 1.18E-06 7.90E-07 1.98E-06 West of Sha Chau (F) 5 9.49E-05 1.18E-06 7.90E-07 1.98E-06 West of Lung Kwu Chau (G) 3 1.77E-04 1.18E-06 7.90E-07 1.99E-06 Lung Kwu Chau to Urmston Anchorage (H)
5 1.77E-04 1.18E-06 7.90E-07 1.99E-06
Urmston Road (I) 4 1.77E-04 1.18E-06 7.90E-07 1.99E-06 West of BPPS (J) 5/1 9.49E-05 1.18E-06 7.90E-07 1.98E-06
*The armour rock protection factor for the subsea pipeline has been taken into account in the total release frequency.
Table 5F.22 Summary of Release Frequency along Subsea LPS Pipeline
Pipeline Section Trench Type
Anchor Impact
(/km/yr)
Corrosion/ Defects (/km/yr)
Others (/km/yr)
Total (/km/yr) *
Jetty Approach to South of Shek Kwu Chau (A)
4 1.32E-05 1.18E-06 7.90E-07 1.97E-06
South of Cheung Chau (B) 5 1.32E-05 1.18E-06 7.90E-07 1.97E-06 West Lamma Channel (C) 5 1.32E-05 1.18E-06 7.90E-07 1.97E-06 Alternative Shore Approach (D) 1 5.95E-05 1.18E-06 7.90E-07 1.98E-06
*The armour rock protection factor for the subsea pipeline has been taken into account in the total release frequency.
5F.3.6 Event Tree Analysis
An event tree analysis was performed to model the development of each event from an initial release to final hazardous scenario. The key event trees for the external damage on subsea pipelines, and spontaneous failure of subsea pipeline, are depicted in Figure 5F.5 and Figure 5F.6 respectively.
The following factors were considered in the event tree development:
Failure cause;
Hole size;
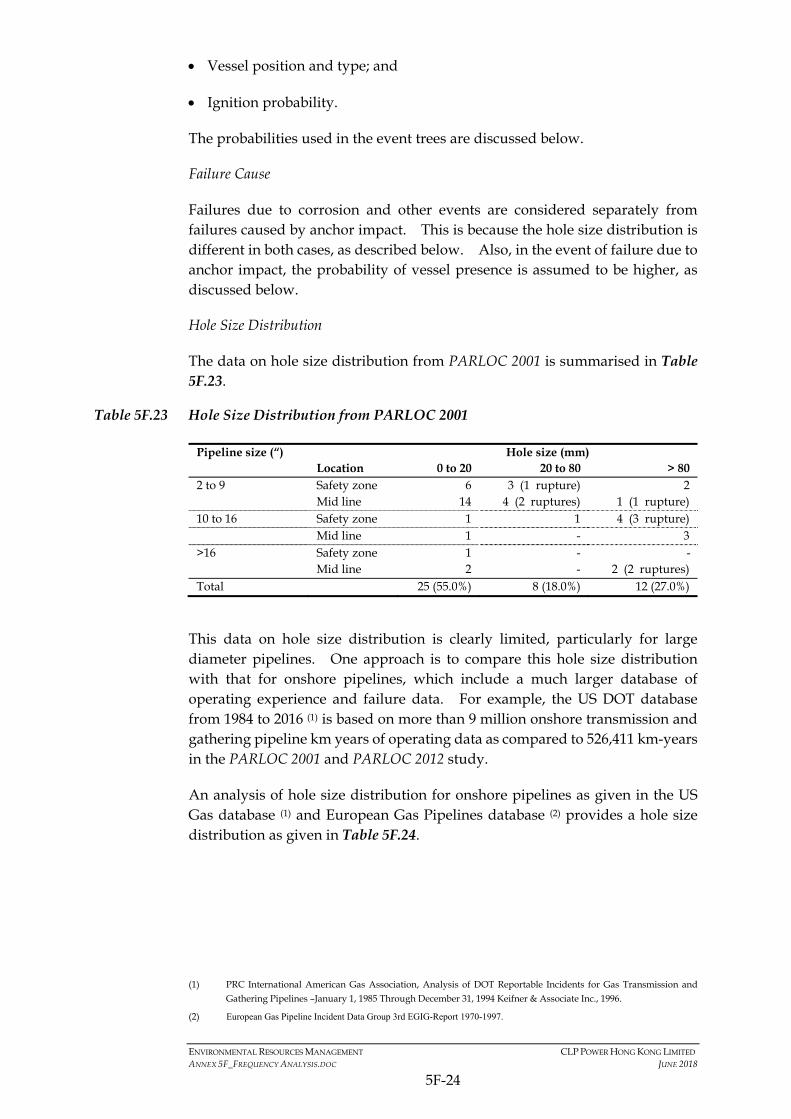
ENVIRONMENTAL RESOURCES MANAGEMENT CLP POWER HONG KONG LIMITED ANNEX 5F_FREQUENCY ANALYSIS.DOC JUNE 2018
5F-24
Vessel position and type; and
Ignition probability.
The probabilities used in the event trees are discussed below.
Failure Cause
Failures due to corrosion and other events are considered separately from failures caused by anchor impact. This is because the hole size distribution is different in both cases, as described below. Also, in the event of failure due to anchor impact, the probability of vessel presence is assumed to be higher, as discussed below.
Hole Size Distribution
The data on hole size distribution from PARLOC 2001 is summarised in Table 5F.23.
Table 5F.23 Hole Size Distribution from PARLOC 2001
Pipeline size (“) Hole size (mm) Location 0 to 20 20 to 80 > 80
2 to 9 Safety zone 6 3 (1 rupture) 2 Mid line 14 4 (2 ruptures) 1 (1 rupture) 10 to 16 Safety zone 1 1 4 (3 rupture) Mid line 1 - 3 >16 Safety zone 1 - - Mid line 2 - 2 (2 ruptures) Total 25 (55.0%) 8 (18.0%) 12 (27.0%)
This data on hole size distribution is clearly limited, particularly for large diameter pipelines. One approach is to compare this hole size distribution with that for onshore pipelines, which include a much larger database of operating experience and failure data. For example, the US DOT database from 1984 to 2016 (1) is based on more than 9 million onshore transmission and gathering pipeline km years of operating data as compared to 526,411 km-years in the PARLOC 2001 and PARLOC 2012 study.
An analysis of hole size distribution for onshore pipelines as given in the US Gas database (1) and European Gas Pipelines database (2) provides a hole size distribution as given in Table 5F.24.
(1) PRC International American Gas Association, Analysis of DOT Reportable Incidents for Gas Transmission and
Gathering Pipelines –January 1, 1985 Through December 31, 1994 Keifner & Associate Inc., 1996.
(2) European Gas Pipeline Incident Data Group 3rd EGIG-Report 1970-1997.
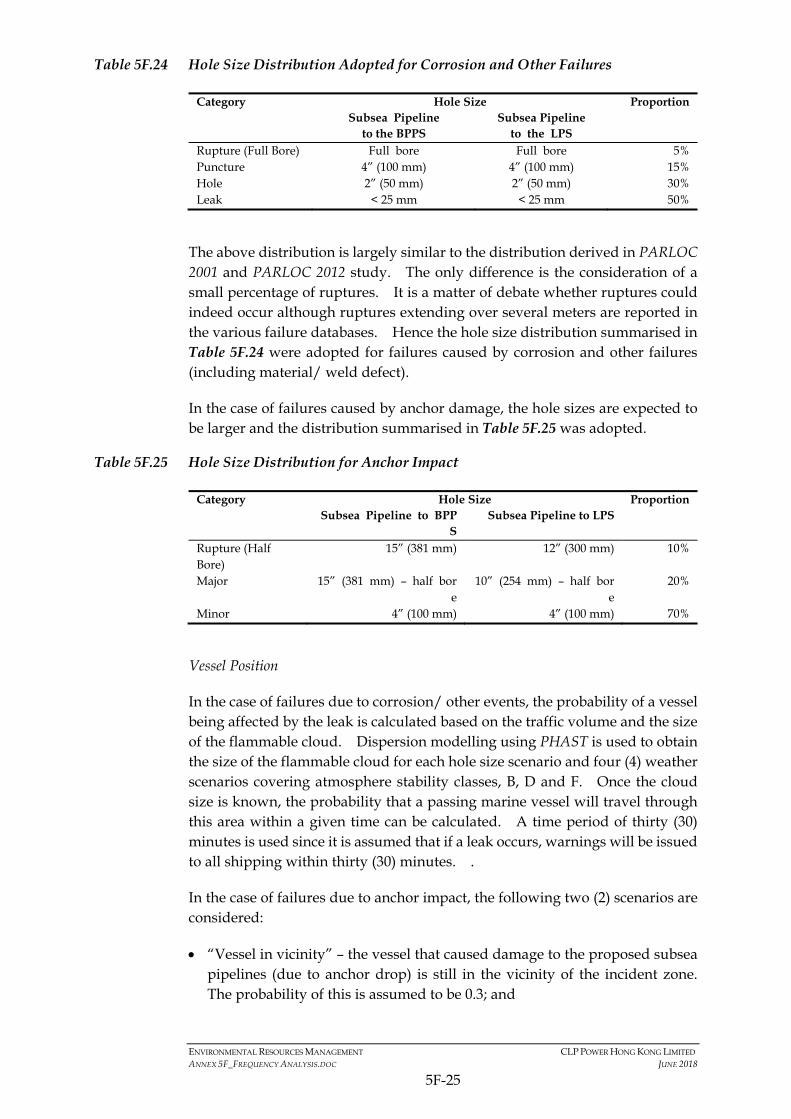
ENVIRONMENTAL RESOURCES MANAGEMENT CLP POWER HONG KONG LIMITED ANNEX 5F_FREQUENCY ANALYSIS.DOC JUNE 2018
5F-25
Table 5F.24 Hole Size Distribution Adopted for Corrosion and Other Failures
Category Hole Size Proportion Subsea Pipeline
to the BPPS Subsea Pipeline
to the LPS
Rupture (Full Bore) Full bore Full bore 5% Puncture 4” (100 mm) 4” (100 mm) 15% Hole Leak
2” (50 mm) < 25 mm
2” (50 mm) < 25 mm
30% 50%
The above distribution is largely similar to the distribution derived in PARLOC 2001 and PARLOC 2012 study. The only difference is the consideration of a small percentage of ruptures. It is a matter of debate whether ruptures could indeed occur although ruptures extending over several meters are reported in the various failure databases. Hence the hole size distribution summarised in Table 5F.24 were adopted for failures caused by corrosion and other failures (including material/ weld defect).
In the case of failures caused by anchor damage, the hole sizes are expected to be larger and the distribution summarised in Table 5F.25 was adopted.
Table 5F.25 Hole Size Distribution for Anchor Impact
Category Hole Size Proportion Subsea Pipeline to BPP
S Subsea Pipeline to LPS
Rupture (Half Bore)
15” (381 mm) 12” (300 mm) 10%
Major 15” (381 mm) – half bore
10” (254 mm) – half bore
20%
Minor 4” (100 mm) 4” (100 mm) 70%
Vessel Position
In the case of failures due to corrosion/ other events, the probability of a vessel being affected by the leak is calculated based on the traffic volume and the size of the flammable cloud. Dispersion modelling using PHAST is used to obtain the size of the flammable cloud for each hole size scenario and four (4) weather scenarios covering atmosphere stability classes, B, D and F. Once the cloud size is known, the probability that a passing marine vessel will travel through this area within a given time can be calculated. A time period of thirty (30) minutes is used since it is assumed that if a leak occurs, warnings will be issued to all shipping within thirty (30) minutes. .
In the case of failures due to anchor impact, the following two (2) scenarios are considered:
“Vessel in vicinity” – the vessel that caused damage to the proposed subsea pipelines (due to anchor drop) is still in the vicinity of the incident zone. The probability of this is assumed to be 0.3; and

ENVIRONMENTAL RESOURCES MANAGEMENT CLP POWER HONG KONG LIMITED ANNEX 5F_FREQUENCY ANALYSIS.DOC JUNE 2018
5F-26
“Passing vessels” – ships approach or pass the scene of the incident following a failure. In this case, the probability of a vessel passing through the plume is calculated using the same method as for a corrosion failure, i.e. based on cloud size and traffic volume.
Ignition Probability for Subsea Pipelines
Ignition of the release is expected only from passing vessels or vessels in the vicinity. As per the previous EIA Report that was approved by the EPD (1), similar values were adopted in the QRA Study for the subsea pipelines to the BPPS and LPS, as given in Table 5F.26.
Table 5F.26 Ignition Probability Assumed for Subsea Pipeline
Release Case Ignition Probability Passing Vessels (1) Vessels in Vicinity (2) <25 mm 0.01 n/a 50 mm 0.05 n/a 100 mm 0.10 0.15 Half bore 0.20 0.30 Full bore 0.30 0.40
Note: 1: Values applied to passing vessels for all types of incidents, i.e. corrosion, others and anchor impact.
2: Values applied only to scenarios where the vessel causing pipeline damage due to anchor impact is still in the vicinity.
5F.4 PROPOSED GRSS AT THE BPPS AND LPS
5F.4.1 Release Frequency Database
Failure frequencies for various hazard sources/ equipment were adopted from historical databases, as per the approved EIA Report (2), summarised in Table 5F.27.
The failure frequencies for natural gas facilities were selected from Hawksley ( 3 ), who presents his own derived data for both above and below ground pipework in 1984. The failure rates from Hawksley was also compared with that suggested by UK HSE ( 4 ), which was established by the Hazardous Installations Directorate (HID) C15 of the UK HSE in 2012. The UK HSE failure rates are intended for use on Land Use Planning cases and have been in use for several years. After review, it was found that the failure rates for pipework from Hawksley and UK HSE are in the same order of magnitude.
(1) ERM, EIA for Liquefied Natural Gas (LNG) Receiving Terminal and Associated Facilities (Register No.: AEIAR-106/2007),
December 2006.
(2) ERM, EIA for Liquefied Natural Gas (LNG) Receiving Terminal and Associated Facilities (Register No.: AEIAR-106/2007), December 2006.
(3) Hawksley, J.L., Some Social, Technical and Economic Aspects of the Risks of Large Plants, CHEMRAWN III, 1984.
(4) UK HSE, Failure Rate and Event Data for use within Risk Assessments, 28 July 2012.

ENVIRONMENTAL RESOURCES MANAGEMENT CLP POWER HONG KONG LIMITED ANNEX 5F_FREQUENCY ANALYSIS.DOC JUNE 2018
5F-27
Table 5F.27 Release Event Frequencies
Equipment Release Scenario
Release Phase
Release Frequency
Unit Reference
Pipe size 600 mm to 750 mm
i) 10 & 25 mm hole
Liquid/ Gas
1.00E-07 per meter-year
Hawksley
ii) 50 & 100 mm hole
Liquid/ Gas
7.00E-08 per meter-year
Hawksley
iii) Full bore rupture
Liquid/ Gas
3.00E-08 per meter-year
Hawksley
Pipe size 150 mm to 500 mm
i) 10 & 25 mm hole
Liquid/ Gas
3.00E-07 per meter-year
Hawksley
ii) 50 & 100 mm hole
Liquid/ Gas
1.00E-07 per meter-year
Hawksley
iii) Full bore rupture
Liquid/ Gas
5.00E-08 per meter-year
Hawksley
5F.4.2 Fault Tree Analysis for Construction Vehicle Impact on the Existing GRS Facilities
During the construction phase of the proposed GRSs at the BPPS and LPS, external construction vehicles will be present at the site for various kinds of construction activities. This introduces the risk of construction vehicle impact on the existing nearby GRS facilities, leading to potential loss of containment of natural gas
Fault tree analysis for the construction vehicle impact on the existing GRS facilities was conducted. The fault tree diagrams for the GRS at the BPPS and the LPS are presented in Figure 5F.7 and Figure 5F.8 respectively.
The frequency of construction vehicle impact on the existing GRS at the BPPS
and the LPS was calculated as 2.01 × 10⁻⁶ per year and 1.21 × 10⁻⁶ per year
respectively.
5F.4.3 Flammable Gas Detection and Shutdown Probability
With reference to the Purple Book (1), the effect of blocking valve system is determined by various factors, such as the position of gas detection monitors and the distribution thereof over the various wind directions, the direction limit of the detection system, the system reaction time and the intervention time of an operator. The probability of failure on demand for an automatic blocking system is 0.001 per demand while that for a hand-operated blocking system is 0.01 per demand. However, as a conservative approach, the probability of failure on demand for all detection and shutdown system was selected as 1 in the QRA Study.
5F.4.4 Ignition Probability
The ignition probability depends not only on the presence of ignition sources, but also the release rate and release duration. Larger releases are more likely
(1) Guidelines for Quantitative Risk Assessment, “Purple Book”, 2005.

ENVIRONMENTAL RESOURCES MANAGEMENT CLP POWER HONG KONG LIMITED ANNEX 5F_FREQUENCY ANALYSIS.DOC JUNE 2018
5F-28
to be ignited than smaller releases. Similarly releases that continue for a longer duration have a higher probability of ignition than short duration releases.
Ignition Probability for Natural Gas
Table 5F.28 summarises the ignition probabilities adopted in the QRA Study as per the approved EIA Reports (1) (2). The total ignition probability is 0.32 for large leaks/ruptures, and 0.07 for other leaks. These ignition probabilities are consistent with the model of Cox, Lees and Ang (3).
The ignition probabilities are distributed between immediate ignition and delayed ignition. Delayed ignition is further divided between delayed ignition 1 and delayed ignition 2 to take into account that a dispersing gas cloud may be ignited at different points during its dispersion. Delayed ignition 1 results in a flash fire and takes into account the possibility that an ignition could occur within the plant area due to the presence of ignition sources on-site. Delayed ignition 2 gives a flash fire after the gas cloud has expanded to its maximum (steady state) extent.
If both delayed ignition 1 and 2 do not occur, the gas cloud disperses with no hazardous effect.
Table 5F.28 Ignition Probability for Natural Gas
Immediate Ignition
Delayed Ignition 1
Delayed Ignition 2
Delayed Ignition
Probability
Total Ignition Probability
Small leak 0.02 0.045 0.005 0.05 0.07 Large leak/ rupture
0.10 0.200 0.020 0.22 0.32
For isolation failure scenarios, the delayed ignition probabilities given in Table 5F.28 are doubled. The longer duration and larger inventory release from a non-isolated release is assumed to make it more likely that an ignition takes place.
5F.4.5 VCE
The explosion probability given an ignition adopted in the QRA Study was taken from Cox, Lees and Ang model (4), as shown in Table 5F.29. VCE occurs upon a delayed ignition from a gas release at a congested area. Since a liquid release is contained in a potential explosion site, it is conservative to assume an unignited liquid release vapourises to produce a flammable vapour cloud, subsequently ignited to produce an explosion.
(1) ERM, EIA for Black Point Gas Supply Project (Register No.: AEIAR-150/2010), February 2010.
(2) ERM, EIA for Liquefied Natural Gas (LNG) Receiving Terminal and Associated Facilities (Register No.: AEIAR-106/2007), December 2006.
(3) Cox, Lees and Ang, Classification of Hazardous Locations, IChemE.
(4) Cox, Lees and Ang, Classification of Hazardous Locations, IChemE.
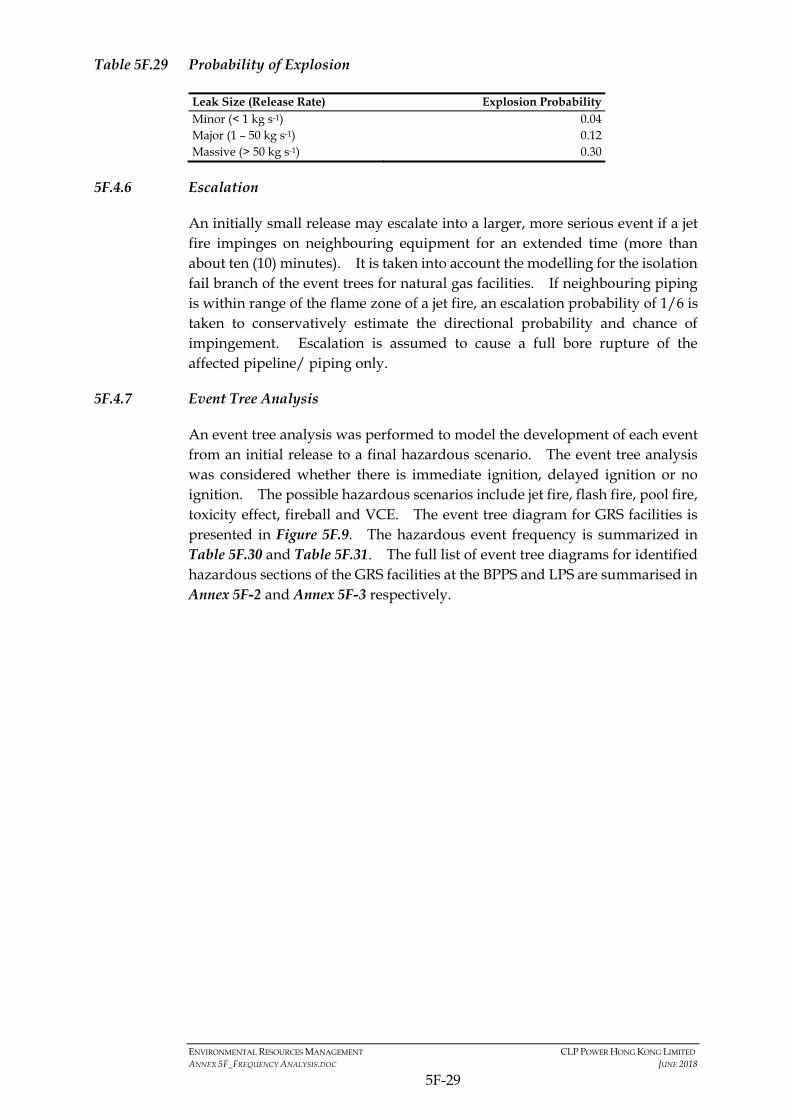
ENVIRONMENTAL RESOURCES MANAGEMENT CLP POWER HONG KONG LIMITED ANNEX 5F_FREQUENCY ANALYSIS.DOC JUNE 2018
5F-29
Table 5F.29 Probability of Explosion
Leak Size (Release Rate) Explosion Probability Minor (< 1 kg s-1) 0.04 Major (1 – 50 kg s-1) 0.12 Massive (> 50 kg s-1) 0.30
5F.4.6 Escalation
An initially small release may escalate into a larger, more serious event if a jet fire impinges on neighbouring equipment for an extended time (more than about ten (10) minutes). It is taken into account the modelling for the isolation fail branch of the event trees for natural gas facilities. If neighbouring piping is within range of the flame zone of a jet fire, an escalation probability of 1/6 is taken to conservatively estimate the directional probability and chance of impingement. Escalation is assumed to cause a full bore rupture of the affected pipeline/ piping only.
5F.4.7 Event Tree Analysis
An event tree analysis was performed to model the development of each event from an initial release to a final hazardous scenario. The event tree analysis was considered whether there is immediate ignition, delayed ignition or no ignition. The possible hazardous scenarios include jet fire, flash fire, pool fire, toxicity effect, fireball and VCE. The event tree diagram for GRS facilities is presented in Figure 5F.9. The hazardous event frequency is summarized in Table 5F.30 and Table 5F.31. The full list of event tree diagrams for identified hazardous sections of the GRS facilities at the BPPS and LPS are summarised in Annex 5F-2 and Annex 5F-3 respectively.

ENVIRONMENTAL RESOURCES MANAGEMENT CLP POWER HONG KONG LIMITED ANNEX 5F_FREQUENCY ANALYSIS.DOC JUNE 2018
5F-30
Table 5F.30 Hazardous Event Frequency: QRA Study for GRS at the BPPS
Hazardous Section
Leak Size (mm) Release Frequency (per year) Hazardous Event Frequency (per year)
Jet Fire Fireball Flash Fire Over Plant Area
Flash Fire Full Extent
Vapour Cloud Explosion
NGRS_01 10 4.00E-06 8.00E-08 - 3.17E-07 4.00E-08 4.32E-08 25 4.00E-06 8.00E-08 - 3.17E-07 4.00E-08 4.32E-08 50 2.80E-06 5.60E-08 - 2.22E-07 2.80E-08 3.02E-08
100 2.80E-06 2.80E-07 - 7.84E-07 1.12E-07 3.36E-07 Line Rupture 1.20E-06 - 1.20E-07 3.36E-07 4.80E-08 1.44E-07 NGRS_02 10 2.00E-06 4.00E-08 - 1.58E-07 2.00E-08 2.16E-08
25 2.00E-06 4.00E-08 - 1.58E-07 2.00E-08 2.16E-08 50 1.40E-06 2.80E-08 - 1.11E-07 1.40E-08 1.51E-08
100 1.40E-06 1.40E-07 - 3.92E-07 5.60E-08 1.68E-07 Line Rupture 6.00E-07 - 6.00E-08 1.68E-07 2.40E-08 7.20E-08 NGRS_03 10 6.50E-06 1.30E-07 - 5.15E-07 6.50E-08 7.02E-08
25 6.50E-06 1.30E-07 - 5.15E-07 6.50E-08 7.02E-08 50 4.55E-06 9.10E-08 - 3.60E-07 4.55E-08 4.91E-08
100 4.55E-06 4.55E-07 - 1.27E-06 1.82E-07 5.46E-07 Line Rupture 1.95E-06 - 1.95E-07 5.46E-07 7.80E-08 2.34E-07 NGRS_04 10 1.04E-05 2.08E-07 - 8.24E-07 1.04E-07 1.12E-07
25 1.04E-05 2.08E-07 - 8.24E-07 1.04E-07 1.12E-07 50 7.28E-06 1.46E-07 - 5.77E-07 7.28E-08 7.86E-08
100 7.28E-06 7.28E-07 - 2.04E-06 2.91E-07 8.74E-07 Line Rupture 3.12E-06 - 3.12E-07 8.74E-07 1.25E-07 3.74E-07 NGRS_05 10 3.42E-05 6.84E-07 - 2.71E-06 3.42E-07 3.69E-07
25 3.42E-05 6.84E-07 - 2.71E-06 3.42E-07 3.69E-07 50 1.14E-05 2.28E-07 - 9.03E-07 1.14E-07 1.23E-07
100 1.14E-05 1.14E-06 - 3.19E-06 4.56E-07 1.37E-06 Line Rupture 5.70E-06 - 5.70E-07 1.60E-06 2.28E-07 6.84E-07 NGRS_06 10 1.56E-05 3.12E-07 - 1.24E-06 1.56E-07 1.68E-07
25 1.56E-05 3.12E-07 - 1.24E-06 1.56E-07 1.68E-07
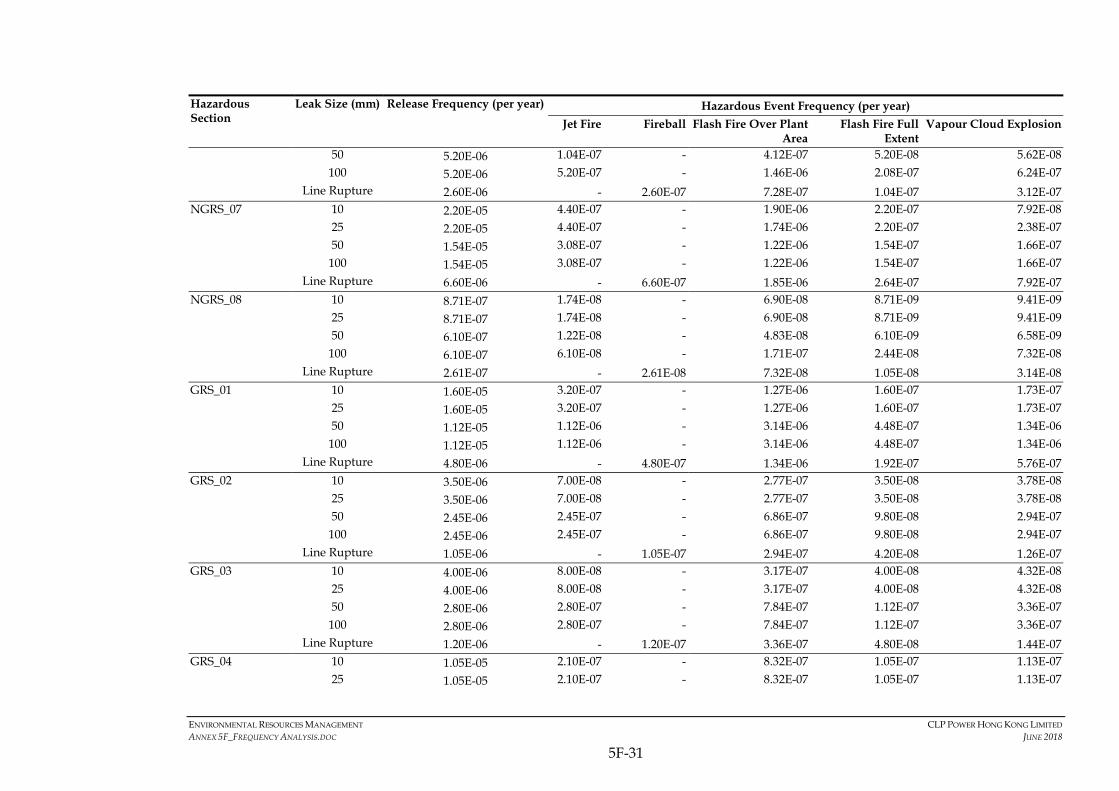
ENVIRONMENTAL RESOURCES MANAGEMENT CLP POWER HONG KONG LIMITED ANNEX 5F_FREQUENCY ANALYSIS.DOC JUNE 2018
5F-31
Hazardous Section
Leak Size (mm) Release Frequency (per year) Hazardous Event Frequency (per year)
Jet Fire Fireball Flash Fire Over Plant Area
Flash Fire Full Extent
Vapour Cloud Explosion
50 5.20E-06 1.04E-07 - 4.12E-07 5.20E-08 5.62E-08
100 5.20E-06 5.20E-07 - 1.46E-06 2.08E-07 6.24E-07 Line Rupture 2.60E-06 - 2.60E-07 7.28E-07 1.04E-07 3.12E-07 NGRS_07 10 2.20E-05 4.40E-07 - 1.90E-06 2.20E-07 7.92E-08
25 2.20E-05 4.40E-07 - 1.74E-06 2.20E-07 2.38E-07 50 1.54E-05 3.08E-07 - 1.22E-06 1.54E-07 1.66E-07
100 1.54E-05 3.08E-07 - 1.22E-06 1.54E-07 1.66E-07 Line Rupture 6.60E-06 - 6.60E-07 1.85E-06 2.64E-07 7.92E-07 NGRS_08 10 8.71E-07 1.74E-08 - 6.90E-08 8.71E-09 9.41E-09
25 8.71E-07 1.74E-08 - 6.90E-08 8.71E-09 9.41E-09 50 6.10E-07 1.22E-08 - 4.83E-08 6.10E-09 6.58E-09
100 6.10E-07 6.10E-08 - 1.71E-07 2.44E-08 7.32E-08 Line Rupture 2.61E-07 - 2.61E-08 7.32E-08 1.05E-08 3.14E-08 GRS_01 10 1.60E-05 3.20E-07 - 1.27E-06 1.60E-07 1.73E-07 25 1.60E-05 3.20E-07 - 1.27E-06 1.60E-07 1.73E-07 50 1.12E-05 1.12E-06 - 3.14E-06 4.48E-07 1.34E-06 100 1.12E-05 1.12E-06 - 3.14E-06 4.48E-07 1.34E-06 Line Rupture 4.80E-06 - 4.80E-07 1.34E-06 1.92E-07 5.76E-07 GRS_02 10 3.50E-06 7.00E-08 - 2.77E-07 3.50E-08 3.78E-08 25 3.50E-06 7.00E-08 - 2.77E-07 3.50E-08 3.78E-08 50 2.45E-06 2.45E-07 - 6.86E-07 9.80E-08 2.94E-07 100 2.45E-06 2.45E-07 - 6.86E-07 9.80E-08 2.94E-07 Line Rupture 1.05E-06 - 1.05E-07 2.94E-07 4.20E-08 1.26E-07 GRS_03 10 4.00E-06 8.00E-08 - 3.17E-07 4.00E-08 4.32E-08 25 4.00E-06 8.00E-08 - 3.17E-07 4.00E-08 4.32E-08 50 2.80E-06 2.80E-07 - 7.84E-07 1.12E-07 3.36E-07 100 2.80E-06 2.80E-07 - 7.84E-07 1.12E-07 3.36E-07 Line Rupture 1.20E-06 - 1.20E-07 3.36E-07 4.80E-08 1.44E-07 GRS_04 10 1.05E-05 2.10E-07 - 8.32E-07 1.05E-07 1.13E-07 25 1.05E-05 2.10E-07 - 8.32E-07 1.05E-07 1.13E-07
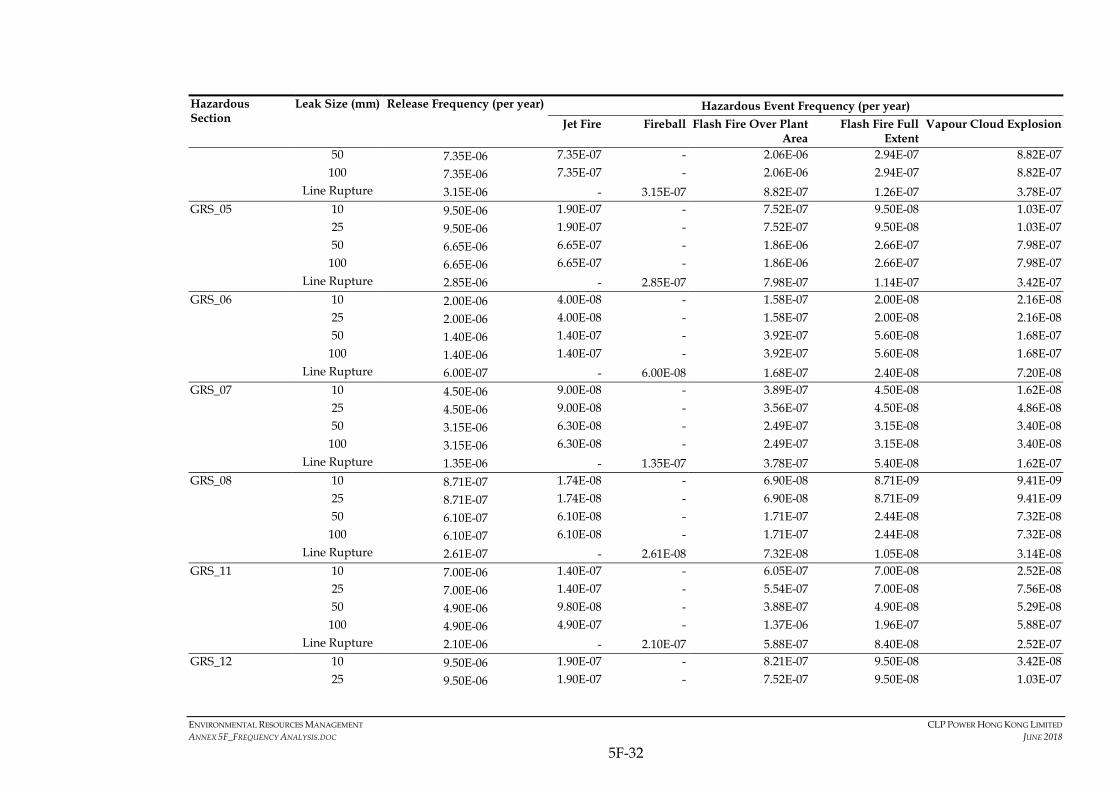
ENVIRONMENTAL RESOURCES MANAGEMENT CLP POWER HONG KONG LIMITED ANNEX 5F_FREQUENCY ANALYSIS.DOC JUNE 2018
5F-32
Hazardous Section
Leak Size (mm) Release Frequency (per year) Hazardous Event Frequency (per year)
Jet Fire Fireball Flash Fire Over Plant Area
Flash Fire Full Extent
Vapour Cloud Explosion
50 7.35E-06 7.35E-07 - 2.06E-06 2.94E-07 8.82E-07 100 7.35E-06 7.35E-07 - 2.06E-06 2.94E-07 8.82E-07 Line Rupture 3.15E-06 - 3.15E-07 8.82E-07 1.26E-07 3.78E-07 GRS_05 10 9.50E-06 1.90E-07 - 7.52E-07 9.50E-08 1.03E-07 25 9.50E-06 1.90E-07 - 7.52E-07 9.50E-08 1.03E-07 50 6.65E-06 6.65E-07 - 1.86E-06 2.66E-07 7.98E-07 100 6.65E-06 6.65E-07 - 1.86E-06 2.66E-07 7.98E-07 Line Rupture 2.85E-06 - 2.85E-07 7.98E-07 1.14E-07 3.42E-07 GRS_06 10 2.00E-06 4.00E-08 - 1.58E-07 2.00E-08 2.16E-08 25 2.00E-06 4.00E-08 - 1.58E-07 2.00E-08 2.16E-08 50 1.40E-06 1.40E-07 - 3.92E-07 5.60E-08 1.68E-07 100 1.40E-06 1.40E-07 - 3.92E-07 5.60E-08 1.68E-07 Line Rupture 6.00E-07 - 6.00E-08 1.68E-07 2.40E-08 7.20E-08 GRS_07 10 4.50E-06 9.00E-08 - 3.89E-07 4.50E-08 1.62E-08 25 4.50E-06 9.00E-08 - 3.56E-07 4.50E-08 4.86E-08 50 3.15E-06 6.30E-08 - 2.49E-07 3.15E-08 3.40E-08 100 3.15E-06 6.30E-08 - 2.49E-07 3.15E-08 3.40E-08 Line Rupture 1.35E-06 - 1.35E-07 3.78E-07 5.40E-08 1.62E-07 GRS_08 10 8.71E-07 1.74E-08 - 6.90E-08 8.71E-09 9.41E-09 25 8.71E-07 1.74E-08 - 6.90E-08 8.71E-09 9.41E-09 50 6.10E-07 6.10E-08 - 1.71E-07 2.44E-08 7.32E-08 100 6.10E-07 6.10E-08 - 1.71E-07 2.44E-08 7.32E-08 Line Rupture 2.61E-07 - 2.61E-08 7.32E-08 1.05E-08 3.14E-08 GRS_11 10 7.00E-06 1.40E-07 - 6.05E-07 7.00E-08 2.52E-08 25 7.00E-06 1.40E-07 - 5.54E-07 7.00E-08 7.56E-08 50 4.90E-06 9.80E-08 - 3.88E-07 4.90E-08 5.29E-08 100 4.90E-06 4.90E-07 - 1.37E-06 1.96E-07 5.88E-07 Line Rupture 2.10E-06 - 2.10E-07 5.88E-07 8.40E-08 2.52E-07 GRS_12 10 9.50E-06 1.90E-07 - 8.21E-07 9.50E-08 3.42E-08 25 9.50E-06 1.90E-07 - 7.52E-07 9.50E-08 1.03E-07

ENVIRONMENTAL RESOURCES MANAGEMENT CLP POWER HONG KONG LIMITED ANNEX 5F_FREQUENCY ANALYSIS.DOC JUNE 2018
5F-33
Hazardous Section
Leak Size (mm) Release Frequency (per year) Hazardous Event Frequency (per year)
Jet Fire Fireball Flash Fire Over Plant Area
Flash Fire Full Extent
Vapour Cloud Explosion
50 6.65E-06 1.33E-07 - 5.27E-07 6.65E-08 7.18E-08 100 6.65E-06 6.65E-07 - 1.86E-06 2.66E-07 7.98E-07 Line Rupture 2.85E-06 - 2.85E-07 7.98E-07 1.14E-07 3.42E-07 GRS_13 10 4.50E-06 9.00E-08 - 3.89E-07 4.50E-08 1.62E-08 25 4.50E-06 9.00E-08 - 3.56E-07 4.50E-08 4.86E-08 50 1.50E-06 3.00E-08 - 1.19E-07 1.50E-08 1.62E-08 100 1.50E-06 1.50E-07 - 4.20E-07 6.00E-08 1.80E-07 Line Rupture 7.50E-07 - 7.50E-08 2.10E-07 3.00E-08 9.00E-08 GRS_14 10 4.50E-06 9.00E-08 - 3.89E-07 4.50E-08 1.62E-08 25 4.50E-06 9.00E-08 - 3.56E-07 4.50E-08 4.86E-08 50 3.15E-06 6.30E-08 - 2.49E-07 3.15E-08 3.40E-08 100 3.15E-06 3.15E-07 - 8.82E-07 1.26E-07 3.78E-07 Line Rupture 1.35E-06 - 1.35E-07 3.78E-07 5.40E-08 1.62E-07 GRS_15 10 8.00E-06 1.60E-07 - 6.91E-07 8.00E-08 2.88E-08 25 8.00E-06 1.60E-07 - 6.34E-07 8.00E-08 8.64E-08 50 5.60E-06 1.12E-07 - 4.44E-07 5.60E-08 6.05E-08 100 5.60E-06 5.60E-07 - 1.57E-06 2.24E-07 6.72E-07 Line Rupture 2.40E-06 - 2.40E-07 6.72E-07 9.60E-08 2.88E-07 GRS_16 10 1.20E-05 2.40E-07 - 1.04E-06 1.20E-07 4.32E-08 25 1.20E-05 2.40E-07 - 9.50E-07 1.20E-07 1.30E-07 50 4.00E-06 8.00E-08 - 3.17E-07 4.00E-08 4.32E-08 100 4.00E-06 4.00E-07 - 1.12E-06 1.60E-07 4.80E-07 Line Rupture 2.00E-06 - 2.00E-07 5.60E-07 8.00E-08 2.40E-07 GRS_17 10 3.50E-06 7.00E-08 - 3.02E-07 3.50E-08 1.26E-08 25 3.50E-06 7.00E-08 - 2.77E-07 3.50E-08 3.78E-08 50 2.45E-06 4.90E-08 - 1.94E-07 2.45E-08 2.65E-08 100 2.45E-06 2.45E-07 - 6.86E-07 9.80E-08 2.94E-07 Line Rupture 1.05E-06 - 1.05E-07 2.94E-07 4.20E-08 1.26E-07 GRS_18 10 2.65E-05 5.30E-07 - 2.29E-06 2.65E-07 9.54E-08 25 2.65E-05 5.30E-07 - 2.10E-06 2.65E-07 2.86E-07

ENVIRONMENTAL RESOURCES MANAGEMENT CLP POWER HONG KONG LIMITED ANNEX 5F_FREQUENCY ANALYSIS.DOC JUNE 2018
5F-34
Hazardous Section
Leak Size (mm) Release Frequency (per year) Hazardous Event Frequency (per year)
Jet Fire Fireball Flash Fire Over Plant Area
Flash Fire Full Extent
Vapour Cloud Explosion
50 1.86E-05 3.71E-07 - 1.47E-06 1.86E-07 2.00E-07 100 1.86E-05 3.71E-07 - 1.47E-06 1.86E-07 2.00E-07 Line Rupture 7.95E-06 - 7.95E-07 2.23E-06 3.18E-07 9.54E-07 GRS_19 10 8.71E-07 1.74E-08 - 7.53E-08 8.71E-09 3.14E-09 25 8.71E-07 1.74E-08 - 6.90E-08 8.71E-09 9.41E-09 50 6.10E-07 1.22E-08 - 4.83E-08 6.10E-09 6.58E-09 100 6.10E-07 6.10E-08 - 1.71E-07 2.44E-08 7.32E-08 Line Rupture 2.61E-07 - 2.61E-08 7.32E-08 1.05E-08 3.14E-08

ENVIRONMENTAL RESOURCES MANAGEMENT CLP POWER HONG KONG LIMITED ANNEX 5F_FREQUENCY ANALYSIS.DOC JUNE 2018
5F-35
Table 5F.31 Hazardous Event Frequency: QRA Study for GRS at the LPS
Hazardous Section
Leak Size (mm) Release Frequency (per year)
Hazardous Event Frequency
Jet Fire Fireball Flash Fire Over Plant Area
Flash Fire Full Extent
Vapour Cloud Explosion
NGRS_01 10 1.50E-05 3.00E-07 - 1.19E-06 1.50E-07 1.62E-07 25 1.50E-05 3.00E-07 - 1.19E-06 1.50E-07 1.62E-07 50 5.00E-06 1.00E-07 - 3.96E-07 5.00E-08 5.40E-08
100 5.00E-06 5.00E-07 - 1.40E-06 2.00E-07 6.00E-07 Line Rupture 2.50E-06 - 2.50E-07 7.00E-07 1.00E-07 3.00E-07 NGRS_02 10 1.50E-05 3.00E-07 - 1.19E-06 1.50E-07 1.62E-07
25 1.50E-05 3.00E-07 - 1.19E-06 1.50E-07 1.62E-07 50 5.00E-06 1.00E-07 - 3.96E-07 5.00E-08 5.40E-08
100 5.00E-06 5.00E-07 - 1.40E-06 2.00E-07 6.00E-07 Line Rupture 2.50E-06 - 2.50E-07 7.00E-07 1.00E-07 3.00E-07 NGRS_03 10 3.00E-07 3.00E-07 - 1.19E-06 1.50E-07 1.62E-07
25 3.00E-07 3.00E-07 - 1.19E-06 1.50E-07 1.62E-07 50 1.00E-07 1.00E-07 - 3.96E-07 5.00E-08 5.40E-08
100 5.00E-07 5.00E-07 - 1.40E-06 2.00E-07 6.00E-07 Line Rupture 2.50E-07 - 2.50E-07 7.00E-07 1.00E-07 3.00E-07 NGRS_04 10 1.50E-05 3.00E-07 - 1.19E-06 1.50E-07 1.62E-07
25 1.50E-05 3.00E-07 - 1.19E-06 1.50E-07 1.62E-07 50 5.00E-06 1.00E-07 - 3.96E-07 5.00E-08 5.40E-08
100 5.00E-06 5.00E-07 - 1.40E-06 2.00E-07 6.00E-07 Line Rupture 2.50E-06 - 2.50E-07 7.00E-07 1.00E-07 3.00E-07 NGRS_05 10 1.50E-05 3.00E-07 - 1.19E-06 1.50E-07 1.62E-07
25 1.50E-05 3.00E-07 - 1.19E-06 1.50E-07 1.62E-07 50 5.00E-06 1.00E-07 - 3.96E-07 5.00E-08 5.40E-08
100 5.00E-06 5.00E-07 - 1.40E-06 2.00E-07 6.00E-07 Line Rupture 2.50E-06 - 2.50E-07 7.00E-07 1.00E-07 3.00E-07 NGRS_06 10 1.50E-05 3.00E-07 - 1.19E-06 1.50E-07 1.62E-07
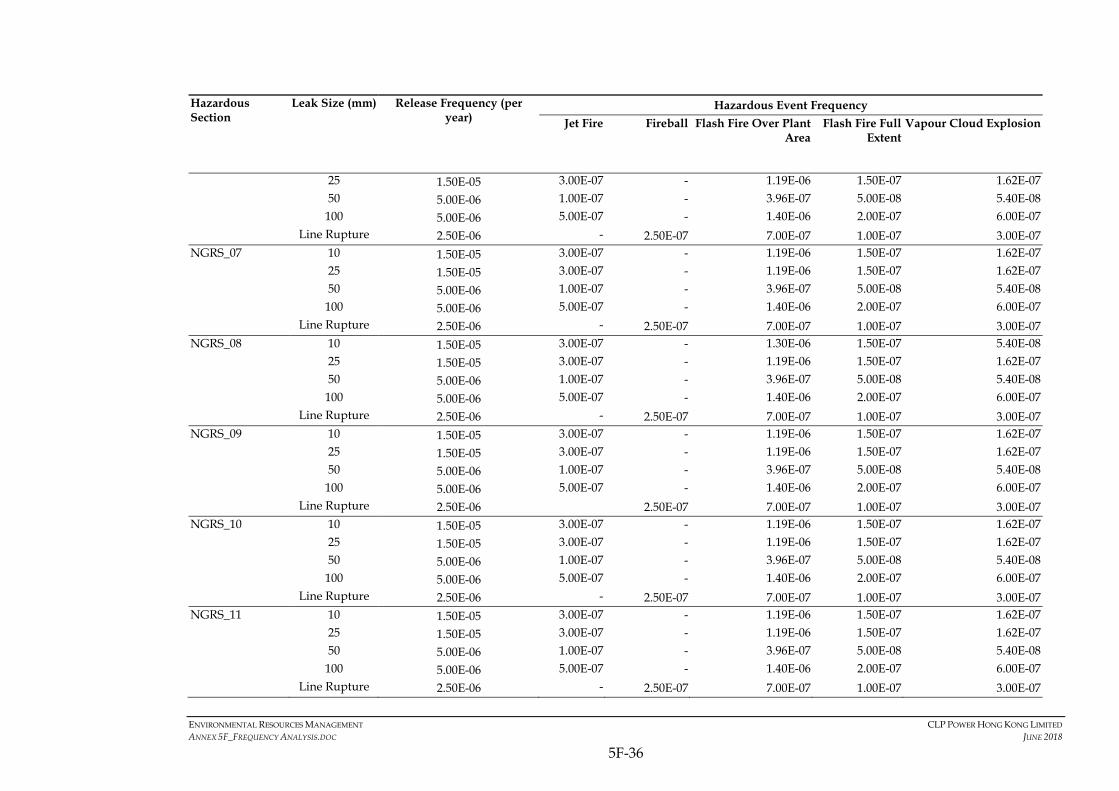
ENVIRONMENTAL RESOURCES MANAGEMENT CLP POWER HONG KONG LIMITED ANNEX 5F_FREQUENCY ANALYSIS.DOC JUNE 2018
5F-36
Hazardous Section
Leak Size (mm) Release Frequency (per year)
Hazardous Event Frequency
Jet Fire Fireball Flash Fire Over Plant Area
Flash Fire Full Extent
Vapour Cloud Explosion
25 1.50E-05 3.00E-07 - 1.19E-06 1.50E-07 1.62E-07 50 5.00E-06 1.00E-07 - 3.96E-07 5.00E-08 5.40E-08
100 5.00E-06 5.00E-07 - 1.40E-06 2.00E-07 6.00E-07 Line Rupture 2.50E-06 - 2.50E-07 7.00E-07 1.00E-07 3.00E-07 NGRS_07 10 1.50E-05 3.00E-07 - 1.19E-06 1.50E-07 1.62E-07
25 1.50E-05 3.00E-07 - 1.19E-06 1.50E-07 1.62E-07 50 5.00E-06 1.00E-07 - 3.96E-07 5.00E-08 5.40E-08
100 5.00E-06 5.00E-07 - 1.40E-06 2.00E-07 6.00E-07 Line Rupture 2.50E-06 - 2.50E-07 7.00E-07 1.00E-07 3.00E-07 NGRS_08 10 1.50E-05 3.00E-07 - 1.30E-06 1.50E-07 5.40E-08
25 1.50E-05 3.00E-07 - 1.19E-06 1.50E-07 1.62E-07 50 5.00E-06 1.00E-07 - 3.96E-07 5.00E-08 5.40E-08
100 5.00E-06 5.00E-07 - 1.40E-06 2.00E-07 6.00E-07 Line Rupture 2.50E-06 - 2.50E-07 7.00E-07 1.00E-07 3.00E-07 NGRS_09 10 1.50E-05 3.00E-07 - 1.19E-06 1.50E-07 1.62E-07
25 1.50E-05 3.00E-07 - 1.19E-06 1.50E-07 1.62E-07 50 5.00E-06 1.00E-07 - 3.96E-07 5.00E-08 5.40E-08
100 5.00E-06 5.00E-07 - 1.40E-06 2.00E-07 6.00E-07 Line Rupture 2.50E-06 2.50E-07 7.00E-07 1.00E-07 3.00E-07 NGRS_10 10 1.50E-05 3.00E-07 - 1.19E-06 1.50E-07 1.62E-07
25 1.50E-05 3.00E-07 - 1.19E-06 1.50E-07 1.62E-07 50 5.00E-06 1.00E-07 - 3.96E-07 5.00E-08 5.40E-08
100 5.00E-06 5.00E-07 - 1.40E-06 2.00E-07 6.00E-07 Line Rupture 2.50E-06 - 2.50E-07 7.00E-07 1.00E-07 3.00E-07 NGRS_11 10 1.50E-05 3.00E-07 - 1.19E-06 1.50E-07 1.62E-07
25 1.50E-05 3.00E-07 - 1.19E-06 1.50E-07 1.62E-07 50 5.00E-06 1.00E-07 - 3.96E-07 5.00E-08 5.40E-08
100 5.00E-06 5.00E-07 - 1.40E-06 2.00E-07 6.00E-07 Line Rupture 2.50E-06 - 2.50E-07 7.00E-07 1.00E-07 3.00E-07

ENVIRONMENTAL RESOURCES MANAGEMENT CLP POWER HONG KONG LIMITED ANNEX 5F_FREQUENCY ANALYSIS.DOC JUNE 2018
5F-37
Hazardous Section
Leak Size (mm) Release Frequency (per year)
Hazardous Event Frequency
Jet Fire Fireball Flash Fire Over Plant Area
Flash Fire Full Extent
Vapour Cloud Explosion
NGRS_12 10 1.50E-05 3.00E-07 - 1.19E-06 1.50E-07 1.62E-07 25 1.50E-05 3.00E-07 - 1.19E-06 1.50E-07 1.62E-07 50 5.00E-06 1.00E-07 - 3.96E-07 5.00E-08 5.40E-08
100 5.00E-06 5.00E-07 - 1.40E-06 2.00E-07 6.00E-07 Line Rupture 2.50E-06 - 2.50E-07 7.00E-07 1.00E-07 3.00E-07 NGRS_13 10 1.50E-05 3.00E-07 - 1.19E-06 1.50E-07 1.62E-07
25 1.50E-05 3.00E-07 - 1.19E-06 1.50E-07 1.62E-07 50 5.00E-06 1.00E-07 - 3.96E-07 5.00E-08 5.40E-08
100 5.00E-06 5.00E-07 - 1.40E-06 2.00E-07 6.00E-07 Line Rupture 2.50E-06 - 2.50E-07 7.00E-07 1.00E-07 3.00E-07 NGRS_14 10 1.50E-05 3.00E-07 - 1.30E-06 1.50E-07 5.40E-08
25 1.50E-05 3.00E-07 - 1.19E-06 1.50E-07 1.62E-07 50 5.00E-06 1.00E-07 - 3.96E-07 5.00E-08 5.40E-08
100 5.00E-06 5.00E-07 - 1.40E-06 2.00E-07 6.00E-07 Line Rupture 2.50E-06 - 2.50E-07 7.00E-07 1.00E-07 3.00E-07 NGRS_15 10 1.50E-05 3.00E-07 - 1.19E-06 1.50E-07 1.62E-07
25 1.50E-05 3.00E-07 - 1.19E-06 1.50E-07 1.62E-07 50 5.00E-06 1.00E-07 - 3.96E-07 5.00E-08 5.40E-08
100 5.00E-06 5.00E-07 - 1.40E-06 2.00E-07 6.00E-07 Line Rupture 2.50E-06 - 2.50E-07 7.00E-07 1.00E-07 3.00E-07 NGRS_16 10 1.50E-05 3.00E-07 - 1.19E-06 1.50E-07 1.62E-07
25 1.50E-05 3.00E-07 - 1.19E-06 1.50E-07 1.62E-07 50 5.00E-06 1.00E-07 - 3.96E-07 5.00E-08 5.40E-08
100 5.00E-06 5.00E-07 - 1.40E-06 2.00E-07 6.00E-07 Line Rupture 2.50E-06 - 2.50E-07 7.00E-07 1.00E-07 3.00E-07 NGRS_17 10 1.50E-05 3.00E-07 - 1.19E-06 1.50E-07 1.62E-07
25 1.50E-05 3.00E-07 - 1.19E-06 1.50E-07 1.62E-07 50 5.00E-06 1.00E-07 - 3.96E-07 5.00E-08 5.40E-08
100 5.00E-06 5.00E-07 - 1.40E-06 2.00E-07 6.00E-07

ENVIRONMENTAL RESOURCES MANAGEMENT CLP POWER HONG KONG LIMITED ANNEX 5F_FREQUENCY ANALYSIS.DOC JUNE 2018
5F-38
Hazardous Section
Leak Size (mm) Release Frequency (per year)
Hazardous Event Frequency
Jet Fire Fireball Flash Fire Over Plant Area
Flash Fire Full Extent
Vapour Cloud Explosion
Line Rupture 2.50E-06 - 2.50E-07 7.00E-07 1.00E-07 3.00E-07 NGRS_18 10 1.50E-05 3.00E-07 - 1.19E-06 1.50E-07 1.62E-07
25 1.50E-05 3.00E-07 - 1.19E-06 1.50E-07 1.62E-07 50 5.00E-06 1.00E-07 - 3.96E-07 5.00E-08 5.40E-08
100 5.00E-06 5.00E-07 - 1.40E-06 2.00E-07 6.00E-07 Line Rupture 2.50E-06 - 2.50E-07 7.00E-07 1.00E-07 3.00E-07 NGRS_19 10 1.50E-05 3.00E-07 - 1.19E-06 1.50E-07 1.62E-07
25 1.50E-05 3.00E-07 - 1.19E-06 1.50E-07 1.62E-07 50 5.00E-06 1.00E-07 - 3.96E-07 5.00E-08 5.40E-08
100 5.00E-06 5.00E-07 - 1.40E-06 2.00E-07 6.00E-07 Line Rupture 2.50E-06 - 2.50E-07 7.00E-07 1.00E-07 3.00E-07 NGRS_20 10 1.50E-05 3.00E-07 - 1.30E-06 1.50E-07 5.40E-08
25 1.50E-05 3.00E-07 - 1.19E-06 1.50E-07 1.62E-07 50 5.00E-06 1.00E-07 - 3.96E-07 5.00E-08 5.40E-08
100 5.00E-06 5.00E-07 - 1.40E-06 2.00E-07 6.00E-07 Line Rupture 2.50E-06 - 2.50E-07 7.00E-07 1.00E-07 3.00E-07 NGRS_21 10 1.50E-05 3.00E-07 - 1.19E-06 1.50E-07 1.62E-07
25 1.50E-05 3.00E-07 - 1.19E-06 1.50E-07 1.62E-07 50 5.00E-06 1.00E-07 - 3.96E-07 5.00E-08 5.40E-08
100 5.00E-06 5.00E-07 - 1.40E-06 2.00E-07 6.00E-07 Line Rupture 2.50E-06 - 2.50E-07 7.00E-07 1.00E-07 3.00E-07 NGRS_22 10 1.50E-05 3.00E-07 - 1.19E-06 1.50E-07 1.62E-07
25 1.50E-05 3.00E-07 - 1.19E-06 1.50E-07 1.62E-07 50 5.00E-06 1.00E-07 - 3.96E-07 5.00E-08 5.40E-08
100 5.00E-06 5.00E-07 - 1.40E-06 2.00E-07 6.00E-07 Line Rupture 2.50E-06 - 2.50E-07 7.00E-07 1.00E-07 3.00E-07 NGRS_23 10 1.50E-05 3.00E-07 - 1.19E-06 1.50E-07 1.62E-07
25 1.50E-05 3.00E-07 - 1.19E-06 1.50E-07 1.62E-07 50 5.00E-06 1.00E-07 - 3.96E-07 5.00E-08 5.40E-08

ENVIRONMENTAL RESOURCES MANAGEMENT CLP POWER HONG KONG LIMITED ANNEX 5F_FREQUENCY ANALYSIS.DOC JUNE 2018
5F-39
Hazardous Section
Leak Size (mm) Release Frequency (per year)
Hazardous Event Frequency
Jet Fire Fireball Flash Fire Over Plant Area
Flash Fire Full Extent
Vapour Cloud Explosion
100 5.00E-06 5.00E-07 - 1.40E-06 2.00E-07 6.00E-07 Line Rupture 2.50E-06 - 2.50E-07 7.00E-07 1.00E-07 3.00E-07 NGRS_24 10 1.50E-05 3.00E-07 - 1.19E-06 1.50E-07 1.62E-07
25 1.50E-05 3.00E-07 - 1.19E-06 1.50E-07 1.62E-07 50 5.00E-06 1.00E-07 - 3.96E-07 5.00E-08 5.40E-08
100 5.00E-06 5.00E-07 - 1.40E-06 2.00E-07 6.00E-07 Line Rupture 2.50E-06 - 2.50E-07 7.00E-07 1.00E-07 3.00E-07 NGRS_25 10 1.50E-05 3.00E-07 - 1.19E-06 1.50E-07 1.62E-07
25 1.50E-05 3.00E-07 - 1.19E-06 1.50E-07 1.62E-07 50 5.00E-06 1.00E-07 - 3.96E-07 5.00E-08 5.40E-08
100 5.00E-06 5.00E-07 - 1.40E-06 2.00E-07 6.00E-07 Line Rupture 2.50E-06 - 2.50E-07 7.00E-07 1.00E-07 3.00E-07 NGRS_26 10 1.50E-05 3.00E-07 - 1.30E-06 1.50E-07 5.40E-08
25 1.50E-05 3.00E-07 - 1.19E-06 1.50E-07 1.62E-07 50 5.00E-06 1.00E-07 - 3.96E-07 5.00E-08 5.40E-08
100 5.00E-06 5.00E-07 - 1.40E-06 2.00E-07 6.00E-07 Line Rupture 2.50E-06 - 2.50E-07 7.00E-07 1.00E-07 3.00E-07 NGRS_27 10 1.50E-05 3.00E-07 - 1.19E-06 1.50E-07 1.62E-07
25 1.50E-05 3.00E-07 - 1.19E-06 1.50E-07 1.62E-07 50 5.00E-06 1.00E-07 - 3.96E-07 5.00E-08 5.40E-08
100 5.00E-06 5.00E-07 - 1.40E-06 2.00E-07 6.00E-07 Line Rupture 2.50E-06 - 2.50E-07 7.00E-07 1.00E-07 3.00E-07 NGRS_28 10 1.50E-05 3.00E-07 - 1.19E-06 1.50E-07 1.62E-07
25 1.50E-05 3.00E-07 - 1.19E-06 1.50E-07 1.62E-07 50 5.00E-06 1.00E-07 - 3.96E-07 5.00E-08 5.40E-08
100 5.00E-06 5.00E-07 - 1.40E-06 2.00E-07 6.00E-07 Line Rupture 2.50E-06 - 2.50E-07 7.00E-07 1.00E-07 3.00E-07 NGRS_29 10 1.50E-05 3.00E-07 - 1.19E-06 1.50E-07 1.62E-07
25 1.50E-05 3.00E-07 - 1.19E-06 1.50E-07 1.62E-07

ENVIRONMENTAL RESOURCES MANAGEMENT CLP POWER HONG KONG LIMITED ANNEX 5F_FREQUENCY ANALYSIS.DOC JUNE 2018
5F-40
Hazardous Section
Leak Size (mm) Release Frequency (per year)
Hazardous Event Frequency
Jet Fire Fireball Flash Fire Over Plant Area
Flash Fire Full Extent
Vapour Cloud Explosion
50 5.00E-06 1.00E-07 - 3.96E-07 5.00E-08 5.40E-08
100 5.00E-06 5.00E-07 - 1.40E-06 2.00E-07 6.00E-07 Line Rupture 2.50E-06 - 2.50E-07 7.00E-07 1.00E-07 3.00E-07 NGRS_30 10 1.50E-05 3.00E-07 - 1.19E-06 1.50E-07 1.62E-07
25 1.50E-05 3.00E-07 - 1.19E-06 1.50E-07 1.62E-07 50 5.00E-06 1.00E-07 - 3.96E-07 5.00E-08 5.40E-08
100 5.00E-06 5.00E-07 - 1.40E-06 2.00E-07 6.00E-07 Line Rupture 2.50E-06 - 2.50E-07 7.00E-07 1.00E-07 3.00E-07 NGRS_31 10 1.50E-05 3.00E-07 - 1.19E-06 1.50E-07 1.62E-07
25 1.50E-05 3.00E-07 - 1.19E-06 1.50E-07 1.62E-07 50 5.00E-06 1.00E-07 - 3.96E-07 5.00E-08 5.40E-08
100 5.00E-06 5.00E-07 - 1.40E-06 2.00E-07 6.00E-07 Line Rupture 2.50E-06 - 2.50E-07 7.00E-07 1.00E-07 3.00E-07 NGRS_32 10 1.50E-05 3.00E-07 - 1.30E-06 1.50E-07 5.40E-08
25 1.50E-05 3.00E-07 - 1.19E-06 1.50E-07 1.62E-07 50 5.00E-06 1.00E-07 - 3.96E-07 5.00E-08 5.40E-08
100 5.00E-06 5.00E-07 - 1.40E-06 2.00E-07 6.00E-07 Line Rupture 2.50E-06 - 2.50E-07 7.00E-07 1.00E-07 3.00E-07 NGRS_33 10 1.50E-05 3.00E-07 - 1.19E-06 1.50E-07 1.62E-07
25 1.50E-05 3.00E-07 - 1.19E-06 1.50E-07 1.62E-07 50 5.00E-06 1.00E-07 - 3.96E-07 5.00E-08 5.40E-08
100 5.00E-06 5.00E-07 - 1.40E-06 2.00E-07 6.00E-07 Line Rupture 2.50E-06 - 2.50E-07 7.00E-07 1.00E-07 3.00E-07 NGRS_34 10 1.50E-05 3.00E-07 - 1.19E-06 1.50E-07 1.62E-07
25 1.50E-05 3.00E-07 - 1.19E-06 1.50E-07 1.62E-07 50 5.00E-06 1.00E-07 - 3.96E-07 5.00E-08 5.40E-08
100 5.00E-06 5.00E-07 - 1.40E-06 2.00E-07 6.00E-07 Line Rupture 2.50E-06 - 2.50E-07 7.00E-07 1.00E-07 3.00E-07 NGRS_35 10 1.50E-05 3.00E-07 - 1.19E-06 1.50E-07 1.62E-07

ENVIRONMENTAL RESOURCES MANAGEMENT CLP POWER HONG KONG LIMITED ANNEX 5F_FREQUENCY ANALYSIS.DOC JUNE 2018
5F-41
Hazardous Section
Leak Size (mm) Release Frequency (per year)
Hazardous Event Frequency
Jet Fire Fireball Flash Fire Over Plant Area
Flash Fire Full Extent
Vapour Cloud Explosion
25 1.50E-05 3.00E-07 - 1.19E-06 1.50E-07 1.62E-07 50 5.00E-06 1.00E-07 - 3.96E-07 5.00E-08 5.40E-08
100 5.00E-06 5.00E-07 - 1.40E-06 2.00E-07 6.00E-07 Line Rupture 2.50E-06 - 2.50E-07 7.00E-07 1.00E-07 3.00E-07 GRS_01 10 2.40E-05 4.80E-07 - 1.90E-06 2.40E-07 2.59E-07 25 2.40E-05 4.80E-07 - 1.90E-06 2.40E-07 2.59E-07 50 8.00E-06 1.60E-07 - 6.34E-07 8.00E-08 8.64E-08 100 8.00E-06 8.00E-07 - 2.24E-06 3.20E-07 9.60E-07 Line Rupture 4.00E-06 - 4.80E-07 1.12E-06 1.60E-07 4.80E-07 GRS_02 10 1.20E-05 2.40E-07 - 9.50E-07 1.20E-07 1.30E-07 25 1.20E-05 2.40E-07 - 9.50E-07 1.20E-07 1.30E-07 50 4.00E-06 8.00E-08 - 3.17E-07 4.00E-08 4.32E-08 100 4.00E-06 4.00E-07 - 1.12E-06 1.60E-07 4.80E-07 Line Rupture 2.00E-06 - 2.00E-07 5.60E-07 8.00E-08 2.40E-07 GRS_03 10 9.00E-06 1.80E-07 - 7.13E-07 9.00E-08 9.72E-08 25 9.00E-06 1.80E-07 - 7.13E-07 9.00E-08 9.72E-08 50 3.00E-06 6.00E-08 - 2.38E-07 3.00E-08 3.24E-08 100 3.00E-06 3.00E-07 - 8.40E-07 1.20E-07 3.60E-07 Line Rupture 1.50E-06 - 1.50E-07 4.20E-07 6.00E-08 1.80E-07 GRS_04 10 1.80E-05 3.60E-07 - 1.43E-06 1.80E-07 1.94E-07 25 1.80E-05 3.60E-07 - 1.43E-06 1.80E-07 1.94E-07 50 6.00E-06 1.20E-07 - 4.75E-07 6.00E-08 6.48E-08 100 6.00E-06 6.00E-07 - 1.68E-06 2.40E-07 7.20E-07 Line Rupture 3.00E-06 - 3.00E-07 8.40E-07 1.20E-07 3.60E-07 GRS_05 10 1.35E-05 2.70E-07 - 1.17E-06 1.35E-07 4.86E-08 25 1.35E-05 2.70E-07 - 1.07E-06 1.35E-07 1.46E-07 50 4.50E-06 9.00E-08 - 3.56E-07 4.50E-08 4.86E-08 100 4.50E-06 9.00E-08 - 3.56E-07 4.50E-08 4.86E-08 Line Rupture 2.25E-06 - 2.25E-07 6.30E-07 9.00E-08 2.70E-07

ENVIRONMENTAL RESOURCES MANAGEMENT CLP POWER HONG KONG LIMITED ANNEX 5F_FREQUENCY ANALYSIS.DOC JUNE 2018
5F-42
Hazardous Section
Leak Size (mm) Release Frequency (per year)
Hazardous Event Frequency
Jet Fire Fireball Flash Fire Over Plant Area
Flash Fire Full Extent
Vapour Cloud Explosion
GRS_06 10 1.80E-05 3.60E-07 - 1.43E-06 1.80E-07 1.94E-07 25 1.80E-05 3.60E-07 - 1.43E-06 1.80E-07 1.94E-07 50 6.00E-06 1.20E-07 - 4.75E-07 6.00E-08 6.48E-08 100 6.00E-06 6.00E-07 - 1.68E-06 2.40E-07 7.20E-07 Line Rupture 3.00E-06 - 3.00E-07 8.40E-07 1.20E-07 3.60E-07 GRS_07 10 1.35E-05 2.70E-07 - 1.07E-06 1.35E-07 1.46E-07 25 1.35E-05 2.70E-07 - 1.07E-06 1.35E-07 1.46E-07 50 4.50E-06 9.00E-08 - 3.56E-07 4.50E-08 4.86E-08 100 4.50E-06 4.50E-07 - 1.26E-06 1.80E-07 5.40E-07 Line Rupture 2.25E-06 - 2.25E-07 6.30E-07 9.00E-08 2.70E-07 GRS_08 10 1.95E-05 3.90E-07 - 1.54E-06 1.95E-07 2.11E-07 25 1.95E-05 3.90E-07 - 1.54E-06 1.95E-07 2.11E-07 50 6.50E-06 1.30E-07 - 5.15E-07 6.50E-08 7.02E-08 100 6.50E-06 6.50E-07 - 1.82E-06 2.60E-07 7.80E-07 Line Rupture 3.25E-06 - 3.25E-07 9.10E-07 1.30E-07 3.90E-07 GRS_09 10 3.60E-05 7.20E-07 - 3.11E-06 3.60E-07 1.30E-07 25 3.60E-05 7.20E-07 - 2.85E-06 3.60E-07 3.89E-07 50 1.20E-05 2.40E-07 - 9.50E-07 1.20E-07 1.30E-07 100 1.20E-05 1.20E-06 - 3.36E-06 4.80E-07 1.44E-06 Line Rupture 6.00E-06 - 6.00E-07 1.68E-06 2.40E-07 7.20E-07 GRS_10 10 1.05E-05 2.10E-07 - 8.32E-07 1.05E-07 1.13E-07 25 1.05E-05 2.10E-07 - 8.32E-07 1.05E-07 1.13E-07 50 3.50E-06 7.00E-08 - 2.77E-07 3.50E-08 3.78E-08 100 3.50E-06 3.50E-07 - 9.80E-07 1.40E-07 4.20E-07 Line Rupture 1.75E-06 - 1.75E-07 4.90E-07 7.00E-08 2.10E-07

Environmental Resources Management
Figure 5F.1
Immediate
Ignition
Delayed
Ignition
Event Outcome
Release Yes Pool fire
No Yes Flash fire
No Unignited release
Event Tree Analysis for LNG Release from LNGC
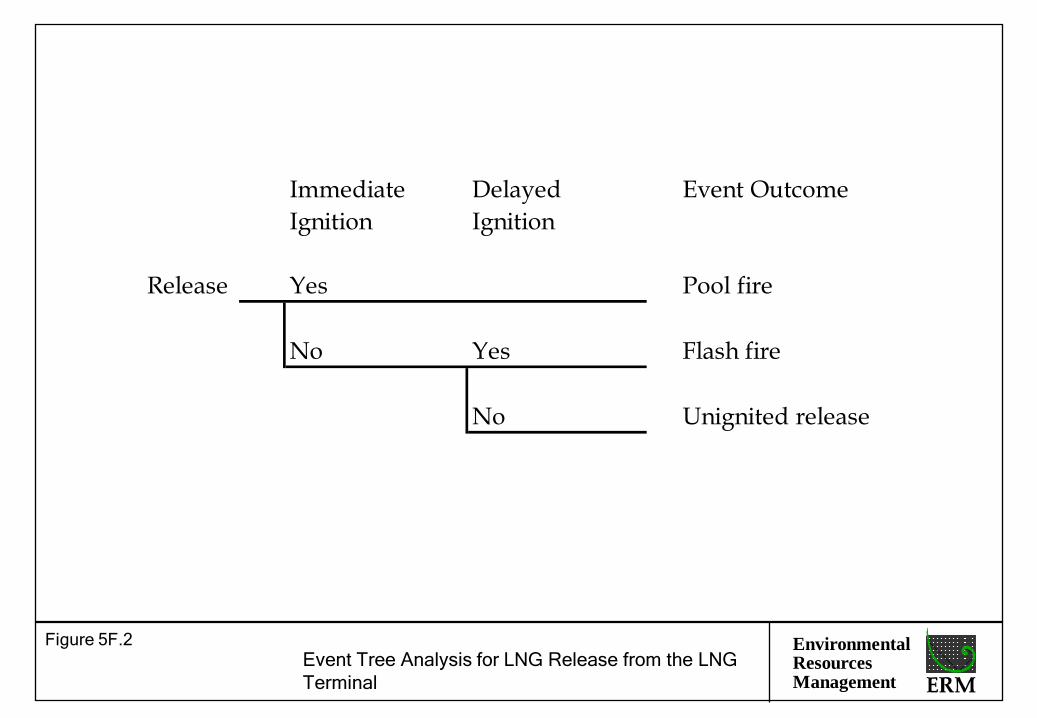
Environmental Resources Management
Figure 5F.2
Immediate
Ignition
Delayed
Ignition
Event Outcome
Release Yes Pool fire
No Yes Flash fire
No Unignited release
Event Tree Analysis for LNG Release from the LNG
Terminal
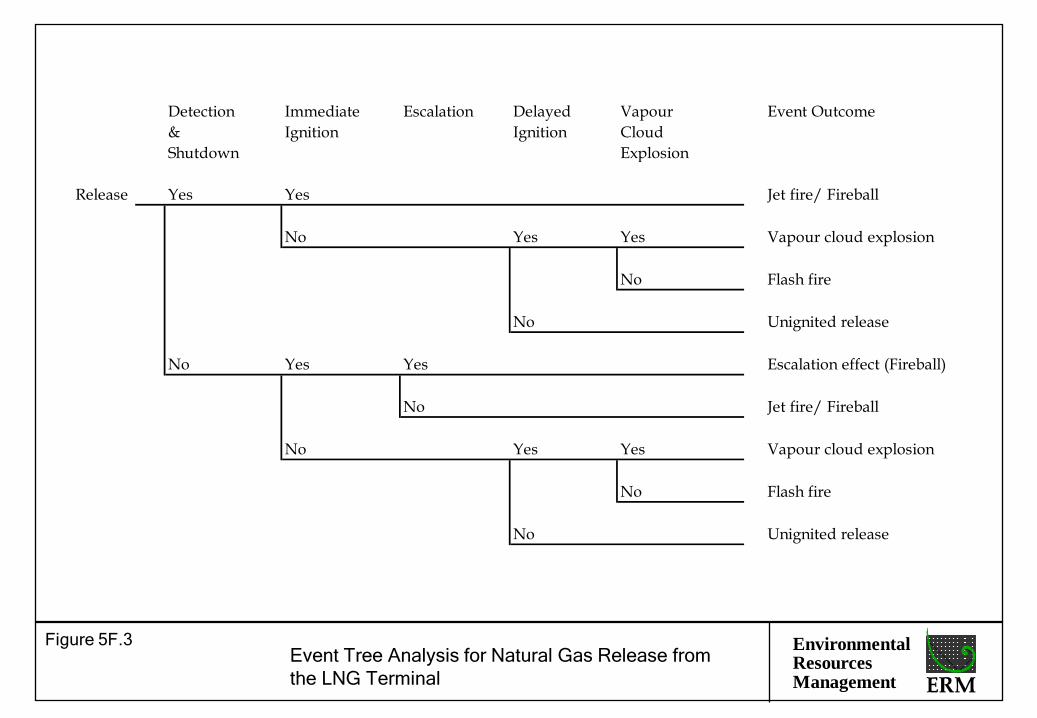
Environmental Resources Management
Event Tree Analysis for Natural Gas Release from
the LNG Terminal
Figure 5F.3
Detection
&
Shutdown
Immediate
Ignition
Escalation Delayed
Ignition
Vapour
Cloud
Explosion
Event Outcome
Release Yes Yes Jet fire/ Fireball
No Yes Yes Vapour cloud explosion
No Flash fire
No Unignited release
No Yes Yes Escalation effect (Fireball)
No Jet fire/ Fireball
No Yes Yes Vapour cloud explosion
No Flash fire
No Unignited release

Environmental Resources Management
Event Tree Analysis for Diesel Release from the
LNG Terminal
Figure 5F.4
Immediate
Ignition
Delayed
Ignition
Hazardous
Scenarios
Release Yes Pool fire
No Yes Flash fire
No
Unignited release

Environmental Resources Management
Event Tree Analysis for Natural Gas Release from
Subsea Pipeline (External Damage from Anchors)
Figure 5F.5
Anchor
damage
Ship in
vicinity
Igntion Passing
vessel
Release
area
Ignition Event Outcome
Release Yes Yes Flash fire
No No Yes Yes Yes Flash fire
No No effect
No Yes Flash fire
No No effect
No No effect

Environmental Resources Management
Event Tree Analysis for Natural Gas Release from
Subsea Pipeline (Spontaneous Failures)
Figure 5F.6
Corrosion
or Other
failure
Passing
vessel
Release
area
Ignition Event Outcome
Release Yes Yes Yes Flash fire
No No effect
No Yes Flash fire
No No effect
No No effect

Environmental Resources Management
Fault Tree Diagram for Construction Vehicle Impact
on Existing BPPS GRS Facilities
Figure 5F.7

Environmental Resources Management
Fault Tree Diagram for Construction Vehicle Impact
on Existing LPS GRS Facilities
Figure 5F.8
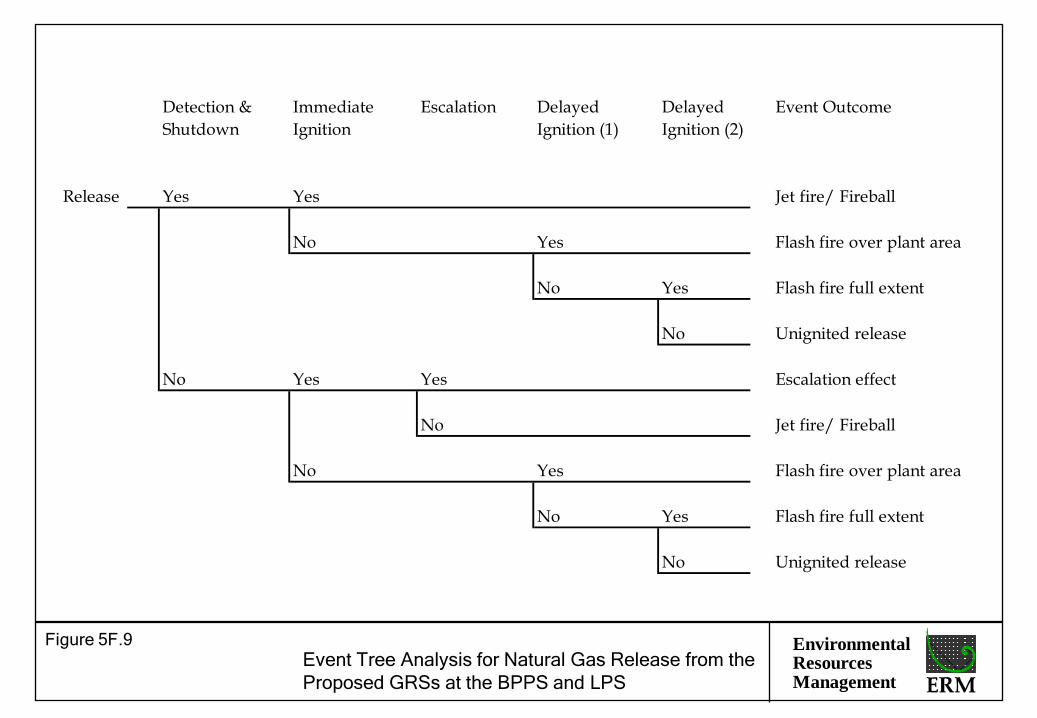
Environmental Resources Management
Event Tree Analysis for Natural Gas Release from the
Proposed GRSs at the BPPS and LPS
Figure 5F.9
Detection &
Shutdown
Immediate
Ignition
Escalation Delayed
Ignition (1)
Delayed
Ignition (2)
Event Outcome
Release Yes Yes Jet fire/ Fireball
No Yes Flash fire over plant area
No Yes Flash fire full extent
No Unignited release
No Yes Yes Escalation effect
No Jet fire/ Fireball
No Yes Flash fire over plant area
No Yes Flash fire full extent
No Unignited release

Annex 5F-1
Full List of Event Tree
Analysis for the LNG
Terminal
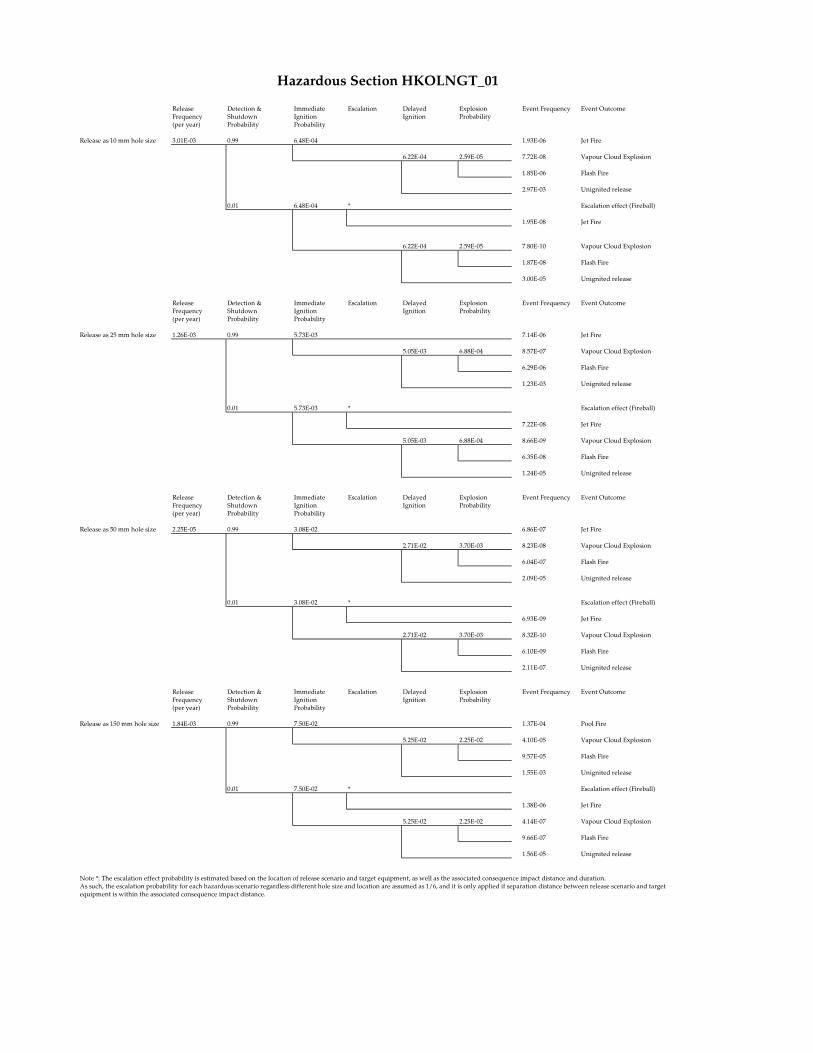
Hazardous Section HKOLNGT_01
Release Frequency (per year)
Detection & Shutdown Probability
Immediate Ignition Probability
Escalation Delayed Ignition
Explosion Probability
Event Frequency Event Outcome
Release as 10 mm hole size 3.01E-03 0.99 6.48E-04 1.93E-06 Jet Fire
6.22E-04 2.59E-05 7.72E-08 Vapour Cloud Explosion
1.85E-06 Flash Fire
2.97E-03 Unignited release
0.01 6.48E-04 * Escalation effect (Fireball)
1.95E-08 Jet Fire
6.22E-04 2.59E-05 7.80E-10 Vapour Cloud Explosion
1.87E-08 Flash Fire
3.00E-05 Unignited release
Release Frequency (per year)
Detection & Shutdown Probability
Immediate Ignition Probability
Escalation Delayed Ignition
Explosion Probability
Event Frequency Event Outcome
Release as 25 mm hole size 1.26E-03 0.99 5.73E-03 7.14E-06 Jet Fire
5.05E-03 6.88E-04 8.57E-07 Vapour Cloud Explosion
6.29E-06 Flash Fire
1.23E-03 Unignited release
0.01 5.73E-03 * Escalation effect (Fireball)
7.22E-08 Jet Fire
5.05E-03 6.88E-04 8.66E-09 Vapour Cloud Explosion
6.35E-08 Flash Fire
1.24E-05 Unignited release
Release Frequency (per year)
Detection & Shutdown Probability
Immediate Ignition Probability
Escalation Delayed Ignition
Explosion Probability
Event Frequency Event Outcome
Release as 50 mm hole size 2.25E-05 0.99 3.08E-02 6.86E-07 Jet Fire
2.71E-02 3.70E-03 8.23E-08 Vapour Cloud Explosion
6.04E-07 Flash Fire
2.09E-05 Unignited release
0.01 3.08E-02 * Escalation effect (Fireball)
6.93E-09 Jet Fire
2.71E-02 3.70E-03 8.32E-10 Vapour Cloud Explosion
6.10E-09 Flash Fire
2.11E-07 Unignited release
Release Frequency (per year)
Detection & Shutdown Probability
Immediate Ignition Probability
Escalation Delayed Ignition
Explosion Probability
Event Frequency Event Outcome
Release as 150 mm hole size 1.84E-03 0.99 7.50E-02 1.37E-04 Pool Fire
5.25E-02 2.25E-02 4.10E-05 Vapour Cloud Explosion
9.57E-05 Flash Fire
1.55E-03 Unignited release
0.01 7.50E-02 * Escalation effect (Fireball)
1.38E-06 Jet Fire
5.25E-02 2.25E-02 4.14E-07 Vapour Cloud Explosion
9.66E-07 Flash Fire
1.56E-05 Unignited release
Note *: The escalation effect probability is estimated based on the location of release scenario and target equipment, as well as the associated consequence impact distance and duration. As such, the escalation probability for each hazardous scenario regardless different hole size and location are assumed as 1/6, and it is only applied if separation distance between release scenario and target equipment is within the associated consequence impact distance.
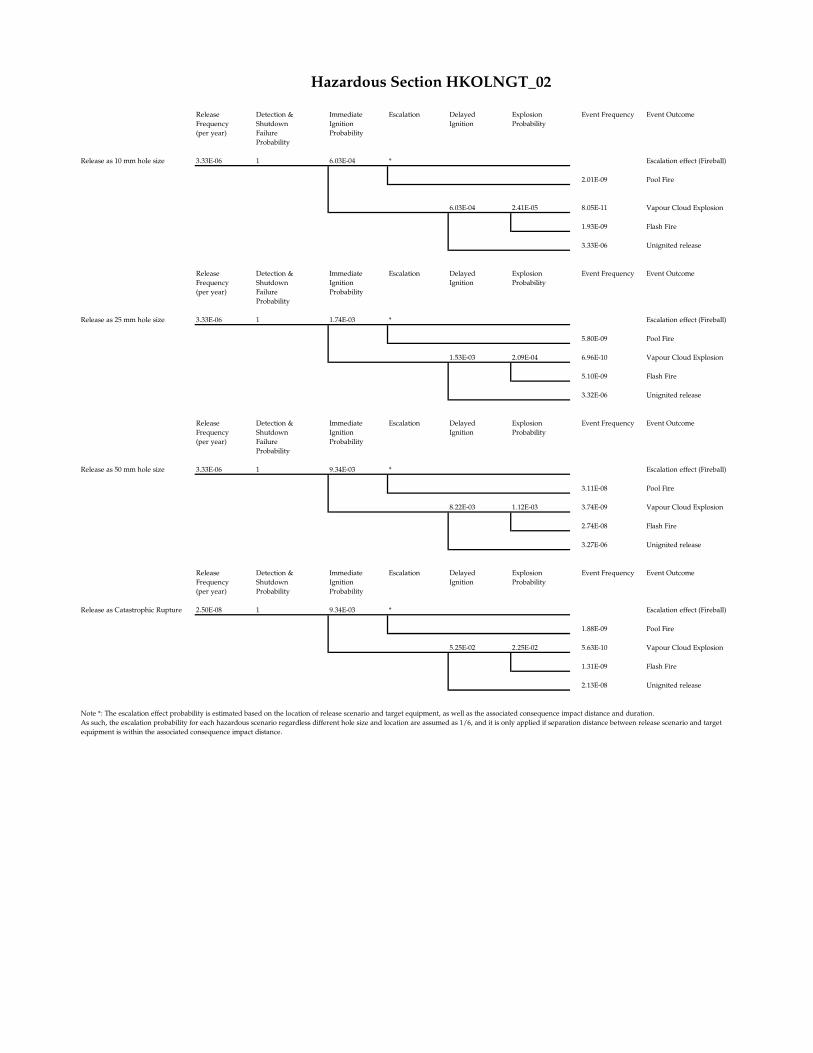
Hazardous Section HKOLNGT_02
Release
Frequency
(per year)
Detection &
Shutdown
Failure
Probability
Immediate
Ignition
Probability
Escalation Delayed
Ignition
Explosion
Probability
Event Frequency Event Outcome
Release as 10 mm hole size 3.33E-06 1 6.03E-04 * Escalation effect (Fireball)
2.01E-09 Pool Fire
6.03E-04 2.41E-05 8.05E-11 Vapour Cloud Explosion
1.93E-09 Flash Fire
3.33E-06 Unignited release
Release
Frequency
(per year)
Detection &
Shutdown
Failure
Probability
Immediate
Ignition
Probability
Escalation Delayed
Ignition
Explosion
Probability
Event Frequency Event Outcome
Release as 25 mm hole size 3.33E-06 1 1.74E-03 * Escalation effect (Fireball)
5.80E-09 Pool Fire
1.53E-03 2.09E-04 6.96E-10 Vapour Cloud Explosion
5.10E-09 Flash Fire
3.32E-06 Unignited release
Release
Frequency
(per year)
Detection &
Shutdown
Failure
Probability
Immediate
Ignition
Probability
Escalation Delayed
Ignition
Explosion
Probability
Event Frequency Event Outcome
Release as 50 mm hole size 3.33E-06 1 9.34E-03 * Escalation effect (Fireball)
3.11E-08 Pool Fire
8.22E-03 1.12E-03 3.74E-09 Vapour Cloud Explosion
2.74E-08 Flash Fire
3.27E-06 Unignited release
Release
Frequency
(per year)
Detection &
Shutdown
Probability
Immediate
Ignition
Probability
Escalation Delayed
Ignition
Explosion
Probability
Event Frequency Event Outcome
Release as Catastrophic Rupture 2.50E-08 1 9.34E-03 * Escalation effect (Fireball)
1.88E-09 Pool Fire
5.25E-02 2.25E-02 5.63E-10 Vapour Cloud Explosion
1.31E-09 Flash Fire
2.13E-08 Unignited release
Note *: The escalation effect probability is estimated based on the location of release scenario and target equipment, as well as the associated consequence impact distance and duration.
As such, the escalation probability for each hazardous scenario regardless different hole size and location are assumed as 1/6, and it is only applied if separation distance between release scenario and target
equipment is within the associated consequence impact distance.

Hazardous Section HKOLNGT_03
Release
Frequency
(per year)
Detection &
Shutdown
Probability
Immediate
Ignition
Probability
Escalation Delayed
Ignition
Explosion
Probability
Event Frequency Event Outcome
Release as 10 mm hole size 9.77E-03 0.99 7.61E-04 7.36E-06 Jet Fire
6.69E-04 9.13E-05 8.83E-07 Vapour Cloud Explosion
6.47E-06 Flash Fire
9.66E-03 Unignited release
0.01 7.61E-04 * Escalation effect (Fireball)
7.43E-08 Jet Fire
6.69E-04 9.13E-05 8.92E-09 Vapour Cloud Explosion
6.54E-08 Flash Fire
9.76E-05 Unignited release
Release
Frequency
(per year)
Detection &
Shutdown
Probability
Immediate
Ignition
Probability
Escalation Delayed
Ignition
Explosion
Probability
Event Frequency Event Outcome
Release as 25 mm hole size 8.20E-04 0.99 7.03E-03 5.71E-06 Jet Fire
6.19E-03 8.44E-04 8.83E-07 Vapour Cloud Explosion
5.02E-06 Flash Fire
8.00E-04 Unignited release
0.01 7.03E-03 * Escalation effect (Fireball)
5.77E-08 Jet Fire
6.19E-03 8.44E-04 6.92E-09 Vapour Cloud Explosion
5.08E-08 Flash Fire
8.08E-06 Unignited release
Release
Frequency
(per year)
Detection &
Shutdown
Probability
Immediate
Ignition
Probability
Escalation Delayed
Ignition
Explosion
Probability
Event Frequency Event Outcome
Release as 50 mm hole size 1.38E-04 0.99 3.78E-02 5.17E-06 Jet Fire
3.33E-02 4.54E-03 6.20E-07 Vapour Cloud Explosion
4.55E-06 Flash Fire
1.26E-04 Unignited release
0.01 3.78E-02 * Escalation effect (Fireball)
5.22E-08 Jet Fire
3.33E-02 4.54E-03 6.27E-09 Vapour Cloud Explosion
4.60E-08 Flash Fire
1.28E-06 Unignited release
Release
Frequency
(per year)
Detection &
Shutdown
Probability
Immediate
Ignition
Probability
Escalation Delayed
Ignition
Explosion
Probability
Event Frequency Event Outcome
Release as 150 mm hole size 7.50E-05 0.99 7.50E-02 5.57E-06 Pool Fire
5.25E-02 2.25E-02 1.67E-06 Vapour Cloud Explosion
3.90E-06 Flash Fire
6.31E-05 Unignited release
0.01 7.50E-02 * Escalation effect (Fireball)
5.63E-08 Pool Fire
5.25E-02 2.25E-02 1.69E-08 Vapour Cloud Explosion
3.94E-08 Flash Fire
6.38E-07 Unignited release
Note *: The escalation effect probability is estimated based on the location of release scenario and target equipment, as well as the associated consequence impact distance and duration.
As such, the escalation probability for each hazardous scenario regardless different hole size and location are assumed as 1/6, and it is only applied if separation distance between release scenario and target
equipment is within the associated consequence impact distance.

Hazardous Section HKOLNGT_04
Release
Frequency
(per year)
Detection &
Shutdown
Immediate
Ignition
Escalation Delayed
Ignition
Vapour Cloud
Explosion
Event Frequency Event Outcome
Release as 10 mm hole size 2.44E-02 0.99 3.47E-03 8.41E-05 Jet fire
3.06E-03 4.17E-04 1.01E-05 Vapour cloud explosion
7.40E-05 Flash fire
2.40E-02 Unignited release
0.01 3.47E-03 * Escalation effect (Fireball)
8.49E-07 Jet fire
3.06E-03 4.17E-04 1.02E-07 Vapour cloud explosion
7.47E-07 Flash fire
2.43E-04 Unignited release
Release
Frequency
(per year)
Detection &
Shutdown
Immediate
Ignition
Escalation Delayed
Ignition
Vapour Cloud
Explosion
Event Frequency Event Outcome
Release as 25 mm hole size 1.64E-03 0.99 3.21E-02 5.22E-05 Jet fire
2.83E-02 3.85E-03 6.27E-06 Vapour cloud explosion
4.60E-05 Flash fire
1.52E-03 Unignited release
0.01 3.21E-02 * Escalation effect (Fireball)
5.27E-07 Jet fire
2.83E-02 3.85E-03 6.33E-08 Vapour cloud explosion
4.64E-07 Flash fire
1.54E-05 Unignited release
Release
Frequency
(per year)
Detection &
Shutdown
Immediate
Ignition
Escalation Delayed
Ignition
Vapour Cloud
Explosion
Event Frequency Event Outcome
Release as 50 mm hole size 2.25E-04 0.99 7.50E-02 1.67E-05 Jet fire
5.25E-02 2.25E-02 5.00E-06 Vapour cloud explosion
1.17E-05 Flash fire
1.89E-04 Unignited release
0.01 7.50E-02 * Escalation effect (Fireball)
1.68E-07 Jet fire
5.25E-02 2.25E-02 5.05E-08 Vapour cloud explosion
1.18E-07 Flash fire
1.91E-06 Unignited release
Release
Frequency
(per year)
Detection &
Shutdown
Immediate
Ignition
Escalation Delayed
Ignition
Vapour Cloud
Explosion
Event Frequency Event Outcome
Release as 150 mm hole size 8.86E-05 0.99 7.50E-02 6.58E-06 Jet fire
5.25E-02 2.25E-02 1.97E-06 Vapour cloud explosion
4.60E-06 Flash fire
7.46E-05 Unignited release
0.01 7.50E-02 * Escalation effect (Fireball)
6.65E-08 Jet fire
5.25E-02 2.25E-02 1.99E-08 Vapour cloud explosion
4.65E-08 Flash fire
7.53E-07 Unignited release
Note *: The escalation effect probability is estimated based on the location of release scenario and target equipment, as well as the associated consequence impact distance and duration.
As such, the escalation probability for each hazardous scenario regardless different hole size and location are assumed as 1/6, and it is only applied if separation distance between release scenario and target equipment is
within the associated consequence impact distance.

Hazardous Section HKOLNGT_05
Release
Frequency
(per year)
Detection &
Shutdown
Immediate
Ignition
Escalation Delayed
Ignition
Vapour Cloud
Explosion
Event Frequency Event Outcome
Release as 10 mm hole size 1.70E-02 0.99 8.59E-04 1.45E-05 Jet fire
7.56E-04 1.03E-04 1.74E-06 Vapour cloud explosion
1.28E-05 Flash fire
1.68E-02 Unignited release
0.01 8.59E-04 * Escalation effect (Fireball)
1.46E-07 Jet fire
7.56E-04 1.03E-04 1.76E-08 Vapour cloud explosion
1.29E-07 Flash fire
1.70E-04 Unignited release
Release
Frequency
(per year)
Detection &
Shutdown
Immediate
Ignition
Escalation Delayed
Ignition
Vapour Cloud
Explosion
Event Frequency Event Outcome
Release as 25 mm hole size 1.68E-03 0.99 7.95E-03 1.32E-05 Jet fire
6.99E-03 9.54E-04 1.59E-06 Vapour cloud explosion
1.16E-05 Flash fire
1.64E-03 Unignited release
0.01 7.95E-03 * Escalation effect (Fireball)
1.34E-07 Jet fire
6.99E-03 9.54E-04 1.60E-08 Vapour cloud explosion
1.17E-07 Flash fire
1.65E-05 Unignited release
Release
Frequency
(per year)
Detection &
Shutdown
Immediate
Ignition
Escalation Delayed
Ignition
Vapour Cloud
Explosion
Event Frequency Event Outcome
Release as 50 mm hole size 3.20E-04 0.99 4.28E-02 1.35E-05 Jet fire
3.76E-02 5.13E-03 1.63E-06 Vapour cloud explosion
1.19E-05 Flash fire
2.90E-04 Unignited release
0.01 4.28E-02 * Escalation effect (Fireball)
1.37E-07 Jet fire
3.76E-02 5.13E-03 1.64E-08 Vapour cloud explosion
1.20E-07 Flash fire
2.93E-06 Unignited release
Release
Frequency
(per year)
Detection &
Shutdown
Immediate
Ignition
Escalation Delayed
Ignition
Vapour Cloud
Explosion
Event Frequency Event Outcome
Release as 150 mm hole size 2.00E-04 0.99 7.50E-02 1.49E-05 Fireball
5.25E-02 2.25E-02 4.46E-06 Vapour cloud explosion
1.04E-05 Flash fire
1.68E-04 Unignited release
0.01 7.50E-02 * Escalation effect (Fireball)
1.50E-07 Fireball
5.25E-02 2.25E-02 4.50E-08 Vapour cloud explosion
1.05E-07 Flash fire
1.70E-06 Unignited release
Note *: The escalation effect probability is estimated based on the location of release scenario and target equipment, as well as the associated consequence impact distance and duration.
As such, the escalation probability for each hazardous scenario regardless different hole size and location are assumed as 1/6, and it is only applied if separation distance between release scenario and target equipment is
within the associated consequence impact distance.
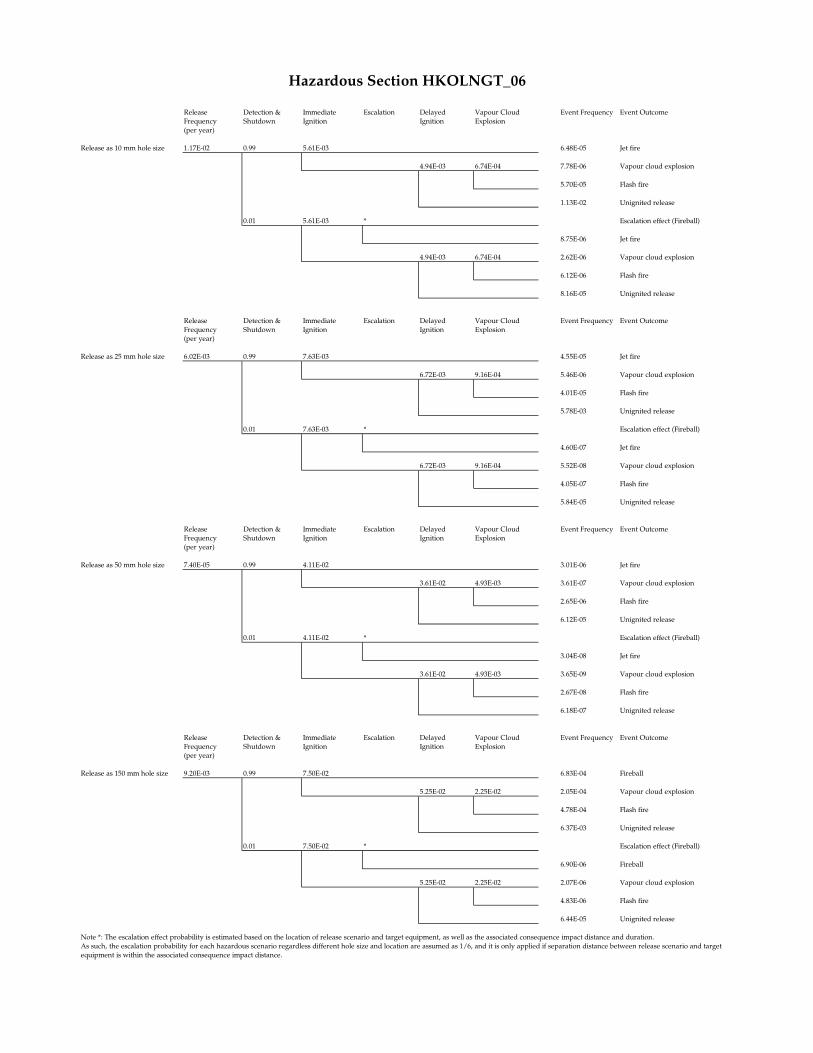
Hazardous Section HKOLNGT_06
Release
Frequency
(per year)
Detection &
Shutdown
Immediate
Ignition
Escalation Delayed
Ignition
Vapour Cloud
Explosion
Event Frequency Event Outcome
Release as 10 mm hole size 1.17E-02 0.99 5.61E-03 6.48E-05 Jet fire
4.94E-03 6.74E-04 7.78E-06 Vapour cloud explosion
5.70E-05 Flash fire
1.13E-02 Unignited release
0.01 5.61E-03 * Escalation effect (Fireball)
8.75E-06 Jet fire
4.94E-03 6.74E-04 2.62E-06 Vapour cloud explosion
6.12E-06 Flash fire
8.16E-05 Unignited release
Release
Frequency
(per year)
Detection &
Shutdown
Immediate
Ignition
Escalation Delayed
Ignition
Vapour Cloud
Explosion
Event Frequency Event Outcome
Release as 25 mm hole size 6.02E-03 0.99 7.63E-03 4.55E-05 Jet fire
6.72E-03 9.16E-04 5.46E-06 Vapour cloud explosion
4.01E-05 Flash fire
5.78E-03 Unignited release
0.01 7.63E-03 * Escalation effect (Fireball)
4.60E-07 Jet fire
6.72E-03 9.16E-04 5.52E-08 Vapour cloud explosion
4.05E-07 Flash fire
5.84E-05 Unignited release
Release
Frequency
(per year)
Detection &
Shutdown
Immediate
Ignition
Escalation Delayed
Ignition
Vapour Cloud
Explosion
Event Frequency Event Outcome
Release as 50 mm hole size 7.40E-05 0.99 4.11E-02 3.01E-06 Jet fire
3.61E-02 4.93E-03 3.61E-07 Vapour cloud explosion
2.65E-06 Flash fire
6.12E-05 Unignited release
0.01 4.11E-02 * Escalation effect (Fireball)
3.04E-08 Jet fire
3.61E-02 4.93E-03 3.65E-09 Vapour cloud explosion
2.67E-08 Flash fire
6.18E-07 Unignited release
Release
Frequency
(per year)
Detection &
Shutdown
Immediate
Ignition
Escalation Delayed
Ignition
Vapour Cloud
Explosion
Event Frequency Event Outcome
Release as 150 mm hole size 9.20E-03 0.99 7.50E-02 6.83E-04 Fireball
5.25E-02 2.25E-02 2.05E-04 Vapour cloud explosion
4.78E-04 Flash fire
6.37E-03 Unignited release
0.01 7.50E-02 * Escalation effect (Fireball)
6.90E-06 Fireball
5.25E-02 2.25E-02 2.07E-06 Vapour cloud explosion
4.83E-06 Flash fire
6.44E-05 Unignited release
Note *: The escalation effect probability is estimated based on the location of release scenario and target equipment, as well as the associated consequence impact distance and duration.
As such, the escalation probability for each hazardous scenario regardless different hole size and location are assumed as 1/6, and it is only applied if separation distance between release scenario and target
equipment is within the associated consequence impact distance.

Hazardous Section HKOLNGT_07
Release
Frequency
(per year)
Detection &
Shutdown
Immediate
Ignition
Escalation Delayed
Ignition
Vapour Cloud
Explosion
Event Frequency Event Outcome
Release as 10 mm hole size 8.19E-03 0.99 8.26E-04 6.69E-06 Jet fire
7.27E-04 9.91E-05 8.03E-07 Vapour cloud explosion
5.89E-06 Flash fire
8.08E-03 Unignited release
0.01 8.26E-04 * Escalation effect (Fireball)
6.76E-08 Jet fire
7.27E-04 9.91E-05 8.11E-09 Vapour cloud explosion
5.95E-08 Flash fire
8.16E-05 Unignited release
Release
Frequency
(per year)
Detection &
Shutdown
Immediate
Ignition
Escalation Delayed
Ignition
Vapour Cloud
Explosion
Event Frequency Event Outcome
Release as 25 mm hole size 6.11E-04 0.99 7.63E-03 4.62E-06 Jet fire
6.72E-03 9.16E-04 5.54E-07 Vapour cloud explosion
4.06E-06 Flash fire
5.86E-04 Unignited release
0.01 7.63E-03 * Escalation effect (Fireball)
4.66E-08 Jet fire
6.72E-03 9.16E-04 5.60E-09 Vapour cloud explosion
4.10E-08 Flash fire
5.92E-06 Unignited release
Release
Frequency
(per year)
Detection &
Shutdown
Immediate
Ignition
Escalation Delayed
Ignition
Vapour Cloud
Explosion
Event Frequency Event Outcome
Release as 50 mm hole size 9.42E-05 0.99 4.11E-02 3.83E-06 Jet fire
3.61E-02 4.93E-03 4.60E-07 Vapour cloud explosion
3.37E-06 Flash fire
7.79E-05 Unignited release
0.01 4.11E-02 * Escalation effect (Fireball)
3.87E-08 Jet fire
3.61E-02 4.93E-03 4.64E-09 Vapour cloud explosion
3.40E-08 Flash fire
7.87E-07 Unignited release
Release
Frequency
(per year)
Detection &
Shutdown
Immediate
Ignition
Escalation Delayed
Ignition
Vapour Cloud
Explosion
Event Frequency Event Outcome
Release as 150 mm hole size 4.12E-05 0.99 7.50E-02 3.06E-06 Fireball
5.25E-02 2.25E-02 9.18E-07 Vapour cloud explosion
2.14E-06 Flash fire
2.86E-05 Unignited release
0.01 7.50E-02 * Escalation effect (Fireball)
3.09E-08 Fireball
5.25E-02 2.25E-02 9.27E-09 Vapour cloud explosion
2.16E-08 Flash fire
2.88E-07 Unignited release
Note *: The escalation effect probability is estimated based on the location of release scenario and target equipment, as well as the associated consequence impact distance and duration.
As such, the escalation probability for each hazardous scenario regardless different hole size and location are assumed as 1/6, and it is only applied if separation distance between release scenario and target
equipment is within the associated consequence impact distance.

Hazardous Section HKOLNGT_08
Release
Frequency
(per year)
Detection &
Shutdown
Immediate
Ignition
Escalation Delayed
Ignition
Vapour Cloud
Explosion
Event Frequency Event Outcome
Release as 10 mm hole size 7.20E-05 0.99 8.26E-04 5.88E-08 Jet fire
7.27E-04 9.91E-05 7.06E-09 Vapour cloud explosion
5.18E-08 Flash fire
7.10E-05 Unignited release
0.01 8.26E-04 * Escalation effect (Fireball)
5.94E-10 Jet fire
7.27E-04 9.91E-05 7.13E-11 Vapour cloud explosion
5.23E-10 Flash fire
7.18E-07 Unignited release
Release
Frequency
(per year)
Detection &
Shutdown
Immediate
Ignition
Escalation Delayed
Ignition
Vapour Cloud
Explosion
Event Frequency Event Outcome
Release as 25 mm hole size 1.80E-05 0.99 7.63E-03 1.36E-07 Jet fire
6.72E-03 9.16E-04 1.63E-08 Vapour cloud explosion
1.20E-07 Flash fire
1.73E-05 Unignited release
0.01 7.63E-03 * Escalation effect (Fireball)
1.37E-09 Jet fire
6.72E-03 9.16E-04 1.65E-10 Vapour cloud explosion
1.21E-09 Flash fire
1.75E-07 Unignited release
Release
Frequency
(per year)
Detection &
Shutdown
Immediate
Ignition
Escalation Delayed
Ignition
Vapour Cloud
Explosion
Event Frequency Event Outcome
Release as 150 mm hole size 3.00E-05 0.99 7.50E-02 2.23E-06 Fireball
5.25E-02 2.25E-02 6.68E-07 Vapour cloud explosion
1.56E-06 Flash fire
2.08E-05 Unignited release
0.01 7.50E-02 * Escalation effect (Fireball)
2.25E-08 Fireball
5.25E-02 2.25E-02 6.75E-09 Vapour cloud explosion
1.58E-08 Flash fire
2.10E-07 Unignited release
Note *: The escalation effect probability is estimated based on the location of release scenario and target equipment, as well as the associated consequence impact distance and duration.
As such, the escalation probability for each hazardous scenario regardless different hole size and location are assumed as 1/6, and it is only applied if separation distance between release scenario and target
equipment is within the associated consequence impact distance.

Hazardous Section HKOLNGT_10
Release
Frequency
(per year)
Detection &
Shutdown
Immediate
Ignition
Escalation Delayed
Ignition
Vapour Cloud
Explosion
Event Frequency Event Outcome
Release as 10 mm hole size 8.19E-03 0.99 8.26E-04 6.69E-06 Jet fire
7.27E-04 9.91E-05 8.03E-07 Vapour cloud explosion
5.89E-06 Flash fire
8.08E-03 Unignited release
0.01 8.26E-04 * Escalation effect (Fireball)
6.76E-08 Jet fire
7.27E-04 9.91E-05 8.11E-09 Vapour cloud explosion
5.95E-08 Flash fire
8.16E-05 Unignited release
Release
Frequency
(per year)
Detection &
Shutdown
Immediate
Ignition
Escalation Delayed
Ignition
Vapour Cloud
Explosion
Event Frequency Event Outcome
Release as 25 mm hole size 6.28E-04 0.99 7.63E-03 4.75E-06 Jet fire
6.72E-03 9.16E-04 5.70E-07 Vapour cloud explosion
4.18E-06 Flash fire
6.03E-04 Unignited release
0.01 7.63E-03 * Escalation effect (Fireball)
4.79E-08 Jet fire
6.72E-03 9.16E-04 5.75E-09 Vapour cloud explosion
4.22E-08 Flash fire
6.09E-06 Unignited release
Release
Frequency
(per year)
Detection &
Shutdown
Immediate
Ignition
Escalation Delayed
Ignition
Vapour Cloud
Explosion
Event Frequency Event Outcome
Release as 50 mm hole size 9.42E-05 0.99 4.11E-02 3.83E-06 Jet fire
3.61E-02 4.93E-03 4.60E-07 Vapour cloud explosion
3.37E-06 Flash fire
7.79E-05 Unignited release
0.01 4.11E-02 * Escalation effect (Fireball)
3.87E-08 Jet fire
3.61E-02 4.93E-03 4.64E-09 Vapour cloud explosion
3.40E-08 Flash fire
7.87E-07 Unignited release
Release
Frequency
(per year)
Detection &
Shutdown
Immediate
Ignition
Escalation Delayed
Ignition
Vapour Cloud
Explosion
Event Frequency Event Outcome
Release as 150 mm hole size 4.12E-05 0.99 7.50E-02 3.06E-06 Fireball
5.25E-02 2.25E-02 9.18E-07 Vapour cloud explosion
2.14E-06 Flash fire
2.86E-05 Unignited release
0.01 7.50E-02 * Escalation effect (Fireball)
3.09E-08 Fireball
5.25E-02 2.25E-02 9.27E-09 Vapour cloud explosion
2.16E-08 Flash fire
2.88E-07 Unignited release
Note *: The escalation effect probability is estimated based on the location of release scenario and target equipment, as well as the associated consequence impact distance and duration.
As such, the escalation probability for each hazardous scenario regardless different hole size and location are assumed as 1/6, and it is only applied if separation distance between release scenario and target
equipment is within the associated consequence impact distance.

Hazardous Section HKOLNGT_11
Release
Frequency
(per year)
Detection &
Shutdown
Immediate
Ignition
Escalation Delayed
Ignition
Vapour Cloud
Explosion
Event Frequency Event Outcome
Release as 10 mm hole size 7.20E-05 0.99 8.26E-04 5.88E-08 Jet fire
7.27E-04 9.91E-05 7.06E-09 Vapour cloud explosion
5.18E-08 Flash fire
7.10E-05 Unignited release
0.01 8.26E-04 * Escalation effect (Fireball)
5.94E-10 Jet fire
7.27E-04 9.91E-05 7.13E-11 Vapour cloud explosion
5.23E-10 Flash fire
7.18E-07 Unignited release
Release
Frequency
(per year)
Detection &
Shutdown
Immediate
Ignition
Escalation Delayed
Ignition
Vapour Cloud
Explosion
Event Frequency Event Outcome
Release as 25 mm hole size 1.80E-05 0.99 7.63E-03 1.36E-07 Jet fire
6.72E-03 9.16E-04 1.63E-08 Vapour cloud explosion
1.20E-07 Flash fire
1.73E-05 Unignited release
0.01 7.63E-03 * Escalation effect (Fireball)
1.37E-09 Jet fire
6.72E-03 9.16E-04 1.65E-10 Vapour cloud explosion
1.21E-09 Flash fire
1.75E-07 Unignited release
Release
Frequency
(per year)
Detection &
Shutdown
Immediate
Ignition
Escalation Delayed
Ignition
Vapour Cloud
Explosion
Event Frequency Event Outcome
Release as 150 mm hole size 3.00E-05 0.99 7.50E-02 2.23E-06 Fireball
5.25E-02 2.25E-02 6.68E-07 Vapour cloud explosion
1.56E-06 Flash fire
2.08E-05 Unignited release
0.01 7.50E-02 * Escalation effect (Fireball)
2.25E-08 Fireball
5.25E-02 2.25E-02 6.75E-09 Vapour cloud explosion
1.58E-08 Flash fire
2.10E-07 Unignited release
Note *: The escalation effect probability is estimated based on the location of release scenario and target equipment, as well as the associated consequence impact distance and duration.
As such, the escalation probability for each hazardous scenario regardless different hole size and location are assumed as 1/6, and it is only applied if separation distance between release scenario and target
equipment is within the associated consequence impact distance.

Hazardous Section HKOLNGT_13
Release
Frequency
(per year)
Detection &
Shutdown
Probability
Immediate
Ignition
Probability
Escalation Delayed
Ignition
Explosion
Probability
Event Frequency Event Outcome
Release as 10 mm hole size 8.21E-03 0.99 7.61E-04 6.18E-06 Jet Fire
6.69E-04 9.13E-05 7.42E-07 Vapour Cloud Explosion
5.44E-06 Flash Fire
8.11E-03 Unignited release
0.01 7.61E-04 * Escalation effect (Fireball)
6.24E-08 Jet Fire
6.69E-04 9.13E-05 7.49E-09 Vapour Cloud Explosion
5.49E-08 Flash Fire
8.19E-05 Unignited release
Release
Frequency
(per year)
Detection &
Shutdown
Probability
Immediate
Ignition
Probability
Escalation Delayed
Ignition
Explosion
Probability
Event Frequency Event Outcome
Release as 25 mm hole size 6.48E-04 0.99 7.03E-03 4.51E-06 Jet Fire
6.19E-03 8.44E-04 5.41E-07 Vapour Cloud Explosion
3.97E-06 Flash Fire
6.28E-04 Unignited release
0.01 7.03E-03 * Escalation effect (Fireball)
4.56E-08 Jet Fire
6.19E-03 8.44E-04 5.47E-09 Vapour Cloud Explosion
4.01E-08 Flash Fire
6.34E-06 Unignited release
Release
Frequency
(per year)
Detection &
Shutdown
Probability
Immediate
Ignition
Probability
Escalation Delayed
Ignition
Explosion
Probability
Event Frequency Event Outcome
Release as 50 mm hole size 9.72E-05 0.99 3.78E-02 3.64E-06 Jet Fire
3.33E-02 4.54E-03 4.37E-07 Vapour Cloud Explosion
3.20E-06 Flash Fire
8.53E-05 Unignited release
0.01 3.78E-02 * Escalation effect (Fireball)
3.68E-08 Jet Fire
3.33E-02 4.54E-03 4.41E-09 Vapour Cloud Explosion
3.24E-08 Flash Fire
8.62E-07 Unignited release
Release
Frequency
(per year)
Detection &
Shutdown
Probability
Immediate
Ignition
Probability
Escalation Delayed
Ignition
Explosion
Probability
Event Frequency Event Outcome
Release as 150 mm hole size 4.32E-05 0.99 7.50E-02 3.21E-06 Pool Fire
5.25E-02 2.25E-02 9.62E-07 Vapour Cloud Explosion
2.25E-06 Flash Fire
2.99E-05 Unignited release
0.01 7.50E-02 * Escalation effect (Fireball)
3.24E-08 Pool Fire
5.25E-02 2.25E-02 9.72E-09 Vapour Cloud Explosion
2.27E-08 Flash Fire
3.02E-07 Unignited release
Note *: The escalation effect probability is estimated based on the location of release scenario and target equipment, as well as the associated consequence impact distance and duration.
As such, the escalation probability for each hazardous scenario regardless different hole size and location are assumed as 1/6, and it is only applied if separation distance between release scenario and target equipment is
within the associated consequence impact distance.

Hazardous Section HKOLNGT_14
Release
Frequency
(per year)
Detection &
Shutdown
Immediate
Ignition
Escalation Delayed
Ignition
Vapour Cloud
Explosion
Event Frequency Event Outcome
Release as 10 mm hole size 3.96E-03 0.99 5.43E-04 2.13E-06 Jet fire
5.21E-04 2.17E-05 8.51E-08 Vapour cloud explosion
2.04E-06 Flash fire
3.91E-03 Unignited release
0.01 5.43E-04 * Escalation effect (Fireball)
2.15E-08 Jet fire
5.21E-04 2.17E-05 8.60E-10 Vapour cloud explosion
2.06E-08 Flash fire
3.95E-05 Unignited release
Release
Frequency
(per year)
Detection &
Shutdown
Immediate
Ignition
Escalation Delayed
Ignition
Vapour Cloud
Explosion
Event Frequency Event Outcome
Release as 25 mm hole size 3.96E-04 0.99 6.20E-04 2.43E-07 Jet fire
5.95E-04 2.48E-05 9.73E-09 Vapour cloud explosion
2.33E-07 Flash fire
3.91E-04 Unignited release
0.01 6.20E-04 * Escalation effect (Fireball)
2.46E-09 Jet fire
5.95E-04 2.48E-05 9.82E-11 Vapour cloud explosion
2.36E-09 Flash fire
3.95E-06 Unignited release
Release
Frequency
(per year)
Detection &
Shutdown
Immediate
Ignition
Escalation Delayed
Ignition
Vapour Cloud
Explosion
Event Frequency Event Outcome
Release as 50 mm hole size 9.10E-05 0.99 1.59E-03 1.44E-07 Jet fire
1.40E-03 1.91E-04 1.72E-08 Vapour cloud explosion
1.26E-07 Flash fire
8.95E-05 Unignited release
0.01 1.59E-03 * Escalation effect (Fireball)
1.45E-09 Jet fire
1.40E-03 1.91E-04 1.74E-10 Vapour cloud explosion
1.28E-09 Flash fire
9.04E-07 Unignited release
Release
Frequency
(per year)
Detection &
Shutdown
Immediate
Ignition
Escalation Delayed
Ignition
Vapour Cloud
Explosion
Event Frequency Event Outcome
Release as 150 mm hole size 3.30E-05 0.99 2.29E-02 7.49E-07 Jet fire
2.02E-02 2.75E-03 8.99E-08 Vapour cloud explosion
6.59E-07 Flash fire
2.97E-05 Unignited release
0.01 2.29E-02 * Escalation effect (Fireball)
7.57E-09 Jet fire
2.02E-02 2.75E-03 9.08E-10 Vapour cloud explosion
6.66E-09 Flash fire
3.00E-07 Unignited release
Note *: The escalation effect probability is estimated based on the location of release scenario and target equipment, as well as the associated consequence impact distance and duration.
As such, the escalation probability for each hazardous scenario regardless different hole size and location are assumed as 1/6, and it is only applied if separation distance between release scenario and target
equipment is within the associated consequence impact distance.

Hazardous Section HKOLNGT_15
Release
Frequency
(per year)
Detection &
Shutdown
Immediate
Ignition
Escalation Delayed
Ignition
Vapour Cloud
Explosion
Event Frequency Event Outcome
Release as 10 mm hole size 8.21E-03 0.99 5.00E-04 4.06E-06 Jet fire
4.80E-04 2.00E-05 1.63E-07 Vapour cloud explosion
3.90E-06 Flash fire
8.11E-03 Unignited release
0.01 5.00E-04 * Escalation effect (Fireball)
4.10E-08 Jet fire
4.80E-04 2.00E-05 1.64E-09 Vapour cloud explosion
3.94E-08 Flash fire
8.19E-05 Unignited release
Release
Frequency
(per year)
Detection &
Shutdown
Immediate
Ignition
Escalation Delayed
Ignition
Vapour Cloud
Explosion
Event Frequency Event Outcome
Release as 25 mm hole size 6.48E-04 0.99 5.57E-04 3.57E-07 Jet fire
5.34E-04 2.23E-05 1.43E-08 Vapour cloud explosion
3.43E-07 Flash fire
6.40E-04 Unignited release
0.01 5.57E-04 * Escalation effect (Fireball)
3.61E-09 Jet fire
5.34E-04 2.23E-05 1.44E-10 Vapour cloud explosion
3.46E-09 Flash fire
6.47E-06 Unignited release
Release
Frequency
(per year)
Detection &
Shutdown
Immediate
Ignition
Escalation Delayed
Ignition
Vapour Cloud
Explosion
Event Frequency Event Outcome
Release as 50 mm hole size 9.72E-05 0.99 6.15E-04 5.92E-08 Jet fire
5.91E-04 2.46E-05 2.37E-09 Vapour cloud explosion
5.68E-08 Flash fire
9.60E-05 Unignited release
0.01 6.15E-04 * Escalation effect (Fireball)
5.98E-10 Jet fire
5.91E-04 2.46E-05 2.39E-11 Vapour cloud explosion
5.74E-10 Flash fire
9.70E-07 Unignited release
Release
Frequency
(per year)
Detection &
Shutdown
Immediate
Ignition
Escalation Delayed
Ignition
Vapour Cloud
Explosion
Event Frequency Event Outcome
Release as 150 mm hole size 4.32E-05 0.99 3.75E-03 1.60E-07 Jet fire
3.30E-03 4.50E-04 1.92E-08 Vapour cloud explosion
1.41E-07 Flash fire
4.21E-05 Unignited release
0.01 3.75E-03 * Escalation effect (Fireball)
1.62E-09 Jet fire
3.30E-03 4.50E-04 1.94E-10 Vapour cloud explosion
1.42E-09 Flash fire
4.26E-07 Unignited release
Note *: The escalation effect probability is estimated based on the location of release scenario and target equipment, as well as the associated consequence impact distance and duration.
As such, the escalation probability for each hazardous scenario regardless different hole size and location are assumed as 1/6, and it is only applied if separation distance between release scenario and target
equipment is within the associated consequence impact distance.

Hazardous Section HKOLNGT_16
Release
Frequency
(per year)
Detection &
Shutdown
Immediate
Ignition
Escalation Delayed
Ignition
Vapour Cloud
Explosion
Event Frequency Event Outcome
Release as 10 mm hole size 6.53E-03 0.99 5.43E-04 3.51E-06 Jet fire
5.21E-04 2.17E-05 1.40E-07 Vapour cloud explosion
3.37E-06 Flash fire
6.45E-03 Unignited release
0.01 5.43E-04 * Escalation effect (Fireball)
3.54E-08 Jet fire
5.21E-04 2.17E-05 1.42E-09 Vapour cloud explosion
3.40E-08 Flash fire
6.51E-05 Unignited release
Release
Frequency
(per year)
Detection &
Shutdown
Immediate
Ignition
Escalation Delayed
Ignition
Vapour Cloud
Explosion
Event Frequency Event Outcome
Release as 25 mm hole size 3.22E-04 0.99 6.20E-04 1.98E-07 Jet fire
5.95E-04 2.48E-05 7.90E-09 Vapour cloud explosion
1.90E-07 Flash fire
3.18E-04 Unignited release
0.01 6.20E-04 * Escalation effect (Fireball)
2.00E-09 Jet fire
5.95E-04 2.48E-05 7.98E-11 Vapour cloud explosion
1.92E-09 Flash fire
3.21E-06 Unignited release
Release
Frequency
(per year)
Detection &
Shutdown
Immediate
Ignition
Escalation Delayed
Ignition
Vapour Cloud
Explosion
Event Frequency Event Outcome
Release as 50 mm hole size 3.96E-05 0.99 1.57E-03 6.17E-08 Jet fire
1.39E-03 1.89E-04 7.41E-09 Vapour cloud explosion
5.43E-08 Flash fire
3.90E-05 Unignited release
0.01 1.57E-03 * Escalation effect (Fireball)
6.24E-10 Jet fire
1.39E-03 1.89E-04 7.48E-11 Vapour cloud explosion
5.49E-10 Flash fire
3.94E-07 Unignited release
Release
Frequency
(per year)
Detection &
Shutdown
Immediate
Ignition
Escalation Delayed
Ignition
Vapour Cloud
Explosion
Event Frequency Event Outcome
Release as 150 mm hole size 1.61E-05 0.99 2.27E-02 3.61E-07 Jet fire
1.99E-02 2.72E-03 4.34E-08 Vapour cloud explosion
3.18E-07 Flash fire
1.45E-05 Unignited release
0.01 2.27E-02 * Escalation effect (Fireball)
3.65E-09 Jet fire
1.99E-02 2.72E-03 4.38E-10 Vapour cloud explosion
3.21E-09 Flash fire
1.46E-07 Unignited release
Note *: The escalation effect probability is estimated based on the location of release scenario and target equipment, as well as the associated consequence impact distance and duration.
As such, the escalation probability for each hazardous scenario regardless different hole size and location are assumed as 1/6, and it is only applied if separation distance between release scenario and target
equipment is within the associated consequence impact distance.

Hazardous Section HKOLNGT_17
Release
Frequency
(per year)
Detection &
Shutdown
Immediate
Ignition
Escalation Delayed
Ignition
Vapour Cloud
Explosion
Event Frequency Event Outcome
Release as 10 mm hole size 2.45E-03 0.99 5.49E-04 1.33E-06 Jet fire
5.27E-04 2.19E-05 5.32E-08 Vapour cloud explosion
1.28E-06 Flash fire
2.42E-03 Unignited release
0.01 5.49E-04 * Escalation effect (Fireball)
1.34E-08 Jet fire
5.27E-04 2.19E-05 5.37E-10 Vapour cloud explosion
1.29E-08 Flash fire
2.44E-05 Unignited release
Release
Frequency
(per year)
Detection &
Shutdown
Immediate
Ignition
Escalation Delayed
Ignition
Vapour Cloud
Explosion
Event Frequency Event Outcome
Release as 25 mm hole size 1.92E-04 0.99 6.27E-04 1.19E-07 Jet fire
6.02E-04 2.51E-05 4.77E-09 Vapour cloud explosion
1.14E-07 Flash fire
1.90E-04 Unignited release
0.01 6.27E-04 * Escalation effect (Fireball)
1.20E-09 Jet fire
6.02E-04 2.51E-05 4.81E-11 Vapour cloud explosion
1.16E-09 Flash fire
1.92E-06 Unignited release
Release
Frequency
(per year)
Detection &
Shutdown
Immediate
Ignition
Escalation Delayed
Ignition
Vapour Cloud
Explosion
Event Frequency Event Outcome
Release as 50 mm hole size 2.96E-05 0.99 1.90E-03 5.57E-08 Jet fire
1.67E-03 2.28E-04 6.69E-09 Vapour cloud explosion
4.90E-08 Flash fire
2.91E-05 Unignited release
0.01 1.90E-03 * Escalation effect (Fireball)
5.63E-10 Jet fire
1.67E-03 2.28E-04 6.76E-11 Vapour cloud explosion
4.95E-10 Flash fire
2.94E-07 Unignited release
Release
Frequency
(per year)
Detection &
Shutdown
Immediate
Ignition
Escalation Delayed
Ignition
Vapour Cloud
Explosion
Event Frequency Event Outcome
Release as 150 mm hole size 1.36E-05 0.99 2.74E-02 3.69E-07 Jet fire
2.41E-02 3.29E-03 4.42E-08 Vapour cloud explosion
3.24E-07 Flash fire
1.20E-05 Unignited release
0.01 2.74E-02 * Escalation effect (Fireball)
3.72E-09 Jet fire
2.41E-02 3.29E-03 4.47E-10 Vapour cloud explosion
3.28E-09 Flash fire
1.21E-07 Unignited release
Note *: The escalation effect probability is estimated based on the location of release scenario and target equipment, as well as the associated consequence impact distance and duration.
As such, the escalation probability for each hazardous scenario regardless different hole size and location are assumed as 1/6, and it is only applied if separation distance between release scenario and target
equipment is within the associated consequence impact distance.
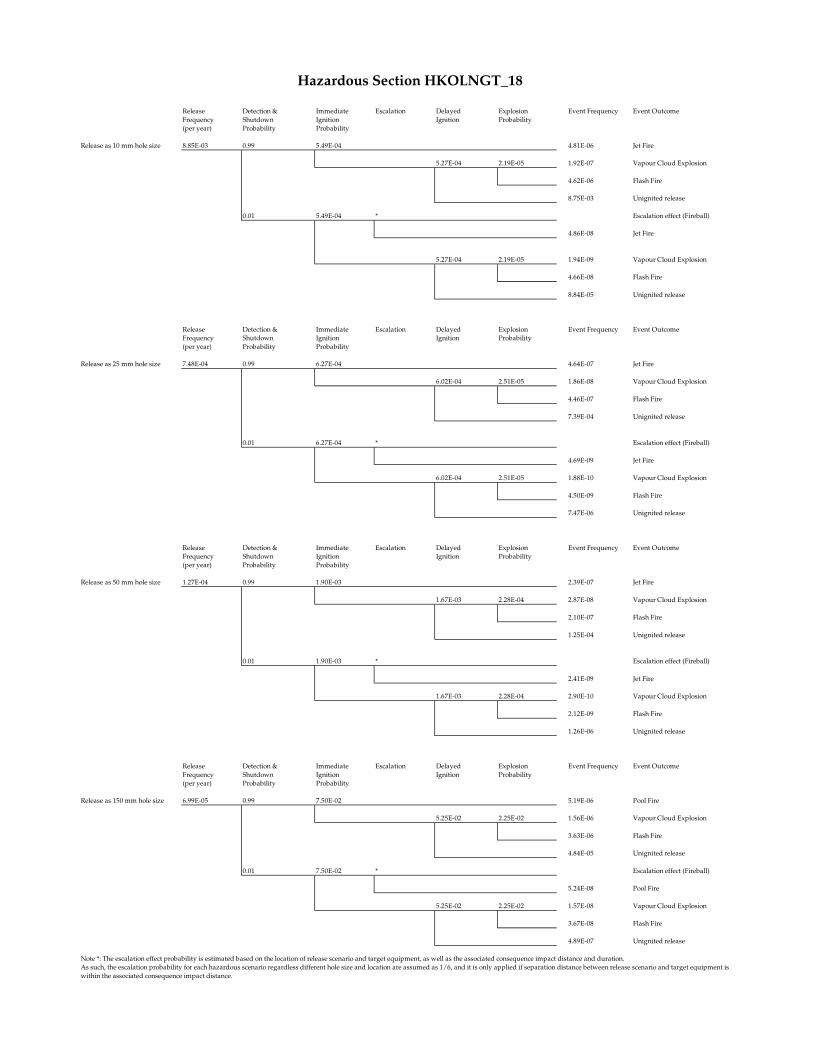
Hazardous Section HKOLNGT_18
Release
Frequency
(per year)
Detection &
Shutdown
Probability
Immediate
Ignition
Probability
Escalation Delayed
Ignition
Explosion
Probability
Event Frequency Event Outcome
Release as 10 mm hole size 8.85E-03 0.99 5.49E-04 4.81E-06 Jet Fire
5.27E-04 2.19E-05 1.92E-07 Vapour Cloud Explosion
4.62E-06 Flash Fire
8.75E-03 Unignited release
0.01 5.49E-04 * Escalation effect (Fireball)
4.86E-08 Jet Fire
5.27E-04 2.19E-05 1.94E-09 Vapour Cloud Explosion
4.66E-08 Flash Fire
8.84E-05 Unignited release
Release
Frequency
(per year)
Detection &
Shutdown
Probability
Immediate
Ignition
Probability
Escalation Delayed
Ignition
Explosion
Probability
Event Frequency Event Outcome
Release as 25 mm hole size 7.48E-04 0.99 6.27E-04 4.64E-07 Jet Fire
6.02E-04 2.51E-05 1.86E-08 Vapour Cloud Explosion
4.46E-07 Flash Fire
7.39E-04 Unignited release
0.01 6.27E-04 * Escalation effect (Fireball)
4.69E-09 Jet Fire
6.02E-04 2.51E-05 1.88E-10 Vapour Cloud Explosion
4.50E-09 Flash Fire
7.47E-06 Unignited release
Release
Frequency
(per year)
Detection &
Shutdown
Probability
Immediate
Ignition
Probability
Escalation Delayed
Ignition
Explosion
Probability
Event Frequency Event Outcome
Release as 50 mm hole size 1.27E-04 0.99 1.90E-03 2.39E-07 Jet Fire
1.67E-03 2.28E-04 2.87E-08 Vapour Cloud Explosion
2.10E-07 Flash Fire
1.25E-04 Unignited release
0.01 1.90E-03 * Escalation effect (Fireball)
2.41E-09 Jet Fire
1.67E-03 2.28E-04 2.90E-10 Vapour Cloud Explosion
2.12E-09 Flash Fire
1.26E-06 Unignited release
Release
Frequency
(per year)
Detection &
Shutdown
Probability
Immediate
Ignition
Probability
Escalation Delayed
Ignition
Explosion
Probability
Event Frequency Event Outcome
Release as 150 mm hole size 6.99E-05 0.99 7.50E-02 5.19E-06 Pool Fire
5.25E-02 2.25E-02 1.56E-06 Vapour Cloud Explosion
3.63E-06 Flash Fire
4.84E-05 Unignited release
0.01 7.50E-02 * Escalation effect (Fireball)
5.24E-08 Pool Fire
5.25E-02 2.25E-02 1.57E-08 Vapour Cloud Explosion
3.67E-08 Flash Fire
4.89E-07 Unignited release
Note *: The escalation effect probability is estimated based on the location of release scenario and target equipment, as well as the associated consequence impact distance and duration.
As such, the escalation probability for each hazardous scenario regardless different hole size and location are assumed as 1/6, and it is only applied if separation distance between release scenario and target equipment is
within the associated consequence impact distance.
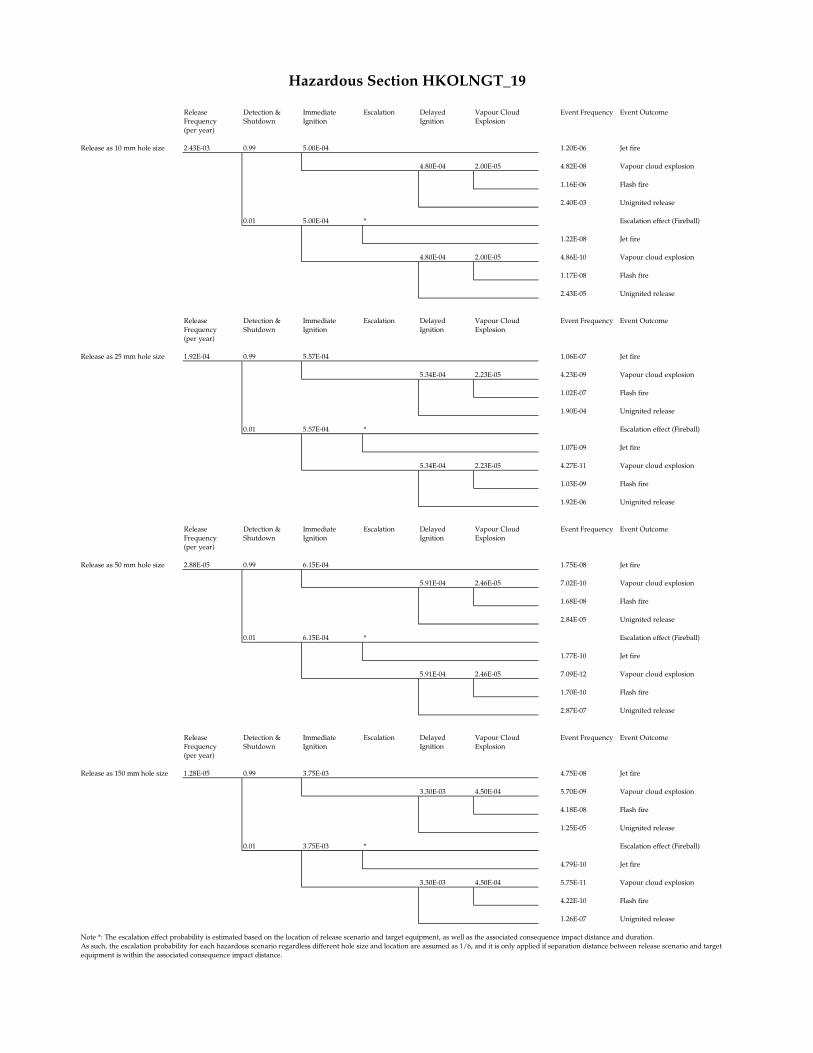
Hazardous Section HKOLNGT_19
Release
Frequency
(per year)
Detection &
Shutdown
Immediate
Ignition
Escalation Delayed
Ignition
Vapour Cloud
Explosion
Event Frequency Event Outcome
Release as 10 mm hole size 2.43E-03 0.99 5.00E-04 1.20E-06 Jet fire
4.80E-04 2.00E-05 4.82E-08 Vapour cloud explosion
1.16E-06 Flash fire
2.40E-03 Unignited release
0.01 5.00E-04 * Escalation effect (Fireball)
1.22E-08 Jet fire
4.80E-04 2.00E-05 4.86E-10 Vapour cloud explosion
1.17E-08 Flash fire
2.43E-05 Unignited release
Release
Frequency
(per year)
Detection &
Shutdown
Immediate
Ignition
Escalation Delayed
Ignition
Vapour Cloud
Explosion
Event Frequency Event Outcome
Release as 25 mm hole size 1.92E-04 0.99 5.57E-04 1.06E-07 Jet fire
5.34E-04 2.23E-05 4.23E-09 Vapour cloud explosion
1.02E-07 Flash fire
1.90E-04 Unignited release
0.01 5.57E-04 * Escalation effect (Fireball)
1.07E-09 Jet fire
5.34E-04 2.23E-05 4.27E-11 Vapour cloud explosion
1.03E-09 Flash fire
1.92E-06 Unignited release
Release
Frequency
(per year)
Detection &
Shutdown
Immediate
Ignition
Escalation Delayed
Ignition
Vapour Cloud
Explosion
Event Frequency Event Outcome
Release as 50 mm hole size 2.88E-05 0.99 6.15E-04 1.75E-08 Jet fire
5.91E-04 2.46E-05 7.02E-10 Vapour cloud explosion
1.68E-08 Flash fire
2.84E-05 Unignited release
0.01 6.15E-04 * Escalation effect (Fireball)
1.77E-10 Jet fire
5.91E-04 2.46E-05 7.09E-12 Vapour cloud explosion
1.70E-10 Flash fire
2.87E-07 Unignited release
Release
Frequency
(per year)
Detection &
Shutdown
Immediate
Ignition
Escalation Delayed
Ignition
Vapour Cloud
Explosion
Event Frequency Event Outcome
Release as 150 mm hole size 1.28E-05 0.99 3.75E-03 4.75E-08 Jet fire
3.30E-03 4.50E-04 5.70E-09 Vapour cloud explosion
4.18E-08 Flash fire
1.25E-05 Unignited release
0.01 3.75E-03 * Escalation effect (Fireball)
4.79E-10 Jet fire
3.30E-03 4.50E-04 5.75E-11 Vapour cloud explosion
4.22E-10 Flash fire
1.26E-07 Unignited release
Note *: The escalation effect probability is estimated based on the location of release scenario and target equipment, as well as the associated consequence impact distance and duration.
As such, the escalation probability for each hazardous scenario regardless different hole size and location are assumed as 1/6, and it is only applied if separation distance between release scenario and target
equipment is within the associated consequence impact distance.

Hazardous Section HKOLNGT_20
Release
Frequency
(per year)
Detection &
Shutdown
Immediate
Ignition
Escalation Delayed
Ignition
Vapour Cloud
Explosion
Event Frequency Event Outcome
Release as 10 mm hole size 2.38E-03 0.99 5.13E-04 1.21E-06 Jet fire
4.92E-04 2.05E-05 4.83E-08 Vapour cloud explosion
1.16E-06 Flash fire
2.35E-03 Unignited release
0.01 5.13E-04 * Escalation effect (Fireball)
1.22E-08 Jet fire
4.92E-04 2.05E-05 4.88E-10 Vapour cloud explosion
1.17E-08 Flash fire
2.37E-05 Unignited release
Release
Frequency
(per year)
Detection &
Shutdown
Immediate
Ignition
Escalation Delayed
Ignition
Vapour Cloud
Explosion
Event Frequency Event Outcome
Release as 25 mm hole size 6.99E-04 0.99 5.86E-04 4.05E-07 Jet fire
5.62E-04 2.34E-05 1.62E-08 Vapour cloud explosion
3.89E-07 Flash fire
6.90E-04 Unignited release
0.01 5.86E-04 * Escalation effect (Fireball)
4.09E-09 Jet fire
5.62E-04 2.34E-05 1.64E-10 Vapour cloud explosion
3.93E-09 Flash fire
6.97E-06 Unignited release
Release
Frequency
(per year)
Detection &
Shutdown
Immediate
Ignition
Escalation Delayed
Ignition
Vapour Cloud
Explosion
Event Frequency Event Outcome
Release as 50 mm hole size 2.16E-05 0.99 6.48E-04 1.38E-08 Jet fire
6.22E-04 2.59E-05 5.54E-10 Vapour cloud explosion
1.33E-08 Flash fire
2.13E-05 Unignited release
0.01 6.48E-04 * Escalation effect (Fireball)
1.40E-10 Jet fire
6.22E-04 2.59E-05 5.60E-12 Vapour cloud explosion
1.34E-10 Flash fire
2.15E-07 Unignited release
Release
Frequency
(per year)
Detection &
Shutdown
Immediate
Ignition
Escalation Delayed
Ignition
Vapour Cloud
Explosion
Event Frequency Event Outcome
Release as 150 mm hole size 9.25E-04 0.99 8.79E-03 8.05E-06 Jet fire
7.73E-03 1.05E-03 9.66E-07 Vapour cloud explosion
7.08E-06 Flash fire
8.84E-04 Unignited release
0.01 8.79E-03 * Escalation effect (Fireball)
8.13E-08 Jet fire
7.73E-03 1.05E-03 9.76E-09 Vapour cloud explosion
7.15E-08 Flash fire
8.92E-06 Unignited release
Note *: The escalation effect probability is estimated based on the location of release scenario and target equipment, as well as the associated consequence impact distance and duration.
As such, the escalation probability for each hazardous scenario regardless different hole size and location are assumed as 1/6, and it is only applied if separation distance between release scenario and target
equipment is within the associated consequence impact distance.

Hazardous Section HKOLNGT_21
Release
Frequency
(per year)
Detection &
Shutdown
Immediate
Ignition
Escalation Delayed
Ignition
Vapour Cloud
Explosion
Event Frequency Event Outcome
Release as 10 mm hole size 2.38E-03 0.99 5.13E-04 1.21E-06 Jet fire
4.92E-04 2.05E-05 4.83E-08 Vapour cloud explosion
1.16E-06 Flash fire
2.35E-03 Unignited release
0.01 5.13E-04 * Escalation effect (Fireball)
1.22E-08 Jet fire
4.92E-04 2.05E-05 4.88E-10 Vapour cloud explosion
1.17E-08 Flash fire
2.37E-05 Unignited release
Release
Frequency
(per year)
Detection &
Shutdown
Immediate
Ignition
Escalation Delayed
Ignition
Vapour Cloud
Explosion
Event Frequency Event Outcome
Release as 25 mm hole size 6.99E-04 0.99 5.86E-04 4.05E-07 Jet fire
5.86E-04 2.34E-05 1.62E-08 Vapour cloud explosion
3.89E-07 Flash fire
6.90E-04 Unignited release
0.01 5.86E-04 * Escalation effect (Fireball)
4.09E-09 Jet fire
5.86E-04 2.34E-05 1.64E-10 Vapour cloud explosion
3.93E-09 Flash fire
6.97E-06 Unignited release
Release
Frequency
(per year)
Detection &
Shutdown
Immediate
Ignition
Escalation Delayed
Ignition
Vapour Cloud
Explosion
Event Frequency Event Outcome
Release as 50 mm hole size 2.16E-05 0.99 6.48E-04 1.38E-08 Jet fire
6.22E-04 2.59E-05 5.54E-10 Vapour cloud explosion
1.33E-08 Flash fire
2.13E-05 Unignited release
0.01 6.48E-04 * Escalation effect (Fireball)
1.40E-10 Jet fire
6.22E-04 2.59E-05 5.60E-12 Vapour cloud explosion
1.34E-10 Flash fire
2.15E-07 Unignited release
Release
Frequency
(per year)
Detection &
Shutdown
Immediate
Ignition
Escalation Delayed
Ignition
Vapour Cloud
Explosion
Event Frequency Event Outcome
Release as 150 mm hole size 9.25E-04 0.99 8.79E-03 8.05E-06 Jet fire
7.73E-03 1.05E-03 9.66E-07 Vapour cloud explosion
7.08E-06 Flash fire
8.84E-04 Unignited release
0.01 8.79E-03 * Escalation effect (Fireball)
8.13E-08 Jet fire
7.73E-03 1.05E-03 9.76E-09 Vapour cloud explosion
7.15E-08 Flash fire
8.92E-06 Unignited release
Note *: The escalation effect probability is estimated based on the location of release scenario and target equipment, as well as the associated consequence impact distance and duration.
As such, the escalation probability for each hazardous scenario regardless different hole size and location are assumed as 1/6, and it is only applied if separation distance between release scenario and target
equipment is within the associated consequence impact distance.

Hazardous Section HKOLNGT_22
Release
Frequency
(per year)
Detection &
Shutdown
Immediate
Ignition
Escalation Delayed
Ignition
Vapour Cloud
Explosion
Event Frequency Event Outcome
Release as 10 mm hole size 2.76E-03 0.99 5.43E-04 1.48E-06 Jet fire
5.21E-04 2.17E-05 5.93E-08 Vapour cloud explosion
1.42E-06 Flash fire
2.73E-03 Unignited release
0.01 5.43E-04 * Escalation effect (Fireball)
1.50E-08 Jet fire
5.21E-04 2.17E-05 5.99E-10 Vapour cloud explosion
1.44E-08 Flash fire
2.75E-05 Unignited release
Release
Frequency
(per year)
Detection &
Shutdown
Immediate
Ignition
Escalation Delayed
Ignition
Vapour Cloud
Explosion
Event Frequency Event Outcome
Release as 25 mm hole size 2.16E-04 0.99 6.20E-04 1.33E-07 Jet fire
5.95E-04 2.48E-05 5.30E-09 Vapour cloud explosion
1.27E-07 Flash fire
2.13E-04 Unignited release
0.01 6.20E-04 * Escalation effect (Fireball)
1.34E-09 Jet fire
5.95E-04 2.48E-05 5.36E-11 Vapour cloud explosion
1.29E-09 Flash fire
2.15E-06 Unignited release
Release
Frequency
(per year)
Detection &
Shutdown
Immediate
Ignition
Escalation Delayed
Ignition
Vapour Cloud
Explosion
Event Frequency Event Outcome
Release as 50 mm hole size 4.80E-05 0.99 1.59E-03 7.57E-08 Jet fire
1.40E-03 1.91E-04 9.09E-09 Vapour cloud explosion
6.66E-08 Flash fire
4.72E-05 Unignited release
0.01 1.59E-03 * Escalation effect (Fireball)
7.65E-10 Jet fire
1.40E-03 1.91E-04 9.18E-11 Vapour cloud explosion
6.73E-10 Flash fire
4.77E-07 Unignited release
Note *: The escalation effect probability is estimated based on the location of release scenario and target equipment, as well as the associated consequence impact distance and duration.
As such, the escalation probability for each hazardous scenario regardless different hole size and location are assumed as 1/6, and it is only applied if separation distance between release scenario and target
equipment is within the associated consequence impact distance.

Hazardous Section HKOLNGT_23
Release
Frequency
(per year)
Detection &
Shutdown
Immediate
Ignition
Escalation Delayed
Ignition
Event Frequency Event Outcome
Release as 10 mm hole size 2.28E-02 0.99 5.00E-04 1.13E-05 Pool fore
4.80E-04 1.08E-05 Flash fire
2.25E-02 Unignited release
0.01 5.00E-04 * Escalation effect (Fireball)
1.14E-07 Pool fore
4.80E-04 1.09E-07 Flash fire
2.28E-04 Unignited release
Release
Frequency
(per year)
Detection &
Shutdown
Immediate
Ignition
Escalation Delayed
Ignition
Event Frequency Event Outcome
Release as 25 mm hole size 3.63E-03 0.99 3.53E-03 1.27E-05 Pool fore
3.11E-03 1.12E-05 Flash fire
3.56E-03 Unignited release
0.01 3.53E-03 * Escalation effect (Fireball)
1.28E-07 Pool fore
3.11E-03 1.13E-07 Flash fire
3.59E-05 Unignited release
Release
Frequency
(per year)
Detection &
Shutdown
Immediate
Ignition
Escalation Delayed
Ignition
Event Frequency Event Outcome
Release as 50 mm hole size 1.54E-03 0.99 1.90E-02 2.90E-05 Pool fore
1.67E-02 2.55E-05 Flash fire
1.44E-03 Unignited release
0.01 1.90E-02 * Escalation effect (Fireball)
1.67E-02 2.93E-07 Pool fore
2.58E-07 Flash fire
1.46E-05 Unignited release
Release
Frequency
(per year)
Detection &
Shutdown
Immediate
Ignition
Escalation Delayed
Ignition
Event Frequency Event Outcome
Release as 150 mm hole size 1.80E-04 0.99 7.50E-02 1.34E-05 Pool fore
5.25E-02 9.36E-06 Flash fire
1.42E-04 Unignited release
0.01 7.50E-02 * Escalation effect (Fireball)
1.35E-07 Pool fore
5.25E-02 9.45E-08 Flash fire
1.44E-06 Unignited release
Note *: The escalation effect probability is estimated based on the location of release scenario and target equipment, as well as the associated consequence impact distance and duration.
As such, the escalation probability for each hazardous scenario regardless different hole size and location are assumed as 1/6, and it is only applied if separation distance between release scenario and target
equipment is within the associated consequence impact distance.

Hazardous Section HKOLNGT_24
Release
Frequency
(per year)
Detection &
Shutdown
Immediate
Ignition
Escalation Delayed
Ignition
Event Frequency Event Outcome
Release as 10 mm hole size 1.52E-02 0.99 6.30E-04 9.47E-06 Pool fore
6.04E-04 9.10E-06 Flash fire
1.50E-02 Unignited release
0.01 6.30E-04 * Escalation effect (Fireball)
9.57E-08 Pool fore
6.04E-04 9.19E-08 Flash fire
1.52E-04 Unignited release
Release
Frequency
(per year)
Detection &
Shutdown
Immediate
Ignition
Escalation Delayed
Ignition
Event Frequency Event Outcome
Release as 25 mm hole size 2.42E-03 0.99 3.53E-03 8.46E-06 Pool fore
3.11E-03 7.44E-06 Flash fire
2.37E-03 Unignited release
0.01 3.53E-03 * Escalation effect (Fireball)
8.54E-08 Pool fore
3.11E-03 7.52E-08 Flash fire
2.40E-05 Unignited release
Release
Frequency
(per year)
Detection &
Shutdown
Immediate
Ignition
Escalation Delayed
Ignition
Event Frequency Event Outcome
Release as 50 mm hole size 1.03E-03 0.99 1.90E-02 1.93E-06 Pool fore
1.67E-02 1.70E-06 Flash fire
1.01E-03 Unignited release
0.01 1.90E-02 * Escalation effect (Fireball)
1.95E-07 Pool fore
1.67E-02 1.72E-07 Flash fire
9.72E-06 Unignited release
Release
Frequency
(per year)
Detection &
Shutdown
Immediate
Ignition
Escalation Delayed
Ignition
Event Frequency Event Outcome
Release as 150 mm hole size 1.20E-04 0.99 7.50E-02 8.91E-07 Pool fore
5.25E-02 6.24E-07 Flash fire
1.16E-04 Unignited release
0.01 7.50E-02 * Escalation effect (Fireball)
9.00E-08 Pool fore
5.25E-02 6.30E-08 Flash fire
9.57E-07 Unignited release
Note *: The escalation effect probability is estimated based on the location of release scenario and target equipment, as well as the associated consequence impact distance and duration.
As such, the escalation probability for each hazardous scenario regardless different hole size and location are assumed as 1/6, and it is only applied if separation distance between release scenario and target
equipment is within the associated consequence impact distance.

Hazardous Section HKOLNGT_25
Release
Frequency
(per year)
Detection &
Shutdown
Immediate
Ignition
Escalation Delayed
Ignition
Event Frequency Event Outcome
Release as 10 mm hole size 2.27E-02 0.99 6.30E-04 1.42E-06 Pool fore
6.04E-04 - Flash fire
2.25E-02 Unignited release
0.01 6.30E-04 * Escalation effect (Fireball)
1.43E-07 Pool fore
6.04E-04 - Flash fire
2.27E-04 Unignited release
Release
Frequency
(per year)
Detection &
Shutdown
Immediate
Ignition
Escalation Delayed
Ignition
Event Frequency Event Outcome
Release as 25 mm hole size 2.36E-03 0.99 3.53E-04 8.25E-07 Pool fore
3.11E-04 - Flash fire
2.33E-03 Unignited release
0.01 3.53E-04 * Escalation effect (Fireball)
8.33E-08 Pool fore
3.11E-04 - Flash fire
2.34E-05 Unignited release
Release
Frequency
(per year)
Detection &
Shutdown
Immediate
Ignition
Escalation Delayed
Ignition
Event Frequency Event Outcome
Release as 50 mm hole size 9.72E-04 0.99 1.90E-03 1.83E-06 Pool fore
1.67E-03 - Flash fire
9.59E-04 Unignited release
0.01 1.90E-03 * Escalation effect (Fireball)
1.85E-07 Pool fore
1.67E-03 - Flash fire
9.35E-06 Unignited release
Release
Frequency
(per year)
Detection &
Shutdown
Immediate
Ignition
Escalation Delayed
Ignition
Event Frequency Event Outcome
Release as 150 mm hole size 1.20E-04 0.99 7.50E-03 8.91E-07 Pool fore
5.25E-03 - Flash fire
1.17E-04 Unignited release
0.01 7.50E-03 * Escalation effect (Fireball)
9.00E-08 Pool fore
5.25E-03 - Flash fire
1.02E-06 Unignited release
Note *: The escalation effect probability is estimated based on the location of release scenario and target equipment, as well as the associated consequence impact distance and duration.
As such, the escalation probability for each hazardous scenario regardless different hole size and location are assumed as 1/6, and it is only applied if separation distance between release scenario and target
equipment is within the associated consequence impact distance.

Annex 5F-2
Full List of Event Tree
Analysis for GRS facilities at
the BPPS

Hazardous Section NGRS_01
Release
Frequency
(per year)
Detection &
Shutdown
Failure
Immediate
Ignition
Escalation Delayed
Ignition (1)
Explosion
Probability
Delayed
Ignition (2)
Event Outcome Frequency Event Outcome
Release as 10 mm hole size 4.00E-06 1.00 0.02 * Escalation effect (Fireball)
8.00E-08 Jet fire
0.09 3.17E-07 Flash fire over plant area
0.12 4.32E-08 Vapour Cloud Explosion
0.01 4.00E-08 Flash fire full extent
3.44E-06 Unignited release
Release
Frequency
(per year)
Detection &
Shutdown
Failure
Immediate
Ignition
Escalation Delayed
Ignition (1)
Explosion
Probability
Delayed
Ignition (2)
Event Outcome Frequency Event Outcome
Release as 25 mm hole size 4.00E-06 1.00 0.02 * Escalation effect (Fireball)
8.00E-08 Jet fire
0.09 3.17E-07 Flash fire over plant area
0.12 4.32E-08 Vapour Cloud Explosion
0.01 4.00E-08 Flash fire full extent
3.44E-06 Unignited release
Release
Frequency
(per year)
Detection &
Shutdown
Failure
Immediate
Ignition
Escalation Delayed
Ignition (1)
Explosion
Probability
Delayed
Ignition (2)
Event Outcome Frequency Event Outcome
Release as 50 mm hole size 2.80E-06 1.00 0.02 * Escalation effect (Fireball)
5.60E-08 Jet fire
0.09 2.22E-07 Flash fire over plant area
0.12 3.02E-08 Vapour Cloud Explosion
0.01 2.80E-08 Flash fire full extent
2.41E-06 Unignited release
Release
Frequency
(per year)
Detection &
Shutdown
Failure
Immediate
Ignition
Escalation Delayed
Ignition (1)
Explosion
Probability
Delayed
Ignition (2)
Event Outcome Frequency Event Outcome
Release as 100 mm hole size 2.80E-06 1.00 0.10 * Escalation effect (Fireball)
2.80E-07 Jet fire
0.4 7.84E-07 Flash fire over plant area
0.04 3.36E-07 Vapour Cloud Explosion
0.3 1.12E-07 Flash fire full extent
1.01E-06 Unignited release
Release
Frequency
(per year)
Detection &
Shutdown
Failure
Immediate
Ignition
Escalation Delayed
Ignition (1)
Explosion
Probability
Delayed
Ignition (2)
Event Outcome Frequency Event Outcome
Release as Line Rupture 1.20E-06 1.00 0.10 * Escalation effect (Fireball)
1.20E-07 Fireball
0.4 3.36E-07 Flash fire over plant area
0.3 1.44E-07 Vapour Cloud Explosion
0.04 4.80E-08 Flash fire full extent
4.32E-07 Unignited release
Note *: The escalation effect probability is estimated based on the location of release scenario and target equipment, as well as the associated consequence impact distance and duration.
As such, the escalation probability for each hazardous scenario regardless different hole size and location are assumed as 1/6, and it is only applied if separation distance between release scenario and target equipment is
within the associated consequence impact distance.

Hazardous Section NGRS_02
Release
Frequency
(per year)
Detection &
Shutdown
Failure
Immediate
Ignition
Escalation Delayed
Ignition (1)
Explosion
Probability
Delayed
Ignition (2)
Event Outcome Frequency Event Outcome
Release as 10 mm hole size 2.00E-06 1.00 0.02 * Escalation effect (Fireball)
4.00E-08 Jet fire
0.09 1.58E-07 Flash fire over plant area
0.01 2.16E-08 Vapour Cloud Explosion
0.12 2.00E-08 Flash fire full extent
1.72E-06 Unignited release
Release
Frequency
(per year)
Detection &
Shutdown
Failure
Immediate
Ignition
Escalation Delayed
Ignition (1)
Explosion
Probability
Delayed
Ignition (2)
Event Outcome Frequency Event Outcome
Release as 25 mm hole size 2.00E-06 1.00 0.02 * Escalation effect (Fireball)
4.00E-08 Jet fire
0.09 1.58E-07 Flash fire over plant area
0.01 2.16E-08 Vapour Cloud Explosion
0.12 2.00E-08 Flash fire full extent
1.72E-06 Unignited release
Release
Frequency
(per year)
Detection &
Shutdown
Failure
Immediate
Ignition
Escalation Delayed
Ignition (1)
Explosion
Probability
Delayed
Ignition (2)
Event Outcome Frequency Event Outcome
Release as 50 mm hole size 1.40E-06 1.00 0.02 * Escalation effect (Fireball)
2.80E-08 Jet fire
0.09 1.11E-07 Flash fire over plant area
0.01 1.51E-08 Vapour Cloud Explosion
0.12 1.40E-08 Flash fire full extent
1.20E-06 Unignited release
Release
Frequency
(per year)
Detection &
Shutdown
Failure
Immediate
Ignition
Escalation Delayed
Ignition (1)
Explosion
Probability
Delayed
Ignition (2)
Event Outcome Frequency Event Outcome
Release as 100 mm hole size 1.40E-06 1.00 0.10 * Escalation effect (Fireball)
1.40E-07 Jet fire
0.4 3.92E-07 Flash fire over plant area
0.04 1.68E-07 Vapour Cloud Explosion
0.3 5.60E-08 Flash fire full extent
5.04E-07 Unignited release
Release
Frequency
(per year)
Detection &
Shutdown
Failure
Immediate
Ignition
Escalation Delayed
Ignition (1)
Explosion
Probability
Delayed
Ignition (2)
Event Outcome Frequency Event Outcome
Release as Line Rupture 6.00E-07 1.00 0.10 * Escalation effect (Fireball)
6.00E-08 Fireball
0.4 1.68E-07 Flash fire over plant area
0.04 7.20E-08 Vapour Cloud Explosion
0.3 2.40E-08 Flash fire full extent
2.16E-07 Unignited release
Note *: The escalation effect probability is estimated based on the location of release scenario and target equipment, as well as the associated consequence impact distance and duration.
As such, the escalation probability for each hazardous scenario regardless different hole size and location are assumed as 1/6, and it is only applied if separation distance between release scenario and target equipment is
within the associated consequence impact distance.

Hazardous Section NGRS_03
Release
Frequency
(per year)
Detection &
Shutdown
Failure
Immediate
Ignition
Escalation Delayed
Ignition (1)
Explosion
Probability
Delayed
Ignition (2)
Event Outcome Frequency Event Outcome
Release as 10 mm hole size 6.50E-06 1.00 0.02 * Escalation effect (Fireball)
1.30E-07 Jet fire
0.09 5.15E-07 Flash fire over plant area
0.12 7.02E-08 Vapour Cloud Explosion
0.01 6.50E-08 Flash fire full extent
5.59E-06 Unignited release
Release
Frequency
(per year)
Detection &
Shutdown
Failure
Immediate
Ignition
Escalation Delayed
Ignition (1)
Explosion
Probability
Delayed
Ignition (2)
Event Outcome Frequency Event Outcome
Release as 25 mm hole size 6.50E-06 1.00 0.02 * Escalation effect (Fireball)
1.30E-07 Jet fire
0.09 5.15E-07 Flash fire over plant area
0.12 7.02E-08 Vapour Cloud Explosion
0.01 6.50E-08 Flash fire full extent
5.59E-06 Unignited release
Release
Frequency
(per year)
Detection &
Shutdown
Failure
Immediate
Ignition
Escalation Delayed
Ignition (1)
Explosion
Probability
Delayed
Ignition (2)
Event Outcome Frequency Event Outcome
Release as 50 mm hole size 4.55E-06 1.00 0.02 * Escalation effect (Fireball)
9.10E-08 Jet fire
0.09 3.60E-07 Flash fire over plant area
0.12 4.91E-08 Vapour Cloud Explosion
0.01 4.55E-08 Flash fire full extent
3.91E-06 Unignited release
Release
Frequency
(per year)
Detection &
Shutdown
Failure
Immediate
Ignition
Escalation Delayed
Ignition (1)
Explosion
Probability
Delayed
Ignition (2)
Event Outcome Frequency Event Outcome
Release as 100 mm hole size 4.55E-06 1.00 0.10 * Escalation effect (Fireball)
4.55E-07 Jet fire
0.4 1.27E-06 Flash fire over plant area
0.12 5.46E-07 Vapour Cloud Explosion
0.04 1.82E-07 Flash fire full extent
1.64E-06 Unignited release
Release
Frequency
(per year)
Detection &
Shutdown
Failure
Immediate
Ignition
Escalation Delayed
Ignition (1)
Explosion
Probability
Delayed
Ignition (2)
Event Outcome Frequency Event Outcome
Release as Line Rupture 1.95E-06 1.00 0.10 * Escalation effect (Fireball)
1.95E-07 Fireball
0.4 5.46E-07 Flash fire over plant area
0.12 2.34E-07 Vapour Cloud Explosion
0.04 7.80E-08 Flash fire full extent
7.02E-07 Unignited release
Note *: The escalation effect probability is estimated based on the location of release scenario and target equipment, as well as the associated consequence impact distance and duration.
As such, the escalation probability for each hazardous scenario regardless different hole size and location are assumed as 1/6, and it is only applied if separation distance between release scenario and target equipment is
within the associated consequence impact distance.

Hazardous Section NGRS_04
Release
Frequency
(per year)
Detection &
Shutdown
Failure
Immediate
Ignition
Escalation Delayed
Ignition (1)
Explosion
Probability
Delayed
Ignition (2)
Event Outcome Frequency Event Outcome
Release as 10 mm hole size 1.04E-05 1.00 0.02 * Escalation effect (Fireball)
2.08E-07 Jet fire
0.09 8.24E-07 Flash fire over plant area
0.12 1.12E-07 Vapour Cloud Explosion
0.01 1.04E-07 Flash fire full extent
8.94E-06 Unignited release
Release
Frequency
(per year)
Detection &
Shutdown
Failure
Immediate
Ignition
Escalation Delayed
Ignition (1)
Explosion
Probability
Delayed
Ignition (2)
Event Outcome Frequency Event Outcome
Release as 25 mm hole size 1.04E-05 1.00 0.02 * Escalation effect (Fireball)
2.08E-07 Jet fire
0.09 8.24E-07 Flash fire over plant area
0.12 1.12E-07 Vapour Cloud Explosion
0.01 1.04E-07 Flash fire full extent
8.94E-06 Unignited release
Release
Frequency
(per year)
Detection &
Shutdown
Failure
Immediate
Ignition
Escalation Delayed
Ignition (1)
Explosion
Probability
Delayed
Ignition (2)
Event Outcome Frequency Event Outcome
Release as 50 mm hole size 7.28E-06 1.00 0.02 * Escalation effect (Fireball)
1.46E-07 Jet fire
0.09 5.77E-07 Flash fire over plant area
0.12 7.86E-08 Vapour Cloud Explosion
0.01 7.28E-08 Flash fire full extent
6.26E-06 Unignited release
Release
Frequency
(per year)
Detection &
Shutdown
Failure
Immediate
Ignition
Escalation Delayed
Ignition (1)
Explosion
Probability
Delayed
Ignition (2)
Event Outcome Frequency Event Outcome
Release as 100 mm hole size 7.28E-06 1.00 0.10 * Escalation effect (Fireball)
7.28E-07 Jet fire
0.4 2.04E-06 Flash fire over plant area
0.3 8.74E-07 Vapour Cloud Explosion
0.01 2.91E-07 Flash fire full extent
2.62E-06 Unignited release
Release
Frequency
(per year)
Detection &
Shutdown
Failure
Immediate
Ignition
Escalation Delayed
Ignition (1)
Explosion
Probability
Delayed
Ignition (2)
Event Outcome Frequency Event Outcome
Release as Line Rupture 3.12E-06 1.00 0.10 * Escalation effect (Fireball)
3.12E-07 Fireball
0.4 8.74E-07 Flash fire over plant area
0.3 3.74E-07 Vapour Cloud Explosion
0.01 1.25E-07 Flash fire full extent
1.12E-06 Unignited release
Note *: The escalation effect probability is estimated based on the location of release scenario and target equipment, as well as the associated consequence impact distance and duration.
As such, the escalation probability for each hazardous scenario regardless different hole size and location are assumed as 1/6, and it is only applied if separation distance between release scenario and target equipment is
within the associated consequence impact distance.

Hazardous Section NGRS_05
Release
Frequency
(per year)
Detection &
Shutdown
Failure
Immediate
Ignition
Escalation Delayed
Ignition (1)
Explosion
Probability
Delayed
Ignition (2)
Event Outcome Frequency Event Outcome
Release as 10 mm hole size 3.42E-05 1.00 0.02 * Escalation effect (Fireball)
6.84E-07 Jet fire
0.09 2.71E-06 Flash fire over plant area
0.12 3.69E-07 Vapour Cloud Explosion
0.01 3.42E-07 Flash fire full extent
2.94E-05 Unignited release
Release
Frequency
(per year)
Detection &
Shutdown
Failure
Immediate
Ignition
Escalation Delayed
Ignition (1)
Explosion
Probability
Delayed
Ignition (2)
Event Outcome Frequency Event Outcome
Release as 25 mm hole size 3.42E-05 1.00 0.02 * Escalation effect (Fireball)
6.84E-07 Jet fire
0.09 2.71E-06 Flash fire over plant area
0.12 3.69E-07 Vapour Cloud Explosion
0.01 3.42E-07 Flash fire full extent
2.94E-05 Unignited release
Release
Frequency
(per year)
Detection &
Shutdown
Failure
Immediate
Ignition
Escalation Delayed
Ignition (1)
Explosion
Probability
Delayed
Ignition (2)
Event Outcome Frequency Event Outcome
Release as 50 mm hole size 1.14E-05 1.00 0.02 * Escalation effect (Fireball)
2.28E-07 Jet fire
0.09 9.03E-07 Flash fire over plant area
0.12 1.23E-07 Vapour Cloud Explosion
0.01 1.14E-07 Flash fire full extent
9.80E-06 Unignited release
Release
Frequency
(per year)
Detection &
Shutdown
Failure
Immediate
Ignition
Escalation Delayed
Ignition (1)
Explosion
Probability
Delayed
Ignition (2)
Event Outcome Frequency Event Outcome
Release as 100 mm hole size 1.14E-05 1.00 0.10 * Escalation effect (Fireball)
1.14E-06 Jet fire
0.4 3.19E-06 Flash fire over plant area
0.12 1.37E-06 Vapour Cloud Explosion
0.04 4.56E-07 Flash fire full extent
4.10E-06 Unignited release
Release
Frequency
(per year)
Detection &
Shutdown
Failure
Immediate
Ignition
Escalation Delayed
Ignition (1)
Explosion
Probability
Delayed
Ignition (2)
Event Outcome Frequency Event Outcome
Release as Line Rupture 5.70E-06 1.00 0.10 * Escalation effect (Fireball)
5.70E-07 Fireball
0.4 1.60E-06 Flash fire over plant area
0.12 6.84E-07 Vapour Cloud Explosion
0.04 2.28E-07 Flash fire full extent
2.05E-06 Unignited release
Note *: The escalation effect probability is estimated based on the location of release scenario and target equipment, as well as the associated consequence impact distance and duration.
As such, the escalation probability for each hazardous scenario regardless different hole size and location are assumed as 1/6, and it is only applied if separation distance between release scenario and target equipment is
within the associated consequence impact distance.

Hazardous Section NGRS_06
Release
Frequency
(per year)
Detection &
Shutdown
Failure
Immediate
Ignition
Escalation Delayed
Ignition (1)
Explosion
Probability
Delayed
Ignition (2)
Event Outcome Frequency Event Outcome
Release as 10 mm hole size 1.56E-05 1.00 0.02 * Escalation effect (Fireball)
3.12E-07 Jet fire
0.09 1.24E-06 Flash fire over plant area
0.12 1.68E-07 Vapour Cloud Explosion
0.01 1.56E-07 Flash fire full extent
1.34E-05 Unignited release
Release
Frequency
(per year)
Detection &
Shutdown
Failure
Immediate
Ignition
Escalation Delayed
Ignition (1)
Explosion
Probability
Delayed
Ignition (2)
Event Outcome Frequency Event Outcome
Release as 25 mm hole size 1.56E-05 1.00 0.02 * Escalation effect (Fireball)
3.12E-07 Jet fire
0.09 1.24E-06 Flash fire over plant area
0.12 1.68E-07 Vapour Cloud Explosion
0.01 1.56E-07 Flash fire full extent
1.34E-05 Unignited release
Release
Frequency
(per year)
Detection &
Shutdown
Failure
Immediate
Ignition
Escalation Delayed
Ignition (1)
Explosion
Probability
Delayed
Ignition (2)
Event Outcome Frequency Event Outcome
Release as 50 mm hole size 5.20E-06 1.00 0.02 * Escalation effect (Fireball)
1.04E-07 Jet fire
0.09 4.12E-07 Flash fire over plant area
0.12 5.62E-08 Vapour Cloud Explosion
0.01 5.20E-08 Flash fire full extent
4.47E-06 Unignited release
Release
Frequency
(per year)
Detection &
Shutdown
Failure
Immediate
Ignition
Escalation Delayed
Ignition (1)
Explosion
Probability
Delayed
Ignition (2)
Event Outcome Frequency Event Outcome
Release as 100 mm hole size 5.20E-06 1.00 0.10 * Escalation effect (Fireball)
5.20E-07 Jet fire
0.4 1.46E-06 Flash fire over plant area
0.3 6.24E-07 Vapour Cloud Explosion
0.04 2.08E-07 Flash fire full extent
1.87E-06 Unignited release
Release
Frequency
(per year)
Detection &
Shutdown
Failure
Immediate
Ignition
Escalation Delayed
Ignition (1)
Explosion
Probability
Delayed
Ignition (2)
Event Outcome Frequency Event Outcome
Release as Line Rupture 2.60E-06 1.00 0.10 * Escalation effect (Fireball)
2.60E-07 Fireball
0.4 7.28E-07 Flash fire over plant area
0.3 3.12E-07 Vapour Cloud Explosion
0.04 1.04E-07 Flash fire full extent
9.36E-07 Unignited release
Note *: The escalation effect probability is estimated based on the location of release scenario and target equipment, as well as the associated consequence impact distance and duration.
As such, the escalation probability for each hazardous scenario regardless different hole size and location are assumed as 1/6, and it is only applied if separation distance between release scenario and target equipment is
within the associated consequence impact distance.

Hazardous Section NGRS_07
Release
Frequency
(per year)
Detection &
Shutdown
Failure
Immediate
Ignition
Escalation Delayed
Ignition (1)
Explosion
Probability
Delayed
Ignition (2)
Event Outcome Frequency Event Outcome
Release as 10 mm hole size 2.20E-05 1.00 0.02 * Escalation effect (Fireball)
4.40E-07 Jet fire
0.09 1.90E-06 Flash fire over plant area
0.04 7.92E-08 Vapour Cloud Explosion
0.01 2.20E-07 Flash fire full extent
1.89E-05 Unignited release
Release
Frequency
(per year)
Detection &
Shutdown
Failure
Immediate
Ignition
Escalation Delayed
Ignition (1)
Explosion
Probability
Delayed
Ignition (2)
Event Outcome Frequency Event Outcome
Release as 25 mm hole size 2.20E-05 1.00 0.02 * Escalation effect (Fireball)
4.40E-07 Jet fire
0.09 1.74E-06 Flash fire over plant area
0.12 2.38E-07 Vapour Cloud Explosion
0.01 2.20E-07 Flash fire full extent
1.89E-05 Unignited release
Release
Frequency
(per year)
Detection &
Shutdown
Failure
Immediate
Ignition
Escalation Delayed
Ignition (1)
Explosion
Probability
Delayed
Ignition (2)
Event Outcome Frequency Event Outcome
Release as 50 mm hole size 1.54E-05 1.00 0.02 * Escalation effect (Fireball)
3.08E-07 Jet fire
0.09 1.22E-06 Flash fire over plant area
0.12 1.66E-07 Vapour Cloud Explosion
0.01 1.54E-07 Flash fire full extent
1.32E-05 Unignited release
Release
Frequency
(per year)
Detection &
Shutdown
Failure
Immediate
Ignition
Escalation Delayed
Ignition (1)
Explosion
Probability
Delayed
Ignition (2)
Event Outcome Frequency Event Outcome
Release as 100 mm hole size 1.54E-05 1.00 0.02 * Escalation effect (Fireball)
3.08E-07 Jet fire
0.09 1.22E-06 Flash fire over plant area
0.12 1.66E-07 Vapour Cloud Explosion
0.01 1.54E-07 Flash fire full extent
1.32E-05 Unignited release
Release
Frequency
(per year)
Detection &
Shutdown
Failure
Immediate
Ignition
Escalation Delayed
Ignition (1)
Explosion
Probability
Delayed
Ignition (2)
Event Outcome Frequency Event Outcome
Release as Line Rupture 6.60E-06 1.00 0.10 * Escalation effect (Fireball)
6.60E-07 Fireball
0.4 1.85E-06 Flash fire over plant area
0.3 7.92E-07 Vapour Cloud Explosion
0.04 2.64E-07 Flash fire full extent
2.38E-06 Unignited release
Note *: The escalation effect probability is estimated based on the location of release scenario and target equipment, as well as the associated consequence impact distance and duration.
As such, the escalation probability for each hazardous scenario regardless different hole size and location are assumed as 1/6, and it is only applied if separation distance between release scenario and target equipment is
within the associated consequence impact distance.

Hazardous Section NGRS_08
Release
Frequency
(per year)
Detection &
Shutdown
Failure
Immediate
Ignition
Escalation Delayed
Ignition (1)
Explosion
Probability
Delayed
Ignition (2)
Event Outcome Frequency Event Outcome
Release as 10 mm hole size 8.71E-07 1.00 0.02 * Escalation effect (Fireball)
1.74E-08 Jet fire
0.09 6.90E-08 Flash fire over plant area
0.12 9.41E-09 Vapour Cloud Explosion
0.01 8.71E-09 Flash fire full extent
7.49E-07 Unignited release
Release
Frequency
(per year)
Detection &
Shutdown
Failure
Immediate
Ignition
Escalation Delayed
Ignition (1)
Explosion
Probability
Delayed
Ignition (2)
Event Outcome Frequency Event Outcome
Release as 25 mm hole size 8.71E-07 1.00 0.02 * Escalation effect (Fireball)
1.74E-08 Jet fire
0.09 6.90E-08 Flash fire over plant area
0.12 9.41E-09 Vapour Cloud Explosion
0.01 8.71E-09 Flash fire full extent
7.49E-07 Unignited release
Release
Frequency
(per year)
Detection &
Shutdown
Failure
Immediate
Ignition
Escalation Delayed
Ignition (1)
Explosion
Probability
Delayed
Ignition (2)
Event Outcome Frequency Event Outcome
Release as 50 mm hole size 6.10E-07 1.00 0.02 * Escalation effect (Fireball)
1.22E-08 Jet fire
0.09 4.83E-08 Flash fire over plant area
0.12 6.58E-09 Vapour Cloud Explosion
0.01 6.10E-09 Flash fire full extent
5.24E-07 Unignited release
Release
Frequency
(per year)
Detection &
Shutdown
Failure
Immediate
Ignition
Escalation Delayed
Ignition (1)
Explosion
Probability
Delayed
Ignition (2)
Event Outcome Frequency Event Outcome
Release as 100 mm hole size 6.10E-07 1.00 0.10 * Escalation effect (Fireball)
6.10E-08 Jet fire
0.4 1.71E-07 Flash fire over plant area
0.3 7.32E-08 Vapour Cloud Explosion
0.04 2.44E-08 Flash fire full extent
2.19E-07 Unignited release
Release
Frequency
(per year)
Detection &
Shutdown
Failure
Immediate
Ignition
Escalation Delayed
Ignition (1)
Explosion
Probability
Delayed
Ignition (2)
Event Outcome Frequency Event Outcome
Release as Line Rupture 2.61E-07 1.00 0.10 * Escalation effect (Fireball)
2.61E-08 Fireball
0.4 7.32E-08 Flash fire over plant area
0.3 3.14E-08 Vapour Cloud Explosion
0.04 1.05E-08 Flash fire full extent
9.41E-08 Unignited release
Note *: The escalation effect probability is estimated based on the location of release scenario and target equipment, as well as the associated consequence impact distance and duration.
As such, the escalation probability for each hazardous scenario regardless different hole size and location are assumed as 1/6, and it is only applied if separation distance between release scenario and target equipment is
within the associated consequence impact distance.

Hazardous Section GRS_01
Release
Frequency
(per year)
Detection &
Shutdown
Failure
Immediate
Ignition
Escalation Delayed
Ignition (1)
Explosion
Probability
Delayed
Ignition (2)
Event Outcome Frequency Event Outcome
Release as 10 mm hole size 1.60E-05 1.00 0.02 * Escalation effect (Fireball)
3.20E-07 Jet fire
0.09 1.27E-06 Flash fire over plant area
0.12 1.73E-07 Vapour Cloud Explosion
0.01 1.60E-07 Flash fire full extent
1.38E-05 Unignited release
Release
Frequency
(per year)
Detection &
Shutdown
Failure
Immediate
Ignition
Escalation Delayed
Ignition (1)
Explosion
Probability
Delayed
Ignition (2)
Event Outcome Frequency Event Outcome
Release as 25 mm hole size 1.60E-05 1.00 0.02 * Escalation effect (Fireball)
3.20E-07 Jet fire
0.09 1.27E-06 Flash fire over plant area
0.12 1.73E-07 Vapour Cloud Explosion
0.01 1.60E-07 Flash fire full extent
1.38E-05 Unignited release
Release
Frequency
(per year)
Detection &
Shutdown
Failure
Immediate
Ignition
Escalation Delayed
Ignition (1)
Explosion
Probability
Delayed
Ignition (2)
Event Outcome Frequency Event Outcome
Release as 50 mm hole size 1.12E-05 1.00 0.10 * Escalation effect (Fireball)
1.12E-06 Jet fire
0.4 3.14E-06 Flash fire over plant area
0.3 1.34E-06 Vapour Cloud Explosion
0.04 4.48E-07 Flash fire full extent
4.03E-06 Unignited release
Release
Frequency
(per year)
Detection &
Shutdown
Failure
Immediate
Ignition
Escalation Delayed
Ignition (1)
Explosion
Probability
Delayed
Ignition (2)
Event Outcome Frequency Event Outcome
Release as 100 mm hole size 1.12E-05 1.00 0.10 * Escalation effect (Fireball)
1.12E-06 Jet fire
0.4 3.14E-06 Flash fire over plant area
0.3 1.34E-06 Vapour Cloud Explosion
0.04 4.48E-07 Flash fire full extent
4.03E-06 Unignited release
Release
Frequency
(per year)
Detection &
Shutdown
Failure
Immediate
Ignition
Escalation Delayed
Ignition (1)
Explosion
Probability
Delayed
Ignition (2)
Event Outcome Frequency Event Outcome
Release as Line Rupture 4.80E-06 1.00 0.10 * Escalation effect (Fireball)
4.80E-07 Fireball
0.4 1.34E-06 Flash fire over plant area
0.3 5.76E-07 Vapour Cloud Explosion
0.04 1.92E-07 Flash fire full extent
1.73E-06 Unignited release
Note *: The escalation effect probability is estimated based on the location of release scenario and target equipment, as well as the associated consequence impact distance and duration.
As such, the escalation probability for each hazardous scenario regardless different hole size and location are assumed as 1/6, and it is only applied if separation distance between release scenario and target equipment is
within the associated consequence impact distance.

Hazardous Section GRS_02
Release
Frequency
(per year)
Detection &
Shutdown
Failure
Immediate
Ignition
Escalation Delayed
Ignition (1)
Explosion
Probability
Delayed
Ignition (2)
Event Outcome Frequency Event Outcome
Release as 10 mm hole size 3.50E-06 1.00 0.02 * Escalation effect (Fireball)
7.00E-08 Jet fire
0.09 2.77E-07 Flash fire over plant area
0.12 3.78E-08 Vapour Cloud Explosion
0.01 3.50E-08 Flash fire full extent
3.01E-06 Unignited release
Release
Frequency
(per year)
Detection &
Shutdown
Failure
Immediate
Ignition
Escalation Delayed
Ignition (1)
Explosion
Probability
Delayed
Ignition (2)
Event Outcome Frequency Event Outcome
Release as 25 mm hole size 3.50E-06 1.00 0.02 * Escalation effect (Fireball)
7.00E-08 Jet fire
0.09 2.77E-07 Flash fire over plant area
0.12 3.78E-08 Vapour Cloud Explosion
0.01 3.50E-08 Flash fire full extent
3.01E-06 Unignited release
Release
Frequency
(per year)
Detection &
Shutdown
Failure
Immediate
Ignition
Escalation Delayed
Ignition (1)
Explosion
Probability
Delayed
Ignition (2)
Event Outcome Frequency Event Outcome
Release as 50 mm hole size 2.45E-06 1.00 0.10 * Escalation effect (Fireball)
2.45E-07 Jet fire
0.4 6.86E-07 Flash fire over plant area
0.3 2.94E-07 Vapour Cloud Explosion
0.04 9.80E-08 Flash fire full extent
8.82E-07 Unignited release
Release
Frequency
(per year)
Detection &
Shutdown
Failure
Immediate
Ignition
Escalation Delayed
Ignition (1)
Explosion
Probability
Delayed
Ignition (2)
Event Outcome Frequency Event Outcome
Release as 100 mm hole size 2.45E-06 1.00 0.10 * Escalation effect (Fireball)
2.45E-07 Jet fire
0.4 6.86E-07 Flash fire over plant area
0.3 2.94E-07 Vapour Cloud Explosion
0.04 9.80E-08 Flash fire full extent
8.82E-07 Unignited release
Release
Frequency
(per year)
Detection &
Shutdown
Failure
Immediate
Ignition
Escalation Delayed
Ignition (1)
Explosion
Probability
Delayed
Ignition (2)
Event Outcome Frequency Event Outcome
Release as Line Rupture 1.05E-06 1.00 0.10 * Escalation effect (Fireball)
1.05E-07 Fireball
0.4 2.94E-07 Flash fire over plant area
0.3 1.26E-07 Vapour Cloud Explosion
0.04 4.20E-08 Flash fire full extent
3.78E-07 Unignited release
Note *: The escalation effect probability is estimated based on the location of release scenario and target equipment, as well as the associated consequence impact distance and duration.
As such, the escalation probability for each hazardous scenario regardless different hole size and location are assumed as 1/6, and it is only applied if separation distance between release scenario and target equipment is
within the associated consequence impact distance.

Hazardous Section GRS_03
Release
Frequency
(per year)
Detection &
Shutdown
Failure
Immediate
Ignition
Escalation Delayed
Ignition (1)
Explosion
Probability
Delayed
Ignition (2)
Event Outcome Frequency Event Outcome
Release as 10 mm hole size 4.00E-06 1.00 0.02 * Escalation effect (Fireball)
8.00E-08 Jet fire
0.09 3.17E-07 Flash fire over plant area
0.12 4.32E-08 Vapour Cloud Explosion
0.01 4.00E-08 Flash fire full extent
3.44E-06 Unignited release
Release
Frequency
(per year)
Detection &
Shutdown
Failure
Immediate
Ignition
Escalation Delayed
Ignition (1)
Explosion
Probability
Delayed
Ignition (2)
Event Outcome Frequency Event Outcome
Release as 25 mm hole size 4.00E-06 1.00 0.02 * Escalation effect (Fireball)
8.00E-08 Jet fire
0.09 3.17E-07 Flash fire over plant area
0.12 4.32E-08 Vapour Cloud Explosion
0.01 4.00E-08 Flash fire full extent
3.44E-06 Unignited release
Release
Frequency
(per year)
Detection &
Shutdown
Failure
Immediate
Ignition
Escalation Delayed
Ignition (1)
Explosion
Probability
Delayed
Ignition (2)
Event Outcome Frequency Event Outcome
Release as 50 mm hole size 2.80E-06 1.00 0.10 * Escalation effect (Fireball)
2.80E-07 Jet fire
0.4 7.84E-07 Flash fire over plant area
0.3 3.36E-07 Vapour Cloud Explosion
0.04 1.12E-07 Flash fire full extent
1.01E-06 Unignited release
Release
Frequency
(per year)
Detection &
Shutdown
Failure
Immediate
Ignition
Escalation Delayed
Ignition (1)
Explosion
Probability
Delayed
Ignition (2)
Event Outcome Frequency Event Outcome
Release as 100 mm hole size 2.80E-06 1.00 0.10 * Escalation effect (Fireball)
2.80E-07 Jet fire
0.4 7.84E-07 Flash fire over plant area
0.3 3.36E-07 Vapour Cloud Explosion
0.04 1.12E-07 Flash fire full extent
1.01E-06 Unignited release
Release
Frequency
(per year)
Detection &
Shutdown
Failure
Immediate
Ignition
Escalation Delayed
Ignition (1)
Explosion
Probability
Delayed
Ignition (2)
Event Outcome Frequency Event Outcome
Release as Line Rupture 1.20E-06 1.00 0.10 * Escalation effect (Fireball)
1.20E-07 Fireball
0.4 3.36E-07 Flash fire over plant area
0.3 1.44E-07 Vapour Cloud Explosion
0.04 4.80E-08 Flash fire full extent
4.32E-07 Unignited release
Note *: The escalation effect probability is estimated based on the location of release scenario and target equipment, as well as the associated consequence impact distance and duration.
As such, the escalation probability for each hazardous scenario regardless different hole size and location are assumed as 1/6, and it is only applied if separation distance between release scenario and target equipment is
within the associated consequence impact distance.

Hazardous Section GRS_04
Release
Frequency
(per year)
Detection &
Shutdown
Failure
Immediate
Ignition
Escalation Delayed
Ignition (1)
Explosion
Probability
Delayed
Ignition (2)
Event Outcome Frequency Event Outcome
Release as 10 mm hole size 1.05E-05 1.00 0.02 * Escalation effect (Fireball)
2.10E-07 Jet fire
0.09 8.32E-07 Flash fire over plant area
0.12 1.13E-07 Vapour Cloud Explosion
0.01 1.05E-07 Flash fire full extent
9.03E-06 Unignited release
Release
Frequency
(per year)
Detection &
Shutdown
Failure
Immediate
Ignition
Escalation Delayed
Ignition (1)
Explosion
Probability
Delayed
Ignition (2)
Event Outcome Frequency Event Outcome
Release as 25 mm hole size 1.05E-05 1.00 0.02 * Escalation effect (Fireball)
2.10E-07 Jet fire
0.09 8.32E-07 Flash fire over plant area
0.12 1.13E-07 Vapour Cloud Explosion
0.01 1.05E-07 Flash fire full extent
9.03E-06 Unignited release
Release
Frequency
(per year)
Detection &
Shutdown
Failure
Immediate
Ignition
Escalation Delayed
Ignition (1)
Explosion
Probability
Delayed
Ignition (2)
Event Outcome Frequency Event Outcome
Release as 50 mm hole size 7.35E-06 1.00 0.10 * Escalation effect (Fireball)
7.35E-07 Jet fire
0.4 2.06E-06 Flash fire over plant area
0.3 8.82E-07 Vapour Cloud Explosion
0.04 2.94E-07 Flash fire full extent
2.65E-06 Unignited release
Release
Frequency
(per year)
Detection &
Shutdown
Failure
Immediate
Ignition
Escalation Delayed
Ignition (1)
Explosion
Probability
Delayed
Ignition (2)
Event Outcome Frequency Event Outcome
Release as 100 mm hole size 7.35E-06 1.00 0.10 * Escalation effect (Fireball)
7.35E-07 Jet fire
0.4 2.06E-06 Flash fire over plant area
0.3 8.82E-07 Vapour Cloud Explosion
0.04 2.94E-07 Flash fire full extent
2.65E-06 Unignited release
Release
Frequency
(per year)
Detection &
Shutdown
Failure
Immediate
Ignition
Escalation Delayed
Ignition (1)
Explosion
Probability
Delayed
Ignition (2)
Event Outcome Frequency Event Outcome
Release as Line Rupture 3.15E-06 1.00 0.10 * Escalation effect (Fireball)
3.15E-07 Fireball
0.4 8.82E-07 Flash fire over plant area
0.3 3.78E-07 Vapour Cloud Explosion
0.04 1.26E-07 Flash fire full extent
1.13E-06 Unignited release
Note *: The escalation effect probability is estimated based on the location of release scenario and target equipment, as well as the associated consequence impact distance and duration.
As such, the escalation probability for each hazardous scenario regardless different hole size and location are assumed as 1/6, and it is only applied if separation distance between release scenario and target equipment is
within the associated consequence impact distance.

Hazardous Section GRS_05
Release
Frequency
(per year)
Detection &
Shutdown
Failure
Immediate
Ignition
Escalation Delayed
Ignition (1)
Explosion
Probability
Delayed
Ignition (2)
Event Outcome Frequency Event Outcome
Release as 10 mm hole size 9.50E-06 1.00 0.02 * Escalation effect (Fireball)
1.90E-07 Jet fire
0.09 7.52E-07 Flash fire over plant area
0.12 1.03E-07 Vapour Cloud Explosion
0.01 9.50E-08 Flash fire full extent
8.17E-06 Unignited release
Release
Frequency
(per year)
Detection &
Shutdown
Failure
Immediate
Ignition
Escalation Delayed
Ignition (1)
Explosion
Probability
Delayed
Ignition (2)
Event Outcome Frequency Event Outcome
Release as 25 mm hole size 9.50E-06 1.00 0.02 * Escalation effect (Fireball)
1.90E-07 Jet fire
0.09 7.52E-07 Flash fire over plant area
0.12 1.03E-07 Vapour Cloud Explosion
0.01 9.50E-08 Flash fire full extent
8.17E-06 Unignited release
Release
Frequency
(per year)
Detection &
Shutdown
Failure
Immediate
Ignition
Escalation Delayed
Ignition (1)
Explosion
Probability
Delayed
Ignition (2)
Event Outcome Frequency Event Outcome
Release as 50 mm hole size 6.65E-06 1.00 0.10 * Escalation effect (Fireball)
6.65E-07 Jet fire
0.4 1.86E-06 Flash fire over plant area
0.3 7.98E-07 Vapour Cloud Explosion
0.04 2.66E-07 Flash fire full extent
2.39E-06 Unignited release
Release
Frequency
(per year)
Detection &
Shutdown
Failure
Immediate
Ignition
Escalation Delayed
Ignition (1)
Explosion
Probability
Delayed
Ignition (2)
Event Outcome Frequency Event Outcome
Release as 100 mm hole size 6.65E-06 1.00 0.10 * Escalation effect (Fireball)
6.65E-07 Jet fire
0.4 1.86E-06 Flash fire over plant area
0.3 7.98E-07 Vapour Cloud Explosion
0.04 2.66E-07 Flash fire full extent
2.39E-06 Unignited release
Release
Frequency
(per year)
Detection &
Shutdown
Failure
Immediate
Ignition
Escalation Delayed
Ignition (1)
Explosion
Probability
Delayed
Ignition (2)
Event Outcome Frequency Event Outcome
Release as Line Rupture 2.85E-06 1.00 0.10 * Escalation effect (Fireball)
2.85E-07 Fireball
0.4 7.98E-07 Flash fire over plant area
0.3 3.42E-07 Vapour Cloud Explosion
0.04 1.14E-07 Flash fire full extent
1.03E-06 Unignited release
Note *: The escalation effect probability is estimated based on the location of release scenario and target equipment, as well as the associated consequence impact distance and duration.
As such, the escalation probability for each hazardous scenario regardless different hole size and location are assumed as 1/6, and it is only applied if separation distance between release scenario and target equipment is
within the associated consequence impact distance.

Hazardous Section GRS_06
Release
Frequency
(per year)
Detection &
Shutdown
Failure
Immediate
Ignition
Escalation Delayed
Ignition (1)
Explosion
Probability
Delayed
Ignition (2)
Event Outcome Frequency Event Outcome
Release as 10 mm hole size 2.00E-06 1.00 0.02 * Escalation effect (Fireball)
4.00E-08 Jet fire
0.09 1.58E-07 Flash fire over plant area
0.12 2.16E-08 Vapour Cloud Explosion
0.01 2.00E-08 Flash fire full extent
1.72E-06 Unignited release
Release
Frequency
(per year)
Detection &
Shutdown
Failure
Immediate
Ignition
Escalation Delayed
Ignition (1)
Explosion
Probability
Delayed
Ignition (2)
Event Outcome Frequency Event Outcome
Release as 25 mm hole size 2.00E-06 1.00 0.02 * Escalation effect (Fireball)
4.00E-08 Jet fire
0.09 1.58E-07 Flash fire over plant area
0.12 2.16E-08 Vapour Cloud Explosion
0.01 2.00E-08 Flash fire full extent
1.72E-06 Unignited release
Release
Frequency
(per year)
Detection &
Shutdown
Failure
Immediate
Ignition
Escalation Delayed
Ignition (1)
Explosion
Probability
Delayed
Ignition (2)
Event Outcome Frequency Event Outcome
Release as 50 mm hole size 1.40E-06 1.00 0.10 * Escalation effect (Fireball)
1.40E-07 Jet fire
0.4 3.92E-07 Flash fire over plant area
0.3 1.68E-07 Vapour Cloud Explosion
0.04 5.60E-08 Flash fire full extent
5.04E-07 Unignited release
Release
Frequency
(per year)
Detection &
Shutdown
Failure
Immediate
Ignition
Escalation Delayed
Ignition (1)
Explosion
Probability
Delayed
Ignition (2)
Event Outcome Frequency Event Outcome
Release as 100 mm hole size 1.40E-06 1.00 0.10 * Escalation effect (Fireball)
1.40E-07 Jet fire
0.4 3.92E-07 Flash fire over plant area
0.3 1.68E-07 Vapour Cloud Explosion
0.04 5.60E-08 Flash fire full extent
5.04E-07 Unignited release
Release
Frequency
(per year)
Detection &
Shutdown
Failure
Immediate
Ignition
Escalation Delayed
Ignition (1)
Explosion
Probability
Delayed
Ignition (2)
Event Outcome Frequency Event Outcome
Release as Line Rupture 6.00E-07 1.00 0.10 * Escalation effect (Fireball)
6.00E-08 Fireball
0.4 1.68E-07 Flash fire over plant area
0.3 7.20E-08 Vapour Cloud Explosion
0.04 2.40E-08 Flash fire full extent
2.16E-07 Unignited release
Note *: The escalation effect probability is estimated based on the location of release scenario and target equipment, as well as the associated consequence impact distance and duration.
As such, the escalation probability for each hazardous scenario regardless different hole size and location are assumed as 1/6, and it is only applied if separation distance between release scenario and target equipment is
within the associated consequence impact distance.

Hazardous Section GRS_07
Release
Frequency
(per year)
Detection &
Shutdown
Failure
Immediate
Ignition
Escalation Delayed
Ignition (1)
Explosion
Probability
Delayed
Ignition (2)
Event Outcome Frequency Event Outcome
Release as 10 mm hole size 4.50E-06 1.00 0.02 * Escalation effect (Fireball)
9.00E-08 Jet fire
0.09 3.89E-07 Flash fire over plant area
0.04 1.62E-08 Vapour Cloud Explosion
0.01 4.50E-08 Flash fire full extent
3.87E-06 Unignited release
Release
Frequency
(per year)
Detection &
Shutdown
Failure
Immediate
Ignition
Escalation Delayed
Ignition (1)
Explosion
Probability
Delayed
Ignition (2)
Event Outcome Frequency Event Outcome
Release as 25 mm hole size 4.50E-06 1.00 0.02 * Escalation effect (Fireball)
9.00E-08 Jet fire
0.09 3.56E-07 Flash fire over plant area
0.12 4.86E-08 Vapour Cloud Explosion
0.01 4.50E-08 Flash fire full extent
3.87E-06 Unignited release
Release
Frequency
(per year)
Detection &
Shutdown
Failure
Immediate
Ignition
Escalation Delayed
Ignition (1)
Explosion
Probability
Delayed
Ignition (2)
Event Outcome Frequency Event Outcome
Release as 50 mm hole size 3.15E-06 1.00 0.02 * Escalation effect (Fireball)
6.30E-08 Jet fire
0.09 2.49E-07 Flash fire over plant area
0.12 3.40E-08 Vapour Cloud Explosion
0.01 3.15E-08 Flash fire full extent
2.71E-06 Unignited release
Release
Frequency
(per year)
Detection &
Shutdown
Failure
Immediate
Ignition
Escalation Delayed
Ignition (1)
Explosion
Probability
Delayed
Ignition (2)
Event Outcome Frequency Event Outcome
Release as 100 mm hole size 3.15E-06 1.00 0.02 * Escalation effect (Fireball)
6.30E-08 Jet fire
0.09 2.49E-07 Flash fire over plant area
0.12 3.40E-08 Vapour Cloud Explosion
0.01 3.15E-08 Flash fire full extent
2.71E-06 Unignited release
Release
Frequency
(per year)
Detection &
Shutdown
Failure
Immediate
Ignition
Escalation Delayed
Ignition (1)
Explosion
Probability
Delayed
Ignition (2)
Event Outcome Frequency Event Outcome
Release as Line Rupture 1.35E-06 1.00 0.02 * Escalation effect (Fireball)
1.35E-07 Fireball
0.4 3.78E-07 Flash fire over plant area
0.3 1.62E-07 Vapour Cloud Explosion
0.04 5.40E-08 Flash fire full extent
4.86E-07 Unignited release
Note *: The escalation effect probability is estimated based on the location of release scenario and target equipment, as well as the associated consequence impact distance and duration.
As such, the escalation probability for each hazardous scenario regardless different hole size and location are assumed as 1/6, and it is only applied if separation distance between release scenario and target equipment is
within the associated consequence impact distance.

Hazardous Section GRS_08
Release
Frequency
(per year)
Detection &
Shutdown
Failure
Immediate
Ignition
Escalation Delayed
Ignition (1)
Explosion
Probability
Delayed
Ignition (2)
Event Outcome Frequency Event Outcome
Release as 10 mm hole size 8.71E-07 1.00 0.02 * Escalation effect (Fireball)
1.74E-08 Jet fire
0.09 6.90E-08 Flash fire over plant area
0.12 9.41E-09 Vapour Cloud Explosion
0.01 8.71E-09 Flash fire full extent
7.49E-07 Unignited release
Release
Frequency
(per year)
Detection &
Shutdown
Failure
Immediate
Ignition
Escalation Delayed
Ignition (1)
Explosion
Probability
Delayed
Ignition (2)
Event Outcome Frequency Event Outcome
Release as 25 mm hole size 8.71E-07 1.00 0.02 * Escalation effect (Fireball)
1.74E-08 Jet fire
0.09 6.90E-08 Flash fire over plant area
0.12 9.41E-09 Vapour Cloud Explosion
0.01 8.71E-09 Flash fire full extent
7.49E-07 Unignited release
Release
Frequency
(per year)
Detection &
Shutdown
Failure
Immediate
Ignition
Escalation Delayed
Ignition (1)
Explosion
Probability
Delayed
Ignition (2)
Event Outcome Frequency Event Outcome
Release as 50 mm hole size 6.10E-07 1.00 0.10 * Escalation effect (Fireball)
6.10E-08 Jet fire
0.4 1.71E-07 Flash fire over plant area
0.3 7.32E-08 Vapour Cloud Explosion
0.04 2.44E-08 Flash fire full extent
2.19E-07 Unignited release
Release
Frequency
(per year)
Detection &
Shutdown
Failure
Immediate
Ignition
Escalation Delayed
Ignition (1)
Explosion
Probability
Delayed
Ignition (2)
Event Outcome Frequency Event Outcome
Release as 100 mm hole size 6.10E-07 1.00 0.10 * Escalation effect (Fireball)
6.10E-08 Jet fire
0.4 1.71E-07 Flash fire over plant area
0.3 7.32E-08 Vapour Cloud Explosion
0.04 2.44E-08 Flash fire full extent
2.19E-07 Unignited release
Release
Frequency
(per year)
Detection &
Shutdown
Failure
Immediate
Ignition
Escalation Delayed
Ignition (1)
Explosion
Probability
Delayed
Ignition (2)
Event Outcome Frequency Event Outcome
Release as Line Rupture 2.61E-07 1.00 0.10 * Escalation effect (Fireball)
2.61E-08 Fireball
0.4 7.32E-08 Flash fire over plant area
0.3 3.14E-08 Vapour Cloud Explosion
0.04 1.05E-08 Flash fire full extent
9.41E-08 Unignited release
Note *: The escalation effect probability is estimated based on the location of release scenario and target equipment, as well as the associated consequence impact distance and duration.
As such, the escalation probability for each hazardous scenario regardless different hole size and location are assumed as 1/6, and it is only applied if separation distance between release scenario and target equipment is
within the associated consequence impact distance.

Hazardous Section GRS_11
Release
Frequency
(per year)
Detection &
Shutdown
Failure
Immediate
Ignition
Escalation Delayed
Ignition (1)
Explosion
Probability
Delayed
Ignition (2)
Event Outcome Frequency Event Outcome
Release as 10 mm hole size 7.00E-06 1.00 0.02 * Escalation effect (Fireball)
1.40E-07 Jet fire
0.09 6.05E-07 Flash fire over plant area
0.01 2.52E-08 Vapour Cloud Explosion
0.04 7.00E-08 Flash fire full extent
6.02E-06 Unignited release
Release
Frequency
(per year)
Detection &
Shutdown
Failure
Immediate
Ignition
Escalation Delayed
Ignition (1)
Explosion
Probability
Delayed
Ignition (2)
Event Outcome Frequency Event Outcome
Release as 25 mm hole size 7.00E-06 1.00 0.02 * Escalation effect (Fireball)
1.40E-07 Jet fire
0.09 5.54E-07 Flash fire over plant area
0.01 7.56E-08 Vapour Cloud Explosion
0.12 7.00E-08 Flash fire full extent
6.02E-06 Unignited release
Release
Frequency
(per year)
Detection &
Shutdown
Failure
Immediate
Ignition
Escalation Delayed
Ignition (1)
Explosion
Probability
Delayed
Ignition (2)
Event Outcome Frequency Event Outcome
Release as 50 mm hole size 4.90E-06 1.00 0.02 * Escalation effect (Fireball)
9.80E-08 Jet fire
0.09 3.88E-07 Flash fire over plant area
0.01 5.29E-08 Vapour Cloud Explosion
0.12 4.90E-08 Flash fire full extent
4.21E-06 Unignited release
Release
Frequency
(per year)
Detection &
Shutdown
Failure
Immediate
Ignition
Escalation Delayed
Ignition (1)
Explosion
Probability
Delayed
Ignition (2)
Event Outcome Frequency Event Outcome
Release as 100 mm hole size 4.90E-06 1.00 0.10 * Escalation effect (Fireball)
4.90E-07 Jet fire
0.4 1.37E-06 Flash fire over plant area
0.04 5.88E-07 Vapour Cloud Explosion
0.3 1.96E-07 Flash fire full extent
1.76E-06 Unignited release
Release
Frequency
(per year)
Detection &
Shutdown
Failure
Immediate
Ignition
Escalation Delayed
Ignition (1)
Explosion
Probability
Delayed
Ignition (2)
Event Outcome Frequency Event Outcome
Release as Line Rupture 2.10E-06 1.00 0.10 * Escalation effect (Fireball)
2.10E-07 Fireball
0.4 5.88E-07 Flash fire over plant area
0.04 2.52E-07 Vapour Cloud Explosion
0.3 8.40E-08 Flash fire full extent
7.56E-07 Unignited release
Note *: The escalation effect probability is estimated based on the location of release scenario and target equipment, as well as the associated consequence impact distance and duration.
As such, the escalation probability for each hazardous scenario regardless different hole size and location are assumed as 1/6, and it is only applied if separation distance between release scenario and target equipment is
within the associated consequence impact distance.

Hazardous Section GRS_12
Release
Frequency
(per year)
Detection &
Shutdown
Failure
Immediate
Ignition
Escalation Delayed
Ignition (1)
Explosion
Probability
Delayed
Ignition (2)
Event Outcome Frequency Event Outcome
Release as 10 mm hole size 9.50E-06 1.00 0.02 * Escalation effect (Fireball)
1.90E-07 Jet fire
0.09 8.21E-07 Flash fire over plant area
0.04 3.42E-08 Vapour Cloud Explosion
0.01 9.50E-08 Flash fire full extent
8.17E-06 Unignited release
Release
Frequency
(per year)
Detection &
Shutdown
Failure
Immediate
Ignition
Escalation Delayed
Ignition (1)
Explosion
Probability
Delayed
Ignition (2)
Event Outcome Frequency Event Outcome
Release as 25 mm hole size 9.50E-06 1.00 0.02 * Escalation effect (Fireball)
1.90E-07 Jet fire
0.09 7.52E-07 Flash fire over plant area
0.12 1.03E-07 Vapour Cloud Explosion
0.01 9.50E-08 Flash fire full extent
8.17E-06 Unignited release
Release
Frequency
(per year)
Detection &
Shutdown
Failure
Immediate
Ignition
Escalation Delayed
Ignition (1)
Explosion
Probability
Delayed
Ignition (2)
Event Outcome Frequency Event Outcome
Release as 50 mm hole size 6.65E-06 1.00 0.02 * Escalation effect (Fireball)
1.33E-07 Jet fire
0.09 5.27E-07 Flash fire over plant area
0.12 7.18E-08 Vapour Cloud Explosion
0.01 6.65E-08 Flash fire full extent
5.72E-06 Unignited release
Release
Frequency
(per year)
Detection &
Shutdown
Failure
Immediate
Ignition
Escalation Delayed
Ignition (1)
Explosion
Probability
Delayed
Ignition (2)
Event Outcome Frequency Event Outcome
Release as 100 mm hole size 6.65E-06 1.00 0.10 * Escalation effect (Fireball)
6.65E-07 Jet fire
0.4 1.86E-06 Flash fire over plant area
0.3 7.98E-07 Vapour Cloud Explosion
0.04 2.66E-07 Flash fire full extent
2.39E-06 Unignited release
Release
Frequency
(per year)
Detection &
Shutdown
Failure
Immediate
Ignition
Escalation Delayed
Ignition (1)
Explosion
Probability
Delayed
Ignition (2)
Event Outcome Frequency Event Outcome
Release as Line Rupture 2.85E-06 1.00 0.10 * Escalation effect (Fireball)
2.85E-07 Fireball
0.4 7.98E-07 Flash fire over plant area
0.3 3.42E-07 Vapour Cloud Explosion
0.04 1.14E-07 Flash fire full extent
1.03E-06 Unignited release
Note *: The escalation effect probability is estimated based on the location of release scenario and target equipment, as well as the associated consequence impact distance and duration.
As such, the escalation probability for each hazardous scenario regardless different hole size and location are assumed as 1/6, and it is only applied if separation distance between release scenario and target equipment is
within the associated consequence impact distance.

Hazardous Section GRS_13
Release
Frequency
(per year)
Detection &
Shutdown
Failure
Immediate
Ignition
Escalation Delayed
Ignition (1)
Explosion
Probability
Delayed
Ignition (2)
Event Outcome Frequency Event Outcome
Release as 10 mm hole size 4.50E-06 1.00 0.02 * Escalation effect (Fireball)
9.00E-08 Jet fire
0.09 3.89E-07 Flash fire over plant area
0.04 1.62E-08 Vapour Cloud Explosion
0.01 4.50E-08 Flash fire full extent
3.87E-06 Unignited release
Release
Frequency
(per year)
Detection &
Shutdown
Failure
Immediate
Ignition
Escalation Delayed
Ignition (1)
Explosion
Probability
Delayed
Ignition (2)
Event Outcome Frequency Event Outcome
Release as 25 mm hole size 4.50E-06 1.00 0.02 * Escalation effect (Fireball)
9.00E-08 Jet fire
0.09 3.56E-07 Flash fire over plant area
0.12 4.86E-08 Vapour Cloud Explosion
0.01 4.50E-08 Flash fire full extent
3.87E-06 Unignited release
Release
Frequency
(per year)
Detection &
Shutdown
Failure
Immediate
Ignition
Escalation Delayed
Ignition (1)
Explosion
Probability
Delayed
Ignition (2)
Event Outcome Frequency Event Outcome
Release as 50 mm hole size 1.50E-06 1.00 0.02 * Escalation effect (Fireball)
3.00E-08 Jet fire
0.09 1.19E-07 Flash fire over plant area
0.12 1.62E-08 Vapour Cloud Explosion
0.01 1.50E-08 Flash fire full extent
1.29E-06 Unignited release
Release
Frequency
(per year)
Detection &
Shutdown
Failure
Immediate
Ignition
Escalation Delayed
Ignition (1)
Explosion
Probability
Delayed
Ignition (2)
Event Outcome Frequency Event Outcome
Release as 100 mm hole size 1.50E-06 1.00 0.10 * Escalation effect (Fireball)
1.50E-07 Jet fire
0.4 4.20E-07 Flash fire over plant area
0.3 1.80E-07 Vapour Cloud Explosion
0.04 6.00E-08 Flash fire full extent
5.40E-07 Unignited release
Release
Frequency
(per year)
Detection &
Shutdown
Failure
Immediate
Ignition
Escalation Delayed
Ignition (1)
Explosion
Probability
Delayed
Ignition (2)
Event Outcome Frequency Event Outcome
Release as Line Rupture 7.50E-07 1.00 0.10 * Escalation effect (Fireball)
7.50E-08 Fireball
0.4 2.10E-07 Flash fire over plant area
0.3 9.00E-08 Vapour Cloud Explosion
0.04 3.00E-08 Flash fire full extent
2.70E-07 Unignited release
Note *: The escalation effect probability is estimated based on the location of release scenario and target equipment, as well as the associated consequence impact distance and duration.
As such, the escalation probability for each hazardous scenario regardless different hole size and location are assumed as 1/6, and it is only applied if separation distance between release scenario and target equipment is
within the associated consequence impact distance.

Hazardous Section GRS_14
Release
Frequency
(per year)
Detection &
Shutdown
Failure
Immediate
Ignition
Escalation Delayed
Ignition (1)
Explosion
Probability
Delayed
Ignition (2)
Event Outcome Frequency Event Outcome
Release as 10 mm hole size 4.50E-06 1.00 0.02 * Escalation effect (Fireball)
9.00E-08 Jet fire
0.09 3.89E-07 Flash fire over plant area
0.04 1.62E-08 Vapour Cloud Explosion
0.01 4.50E-08 Flash fire full extent
3.87E-06 Unignited release
Release
Frequency
(per year)
Detection &
Shutdown
Failure
Immediate
Ignition
Escalation Delayed
Ignition (1)
Explosion
Probability
Delayed
Ignition (2)
Event Outcome Frequency Event Outcome
Release as 25 mm hole size 4.50E-06 1.00 0.02 * Escalation effect (Fireball)
9.00E-08 Jet fire
0.09 3.56E-07 Flash fire over plant area
0.12 4.86E-08 Vapour Cloud Explosion
0.01 4.50E-08 Flash fire full extent
3.87E-06 Unignited release
Release
Frequency
(per year)
Detection &
Shutdown
Failure
Immediate
Ignition
Escalation Delayed
Ignition (1)
Explosion
Probability
Delayed
Ignition (2)
Event Outcome Frequency Event Outcome
Release as 50 mm hole size 3.15E-06 1.00 0.02 * Escalation effect (Fireball)
6.30E-08 Jet fire
0.09 2.49E-07 Flash fire over plant area
0.12 3.40E-08 Vapour Cloud Explosion
0.01 3.15E-08 Flash fire full extent
2.71E-06 Unignited release
Release
Frequency
(per year)
Detection &
Shutdown
Failure
Immediate
Ignition
Escalation Delayed
Ignition (1)
Explosion
Probability
Delayed
Ignition (2)
Event Outcome Frequency Event Outcome
Release as 100 mm hole size 3.15E-06 1.00 0.10 * Escalation effect (Fireball)
3.15E-07 Jet fire
0.4 8.82E-07 Flash fire over plant area
0.3 3.78E-07 Vapour Cloud Explosion
0.04 1.26E-07 Flash fire full extent
1.13E-06 Unignited release
Release
Frequency
(per year)
Detection &
Shutdown
Failure
Immediate
Ignition
Escalation Delayed
Ignition (1)
Explosion
Probability
Delayed
Ignition (2)
Event Outcome Frequency Event Outcome
Release as Line Rupture 1.35E-06 1.00 0.10 * Escalation effect (Fireball)
1.35E-07 Fireball
0.4 3.78E-07 Flash fire over plant area
0.3 1.62E-07 Vapour Cloud Explosion
0.04 5.40E-08 Flash fire full extent
4.86E-07 Unignited release
Note *: The escalation effect probability is estimated based on the location of release scenario and target equipment, as well as the associated consequence impact distance and duration.
As such, the escalation probability for each hazardous scenario regardless different hole size and location are assumed as 1/6, and it is only applied if separation distance between release scenario and target equipment is
within the associated consequence impact distance.

Hazardous Section GRS_15
Release
Frequency
(per year)
Detection &
Shutdown
Failure
Immediate
Ignition
Escalation Delayed
Ignition (1)
Explosion
Probability
Delayed
Ignition (2)
Event Outcome Frequency Event Outcome
Release as 10 mm hole size 8.00E-06 1.00 0.02 * Escalation effect (Fireball)
1.60E-07 Jet fire
0.09 6.91E-07 Flash fire over plant area
0.04 2.88E-08 Vapour Cloud Explosion
0.01 8.00E-08 Flash fire full extent
6.88E-06 Unignited release
Release
Frequency
(per year)
Detection &
Shutdown
Failure
Immediate
Ignition
Escalation Delayed
Ignition (1)
Explosion
Probability
Delayed
Ignition (2)
Event Outcome Frequency Event Outcome
Release as 25 mm hole size 8.00E-06 1.00 0.02 * Escalation effect (Fireball)
1.60E-07 Jet fire
0.09 6.34E-07 Flash fire over plant area
0.12 8.64E-08 Vapour Cloud Explosion
0.01 8.00E-08 Flash fire full extent
6.88E-06 Unignited release
Release
Frequency
(per year)
Detection &
Shutdown
Failure
Immediate
Ignition
Escalation Delayed
Ignition (1)
Explosion
Probability
Delayed
Ignition (2)
Event Outcome Frequency Event Outcome
Release as 50 mm hole size 5.60E-06 1.00 0.02 * Escalation effect (Fireball)
1.12E-07 Jet fire
0.09 4.44E-07 Flash fire over plant area
0.12 6.05E-08 Vapour Cloud Explosion
0.01 5.60E-08 Flash fire full extent
4.82E-06 Unignited release
Release
Frequency
(per year)
Detection &
Shutdown
Failure
Immediate
Ignition
Escalation Delayed
Ignition (1)
Explosion
Probability
Delayed
Ignition (2)
Event Outcome Frequency Event Outcome
Release as 100 mm hole size 5.60E-06 1.00 0.10 * Escalation effect (Fireball)
5.60E-07 Jet fire
0.4 1.57E-06 Flash fire over plant area
0.3 6.72E-07 Vapour Cloud Explosion
0.04 2.24E-07 Flash fire full extent
2.02E-06 Unignited release
Release
Frequency
(per year)
Detection &
Shutdown
Failure
Immediate
Ignition
Escalation Delayed
Ignition (1)
Explosion
Probability
Delayed
Ignition (2)
Event Outcome Frequency Event Outcome
Release as Line Rupture 2.40E-06 1.00 0.10 * Escalation effect (Fireball)
2.40E-07 Fireball
0.4 6.72E-07 Flash fire over plant area
0.3 2.88E-07 Vapour Cloud Explosion
0.04 9.60E-08 Flash fire full extent
8.64E-07 Unignited release
Note *: The escalation effect probability is estimated based on the location of release scenario and target equipment, as well as the associated consequence impact distance and duration.
As such, the escalation probability for each hazardous scenario regardless different hole size and location are assumed as 1/6, and it is only applied if separation distance between release scenario and target equipment is
within the associated consequence impact distance.
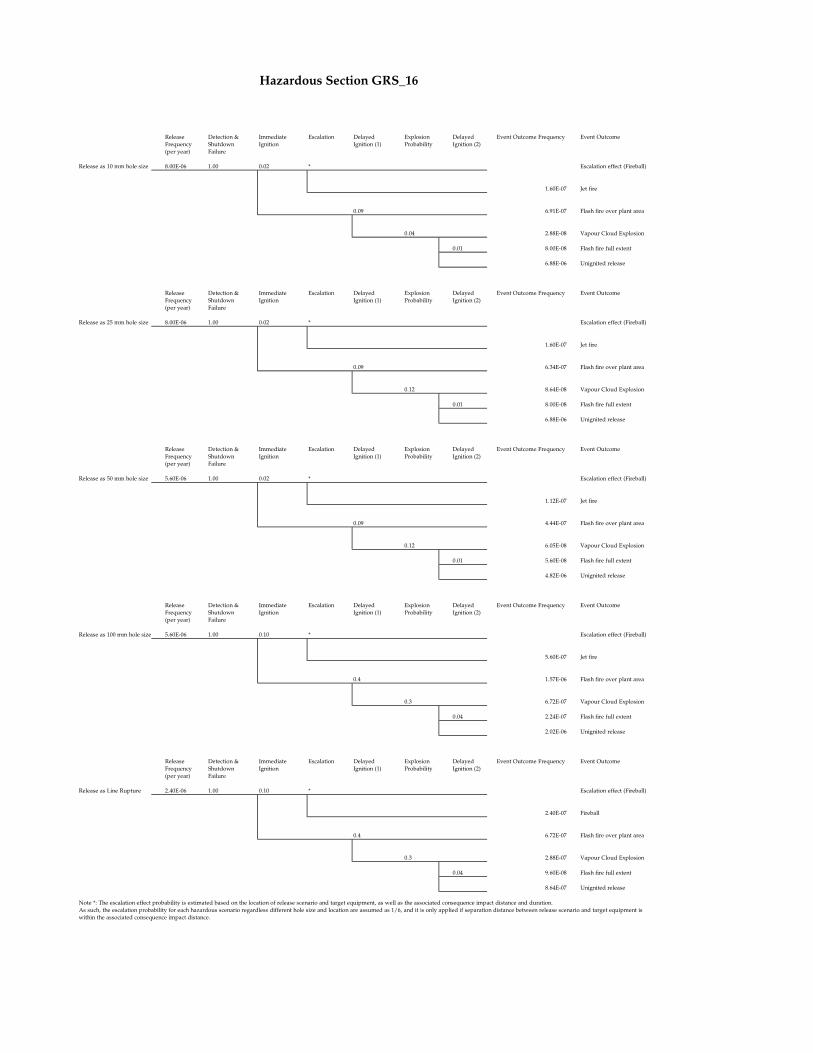
Hazardous Section GRS_16
Release
Frequency
(per year)
Detection &
Shutdown
Failure
Immediate
Ignition
Escalation Delayed
Ignition (1)
Explosion
Probability
Delayed
Ignition (2)
Event Outcome Frequency Event Outcome
Release as 10 mm hole size 8.00E-06 1.00 0.02 * Escalation effect (Fireball)
1.60E-07 Jet fire
0.09 6.91E-07 Flash fire over plant area
0.04 2.88E-08 Vapour Cloud Explosion
0.01 8.00E-08 Flash fire full extent
6.88E-06 Unignited release
Release
Frequency
(per year)
Detection &
Shutdown
Failure
Immediate
Ignition
Escalation Delayed
Ignition (1)
Explosion
Probability
Delayed
Ignition (2)
Event Outcome Frequency Event Outcome
Release as 25 mm hole size 8.00E-06 1.00 0.02 * Escalation effect (Fireball)
1.60E-07 Jet fire
0.09 6.34E-07 Flash fire over plant area
0.12 8.64E-08 Vapour Cloud Explosion
0.01 8.00E-08 Flash fire full extent
6.88E-06 Unignited release
Release
Frequency
(per year)
Detection &
Shutdown
Failure
Immediate
Ignition
Escalation Delayed
Ignition (1)
Explosion
Probability
Delayed
Ignition (2)
Event Outcome Frequency Event Outcome
Release as 50 mm hole size 5.60E-06 1.00 0.02 * Escalation effect (Fireball)
1.12E-07 Jet fire
0.09 4.44E-07 Flash fire over plant area
0.12 6.05E-08 Vapour Cloud Explosion
0.01 5.60E-08 Flash fire full extent
4.82E-06 Unignited release
Release
Frequency
(per year)
Detection &
Shutdown
Failure
Immediate
Ignition
Escalation Delayed
Ignition (1)
Explosion
Probability
Delayed
Ignition (2)
Event Outcome Frequency Event Outcome
Release as 100 mm hole size 5.60E-06 1.00 0.10 * Escalation effect (Fireball)
5.60E-07 Jet fire
0.4 1.57E-06 Flash fire over plant area
0.3 6.72E-07 Vapour Cloud Explosion
0.04 2.24E-07 Flash fire full extent
2.02E-06 Unignited release
Release
Frequency
(per year)
Detection &
Shutdown
Failure
Immediate
Ignition
Escalation Delayed
Ignition (1)
Explosion
Probability
Delayed
Ignition (2)
Event Outcome Frequency Event Outcome
Release as Line Rupture 2.40E-06 1.00 0.10 * Escalation effect (Fireball)
2.40E-07 Fireball
0.4 6.72E-07 Flash fire over plant area
0.3 2.88E-07 Vapour Cloud Explosion
0.04 9.60E-08 Flash fire full extent
8.64E-07 Unignited release
Note *: The escalation effect probability is estimated based on the location of release scenario and target equipment, as well as the associated consequence impact distance and duration.
As such, the escalation probability for each hazardous scenario regardless different hole size and location are assumed as 1/6, and it is only applied if separation distance between release scenario and target equipment is
within the associated consequence impact distance.

Hazardous Section GRS_17
Release
Frequency
(per year)
Detection &
Shutdown
Failure
Immediate
Ignition
Escalation Delayed
Ignition (1)
Explosion
Probability
Delayed
Ignition (2)
Event Outcome Frequency Event Outcome
Release as 10 mm hole size 3.50E-06 1.00 0.02 * Escalation effect (Fireball)
7.00E-08 Jet fire
0.09 3.02E-07 Flash fire over plant area
0.04 1.26E-08 Vapour Cloud Explosion
0.01 3.50E-08 Flash fire full extent
3.01E-06 Unignited release
Release
Frequency
(per year)
Detection &
Shutdown
Failure
Immediate
Ignition
Escalation Delayed
Ignition (1)
Explosion
Probability
Delayed
Ignition (2)
Event Outcome Frequency Event Outcome
Release as 25 mm hole size 3.50E-06 1.00 0.02 * Escalation effect (Fireball)
7.00E-08 Jet fire
0.09 2.77E-07 Flash fire over plant area
0.12 3.78E-08 Vapour Cloud Explosion
0.01 3.50E-08 Flash fire full extent
3.01E-06 Unignited release
Release
Frequency
(per year)
Detection &
Shutdown
Failure
Immediate
Ignition
Escalation Delayed
Ignition (1)
Explosion
Probability
Delayed
Ignition (2)
Event Outcome Frequency Event Outcome
Release as 50 mm hole size 2.45E-06 1.00 0.02 * Escalation effect (Fireball)
4.90E-08 Jet fire
0.09 1.94E-07 Flash fire over plant area
0.12 2.65E-08 Vapour Cloud Explosion
0.01 2.45E-08 Flash fire full extent
2.11E-06 Unignited release
Release
Frequency
(per year)
Detection &
Shutdown
Failure
Immediate
Ignition
Escalation Delayed
Ignition (1)
Explosion
Probability
Delayed
Ignition (2)
Event Outcome Frequency Event Outcome
Release as 100 mm hole size 2.45E-06 1.00 0.10 * Escalation effect (Fireball)
2.45E-07 Jet fire
0.4 6.86E-07 Flash fire over plant area
0.3 2.94E-07 Vapour Cloud Explosion
0.04 9.80E-08 Flash fire full extent
8.82E-07 Unignited release
Release
Frequency
(per year)
Detection &
Shutdown
Failure
Immediate
Ignition
Escalation Delayed
Ignition (1)
Explosion
Probability
Delayed
Ignition (2)
Event Outcome Frequency Event Outcome
Release as Line Rupture 1.05E-06 1.00 0.10 * Escalation effect (Fireball)
1.05E-07 Fireball
0.4 2.94E-07 Flash fire over plant area
0.3 1.26E-07 Vapour Cloud Explosion
0.04 4.20E-08 Flash fire full extent
3.78E-07 Unignited release
Note *: The escalation effect probability is estimated based on the location of release scenario and target equipment, as well as the associated consequence impact distance and duration.
As such, the escalation probability for each hazardous scenario regardless different hole size and location are assumed as 1/6, and it is only applied if separation distance between release scenario and target equipment is
within the associated consequence impact distance.
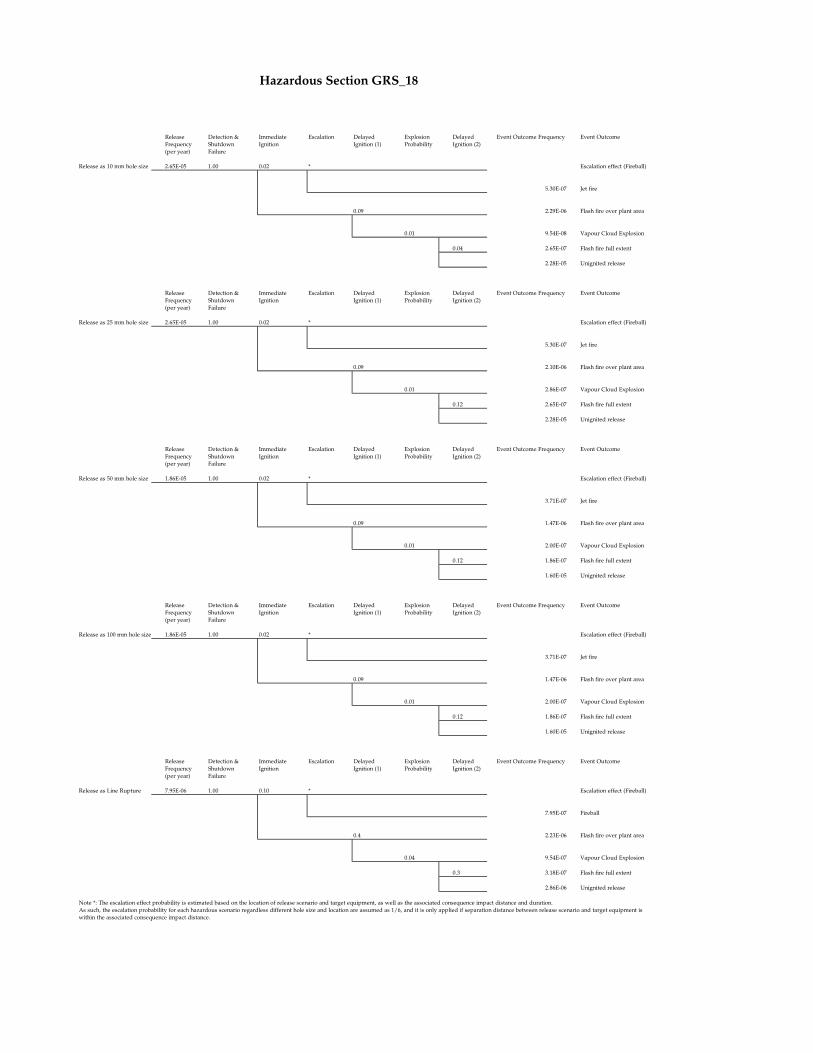
Hazardous Section GRS_18
Release
Frequency
(per year)
Detection &
Shutdown
Failure
Immediate
Ignition
Escalation Delayed
Ignition (1)
Explosion
Probability
Delayed
Ignition (2)
Event Outcome Frequency Event Outcome
Release as 10 mm hole size 2.65E-05 1.00 0.02 * Escalation effect (Fireball)
5.30E-07 Jet fire
0.09 2.29E-06 Flash fire over plant area
0.01 9.54E-08 Vapour Cloud Explosion
0.04 2.65E-07 Flash fire full extent
2.28E-05 Unignited release
Release
Frequency
(per year)
Detection &
Shutdown
Failure
Immediate
Ignition
Escalation Delayed
Ignition (1)
Explosion
Probability
Delayed
Ignition (2)
Event Outcome Frequency Event Outcome
Release as 25 mm hole size 2.65E-05 1.00 0.02 * Escalation effect (Fireball)
5.30E-07 Jet fire
0.09 2.10E-06 Flash fire over plant area
0.01 2.86E-07 Vapour Cloud Explosion
0.12 2.65E-07 Flash fire full extent
2.28E-05 Unignited release
Release
Frequency
(per year)
Detection &
Shutdown
Failure
Immediate
Ignition
Escalation Delayed
Ignition (1)
Explosion
Probability
Delayed
Ignition (2)
Event Outcome Frequency Event Outcome
Release as 50 mm hole size 1.86E-05 1.00 0.02 * Escalation effect (Fireball)
3.71E-07 Jet fire
0.09 1.47E-06 Flash fire over plant area
0.01 2.00E-07 Vapour Cloud Explosion
0.12 1.86E-07 Flash fire full extent
1.60E-05 Unignited release
Release
Frequency
(per year)
Detection &
Shutdown
Failure
Immediate
Ignition
Escalation Delayed
Ignition (1)
Explosion
Probability
Delayed
Ignition (2)
Event Outcome Frequency Event Outcome
Release as 100 mm hole size 1.86E-05 1.00 0.02 * Escalation effect (Fireball)
3.71E-07 Jet fire
0.09 1.47E-06 Flash fire over plant area
0.01 2.00E-07 Vapour Cloud Explosion
0.12 1.86E-07 Flash fire full extent
1.60E-05 Unignited release
Release
Frequency
(per year)
Detection &
Shutdown
Failure
Immediate
Ignition
Escalation Delayed
Ignition (1)
Explosion
Probability
Delayed
Ignition (2)
Event Outcome Frequency Event Outcome
Release as Line Rupture 7.95E-06 1.00 0.10 * Escalation effect (Fireball)
7.95E-07 Fireball
0.4 2.23E-06 Flash fire over plant area
0.04 9.54E-07 Vapour Cloud Explosion
0.3 3.18E-07 Flash fire full extent
2.86E-06 Unignited release
Note *: The escalation effect probability is estimated based on the location of release scenario and target equipment, as well as the associated consequence impact distance and duration.
As such, the escalation probability for each hazardous scenario regardless different hole size and location are assumed as 1/6, and it is only applied if separation distance between release scenario and target equipment is
within the associated consequence impact distance.

Hazardous Section GRS_19
Release
Frequency
(per year)
Detection &
Shutdown
Failure
Immediate
Ignition
Escalation Delayed
Ignition (1)
Explosion
Probability
Delayed
Ignition (2)
Event Outcome Frequency Event Outcome
Release as 10 mm hole size 8.71E-07 1.00 0.02 * Escalation effect (Fireball)
1.74E-08 Jet fire
0.09 7.53E-08 Flash fire over plant area
0.04 3.14E-09 Vapour Cloud Explosion
0.01 8.71E-09 Flash fire full extent
7.49E-07 Unignited release
Release
Frequency
(per year)
Detection &
Shutdown
Failure
Immediate
Ignition
Escalation Delayed
Ignition (1)
Explosion
Probability
Delayed
Ignition (2)
Event Outcome Frequency Event Outcome
Release as 25 mm hole size 8.71E-07 1.00 0.02 * Escalation effect (Fireball)
1.74E-08 Jet fire
0.09 6.90E-08 Flash fire over plant area
0.12 9.41E-09 Vapour Cloud Explosion
0.01 8.71E-09 Flash fire full extent
7.49E-07 Unignited release
Release
Frequency
(per year)
Detection &
Shutdown
Failure
Immediate
Ignition
Escalation Delayed
Ignition (1)
Explosion
Probability
Delayed
Ignition (2)
Event Outcome Frequency Event Outcome
Release as 50 mm hole size 6.10E-07 1.00 0.02 * Escalation effect (Fireball)
1.22E-08 Jet fire
0.09 4.83E-08 Flash fire over plant area
0.12 6.58E-09 Vapour Cloud Explosion
0.01 6.10E-09 Flash fire full extent
5.24E-07 Unignited release
Release
Frequency
(per year)
Detection &
Shutdown
Failure
Immediate
Ignition
Escalation Delayed
Ignition (1)
Explosion
Probability
Delayed
Ignition (2)
Event Outcome Frequency Event Outcome
Release as 100 mm hole size 6.10E-07 1.00 0.10 * Escalation effect (Fireball)
6.10E-08 Jet fire
0.4 1.71E-07 Flash fire over plant area
0.3 7.32E-08 Vapour Cloud Explosion
0.04 2.44E-08 Flash fire full extent
2.19E-07 Unignited release
Release
Frequency
(per year)
Detection &
Shutdown
Failure
Immediate
Ignition
Escalation Delayed
Ignition (1)
Explosion
Probability
Delayed
Ignition (2)
Event Outcome Frequency Event Outcome
Release as Line Rupture 2.61E-07 1.00 0.10 * Escalation effect (Fireball)
2.61E-08 Fireball
0.4 7.32E-08 Flash fire over plant area
0.3 3.14E-08 Vapour Cloud Explosion
0.04 1.05E-08 Flash fire full extent
9.41E-08 Unignited release
Note *: The escalation effect probability is estimated based on the location of release scenario and target equipment, as well as the associated consequence impact distance and duration.
As such, the escalation probability for each hazardous scenario regardless different hole size and location are assumed as 1/6, and it is only applied if separation distance between release scenario and target equipment is
within the associated consequence impact distance.

Annex 5F-3
Full List of Event Tree
Analysis for GRS facilities at
the LPS

Hazardous Section NGRS_01
Release
Frequency
(per year)
Detection &
Shutdown
Failure
Immediate
Ignition
Escalation Delayed
Ignition (1)
Explosion
Probability
Delayed
Ignition (2)
Event Outcome Frequency Event Outcome
Release as 10 mm hole size 1.50E-05 1.00 0.02 * Escalation effect (Fireball)
3.00E-07 Jet fire
0.09 1.19E-06 Flash fire over plant area
0.12 1.62E-07 Vapour Cloud Explosion
0.01 1.50E-07 Flash fire full extent
1.29E-05 Unignited release
Release
Frequency
(per year)
Detection &
Shutdown
Failure
Immediate
Ignition
Escalation Delayed
Ignition (1)
Explosion
Probability
Delayed
Ignition (2)
Event Outcome Frequency Event Outcome
Release as 25 mm hole size 1.50E-05 1.00 0.02 * Escalation effect (Fireball)
3.00E-07 Jet fire
0.09 1.19E-06 Flash fire over plant area
0.12 1.62E-07 Vapour Cloud Explosion
0.01 1.50E-07 Flash fire full extent
1.29E-05 Unignited release
Release
Frequency
(per year)
Detection &
Shutdown
Failure
Immediate
Ignition
Escalation Delayed
Ignition (1)
Explosion
Probability
Delayed
Ignition (2)
Event Outcome Frequency Event Outcome
Release as 50 mm hole size 5.00E-06 1.00 0.02 * Escalation effect (Fireball)
1.00E-07 Jet fire
0.09 3.96E-07 Flash fire over plant area
0.12 5.40E-08 Vapour Cloud Explosion
0.01 5.00E-08 Flash fire full extent
4.30E-06 Unignited release
Release
Frequency
(per year)
Detection &
Shutdown
Failure
Immediate
Ignition
Escalation Delayed
Ignition (1)
Explosion
Probability
Delayed
Ignition (2)
Event Outcome Frequency Event Outcome
Release as 100 mm hole size 5.00E-06 1.00 0.10 * Escalation effect (Fireball)
5.00E-07 Jet fire
0.4 1.40E-06 Flash fire over plant area
0.3 6.00E-07 Vapour Cloud Explosion
0.04 2.00E-07 Flash fire full extent
1.80E-06 Unignited release
Release
Frequency
(per year)
Detection &
Shutdown
Failure
Immediate
Ignition
Escalation Delayed
Ignition (1)
Explosion
Probability
Delayed
Ignition (2)
Event Outcome Frequency Event Outcome
Release as Line Rupture 2.50E-06 1.00 0.10 * Escalation effect (Fireball)
2.50E-07 Fireball
0.4 7.00E-07 Flash fire over plant area
0.3 3.00E-07 Vapour Cloud Explosion
0.04 1.00E-07 Flash fire full extent
9.00E-07 Unignited release
Note *: The escalation effect probability is estimated based on the location of release scenario and target equipment, as well as the associated consequence impact distance and duration.
As such, the escalation probability for each hazardous scenario regardless different hole size and location are assumed as 1/6, and it is only applied if separation distance between release scenario and target equipment is
within the associated consequence impact distance.

Hazardous Section NGRS_02
Release
Frequency
(per year)
Detection &
Shutdown
Failure
Immediate
Ignition
Escalation Delayed
Ignition (1)
Explosion
Probability
Delayed
Ignition (2)
Event Outcome Frequency Event Outcome
Release as 10 mm hole size 1.50E-05 1.00 0.02 * Escalation effect (Fireball)
3.00E-07 Jet fire
0.09 1.19E-06 Flash fire over plant area
0.01 1.62E-07 Vapour Cloud Explosion
0.12 1.50E-07 Flash fire full extent
1.29E-05 Unignited release
Release
Frequency
(per year)
Detection &
Shutdown
Failure
Immediate
Ignition
Escalation Delayed
Ignition (1)
Explosion
Probability
Delayed
Ignition (2)
Event Outcome Frequency Event Outcome
Release as 25 mm hole size 1.50E-05 1.00 0.02 * Escalation effect (Fireball)
3.00E-07 Jet fire
0.09 1.19E-06 Flash fire over plant area
0.01 1.62E-07 Vapour Cloud Explosion
0.12 1.50E-07 Flash fire full extent
1.29E-05 Unignited release
Release
Frequency
(per year)
Detection &
Shutdown
Failure
Immediate
Ignition
Escalation Delayed
Ignition (1)
Explosion
Probability
Delayed
Ignition (2)
Event Outcome Frequency Event Outcome
Release as 50 mm hole size 5.00E-06 1.00 0.02 * Escalation effect (Fireball)
1.00E-07 Jet fire
0.09 3.96E-07 Flash fire over plant area
0.01 5.40E-08 Vapour Cloud Explosion
0.12 5.00E-08 Flash fire full extent
4.30E-06 Unignited release
Release
Frequency
(per year)
Detection &
Shutdown
Failure
Immediate
Ignition
Escalation Delayed
Ignition (1)
Explosion
Probability
Delayed
Ignition (2)
Event Outcome Frequency Event Outcome
Release as 100 mm hole size 5.00E-06 1.00 0.10 * Escalation effect (Fireball)
5.00E-07 Jet fire
0.4 1.40E-06 Flash fire over plant area
0.04 6.00E-07 Vapour Cloud Explosion
0.3 2.00E-07 Flash fire full extent
1.80E-06 Unignited release
Release
Frequency
(per year)
Detection &
Shutdown
Failure
Immediate
Ignition
Escalation Delayed
Ignition (1)
Explosion
Probability
Delayed
Ignition (2)
Event Outcome Frequency Event Outcome
Release as Line Rupture 2.50E-06 1.00 0.10 * Escalation effect (Fireball)
2.50E-07 Fireball
0.4 7.00E-07 Flash fire over plant area
0.04 3.00E-07 Vapour Cloud Explosion
0.3 1.00E-07 Flash fire full extent
9.00E-07 Unignited release
Note *: The escalation effect probability is estimated based on the location of release scenario and target equipment, as well as the associated consequence impact distance and duration.
As such, the escalation probability for each hazardous scenario regardless different hole size and location are assumed as 1/6, and it is only applied if separation distance between release scenario and target equipment is
within the associated consequence impact distance.

Hazardous Section NGRS_03
Release
Frequency
(per year)
Detection &
Shutdown
Failure
Immediate
Ignition
Escalation Delayed
Ignition (1)
Explosion
Probability
Delayed
Ignition (2)
Event Outcome Frequency Event Outcome
Release as 10 mm hole size 1.50E-05 1.00 0.02 * Escalation effect (Fireball)
3.00E-07 Jet fire
0.09 1.19E-06 Flash fire over plant area
0.12 1.62E-07 Vapour Cloud Explosion
0.01 1.50E-07 Flash fire full extent
1.29E-05 Unignited release
Release
Frequency
(per year)
Detection &
Shutdown
Failure
Immediate
Ignition
Escalation Delayed
Ignition (1)
Explosion
Probability
Delayed
Ignition (2)
Event Outcome Frequency Event Outcome
Release as 25 mm hole size 1.50E-05 1.00 0.02 * Escalation effect (Fireball)
3.00E-07 Jet fire
0.09 1.19E-06 Flash fire over plant area
0.12 1.62E-07 Vapour Cloud Explosion
0.01 1.50E-07 Flash fire full extent
1.29E-05 Unignited release
Release
Frequency
(per year)
Detection &
Shutdown
Failure
Immediate
Ignition
Escalation Delayed
Ignition (1)
Explosion
Probability
Delayed
Ignition (2)
Event Outcome Frequency Event Outcome
Release as 50 mm hole size 5.00E-06 1.00 0.02 * Escalation effect (Fireball)
1.00E-07 Jet fire
0.09 3.96E-07 Flash fire over plant area
0.12 5.40E-08 Vapour Cloud Explosion
0.01 5.00E-08 Flash fire full extent
4.30E-06 Unignited release
Release
Frequency
(per year)
Detection &
Shutdown
Failure
Immediate
Ignition
Escalation Delayed
Ignition (1)
Explosion
Probability
Delayed
Ignition (2)
Event Outcome Frequency Event Outcome
Release as 100 mm hole size 5.00E-06 1.00 0.10 * Escalation effect (Fireball)
5.00E-07 Jet fire
0.4 1.40E-06 Flash fire over plant area
0.3 6.00E-07 Vapour Cloud Explosion
0.04 2.00E-07 Flash fire full extent
1.80E-06 Unignited release
Release
Frequency
(per year)
Detection &
Shutdown
Failure
Immediate
Ignition
Escalation Delayed
Ignition (1)
Explosion
Probability
Delayed
Ignition (2)
Event Outcome Frequency Event Outcome
Release as Line Rupture 2.50E-06 1.00 0.10 * Escalation effect (Fireball)
2.50E-07 Fireball
0.4 7.00E-07 Flash fire over plant area
0.3 3.00E-07 Vapour Cloud Explosion
0.04 1.00E-07 Flash fire full extent
9.00E-07 Unignited release
Note *: The escalation effect probability is estimated based on the location of release scenario and target equipment, as well as the associated consequence impact distance and duration.
As such, the escalation probability for each hazardous scenario regardless different hole size and location are assumed as 1/6, and it is only applied if separation distance between release scenario and target equipment is
within the associated consequence impact distance.

Hazardous Section NGRS_04
Release
Frequency
(per year)
Detection &
Shutdown
Failure
Immediate
Ignition
Escalation Delayed
Ignition (1)
Explosion
Probability
Delayed
Ignition (2)
Event Outcome Frequency Event Outcome
Release as 10 mm hole size 1.50E-05 1.00 0.02 * Escalation effect (Fireball)
3.00E-07 Jet fire
0.09 1.19E-06 Flash fire over plant area
0.12 1.62E-07 Vapour Cloud Explosion
0.01 1.50E-07 Flash fire full extent
1.29E-05 Unignited release
Release
Frequency
(per year)
Detection &
Shutdown
Failure
Immediate
Ignition
Escalation Delayed
Ignition (1)
Explosion
Probability
Delayed
Ignition (2)
Event Outcome Frequency Event Outcome
Release as 25 mm hole size 1.50E-05 1.00 0.02 * Escalation effect (Fireball)
3.00E-07 Jet fire
0.09 1.19E-06 Flash fire over plant area
0.12 1.62E-07 Vapour Cloud Explosion
0.01 1.50E-07 Flash fire full extent
1.29E-05 Unignited release
Release
Frequency
(per year)
Detection &
Shutdown
Failure
Immediate
Ignition
Escalation Delayed
Ignition (1)
Explosion
Probability
Delayed
Ignition (2)
Event Outcome Frequency Event Outcome
Release as 50 mm hole size 5.00E-06 1.00 0.02 * Escalation effect (Fireball)
1.00E-07 Jet fire
0.09 3.96E-07 Flash fire over plant area
0.12 5.40E-08 Vapour Cloud Explosion
0.01 5.00E-08 Flash fire full extent
4.30E-06 Unignited release
Release
Frequency
(per year)
Detection &
Shutdown
Failure
Immediate
Ignition
Escalation Delayed
Ignition (1)
Explosion
Probability
Delayed
Ignition (2)
Event Outcome Frequency Event Outcome
Release as 100 mm hole size 5.00E-06 1.00 0.10 * Escalation effect (Fireball)
5.00E-07 Jet fire
0.4 1.40E-06 Flash fire over plant area
0.3 6.00E-07 Vapour Cloud Explosion
0.04 2.00E-07 Flash fire full extent
1.80E-06 Unignited release
Release
Frequency
(per year)
Detection &
Shutdown
Failure
Immediate
Ignition
Escalation Delayed
Ignition (1)
Explosion
Probability
Delayed
Ignition (2)
Event Outcome Frequency Event Outcome
Release as Line Rupture 2.50E-06 1.00 0.10 * Escalation effect (Fireball)
2.50E-07 Fireball
0.4 7.00E-07 Flash fire over plant area
0.3 3.00E-07 Vapour Cloud Explosion
0.04 1.00E-07 Flash fire full extent
9.00E-07 Unignited release
Note *: The escalation effect probability is estimated based on the location of release scenario and target equipment, as well as the associated consequence impact distance and duration.
As such, the escalation probability for each hazardous scenario regardless different hole size and location are assumed as 1/6, and it is only applied if separation distance between release scenario and target equipment is
within the associated consequence impact distance.

Hazardous Section NGRS_05
Release
Frequency
(per year)
Detection &
Shutdown
Failure
Immediate
Ignition
Escalation Delayed
Ignition (1)
Explosion
Probability
Delayed
Ignition (2)
Event Outcome Frequency Event Outcome
Release as 10 mm hole size 1.50E-05 1.00 0.02 * Escalation effect (Fireball)
3.00E-07 Jet fire
0.09 1.19E-06 Flash fire over plant area
0.12 1.62E-07 Vapour Cloud Explosion
0.01 1.50E-07 Flash fire full extent
1.29E-05 Unignited release
Release
Frequency
(per year)
Detection &
Shutdown
Failure
Immediate
Ignition
Escalation Delayed
Ignition (1)
Explosion
Probability
Delayed
Ignition (2)
Event Outcome Frequency Event Outcome
Release as 25 mm hole size 1.50E-05 1.00 0.02 * Escalation effect (Fireball)
3.00E-07 Jet fire
0.09 1.19E-06 Flash fire over plant area
0.12 1.62E-07 Vapour Cloud Explosion
0.01 1.50E-07 Flash fire full extent
1.29E-05 Unignited release
Release
Frequency
(per year)
Detection &
Shutdown
Failure
Immediate
Ignition
Escalation Delayed
Ignition (1)
Explosion
Probability
Delayed
Ignition (2)
Event Outcome Frequency Event Outcome
Release as 50 mm hole size 5.00E-06 1.00 0.02 * Escalation effect (Fireball)
1.00E-07 Jet fire
0.09 3.96E-07 Flash fire over plant area
0.12 5.40E-08 Vapour Cloud Explosion
0.01 5.00E-08 Flash fire full extent
4.30E-06 Unignited release
Release
Frequency
(per year)
Detection &
Shutdown
Failure
Immediate
Ignition
Escalation Delayed
Ignition (1)
Explosion
Probability
Delayed
Ignition (2)
Event Outcome Frequency Event Outcome
Release as 100 mm hole size 5.00E-06 1.00 0.10 * Escalation effect (Fireball)
5.00E-07 Jet fire
0.4 1.40E-06 Flash fire over plant area
0.3 6.00E-07 Vapour Cloud Explosion
0.04 2.00E-07 Flash fire full extent
1.80E-06 Unignited release
Release
Frequency
(per year)
Detection &
Shutdown
Failure
Immediate
Ignition
Escalation Delayed
Ignition (1)
Explosion
Probability
Delayed
Ignition (2)
Event Outcome Frequency Event Outcome
Release as Line Rupture 2.50E-06 1.00 0.10 * Escalation effect (Fireball)
2.50E-07 Fireball
0.4 7.00E-07 Flash fire over plant area
0.3 3.00E-07 Vapour Cloud Explosion
0.04 1.00E-07 Flash fire full extent
9.00E-07 Unignited release
Note *: The escalation effect probability is estimated based on the location of release scenario and target equipment, as well as the associated consequence impact distance and duration.
As such, the escalation probability for each hazardous scenario regardless different hole size and location are assumed as 1/6, and it is only applied if separation distance between release scenario and target equipment is
within the associated consequence impact distance.

Hazardous Section NGRS_06
Release
Frequency
(per year)
Detection &
Shutdown
Failure
Immediate
Ignition
Escalation Delayed
Ignition (1)
Explosion
Probability
Delayed
Ignition (2)
Event Outcome Frequency Event Outcome
Release as 10 mm hole size 1.50E-05 1.00 0.02 * Escalation effect (Fireball)
3.00E-07 Jet fire
0.09 1.19E-06 Flash fire over plant area
0.12 1.62E-07 Vapour Cloud Explosion
0.01 1.50E-07 Flash fire full extent
1.29E-05 Unignited release
Release
Frequency
(per year)
Detection &
Shutdown
Failure
Immediate
Ignition
Escalation Delayed
Ignition (1)
Explosion
Probability
Delayed
Ignition (2)
Event Outcome Frequency Event Outcome
Release as 25 mm hole size 1.50E-05 1.00 0.02 * Escalation effect (Fireball)
3.00E-07 Jet fire
0.09 1.19E-06 Flash fire over plant area
0.12 1.62E-07 Vapour Cloud Explosion
0.01 1.50E-07 Flash fire full extent
1.29E-05 Unignited release
Release
Frequency
(per year)
Detection &
Shutdown
Failure
Immediate
Ignition
Escalation Delayed
Ignition (1)
Explosion
Probability
Delayed
Ignition (2)
Event Outcome Frequency Event Outcome
Release as 50 mm hole size 5.00E-06 1.00 0.02 * Escalation effect (Fireball)
1.00E-07 Jet fire
0.09 3.96E-07 Flash fire over plant area
0.12 5.40E-08 Vapour Cloud Explosion
0.01 5.00E-08 Flash fire full extent
4.30E-06 Unignited release
Release
Frequency
(per year)
Detection &
Shutdown
Failure
Immediate
Ignition
Escalation Delayed
Ignition (1)
Explosion
Probability
Delayed
Ignition (2)
Event Outcome Frequency Event Outcome
Release as 100 mm hole size 5.00E-06 1.00 0.10 * Escalation effect (Fireball)
5.00E-07 Jet fire
0.4 1.40E-06 Flash fire over plant area
0.3 6.00E-07 Vapour Cloud Explosion
0.04 2.00E-07 Flash fire full extent
1.80E-06 Unignited release
Release
Frequency
(per year)
Detection &
Shutdown
Failure
Immediate
Ignition
Escalation Delayed
Ignition (1)
Explosion
Probability
Delayed
Ignition (2)
Event Outcome Frequency Event Outcome
Release as Line Rupture 2.50E-06 1.00 0.10 * Escalation effect (Fireball)
2.50E-07 Fireball
0.4 7.00E-07 Flash fire over plant area
0.3 3.00E-07 Vapour Cloud Explosion
0.04 1.00E-07 Flash fire full extent
9.00E-07 Unignited release
Note *: The escalation effect probability is estimated based on the location of release scenario and target equipment, as well as the associated consequence impact distance and duration.
As such, the escalation probability for each hazardous scenario regardless different hole size and location are assumed as 1/6, and it is only applied if separation distance between release scenario and target equipment is
within the associated consequence impact distance.

Hazardous Section NGRS_07
Release
Frequency
(per year)
Detection &
Shutdown
Failure
Immediate
Ignition
Escalation Delayed
Ignition (1)
Explosion
Probability
Delayed
Ignition (2)
Event Outcome Frequency Event Outcome
Release as 10 mm hole size 1.50E-05 1.00 0.02 * Escalation effect (Fireball)
3.00E-07 Jet fire
0.09 1.19E-06 Flash fire over plant area
0.12 1.62E-07 Vapour Cloud Explosion
0.01 1.50E-07 Flash fire full extent
1.29E-05 Unignited release
Release
Frequency
(per year)
Detection &
Shutdown
Failure
Immediate
Ignition
Escalation Delayed
Ignition (1)
Explosion
Probability
Delayed
Ignition (2)
Event Outcome Frequency Event Outcome
Release as 25 mm hole size 1.50E-05 1.00 0.02 * Escalation effect (Fireball)
3.00E-07 Jet fire
0.09 1.19E-06 Flash fire over plant area
0.12 1.62E-07 Vapour Cloud Explosion
0.01 1.50E-07 Flash fire full extent
1.29E-05 Unignited release
Release
Frequency
(per year)
Detection &
Shutdown
Failure
Immediate
Ignition
Escalation Delayed
Ignition (1)
Explosion
Probability
Delayed
Ignition (2)
Event Outcome Frequency Event Outcome
Release as 50 mm hole size 5.00E-06 1.00 0.02 * Escalation effect (Fireball)
1.00E-07 Jet fire
0.09 3.96E-07 Flash fire over plant area
0.12 5.40E-08 Vapour Cloud Explosion
0.01 5.00E-08 Flash fire full extent
4.30E-06 Unignited release
Release
Frequency
(per year)
Detection &
Shutdown
Failure
Immediate
Ignition
Escalation Delayed
Ignition (1)
Explosion
Probability
Delayed
Ignition (2)
Event Outcome Frequency Event Outcome
Release as 100 mm hole size 5.00E-06 1.00 0.10 * Escalation effect (Fireball)
5.00E-07 Jet fire
0.4 1.40E-06 Flash fire over plant area
0.3 6.00E-07 Vapour Cloud Explosion
0.04 2.00E-07 Flash fire full extent
1.80E-06 Unignited release
Release
Frequency
(per year)
Detection &
Shutdown
Failure
Immediate
Ignition
Escalation Delayed
Ignition (1)
Explosion
Probability
Delayed
Ignition (2)
Event Outcome Frequency Event Outcome
Release as Line Rupture 2.50E-06 1.00 0.10 * Escalation effect (Fireball)
2.50E-07 Fireball
0.4 7.00E-07 Flash fire over plant area
0.3 3.00E-07 Vapour Cloud Explosion
0.04 1.00E-07 Flash fire full extent
9.00E-07 Unignited release
Note *: The escalation effect probability is estimated based on the location of release scenario and target equipment, as well as the associated consequence impact distance and duration.
As such, the escalation probability for each hazardous scenario regardless different hole size and location are assumed as 1/6, and it is only applied if separation distance between release scenario and target equipment is
within the associated consequence impact distance.
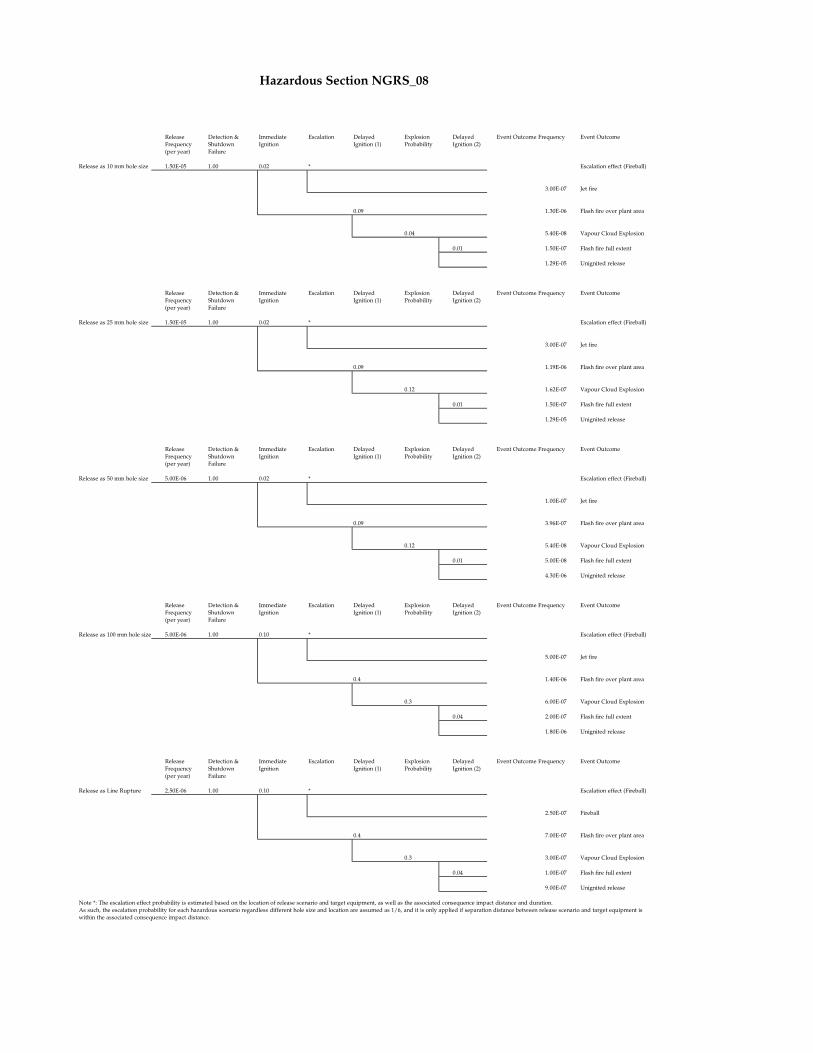
Hazardous Section NGRS_08
Release
Frequency
(per year)
Detection &
Shutdown
Failure
Immediate
Ignition
Escalation Delayed
Ignition (1)
Explosion
Probability
Delayed
Ignition (2)
Event Outcome Frequency Event Outcome
Release as 10 mm hole size 1.50E-05 1.00 0.02 * Escalation effect (Fireball)
3.00E-07 Jet fire
0.09 1.30E-06 Flash fire over plant area
0.04 5.40E-08 Vapour Cloud Explosion
0.01 1.50E-07 Flash fire full extent
1.29E-05 Unignited release
Release
Frequency
(per year)
Detection &
Shutdown
Failure
Immediate
Ignition
Escalation Delayed
Ignition (1)
Explosion
Probability
Delayed
Ignition (2)
Event Outcome Frequency Event Outcome
Release as 25 mm hole size 1.50E-05 1.00 0.02 * Escalation effect (Fireball)
3.00E-07 Jet fire
0.09 1.19E-06 Flash fire over plant area
0.12 1.62E-07 Vapour Cloud Explosion
0.01 1.50E-07 Flash fire full extent
1.29E-05 Unignited release
Release
Frequency
(per year)
Detection &
Shutdown
Failure
Immediate
Ignition
Escalation Delayed
Ignition (1)
Explosion
Probability
Delayed
Ignition (2)
Event Outcome Frequency Event Outcome
Release as 50 mm hole size 5.00E-06 1.00 0.02 * Escalation effect (Fireball)
1.00E-07 Jet fire
0.09 3.96E-07 Flash fire over plant area
0.12 5.40E-08 Vapour Cloud Explosion
0.01 5.00E-08 Flash fire full extent
4.30E-06 Unignited release
Release
Frequency
(per year)
Detection &
Shutdown
Failure
Immediate
Ignition
Escalation Delayed
Ignition (1)
Explosion
Probability
Delayed
Ignition (2)
Event Outcome Frequency Event Outcome
Release as 100 mm hole size 5.00E-06 1.00 0.10 * Escalation effect (Fireball)
5.00E-07 Jet fire
0.4 1.40E-06 Flash fire over plant area
0.3 6.00E-07 Vapour Cloud Explosion
0.04 2.00E-07 Flash fire full extent
1.80E-06 Unignited release
Release
Frequency
(per year)
Detection &
Shutdown
Failure
Immediate
Ignition
Escalation Delayed
Ignition (1)
Explosion
Probability
Delayed
Ignition (2)
Event Outcome Frequency Event Outcome
Release as Line Rupture 2.50E-06 1.00 0.10 * Escalation effect (Fireball)
2.50E-07 Fireball
0.4 7.00E-07 Flash fire over plant area
0.3 3.00E-07 Vapour Cloud Explosion
0.04 1.00E-07 Flash fire full extent
9.00E-07 Unignited release
Note *: The escalation effect probability is estimated based on the location of release scenario and target equipment, as well as the associated consequence impact distance and duration.
As such, the escalation probability for each hazardous scenario regardless different hole size and location are assumed as 1/6, and it is only applied if separation distance between release scenario and target equipment is
within the associated consequence impact distance.

Hazardous Section NGRS_09
Release
Frequency
(per year)
Detection &
Shutdown
Failure
Immediate
Ignition
Escalation Delayed
Ignition (1)
Explosion
Probability
Delayed
Ignition (2)
Event Outcome Frequency Event Outcome
Release as 10 mm hole size 1.50E-05 1.00 0.02 * Escalation effect (Fireball)
3.00E-07 Jet fire
0.09 1.19E-06 Flash fire over plant area
0.12 1.62E-07 Vapour Cloud Explosion
0.01 1.50E-07 Flash fire full extent
1.29E-05 Unignited release
Release
Frequency
(per year)
Detection &
Shutdown
Failure
Immediate
Ignition
Escalation Delayed
Ignition (1)
Explosion
Probability
Delayed
Ignition (2)
Event Outcome Frequency Event Outcome
Release as 25 mm hole size 1.50E-05 1.00 0.02 * Escalation effect (Fireball)
3.00E-07 Jet fire
0.09 1.19E-06 Flash fire over plant area
0.12 1.62E-07 Vapour Cloud Explosion
0.01 1.50E-07 Flash fire full extent
1.29E-05 Unignited release
Release
Frequency
(per year)
Detection &
Shutdown
Failure
Immediate
Ignition
Escalation Delayed
Ignition (1)
Explosion
Probability
Delayed
Ignition (2)
Event Outcome Frequency Event Outcome
Release as 50 mm hole size 5.00E-06 1.00 0.02 * Escalation effect (Fireball)
1.00E-07 Jet fire
0.09 3.96E-07 Flash fire over plant area
0.12 5.40E-08 Vapour Cloud Explosion
0.01 5.00E-08 Flash fire full extent
4.30E-06 Unignited release
Release
Frequency
(per year)
Detection &
Shutdown
Failure
Immediate
Ignition
Escalation Delayed
Ignition (1)
Explosion
Probability
Delayed
Ignition (2)
Event Outcome Frequency Event Outcome
Release as 100 mm hole size 5.00E-06 1.00 0.10 * Escalation effect (Fireball)
5.00E-07 Jet fire
0.4 1.40E-06 Flash fire over plant area
0.3 6.00E-07 Vapour Cloud Explosion
0.04 2.00E-07 Flash fire full extent
1.80E-06 Unignited release
Release
Frequency
(per year)
Detection &
Shutdown
Failure
Immediate
Ignition
Escalation Delayed
Ignition (1)
Explosion
Probability
Delayed
Ignition (2)
Event Outcome Frequency Event Outcome
Release as Line Rupture 2.50E-06 1.00 0.10 * Escalation effect (Fireball)
2.50E-07 Fireball
0.4 7.00E-07 Flash fire over plant area
0.3 3.00E-07 Vapour Cloud Explosion
0.04 1.00E-07 Flash fire full extent
9.00E-07 Unignited release
Note *: The escalation effect probability is estimated based on the location of release scenario and target equipment, as well as the associated consequence impact distance and duration.
As such, the escalation probability for each hazardous scenario regardless different hole size and location are assumed as 1/6, and it is only applied if separation distance between release scenario and target equipment is
within the associated consequence impact distance.

Hazardous Section NGRS_10
Release
Frequency
(per year)
Detection &
Shutdown
Failure
Immediate
Ignition
Escalation Delayed
Ignition (1)
Explosion
Probability
Delayed
Ignition (2)
Event Outcome Frequency Event Outcome
Release as 10 mm hole size 1.50E-05 1.00 0.02 * Escalation effect (Fireball)
3.00E-07 Jet fire
0.09 1.19E-06 Flash fire over plant area
0.12 1.62E-07 Vapour Cloud Explosion
0.01 1.50E-07 Flash fire full extent
1.29E-05 Unignited release
Release
Frequency
(per year)
Detection &
Shutdown
Failure
Immediate
Ignition
Escalation Delayed
Ignition (1)
Explosion
Probability
Delayed
Ignition (2)
Event Outcome Frequency Event Outcome
Release as 25 mm hole size 1.50E-05 1.00 0.02 * Escalation effect (Fireball)
3.00E-07 Jet fire
0.09 1.19E-06 Flash fire over plant area
0.12 1.62E-07 Vapour Cloud Explosion
0.01 1.50E-07 Flash fire full extent
1.29E-05 Unignited release
Release
Frequency
(per year)
Detection &
Shutdown
Failure
Immediate
Ignition
Escalation Delayed
Ignition (1)
Explosion
Probability
Delayed
Ignition (2)
Event Outcome Frequency Event Outcome
Release as 50 mm hole size 5.00E-06 1.00 0.02 * Escalation effect (Fireball)
1.00E-07 Jet fire
0.09 3.96E-07 Flash fire over plant area
0.12 5.40E-08 Vapour Cloud Explosion
0.01 5.00E-08 Flash fire full extent
4.30E-06 Unignited release
Release
Frequency
(per year)
Detection &
Shutdown
Failure
Immediate
Ignition
Escalation Delayed
Ignition (1)
Explosion
Probability
Delayed
Ignition (2)
Event Outcome Frequency Event Outcome
Release as 100 mm hole size 5.00E-06 1.00 0.10 * Escalation effect (Fireball)
5.00E-07 Jet fire
0.4 1.40E-06 Flash fire over plant area
0.3 6.00E-07 Vapour Cloud Explosion
0.04 2.00E-07 Flash fire full extent
1.80E-06 Unignited release
Release
Frequency
(per year)
Detection &
Shutdown
Failure
Immediate
Ignition
Escalation Delayed
Ignition (1)
Explosion
Probability
Delayed
Ignition (2)
Event Outcome Frequency Event Outcome
Release as Line Rupture 2.50E-06 1.00 0.10 * Escalation effect (Fireball)
2.50E-07 Fireball
0.4 7.00E-07 Flash fire over plant area
0.3 3.00E-07 Vapour Cloud Explosion
0.04 1.00E-07 Flash fire full extent
9.00E-07 Unignited release
Note *: The escalation effect probability is estimated based on the location of release scenario and target equipment, as well as the associated consequence impact distance and duration.
As such, the escalation probability for each hazardous scenario regardless different hole size and location are assumed as 1/6, and it is only applied if separation distance between release scenario and target equipment is
within the associated consequence impact distance.

Hazardous Section NGRS_11
Release
Frequency
(per year)
Detection &
Shutdown
Failure
Immediate
Ignition
Escalation Delayed
Ignition (1)
Explosion
Probability
Delayed
Ignition (2)
Event Outcome Frequency Event Outcome
Release as 10 mm hole size 1.50E-05 1.00 0.02 * Escalation effect (Fireball)
3.00E-07 Jet fire
0.09 1.19E-06 Flash fire over plant area
0.12 1.62E-07 Vapour Cloud Explosion
0.01 1.50E-07 Flash fire full extent
1.29E-05 Unignited release
Release
Frequency
(per year)
Detection &
Shutdown
Failure
Immediate
Ignition
Escalation Delayed
Ignition (1)
Explosion
Probability
Delayed
Ignition (2)
Event Outcome Frequency Event Outcome
Release as 25 mm hole size 1.50E-05 1.00 0.02 * Escalation effect (Fireball)
3.00E-07 Jet fire
0.09 1.19E-06 Flash fire over plant area
0.12 1.62E-07 Vapour Cloud Explosion
0.01 1.50E-07 Flash fire full extent
1.29E-05 Unignited release
Release
Frequency
(per year)
Detection &
Shutdown
Failure
Immediate
Ignition
Escalation Delayed
Ignition (1)
Explosion
Probability
Delayed
Ignition (2)
Event Outcome Frequency Event Outcome
Release as 50 mm hole size 5.00E-06 1.00 0.02 * Escalation effect (Fireball)
1.00E-07 Jet fire
0.09 3.96E-07 Flash fire over plant area
0.12 5.40E-08 Vapour Cloud Explosion
0.01 5.00E-08 Flash fire full extent
4.30E-06 Unignited release
Release
Frequency
(per year)
Detection &
Shutdown
Failure
Immediate
Ignition
Escalation Delayed
Ignition (1)
Explosion
Probability
Delayed
Ignition (2)
Event Outcome Frequency Event Outcome
Release as 100 mm hole size 5.00E-06 1.00 0.10 * Escalation effect (Fireball)
5.00E-07 Jet fire
0.4 1.40E-06 Flash fire over plant area
0.3 6.00E-07 Vapour Cloud Explosion
0.04 2.00E-07 Flash fire full extent
1.80E-06 Unignited release
Release
Frequency
(per year)
Detection &
Shutdown
Failure
Immediate
Ignition
Escalation Delayed
Ignition (1)
Explosion
Probability
Delayed
Ignition (2)
Event Outcome Frequency Event Outcome
Release as Line Rupture 2.50E-06 1.00 0.10 * Escalation effect (Fireball)
2.50E-07 Fireball
0.4 7.00E-07 Flash fire over plant area
0.3 3.00E-07 Vapour Cloud Explosion
0.04 1.00E-07 Flash fire full extent
9.00E-07 Unignited release
Note *: The escalation effect probability is estimated based on the location of release scenario and target equipment, as well as the associated consequence impact distance and duration.
As such, the escalation probability for each hazardous scenario regardless different hole size and location are assumed as 1/6, and it is only applied if separation distance between release scenario and target equipment is
within the associated consequence impact distance.

Hazardous Section NGRS_12
Release
Frequency
(per year)
Detection &
Shutdown
Failure
Immediate
Ignition
Escalation Delayed
Ignition (1)
Explosion
Probability
Delayed
Ignition (2)
Event Outcome Frequency Event Outcome
Release as 10 mm hole size 1.50E-05 1.00 0.02 * Escalation effect (Fireball)
3.00E-07 Jet fire
0.09 1.19E-06 Flash fire over plant area
0.12 1.62E-07 Vapour Cloud Explosion
0.01 1.50E-07 Flash fire full extent
1.29E-05 Unignited release
Release
Frequency
(per year)
Detection &
Shutdown
Failure
Immediate
Ignition
Escalation Delayed
Ignition (1)
Explosion
Probability
Delayed
Ignition (2)
Event Outcome Frequency Event Outcome
Release as 25 mm hole size 1.50E-05 1.00 0.02 * Escalation effect (Fireball)
3.00E-07 Jet fire
0.09 1.19E-06 Flash fire over plant area
0.12 1.62E-07 Vapour Cloud Explosion
0.01 1.50E-07 Flash fire full extent
1.29E-05 Unignited release
Release
Frequency
(per year)
Detection &
Shutdown
Failure
Immediate
Ignition
Escalation Delayed
Ignition (1)
Explosion
Probability
Delayed
Ignition (2)
Event Outcome Frequency Event Outcome
Release as 50 mm hole size 5.00E-06 1.00 0.02 * Escalation effect (Fireball)
1.00E-07 Jet fire
0.09 3.96E-07 Flash fire over plant area
0.12 5.40E-08 Vapour Cloud Explosion
0.01 5.00E-08 Flash fire full extent
4.30E-06 Unignited release
Release
Frequency
(per year)
Detection &
Shutdown
Failure
Immediate
Ignition
Escalation Delayed
Ignition (1)
Explosion
Probability
Delayed
Ignition (2)
Event Outcome Frequency Event Outcome
Release as 100 mm hole size 5.00E-06 1.00 0.10 * Escalation effect (Fireball)
5.00E-07 Jet fire
0.4 1.40E-06 Flash fire over plant area
0.3 6.00E-07 Vapour Cloud Explosion
0.04 2.00E-07 Flash fire full extent
1.80E-06 Unignited release
Release
Frequency
(per year)
Detection &
Shutdown
Failure
Immediate
Ignition
Escalation Delayed
Ignition (1)
Explosion
Probability
Delayed
Ignition (2)
Event Outcome Frequency Event Outcome
Release as Line Rupture 2.50E-06 1.00 0.10 * Escalation effect (Fireball)
2.50E-07 Fireball
0.4 7.00E-07 Flash fire over plant area
0.3 3.00E-07 Vapour Cloud Explosion
0.04 1.00E-07 Flash fire full extent
9.00E-07 Unignited release
Note *: The escalation effect probability is estimated based on the location of release scenario and target equipment, as well as the associated consequence impact distance and duration.
As such, the escalation probability for each hazardous scenario regardless different hole size and location are assumed as 1/6, and it is only applied if separation distance between release scenario and target equipment is
within the associated consequence impact distance.

Hazardous Section NGRS_13
Release
Frequency
(per year)
Detection &
Shutdown
Failure
Immediate
Ignition
Escalation Delayed
Ignition (1)
Explosion
Probability
Delayed
Ignition (2)
Event Outcome Frequency Event Outcome
Release as 10 mm hole size 1.50E-05 1.00 0.02 * Escalation effect (Fireball)
3.00E-07 Jet fire
0.09 1.19E-06 Flash fire over plant area
0.12 1.62E-07 Vapour Cloud Explosion
0.01 1.50E-07 Flash fire full extent
1.29E-05 Unignited release
Release
Frequency
(per year)
Detection &
Shutdown
Failure
Immediate
Ignition
Escalation Delayed
Ignition (1)
Explosion
Probability
Delayed
Ignition (2)
Event Outcome Frequency Event Outcome
Release as 25 mm hole size 1.50E-05 1.00 0.02 * Escalation effect (Fireball)
3.00E-07 Jet fire
0.09 1.19E-06 Flash fire over plant area
0.12 1.62E-07 Vapour Cloud Explosion
0.01 1.50E-07 Flash fire full extent
1.29E-05 Unignited release
Release
Frequency
(per year)
Detection &
Shutdown
Failure
Immediate
Ignition
Escalation Delayed
Ignition (1)
Explosion
Probability
Delayed
Ignition (2)
Event Outcome Frequency Event Outcome
Release as 50 mm hole size 5.00E-06 1.00 0.02 * Escalation effect (Fireball)
1.00E-07 Jet fire
0.09 3.96E-07 Flash fire over plant area
0.12 5.40E-08 Vapour Cloud Explosion
0.01 5.00E-08 Flash fire full extent
4.30E-06 Unignited release
Release
Frequency
(per year)
Detection &
Shutdown
Failure
Immediate
Ignition
Escalation Delayed
Ignition (1)
Explosion
Probability
Delayed
Ignition (2)
Event Outcome Frequency Event Outcome
Release as 100 mm hole size 5.00E-06 1.00 0.10 * Escalation effect (Fireball)
5.00E-07 Jet fire
0.4 1.40E-06 Flash fire over plant area
0.3 6.00E-07 Vapour Cloud Explosion
0.04 2.00E-07 Flash fire full extent
1.80E-06 Unignited release
Release
Frequency
(per year)
Detection &
Shutdown
Failure
Immediate
Ignition
Escalation Delayed
Ignition (1)
Explosion
Probability
Delayed
Ignition (2)
Event Outcome Frequency Event Outcome
Release as Line Rupture 2.50E-06 1.00 0.10 * Escalation effect (Fireball)
2.50E-07 Fireball
0.4 7.00E-07 Flash fire over plant area
0.3 3.00E-07 Vapour Cloud Explosion
0.04 1.00E-07 Flash fire full extent
9.00E-07 Unignited release
Note *: The escalation effect probability is estimated based on the location of release scenario and target equipment, as well as the associated consequence impact distance and duration.
As such, the escalation probability for each hazardous scenario regardless different hole size and location are assumed as 1/6, and it is only applied if separation distance between release scenario and target equipment is
within the associated consequence impact distance.

Hazardous Section NGRS_14
Release
Frequency
(per year)
Detection &
Shutdown
Failure
Immediate
Ignition
Escalation Delayed
Ignition (1)
Explosion
Probability
Delayed
Ignition (2)
Event Outcome Frequency Event Outcome
Release as 10 mm hole size 1.50E-05 1.00 0.02 * Escalation effect (Fireball)
3.00E-07 Jet fire
0.09 1.30E-06 Flash fire over plant area
0.04 5.40E-08 Vapour Cloud Explosion
0.01 1.50E-07 Flash fire full extent
1.29E-05 Unignited release
Release
Frequency
(per year)
Detection &
Shutdown
Failure
Immediate
Ignition
Escalation Delayed
Ignition (1)
Explosion
Probability
Delayed
Ignition (2)
Event Outcome Frequency Event Outcome
Release as 25 mm hole size 1.50E-05 1.00 0.02 * Escalation effect (Fireball)
3.00E-07 Jet fire
0.09 1.19E-06 Flash fire over plant area
0.12 1.62E-07 Vapour Cloud Explosion
0.01 1.50E-07 Flash fire full extent
1.29E-05 Unignited release
Release
Frequency
(per year)
Detection &
Shutdown
Failure
Immediate
Ignition
Escalation Delayed
Ignition (1)
Explosion
Probability
Delayed
Ignition (2)
Event Outcome Frequency Event Outcome
Release as 50 mm hole size 5.00E-06 1.00 0.02 * Escalation effect (Fireball)
1.00E-07 Jet fire
0.09 3.96E-07 Flash fire over plant area
0.12 5.40E-08 Vapour Cloud Explosion
0.01 5.00E-08 Flash fire full extent
4.30E-06 Unignited release
Release
Frequency
(per year)
Detection &
Shutdown
Failure
Immediate
Ignition
Escalation Delayed
Ignition (1)
Explosion
Probability
Delayed
Ignition (2)
Event Outcome Frequency Event Outcome
Release as 100 mm hole size 5.00E-06 1.00 0.10 * Escalation effect (Fireball)
5.00E-07 Jet fire
0.4 1.40E-06 Flash fire over plant area
0.3 6.00E-07 Vapour Cloud Explosion
0.04 2.00E-07 Flash fire full extent
1.80E-06 Unignited release
Release
Frequency
(per year)
Detection &
Shutdown
Failure
Immediate
Ignition
Escalation Delayed
Ignition (1)
Explosion
Probability
Delayed
Ignition (2)
Event Outcome Frequency Event Outcome
Release as Line Rupture 2.50E-06 1.00 0.10 * Escalation effect (Fireball)
2.50E-07 Fireball
0.4 7.00E-07 Flash fire over plant area
0.3 3.00E-07 Vapour Cloud Explosion
0.04 1.00E-07 Flash fire full extent
9.00E-07 Unignited release
Note *: The escalation effect probability is estimated based on the location of release scenario and target equipment, as well as the associated consequence impact distance and duration.
As such, the escalation probability for each hazardous scenario regardless different hole size and location are assumed as 1/6, and it is only applied if separation distance between release scenario and target equipment is
within the associated consequence impact distance.

Hazardous Section NGRS_15
Release
Frequency
(per year)
Detection &
Shutdown
Failure
Immediate
Ignition
Escalation Delayed
Ignition (1)
Explosion
Probability
Delayed
Ignition (2)
Event Outcome Frequency Event Outcome
Release as 10 mm hole size 1.50E-05 1.00 0.02 * Escalation effect (Fireball)
3.00E-07 Jet fire
0.09 1.19E-06 Flash fire over plant area
0.12 1.62E-07 Vapour Cloud Explosion
0.01 1.50E-07 Flash fire full extent
1.29E-05 Unignited release
Release
Frequency
(per year)
Detection &
Shutdown
Failure
Immediate
Ignition
Escalation Delayed
Ignition (1)
Explosion
Probability
Delayed
Ignition (2)
Event Outcome Frequency Event Outcome
Release as 25 mm hole size 1.50E-05 1.00 0.02 * Escalation effect (Fireball)
3.00E-07 Jet fire
0.09 1.19E-06 Flash fire over plant area
0.12 1.62E-07 Vapour Cloud Explosion
0.01 1.50E-07 Flash fire full extent
1.29E-05 Unignited release
Release
Frequency
(per year)
Detection &
Shutdown
Failure
Immediate
Ignition
Escalation Delayed
Ignition (1)
Explosion
Probability
Delayed
Ignition (2)
Event Outcome Frequency Event Outcome
Release as 50 mm hole size 5.00E-06 1.00 0.02 * Escalation effect (Fireball)
1.00E-07 Jet fire
0.09 3.96E-07 Flash fire over plant area
0.12 5.40E-08 Vapour Cloud Explosion
0.01 5.00E-08 Flash fire full extent
4.30E-06 Unignited release
Release
Frequency
(per year)
Detection &
Shutdown
Failure
Immediate
Ignition
Escalation Delayed
Ignition (1)
Explosion
Probability
Delayed
Ignition (2)
Event Outcome Frequency Event Outcome
Release as 100 mm hole size 5.00E-06 1.00 0.10 * Escalation effect (Fireball)
5.00E-07 Jet fire
0.4 1.40E-06 Flash fire over plant area
0.3 6.00E-07 Vapour Cloud Explosion
0.04 2.00E-07 Flash fire full extent
1.80E-06 Unignited release
Release
Frequency
(per year)
Detection &
Shutdown
Failure
Immediate
Ignition
Escalation Delayed
Ignition (1)
Explosion
Probability
Delayed
Ignition (2)
Event Outcome Frequency Event Outcome
Release as Line Rupture 2.50E-06 1.00 0.10 * Escalation effect (Fireball)
2.50E-07 Fireball
0.4 7.00E-07 Flash fire over plant area
0.3 3.00E-07 Vapour Cloud Explosion
0.04 1.00E-07 Flash fire full extent
9.00E-07 Unignited release
Note *: The escalation effect probability is estimated based on the location of release scenario and target equipment, as well as the associated consequence impact distance and duration.
As such, the escalation probability for each hazardous scenario regardless different hole size and location are assumed as 1/6, and it is only applied if separation distance between release scenario and target equipment is
within the associated consequence impact distance.

Hazardous Section NGRS_16
Release
Frequency
(per year)
Detection &
Shutdown
Failure
Immediate
Ignition
Escalation Delayed
Ignition (1)
Explosion
Probability
Delayed
Ignition (2)
Event Outcome Frequency Event Outcome
Release as 10 mm hole size 1.50E-05 1.00 0.02 * Escalation effect (Fireball)
3.00E-07 Jet fire
0.09 1.19E-06 Flash fire over plant area
0.12 1.62E-07 Vapour Cloud Explosion
0.01 1.50E-07 Flash fire full extent
1.29E-05 Unignited release
Release
Frequency
(per year)
Detection &
Shutdown
Failure
Immediate
Ignition
Escalation Delayed
Ignition (1)
Explosion
Probability
Delayed
Ignition (2)
Event Outcome Frequency Event Outcome
Release as 25 mm hole size 1.50E-05 1.00 0.02 * Escalation effect (Fireball)
3.00E-07 Jet fire
0.09 1.19E-06 Flash fire over plant area
0.12 1.62E-07 Vapour Cloud Explosion
0.01 1.50E-07 Flash fire full extent
1.29E-05 Unignited release
Release
Frequency
(per year)
Detection &
Shutdown
Failure
Immediate
Ignition
Escalation Delayed
Ignition (1)
Explosion
Probability
Delayed
Ignition (2)
Event Outcome Frequency Event Outcome
Release as 50 mm hole size 5.00E-06 1.00 0.02 * Escalation effect (Fireball)
1.00E-07 Jet fire
0.09 3.96E-07 Flash fire over plant area
0.12 5.40E-08 Vapour Cloud Explosion
0.01 5.00E-08 Flash fire full extent
4.30E-06 Unignited release
Release
Frequency
(per year)
Detection &
Shutdown
Failure
Immediate
Ignition
Escalation Delayed
Ignition (1)
Explosion
Probability
Delayed
Ignition (2)
Event Outcome Frequency Event Outcome
Release as 100 mm hole size 5.00E-06 1.00 0.10 * Escalation effect (Fireball)
5.00E-07 Jet fire
0.4 1.40E-06 Flash fire over plant area
0.3 6.00E-07 Vapour Cloud Explosion
0.04 2.00E-07 Flash fire full extent
1.80E-06 Unignited release
Release
Frequency
(per year)
Detection &
Shutdown
Failure
Immediate
Ignition
Escalation Delayed
Ignition (1)
Explosion
Probability
Delayed
Ignition (2)
Event Outcome Frequency Event Outcome
Release as Line Rupture 2.50E-06 1.00 0.10 * Escalation effect (Fireball)
2.50E-07 Fireball
0.4 7.00E-07 Flash fire over plant area
0.3 3.00E-07 Vapour Cloud Explosion
0.04 1.00E-07 Flash fire full extent
9.00E-07 Unignited release
Note *: The escalation effect probability is estimated based on the location of release scenario and target equipment, as well as the associated consequence impact distance and duration.
As such, the escalation probability for each hazardous scenario regardless different hole size and location are assumed as 1/6, and it is only applied if separation distance between release scenario and target equipment is
within the associated consequence impact distance.

Hazardous Section NGRS_17
Release
Frequency
(per year)
Detection &
Shutdown
Failure
Immediate
Ignition
Escalation Delayed
Ignition (1)
Explosion
Probability
Delayed
Ignition (2)
Event Outcome Frequency Event Outcome
Release as 10 mm hole size 1.50E-05 1.00 0.02 * Escalation effect (Fireball)
3.00E-07 Jet fire
0.09 1.19E-06 Flash fire over plant area
0.12 1.62E-07 Vapour Cloud Explosion
0.01 1.50E-07 Flash fire full extent
1.29E-05 Unignited release
Release
Frequency
(per year)
Detection &
Shutdown
Failure
Immediate
Ignition
Escalation Delayed
Ignition (1)
Explosion
Probability
Delayed
Ignition (2)
Event Outcome Frequency Event Outcome
Release as 25 mm hole size 1.50E-05 1.00 0.02 * Escalation effect (Fireball)
3.00E-07 Jet fire
0.09 1.19E-06 Flash fire over plant area
0.12 1.62E-07 Vapour Cloud Explosion
0.01 1.50E-07 Flash fire full extent
1.29E-05 Unignited release
Release
Frequency
(per year)
Detection &
Shutdown
Failure
Immediate
Ignition
Escalation Delayed
Ignition (1)
Explosion
Probability
Delayed
Ignition (2)
Event Outcome Frequency Event Outcome
Release as 50 mm hole size 5.00E-06 1.00 0.02 * Escalation effect (Fireball)
1.00E-07 Jet fire
0.09 3.96E-07 Flash fire over plant area
0.12 5.40E-08 Vapour Cloud Explosion
0.01 5.00E-08 Flash fire full extent
4.30E-06 Unignited release
Release
Frequency
(per year)
Detection &
Shutdown
Failure
Immediate
Ignition
Escalation Delayed
Ignition (1)
Explosion
Probability
Delayed
Ignition (2)
Event Outcome Frequency Event Outcome
Release as 100 mm hole size 5.00E-06 1.00 0.10 * Escalation effect (Fireball)
5.00E-07 Jet fire
0.4 1.40E-06 Flash fire over plant area
0.3 6.00E-07 Vapour Cloud Explosion
0.04 2.00E-07 Flash fire full extent
1.80E-06 Unignited release
Release
Frequency
(per year)
Detection &
Shutdown
Failure
Immediate
Ignition
Escalation Delayed
Ignition (1)
Explosion
Probability
Delayed
Ignition (2)
Event Outcome Frequency Event Outcome
Release as Line Rupture 2.50E-06 1.00 0.10 * Escalation effect (Fireball)
2.50E-07 Fireball
0.4 7.00E-07 Flash fire over plant area
0.3 3.00E-07 Vapour Cloud Explosion
0.04 1.00E-07 Flash fire full extent
9.00E-07 Unignited release
Note *: The escalation effect probability is estimated based on the location of release scenario and target equipment, as well as the associated consequence impact distance and duration.
As such, the escalation probability for each hazardous scenario regardless different hole size and location are assumed as 1/6, and it is only applied if separation distance between release scenario and target equipment is
within the associated consequence impact distance.

Hazardous Section NGRS_18
Release
Frequency
(per year)
Detection &
Shutdown
Failure
Immediate
Ignition
Escalation Delayed
Ignition (1)
Explosion
Probability
Delayed
Ignition (2)
Event Outcome Frequency Event Outcome
Release as 10 mm hole size 1.50E-05 1.00 0.02 * Escalation effect (Fireball)
3.00E-07 Jet fire
0.09 1.19E-06 Flash fire over plant area
0.12 1.62E-07 Vapour Cloud Explosion
0.01 1.50E-07 Flash fire full extent
1.29E-05 Unignited release
Release
Frequency
(per year)
Detection &
Shutdown
Failure
Immediate
Ignition
Escalation Delayed
Ignition (1)
Explosion
Probability
Delayed
Ignition (2)
Event Outcome Frequency Event Outcome
Release as 25 mm hole size 1.50E-05 1.00 0.02 * Escalation effect (Fireball)
3.00E-07 Jet fire
0.09 1.19E-06 Flash fire over plant area
0.12 1.62E-07 Vapour Cloud Explosion
0.01 1.50E-07 Flash fire full extent
1.29E-05 Unignited release
Release
Frequency
(per year)
Detection &
Shutdown
Failure
Immediate
Ignition
Escalation Delayed
Ignition (1)
Explosion
Probability
Delayed
Ignition (2)
Event Outcome Frequency Event Outcome
Release as 50 mm hole size 5.00E-06 1.00 0.02 * Escalation effect (Fireball)
1.00E-07 Jet fire
0.09 3.96E-07 Flash fire over plant area
0.12 5.40E-08 Vapour Cloud Explosion
0.01 5.00E-08 Flash fire full extent
4.30E-06 Unignited release
Release
Frequency
(per year)
Detection &
Shutdown
Failure
Immediate
Ignition
Escalation Delayed
Ignition (1)
Explosion
Probability
Delayed
Ignition (2)
Event Outcome Frequency Event Outcome
Release as 100 mm hole size 5.00E-06 1.00 0.10 * Escalation effect (Fireball)
5.00E-07 Jet fire
0.4 1.40E-06 Flash fire over plant area
0.3 6.00E-07 Vapour Cloud Explosion
0.04 2.00E-07 Flash fire full extent
1.80E-06 Unignited release
Release
Frequency
(per year)
Detection &
Shutdown
Failure
Immediate
Ignition
Escalation Delayed
Ignition (1)
Explosion
Probability
Delayed
Ignition (2)
Event Outcome Frequency Event Outcome
Release as Line Rupture 2.50E-06 1.00 0.10 * Escalation effect (Fireball)
2.50E-07 Fireball
0.4 7.00E-07 Flash fire over plant area
0.3 3.00E-07 Vapour Cloud Explosion
0.04 1.00E-07 Flash fire full extent
9.00E-07 Unignited release
Note *: The escalation effect probability is estimated based on the location of release scenario and target equipment, as well as the associated consequence impact distance and duration.
As such, the escalation probability for each hazardous scenario regardless different hole size and location are assumed as 1/6, and it is only applied if separation distance between release scenario and target equipment is
within the associated consequence impact distance.

Hazardous Section NGRS_19
Release
Frequency
(per year)
Detection &
Shutdown
Failure
Immediate
Ignition
Escalation Delayed
Ignition (1)
Explosion
Probability
Delayed
Ignition (2)
Event Outcome Frequency Event Outcome
Release as 10 mm hole size 1.50E-05 1.00 0.02 * Escalation effect (Fireball)
3.00E-07 Jet fire
0.09 1.19E-06 Flash fire over plant area
0.12 1.62E-07 Vapour Cloud Explosion
0.01 1.50E-07 Flash fire full extent
1.29E-05 Unignited release
Release
Frequency
(per year)
Detection &
Shutdown
Failure
Immediate
Ignition
Escalation Delayed
Ignition (1)
Explosion
Probability
Delayed
Ignition (2)
Event Outcome Frequency Event Outcome
Release as 25 mm hole size 1.50E-05 1.00 0.02 * Escalation effect (Fireball)
3.00E-07 Jet fire
0.09 1.19E-06 Flash fire over plant area
0.12 1.62E-07 Vapour Cloud Explosion
0.01 1.50E-07 Flash fire full extent
1.29E-05 Unignited release
Release
Frequency
(per year)
Detection &
Shutdown
Failure
Immediate
Ignition
Escalation Delayed
Ignition (1)
Explosion
Probability
Delayed
Ignition (2)
Event Outcome Frequency Event Outcome
Release as 50 mm hole size 5.00E-06 1.00 0.02 * Escalation effect (Fireball)
1.00E-07 Jet fire
0.09 3.96E-07 Flash fire over plant area
0.12 5.40E-08 Vapour Cloud Explosion
0.01 5.00E-08 Flash fire full extent
4.30E-06 Unignited release
Release
Frequency
(per year)
Detection &
Shutdown
Failure
Immediate
Ignition
Escalation Delayed
Ignition (1)
Explosion
Probability
Delayed
Ignition (2)
Event Outcome Frequency Event Outcome
Release as 100 mm hole size 5.00E-06 1.00 0.10 * Escalation effect (Fireball)
5.00E-07 Jet fire
0.4 1.40E-06 Flash fire over plant area
0.3 6.00E-07 Vapour Cloud Explosion
0.04 2.00E-07 Flash fire full extent
1.80E-06 Unignited release
Release
Frequency
(per year)
Detection &
Shutdown
Failure
Immediate
Ignition
Escalation Delayed
Ignition (1)
Explosion
Probability
Delayed
Ignition (2)
Event Outcome Frequency Event Outcome
Release as Line Rupture 2.50E-06 1.00 0.10 * Escalation effect (Fireball)
2.50E-07 Fireball
0.4 7.00E-07 Flash fire over plant area
0.3 3.00E-07 Vapour Cloud Explosion
0.04 1.00E-07 Flash fire full extent
9.00E-07 Unignited release
Note *: The escalation effect probability is estimated based on the location of release scenario and target equipment, as well as the associated consequence impact distance and duration.
As such, the escalation probability for each hazardous scenario regardless different hole size and location are assumed as 1/6, and it is only applied if separation distance between release scenario and target equipment is
within the associated consequence impact distance.

Hazardous Section NGRS_20
Release
Frequency
(per year)
Detection &
Shutdown
Failure
Immediate
Ignition
Escalation Delayed
Ignition (1)
Explosion
Probability
Delayed
Ignition (2)
Event Outcome Frequency Event Outcome
Release as 10 mm hole size 1.50E-05 1.00 0.02 * Escalation effect (Fireball)
3.00E-07 Jet fire
0.09 1.30E-06 Flash fire over plant area
0.04 5.40E-08 Vapour Cloud Explosion
0.01 1.50E-07 Flash fire full extent
1.29E-05 Unignited release
Release
Frequency
(per year)
Detection &
Shutdown
Failure
Immediate
Ignition
Escalation Delayed
Ignition (1)
Explosion
Probability
Delayed
Ignition (2)
Event Outcome Frequency Event Outcome
Release as 25 mm hole size 1.50E-05 1.00 0.02 * Escalation effect (Fireball)
3.00E-07 Jet fire
0.09 1.19E-06 Flash fire over plant area
0.12 1.62E-07 Vapour Cloud Explosion
0.01 1.50E-07 Flash fire full extent
1.29E-05 Unignited release
Release
Frequency
(per year)
Detection &
Shutdown
Failure
Immediate
Ignition
Escalation Delayed
Ignition (1)
Explosion
Probability
Delayed
Ignition (2)
Event Outcome Frequency Event Outcome
Release as 50 mm hole size 5.00E-06 1.00 0.02 * Escalation effect (Fireball)
1.00E-07 Jet fire
0.09 3.96E-07 Flash fire over plant area
0.12 5.40E-08 Vapour Cloud Explosion
0.01 5.00E-08 Flash fire full extent
4.30E-06 Unignited release
Release
Frequency
(per year)
Detection &
Shutdown
Failure
Immediate
Ignition
Escalation Delayed
Ignition (1)
Explosion
Probability
Delayed
Ignition (2)
Event Outcome Frequency Event Outcome
Release as 100 mm hole size 5.00E-06 1.00 0.10 * Escalation effect (Fireball)
5.00E-07 Jet fire
0.4 1.40E-06 Flash fire over plant area
0.3 6.00E-07 Vapour Cloud Explosion
0.04 2.00E-07 Flash fire full extent
1.80E-06 Unignited release
Release
Frequency
(per year)
Detection &
Shutdown
Failure
Immediate
Ignition
Escalation Delayed
Ignition (1)
Explosion
Probability
Delayed
Ignition (2)
Event Outcome Frequency Event Outcome
Release as Line Rupture 2.50E-06 1.00 0.10 * Escalation effect (Fireball)
2.50E-07 Fireball
0.4 7.00E-07 Flash fire over plant area
0.3 3.00E-07 Vapour Cloud Explosion
0.04 1.00E-07 Flash fire full extent
9.00E-07 Unignited release
Note *: The escalation effect probability is estimated based on the location of release scenario and target equipment, as well as the associated consequence impact distance and duration.
As such, the escalation probability for each hazardous scenario regardless different hole size and location are assumed as 1/6, and it is only applied if separation distance between release scenario and target equipment is
within the associated consequence impact distance.

Hazardous Section NGRS_21
Release
Frequency
(per year)
Detection &
Shutdown
Failure
Immediate
Ignition
Escalation Delayed
Ignition (1)
Explosion
Probability
Delayed
Ignition (2)
Event Outcome Frequency Event Outcome
Release as 10 mm hole size 1.50E-05 1.00 0.02 * Escalation effect (Fireball)
3.00E-07 Jet fire
0.09 1.19E-06 Flash fire over plant area
0.12 1.62E-07 Vapour Cloud Explosion
0.01 1.50E-07 Flash fire full extent
1.29E-05 Unignited release
Release
Frequency
(per year)
Detection &
Shutdown
Failure
Immediate
Ignition
Escalation Delayed
Ignition (1)
Explosion
Probability
Delayed
Ignition (2)
Event Outcome Frequency Event Outcome
Release as 25 mm hole size 1.50E-05 1.00 0.02 * Escalation effect (Fireball)
3.00E-07 Jet fire
0.09 1.19E-06 Flash fire over plant area
0.12 1.62E-07 Vapour Cloud Explosion
0.01 1.50E-07 Flash fire full extent
1.29E-05 Unignited release
Release
Frequency
(per year)
Detection &
Shutdown
Failure
Immediate
Ignition
Escalation Delayed
Ignition (1)
Explosion
Probability
Delayed
Ignition (2)
Event Outcome Frequency Event Outcome
Release as 50 mm hole size 5.00E-06 1.00 0.02 * Escalation effect (Fireball)
1.00E-07 Jet fire
0.09 3.96E-07 Flash fire over plant area
0.12 5.40E-08 Vapour Cloud Explosion
0.01 5.00E-08 Flash fire full extent
4.30E-06 Unignited release
Release
Frequency
(per year)
Detection &
Shutdown
Failure
Immediate
Ignition
Escalation Delayed
Ignition (1)
Explosion
Probability
Delayed
Ignition (2)
Event Outcome Frequency Event Outcome
Release as 100 mm hole size 5.00E-06 1.00 0.10 * Escalation effect (Fireball)
5.00E-07 Jet fire
0.4 1.40E-06 Flash fire over plant area
0.3 6.00E-07 Vapour Cloud Explosion
0.04 2.00E-07 Flash fire full extent
1.80E-06 Unignited release
Release
Frequency
(per year)
Detection &
Shutdown
Failure
Immediate
Ignition
Escalation Delayed
Ignition (1)
Explosion
Probability
Delayed
Ignition (2)
Event Outcome Frequency Event Outcome
Release as Line Rupture 2.50E-06 1.00 0.10 * Escalation effect (Fireball)
2.50E-07 Fireball
0.4 7.00E-07 Flash fire over plant area
0.3 3.00E-07 Vapour Cloud Explosion
0.04 1.00E-07 Flash fire full extent
9.00E-07 Unignited release
Note *: The escalation effect probability is estimated based on the location of release scenario and target equipment, as well as the associated consequence impact distance and duration.
As such, the escalation probability for each hazardous scenario regardless different hole size and location are assumed as 1/6, and it is only applied if separation distance between release scenario and target equipment is
within the associated consequence impact distance.

Hazardous Section NGRS_22
Release
Frequency
(per year)
Detection &
Shutdown
Failure
Immediate
Ignition
Escalation Delayed
Ignition (1)
Explosion
Probability
Delayed
Ignition (2)
Event Outcome Frequency Event Outcome
Release as 10 mm hole size 1.50E-05 1.00 0.02 * Escalation effect (Fireball)
3.00E-07 Jet fire
0.09 1.19E-06 Flash fire over plant area
0.12 1.62E-07 Vapour Cloud Explosion
0.01 1.50E-07 Flash fire full extent
1.29E-05 Unignited release
Release
Frequency
(per year)
Detection &
Shutdown
Failure
Immediate
Ignition
Escalation Delayed
Ignition (1)
Explosion
Probability
Delayed
Ignition (2)
Event Outcome Frequency Event Outcome
Release as 25 mm hole size 1.50E-05 1.00 0.02 * Escalation effect (Fireball)
3.00E-07 Jet fire
0.09 1.19E-06 Flash fire over plant area
0.12 1.62E-07 Vapour Cloud Explosion
0.01 1.50E-07 Flash fire full extent
1.29E-05 Unignited release
Release
Frequency
(per year)
Detection &
Shutdown
Failure
Immediate
Ignition
Escalation Delayed
Ignition (1)
Explosion
Probability
Delayed
Ignition (2)
Event Outcome Frequency Event Outcome
Release as 50 mm hole size 5.00E-06 1.00 0.02 * Escalation effect (Fireball)
1.00E-07 Jet fire
0.09 3.96E-07 Flash fire over plant area
0.12 5.40E-08 Vapour Cloud Explosion
0.01 5.00E-08 Flash fire full extent
4.30E-06 Unignited release
Release
Frequency
(per year)
Detection &
Shutdown
Failure
Immediate
Ignition
Escalation Delayed
Ignition (1)
Explosion
Probability
Delayed
Ignition (2)
Event Outcome Frequency Event Outcome
Release as 100 mm hole size 5.00E-06 1.00 0.10 * Escalation effect (Fireball)
5.00E-07 Jet fire
0.4 1.40E-06 Flash fire over plant area
0.3 6.00E-07 Vapour Cloud Explosion
0.04 2.00E-07 Flash fire full extent
1.80E-06 Unignited release
Release
Frequency
(per year)
Detection &
Shutdown
Failure
Immediate
Ignition
Escalation Delayed
Ignition (1)
Explosion
Probability
Delayed
Ignition (2)
Event Outcome Frequency Event Outcome
Release as Line Rupture 2.50E-06 1.00 0.10 * Escalation effect (Fireball)
2.50E-07 Fireball
0.4 7.00E-07 Flash fire over plant area
0.3 3.00E-07 Vapour Cloud Explosion
0.04 1.00E-07 Flash fire full extent
9.00E-07 Unignited release
Note *: The escalation effect probability is estimated based on the location of release scenario and target equipment, as well as the associated consequence impact distance and duration.
As such, the escalation probability for each hazardous scenario regardless different hole size and location are assumed as 1/6, and it is only applied if separation distance between release scenario and target equipment is
within the associated consequence impact distance.

Hazardous Section NGRS_23
Release
Frequency
(per year)
Detection &
Shutdown
Failure
Immediate
Ignition
Escalation Delayed
Ignition (1)
Explosion
Probability
Delayed
Ignition (2)
Event Outcome Frequency Event Outcome
Release as 10 mm hole size 1.50E-05 1.00 0.02 * Escalation effect (Fireball)
3.00E-07 Jet fire
0.09 1.19E-06 Flash fire over plant area
0.12 1.62E-07 Vapour Cloud Explosion
0.01 1.50E-07 Flash fire full extent
1.29E-05 Unignited release
Release
Frequency
(per year)
Detection &
Shutdown
Failure
Immediate
Ignition
Escalation Delayed
Ignition (1)
Explosion
Probability
Delayed
Ignition (2)
Event Outcome Frequency Event Outcome
Release as 25 mm hole size 1.50E-05 1.00 0.02 * Escalation effect (Fireball)
3.00E-07 Jet fire
0.09 1.19E-06 Flash fire over plant area
0.12 1.62E-07 Vapour Cloud Explosion
0.01 1.50E-07 Flash fire full extent
1.29E-05 Unignited release
Release
Frequency
(per year)
Detection &
Shutdown
Failure
Immediate
Ignition
Escalation Delayed
Ignition (1)
Explosion
Probability
Delayed
Ignition (2)
Event Outcome Frequency Event Outcome
Release as 50 mm hole size 5.00E-06 1.00 0.02 * Escalation effect (Fireball)
1.00E-07 Jet fire
0.09 3.96E-07 Flash fire over plant area
0.12 5.40E-08 Vapour Cloud Explosion
0.01 5.00E-08 Flash fire full extent
4.30E-06 Unignited release
Release
Frequency
(per year)
Detection &
Shutdown
Failure
Immediate
Ignition
Escalation Delayed
Ignition (1)
Explosion
Probability
Delayed
Ignition (2)
Event Outcome Frequency Event Outcome
Release as 100 mm hole size 5.00E-06 1.00 0.10 * Escalation effect (Fireball)
5.00E-07 Jet fire
0.4 1.40E-06 Flash fire over plant area
0.3 6.00E-07 Vapour Cloud Explosion
0.04 2.00E-07 Flash fire full extent
1.80E-06 Unignited release
Release
Frequency
(per year)
Detection &
Shutdown
Failure
Immediate
Ignition
Escalation Delayed
Ignition (1)
Explosion
Probability
Delayed
Ignition (2)
Event Outcome Frequency Event Outcome
Release as Line Rupture 2.50E-06 1.00 0.10 * Escalation effect (Fireball)
2.50E-07 Fireball
0.4 7.00E-07 Flash fire over plant area
0.3 3.00E-07 Vapour Cloud Explosion
0.04 1.00E-07 Flash fire full extent
9.00E-07 Unignited release
Note *: The escalation effect probability is estimated based on the location of release scenario and target equipment, as well as the associated consequence impact distance and duration.
As such, the escalation probability for each hazardous scenario regardless different hole size and location are assumed as 1/6, and it is only applied if separation distance between release scenario and target equipment is
within the associated consequence impact distance.

Hazardous Section NGRS_24
Release
Frequency
(per year)
Detection &
Shutdown
Failure
Immediate
Ignition
Escalation Delayed
Ignition (1)
Explosion
Probability
Delayed
Ignition (2)
Event Outcome Frequency Event Outcome
Release as 10 mm hole size 1.50E-05 1.00 0.02 * Escalation effect (Fireball)
3.00E-07 Jet fire
0.09 1.19E-06 Flash fire over plant area
0.12 1.62E-07 Vapour Cloud Explosion
0.01 1.50E-07 Flash fire full extent
1.29E-05 Unignited release
Release
Frequency
(per year)
Detection &
Shutdown
Failure
Immediate
Ignition
Escalation Delayed
Ignition (1)
Explosion
Probability
Delayed
Ignition (2)
Event Outcome Frequency Event Outcome
Release as 25 mm hole size 1.50E-05 1.00 0.02 * Escalation effect (Fireball)
3.00E-07 Jet fire
0.09 1.19E-06 Flash fire over plant area
0.12 1.62E-07 Vapour Cloud Explosion
0.01 1.50E-07 Flash fire full extent
1.29E-05 Unignited release
Release
Frequency
(per year)
Detection &
Shutdown
Failure
Immediate
Ignition
Escalation Delayed
Ignition (1)
Explosion
Probability
Delayed
Ignition (2)
Event Outcome Frequency Event Outcome
Release as 50 mm hole size 5.00E-06 1.00 0.02 * Escalation effect (Fireball)
1.00E-07 Jet fire
0.09 3.96E-07 Flash fire over plant area
0.12 5.40E-08 Vapour Cloud Explosion
0.01 5.00E-08 Flash fire full extent
4.30E-06 Unignited release
Release
Frequency
(per year)
Detection &
Shutdown
Failure
Immediate
Ignition
Escalation Delayed
Ignition (1)
Explosion
Probability
Delayed
Ignition (2)
Event Outcome Frequency Event Outcome
Release as 100 mm hole size 5.00E-06 1.00 0.10 * Escalation effect (Fireball)
5.00E-07 Jet fire
0.4 1.40E-06 Flash fire over plant area
0.3 6.00E-07 Vapour Cloud Explosion
0.04 2.00E-07 Flash fire full extent
1.80E-06 Unignited release
Release
Frequency
(per year)
Detection &
Shutdown
Failure
Immediate
Ignition
Escalation Delayed
Ignition (1)
Explosion
Probability
Delayed
Ignition (2)
Event Outcome Frequency Event Outcome
Release as Line Rupture 2.50E-06 1.00 0.10 * Escalation effect (Fireball)
2.50E-07 Fireball
0.4 7.00E-07 Flash fire over plant area
0.3 3.00E-07 Vapour Cloud Explosion
0.04 1.00E-07 Flash fire full extent
9.00E-07 Unignited release
Note *: The escalation effect probability is estimated based on the location of release scenario and target equipment, as well as the associated consequence impact distance and duration.
As such, the escalation probability for each hazardous scenario regardless different hole size and location are assumed as 1/6, and it is only applied if separation distance between release scenario and target equipment is
within the associated consequence impact distance.

Hazardous Section NGRS_25
Release
Frequency
(per year)
Detection &
Shutdown
Failure
Immediate
Ignition
Escalation Delayed
Ignition (1)
Explosion
Probability
Delayed
Ignition (2)
Event Outcome Frequency Event Outcome
Release as 10 mm hole size 1.50E-05 1.00 0.02 * Escalation effect (Fireball)
3.00E-07 Jet fire
0.09 1.19E-06 Flash fire over plant area
0.12 1.62E-07 Vapour Cloud Explosion
0.01 1.50E-07 Flash fire full extent
1.29E-05 Unignited release
Release
Frequency
(per year)
Detection &
Shutdown
Failure
Immediate
Ignition
Escalation Delayed
Ignition (1)
Explosion
Probability
Delayed
Ignition (2)
Event Outcome Frequency Event Outcome
Release as 25 mm hole size 1.50E-05 1.00 0.02 * Escalation effect (Fireball)
3.00E-07 Jet fire
0.09 1.19E-06 Flash fire over plant area
0.12 1.62E-07 Vapour Cloud Explosion
0.01 1.50E-07 Flash fire full extent
1.29E-05 Unignited release
Release
Frequency
(per year)
Detection &
Shutdown
Failure
Immediate
Ignition
Escalation Delayed
Ignition (1)
Explosion
Probability
Delayed
Ignition (2)
Event Outcome Frequency Event Outcome
Release as 50 mm hole size 5.00E-06 1.00 0.02 * Escalation effect (Fireball)
1.00E-07 Jet fire
0.09 3.96E-07 Flash fire over plant area
0.12 5.40E-08 Vapour Cloud Explosion
0.01 5.00E-08 Flash fire full extent
4.30E-06 Unignited release
Release
Frequency
(per year)
Detection &
Shutdown
Failure
Immediate
Ignition
Escalation Delayed
Ignition (1)
Explosion
Probability
Delayed
Ignition (2)
Event Outcome Frequency Event Outcome
Release as 100 mm hole size 5.00E-06 1.00 0.10 * Escalation effect (Fireball)
5.00E-07 Jet fire
0.4 1.40E-06 Flash fire over plant area
0.3 6.00E-07 Vapour Cloud Explosion
0.04 2.00E-07 Flash fire full extent
1.80E-06 Unignited release
Release
Frequency
(per year)
Detection &
Shutdown
Failure
Immediate
Ignition
Escalation Delayed
Ignition (1)
Explosion
Probability
Delayed
Ignition (2)
Event Outcome Frequency Event Outcome
Release as Line Rupture 2.50E-06 1.00 0.10 * Escalation effect (Fireball)
2.50E-07 Fireball
0.4 7.00E-07 Flash fire over plant area
0.3 3.00E-07 Vapour Cloud Explosion
0.04 1.00E-07 Flash fire full extent
9.00E-07 Unignited release
Note *: The escalation effect probability is estimated based on the location of release scenario and target equipment, as well as the associated consequence impact distance and duration.
As such, the escalation probability for each hazardous scenario regardless different hole size and location are assumed as 1/6, and it is only applied if separation distance between release scenario and target equipment is
within the associated consequence impact distance.

Hazardous Section NGRS_26
Release
Frequency
(per year)
Detection &
Shutdown
Failure
Immediate
Ignition
Escalation Delayed
Ignition (1)
Explosion
Probability
Delayed
Ignition (2)
Event Outcome Frequency Event Outcome
Release as 10 mm hole size 1.50E-05 1.00 0.02 * Escalation effect (Fireball)
3.00E-07 Jet fire
0.09 1.30E-06 Flash fire over plant area
0.04 5.40E-08 Vapour Cloud Explosion
0.01 1.50E-07 Flash fire full extent
1.29E-05 Unignited release
Release
Frequency
(per year)
Detection &
Shutdown
Failure
Immediate
Ignition
Escalation Delayed
Ignition (1)
Explosion
Probability
Delayed
Ignition (2)
Event Outcome Frequency Event Outcome
Release as 25 mm hole size 1.50E-05 1.00 0.02 * Escalation effect (Fireball)
3.00E-07 Jet fire
0.09 1.19E-06 Flash fire over plant area
0.12 1.62E-07 Vapour Cloud Explosion
0.01 1.50E-07 Flash fire full extent
1.29E-05 Unignited release
Release
Frequency
(per year)
Detection &
Shutdown
Failure
Immediate
Ignition
Escalation Delayed
Ignition (1)
Explosion
Probability
Delayed
Ignition (2)
Event Outcome Frequency Event Outcome
Release as 50 mm hole size 5.00E-06 1.00 0.02 * Escalation effect (Fireball)
1.00E-07 Jet fire
0.09 3.96E-07 Flash fire over plant area
0.12 5.40E-08 Vapour Cloud Explosion
0.01 5.00E-08 Flash fire full extent
4.30E-06 Unignited release
Release
Frequency
(per year)
Detection &
Shutdown
Failure
Immediate
Ignition
Escalation Delayed
Ignition (1)
Explosion
Probability
Delayed
Ignition (2)
Event Outcome Frequency Event Outcome
Release as 100 mm hole size 5.00E-06 1.00 0.10 * Escalation effect (Fireball)
5.00E-07 Jet fire
0.4 1.40E-06 Flash fire over plant area
0.3 6.00E-07 Vapour Cloud Explosion
0.04 2.00E-07 Flash fire full extent
1.80E-06 Unignited release
Release
Frequency
(per year)
Detection &
Shutdown
Failure
Immediate
Ignition
Escalation Delayed
Ignition (1)
Explosion
Probability
Delayed
Ignition (2)
Event Outcome Frequency Event Outcome
Release as Line Rupture 2.50E-06 1.00 0.10 * Escalation effect (Fireball)
2.50E-07 Fireball
0.4 7.00E-07 Flash fire over plant area
0.3 3.00E-07 Vapour Cloud Explosion
0.04 1.00E-07 Flash fire full extent
9.00E-07 Unignited release
Note *: The escalation effect probability is estimated based on the location of release scenario and target equipment, as well as the associated consequence impact distance and duration.
As such, the escalation probability for each hazardous scenario regardless different hole size and location are assumed as 1/6, and it is only applied if separation distance between release scenario and target equipment is
within the associated consequence impact distance.

Hazardous Section NGRS_27
Release
Frequency
(per year)
Detection &
Shutdown
Failure
Immediate
Ignition
Escalation Delayed
Ignition (1)
Explosion
Probability
Delayed
Ignition (2)
Event Outcome Frequency Event Outcome
Release as 10 mm hole size 1.50E-05 1.00 0.02 * Escalation effect (Fireball)
3.00E-07 Jet fire
0.09 1.19E-06 Flash fire over plant area
0.12 1.62E-07 Vapour Cloud Explosion
0.01 1.50E-07 Flash fire full extent
1.29E-05 Unignited release
Release
Frequency
(per year)
Detection &
Shutdown
Failure
Immediate
Ignition
Escalation Delayed
Ignition (1)
Explosion
Probability
Delayed
Ignition (2)
Event Outcome Frequency Event Outcome
Release as 25 mm hole size 1.50E-05 1.00 0.02 * Escalation effect (Fireball)
3.00E-07 Jet fire
0.09 1.19E-06 Flash fire over plant area
0.12 1.62E-07 Vapour Cloud Explosion
0.01 1.50E-07 Flash fire full extent
1.29E-05 Unignited release
Release
Frequency
(per year)
Detection &
Shutdown
Failure
Immediate
Ignition
Escalation Delayed
Ignition (1)
Explosion
Probability
Delayed
Ignition (2)
Event Outcome Frequency Event Outcome
Release as 50 mm hole size 5.00E-06 1.00 0.02 * Escalation effect (Fireball)
1.00E-07 Jet fire
0.09 3.96E-07 Flash fire over plant area
0.12 5.40E-08 Vapour Cloud Explosion
0.01 5.00E-08 Flash fire full extent
4.30E-06 Unignited release
Release
Frequency
(per year)
Detection &
Shutdown
Failure
Immediate
Ignition
Escalation Delayed
Ignition (1)
Explosion
Probability
Delayed
Ignition (2)
Event Outcome Frequency Event Outcome
Release as 100 mm hole size 5.00E-06 1.00 0.10 * Escalation effect (Fireball)
5.00E-07 Jet fire
0.4 1.40E-06 Flash fire over plant area
0.3 6.00E-07 Vapour Cloud Explosion
0.04 2.00E-07 Flash fire full extent
1.80E-06 Unignited release
Release
Frequency
(per year)
Detection &
Shutdown
Failure
Immediate
Ignition
Escalation Delayed
Ignition (1)
Explosion
Probability
Delayed
Ignition (2)
Event Outcome Frequency Event Outcome
Release as Line Rupture 2.50E-06 1.00 0.10 * Escalation effect (Fireball)
2.50E-07 Fireball
0.4 7.00E-07 Flash fire over plant area
0.3 3.00E-07 Vapour Cloud Explosion
0.04 1.00E-07 Flash fire full extent
9.00E-07 Unignited release
Note *: The escalation effect probability is estimated based on the location of release scenario and target equipment, as well as the associated consequence impact distance and duration.
As such, the escalation probability for each hazardous scenario regardless different hole size and location are assumed as 1/6, and it is only applied if separation distance between release scenario and target equipment is
within the associated consequence impact distance.

Hazardous Section NGRS_28
Release
Frequency
(per year)
Detection &
Shutdown
Failure
Immediate
Ignition
Escalation Delayed
Ignition (1)
Explosion
Probability
Delayed
Ignition (2)
Event Outcome Frequency Event Outcome
Release as 10 mm hole size 1.50E-05 1.00 0.02 * Escalation effect (Fireball)
3.00E-07 Jet fire
0.09 1.19E-06 Flash fire over plant area
0.12 1.62E-07 Vapour Cloud Explosion
0.01 1.50E-07 Flash fire full extent
1.29E-05 Unignited release
Release
Frequency
(per year)
Detection &
Shutdown
Failure
Immediate
Ignition
Escalation Delayed
Ignition (1)
Explosion
Probability
Delayed
Ignition (2)
Event Outcome Frequency Event Outcome
Release as 25 mm hole size 1.50E-05 1.00 0.02 * Escalation effect (Fireball)
3.00E-07 Jet fire
0.09 1.19E-06 Flash fire over plant area
0.12 1.62E-07 Vapour Cloud Explosion
0.01 1.50E-07 Flash fire full extent
1.29E-05 Unignited release
Release
Frequency
(per year)
Detection &
Shutdown
Failure
Immediate
Ignition
Escalation Delayed
Ignition (1)
Explosion
Probability
Delayed
Ignition (2)
Event Outcome Frequency Event Outcome
Release as 50 mm hole size 5.00E-06 1.00 0.02 * Escalation effect (Fireball)
1.00E-07 Jet fire
0.09 3.96E-07 Flash fire over plant area
0.12 5.40E-08 Vapour Cloud Explosion
0.01 5.00E-08 Flash fire full extent
4.30E-06 Unignited release
Release
Frequency
(per year)
Detection &
Shutdown
Failure
Immediate
Ignition
Escalation Delayed
Ignition (1)
Explosion
Probability
Delayed
Ignition (2)
Event Outcome Frequency Event Outcome
Release as 100 mm hole size 5.00E-06 1.00 0.10 * Escalation effect (Fireball)
5.00E-07 Jet fire
0.4 1.40E-06 Flash fire over plant area
0.3 6.00E-07 Vapour Cloud Explosion
0.04 2.00E-07 Flash fire full extent
1.80E-06 Unignited release
Release
Frequency
(per year)
Detection &
Shutdown
Failure
Immediate
Ignition
Escalation Delayed
Ignition (1)
Explosion
Probability
Delayed
Ignition (2)
Event Outcome Frequency Event Outcome
Release as Line Rupture 2.50E-06 1.00 0.10 * Escalation effect (Fireball)
2.50E-07 Fireball
0.4 7.00E-07 Flash fire over plant area
0.3 3.00E-07 Vapour Cloud Explosion
0.04 1.00E-07 Flash fire full extent
9.00E-07 Unignited release
Note *: The escalation effect probability is estimated based on the location of release scenario and target equipment, as well as the associated consequence impact distance and duration.
As such, the escalation probability for each hazardous scenario regardless different hole size and location are assumed as 1/6, and it is only applied if separation distance between release scenario and target equipment is
within the associated consequence impact distance.

Hazardous Section NGRS_29
Release
Frequency
(per year)
Detection &
Shutdown
Failure
Immediate
Ignition
Escalation Delayed
Ignition (1)
Explosion
Probability
Delayed
Ignition (2)
Event Outcome Frequency Event Outcome
Release as 10 mm hole size 1.50E-05 1.00 0.02 * Escalation effect (Fireball)
3.00E-07 Jet fire
0.09 1.19E-06 Flash fire over plant area
0.12 1.62E-07 Vapour Cloud Explosion
0.01 1.50E-07 Flash fire full extent
1.29E-05 Unignited release
Release
Frequency
(per year)
Detection &
Shutdown
Failure
Immediate
Ignition
Escalation Delayed
Ignition (1)
Explosion
Probability
Delayed
Ignition (2)
Event Outcome Frequency Event Outcome
Release as 25 mm hole size 1.50E-05 1.00 0.02 * Escalation effect (Fireball)
3.00E-07 Jet fire
0.09 1.19E-06 Flash fire over plant area
0.12 1.62E-07 Vapour Cloud Explosion
0.01 1.50E-07 Flash fire full extent
1.29E-05 Unignited release
Release
Frequency
(per year)
Detection &
Shutdown
Failure
Immediate
Ignition
Escalation Delayed
Ignition (1)
Explosion
Probability
Delayed
Ignition (2)
Event Outcome Frequency Event Outcome
Release as 50 mm hole size 5.00E-06 1.00 0.02 * Escalation effect (Fireball)
1.00E-07 Jet fire
0.09 3.96E-07 Flash fire over plant area
0.12 5.40E-08 Vapour Cloud Explosion
0.01 5.00E-08 Flash fire full extent
4.30E-06 Unignited release
Release
Frequency
(per year)
Detection &
Shutdown
Failure
Immediate
Ignition
Escalation Delayed
Ignition (1)
Explosion
Probability
Delayed
Ignition (2)
Event Outcome Frequency Event Outcome
Release as 100 mm hole size 5.00E-06 1.00 0.10 * Escalation effect (Fireball)
5.00E-07 Jet fire
0.4 1.40E-06 Flash fire over plant area
0.3 6.00E-07 Vapour Cloud Explosion
0.04 2.00E-07 Flash fire full extent
1.80E-06 Unignited release
Release
Frequency
(per year)
Detection &
Shutdown
Failure
Immediate
Ignition
Escalation Delayed
Ignition (1)
Explosion
Probability
Delayed
Ignition (2)
Event Outcome Frequency Event Outcome
Release as Line Rupture 2.50E-06 1.00 0.10 * Escalation effect (Fireball)
2.50E-07 Fireball
0.4 7.00E-07 Flash fire over plant area
0.3 3.00E-07 Vapour Cloud Explosion
0.04 1.00E-07 Flash fire full extent
9.00E-07 Unignited release
Note *: The escalation effect probability is estimated based on the location of release scenario and target equipment, as well as the associated consequence impact distance and duration.
As such, the escalation probability for each hazardous scenario regardless different hole size and location are assumed as 1/6, and it is only applied if separation distance between release scenario and target equipment is
within the associated consequence impact distance.

Hazardous Section NGRS_30
Release
Frequency
(per year)
Detection &
Shutdown
Failure
Immediate
Ignition
Escalation Delayed
Ignition (1)
Explosion
Probability
Delayed
Ignition (2)
Event Outcome Frequency Event Outcome
Release as 10 mm hole size 1.50E-05 1.00 0.02 * Escalation effect (Fireball)
3.00E-07 Jet fire
0.09 1.19E-06 Flash fire over plant area
0.12 1.62E-07 Vapour Cloud Explosion
0.01 1.50E-07 Flash fire full extent
1.29E-05 Unignited release
Release
Frequency
(per year)
Detection &
Shutdown
Failure
Immediate
Ignition
Escalation Delayed
Ignition (1)
Explosion
Probability
Delayed
Ignition (2)
Event Outcome Frequency Event Outcome
Release as 25 mm hole size 1.50E-05 1.00 0.02 * Escalation effect (Fireball)
3.00E-07 Jet fire
0.09 1.19E-06 Flash fire over plant area
0.12 1.62E-07 Vapour Cloud Explosion
0.01 1.50E-07 Flash fire full extent
1.29E-05 Unignited release
Release
Frequency
(per year)
Detection &
Shutdown
Failure
Immediate
Ignition
Escalation Delayed
Ignition (1)
Explosion
Probability
Delayed
Ignition (2)
Event Outcome Frequency Event Outcome
Release as 50 mm hole size 5.00E-06 1.00 0.02 * Escalation effect (Fireball)
1.00E-07 Jet fire
0.09 3.96E-07 Flash fire over plant area
0.12 5.40E-08 Vapour Cloud Explosion
0.01 5.00E-08 Flash fire full extent
4.30E-06 Unignited release
Release
Frequency
(per year)
Detection &
Shutdown
Failure
Immediate
Ignition
Escalation Delayed
Ignition (1)
Explosion
Probability
Delayed
Ignition (2)
Event Outcome Frequency Event Outcome
Release as 100 mm hole size 5.00E-06 1.00 0.10 * Escalation effect (Fireball)
5.00E-07 Jet fire
0.4 1.40E-06 Flash fire over plant area
0.3 6.00E-07 Vapour Cloud Explosion
0.04 2.00E-07 Flash fire full extent
1.80E-06 Unignited release
Release
Frequency
(per year)
Detection &
Shutdown
Failure
Immediate
Ignition
Escalation Delayed
Ignition (1)
Explosion
Probability
Delayed
Ignition (2)
Event Outcome Frequency Event Outcome
Release as Line Rupture 2.50E-06 1.00 0.10 * Escalation effect (Fireball)
2.50E-07 Fireball
0.4 7.00E-07 Flash fire over plant area
0.3 3.00E-07 Vapour Cloud Explosion
0.04 1.00E-07 Flash fire full extent
9.00E-07 Unignited release
Note *: The escalation effect probability is estimated based on the location of release scenario and target equipment, as well as the associated consequence impact distance and duration.
As such, the escalation probability for each hazardous scenario regardless different hole size and location are assumed as 1/6, and it is only applied if separation distance between release scenario and target equipment is
within the associated consequence impact distance.

Hazardous Section NGRS_31
Release
Frequency
(per year)
Detection &
Shutdown
Failure
Immediate
Ignition
Escalation Delayed
Ignition (1)
Explosion
Probability
Delayed
Ignition (2)
Event Outcome Frequency Event Outcome
Release as 10 mm hole size 1.50E-05 1.00 0.02 * Escalation effect (Fireball)
3.00E-07 Jet fire
0.09 1.19E-06 Flash fire over plant area
0.12 1.62E-07 Vapour Cloud Explosion
0.01 1.50E-07 Flash fire full extent
1.29E-05 Unignited release
Release
Frequency
(per year)
Detection &
Shutdown
Failure
Immediate
Ignition
Escalation Delayed
Ignition (1)
Explosion
Probability
Delayed
Ignition (2)
Event Outcome Frequency Event Outcome
Release as 25 mm hole size 1.50E-05 1.00 0.02 * Escalation effect (Fireball)
3.00E-07 Jet fire
0.09 1.19E-06 Flash fire over plant area
0.12 1.62E-07 Vapour Cloud Explosion
0.01 1.50E-07 Flash fire full extent
1.29E-05 Unignited release
Release
Frequency
(per year)
Detection &
Shutdown
Failure
Immediate
Ignition
Escalation Delayed
Ignition (1)
Explosion
Probability
Delayed
Ignition (2)
Event Outcome Frequency Event Outcome
Release as 50 mm hole size 5.00E-06 1.00 0.02 * Escalation effect (Fireball)
1.00E-07 Jet fire
0.09 3.96E-07 Flash fire over plant area
0.12 5.40E-08 Vapour Cloud Explosion
0.01 5.00E-08 Flash fire full extent
4.30E-06 Unignited release
Release
Frequency
(per year)
Detection &
Shutdown
Failure
Immediate
Ignition
Escalation Delayed
Ignition (1)
Explosion
Probability
Delayed
Ignition (2)
Event Outcome Frequency Event Outcome
Release as 100 mm hole size 5.00E-06 1.00 0.10 * Escalation effect (Fireball)
5.00E-07 Jet fire
0.4 1.40E-06 Flash fire over plant area
0.3 6.00E-07 Vapour Cloud Explosion
0.04 2.00E-07 Flash fire full extent
1.80E-06 Unignited release
Release
Frequency
(per year)
Detection &
Shutdown
Failure
Immediate
Ignition
Escalation Delayed
Ignition (1)
Explosion
Probability
Delayed
Ignition (2)
Event Outcome Frequency Event Outcome
Release as Line Rupture 2.50E-06 1.00 0.10 * Escalation effect (Fireball)
2.50E-07 Fireball
0.4 7.00E-07 Flash fire over plant area
0.3 3.00E-07 Vapour Cloud Explosion
0.04 1.00E-07 Flash fire full extent
9.00E-07 Unignited release
Note *: The escalation effect probability is estimated based on the location of release scenario and target equipment, as well as the associated consequence impact distance and duration.
As such, the escalation probability for each hazardous scenario regardless different hole size and location are assumed as 1/6, and it is only applied if separation distance between release scenario and target equipment is
within the associated consequence impact distance.

Hazardous Section NGRS_32
Release
Frequency
(per year)
Detection &
Shutdown
Failure
Immediate
Ignition
Escalation Delayed
Ignition (1)
Explosion
Probability
Delayed
Ignition (2)
Event Outcome Frequency Event Outcome
Release as 10 mm hole size 1.50E-05 1.00 0.02 * Escalation effect (Fireball)
3.00E-07 Jet fire
0.09 1.30E-06 Flash fire over plant area
0.04 5.40E-08 Vapour Cloud Explosion
0.01 1.50E-07 Flash fire full extent
1.29E-05 Unignited release
Release
Frequency
(per year)
Detection &
Shutdown
Failure
Immediate
Ignition
Escalation Delayed
Ignition (1)
Explosion
Probability
Delayed
Ignition (2)
Event Outcome Frequency Event Outcome
Release as 25 mm hole size 1.50E-05 1.00 0.02 * Escalation effect (Fireball)
3.00E-07 Jet fire
0.09 1.19E-06 Flash fire over plant area
0.12 1.62E-07 Vapour Cloud Explosion
0.01 1.50E-07 Flash fire full extent
1.29E-05 Unignited release
Release
Frequency
(per year)
Detection &
Shutdown
Failure
Immediate
Ignition
Escalation Delayed
Ignition (1)
Explosion
Probability
Delayed
Ignition (2)
Event Outcome Frequency Event Outcome
Release as 50 mm hole size 5.00E-06 1.00 0.02 * Escalation effect (Fireball)
1.00E-07 Jet fire
0.09 3.96E-07 Flash fire over plant area
0.12 5.40E-08 Vapour Cloud Explosion
0.01 5.00E-08 Flash fire full extent
4.30E-06 Unignited release
Release
Frequency
(per year)
Detection &
Shutdown
Failure
Immediate
Ignition
Escalation Delayed
Ignition (1)
Explosion
Probability
Delayed
Ignition (2)
Event Outcome Frequency Event Outcome
Release as 100 mm hole size 5.00E-06 1.00 0.10 * Escalation effect (Fireball)
5.00E-07 Jet fire
0.4 1.40E-06 Flash fire over plant area
0.3 6.00E-07 Vapour Cloud Explosion
0.04 2.00E-07 Flash fire full extent
1.80E-06 Unignited release
Release
Frequency
(per year)
Detection &
Shutdown
Failure
Immediate
Ignition
Escalation Delayed
Ignition (1)
Explosion
Probability
Delayed
Ignition (2)
Event Outcome Frequency Event Outcome
Release as Line Rupture 2.50E-06 1.00 0.10 * Escalation effect (Fireball)
2.50E-07 Fireball
0.4 7.00E-07 Flash fire over plant area
0.3 3.00E-07 Vapour Cloud Explosion
0.04 1.00E-07 Flash fire full extent
9.00E-07 Unignited release
Note *: The escalation effect probability is estimated based on the location of release scenario and target equipment, as well as the associated consequence impact distance and duration.
As such, the escalation probability for each hazardous scenario regardless different hole size and location are assumed as 1/6, and it is only applied if separation distance between release scenario and target equipment is
within the associated consequence impact distance.

Hazardous Section NGRS_33
Release
Frequency
(per year)
Detection &
Shutdown
Failure
Immediate
Ignition
Escalation Delayed
Ignition (1)
Explosion
Probability
Delayed
Ignition (2)
Event Outcome Frequency Event Outcome
Release as 10 mm hole size 1.50E-05 1.00 0.02 * Escalation effect (Fireball)
3.00E-07 Jet fire
0.09 1.19E-06 Flash fire over plant area
0.12 1.62E-07 Vapour Cloud Explosion
0.01 1.50E-07 Flash fire full extent
1.29E-05 Unignited release
Release
Frequency
(per year)
Detection &
Shutdown
Failure
Immediate
Ignition
Escalation Delayed
Ignition (1)
Explosion
Probability
Delayed
Ignition (2)
Event Outcome Frequency Event Outcome
Release as 25 mm hole size 1.50E-05 1.00 0.02 * Escalation effect (Fireball)
3.00E-07 Jet fire
0.09 1.19E-06 Flash fire over plant area
0.12 1.62E-07 Vapour Cloud Explosion
0.01 1.50E-07 Flash fire full extent
1.29E-05 Unignited release
Release
Frequency
(per year)
Detection &
Shutdown
Failure
Immediate
Ignition
Escalation Delayed
Ignition (1)
Explosion
Probability
Delayed
Ignition (2)
Event Outcome Frequency Event Outcome
Release as 50 mm hole size 5.00E-06 1.00 0.02 * Escalation effect (Fireball)
1.00E-07 Jet fire
0.09 3.96E-07 Flash fire over plant area
0.12 5.40E-08 Vapour Cloud Explosion
0.01 5.00E-08 Flash fire full extent
4.30E-06 Unignited release
Release
Frequency
(per year)
Detection &
Shutdown
Failure
Immediate
Ignition
Escalation Delayed
Ignition (1)
Explosion
Probability
Delayed
Ignition (2)
Event Outcome Frequency Event Outcome
Release as 100 mm hole size 5.00E-06 1.00 0.10 * Escalation effect (Fireball)
5.00E-07 Jet fire
0.4 1.40E-06 Flash fire over plant area
0.3 6.00E-07 Vapour Cloud Explosion
0.04 2.00E-07 Flash fire full extent
1.80E-06 Unignited release
Release
Frequency
(per year)
Detection &
Shutdown
Failure
Immediate
Ignition
Escalation Delayed
Ignition (1)
Explosion
Probability
Delayed
Ignition (2)
Event Outcome Frequency Event Outcome
Release as Line Rupture 2.50E-06 1.00 0.10 * Escalation effect (Fireball)
2.50E-07 Fireball
0.4 7.00E-07 Flash fire over plant area
0.3 3.00E-07 Vapour Cloud Explosion
0.04 1.00E-07 Flash fire full extent
9.00E-07 Unignited release
Note *: The escalation effect probability is estimated based on the location of release scenario and target equipment, as well as the associated consequence impact distance and duration.
As such, the escalation probability for each hazardous scenario regardless different hole size and location are assumed as 1/6, and it is only applied if separation distance between release scenario and target equipment is
within the associated consequence impact distance.

Hazardous Section NGRS_34
Release
Frequency
(per year)
Detection &
Shutdown
Failure
Immediate
Ignition
Escalation Delayed
Ignition (1)
Explosion
Probability
Delayed
Ignition (2)
Event Outcome Frequency Event Outcome
Release as 10 mm hole size 1.50E-05 1.00 0.02 * Escalation effect (Fireball)
3.00E-07 Jet fire
0.09 1.19E-06 Flash fire over plant area
0.12 1.62E-07 Vapour Cloud Explosion
0.01 1.50E-07 Flash fire full extent
1.29E-05 Unignited release
Release
Frequency
(per year)
Detection &
Shutdown
Failure
Immediate
Ignition
Escalation Delayed
Ignition (1)
Explosion
Probability
Delayed
Ignition (2)
Event Outcome Frequency Event Outcome
Release as 25 mm hole size 1.50E-05 1.00 0.02 * Escalation effect (Fireball)
3.00E-07 Jet fire
0.09 1.19E-06 Flash fire over plant area
0.12 1.62E-07 Vapour Cloud Explosion
0.01 1.50E-07 Flash fire full extent
1.29E-05 Unignited release
Release
Frequency
(per year)
Detection &
Shutdown
Failure
Immediate
Ignition
Escalation Delayed
Ignition (1)
Explosion
Probability
Delayed
Ignition (2)
Event Outcome Frequency Event Outcome
Release as 50 mm hole size 5.00E-06 1.00 0.02 * Escalation effect (Fireball)
1.00E-07 Jet fire
0.09 3.96E-07 Flash fire over plant area
0.12 5.40E-08 Vapour Cloud Explosion
0.01 5.00E-08 Flash fire full extent
4.30E-06 Unignited release
Release
Frequency
(per year)
Detection &
Shutdown
Failure
Immediate
Ignition
Escalation Delayed
Ignition (1)
Explosion
Probability
Delayed
Ignition (2)
Event Outcome Frequency Event Outcome
Release as 100 mm hole size 5.00E-06 1.00 0.10 * Escalation effect (Fireball)
5.00E-07 Jet fire
0.4 1.40E-06 Flash fire over plant area
0.3 6.00E-07 Vapour Cloud Explosion
0.04 2.00E-07 Flash fire full extent
1.80E-06 Unignited release
Release
Frequency
(per year)
Detection &
Shutdown
Failure
Immediate
Ignition
Escalation Delayed
Ignition (1)
Explosion
Probability
Delayed
Ignition (2)
Event Outcome Frequency Event Outcome
Release as Line Rupture 2.50E-06 1.00 0.10 * Escalation effect (Fireball)
2.50E-07 Fireball
0.4 7.00E-07 Flash fire over plant area
0.3 3.00E-07 Vapour Cloud Explosion
0.04 1.00E-07 Flash fire full extent
9.00E-07 Unignited release
Note *: The escalation effect probability is estimated based on the location of release scenario and target equipment, as well as the associated consequence impact distance and duration.
As such, the escalation probability for each hazardous scenario regardless different hole size and location are assumed as 1/6, and it is only applied if separation distance between release scenario and target equipment is
within the associated consequence impact distance.

Hazardous Section NGRS_35
Release
Frequency
(per year)
Detection &
Shutdown
Failure
Immediate
Ignition
Escalation Delayed
Ignition (1)
Explosion
Probability
Delayed
Ignition (2)
Event Outcome Frequency Event Outcome
Release as 10 mm hole size 1.50E-05 1.00 0.02 * Escalation effect (Fireball)
3.00E-07 Jet fire
0.09 1.19E-06 Flash fire over plant area
0.12 1.62E-07 Vapour Cloud Explosion
0.01 1.50E-07 Flash fire full extent
1.29E-05 Unignited release
Release
Frequency
(per year)
Detection &
Shutdown
Failure
Immediate
Ignition
Escalation Delayed
Ignition (1)
Explosion
Probability
Delayed
Ignition (2)
Event Outcome Frequency Event Outcome
Release as 25 mm hole size 1.50E-05 1.00 0.02 * Escalation effect (Fireball)
3.00E-07 Jet fire
0.09 1.19E-06 Flash fire over plant area
0.12 1.62E-07 Vapour Cloud Explosion
0.01 1.50E-07 Flash fire full extent
1.29E-05 Unignited release
Release
Frequency
(per year)
Detection &
Shutdown
Failure
Immediate
Ignition
Escalation Delayed
Ignition (1)
Explosion
Probability
Delayed
Ignition (2)
Event Outcome Frequency Event Outcome
Release as 50 mm hole size 5.00E-06 1.00 0.02 * Escalation effect (Fireball)
1.00E-07 Jet fire
0.09 3.96E-07 Flash fire over plant area
0.12 5.40E-08 Vapour Cloud Explosion
0.01 5.00E-08 Flash fire full extent
4.30E-06 Unignited release
Release
Frequency
(per year)
Detection &
Shutdown
Failure
Immediate
Ignition
Escalation Delayed
Ignition (1)
Explosion
Probability
Delayed
Ignition (2)
Event Outcome Frequency Event Outcome
Release as 100 mm hole size 5.00E-06 1.00 0.10 * Escalation effect (Fireball)
5.00E-07 Jet fire
0.4 1.40E-06 Flash fire over plant area
0.3 6.00E-07 Vapour Cloud Explosion
0.04 2.00E-07 Flash fire full extent
1.80E-06 Unignited release
Release
Frequency
(per year)
Detection &
Shutdown
Failure
Immediate
Ignition
Escalation Delayed
Ignition (1)
Explosion
Probability
Delayed
Ignition (2)
Event Outcome Frequency Event Outcome
Release as Line Rupture 2.50E-06 1.00 0.10 * Escalation effect (Fireball)
2.50E-07 Fireball
0.4 7.00E-07 Flash fire over plant area
0.3 3.00E-07 Vapour Cloud Explosion
0.04 1.00E-07 Flash fire full extent
9.00E-07 Unignited release
Note *: The escalation effect probability is estimated based on the location of release scenario and target equipment, as well as the associated consequence impact distance and duration.
As such, the escalation probability for each hazardous scenario regardless different hole size and location are assumed as 1/6, and it is only applied if separation distance between release scenario and target equipment is
within the associated consequence impact distance.

Hazardous Section GRS_01
Release
Frequency
(per year)
Detection &
Shutdown
Failure
Immediate
Ignition
Escalation Delayed
Ignition (1)
Explosion
Probability
Delayed
Ignition (2)
Event Outcome Frequency Event Outcome
Release as 10 mm hole size 2.40E-05 1.00 0.02 * Escalation effect (Fireball)
4.80E-07 Jet fire
0.09 1.90E-06 Flash fire over plant area
0.12 2.59E-07 Vapour Cloud Explosion
0.01 2.40E-07 Flash fire full extent
2.06E-05 Unignited release
Release
Frequency
(per year)
Detection &
Shutdown
Failure
Immediate
Ignition
Escalation Delayed
Ignition (1)
Explosion
Probability
Delayed
Ignition (2)
Event Outcome Frequency Event Outcome
Release as 25 mm hole size 2.40E-05 1.00 0.02 * Escalation effect (Fireball)
4.80E-07 Jet fire
0.09 1.90E-06 Flash fire over plant area
0.12 2.59E-07 Vapour Cloud Explosion
0.01 2.40E-07 Flash fire full extent
2.06E-05 Unignited release
Release
Frequency
(per year)
Detection &
Shutdown
Failure
Immediate
Ignition
Escalation Delayed
Ignition (1)
Explosion
Probability
Delayed
Ignition (2)
Event Outcome Frequency Event Outcome
Release as 50 mm hole size 8.00E-06 1.00 0.02 * Escalation effect (Fireball)
1.60E-07 Jet fire
0.09 6.34E-07 Flash fire over plant area
0.12 8.64E-08 Vapour Cloud Explosion
0.01 8.00E-08 Flash fire full extent
6.88E-06 Unignited release
Release
Frequency
(per year)
Detection &
Shutdown
Failure
Immediate
Ignition
Escalation Delayed
Ignition (1)
Explosion
Probability
Delayed
Ignition (2)
Event Outcome Frequency Event Outcome
Release as 100 mm hole size 8.00E-06 1.00 0.10 * Escalation effect (Fireball)
8.00E-07 Jet fire
0.4 2.24E-06 Flash fire over plant area
0.3 9.60E-07 Vapour Cloud Explosion
0.04 2.00E-07 Flash fire full extent
3.20E-07 Unignited release
Release
Frequency
(per year)
Detection &
Shutdown
Failure
Immediate
Ignition
Escalation Delayed
Ignition (1)
Explosion
Probability
Delayed
Ignition (2)
Event Outcome Frequency Event Outcome
Release as Line Rupture 4.00E-06 1.00 0.10 * Escalation effect (Fireball)
4.00E-07 Fireball
0.4 1.12E-06 Flash fire over plant area
0.3 4.80E-07 Vapour Cloud Explosion
0.04 1.60E-07 Flash fire full extent
1.44E-06 Unignited release
Note *: The escalation effect probability is estimated based on the location of release scenario and target equipment, as well as the associated consequence impact distance and duration.
As such, the escalation probability for each hazardous scenario regardless different hole size and location are assumed as 1/6, and it is only applied if separation distance between release scenario and target equipment is
within the associated consequence impact distance.

Hazardous Section GRS_02
Release
Frequency
(per year)
Detection &
Shutdown
Failure
Immediate
Ignition
Escalation Delayed
Ignition (1)
Explosion
Probability
Delayed
Ignition (2)
Event Outcome Frequency Event Outcome
Release as 10 mm hole size 1.20E-05 1.00 0.02 * Escalation effect (Fireball)
2.40E-07 Jet fire
0.09 9.50E-07 Flash fire over plant area
0.12 1.30E-07 Vapour Cloud Explosion
0.01 1.20E-07 Flash fire full extent
1.03E-05 Unignited release
Release
Frequency
(per year)
Detection &
Shutdown
Failure
Immediate
Ignition
Escalation Delayed
Ignition (1)
Explosion
Probability
Delayed
Ignition (2)
Event Outcome Frequency Event Outcome
Release as 25 mm hole size 1.20E-05 1.00 0.02 * Escalation effect (Fireball)
2.40E-07 Jet fire
0.09 9.50E-07 Flash fire over plant area
0.12 1.30E-07 Vapour Cloud Explosion
0.01 1.20E-07 Flash fire full extent
1.03E-05 Unignited release
Release
Frequency
(per year)
Detection &
Shutdown
Failure
Immediate
Ignition
Escalation Delayed
Ignition (1)
Explosion
Probability
Delayed
Ignition (2)
Event Outcome Frequency Event Outcome
Release as 50 mm hole size 4.00E-06 1.00 0.02 * Escalation effect (Fireball)
8.00E-08 Jet fire
0.09 3.17E-07 Flash fire over plant area
0.12 4.32E-08 Vapour Cloud Explosion
0.01 4.00E-08 Flash fire full extent
3.44E-06 Unignited release
Release
Frequency
(per year)
Detection &
Shutdown
Failure
Immediate
Ignition
Escalation Delayed
Ignition (1)
Explosion
Probability
Delayed
Ignition (2)
Event Outcome Frequency Event Outcome
Release as 100 mm hole size 4.00E-06 1.00 0.10 * Escalation effect (Fireball)
4.00E-07 Jet fire
0.4 1.12E-06 Flash fire over plant area
0.3 4.80E-07 Vapour Cloud Explosion
0.04 1.60E-07 Flash fire full extent
1.44E-06 Unignited release
Release
Frequency
(per year)
Detection &
Shutdown
Failure
Immediate
Ignition
Escalation Delayed
Ignition (1)
Explosion
Probability
Delayed
Ignition (2)
Event Outcome Frequency Event Outcome
Release as Line Rupture 2.00E-06 1.00 0.10 * Escalation effect (Fireball)
2.00E-07 Fireball
0.4 5.60E-07 Flash fire over plant area
0.3 2.40E-07 Vapour Cloud Explosion
0.04 8.00E-08 Flash fire full extent
7.20E-07 Unignited release
Note *: The escalation effect probability is estimated based on the location of release scenario and target equipment, as well as the associated consequence impact distance and duration.
As such, the escalation probability for each hazardous scenario regardless different hole size and location are assumed as 1/6, and it is only applied if separation distance between release scenario and target equipment is
within the associated consequence impact distance.

Hazardous Section GRS_03
Release
Frequency
(per year)
Detection &
Shutdown
Failure
Immediate
Ignition
Escalation Delayed
Ignition (1)
Explosion
Probability
Delayed
Ignition (2)
Event Outcome Frequency Event Outcome
Release as 10 mm hole size 9.00E-06 1.00 0.02 * Escalation effect (Fireball)
1.80E-07 Jet fire
0.09 7.13E-07 Flash fire over plant area
0.12 9.72E-08 Vapour Cloud Explosion
0.01 9.00E-08 Flash fire full extent
7.74E-06 Unignited release
Release
Frequency
(per year)
Detection &
Shutdown
Failure
Immediate
Ignition
Escalation Delayed
Ignition (1)
Explosion
Probability
Delayed
Ignition (2)
Event Outcome Frequency Event Outcome
Release as 25 mm hole size 9.00E-06 1.00 0.02 * Escalation effect (Fireball)
1.80E-07 Jet fire
0.09 7.13E-07 Flash fire over plant area
0.12 9.72E-08 Vapour Cloud Explosion
0.01 9.00E-08 Flash fire full extent
7.74E-06 Unignited release
Release
Frequency
(per year)
Detection &
Shutdown
Failure
Immediate
Ignition
Escalation Delayed
Ignition (1)
Explosion
Probability
Delayed
Ignition (2)
Event Outcome Frequency Event Outcome
Release as 50 mm hole size 3.00E-06 1.00 0.02 * Escalation effect (Fireball)
6.00E-08 Jet fire
0.09 2.38E-07 Flash fire over plant area
0.12 3.24E-08 Vapour Cloud Explosion
0.01 3.00E-08 Flash fire full extent
2.58E-06 Unignited release
Release
Frequency
(per year)
Detection &
Shutdown
Failure
Immediate
Ignition
Escalation Delayed
Ignition (1)
Explosion
Probability
Delayed
Ignition (2)
Event Outcome Frequency Event Outcome
Release as 100 mm hole size 3.00E-06 1.00 0.10 * Escalation effect (Fireball)
3.00E-07 Jet fire
0.4 8.40E-07 Flash fire over plant area
0.3 3.60E-07 Vapour Cloud Explosion
0.04 1.20E-07 Flash fire full extent
1.08E-06 Unignited release
Release
Frequency
(per year)
Detection &
Shutdown
Failure
Immediate
Ignition
Escalation Delayed
Ignition (1)
Explosion
Probability
Delayed
Ignition (2)
Event Outcome Frequency Event Outcome
Release as Line Rupture 1.50E-06 1.00 0.10 * Escalation effect (Fireball)
1.50E-07 Fireball
0.4 4.20E-07 Flash fire over plant area
0.3 1.80E-07 Vapour Cloud Explosion
0.04 6.00E-08 Flash fire full extent
5.40E-07 Unignited release
Note *: The escalation effect probability is estimated based on the location of release scenario and target equipment, as well as the associated consequence impact distance and duration.
As such, the escalation probability for each hazardous scenario regardless different hole size and location are assumed as 1/6, and it is only applied if separation distance between release scenario and target equipment is
within the associated consequence impact distance.
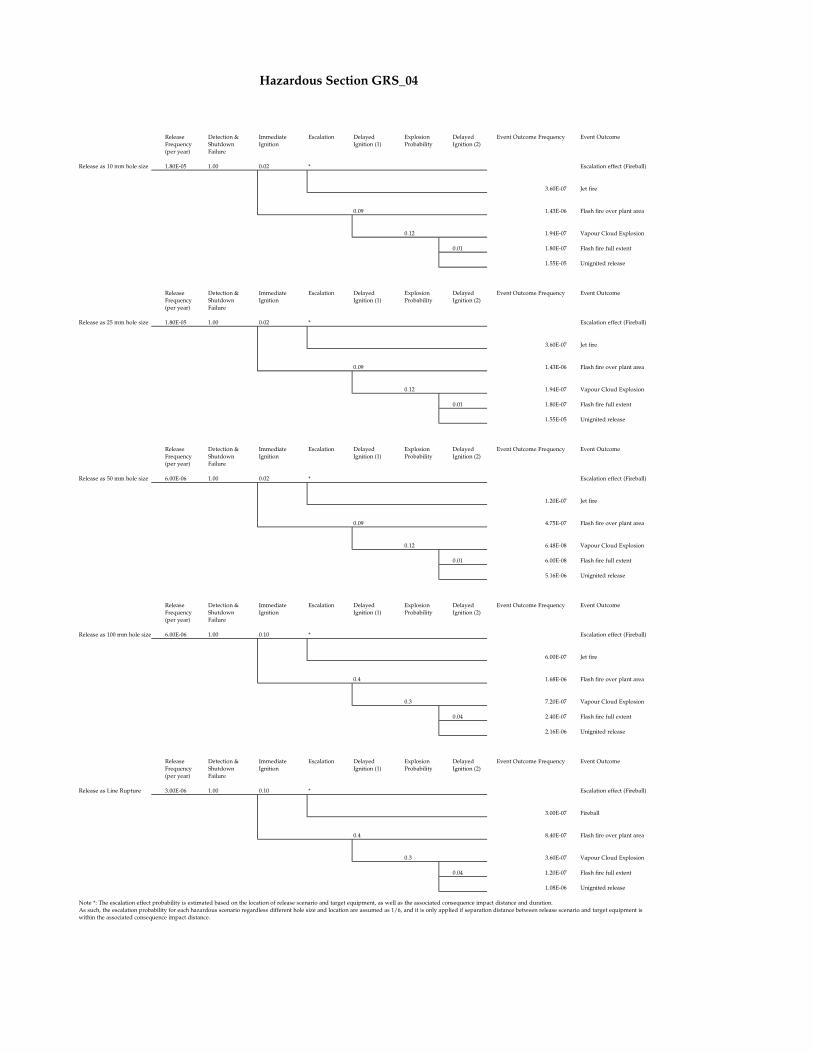
Hazardous Section GRS_04
Release
Frequency
(per year)
Detection &
Shutdown
Failure
Immediate
Ignition
Escalation Delayed
Ignition (1)
Explosion
Probability
Delayed
Ignition (2)
Event Outcome Frequency Event Outcome
Release as 10 mm hole size 1.80E-05 1.00 0.02 * Escalation effect (Fireball)
3.60E-07 Jet fire
0.09 1.43E-06 Flash fire over plant area
0.12 1.94E-07 Vapour Cloud Explosion
0.01 1.80E-07 Flash fire full extent
1.55E-05 Unignited release
Release
Frequency
(per year)
Detection &
Shutdown
Failure
Immediate
Ignition
Escalation Delayed
Ignition (1)
Explosion
Probability
Delayed
Ignition (2)
Event Outcome Frequency Event Outcome
Release as 25 mm hole size 1.80E-05 1.00 0.02 * Escalation effect (Fireball)
3.60E-07 Jet fire
0.09 1.43E-06 Flash fire over plant area
0.12 1.94E-07 Vapour Cloud Explosion
0.01 1.80E-07 Flash fire full extent
1.55E-05 Unignited release
Release
Frequency
(per year)
Detection &
Shutdown
Failure
Immediate
Ignition
Escalation Delayed
Ignition (1)
Explosion
Probability
Delayed
Ignition (2)
Event Outcome Frequency Event Outcome
Release as 50 mm hole size 6.00E-06 1.00 0.02 * Escalation effect (Fireball)
1.20E-07 Jet fire
0.09 4.75E-07 Flash fire over plant area
0.12 6.48E-08 Vapour Cloud Explosion
0.01 6.00E-08 Flash fire full extent
5.16E-06 Unignited release
Release
Frequency
(per year)
Detection &
Shutdown
Failure
Immediate
Ignition
Escalation Delayed
Ignition (1)
Explosion
Probability
Delayed
Ignition (2)
Event Outcome Frequency Event Outcome
Release as 100 mm hole size 6.00E-06 1.00 0.10 * Escalation effect (Fireball)
6.00E-07 Jet fire
0.4 1.68E-06 Flash fire over plant area
0.3 7.20E-07 Vapour Cloud Explosion
0.04 2.40E-07 Flash fire full extent
2.16E-06 Unignited release
Release
Frequency
(per year)
Detection &
Shutdown
Failure
Immediate
Ignition
Escalation Delayed
Ignition (1)
Explosion
Probability
Delayed
Ignition (2)
Event Outcome Frequency Event Outcome
Release as Line Rupture 3.00E-06 1.00 0.10 * Escalation effect (Fireball)
3.00E-07 Fireball
0.4 8.40E-07 Flash fire over plant area
0.3 3.60E-07 Vapour Cloud Explosion
0.04 1.20E-07 Flash fire full extent
1.08E-06 Unignited release
Note *: The escalation effect probability is estimated based on the location of release scenario and target equipment, as well as the associated consequence impact distance and duration.
As such, the escalation probability for each hazardous scenario regardless different hole size and location are assumed as 1/6, and it is only applied if separation distance between release scenario and target equipment is
within the associated consequence impact distance.

Hazardous Section GRS_05
Release
Frequency
(per year)
Detection &
Shutdown
Failure
Immediate
Ignition
Escalation Delayed
Ignition (1)
Explosion
Probability
Delayed
Ignition (2)
Event Outcome Frequency Event Outcome
Release as 10 mm hole size 1.35E-05 1.00 0.02 * Escalation effect (Fireball)
2.70E-07 Jet fire
0.09 1.17E-06 Flash fire over plant area
0.04 4.86E-08 Vapour Cloud Explosion
0.01 1.35E-07 Flash fire full extent
1.16E-05 Unignited release
Release
Frequency
(per year)
Detection &
Shutdown
Failure
Immediate
Ignition
Escalation Delayed
Ignition (1)
Explosion
Probability
Delayed
Ignition (2)
Event Outcome Frequency Event Outcome
Release as 25 mm hole size 1.35E-05 1.00 0.02 * Escalation effect (Fireball)
2.70E-07 Jet fire
0.09 1.07E-06 Flash fire over plant area
0.12 1.46E-07 Vapour Cloud Explosion
0.01 1.35E-07 Flash fire full extent
1.16E-05 Unignited release
Release
Frequency
(per year)
Detection &
Shutdown
Failure
Immediate
Ignition
Escalation Delayed
Ignition (1)
Explosion
Probability
Delayed
Ignition (2)
Event Outcome Frequency Event Outcome
Release as 50 mm hole size 4.50E-06 1.00 0.02 * Escalation effect (Fireball)
9.00E-08 Jet fire
0.09 3.56E-07 Flash fire over plant area
0.12 4.86E-08 Vapour Cloud Explosion
0.01 4.50E-08 Flash fire full extent
3.87E-06 Unignited release
Release
Frequency
(per year)
Detection &
Shutdown
Failure
Immediate
Ignition
Escalation Delayed
Ignition (1)
Explosion
Probability
Delayed
Ignition (2)
Event Outcome Frequency Event Outcome
Release as 100 mm hole size 4.50E-06 1.00 0.02 * Escalation effect (Fireball)
9.00E-08 Jet fire
0.09 3.56E-07 Flash fire over plant area
0.12 4.86E-08 Vapour Cloud Explosion
0.01 4.50E-08 Flash fire full extent
3.87E-06 Unignited release
Release
Frequency
(per year)
Detection &
Shutdown
Failure
Immediate
Ignition
Escalation Delayed
Ignition (1)
Explosion
Probability
Delayed
Ignition (2)
Event Outcome Frequency Event Outcome
Release as Line Rupture 2.25E-06 1.00 0.10 * Escalation effect (Fireball)
2.25E-07 Fireball
0.4 6.30E-07 Flash fire over plant area
0.3 2.70E-07 Vapour Cloud Explosion
0.04 9.00E-08 Flash fire full extent
8.10E-07 Unignited release
Note *: The escalation effect probability is estimated based on the location of release scenario and target equipment, as well as the associated consequence impact distance and duration.
As such, the escalation probability for each hazardous scenario regardless different hole size and location are assumed as 1/6, and it is only applied if separation distance between release scenario and target equipment is
within the associated consequence impact distance.

Hazardous Section GRS_06
Release
Frequency
(per year)
Detection &
Shutdown
Failure
Immediate
Ignition
Escalation Delayed
Ignition (1)
Explosion
Probability
Delayed
Ignition (2)
Event Outcome Frequency Event Outcome
Release as 10 mm hole size 1.80E-05 1.00 0.02 * Escalation effect (Fireball)
3.60E-07 Jet fire
0.09 1.43E-06 Flash fire over plant area
0.12 1.94E-07 Vapour Cloud Explosion
0.01 1.80E-07 Flash fire full extent
1.55E-05 Unignited release
Release
Frequency
(per year)
Detection &
Shutdown
Failure
Immediate
Ignition
Escalation Delayed
Ignition (1)
Explosion
Probability
Delayed
Ignition (2)
Event Outcome Frequency Event Outcome
Release as 25 mm hole size 1.80E-05 1.00 0.02 * Escalation effect (Fireball)
3.60E-07 Jet fire
0.09 1.43E-06 Flash fire over plant area
0.12 1.94E-07 Vapour Cloud Explosion
0.01 1.80E-07 Flash fire full extent
1.55E-05 Unignited release
Release
Frequency
(per year)
Detection &
Shutdown
Failure
Immediate
Ignition
Escalation Delayed
Ignition (1)
Explosion
Probability
Delayed
Ignition (2)
Event Outcome Frequency Event Outcome
Release as 50 mm hole size 6.00E-06 1.00 0.02 * Escalation effect (Fireball)
1.20E-07 Jet fire
0.09 4.75E-07 Flash fire over plant area
0.12 6.48E-08 Vapour Cloud Explosion
0.01 6.00E-08 Flash fire full extent
5.16E-06 Unignited release
Release
Frequency
(per year)
Detection &
Shutdown
Failure
Immediate
Ignition
Escalation Delayed
Ignition (1)
Explosion
Probability
Delayed
Ignition (2)
Event Outcome Frequency Event Outcome
Release as 100 mm hole size 6.00E-06 1.00 0.10 * Escalation effect (Fireball)
6.00E-07 Jet fire
0.4 1.68E-06 Flash fire over plant area
0.3 7.20E-07 Vapour Cloud Explosion
0.04 2.40E-07 Flash fire full extent
2.16E-06 Unignited release
Release
Frequency
(per year)
Detection &
Shutdown
Failure
Immediate
Ignition
Escalation Delayed
Ignition (1)
Explosion
Probability
Delayed
Ignition (2)
Event Outcome Frequency Event Outcome
Release as Line Rupture 1.80E-05 1.00 0.10 * Escalation effect (Fireball)
3.00E-07 Fireball
0.4 8.40E-07 Flash fire over plant area
0.3 3.60E-07 Vapour Cloud Explosion
0.04 1.20E-07 Flash fire full extent
1.08E-06 Unignited release
Note *: The escalation effect probability is estimated based on the location of release scenario and target equipment, as well as the associated consequence impact distance and duration.
As such, the escalation probability for each hazardous scenario regardless different hole size and location are assumed as 1/6, and it is only applied if separation distance between release scenario and target equipment is
within the associated consequence impact distance.

Hazardous Section GRS_07
Release
Frequency
(per year)
Detection &
Shutdown
Failure
Immediate
Ignition
Escalation Delayed
Ignition (1)
Explosion
Probability
Delayed
Ignition (2)
Event Outcome Frequency Event Outcome
Release as 10 mm hole size 1.35E-05 1.00 0.02 * Escalation effect (Fireball)
2.70E-07 Jet fire
0.09 1.07E-06 Flash fire over plant area
0.12 1.46E-07 Vapour Cloud Explosion
0.01 1.35E-07 Flash fire full extent
1.16E-05 Unignited release
Release
Frequency
(per year)
Detection &
Shutdown
Failure
Immediate
Ignition
Escalation Delayed
Ignition (1)
Explosion
Probability
Delayed
Ignition (2)
Event Outcome Frequency Event Outcome
Release as 25 mm hole size 1.35E-05 1.00 0.02 * Escalation effect (Fireball)
2.70E-07 Jet fire
0.09 1.07E-06 Flash fire over plant area
0.12 1.46E-07 Vapour Cloud Explosion
0.01 1.35E-07 Flash fire full extent
1.16E-05 Unignited release
Release
Frequency
(per year)
Detection &
Shutdown
Failure
Immediate
Ignition
Escalation Delayed
Ignition (1)
Explosion
Probability
Delayed
Ignition (2)
Event Outcome Frequency Event Outcome
Release as 50 mm hole size 4.50E-06 1.00 0.02 * Escalation effect (Fireball)
9.00E-08 Jet fire
0.09 3.56E-07 Flash fire over plant area
0.12 4.86E-08 Vapour Cloud Explosion
0.01 4.50E-08 Flash fire full extent
3.87E-06 Unignited release
Release
Frequency
(per year)
Detection &
Shutdown
Failure
Immediate
Ignition
Escalation Delayed
Ignition (1)
Explosion
Probability
Delayed
Ignition (2)
Event Outcome Frequency Event Outcome
Release as 100 mm hole size 4.50E-06 1.00 0.10 * Escalation effect (Fireball)
4.50E-07 Jet fire
0.4 1.26E-06 Flash fire over plant area
0.3 5.40E-07 Vapour Cloud Explosion
0.04 1.80E-07 Flash fire full extent
1.62E-06 Unignited release
Release
Frequency
(per year)
Detection &
Shutdown
Failure
Immediate
Ignition
Escalation Delayed
Ignition (1)
Explosion
Probability
Delayed
Ignition (2)
Event Outcome Frequency Event Outcome
Release as Line Rupture 2.25E-06 1.00 0.10 * Escalation effect (Fireball)
4.50E-07 Fireball
0.4 1.26E-06 Flash fire over plant area
0.3 5.40E-07 Vapour Cloud Explosion
0.04 1.80E-07 Flash fire full extent
1.62E-06 Unignited release
Note *: The escalation effect probability is estimated based on the location of release scenario and target equipment, as well as the associated consequence impact distance and duration.
As such, the escalation probability for each hazardous scenario regardless different hole size and location are assumed as 1/6, and it is only applied if separation distance between release scenario and target equipment is
within the associated consequence impact distance.

Hazardous Section GRS_08
Release
Frequency
(per year)
Detection &
Shutdown
Failure
Immediate
Ignition
Escalation Delayed
Ignition (1)
Explosion
Probability
Delayed
Ignition (2)
Event Outcome Frequency Event Outcome
Release as 10 mm hole size 1.95E-05 1.00 0.02 * Escalation effect (Fireball)
3.90E-07 Jet fire
0.09 1.54E-06 Flash fire over plant area
0.12 2.11E-07 Vapour Cloud Explosion
0.01 1.95E-07 Flash fire full extent
1.68E-05 Unignited release
Release
Frequency
(per year)
Detection &
Shutdown
Failure
Immediate
Ignition
Escalation Delayed
Ignition (1)
Explosion
Probability
Delayed
Ignition (2)
Event Outcome Frequency Event Outcome
Release as 25 mm hole size 1.95E-05 1.00 0.02 * Escalation effect (Fireball)
3.90E-07 Jet fire
0.09 1.54E-06 Flash fire over plant area
0.12 2.11E-07 Vapour Cloud Explosion
0.01 1.95E-07 Flash fire full extent
1.68E-05 Unignited release
Release
Frequency
(per year)
Detection &
Shutdown
Failure
Immediate
Ignition
Escalation Delayed
Ignition (1)
Explosion
Probability
Delayed
Ignition (2)
Event Outcome Frequency Event Outcome
Release as 50 mm hole size 6.50E-06 1.00 0.02 * Escalation effect (Fireball)
1.30E-07 Jet fire
0.09 5.15E-07 Flash fire over plant area
0.12 7.02E-08 Vapour Cloud Explosion
0.01 6.50E-08 Flash fire full extent
5.59E-06 Unignited release
Release
Frequency
(per year)
Detection &
Shutdown
Failure
Immediate
Ignition
Escalation Delayed
Ignition (1)
Explosion
Probability
Delayed
Ignition (2)
Event Outcome Frequency Event Outcome
Release as 100 mm hole size 6.50E-06 1.00 0.10 * Escalation effect (Fireball)
6.50E-07 Jet fire
0.4 1.82E-06 Flash fire over plant area
0.3 7.80E-07 Vapour Cloud Explosion
0.04 2.60E-07 Flash fire full extent
2.34E-06 Unignited release
Release
Frequency
(per year)
Detection &
Shutdown
Failure
Immediate
Ignition
Escalation Delayed
Ignition (1)
Explosion
Probability
Delayed
Ignition (2)
Event Outcome Frequency Event Outcome
Release as Line Rupture 3.25E-06 1.00 0.10 * Escalation effect (Fireball)
3.25E-07 Fireball
0.4 9.10E-07 Flash fire over plant area
0.3 3.90E-07 Vapour Cloud Explosion
0.04 1.30E-07 Flash fire full extent
1.17E-06 Unignited release
Note *: The escalation effect probability is estimated based on the location of release scenario and target equipment, as well as the associated consequence impact distance and duration.
As such, the escalation probability for each hazardous scenario regardless different hole size and location are assumed as 1/6, and it is only applied if separation distance between release scenario and target equipment is
within the associated consequence impact distance.

Hazardous Section GRS_09
Release
Frequency
(per year)
Detection &
Shutdown
Failure
Immediate
Ignition
Escalation Delayed
Ignition (1)
Explosion
Probability
Delayed
Ignition (2)
Event Outcome Frequency Event Outcome
Release as 10 mm hole size 3.60E-05 1.00 0.02 * Escalation effect (Fireball)
7.20E-07 Jet fire
0.09 3.11E-06 Flash fire over plant area
0.04 1.30E-07 Vapour Cloud Explosion
0.01 3.60E-07 Flash fire full extent
3.10E-05 Unignited release
Release
Frequency
(per year)
Detection &
Shutdown
Failure
Immediate
Ignition
Escalation Delayed
Ignition (1)
Explosion
Probability
Delayed
Ignition (2)
Event Outcome Frequency Event Outcome
Release as 25 mm hole size 3.60E-05 1.00 0.02 * Escalation effect (Fireball)
7.20E-07 Jet fire
0.09 2.85E-06 Flash fire over plant area
0.12 3.89E-07 Vapour Cloud Explosion
0.01 3.60E-07 Flash fire full extent
3.10E-05 Unignited release
Release
Frequency
(per year)
Detection &
Shutdown
Failure
Immediate
Ignition
Escalation Delayed
Ignition (1)
Explosion
Probability
Delayed
Ignition (2)
Event Outcome Frequency Event Outcome
Release as 50 mm hole size 1.20E-05 1.00 0.02 * Escalation effect (Fireball)
2.40E-07 Jet fire
0.09 9.50E-07 Flash fire over plant area
0.12 1.30E-07 Vapour Cloud Explosion
0.01 1.20E-07 Flash fire full extent
1.03E-05 Unignited release
Release
Frequency
(per year)
Detection &
Shutdown
Failure
Immediate
Ignition
Escalation Delayed
Ignition (1)
Explosion
Probability
Delayed
Ignition (2)
Event Outcome Frequency Event Outcome
Release as 100 mm hole size 1.20E-05 1.00 0.10 * Escalation effect (Fireball)
1.20E-06 Jet fire
0.4 3.36E-06 Flash fire over plant area
0.3 1.44E-06 Vapour Cloud Explosion
0.04 4.80E-07 Flash fire full extent
4.32E-06 Unignited release
Release
Frequency
(per year)
Detection &
Shutdown
Failure
Immediate
Ignition
Escalation Delayed
Ignition (1)
Explosion
Probability
Delayed
Ignition (2)
Event Outcome Frequency Event Outcome
Release as Line Rupture 6.00E-06 1.00 0.10 * Escalation effect (Fireball)
6.00E-07 Fireball
0.4 1.68E-06 Flash fire over plant area
0.3 7.20E-07 Vapour Cloud Explosion
0.04 2.40E-07 Flash fire full extent
2.16E-06 Unignited release
Note *: The escalation effect probability is estimated based on the location of release scenario and target equipment, as well as the associated consequence impact distance and duration.
As such, the escalation probability for each hazardous scenario regardless different hole size and location are assumed as 1/6, and it is only applied if separation distance between release scenario and target equipment is
within the associated consequence impact distance.

Hazardous Section GRS_10
Release
Frequency
(per year)
Detection &
Shutdown
Failure
Immediate
Ignition
Escalation Delayed
Ignition (1)
Explosion
Probability
Delayed
Ignition (2)
Event Outcome Frequency Event Outcome
Release as 10 mm hole size 1.05E-05 1.00 0.02 * Escalation effect (Fireball)
2.10E-07 Jet fire
0.09 8.32E-07 Flash fire over plant area
0.12 1.13E-07 Vapour Cloud Explosion
0.01 1.05E-07 Flash fire full extent
9.03E-06 Unignited release
Release
Frequency
(per year)
Detection &
Shutdown
Failure
Immediate
Ignition
Escalation Delayed
Ignition (1)
Explosion
Probability
Delayed
Ignition (2)
Event Outcome Frequency Event Outcome
Release as 25 mm hole size 1.05E-05 1.00 0.02 * Escalation effect (Fireball)
2.10E-07 Jet fire
0.09 8.32E-07 Flash fire over plant area
0.12 1.13E-07 Vapour Cloud Explosion
0.01 1.05E-07 Flash fire full extent
9.03E-06 Unignited release
Release
Frequency
(per year)
Detection &
Shutdown
Failure
Immediate
Ignition
Escalation Delayed
Ignition (1)
Explosion
Probability
Delayed
Ignition (2)
Event Outcome Frequency Event Outcome
Release as 50 mm hole size 3.50E-06 1.00 0.02 * Escalation effect (Fireball)
7.00E-08 Jet fire
0.09 2.77E-07 Flash fire over plant area
0.12 3.78E-08 Vapour Cloud Explosion
0.01 3.50E-08 Flash fire full extent
3.01E-06 Unignited release
Release
Frequency
(per year)
Detection &
Shutdown
Failure
Immediate
Ignition
Escalation Delayed
Ignition (1)
Explosion
Probability
Delayed
Ignition (2)
Event Outcome Frequency Event Outcome
Release as 100 mm hole size 3.50E-06 1.00 0.10 * Escalation effect (Fireball)
3.50E-07 Jet fire
0.4 9.80E-07 Flash fire over plant area
0.3 4.20E-07 Vapour Cloud Explosion
0.04 1.40E-07 Flash fire full extent
1.26E-06 Unignited release
Release
Frequency
(per year)
Detection &
Shutdown
Failure
Immediate
Ignition
Escalation Delayed
Ignition (1)
Explosion
Probability
Delayed
Ignition (2)
Event Outcome Frequency Event Outcome
Release as Line Rupture 1.75E-06 1.00 0.10 * Escalation effect (Fireball)
1.75E-07 Fireball
0.4 4.90E-07 Flash fire over plant area
0.3 2.10E-07 Vapour Cloud Explosion
0.04 7.00E-08 Flash fire full extent
6.30E-07 Unignited release
Note *: The escalation effect probability is estimated based on the location of release scenario and target equipment, as well as the associated consequence impact distance and duration.
As such, the escalation probability for each hazardous scenario regardless different hole size and location are assumed as 1/6, and it is only applied if separation distance between release scenario and target equipment is
within the associated consequence impact distance.

Annex 5G
Consequence Analysis

ENVIRONMENTAL RESOURCES MANAGEMENT CLP POWER HONG KONG LIMITED ANNEX 5G_CONSEQUENCE ANALYSIS.DOC JUNE 2018
5G-1
5G CONSEQUENCE ANALYSIS
This Annex provides the details of the consequence analysis as follows:
Section 5G.1 – General Consequence Analysis; and
Section 5G.2 – Subsea Pipeline Consequence Analysis.
5G.1 GENERAL CONSEQUENCE ANALYSIS
This section summarises the approaches to model the major hazardous scenarios from the continuous and catastrophic releases considered in the QRA Study. Consequence analysis comprises the following items:
Source term modelling, which involves determining the release rate variation with time and thermodynamic properties of the released fluids;
Physical effects modelling, which involves estimating the effect zone of the various hazardous scenarios; and
Consequence end-point criteria, which involves assessing of the impact of hazardous scenarios on the exposed population.
5G.1.1 Sources Term Modelling
Sources term modelling was carried out to determine the maximum (e.g. initial) release rate that may be expected should a loss of containment occur.
Release Duration
For LNG unloading arm failure at the LNG Terminal, as per the previous EIA Report that was approved by the EPD and other relevant authorities (1), two (2) release durations were considered:
30 seconds release; and
2 minutes release.
A shorter release time (i.e. 30 seconds) was adopted in the QRA Study due to the presence of personnel in the vicinity who can initiate emergency shutdown successfully on top of the fire and gas detection system, and also due to the provision of detectors for excessive movement of the unloading arm which will initiate an automatic shutdown. The 2-minute release duration represents the case of failure of isolation of one unloading arm. Duration longer than 2
(1) ERM, EIA for Liquefied Natural Gas (LNG) Receiving Terminal and Associated Facilities (Register No.: AEIAR-106/2007),
December 2006.

ENVIRONMENTAL RESOURCES MANAGEMENT CLP POWER HONG KONG LIMITED ANNEX 5G_CONSEQUENCE ANALYSIS.DOC JUNE 2018
5G-2
minutes was not considered significant given that the transfer pumps on the LNG can be stopped, which will stop any further release.
For other process facilities in the Project (including FSRU Vessel and the proposed GRSs at the BPPS and LPS), with reference to Purple Book (1), the closing time of an automatic blocking system is two (2) minutes, representing the release duration for isolation success case. Detection and shutdown system may however fail due to some reasons, also as per Purple Book (1), the release duration is limited to a maximum of thirty (30) minutes. The release duration of thirty (30) minutes was conservatively adopted in the QRA Study as the release duration for isolation failure case.
Release Direction
The orientation of a release can have some effects on the hazard footprint calculated by PHAST. The models take into account the momentum of the release, air entrainment, vaporization rate and liquid rainout fraction.
For a horizontal, non-impinging release, momentum effects tend to dominate for most releases giving a jet fire as the most serious outcome. If a release is vertically upwards, the hazard footprint will be significantly less compared to a horizontal release. Also, if a release impinges on the ground or other obstacles, the momentum of the release and air entrainment is reduced, thereby reducing the hazard footprint but also increasing the liquid rainout fraction. In this scenario, a pool fire may become more likely.
Therefore, for all pool fire scenarios, the release orientation was set to “downward impinging release” in order to obtain the worst-case consequence pool fire, while “horizontal non-impinging” was representatively selected for modelling fire effects such as jet fire and flash fire as a conservative approach.
5G.1.2 Physical Effects Modelling
The physical effects modelling by PHAST assessed the effects zones for the following hazardous scenarios in the QRA Study:
Jet fire;
Flash fire;
Pool fire;
Fireball; and
Vapour cloud explosion.
(1) Guidelines for Quantitative Risk Assessment, “Purple Book”, 2005.

ENVIRONMENTAL RESOURCES MANAGEMENT CLP POWER HONG KONG LIMITED ANNEX 5G_CONSEQUENCE ANALYSIS.DOC JUNE 2018
5G-3
Jet Fire
A jet fire results from an ignited release of the pressurised flammable gas (i.e. natural gas). The momentum of the release carries the flammable materials forward in form of a long plume entraining air to give a flammable mixture. Combustion in a jet fire occurs in the form of a strong turbulent diffusion flame that is strongly influenced by the momentum of the release.
A jet fire was modelled for a pressurised flammable gas release. The default jet fire correlation model in PHAST was selected, and the release orientation was set as a horizontal non-impinging release.
Flash Fire
If there is no immediate ignition, the flammable gas such as natural gas, diesel and marine diesel oil may disperse before subsequently encountering an ignition source giving a jet fire or pool fire. The vapour cloud will then burn with a flash back to the source of the leak. A flash fire is assumed to be fatal to anyone caught within the flash fire envelope, although the short duration of a flash fire means that radiation effects are negligible. The fatality probability is therefore zero for persons outside the flash fire envelope.
Dispersion modelling was conducted by PHAST to calculate the extent of the flammable vapour cloud. This takes into account both the direct vaporisation from the release, and also the vapour formed from evaporating pools. The extent of the flash fire was assumed to be the dispersion distance to 0.85 LFL in the QRA Study.
Pool Fire
In case of an early ignition of a liquid pool such as LNG, diesel, marine diesel and lubricating oil pool, an early pool fire will be formed and the maximum pool diameter can be obtained by matching the burning rate with the release rate. Under such a condition, the size of the pool fire will not increase further and will be steady. In case of a delay ignition, the maximum pool radius is reached when the pool thickness at the centre of the pool reaches the maximum thickness.
Fireball
Immediate ignition of release caused by a catastrophic rupture of process equipment or a full bore rupture of a pipeline may give rise to a fireball. The consequence analysis for a fireball scenario was conducted by Roberts (HSE) method (1) in PHAST as the calculation method.
The flammable mass for fireball modelling was conservatively estimated by the initial flow rate continuing for ten (10) seconds even though the initial release
(1) DNV, PHAST version 6.7.
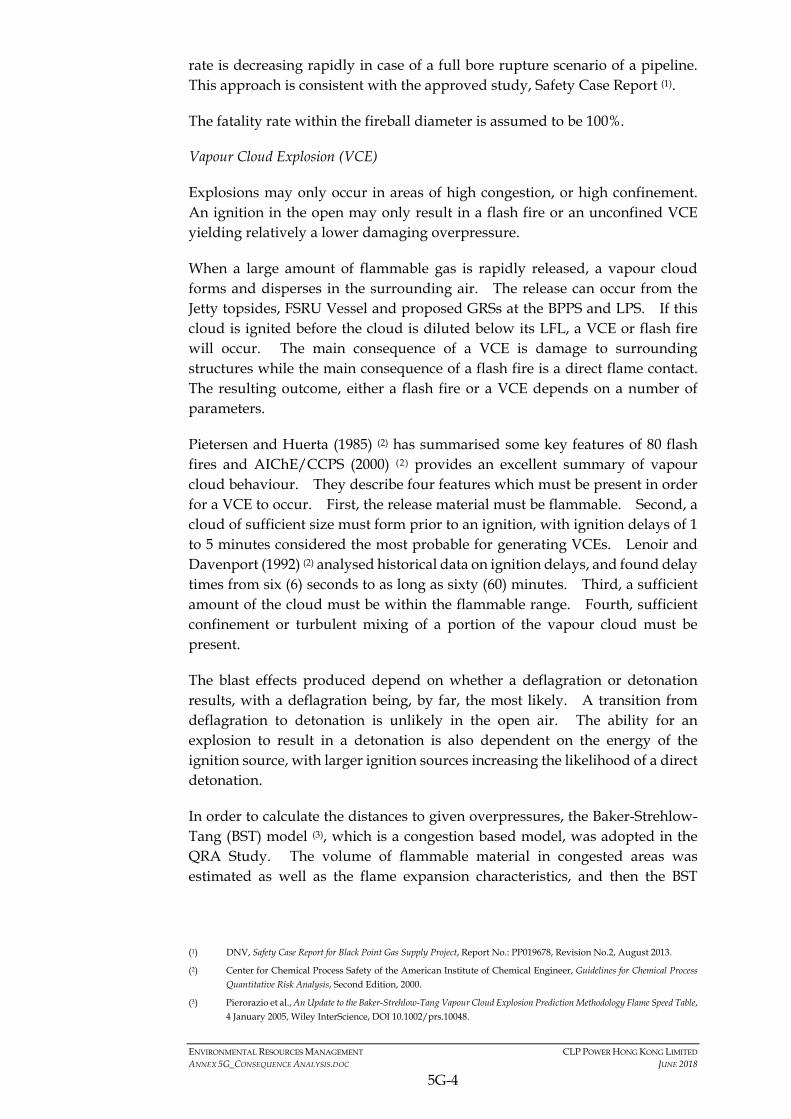
ENVIRONMENTAL RESOURCES MANAGEMENT CLP POWER HONG KONG LIMITED ANNEX 5G_CONSEQUENCE ANALYSIS.DOC JUNE 2018
5G-4
rate is decreasing rapidly in case of a full bore rupture scenario of a pipeline. This approach is consistent with the approved study, Safety Case Report (1).
The fatality rate within the fireball diameter is assumed to be 100%.
Vapour Cloud Explosion (VCE)
Explosions may only occur in areas of high congestion, or high confinement. An ignition in the open may only result in a flash fire or an unconfined VCE yielding relatively a lower damaging overpressure.
When a large amount of flammable gas is rapidly released, a vapour cloud forms and disperses in the surrounding air. The release can occur from the Jetty topsides, FSRU Vessel and proposed GRSs at the BPPS and LPS. If this cloud is ignited before the cloud is diluted below its LFL, a VCE or flash fire will occur. The main consequence of a VCE is damage to surrounding structures while the main consequence of a flash fire is a direct flame contact. The resulting outcome, either a flash fire or a VCE depends on a number of parameters.
Pietersen and Huerta (1985) (2) has summarised some key features of 80 flash fires and AIChE/CCPS (2000) (2) provides an excellent summary of vapour cloud behaviour. They describe four features which must be present in order for a VCE to occur. First, the release material must be flammable. Second, a cloud of sufficient size must form prior to an ignition, with ignition delays of 1 to 5 minutes considered the most probable for generating VCEs. Lenoir and Davenport (1992) (2) analysed historical data on ignition delays, and found delay times from six (6) seconds to as long as sixty (60) minutes. Third, a sufficient amount of the cloud must be within the flammable range. Fourth, sufficient confinement or turbulent mixing of a portion of the vapour cloud must be present.
The blast effects produced depend on whether a deflagration or detonation results, with a deflagration being, by far, the most likely. A transition from deflagration to detonation is unlikely in the open air. The ability for an explosion to result in a detonation is also dependent on the energy of the ignition source, with larger ignition sources increasing the likelihood of a direct detonation.
In order to calculate the distances to given overpressures, the Baker-Strehlow-Tang (BST) model (3), which is a congestion based model, was adopted in the QRA Study. The volume of flammable material in congested areas was estimated as well as the flame expansion characteristics, and then the BST
(1) DNV, Safety Case Report for Black Point Gas Supply Project, Report No.: PP019678, Revision No.2, August 2013.
(2) Center for Chemical Process Safety of the American Institute of Chemical Engineer, Guidelines for Chemical Process Quantitative Risk Analysis, Second Edition, 2000.
(3) Pierorazio et al., An Update to the Baker-Strehlow-Tang Vapour Cloud Explosion Prediction Methodology Flame Speed Table, 4 January 2005, Wiley InterScience, DOI 10.1002/prs.10048.

ENVIRONMENTAL RESOURCES MANAGEMENT CLP POWER HONG KONG LIMITED ANNEX 5G_CONSEQUENCE ANALYSIS.DOC JUNE 2018
5G-5
model predicts the overpressures at a given distance. The BST model predicts the blast levels based on:
Mass of flammable material involved in an explosion (determined based on dispersion modelling by PHAST);
Reactivity of the flammable material (high, medium, or low)
Degree of freedom for the flame expansion (1D, 2D, 2.5D or 3D); and
Congestion level of a potential explosion site (high, medium, low).
To apply the BST model, the LNG Terminal was identified with two (2) potential explosion sites based on the facility layout. Leaks from the isolatable sections of the LNG Terminal facilities were then modelled to cause explosion in the nearest potential explosion site.
Similar to thermal radiation levels, overpressure levels, corresponding to specific fatality levels, were taken from the data published by Purple Book (1) for indoor/ outdoor population. The various overpressure levels considered in the QRA Study are presented in Table 5G.3.
Table 5G.1 summarises the input parameters, such as level of congestion, reactivity of material, etc., to the BST model performed by PHAST.
Table 5G.1 Identified PESs at the LNG Terminal
Tag PES Location
Reactivity of Material
Degree of Freedom for Flame Expansion
Level of Congestion
Length (m)
Width (m)
Height (m)
Estimated PES
Volume (m3)
PES 1 The Jetty Low 2D Medium 50 68 12 40,800 PES 2 Re-gasification
Module at the FSRU Vessel
Low 2D Medium 40 46 12 22,080
5G.1.3 Consequence End-Point Criteria
The estimation of the fatality/ injury caused by a physical effect such as thermal radiation requires the use of probit equations, which describe the probability of fatality as a function of some physical effects. The probit equation takes the general form:
Y = a + b ln V
where: Y is the probit a, b are constants determined from experiments V is a measure of the physical effect such as thermal dose
(1) Guidelines for Quantitative Risk Assessment, “Purple Book”, 2005.
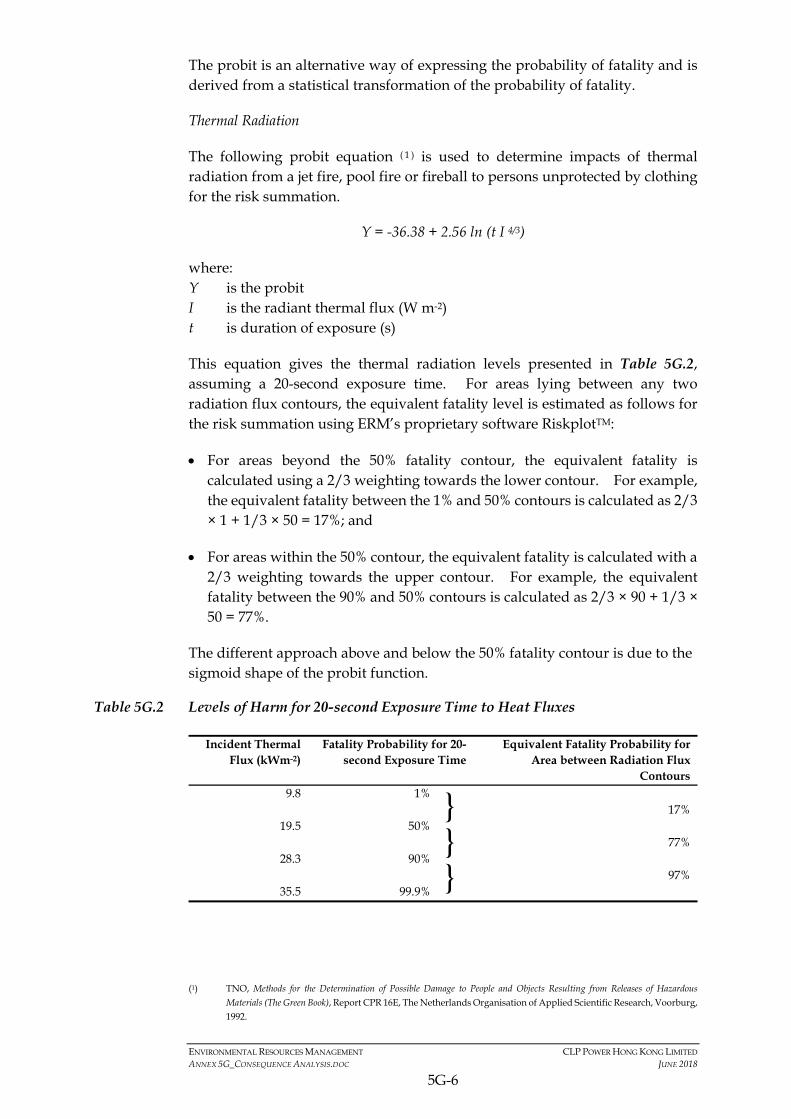
ENVIRONMENTAL RESOURCES MANAGEMENT CLP POWER HONG KONG LIMITED ANNEX 5G_CONSEQUENCE ANALYSIS.DOC JUNE 2018
5G-6
The probit is an alternative way of expressing the probability of fatality and is derived from a statistical transformation of the probability of fatality.
Thermal Radiation
The following probit equation ( 1 ) is used to determine impacts of thermal radiation from a jet fire, pool fire or fireball to persons unprotected by clothing for the risk summation.
Y = -36.38 + 2.56 ln (t I 4/3)
where: Y is the probit I is the radiant thermal flux (W m-2) t is duration of exposure (s)
This equation gives the thermal radiation levels presented in Table 5G.2, assuming a 20-second exposure time. For areas lying between any two radiation flux contours, the equivalent fatality level is estimated as follows for the risk summation using ERM’s proprietary software RiskplotTM:
For areas beyond the 50% fatality contour, the equivalent fatality is calculated using a 2/3 weighting towards the lower contour. For example, the equivalent fatality between the 1% and 50% contours is calculated as 2/3 × 1 + 1/3 × 50 = 17%; and
For areas within the 50% contour, the equivalent fatality is calculated with a 2/3 weighting towards the upper contour. For example, the equivalent fatality between the 90% and 50% contours is calculated as 2/3 × 90 + 1/3 × 50 = 77%.
The different approach above and below the 50% fatality contour is due to the sigmoid shape of the probit function.
Table 5G.2 Levels of Harm for 20-second Exposure Time to Heat Fluxes
Incident Thermal Flux (kWm-2)
Fatality Probability for 20-second Exposure Time
Equivalent Fatality Probability for Area between Radiation Flux
Contours 9.8
1%
}
}
}
17%
19.5
50% 77%
28.3
35.5
90%
99.9%
97%
(1) TNO, Methods for the Determination of Possible Damage to People and Objects Resulting from Releases of Hazardous
Materials (The Green Book), Report CPR 16E, The Netherlands Organisation of Applied Scientific Research, Voorburg, 1992.
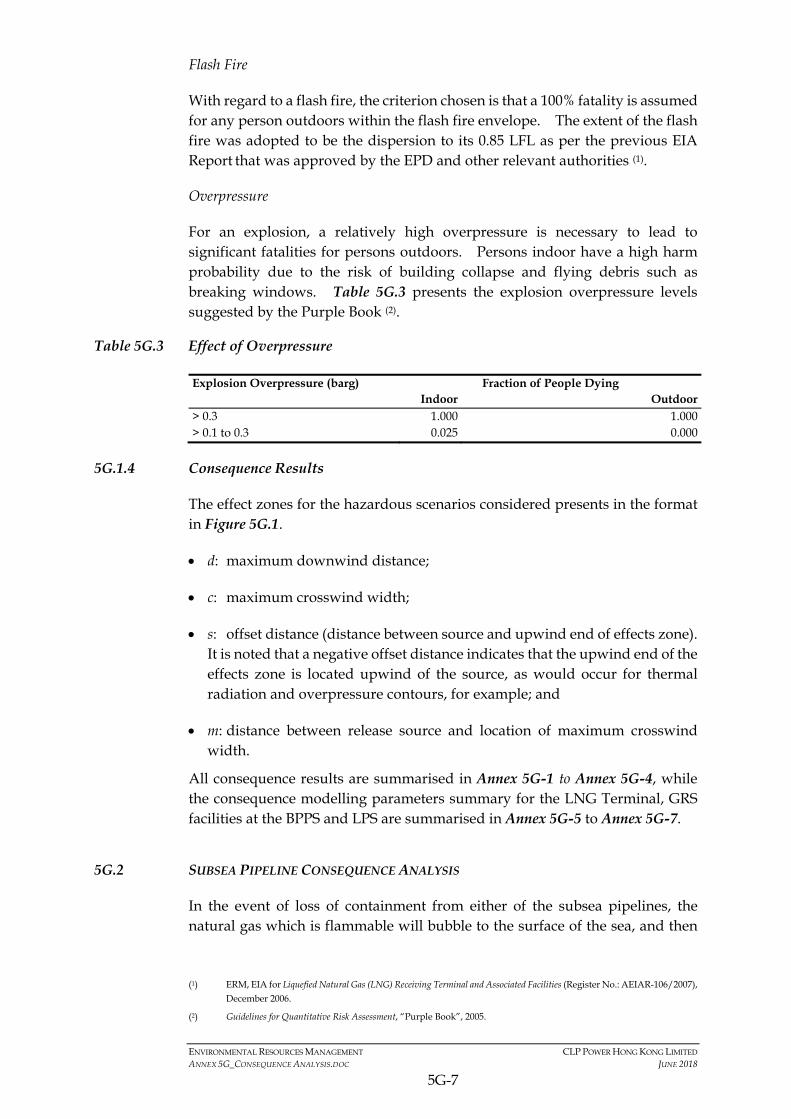
ENVIRONMENTAL RESOURCES MANAGEMENT CLP POWER HONG KONG LIMITED ANNEX 5G_CONSEQUENCE ANALYSIS.DOC JUNE 2018
5G-7
Flash Fire
With regard to a flash fire, the criterion chosen is that a 100% fatality is assumed for any person outdoors within the flash fire envelope. The extent of the flash fire was adopted to be the dispersion to its 0.85 LFL as per the previous EIA Report that was approved by the EPD and other relevant authorities (1).
Overpressure
For an explosion, a relatively high overpressure is necessary to lead to significant fatalities for persons outdoors. Persons indoor have a high harm probability due to the risk of building collapse and flying debris such as breaking windows. Table 5G.3 presents the explosion overpressure levels suggested by the Purple Book (2).
Table 5G.3 Effect of Overpressure
Explosion Overpressure (barg) Fraction of People Dying Indoor Outdoor > 0.3 1.000 1.000 > 0.1 to 0.3 0.025 0.000
5G.1.4 Consequence Results
The effect zones for the hazardous scenarios considered presents in the format in Figure 5G.1.
d: maximum downwind distance;
c: maximum crosswind width;
s: offset distance (distance between source and upwind end of effects zone). It is noted that a negative offset distance indicates that the upwind end of the effects zone is located upwind of the source, as would occur for thermal radiation and overpressure contours, for example; and
m: distance between release source and location of maximum crosswind width.
All consequence results are summarised in Annex 5G-1 to Annex 5G-4, while the consequence modelling parameters summary for the LNG Terminal, GRS facilities at the BPPS and LPS are summarised in Annex 5G-5 to Annex 5G-7.
5G.2 SUBSEA PIPELINE CONSEQUENCE ANALYSIS
In the event of loss of containment from either of the subsea pipelines, the natural gas which is flammable will bubble to the surface of the sea, and then
(1) ERM, EIA for Liquefied Natural Gas (LNG) Receiving Terminal and Associated Facilities (Register No.: AEIAR-106/2007),
December 2006.
(2) Guidelines for Quantitative Risk Assessment, “Purple Book”, 2005.
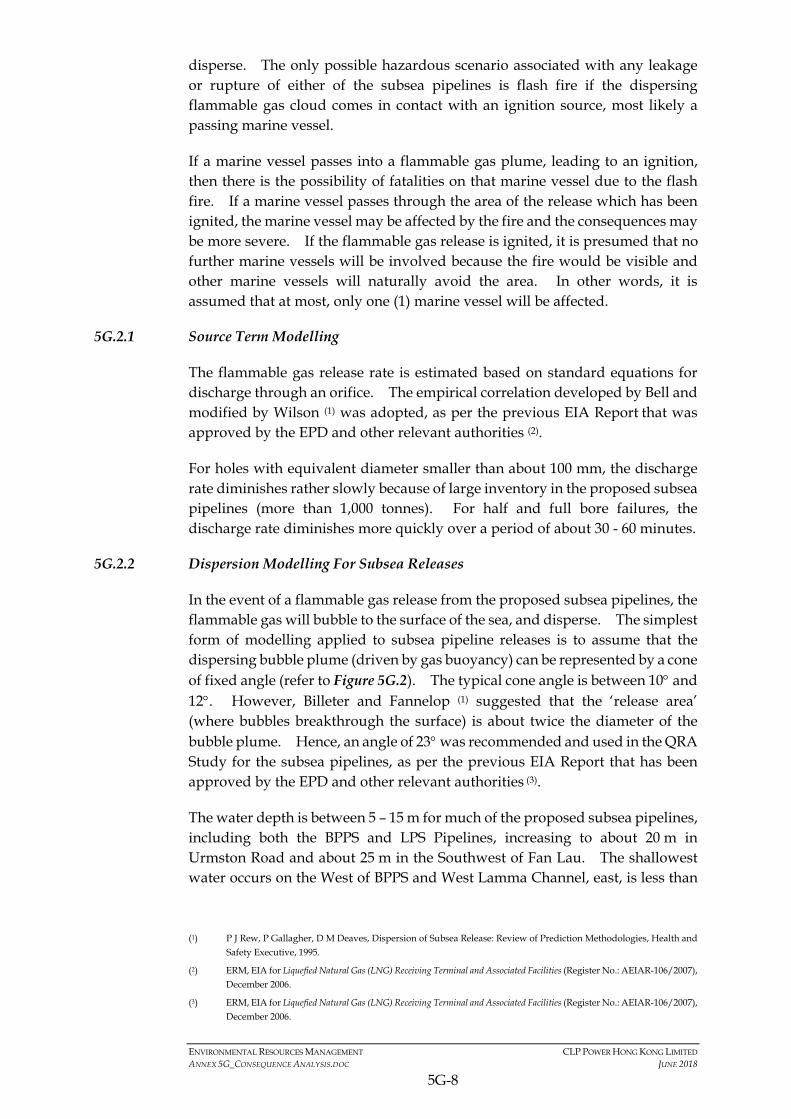
ENVIRONMENTAL RESOURCES MANAGEMENT CLP POWER HONG KONG LIMITED ANNEX 5G_CONSEQUENCE ANALYSIS.DOC JUNE 2018
5G-8
disperse. The only possible hazardous scenario associated with any leakage or rupture of either of the subsea pipelines is flash fire if the dispersing flammable gas cloud comes in contact with an ignition source, most likely a passing marine vessel.
If a marine vessel passes into a flammable gas plume, leading to an ignition, then there is the possibility of fatalities on that marine vessel due to the flash fire. If a marine vessel passes through the area of the release which has been ignited, the marine vessel may be affected by the fire and the consequences may be more severe. If the flammable gas release is ignited, it is presumed that no further marine vessels will be involved because the fire would be visible and other marine vessels will naturally avoid the area. In other words, it is assumed that at most, only one (1) marine vessel will be affected.
5G.2.1 Source Term Modelling
The flammable gas release rate is estimated based on standard equations for discharge through an orifice. The empirical correlation developed by Bell and modified by Wilson (1) was adopted, as per the previous EIA Report that was approved by the EPD and other relevant authorities (2).
For holes with equivalent diameter smaller than about 100 mm, the discharge rate diminishes rather slowly because of large inventory in the proposed subsea pipelines (more than 1,000 tonnes). For half and full bore failures, the discharge rate diminishes more quickly over a period of about 30 - 60 minutes.
5G.2.2 Dispersion Modelling For Subsea Releases
In the event of a flammable gas release from the proposed subsea pipelines, the flammable gas will bubble to the surface of the sea, and disperse. The simplest form of modelling applied to subsea pipeline releases is to assume that the dispersing bubble plume (driven by gas buoyancy) can be represented by a cone of fixed angle (refer to Figure 5G.2). The typical cone angle is between 10 and 12. However, Billeter and Fannelop (1) suggested that the ‘release area’ (where bubbles breakthrough the surface) is about twice the diameter of the bubble plume. Hence, an angle of 23 was recommended and used in the QRA Study for the subsea pipelines, as per the previous EIA Report that has been approved by the EPD and other relevant authorities (3).
The water depth is between 5 – 15 m for much of the proposed subsea pipelines, including both the BPPS and LPS Pipelines, increasing to about 20 m in Urmston Road and about 25 m in the Southwest of Fan Lau. The shallowest water occurs on the West of BPPS and West Lamma Channel, east, is less than
(1) P J Rew, P Gallagher, D M Deaves, Dispersion of Subsea Release: Review of Prediction Methodologies, Health and
Safety Executive, 1995.
(2) ERM, EIA for Liquefied Natural Gas (LNG) Receiving Terminal and Associated Facilities (Register No.: AEIAR-106/2007), December 2006.
(3) ERM, EIA for Liquefied Natural Gas (LNG) Receiving Terminal and Associated Facilities (Register No.: AEIAR-106/2007), December 2006.

ENVIRONMENTAL RESOURCES MANAGEMENT CLP POWER HONG KONG LIMITED ANNEX 5G_CONSEQUENCE ANALYSIS.DOC JUNE 2018
5G-9
5 m deep. For this range of water depths, the cone model predicted the ‘release area’ to be in the range of 0.6 to 10 m diameter.
5G.2.3 Dispersion above Sea Surface
Any flammable gas will begin to disperse into atmosphere upon reaching the surface of the sea. The distance to which the flammable gas envelope extends will depend on ambient conditions such as wind speed and atmospheric stability as well as source conditions. The extent of the flammable area was taken as the distance to 0.85 LFL, as per the previous EIA Report (1) that was approved by the EPD and other relevant authorities. PHAST was used to model the plume dispersion as an area source on the surface of the ocean.
5G.2.4 Impact Criteria
Impact on Population on Marine Vessels
The impact assessment on population on marine vessels was conducted as per the previous EIA Report that was approved by the EPD and other relevant authorities (1). The hazardous distance was taken to be the distance to 0.85 LFL. It was assumed that marine vessels would be at risk for thirty (30) minutes before warning could be issued to advise marine vessels to avoid the area. Knowing the marine vessel traffic (in marine ships per day per km of subsea pipeline), the probability that a passing marine vessel will cross through the flammable plume during this thirty (30) minutes as:
Probability = Traffic (/km/day) × Length of Plume (km) × 0.5 (hour) / 24 (hour/ day)
If a marine vessel comes in contact with the flammable plume and causes an ignition, the resulting flash fire may lead to fatalities depending on the type of marine vessel. Small open marine vessels such as fishing boats are expected to provide less protection to its occupants. Large ocean-going vessels will provide better protection.
Fatality factors were therefore applied to each class of marine vessel to take into account the protection offered by the marine vessel. As per the previous EIA Report that was approved by the EPD and other relevant authorities (1), the fatalities factors used in the QRA Study are as given in Table 5G.4..
(1) ERM, EIA for Liquefied Natural Gas (LNG) Receiving Terminal and Associated Facilities (Register No.: AEIAR-106/2007),
December 2006.

ENVIRONMENTAL RESOURCES MANAGEMENT CLP POWER HONG KONG LIMITED ANNEX 5G_CONSEQUENCE ANALYSIS.DOC JUNE 2018
5G-10
Table 5G.4 Fatality Probability for Subsea Pipelines’ MAEs
Marine Vessel Class Fatality Release area Cloud area Fishing vessels 1 0.9 Rivertrade coastal vessel 1 0.3 Ocean-going vessels 1 0.1 Fast launches 1 0.9 Fast ferries 1 0.4
Others 1 0.3
If a marine vessel passes into the ‘release area’, leading to the ignition of the flammable gas cloud, the marine vessel is more likely to be caught in the ensuing fire. This is assumed to result in more severe consequence with potential for 100% fatality of occupants. The analysis limits the number of marine vessels involved to one (1). It is assumed that once the flammable gas plume is ignited, other marine vessels will avoid the area.
Impact on Road Traffic Population on Hong Kong-Zhuhai-Macao Bridge
The Hong Kong – Zhuhai – Macao Bridge (HZMB) will straddle the proposed subsea pipeline connecting to the BPPS within the West of Tai O Section. It is noted also that the West of Tai O Section of the pipeline will be provided with 3 m of rock armour protection. The bridge, therefore is not expected to have any effect on pipeline failure frequencies during construction or operation.
If the BPPS Pipeline failure does occur for other reasons, such as external corrosion or anchor impact, the transit road traffic population on the bridge may be affected. This scenario was considered in the consequence analysis for the West of Tai O Section of the proposed BPPS Pipeline.
Based on the Presses Release “LCQ17: Cross-boundary transport arrangements” in January 2015 (1), the vehicle traffic expected on the bridge in 2020 is 15,350 per day, it was conservatively assumed that 20,000 vehicles per day will traverse the bridge. This is equivalent to about 50% of the vehicles crossing all land borders currently (2). The same vehicle mix was assumed as currently crossing the land borders, namely: 45% private cars, 9% coaches/ shuttle buses and 46% goods/ container vehicles. It was further assumed that cars and good vehicles have a traffic population of two (2), while buses have a traffic population of fifty (50).
The impact assessment on population on Hong Kong Zhuhai Macau Bridge was conducted as per the previous EIA Report that was approved by the EPD and other relevant authorities (3). Flash fire was modelled in the QRA Study.
(1) http://www.info.gov.hk/gia/general/201501/28/P201501280314.htm.
(2) Transport Department, Monthly Traffic and Transport Digest, May 2017, http://www.td.gov.hk/filemanager/en/content_4856/table81e.pdf.
(3) ERM, EIA for Liquefied Natural Gas (LNG) Receiving Terminal and Associated Facilities (Register No.: AEIAR-106/2007), December 2006.
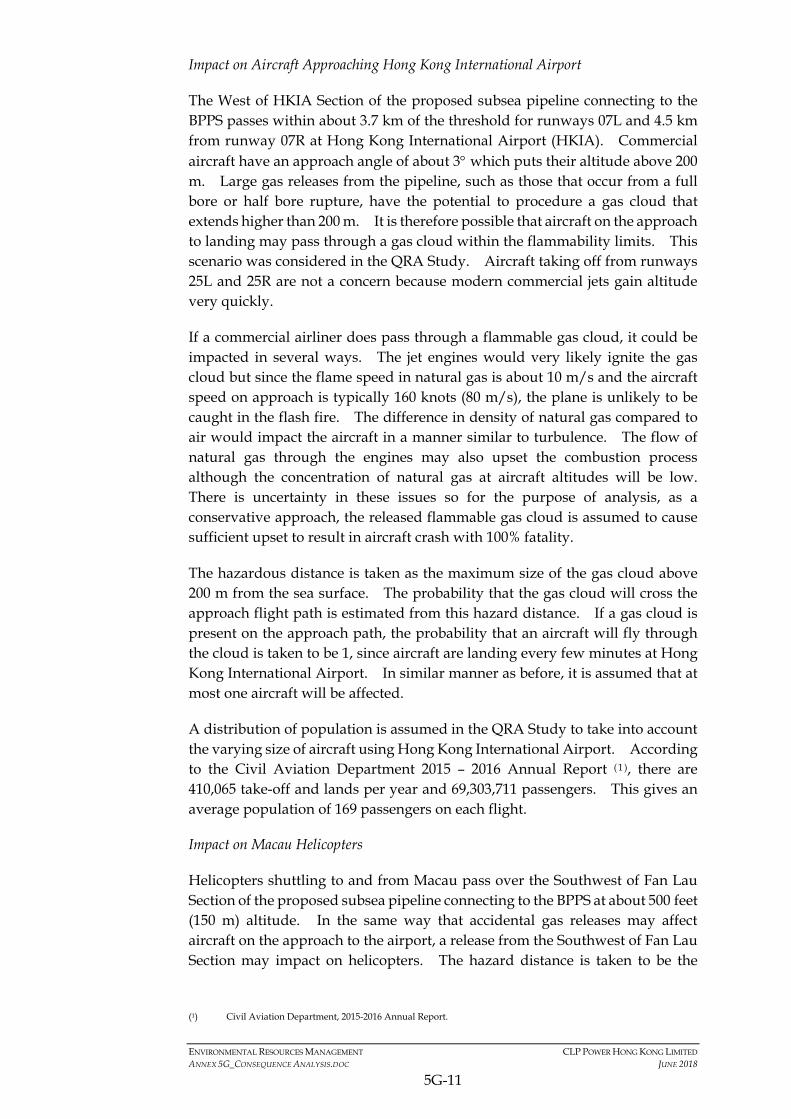
ENVIRONMENTAL RESOURCES MANAGEMENT CLP POWER HONG KONG LIMITED ANNEX 5G_CONSEQUENCE ANALYSIS.DOC JUNE 2018
5G-11
Impact on Aircraft Approaching Hong Kong International Airport
The West of HKIA Section of the proposed subsea pipeline connecting to the BPPS passes within about 3.7 km of the threshold for runways 07L and 4.5 km from runway 07R at Hong Kong International Airport (HKIA). Commercial aircraft have an approach angle of about 3 which puts their altitude above 200 m. Large gas releases from the pipeline, such as those that occur from a full bore or half bore rupture, have the potential to procedure a gas cloud that extends higher than 200 m. It is therefore possible that aircraft on the approach to landing may pass through a gas cloud within the flammability limits. This scenario was considered in the QRA Study. Aircraft taking off from runways 25L and 25R are not a concern because modern commercial jets gain altitude very quickly.
If a commercial airliner does pass through a flammable gas cloud, it could be impacted in several ways. The jet engines would very likely ignite the gas cloud but since the flame speed in natural gas is about 10 m/s and the aircraft speed on approach is typically 160 knots (80 m/s), the plane is unlikely to be caught in the flash fire. The difference in density of natural gas compared to air would impact the aircraft in a manner similar to turbulence. The flow of natural gas through the engines may also upset the combustion process although the concentration of natural gas at aircraft altitudes will be low. There is uncertainty in these issues so for the purpose of analysis, as a conservative approach, the released flammable gas cloud is assumed to cause sufficient upset to result in aircraft crash with 100% fatality.
The hazardous distance is taken as the maximum size of the gas cloud above 200 m from the sea surface. The probability that the gas cloud will cross the approach flight path is estimated from this hazard distance. If a gas cloud is present on the approach path, the probability that an aircraft will fly through the cloud is taken to be 1, since aircraft are landing every few minutes at Hong Kong International Airport. In similar manner as before, it is assumed that at most one aircraft will be affected.
A distribution of population is assumed in the QRA Study to take into account the varying size of aircraft using Hong Kong International Airport. According to the Civil Aviation Department 2015 – 2016 Annual Report ( 1 ), there are 410,065 take-off and lands per year and 69,303,711 passengers. This gives an average population of 169 passengers on each flight.
Impact on Macau Helicopters
Helicopters shuttling to and from Macau pass over the Southwest of Fan Lau Section of the proposed subsea pipeline connecting to the BPPS at about 500 feet (150 m) altitude. In the same way that accidental gas releases may affect aircraft on the approach to the airport, a release from the Southwest of Fan Lau Section may impact on helicopters. The hazard distance is taken to be the
(1) Civil Aviation Department, 2015-2016 Annual Report.
ENVIRONMENTAL RESOURCES MANAGEMENT CLP POWER HONG KONG LIMITED ANNEX 5G_CONSEQUENCE ANALYSIS.DOC JUNE 2018
5G-12
maximum width of the gas cloud above 150 m altitude. Although there is only one flight every thirty (30) minutes and the return flights pass further south missing the pipeline route, it is again assumed that one helicopter is certain to be affected if the gas cloud lies across the flight path. The methodology is the same as that used for aircraft. It is further assumed that all helicopters are filled to capacity with twelve (12) passengers and crew.
This is a very conservative approach for helicopters but given that they are not expected to make a significant contribution to the risk results, this simple approach is sufficient.
5G.2.5 Consequence Results
Hazard distances will be determined from the dispersion modelling for marine vessels and other in the vicinity of the proposed subsea pipelines. Given that natural gas is buoyant and tends to disperse from the sea surface, the hazard distance is defined as the gas cloud width near sea level where an ignition is possible by passing marine vessels. The hazard distance (maximum width within fifty (50) m of the sea surface) was then taken from PHAST modelling for the detailed risk assessment.

Environmental Resources Management
Presentation of Consequence Results Figure 5G.1
d
c
s
m
Source

Environmental Resources Management
Simple Cone Model for Subsea Dispersion Figure 5G.2

Annex 5G-1
Consequence Analysis
Results for Marine Transits
of LNGC and FSRU Vessel
to the LNG Terminal

F, 2 m/s D, 3 m/s D, 7m/s B, 2.5m/s
Pool Fire 35.35 kW/m2 78 86 102 82
28.3 kW/m2 90 97 111 94
19.5 kW/m2 109 116 126 113
9.8 kW/m2 149 154 162 152
Flash Fire 0.85 LFL 67 184 191 142
Pool Fire 35.35 kW/m2 182 197 232 190
28.3 kW/m2 208 224 256 217
19.5 kW/m2 254 268 294 262
9.8 kW/m2 348 359 376 354
Flash Fire 0.85 LFL 77 272 256 229
Pool Fire 35.35 kW/m2 313 337 394 326
28.3 kW/m2 358 381 435 370
19.5 kW/m2 435 457 501 447
9.8 kW/m2 595 613 641 605
Flash Fire 0.85 LFL 95 203 393 186
Pool Fire 35.35 kW/m2 65 72 86 69
28.3 kW/m2 75 82 95 79
19.5 kW/m2 93 99 108 96
9.8 kW/m2 128 132 139 130
Flash Fire 0.85 LFL 64 175 87 90
Pool Fire 35.35 kW/m2 77 84 100 81
28.3 kW/m2 88 96 109 92
19.5 kW/m2 107 114 124 111
9.8 kW/m2 147 151 159 149
Flash Fire 0.85 LFL 66 183 186 139
Pool Fire 35.35 kW/m2 178 194 229 187
28.3 kW/m2 204 220 251 213
19.5 kW/m2 249 264 289 257
9.8 kW/m2 342 353 370 348
Flash Fire 0.85 LFL 76 277 250 229
Pool Fire 35.35 kW/m2 308 331 387 320
28.3 kW/m2 352 375 427 364
S_LNGC_Collision_1500 1500 mm hole size leak due to
collision release for Small LNGC
L 1500
S_LNGC_Collision_750 750 mm hole size leak due to
collision release for Small LNGC
L 750
S_LNGC_Collision_250 250 mm hole size leak due to
collision release for Small LNGC
L 250
L_LNGC_Grounding_250 250 mm hole size leak due to
groudning release for Large
LNGC
L 250
L_LNGC_Collision_1500 1500 mm hole size leak due to
collision release for Large LNGC
L 1,500
Hazard Extent (m)
Weather Conditions
L_LNGC_Collision_250 250 mm hole size leak due to
collision release for Large LNGC
L 250
Section PhaseLeak Size
(mm)
Hazard
Effects
End Point
Criteria
L_LNGC_Collision_750 750 mm hole size leak due to
collision release for Large LNGC
L 750
Annex 5G - 1 - 1

F, 2 m/s D, 3 m/s D, 7m/s B, 2.5m/s
Hazard Extent (m)
Weather ConditionsSection PhaseLeak Size
(mm)
Hazard
Effects
End Point
Criteria
19.5 kW/m2 427 449 493 439
9.8 kW/m2 585 602 630 595
Flash Fire 0.85 LFL 94 202 390 186
Pool Fire 35.35 kW/m2 63 70 83 66
28.3 kW/m2 73 79 92 76
19.5 kW/m2 89 95 104 93
9.8 kW/m2 124 127 135 126
Flash Fire 0.85 LFL 64 169 84 88
L 10 Pool Fire 35.35 kW/m2 10 10 11 12
28.3 kW/m2 11 11 12 15
19.5 kW/m2 14 14 15 16
9.8 kW/m2 17 17 18 19
Flash Fire 0.85 LFL 2 2 2 2
L 25 Pool Fire 35.35 kW/m2 14 14 14 15
28.3 kW/m2 14 14 15 15
19.5 kW/m2 18 17 19 21
9.8 kW/m2 26 25 27 29
Flash Fire 0.85 LFL 7 7 7 7
L 50 Pool Fire 35.35 kW/m2 12 12 12 12
28.3 kW/m2 12 12 12 12
19.5 kW/m2 21 21 21 22
9.8 kW/m2 30 29 31 35
Flash Fire 0.85 LFL 8 7 8 8
L Pool Fire 35.35 kW/m2 36 36 36 36
28.3 kW/m2 36 36 36 36
19.5 kW/m2 47 47 47 48
9.8 kW/m2 53 52 55 59
Flash Fire 0.85 LFL 10 8 9 9
CR_Diesel Storage System Catastrophic rupture of Diesel
(Heavy Fuel Oil) Storage System
Catastrophic
Rupture
10 mm hole size leak of Diesel
(Heavy Fuel Oil) Storage System
VS_Diesel Storage System
25 mm hole size leak of Diesel
(Heavy Fuel Oil) Storage System
S_Diesel Storage System
M_Diesel Storage System 50 mm hole size leak of Diesel
(Heavy Fuel Oil) Storage System
S_LNGC_Grounding_250 250 mm hole size leak due to
groudning release for Small
LNGC
L 250
Annex 5G - 1 - 2

F, 2 m/s D, 3 m/s D, 7m/s B, 2.5m/s
Hazard Extent (m)
Weather ConditionsSection PhaseLeak Size
(mm)
Hazard
Effects
End Point
Criteria
L 10 Pool Fire 35.35 kW/m2 10 10 11 12
28.3 kW/m2 11 11 12 15
19.5 kW/m2 14 14 15 16
9.8 kW/m2 17 17 18 19
Flash Fire 0.85 LFL 2 2 2 2
L 25 Pool Fire 35.35 kW/m2 14 14 14 15
28.3 kW/m2 14 14 15 15
19.5 kW/m2 18 17 19 21
9.8 kW/m2 26 25 27 29
Flash Fire 0.85 LFL 7 7 7 7
L 50 Pool Fire 35.35 kW/m2 12 12 12 12
28.3 kW/m2 12 12 12 12
19.5 kW/m2 21 21 21 22
9.8 kW/m2 30 29 31 35
Flash Fire 0.85 LFL 8 7 8 8
L Pool Fire 35.35 kW/m2 36 36 36 36
28.3 kW/m2 36 36 36 36
19.5 kW/m2 47 47 47 48
9.8 kW/m2 53 52 55 59
Flash Fire 0.85 LFL 10 8 9 9
L 10 Pool Fire 35.35 kW/m2 10 10 11 12
28.3 kW/m2 11 11 12 15
19.5 kW/m2 14 14 15 16
9.8 kW/m2 17 17 18 19
L 25 Pool Fire 35.35 kW/m2 14 14 14 15
28.3 kW/m2 14 14 15 15
19.5 kW/m2 18 17 19 21
9.8 kW/m2 26 25 27 29
S_Lubricating Oil Storage
System
25 mm hole size leak of
Lubricating Oil Storage System
M_Marine Diesel Oil
System
50 mm hole size leak of Marine
Diesel Oil System
CR_Marine Diesel Oil
System
Catastrophic rupture of Marine
Diesel Oil System
Catastrophic
Rupture
VS_Lubricating Oil Storage
System
10 mm hole size leak of
Lubricating Oil Storage System
VS_Marine Diesel Oil
System
10 mm hole size leak of Marine
Diesel Oil System
S_Marine Diesel Oil System 25 mm hole size leak of Marine
Diesel Oil System
Annex 5G - 1 - 3
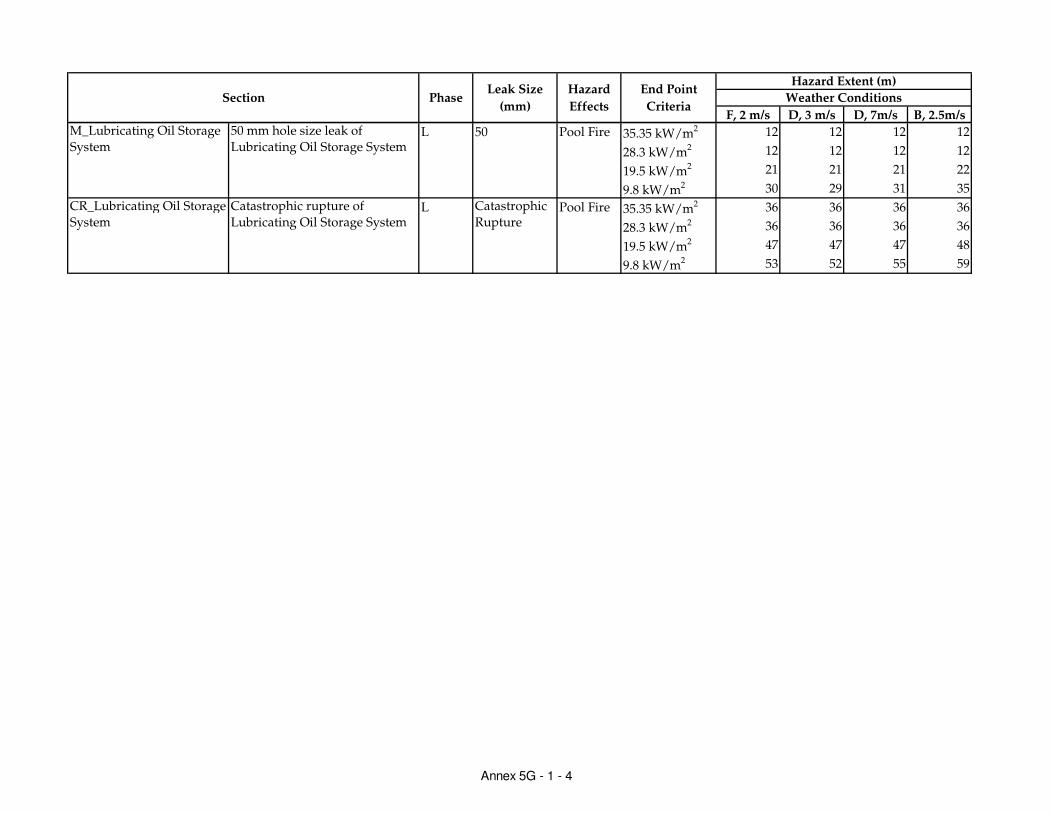
F, 2 m/s D, 3 m/s D, 7m/s B, 2.5m/s
Hazard Extent (m)
Weather ConditionsSection PhaseLeak Size
(mm)
Hazard
Effects
End Point
Criteria
L 50 Pool Fire 35.35 kW/m2 12 12 12 12
28.3 kW/m2 12 12 12 12
19.5 kW/m2 21 21 21 22
9.8 kW/m2 30 29 31 35
L Pool Fire 35.35 kW/m2 36 36 36 36
28.3 kW/m2 36 36 36 36
19.5 kW/m2 47 47 47 48
9.8 kW/m2 53 52 55 59
Catastrophic
Rupture
M_Lubricating Oil Storage
System
50 mm hole size leak of
Lubricating Oil Storage System
CR_Lubricating Oil Storage
System
Catastrophic rupture of
Lubricating Oil Storage System
Annex 5G - 1 - 4

Annex 5G-2
Consequence Analysis
Results for the LNG
Terminal

F, 2 m/s D, 3 m/s D, 7m/s B, 2.5m/s
Jet Fire 35.35 kW/m2 21 22 20 17
28.3 kW/m2 22 23 21 18
19.5 kW/m2 23 24 22 19
9.8 kW/m2 26 27 25 22
Flash Fire 0.85 LFL 14 26 23 24
Jet Fire 35.35 kW/m2 47 49 45 39
28.3 kW/m2 48 51 47 41
19.5 kW/m2 51 53 50 43
9.8 kW/m2 57 59 56 49
Flash Fire 0.85 LFL 80 91 92 92
Jet Fire 35.35 kW/m2 85 89 82 71
28.3 kW/m2 89 92 85 74
19.5 kW/m2 94 98 91 79
9.8 kW/m2 105 109 102 90
Flash Fire 0.85 LFL 200 184 209 242
Pool Fire 35.35 kW/m2 176 168 182 212
28.3 kW/m2 198 189 203 230
19.5 kW/m2 234 226 239 260
9.8 kW/m2 309 301 311 327
Flash Fire 0.85 LFL 316 619 432 645
Pool Fire 35.35 kW/m2 1 1 1 1
28.3 kW/m2 1 1 1 1
19.5 kW/m2 1 1 1 1
9.8 kW/m2 1 1 1 1
Flash Fire 0.85 LFL 9 9 11 10
Pool Fire 35.35 kW/m2 4 10 11 0
28.3 kW/m2 4 10 11 12
19.5 kW/m2 4 11 11 12
9.8 kW/m2 4 13 13 13
Flash Fire 0.85 LFL 37 66 40 37
Pool Fire 35.35 kW/m2 13 18 19 19
28.3 kW/m2 13 20 21 22
19.5 kW/m2 13 23 24 25
HKOLNGT_02 LNG Storage Tanks L 10
25
50
50
Full bore
LLNG Loadout from LNGC, via Jetty, to LNG Storage Tank in FSRU Vessel
10
25
HKOLNGT_01
Hazard Extent (m)
Weather Conditions
End Point
CriteriaSection
Hazard
EffectsPhase
Leak Size
(mm)
Annex 5G - 2 - 1
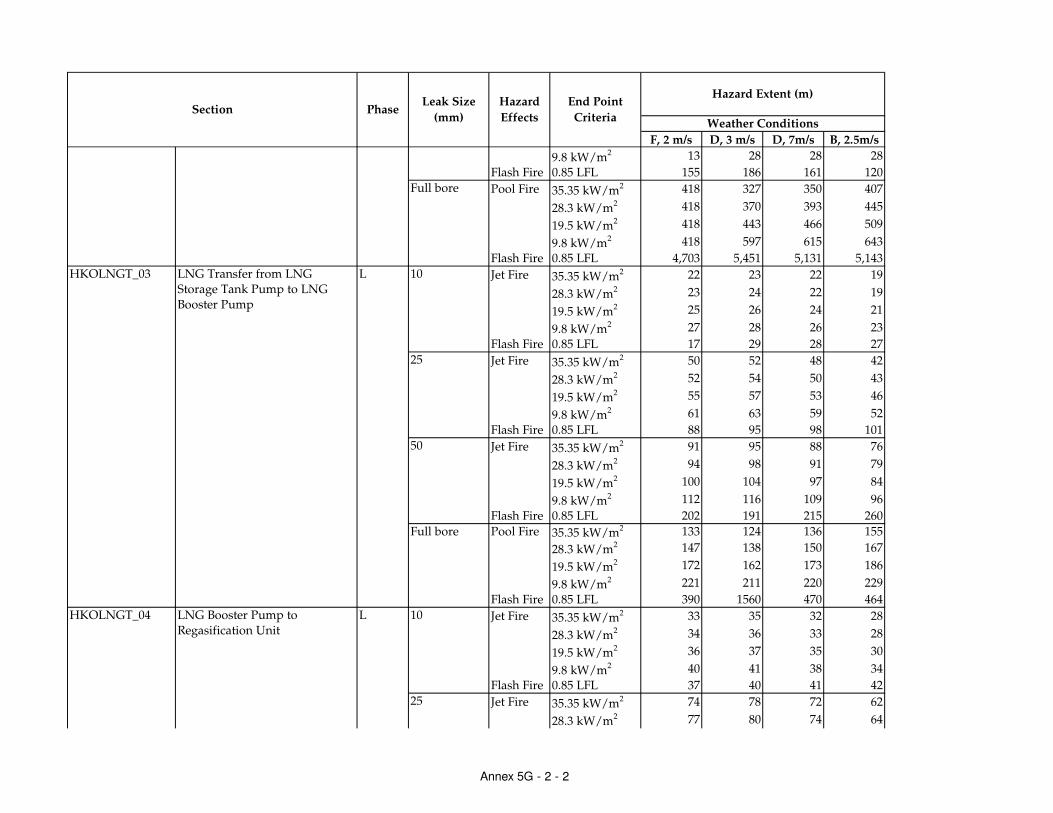
F, 2 m/s D, 3 m/s D, 7m/s B, 2.5m/s
Hazard Extent (m)
Weather Conditions
End Point
CriteriaSection
Hazard
EffectsPhase
Leak Size
(mm)
9.8 kW/m2 13 28 28 28
Flash Fire 0.85 LFL 155 186 161 120
Pool Fire 35.35 kW/m2 418 327 350 407
28.3 kW/m2 418 370 393 445
19.5 kW/m2 418 443 466 509
9.8 kW/m2 418 597 615 643
Flash Fire 0.85 LFL 4,703 5,451 5,131 5,143
Jet Fire 35.35 kW/m2 22 23 22 19
28.3 kW/m2 23 24 22 19
19.5 kW/m2 25 26 24 21
9.8 kW/m2 27 28 26 23
Flash Fire 0.85 LFL 17 29 28 27
Jet Fire 35.35 kW/m2 50 52 48 42
28.3 kW/m2 52 54 50 43
19.5 kW/m2 55 57 53 46
9.8 kW/m2 61 63 59 52
Flash Fire 0.85 LFL 88 95 98 101
Jet Fire 35.35 kW/m2 91 95 88 76
28.3 kW/m2 94 98 91 79
19.5 kW/m2 100 104 97 84
9.8 kW/m2 112 116 109 96
Flash Fire 0.85 LFL 202 191 215 260
Pool Fire 35.35 kW/m2 133 124 136 155
28.3 kW/m2 147 138 150 167
19.5 kW/m2 172 162 173 186
9.8 kW/m2 221 211 220 229
Flash Fire 0.85 LFL 390 1560 470 464
Jet Fire 35.35 kW/m2 33 35 32 28
28.3 kW/m2 34 36 33 28
19.5 kW/m2 36 37 35 30
9.8 kW/m2 40 41 38 34
Flash Fire 0.85 LFL 37 40 41 42
Jet Fire 35.35 kW/m2 74 78 72 62
28.3 kW/m2 77 80 74 64
Full bore
10
25
10
25
50
Full bore
LNG Transfer from LNG Storage Tank Pump to LNG Booster Pump
L
HKOLNGT_04 LNG Booster Pump to Regasification Unit
L
HKOLNGT_03
Annex 5G - 2 - 2
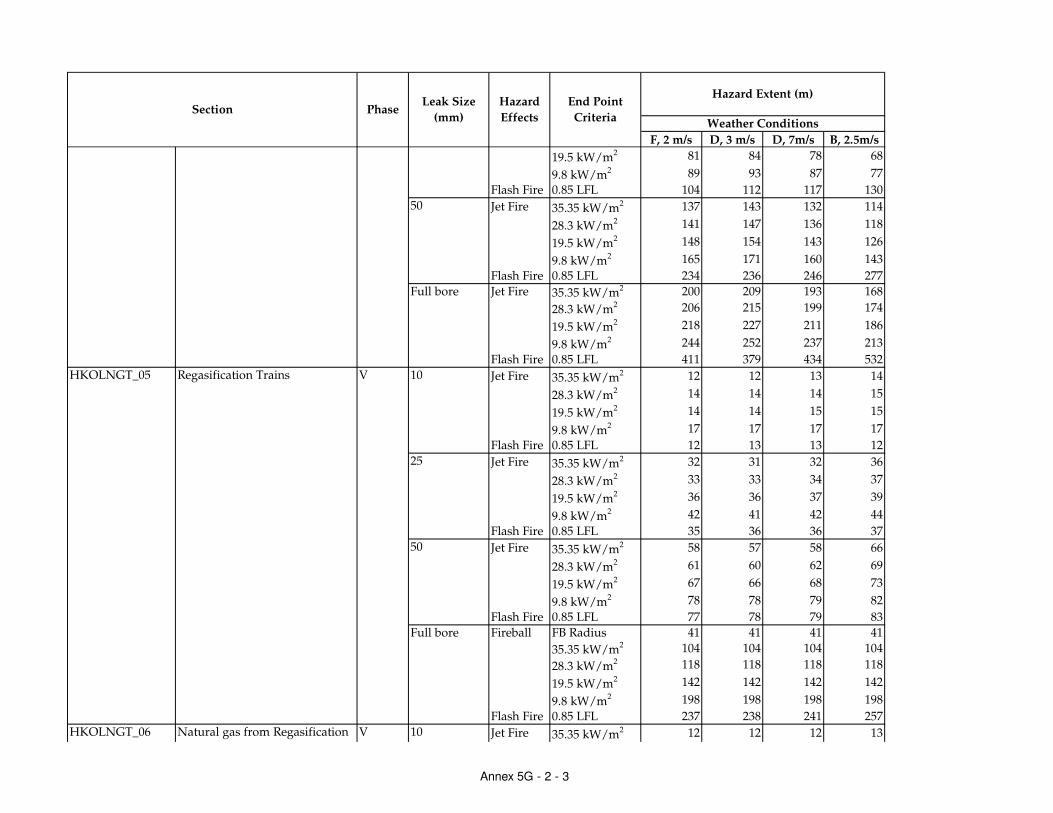
F, 2 m/s D, 3 m/s D, 7m/s B, 2.5m/s
Hazard Extent (m)
Weather Conditions
End Point
CriteriaSection
Hazard
EffectsPhase
Leak Size
(mm)
19.5 kW/m2 81 84 78 68
9.8 kW/m2 89 93 87 77
Flash Fire 0.85 LFL 104 112 117 130
Jet Fire 35.35 kW/m2 137 143 132 114
28.3 kW/m2 141 147 136 118
19.5 kW/m2 148 154 143 126
9.8 kW/m2 165 171 160 143
Flash Fire 0.85 LFL 234 236 246 277
Jet Fire 35.35 kW/m2 200 209 193 168
28.3 kW/m2 206 215 199 174
19.5 kW/m2 218 227 211 186
9.8 kW/m2 244 252 237 213
Flash Fire 0.85 LFL 411 379 434 532
Jet Fire 35.35 kW/m2 12 12 13 14
28.3 kW/m2 14 14 14 15
19.5 kW/m2 14 14 15 15
9.8 kW/m2 17 17 17 17
Flash Fire 0.85 LFL 12 13 13 12
Jet Fire 35.35 kW/m2 32 31 32 36
28.3 kW/m2 33 33 34 37
19.5 kW/m2 36 36 37 39
9.8 kW/m2 42 41 42 44
Flash Fire 0.85 LFL 35 36 36 37
Jet Fire 35.35 kW/m2 58 57 58 66
28.3 kW/m2 61 60 62 69
19.5 kW/m2 67 66 68 73
9.8 kW/m2 78 78 79 82
Flash Fire 0.85 LFL 77 78 79 83
Fireball FB Radius 41 41 41 41
35.35 kW/m2 104 104 104 104
28.3 kW/m2 118 118 118 118
19.5 kW/m2 142 142 142 142
9.8 kW/m2 198 198 198 198
Flash Fire 0.85 LFL 237 238 241 257
Jet Fire 35.35 kW/m2 12 12 12 13
HKOLNGT_05 Regasification Trains V
HKOLNGT_06 Natural gas from Regasification Unit, via metering, to Jetty
V 10
Full bore
10
25
50
50
Full bore
Annex 5G - 2 - 3

F, 2 m/s D, 3 m/s D, 7m/s B, 2.5m/s
Hazard Extent (m)
Weather Conditions
End Point
CriteriaSection
Hazard
EffectsPhase
Leak Size
(mm)
28.3 kW/m2 13 13 13 14
19.5 kW/m2 14 14 14 15
9.8 kW/m2 16 16 17 17
Flash Fire 0.85 LFL 12 13 12 11
Jet Fire 35.35 kW/m2 31 31 32 35
28.3 kW/m2 32 32 33 37
19.5 kW/m2 36 35 36 39
9.8 kW/m2 41 41 41 43
Flash Fire 0.85 LFL 34 35 35 36
Jet Fire 35.35 kW/m2 57 57 57 65
28.3 kW/m2 60 59 61 68
19.5 kW/m2 66 65 67 72
9.8 kW/m2 77 77 77 80
Flash Fire 0.85 LFL 75 76 78 82
Fireball FB Radius 40 40 40 40
35.35 kW/m2 103 103 103 103
28.3 kW/m2 116 116 116 116
19.5 kW/m2 140 140 140 140
9.8 kW/m2 196 196 196 196
Flash Fire 0.85 LFL 231 233 237 251
Jet Fire 35.35 kW/m2 12 12 12 13
28.3 kW/m2 13 13 13 14
19.5 kW/m2 14 14 14 15
9.8 kW/m2 16 16 17 17
Flash Fire 0.85 LFL 12 13 12 11
Jet Fire 35.35 kW/m2 31 31 32 35
28.3 kW/m2 32 32 33 37
19.5 kW/m2 36 35 36 39
9.8 kW/m2 41 41 41 43
Flash Fire 0.85 LFL 34 35 35 36
Jet Fire 35.35 kW/m2 57 57 57 65
28.3 kW/m2 60 59 61 68
19.5 kW/m2 66 65 67 72
9.8 kW/m2 77 77 77 80
Unit, via metering, to Jetty (including HP Gas Loading Arm)
50
HKOLNGT_07 Natural gas in Jetty to ESDV of Riser for BPPS Subsea Pipeline
V
25
50
10
Full bore
25
Annex 5G - 2 - 4
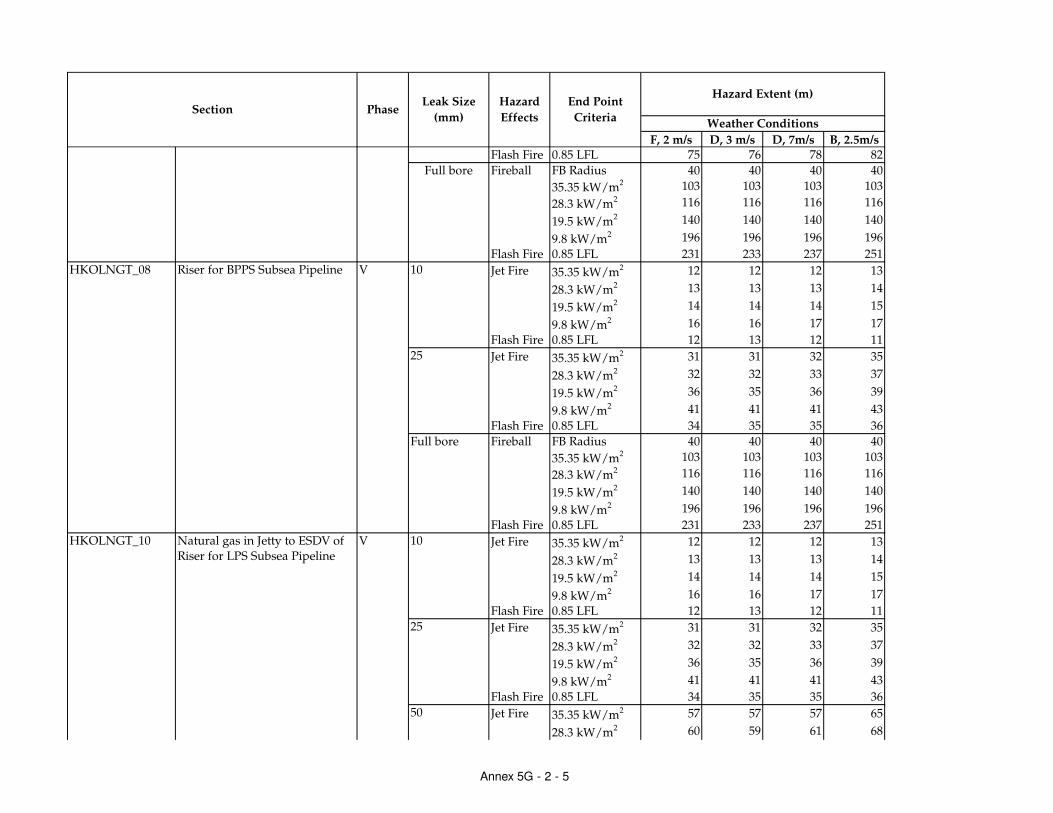
F, 2 m/s D, 3 m/s D, 7m/s B, 2.5m/s
Hazard Extent (m)
Weather Conditions
End Point
CriteriaSection
Hazard
EffectsPhase
Leak Size
(mm)
Flash Fire 0.85 LFL 75 76 78 82
Fireball FB Radius 40 40 40 40
35.35 kW/m2 103 103 103 103
28.3 kW/m2 116 116 116 116
19.5 kW/m2 140 140 140 140
9.8 kW/m2 196 196 196 196
Flash Fire 0.85 LFL 231 233 237 251
Jet Fire 35.35 kW/m2 12 12 12 13
28.3 kW/m2 13 13 13 14
19.5 kW/m2 14 14 14 15
9.8 kW/m2 16 16 17 17
Flash Fire 0.85 LFL 12 13 12 11
Jet Fire 35.35 kW/m2 31 31 32 35
28.3 kW/m2 32 32 33 37
19.5 kW/m2 36 35 36 39
9.8 kW/m2 41 41 41 43
Flash Fire 0.85 LFL 34 35 35 36
Jet Fire 35.35 kW/m2 57 57 57 65
28.3 kW/m2 60 59 61 68
HKOLNGT_08 Riser for BPPS Subsea Pipeline V
HKOLNGT_10 Natural gas in Jetty to ESDV of Riser for LPS Subsea Pipeline
V
25
10
Full bore
Full bore
10
25
50
Annex 5G - 2 - 5
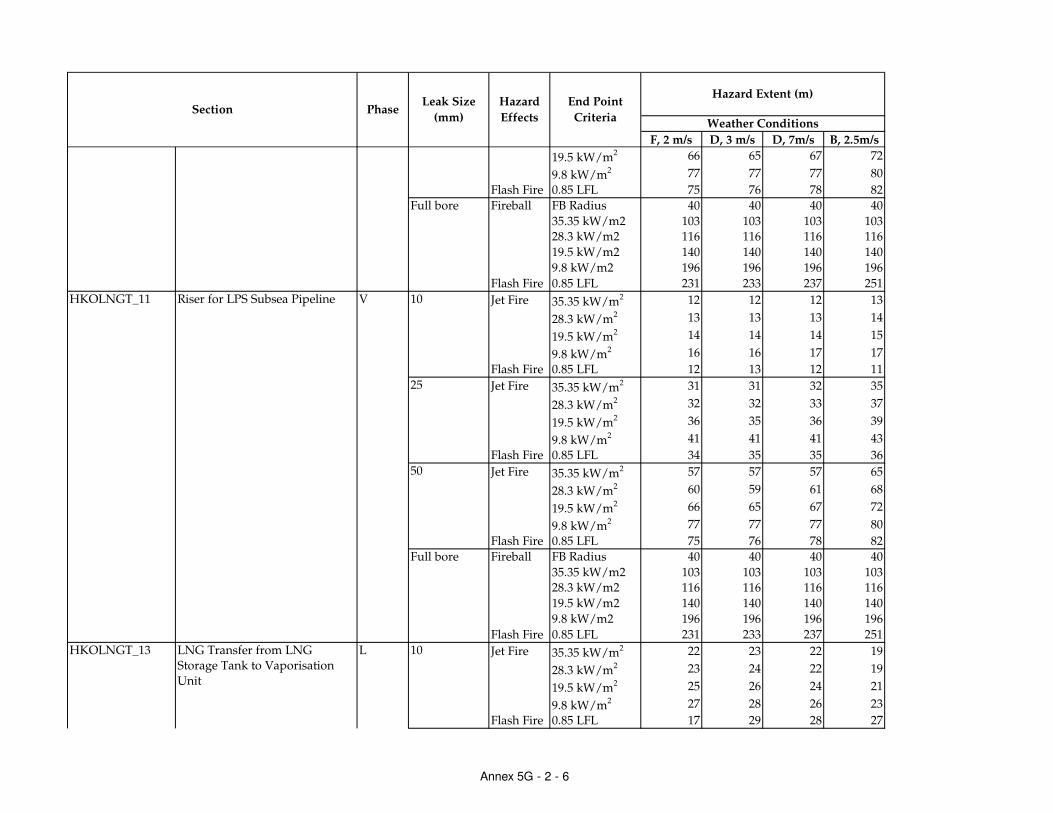
F, 2 m/s D, 3 m/s D, 7m/s B, 2.5m/s
Hazard Extent (m)
Weather Conditions
End Point
CriteriaSection
Hazard
EffectsPhase
Leak Size
(mm)
19.5 kW/m2 66 65 67 72
9.8 kW/m2 77 77 77 80
Flash Fire 0.85 LFL 75 76 78 82
Fireball FB Radius 40 40 40 40
35.35 kW/m2 103 103 103 103 28.3 kW/m2 116 116 116 116
19.5 kW/m2 140 140 140 140
9.8 kW/m2 196 196 196 196
Flash Fire 0.85 LFL 231 233 237 251
Jet Fire 35.35 kW/m2 12 12 12 13
28.3 kW/m2 13 13 13 14
19.5 kW/m2 14 14 14 15
9.8 kW/m2 16 16 17 17
Flash Fire 0.85 LFL 12 13 12 11
Jet Fire 35.35 kW/m2 31 31 32 35
28.3 kW/m2 32 32 33 37
19.5 kW/m2 36 35 36 39
9.8 kW/m2 41 41 41 43
Flash Fire 0.85 LFL 34 35 35 36
Jet Fire 35.35 kW/m2 57 57 57 65
28.3 kW/m2 60 59 61 68
19.5 kW/m2 66 65 67 72
9.8 kW/m2 77 77 77 80
Flash Fire 0.85 LFL 75 76 78 82
Fireball FB Radius 40 40 40 40
35.35 kW/m2 103 103 103 103 28.3 kW/m2 116 116 116 116
19.5 kW/m2 140 140 140 140
9.8 kW/m2 196 196 196 196
Flash Fire 0.85 LFL 231 233 237 251
Jet Fire 35.35 kW/m2 22 23 22 19
28.3 kW/m2 23 24 22 19
19.5 kW/m2 25 26 24 21
9.8 kW/m2 27 28 26 23
Flash Fire 0.85 LFL 17 29 28 27
HKOLNGT_11 Riser for LPS Subsea Pipeline V
LLNG Transfer from LNG Storage Tank to Vaporisation Unit
HKOLNGT_13 10
Full bore
10
25
50
Full bore
Annex 5G - 2 - 6
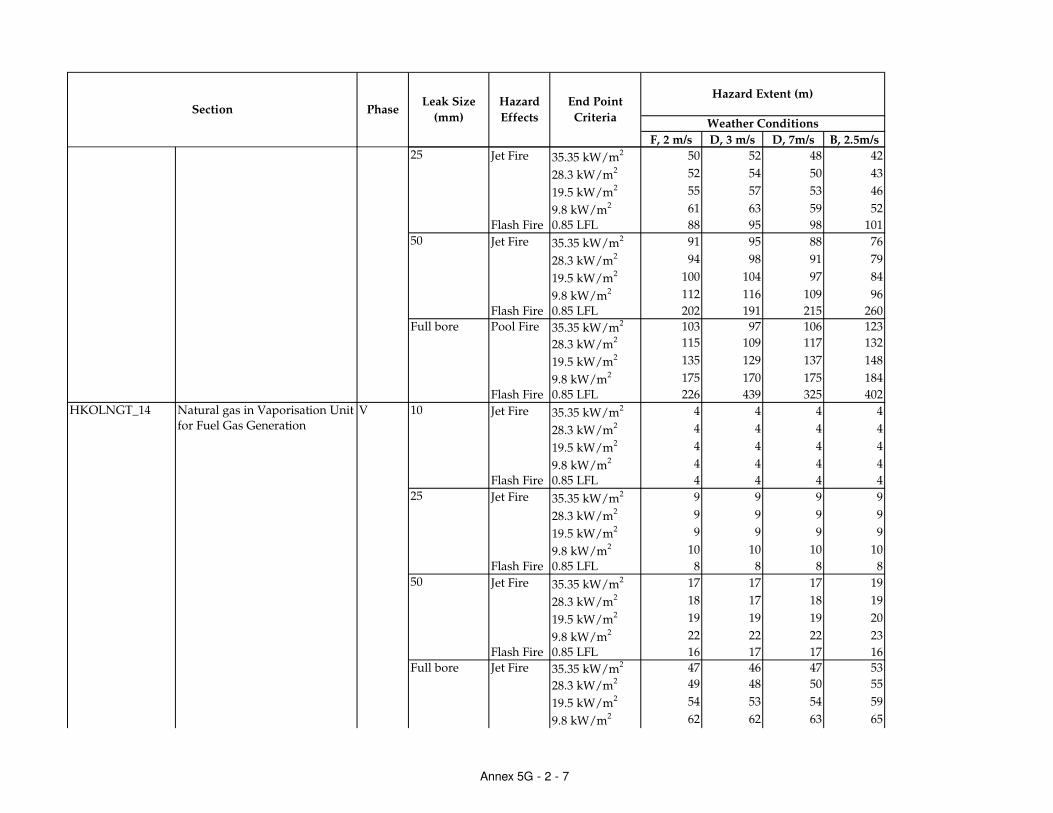
F, 2 m/s D, 3 m/s D, 7m/s B, 2.5m/s
Hazard Extent (m)
Weather Conditions
End Point
CriteriaSection
Hazard
EffectsPhase
Leak Size
(mm)
Jet Fire 35.35 kW/m2 50 52 48 42
28.3 kW/m2 52 54 50 43
19.5 kW/m2 55 57 53 46
9.8 kW/m2 61 63 59 52
Flash Fire 0.85 LFL 88 95 98 101
Jet Fire 35.35 kW/m2 91 95 88 76
28.3 kW/m2 94 98 91 79
19.5 kW/m2 100 104 97 84
9.8 kW/m2 112 116 109 96
Flash Fire 0.85 LFL 202 191 215 260
Pool Fire 35.35 kW/m2 103 97 106 123
28.3 kW/m2 115 109 117 132
19.5 kW/m2 135 129 137 148
9.8 kW/m2 175 170 175 184
Flash Fire 0.85 LFL 226 439 325 402
Jet Fire 35.35 kW/m2 4 4 4 4
28.3 kW/m2 4 4 4 4
19.5 kW/m2 4 4 4 4
9.8 kW/m2 4 4 4 4
Flash Fire 0.85 LFL 4 4 4 4
Jet Fire 35.35 kW/m2 9 9 9 9
28.3 kW/m2 9 9 9 9
19.5 kW/m2 9 9 9 9
9.8 kW/m2 10 10 10 10
Flash Fire 0.85 LFL 8 8 8 8
Jet Fire 35.35 kW/m2 17 17 17 19
28.3 kW/m2 18 17 18 19
19.5 kW/m2 19 19 19 20
9.8 kW/m2 22 22 22 23
Flash Fire 0.85 LFL 16 17 17 16
Jet Fire 35.35 kW/m2 47 46 47 53
28.3 kW/m2 49 48 50 55
19.5 kW/m2 54 53 54 59
9.8 kW/m2 62 62 63 65
VNatural gas in Vaporisation Unit for Fuel Gas Generation
HKOLNGT_14
25
50
Full bore
50
Full bore
10
25
Annex 5G - 2 - 7

F, 2 m/s D, 3 m/s D, 7m/s B, 2.5m/s
Hazard Extent (m)
Weather Conditions
End Point
CriteriaSection
Hazard
EffectsPhase
Leak Size
(mm)
Flash Fire 0.85 LFL 56 58 58 61
Jet Fire 35.35 kW/m2 3 3 3 3
28.3 kW/m2 3 3 3 3
19.5 kW/m2 3 3 3 3
9.8 kW/m2 3 3 3 3
Flash Fire 0.85 LFL 3 3 3 3
Jet Fire 35.35 kW/m2 6 6 6 6
28.3 kW/m2 6 6 6 6
19.5 kW/m2 6 6 6 6
9.8 kW/m2 6 6 6 6
Flash Fire 0.85 LFL 5 6 6 5
Jet Fire 35.35 kW/m2 10 10 10 10
28.3 kW/m2 10 10 10 12
19.5 kW/m2 10 10 10 13
9.8 kW/m2 12 11 12 14
Flash Fire 0.85 LFL 10 11 10 10
Jet Fire 35.35 kW/m2 24 23 25 32
28.3 kW/m2 25 25 26 33
19.5 kW/m2 27 26 28 33
9.8 kW/m2 33 32 33 36
Flash Fire 0.85 LFL 37 37 38 38
Jet Fire 35.35 kW/m2 4 4 4 4
28.3 kW/m2 4 4 4 4
19.5 kW/m2 4 4 4 4
9.8 kW/m2 4 4 4 4
Flash Fire 0.85 LFL 3 4 4 4
Jet Fire 35.35 kW/m2 9 9 9 8
28.3 kW/m2 9 9 9 8
19.5 kW/m2 9 9 9 8
9.8 kW/m2 10 10 10 10
Flash Fire 0.85 LFL 8 8 8 8
Jet Fire 35.35 kW/m2 17 17 17 18
28.3 kW/m2 18 17 18 19
19.5 kW/m2 19 19 19 21
HKOLNGT_15 BOG from LNG Storage Tank to BOG Compressor
V
HKOLNGT_16 Compressed BOG for fuel gas use in power generation
V
50
Full bore
10
25
10
25
50
Annex 5G - 2 - 8
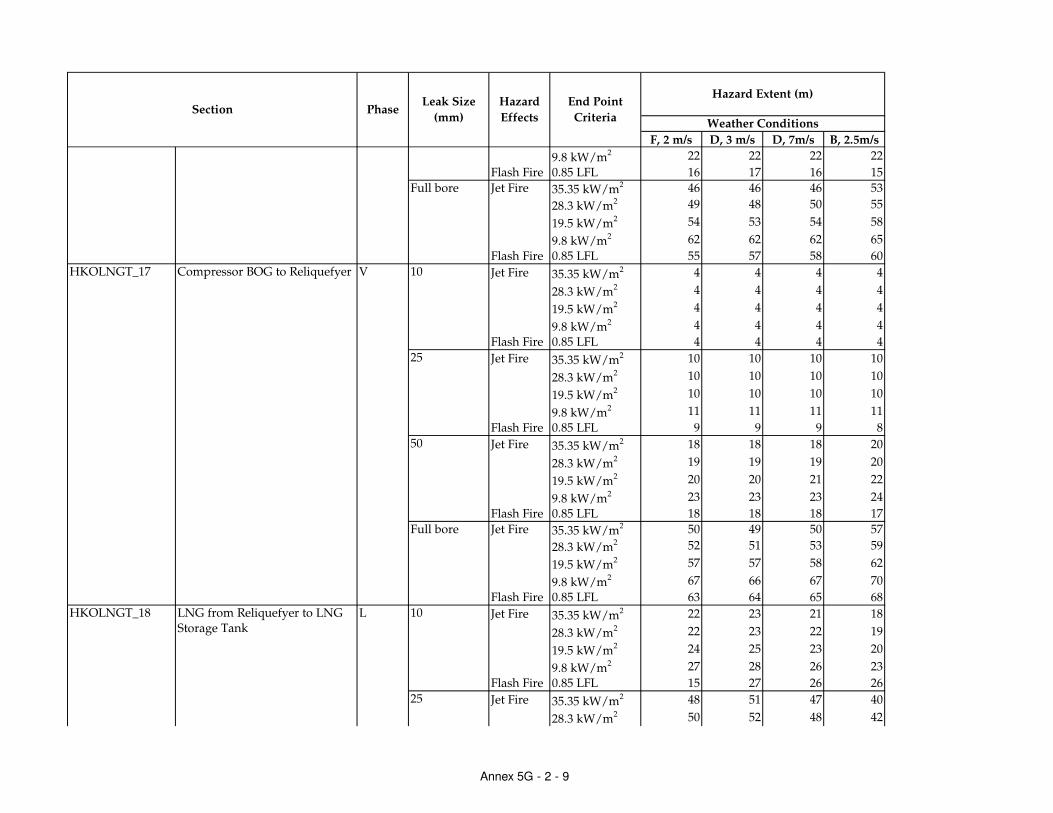
F, 2 m/s D, 3 m/s D, 7m/s B, 2.5m/s
Hazard Extent (m)
Weather Conditions
End Point
CriteriaSection
Hazard
EffectsPhase
Leak Size
(mm)
9.8 kW/m2 22 22 22 22
Flash Fire 0.85 LFL 16 17 16 15
Jet Fire 35.35 kW/m2 46 46 46 53
28.3 kW/m2 49 48 50 55
19.5 kW/m2 54 53 54 58
9.8 kW/m2 62 62 62 65
Flash Fire 0.85 LFL 55 57 58 60
Jet Fire 35.35 kW/m2 4 4 4 4
28.3 kW/m2 4 4 4 4
19.5 kW/m2 4 4 4 4
9.8 kW/m2 4 4 4 4
Flash Fire 0.85 LFL 4 4 4 4
Jet Fire 35.35 kW/m2 10 10 10 10
28.3 kW/m2 10 10 10 10
19.5 kW/m2 10 10 10 10
9.8 kW/m2 11 11 11 11
Flash Fire 0.85 LFL 9 9 9 8
Jet Fire 35.35 kW/m2 18 18 18 20
28.3 kW/m2 19 19 19 20
19.5 kW/m2 20 20 21 22
9.8 kW/m2 23 23 23 24
Flash Fire 0.85 LFL 18 18 18 17
Jet Fire 35.35 kW/m2 50 49 50 57
28.3 kW/m2 52 51 53 59
19.5 kW/m2 57 57 58 62
9.8 kW/m2 67 66 67 70
Flash Fire 0.85 LFL 63 64 65 68
Jet Fire 35.35 kW/m2 22 23 21 18
28.3 kW/m2 22 23 22 19
19.5 kW/m2 24 25 23 20
9.8 kW/m2 27 28 26 23
Flash Fire 0.85 LFL 15 27 26 26
Jet Fire 35.35 kW/m2 48 51 47 40
28.3 kW/m2 50 52 48 42
HKOLNGT_17 Compressor BOG to Reliquefyer V
HKOLNGT_18 LNG from Reliquefyer to LNG Storage Tank
L 10
25
25
50
Full bore
Full bore
10
Annex 5G - 2 - 9

F, 2 m/s D, 3 m/s D, 7m/s B, 2.5m/s
Hazard Extent (m)
Weather Conditions
End Point
CriteriaSection
Hazard
EffectsPhase
Leak Size
(mm)
19.5 kW/m2 53 55 51 45
9.8 kW/m2 59 61 58 51
Flash Fire 0.85 LFL 84 93 96 97
Jet Fire 35.35 kW/m2 89 92 85 74
28.3 kW/m2 92 96 88 77
19.5 kW/m2 97 101 94 82
9.8 kW/m2 109 113 106 94
Flash Fire 0.85 LFL 199 186 211 251
Pool Fire 35.35 kW/m2 73 69 75 87
28.3 kW/m2 82 77 83 94
19.5 kW/m2 95 91 96 104
9.8 kW/m2 123 118 122 128
Flash Fire 0.85 LFL 816 692 827 512
Jet Fire 35.35 kW/m2 3 3 3 3
28.3 kW/m2 3 3 3 3
19.5 kW/m2 3 3 3 3
9.8 kW/m2 3 3 3 3
Flash Fire 0.85 LFL 3 3 3 3
Jet Fire 35.35 kW/m2 6 6 6 6
28.3 kW/m2 6 6 6 6
19.5 kW/m2 6 6 6 6
9.8 kW/m2 6 6 6 6
Flash Fire 0.85 LFL 5 6 6 5
Jet Fire 35.35 kW/m2 10 9 10 10
28.3 kW/m2 10 9 10 12
19.5 kW/m2 10 9 10 13
9.8 kW/m2 12 11 12 14
Flash Fire 0.85 LFL 10 11 10 10
Jet Fire 35.35 kW/m2 24 23 25 32
28.3 kW/m2 25 25 26 33
19.5 kW/m2 27 26 28 33
9.8 kW/m2 33 32 33 36
Flash Fire 0.85 LFL 37 37 38 38
Jet Fire 35.35 kW/m2 3 3 3 3
HKOLNGT_19 BOG in Gas Combustion Unit V
HKOLNGT_20 LNGC Vapour (BOG) return line during loadout operation
V
50
Full bore
10
Full bore
10
25
50
Annex 5G - 2 - 10

F, 2 m/s D, 3 m/s D, 7m/s B, 2.5m/s
Hazard Extent (m)
Weather Conditions
End Point
CriteriaSection
Hazard
EffectsPhase
Leak Size
(mm)
28.3 kW/m2 3 3 3 3
19.5 kW/m2 3 3 3 3
9.8 kW/m2 3 3 3 3
Flash Fire 0.85 LFL 3 3 3 3
Jet Fire 35.35 kW/m2 7 7 7 7
28.3 kW/m2 7 7 7 7
19.5 kW/m2 7 7 7 7
9.8 kW/m2 7 7 7 8
Flash Fire 0.85 LFL 6 7 7 6
Jet Fire 35.35 kW/m2 12 12 12 12
28.3 kW/m2 12 12 12 15
19.5 kW/m2 14 13 14 15
9.8 kW/m2 16 16 16 17
Flash Fire 0.85 LFL 12 13 13 12
Jet Fire 35.35 kW/m2 33 33 34 40
28.3 kW/m2 34 34 35 42
19.5 kW/m2 38 37 39 44
9.8 kW/m2 45 44 45 48
Flash Fire 0.85 LFL 46 46 47 49
Jet Fire 35.35 kW/m2 3 3 3 3
28.3 kW/m2 3 3 3 3
19.5 kW/m2 3 3 3 3
9.8 kW/m2 3 3 3 3
Flash Fire 0.85 LFL 3 3 3 3
Jet Fire 35.35 kW/m2 7 7 7 7
28.3 kW/m2 7 7 7 7
19.5 kW/m2 7 7 7 7
9.8 kW/m2 7 7 7 8
Flash Fire 0.85 LFL 6 7 7 6
Jet Fire 35.35 kW/m2 12 12 12 13
28.3 kW/m2 12 12 12 15
19.5 kW/m2 14 13 14 15
9.8 kW/m2 16 16 16 17
Flash Fire 0.85 LFL 12 13 13 12
during loadout operation
HKOLNGT_21 FSRU Vapour (BOG) return line during loadout operation
V 10
25
50
25
50
Full bore
Annex 5G - 2 - 11

F, 2 m/s D, 3 m/s D, 7m/s B, 2.5m/s
Hazard Extent (m)
Weather Conditions
End Point
CriteriaSection
Hazard
EffectsPhase
Leak Size
(mm)
Jet Fire 35.35 kW/m2 33 33 34 40
28.3 kW/m2 34 34 35 42
19.5 kW/m2 38 37 39 44
9.8 kW/m2 45 44 45 48
Flash Fire 0.85 LFL 46 46 47 49
Jet Fire 35.35 kW/m2 4 4 4 4
28.3 kW/m2 4 4 4 4
19.5 kW/m2 4 4 4 4
9.8 kW/m2 4 4 4 4
Flash Fire 0.85 LFL 4 4 4 4
Jet Fire 35.35 kW/m2 9 9 9 9
28.3 kW/m2 9 9 9 9
19.5 kW/m2 9 9 9 9
9.8 kW/m2 10 10 10 10
Flash Fire 0.85 LFL 8 8 8 8
Jet Fire 35.35 kW/m2 17 17 17 19
28.3 kW/m2 18 17 18 19
19.5 kW/m2 19 19 19 20
9.8 kW/m2 22 22 22 23
Flash Fire 0.85 LFL 16 17 17 16
Pool Fire 35.35 kW/m2 10 10 11 12
28.3 kW/m2 11 11 12 15
19.5 kW/m2 14 14 15 16
9.8 kW/m2 17 17 18 19
Flash Fire 0.85 LFL 2 2 2 2
Pool Fire 35.35 kW/m2 14 14 14 15
28.3 kW/m2 14 14 15 15
19.5 kW/m2 18 17 19 21
9.8 kW/m2 26 25 27 29
Flash Fire 0.85 LFL 7 7 7 7
Pool Fire 35.35 kW/m2 12 12 12 12
28.3 kW/m2 12 12 12 12
19.5 kW/m2 21 21 21 22
9.8 kW/m2 30 29 31 35
HKOLNGT_23 Diesel (Heavy Fuel Oil) Storage System
L
HKOLNGT_22 Fuel gas line from Regasification Unit
V
50
50
10
25
Full bore
10
25
Annex 5G - 2 - 12

F, 2 m/s D, 3 m/s D, 7m/s B, 2.5m/s
Hazard Extent (m)
Weather Conditions
End Point
CriteriaSection
Hazard
EffectsPhase
Leak Size
(mm)
Flash Fire 0.85 LFL 8 7 8 8
Pool Fire 35.35 kW/m2 36 36 36 36
28.3 kW/m2 36 36 36 36
19.5 kW/m2 47 47 47 48
9.8 kW/m2 53 52 55 59
Flash Fire 0.85 LFL 10 8 9 9
Pool Fire 35.35 kW/m2 10 10 11 12
28.3 kW/m2 11 11 12 15
19.5 kW/m2 14 14 15 16
9.8 kW/m2 17 17 18 19
Flash Fire 0.85 LFL 5 5 6 6
Pool Fire 35.35 kW/m2 14 14 14 15
28.3 kW/m2 14 14 15 15
19.5 kW/m2 18 17 19 21
9.8 kW/m2 26 25 27 29
Flash Fire 0.85 LFL 7 7 7 7
Pool Fire 35.35 kW/m2 12 12 12 12
28.3 kW/m2 12 12 12 12
19.5 kW/m2 21 21 21 22
9.8 kW/m2 30 29 31 35
Flash Fire 0.85 LFL 8 7 8 8
Pool Fire 35.35 kW/m2 36 36 36 36
28.3 kW/m2 36 36 36 36
19.5 kW/m2 47 47 47 48
9.8 kW/m2 53 52 55 59
Flash Fire 0.85 LFL 10 8 9 9
Pool Fire 35.35 kW/m2 10 10 11 12
28.3 kW/m2 11 11 12 15
19.5 kW/m2 14 14 15 16
9.8 kW/m2 17 17 18 19
Pool Fire 35.35 kW/m2 14 14 14 15
28.3 kW/m2 14 14 15 15
19.5 kW/m2 18 17 19 21
9.8 kW/m2 26 25 27 29
HKOLNGT_25 Lubricating Oil Storage System L
HKOLNGT_24 Marine Diesel Oil Storage System
L
10
25
25
50
Catastrophic Rupture
Catastrophic Rupture
10
Annex 5G - 2 - 13

F, 2 m/s D, 3 m/s D, 7m/s B, 2.5m/s
Hazard Extent (m)
Weather Conditions
End Point
CriteriaSection
Hazard
EffectsPhase
Leak Size
(mm)
Pool Fire 35.35 kW/m2 12 12 12 12
28.3 kW/m2 12 12 12 12
19.5 kW/m2 21 21 21 22
9.8 kW/m2 30 29 31 35
Pool Fire 35.35 kW/m2 36 36 36 36
28.3 kW/m2 36 36 36 36
19.5 kW/m2 47 47 47 48
9.8 kW/m2 53 52 55 59
Catastrophic Rupture
50
Annex 5G - 2 - 14

Annex 5G-3
Consequence Analysis
Results for GRSs at BPPS

F, 2 m/s D, 3 m/s D, 7m/s B, 2.5m/s
Jet Fire 35.35 kW/m2 17 17 18 17
28.3 kW/m2 17 18 19 18
19.5 kW/m2 19 19 20 19
9.8 kW/m2 22 22 22 22
Flash Fire 0.85 LFL 14 14 13 13
Jet Fire 35.35 kW/m2 39 40 45 39
28.3 kW/m2 41 42 47 42
19.5 kW/m2 45 46 50 46
9.8 kW/m2 53 53 55 53
Flash Fire 0.85 LFL 40 40 40 39
Jet Fire 35.35 kW/m2 70 71 81 71
28.3 kW/m2 73 76 84 75
19.5 kW/m2 82 83 89 82
9.8 kW/m2 97 98 101 97
Flash Fire 0.85 LFL 86 87 92 85
Jet Fire 35.35 kW/m2 125 126 139 126
28.3 kW/m2 131 132 145 131
19.5 kW/m2 144 147 156 146
9.8 kW/m2 176 178 180 177
Flash Fire 0.85 LFL 183 184 195 179
Fireball Fireball Radius 135 135 135 135
35.35 kW/m2 320 320 320 320
28.3 kW/m2 361 361 361 361
19.5 kW/m2 435 435 435 435
9.8 kW/m2 605 605 605 605
Hazard
Effects
End Point
CriteriaSection Phase
Leak Size
(mm)
Hazard Extent (m)
Weather Conditions
BPPS_GRS_01 Above ground piping from
shore end to pig receiver of Y13-
1 GRS
V 10
25
50
100
Full bore
Annex 5G - 3 - 1
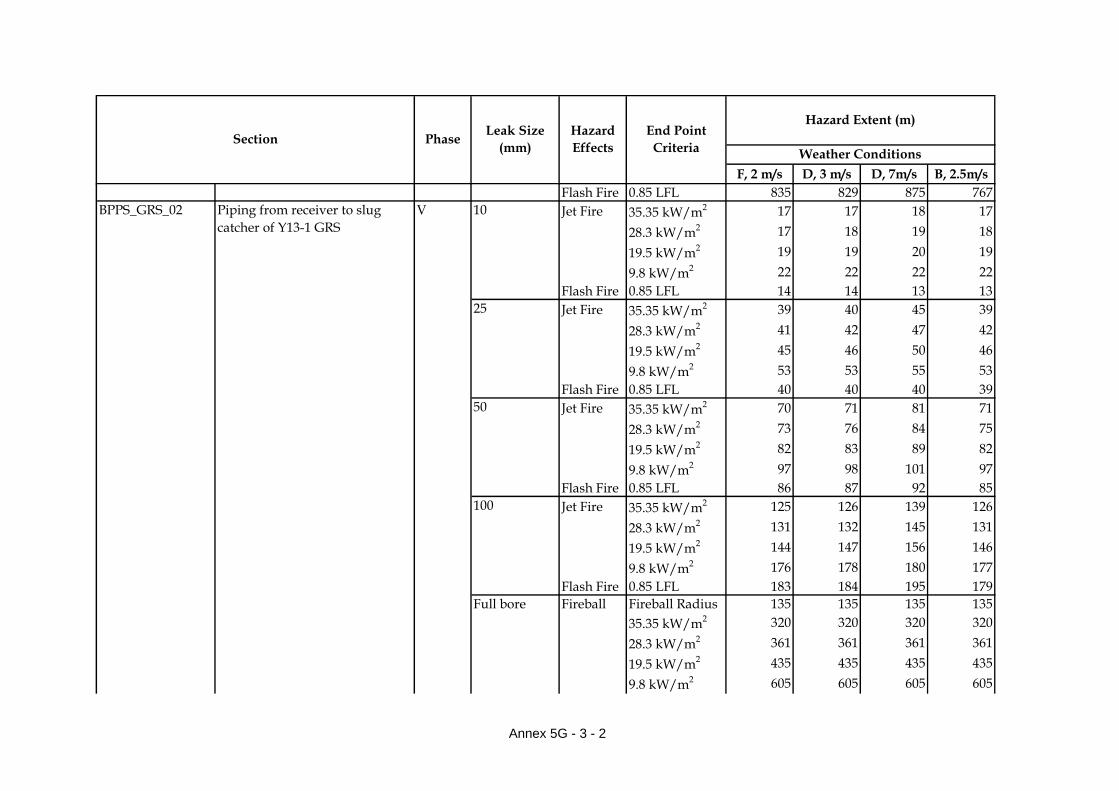
F, 2 m/s D, 3 m/s D, 7m/s B, 2.5m/s
Hazard
Effects
End Point
CriteriaSection Phase
Leak Size
(mm)
Hazard Extent (m)
Weather Conditions
Flash Fire 0.85 LFL 835 829 875 767
Jet Fire 35.35 kW/m2 17 17 18 17
28.3 kW/m2 17 18 19 18
19.5 kW/m2 19 19 20 19
9.8 kW/m2 22 22 22 22
Flash Fire 0.85 LFL 14 14 13 13
Jet Fire 35.35 kW/m2 39 40 45 39
28.3 kW/m2 41 42 47 42
19.5 kW/m2 45 46 50 46
9.8 kW/m2 53 53 55 53
Flash Fire 0.85 LFL 40 40 40 39
Jet Fire 35.35 kW/m2 70 71 81 71
28.3 kW/m2 73 76 84 75
19.5 kW/m2 82 83 89 82
9.8 kW/m2 97 98 101 97
Flash Fire 0.85 LFL 86 87 92 85
Jet Fire 35.35 kW/m2 125 126 139 126
28.3 kW/m2 131 132 145 131
19.5 kW/m2 144 147 156 146
9.8 kW/m2 176 178 180 177
Flash Fire 0.85 LFL 183 184 195 179
Fireball Fireball Radius 135 135 135 135
35.35 kW/m2 320 320 320 320
28.3 kW/m2 361 361 361 361
19.5 kW/m2 435 435 435 435
9.8 kW/m2 605 605 605 605
BPPS_GRS_01 Above ground piping from
shore end to pig receiver of Y13-
1 GRS
V
BPPS_GRS_02 Piping from receiver to slug
catcher of Y13-1 GRS
V 10
100
Full bore
25
50
Full bore
Annex 5G - 3 - 2

F, 2 m/s D, 3 m/s D, 7m/s B, 2.5m/s
Hazard
Effects
End Point
CriteriaSection Phase
Leak Size
(mm)
Hazard Extent (m)
Weather Conditions
Flash Fire 0.85 LFL 835 829 875 767
Jet Fire 35.35 kW/m2 17 17 18 17
28.3 kW/m2 17 18 19 18
19.5 kW/m2 19 19 20 19
9.8 kW/m2 22 22 22 22
Flash Fire 0.85 LFL 14 14 13 13
Jet Fire 35.35 kW/m2 39 40 45 39
28.3 kW/m2 41 42 47 42
19.5 kW/m2 45 46 50 46
9.8 kW/m2 53 53 55 53
Flash Fire 0.85 LFL 40 40 40 39
Jet Fire 35.35 kW/m2 70 71 81 71
28.3 kW/m2 73 76 84 75
19.5 kW/m2 82 83 89 82
9.8 kW/m2 97 98 101 97
Flash Fire 0.85 LFL 86 87 92 85
Jet Fire 35.35 kW/m2 125 126 139 126
28.3 kW/m2 131 132 145 131
19.5 kW/m2 144 147 156 146
9.8 kW/m2 176 178 180 177
Flash Fire 0.85 LFL 183 184 195 179
Fireball Fireball Radius 135 135 135 135
35.35 kW/m2 320 320 320 320
28.3 kW/m2 361 361 361 361
19.5 kW/m2 435 435 435 435
9.8 kW/m2 605 605 605 605
BPPS_GRS_02 Piping from receiver to slug
catcher of Y13-1 GRS
V
10
25
Full bore
BPPS_GRS_03 Piping from slug catcher to inlet
gas filter separators of Y13-1
GRS
V
50
100
Full bore
Annex 5G - 3 - 3

F, 2 m/s D, 3 m/s D, 7m/s B, 2.5m/s
Hazard
Effects
End Point
CriteriaSection Phase
Leak Size
(mm)
Hazard Extent (m)
Weather Conditions
Flash Fire 0.85 LFL 835 829 875 767
Jet Fire 35.35 kW/m2 17 17 18 17
28.3 kW/m2 17 18 19 18
19.5 kW/m2 19 19 20 19
9.8 kW/m2 22 22 22 22
Flash Fire 0.85 LFL 14 14 13 13
Jet Fire 35.35 kW/m2 39 40 45 39
28.3 kW/m2 41 42 47 42
19.5 kW/m2 45 46 50 46
9.8 kW/m2 53 53 55 53
Flash Fire 0.85 LFL 40 40 40 39
Jet Fire 35.35 kW/m2 70 71 81 71
28.3 kW/m2 73 76 84 75
19.5 kW/m2 82 83 89 82
9.8 kW/m2 97 98 101 97
Flash Fire 0.85 LFL 86 87 92 85
Jet Fire 35.35 kW/m2 125 126 139 126
28.3 kW/m2 131 132 145 131
19.5 kW/m2 144 147 156 146
9.8 kW/m2 176 178 180 177
Flash Fire 0.85 LFL 183 184 195 179
Fireball Fireball Radius 135 135 135 135
35.35 kW/m2 320 320 320 320
28.3 kW/m2 361 361 361 361
19.5 kW/m2 435 435 435 435
9.8 kW/m2 605 605 605 605
BPPS_GRS_04 Piping from inlet gas filter
separator to gas heater of Y13-1
GRS
V 10
BPPS_GRS_03 Piping from slug catcher to inlet
gas filter separators of Y13-1
GRS
V
100
Full bore
25
50
Full bore
Annex 5G - 3 - 4

F, 2 m/s D, 3 m/s D, 7m/s B, 2.5m/s
Hazard
Effects
End Point
CriteriaSection Phase
Leak Size
(mm)
Hazard Extent (m)
Weather Conditions
Flash Fire 0.85 LFL 835 829 875 767
Jet Fire 35.35 kW/m2 17 17 18 17
28.3 kW/m2 17 18 19 18
19.5 kW/m2 19 19 20 19
9.8 kW/m2 22 22 22 22
Flash Fire 0.85 LFL 14 14 13 13
Jet Fire 35.35 kW/m2 39 40 45 39
28.3 kW/m2 41 42 47 42
19.5 kW/m2 45 46 50 46
9.8 kW/m2 53 53 55 53
Flash Fire 0.85 LFL 40 40 40 39
Jet Fire 35.35 kW/m2 70 71 81 71
28.3 kW/m2 73 76 84 75
19.5 kW/m2 82 83 89 82
9.8 kW/m2 97 98 101 97
Flash Fire 0.85 LFL 86 87 92 85
Jet Fire 35.35 kW/m2 125 126 139 126
28.3 kW/m2 131 132 145 131
19.5 kW/m2 144 147 156 146
9.8 kW/m2 176 178 180 177
Flash Fire 0.85 LFL 183 184 195 179
Fireball Fireball Radius 135 135 135 135
35.35 kW/m2 320 320 320 320
28.3 kW/m2 361 361 361 361
19.5 kW/m2 435 435 435 435
9.8 kW/m2 605 605 605 605
BPPS_GRS_04 Piping from inlet gas filter
separator to gas heater of Y13-1
GRS
V
10
25
Full bore
BPPS_GRS_05 Piping from gas heaters to
pressure reduction station,
including PRS of Y13-1 GRS
V
50
100
Full bore
Annex 5G - 3 - 5

F, 2 m/s D, 3 m/s D, 7m/s B, 2.5m/s
Hazard
Effects
End Point
CriteriaSection Phase
Leak Size
(mm)
Hazard Extent (m)
Weather Conditions
Flash Fire 0.85 LFL 835 829 875 767
Jet Fire 35.35 kW/m2 17 17 18 17
28.3 kW/m2 17 18 19 18
19.5 kW/m2 19 19 20 19
9.8 kW/m2 22 22 22 22
Flash Fire 0.85 LFL 14 14 13 13
Jet Fire 35.35 kW/m2 39 40 45 39
28.3 kW/m2 41 42 47 42
19.5 kW/m2 45 46 50 46
9.8 kW/m2 53 53 55 53
Flash Fire 0.85 LFL 40 40 40 39
Jet Fire 35.35 kW/m2 70 71 81 71
28.3 kW/m2 73 76 84 75
19.5 kW/m2 82 83 89 82
9.8 kW/m2 97 98 101 97
Flash Fire 0.85 LFL 86 87 92 85
Jet Fire 35.35 kW/m2 125 126 139 126
28.3 kW/m2 131 132 145 131
19.5 kW/m2 144 147 156 146
9.8 kW/m2 176 178 180 177
Flash Fire 0.85 LFL 183 184 195 179
Fireball Fireball Radius 135 135 135 135
35.35 kW/m2 320 320 320 320
28.3 kW/m2 361 361 361 361
19.5 kW/m2 435 435 435 435
9.8 kW/m2 605 605 605 605
BPPS_GRS_06 Piping from pressure reduction
station to outlet gas filter
separator of Y13-1 GRS
V 10
BPPS_GRS_05 Piping from gas heaters to
pressure reduction station,
including PRS of Y13-1 GRS
V
100
Full bore
25
50
Full bore
Annex 5G - 3 - 6

F, 2 m/s D, 3 m/s D, 7m/s B, 2.5m/s
Hazard
Effects
End Point
CriteriaSection Phase
Leak Size
(mm)
Hazard Extent (m)
Weather Conditions
Flash Fire 0.85 LFL 835 829 875 767
Jet Fire 35.35 kW/m2 0 0 0 0
28.3 kW/m2 0 0 0 0
19.5 kW/m2 8 0 0 8
9.8 kW/m2 10 10 10 10
Flash Fire 0.85 LFL 7 7 6 6
Jet Fire 35.35 kW/m2 20 20 22 20
28.3 kW/m2 21 21 23 21
19.5 kW/m2 22 23 24 23
9.8 kW/m2 26 26 27 26
Flash Fire 0.85 LFL 17 17 16 16
Jet Fire 35.35 kW/m2 38 39 44 38
28.3 kW/m2 40 41 45 40
19.5 kW/m2 44 45 48 44
9.8 kW/m2 50 51 53 51
Flash Fire 0.85 LFL 37 37 38 36
Pool Fire 35.35 kW/m2 68 69 78 69
28.3 kW/m2 71 73 81 72
19.5 kW/m2 79 80 86 80
9.8 kW/m2 93 94 97 94
Flash Fire 0.85 LFL 81 81 85 78
Fireball Fireball Radius 83 83 83 83
35.35 kW/m2 204 204 204 204
28.3 kW/m2 229 229 229 229
19.5 kW/m2 277 277 277 277
9.8 kW/m2 387 387 387 387
BPPS_GRS_06 Piping from pressure reduction
station to outlet gas filter
separator of Y13-1 GRS
V
10
25
Full bore
BPPS_GRS_07 Piping from outlet gas filter
separator to manifold, including
sales gas meter unit of Y13-1
GRS
V
50
100
Full bore
Annex 5G - 3 - 7

F, 2 m/s D, 3 m/s D, 7m/s B, 2.5m/s
Hazard
Effects
End Point
CriteriaSection Phase
Leak Size
(mm)
Hazard Extent (m)
Weather Conditions
Flash Fire 0.85 LFL 472 477 501 426
Jet Fire 35.35 kW/m2 17 17 18 17
28.3 kW/m2 17 18 19 18
19.5 kW/m2 19 19 20 19
9.8 kW/m2 22 22 22 22
Flash Fire 0.85 LFL 14 14 13 13
Jet Fire 35.35 kW/m2 39 40 45 39
28.3 kW/m2 41 42 47 42
19.5 kW/m2 45 46 50 46
9.8 kW/m2 53 53 55 53
Flash Fire 0.85 LFL 40 40 40 39
Jet Fire 35.35 kW/m2 70 71 81 71
28.3 kW/m2 73 76 84 75
19.5 kW/m2 82 83 89 82
9.8 kW/m2 97 98 101 97
Flash Fire 0.85 LFL 86 87 92 85
Jet Fire 35.35 kW/m2 125 126 139 126
28.3 kW/m2 131 132 145 131
19.5 kW/m2 144 147 156 146
9.8 kW/m2 176 178 180 177
Flash Fire 0.85 LFL 183 184 195 179
Fireball Fireball Radius 135 135 135 135
35.35 kW/m2 320 320 320 320
28.3 kW/m2 361 361 361 361
19.5 kW/m2 435 435 435 435
9.8 kW/m2 605 605 605 605
BPPS_GRS_08 Pig receiver of Y13-1 GRS V 10
BPPS_GRS_07 Piping from outlet gas filter
separator to manifold, including
sales gas meter unit of Y13-1
GRS
V
100
Full bore
25
50
Full bore
Annex 5G - 3 - 8

F, 2 m/s D, 3 m/s D, 7m/s B, 2.5m/s
Hazard
Effects
End Point
CriteriaSection Phase
Leak Size
(mm)
Hazard Extent (m)
Weather Conditions
Flash Fire 0.85 LFL 835 829 875 767
Jet Fire 35.35 kW/m2 0 0 0 0
28.3 kW/m2 0 0 0 0
19.5 kW/m2 11 11 11 11
9.8 kW/m2 12 12 12 12
Flash Fire 0.85 LFL 8 8 7 8
Jet Fire 35.35 kW/m2 24 25 27 24
28.3 kW/m2 25 25 28 25
19.5 kW/m2 27 28 30 27
9.8 kW/m2 31 31 33 31
Flash Fire 0.85 LFL 21 21 20 20
Jet Fire 35.35 kW/m2 45 46 52 45
28.3 kW/m2 47 48 54 48
19.5 kW/m2 52 53 57 52
9.8 kW/m2 60 61 63 60
Flash Fire 0.85 LFL 46 47 48 45
Jet Fire 35.35 kW/m2 79 81 49 80
28.3 kW/m2 83 85 49 84
19.5 kW/m2 92 94 49 93
9.8 kW/m2 110 111 49 110
Flash Fire 0.85 LFL 100 100 106 96
Fireball Fireball Radius 95 95 95 95
35.35 kW/m2 231 231 231 231
28.3 kW/m2 260 260 260 260
19.5 kW/m2 315 315 315 315
9.8 kW/m2 439 439 439 439
BPPS_GRS_08 Pig receiver of Y13-1 GRS V
10
25
Full bore
BPPS_GRS_11 Above ground piping from
shore end to pig receiver of
Dachan GRS
V
50
100
Full bore
Annex 5G - 3 - 9

F, 2 m/s D, 3 m/s D, 7m/s B, 2.5m/s
Hazard
Effects
End Point
CriteriaSection Phase
Leak Size
(mm)
Hazard Extent (m)
Weather Conditions
Flash Fire 0.85 LFL 344 349 366 309
Jet Fire 35.35 kW/m2 0 0 0 0
28.3 kW/m2 0 0 0 0
19.5 kW/m2 11 11 11 11
9.8 kW/m2 12 12 12 12
Flash Fire 0.85 LFL 8 8 7 8
Jet Fire 35.35 kW/m2 24 25 27 24
28.3 kW/m2 25 25 28 25
19.5 kW/m2 27 28 30 27
9.8 kW/m2 31 31 33 31
Flash Fire 0.85 LFL 21 21 20 20
Jet Fire 35.35 kW/m2 45 46 52 45
28.3 kW/m2 47 48 54 48
19.5 kW/m2 52 53 57 52
9.8 kW/m2 60 61 63 60
Flash Fire 0.85 LFL 46 47 48 45
Jet Fire 35.35 kW/m2 79 81 49 80
28.3 kW/m2 83 85 49 84
19.5 kW/m2 92 94 49 93
9.8 kW/m2 110 111 49 110
Flash Fire 0.85 LFL 100 100 106 96
Fireball Fireball Radius 94 94 94 94
35.35 kW/m2 229 229 229 229
28.3 kW/m2 259 259 259 259
19.5 kW/m2 312 312 312 312
9.8 kW/m2 435 435 435 435
BPPS_GRS_12 Piping from receiver to gas filter
of Dachan GRS
V 10
BPPS_GRS_11 Above ground piping from
shore end to pig receiver of
Dachan GRS
V
100
Full bore
25
50
Full bore
Annex 5G - 3 - 10

F, 2 m/s D, 3 m/s D, 7m/s B, 2.5m/s
Hazard
Effects
End Point
CriteriaSection Phase
Leak Size
(mm)
Hazard Extent (m)
Weather Conditions
Flash Fire 0.85 LFL 339 343 360 303
Jet Fire 35.35 kW/m2 0 0 0 0
28.3 kW/m2 0 0 0 0
19.5 kW/m2 11 11 11 11
9.8 kW/m2 12 12 12 12
Flash Fire 0.85 LFL 8 8 7 8
Jet Fire 35.35 kW/m2 24 25 27 24
28.3 kW/m2 25 25 28 25
19.5 kW/m2 27 28 30 27
9.8 kW/m2 31 31 33 31
Flash Fire 0.85 LFL 21 21 20 20
Jet Fire 35.35 kW/m2 45 46 52 45
28.3 kW/m2 47 48 54 48
19.5 kW/m2 52 53 57 52
9.8 kW/m2 60 61 63 60
Flash Fire 0.85 LFL 46 47 48 45
Jet Fire 35.35 kW/m2 79 81 49 80
28.3 kW/m2 83 85 49 84
19.5 kW/m2 92 94 49 93
9.8 kW/m2 110 111 49 110
Flash Fire 0.85 LFL 100 100 106 96
Fireball Fireball Radius 65 65 65 65
35.35 kW/m2 163 163 163 163
28.3 kW/m2 182 182 182 182
19.5 kW/m2 219 219 219 219
9.8 kW/m2 308 308 308 308
BPPS_GRS_12 Piping from receiver to gas filter
of Dachan GRS
V
10
25
Full bore
BPPS_GRS_13 Filter & inlet/outlet piping of
Dachan GRS
V
50
100
Full bore
Annex 5G - 3 - 11

F, 2 m/s D, 3 m/s D, 7m/s B, 2.5m/s
Hazard
Effects
End Point
CriteriaSection Phase
Leak Size
(mm)
Hazard Extent (m)
Weather Conditions
Flash Fire 0.85 LFL 364 368 389 335
Jet Fire 35.35 kW/m2 0 0 0 0
28.3 kW/m2 0 0 0 0
19.5 kW/m2 11 11 11 11
9.8 kW/m2 12 12 12 12
Flash Fire 0.85 LFL 8 8 7 8
Jet Fire 35.35 kW/m2 24 25 27 24
28.3 kW/m2 25 25 28 25
19.5 kW/m2 27 28 30 27
9.8 kW/m2 31 31 33 31
Flash Fire 0.85 LFL 21 21 20 20
Jet Fire 35.35 kW/m2 45 46 52 45
28.3 kW/m2 47 48 54 48
19.5 kW/m2 52 53 57 52
9.8 kW/m2 60 61 63 60
Flash Fire 0.85 LFL 46 47 48 45
Jet Fire 35.35 kW/m2 79 81 49 80
28.3 kW/m2 83 85 49 84
19.5 kW/m2 92 94 49 93
9.8 kW/m2 110 111 49 110
Flash Fire 0.85 LFL 100 100 106 96
Fireball Fireball Radius 94 94 94 94
35.35 kW/m2 229 229 229 229
28.3 kW/m2 259 259 259 259
19.5 kW/m2 312 312 312 312
9.8 kW/m2 435 435 435 435
BPPS_GRS_14 Piping from filter to metering
station of Dachan GRS
V 10
BPPS_GRS_13 Filter & inlet/outlet piping of
Dachan GRS
V
100
Full bore
25
50
Full bore
Annex 5G - 3 - 12
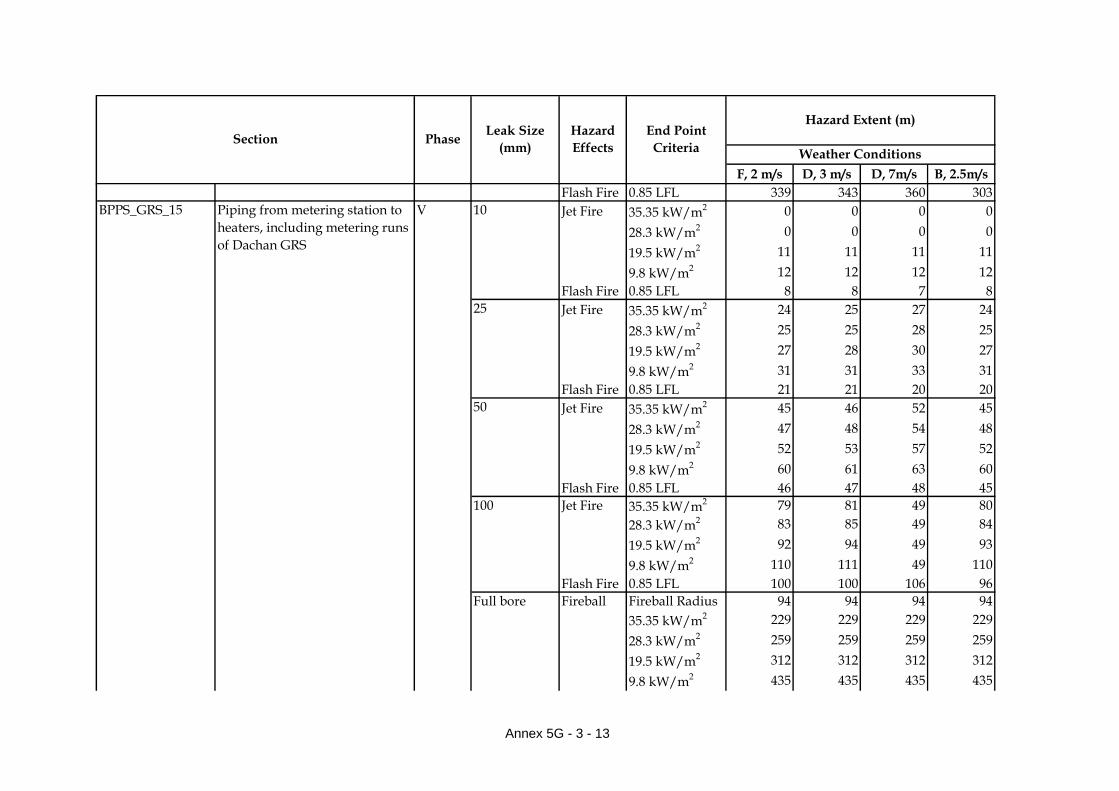
F, 2 m/s D, 3 m/s D, 7m/s B, 2.5m/s
Hazard
Effects
End Point
CriteriaSection Phase
Leak Size
(mm)
Hazard Extent (m)
Weather Conditions
Flash Fire 0.85 LFL 339 343 360 303
Jet Fire 35.35 kW/m2 0 0 0 0
28.3 kW/m2 0 0 0 0
19.5 kW/m2 11 11 11 11
9.8 kW/m2 12 12 12 12
Flash Fire 0.85 LFL 8 8 7 8
Jet Fire 35.35 kW/m2 24 25 27 24
28.3 kW/m2 25 25 28 25
19.5 kW/m2 27 28 30 27
9.8 kW/m2 31 31 33 31
Flash Fire 0.85 LFL 21 21 20 20
Jet Fire 35.35 kW/m2 45 46 52 45
28.3 kW/m2 47 48 54 48
19.5 kW/m2 52 53 57 52
9.8 kW/m2 60 61 63 60
Flash Fire 0.85 LFL 46 47 48 45
Jet Fire 35.35 kW/m2 79 81 49 80
28.3 kW/m2 83 85 49 84
19.5 kW/m2 92 94 49 93
9.8 kW/m2 110 111 49 110
Flash Fire 0.85 LFL 100 100 106 96
Fireball Fireball Radius 94 94 94 94
35.35 kW/m2 229 229 229 229
28.3 kW/m2 259 259 259 259
19.5 kW/m2 312 312 312 312
9.8 kW/m2 435 435 435 435
BPPS_GRS_14 Piping from filter to metering
station of Dachan GRS
V
10
25
Full bore
BPPS_GRS_15 Piping from metering station to
heaters, including metering runs
of Dachan GRS
V
50
100
Full bore
Annex 5G - 3 - 13
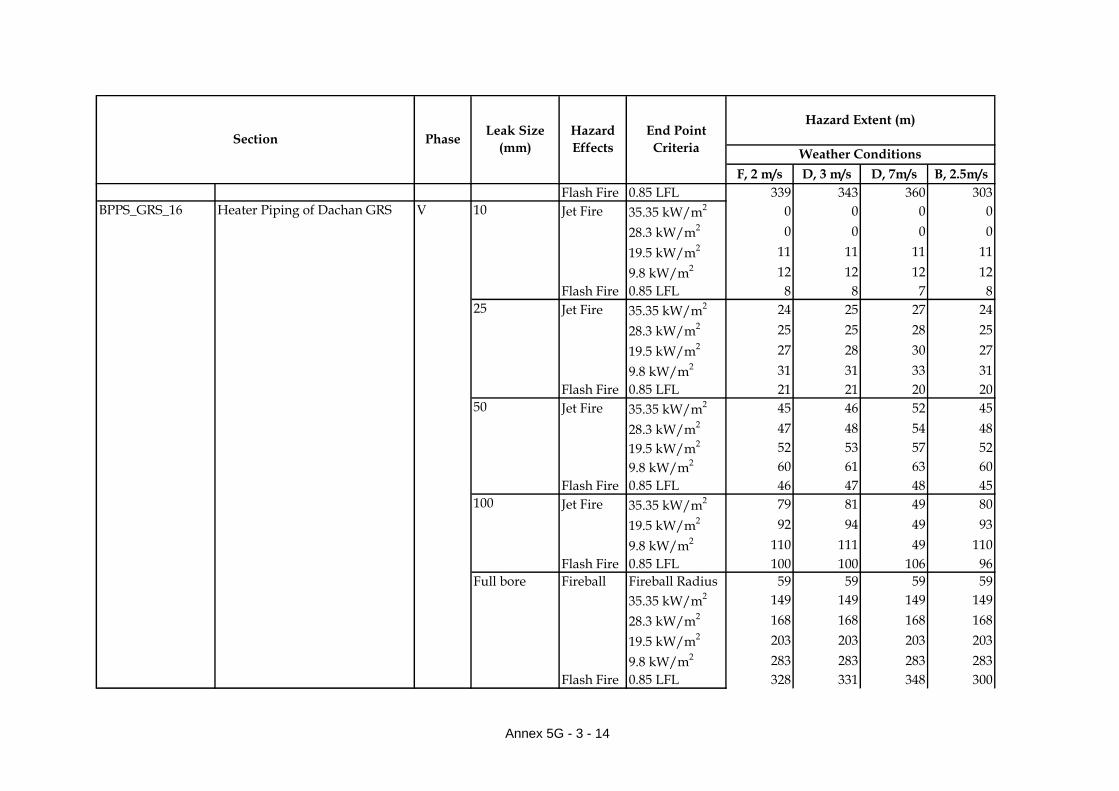
F, 2 m/s D, 3 m/s D, 7m/s B, 2.5m/s
Hazard
Effects
End Point
CriteriaSection Phase
Leak Size
(mm)
Hazard Extent (m)
Weather Conditions
Flash Fire 0.85 LFL 339 343 360 303
Jet Fire 35.35 kW/m2 0 0 0 0
28.3 kW/m2 0 0 0 0
19.5 kW/m2 11 11 11 11
9.8 kW/m2 12 12 12 12
Flash Fire 0.85 LFL 8 8 7 8
Jet Fire 35.35 kW/m2 24 25 27 24
28.3 kW/m2 25 25 28 25
19.5 kW/m2 27 28 30 27
9.8 kW/m2 31 31 33 31
Flash Fire 0.85 LFL 21 21 20 20
Jet Fire 35.35 kW/m2 45 46 52 45
28.3 kW/m2 47 48 54 48
19.5 kW/m2 52 53 57 52
9.8 kW/m2 60 61 63 60
Flash Fire 0.85 LFL 46 47 48 45
Jet Fire 35.35 kW/m2 79 81 49 80
19.5 kW/m2 92 94 49 93
9.8 kW/m2 110 111 49 110
Flash Fire 0.85 LFL 100 100 106 96
Fireball Fireball Radius 59 59 59 59
35.35 kW/m2 149 149 149 149
28.3 kW/m2 168 168 168 168
19.5 kW/m2 203 203 203 203
9.8 kW/m2 283 283 283 283
Flash Fire 0.85 LFL 328 331 348 300
BPPS_GRS_16 Heater Piping of Dachan GRS V 10
BPPS_GRS_15 Piping from metering station to
heaters, including metering runs
of Dachan GRS
V
100
Full bore
25
50
Full bore
Annex 5G - 3 - 14
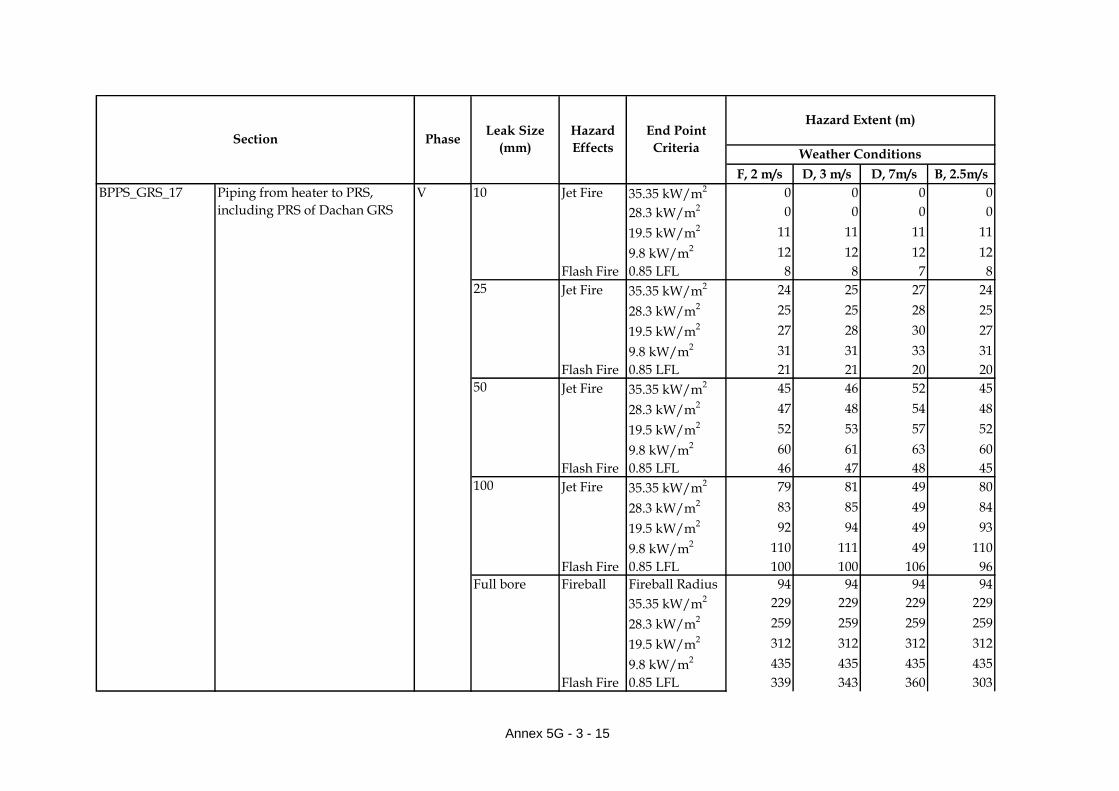
F, 2 m/s D, 3 m/s D, 7m/s B, 2.5m/s
Hazard
Effects
End Point
CriteriaSection Phase
Leak Size
(mm)
Hazard Extent (m)
Weather Conditions
Jet Fire 35.35 kW/m2 0 0 0 0
28.3 kW/m2 0 0 0 0
19.5 kW/m2 11 11 11 11
9.8 kW/m2 12 12 12 12
Flash Fire 0.85 LFL 8 8 7 8
Jet Fire 35.35 kW/m2 24 25 27 24
28.3 kW/m2 25 25 28 25
19.5 kW/m2 27 28 30 27
9.8 kW/m2 31 31 33 31
Flash Fire 0.85 LFL 21 21 20 20
Jet Fire 35.35 kW/m2 45 46 52 45
28.3 kW/m2 47 48 54 48
19.5 kW/m2 52 53 57 52
9.8 kW/m2 60 61 63 60
Flash Fire 0.85 LFL 46 47 48 45
Jet Fire 35.35 kW/m2 79 81 49 80
28.3 kW/m2 83 85 49 84
19.5 kW/m2 92 94 49 93
9.8 kW/m2 110 111 49 110
Flash Fire 0.85 LFL 100 100 106 96
Fireball Fireball Radius 94 94 94 94
35.35 kW/m2 229 229 229 229
28.3 kW/m2 259 259 259 259
19.5 kW/m2 312 312 312 312
9.8 kW/m2 435 435 435 435
Flash Fire 0.85 LFL 339 343 360 303
10
25
BPPS_GRS_17 Piping from heater to PRS,
including PRS of Dachan GRS
V
50
100
Full bore
Annex 5G - 3 - 15
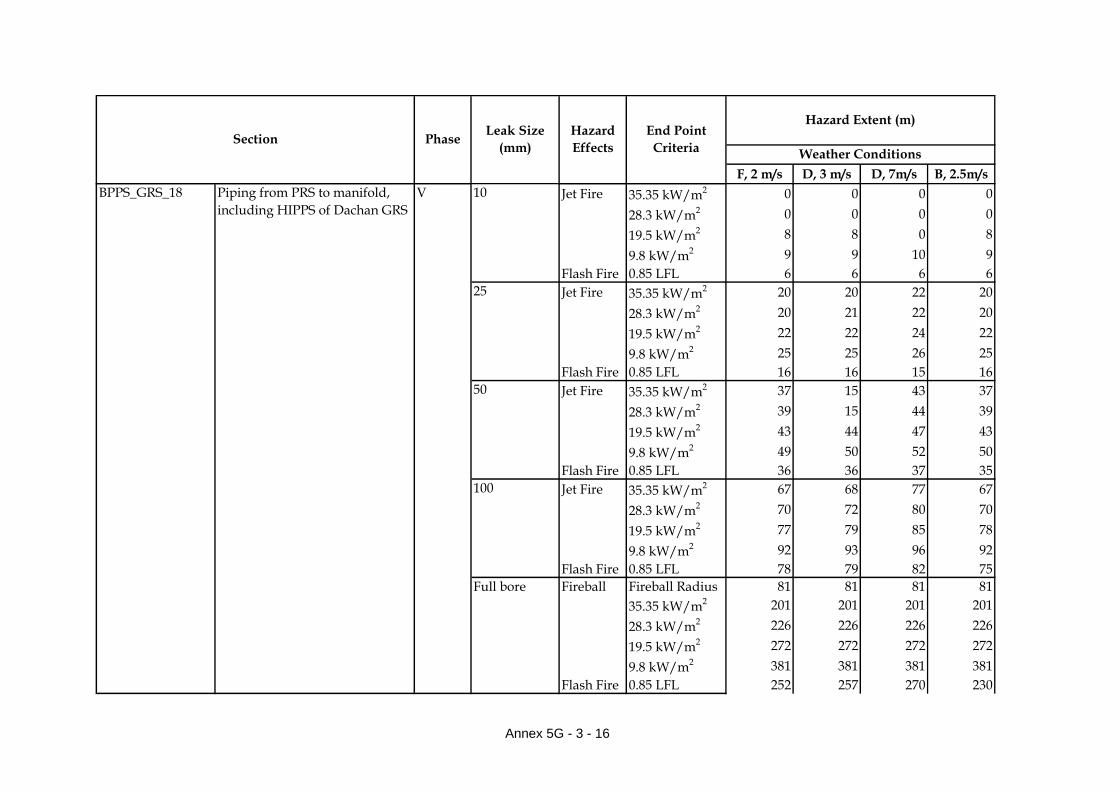
F, 2 m/s D, 3 m/s D, 7m/s B, 2.5m/s
Hazard
Effects
End Point
CriteriaSection Phase
Leak Size
(mm)
Hazard Extent (m)
Weather Conditions
Jet Fire 35.35 kW/m2 0 0 0 0
28.3 kW/m2 0 0 0 0
19.5 kW/m2 8 8 0 8
9.8 kW/m2 9 9 10 9
Flash Fire 0.85 LFL 6 6 6 6
Jet Fire 35.35 kW/m2 20 20 22 20
28.3 kW/m2 20 21 22 20
19.5 kW/m2 22 22 24 22
9.8 kW/m2 25 25 26 25
Flash Fire 0.85 LFL 16 16 15 16
Jet Fire 35.35 kW/m2 37 15 43 37
28.3 kW/m2 39 15 44 39
19.5 kW/m2 43 44 47 43
9.8 kW/m2 49 50 52 50
Flash Fire 0.85 LFL 36 36 37 35
Jet Fire 35.35 kW/m2 67 68 77 67
28.3 kW/m2 70 72 80 70
19.5 kW/m2 77 79 85 78
9.8 kW/m2 92 93 96 92
Flash Fire 0.85 LFL 78 79 82 75
Fireball Fireball Radius 81 81 81 81
35.35 kW/m2 201 201 201 201
28.3 kW/m2 226 226 226 226
19.5 kW/m2 272 272 272 272
9.8 kW/m2 381 381 381 381
Flash Fire 0.85 LFL 252 257 270 230
BPPS_GRS_18 Piping from PRS to manifold,
including HIPPS of Dachan GRS
V 10
100
25
50
Full bore
Annex 5G - 3 - 16

F, 2 m/s D, 3 m/s D, 7m/s B, 2.5m/s
Hazard
Effects
End Point
CriteriaSection Phase
Leak Size
(mm)
Hazard Extent (m)
Weather Conditions
Jet Fire 35.35 kW/m2 0 0 0 0
28.3 kW/m2 0 0 0 0
19.5 kW/m2 11 11 11 11
9.8 kW/m2 12 12 12 12
Flash Fire 0.85 LFL 8 8 7 8
Jet Fire 35.35 kW/m2 24 25 27 24
28.3 kW/m2 25 25 28 25
19.5 kW/m2 27 28 30 27
9.8 kW/m2 31 31 33 31
Flash Fire 0.85 LFL 21 21 20 20
Jet Fire 35.35 kW/m2 45 46 52 45
28.3 kW/m2 47 48 54 48
19.5 kW/m2 52 53 57 52
9.8 kW/m2 60 61 63 60
Flash Fire 0.85 LFL 46 47 48 45
Jet Fire 35.35 kW/m2 79 81 49 80
28.3 kW/m2 83 85 49 84
19.5 kW/m2 92 94 49 93
9.8 kW/m2 110 111 49 110
Flash Fire 0.85 LFL 100 100 106 96
Fireball Fireball Radius 104 104 104 104
35.35 kW/m2 252 252 252 252
28.3 kW/m2 284 284 284 284
19.5 kW/m2 340 340 340 340
9.8 kW/m2 475 475 475 475
Flash Fire 0.85 LFL 394 398 417 351
25
50
100
Full bore
BPPS_GRS_19 Pig receiver of Dachan GRS V 10
Annex 5G - 3 - 17

F, 2 m/s D, 3 m/s D, 7m/s B, 2.5m/s
Hazard
Effects
End Point
CriteriaSection Phase
Leak Size
(mm)
Hazard Extent (m)
Weather Conditions
Jet Fire 35.35 kW/m2 12 12 13 12
28.3 kW/m2 13 13 14 13
19.5 kW/m2 14 14 15 14
9.8 kW/m2 16 16 16 16
Flash Fire 0.85 LFL 12 12 11 11
Jet Fire 35.35 kW/m2 30 31 34 31
28.3 kW/m2 31 32 36 32
19.5 kW/m2 35 35 38 35
9.8 kW/m2 40 40 42 40
Flash Fire 0.85 LFL 34 34 34 33
Jet Fire 35.35 kW/m2 55 56 64 56
28.3 kW/m2 58 60 66 59
19.5 kW/m2 64 65 70 65
9.8 kW/m2 75 76 79 76
Flash Fire 0.85 LFL 75 76 80 73
Jet Fire 35.35 kW/m2 98 99 110 98
28.3 kW/m2 102 104 115 102
19.5 kW/m2 113 115 123 114
9.8 kW/m2 137 138 141 137
Flash Fire 0.85 LFL 158 159 169 151
Fireball Fireball Radius 120 120 120 120
35.35 kW/m2 199 199 199 199
28.3 kW/m2 248 248 248 248
19.5 kW/m2 330 330 330 330
9.8 kW/m2 503 503 503 503
Flash Fire 0.85 LFL 803 803 854 745
10
25
BPPS_NGRS_01 Above ground piping from
shore end to pig receiver of New
GRS
V
50
100
Full bore
Annex 5G - 3 - 18

F, 2 m/s D, 3 m/s D, 7m/s B, 2.5m/s
Hazard
Effects
End Point
CriteriaSection Phase
Leak Size
(mm)
Hazard Extent (m)
Weather Conditions
Jet Fire 35.35 kW/m2 12 12 13 12
28.3 kW/m2 13 13 14 13
19.5 kW/m2 14 14 15 14
9.8 kW/m2 16 16 16 16
Flash Fire 0.85 LFL 12 12 11 11
Jet Fire 35.35 kW/m2 30 31 34 31
28.3 kW/m2 31 32 36 32
19.5 kW/m2 35 35 38 35
9.8 kW/m2 40 40 42 40
Flash Fire 0.85 LFL 34 34 34 33
Jet Fire 35.35 kW/m2 55 56 64 56
28.3 kW/m2 58 60 66 59
19.5 kW/m2 64 65 70 65
9.8 kW/m2 75 76 79 76
Flash Fire 0.85 LFL 75 76 80 73
Pool Fire 35.35 kW/m2 98 99 110 98
28.3 kW/m2 102 104 115 102
19.5 kW/m2 113 115 123 114
9.8 kW/m2 137 138 141 137
Flash Fire 0.85 LFL 158 159 169 151
Fireball Fireball Radius 115 115 115 115
35.35 kW/m2 191 191 191 191
28.3 kW/m2 239 239 239 239
19.5 kW/m2 317 317 317 317
9.8 kW/m2 483 483 483 483
Flash Fire 0.85 LFL 769 770 814 709
BPPS_NGRS_02 Piping from Pig Receiving
Station to Gas Filter of New GRS
V 10
100
25
50
Full bore
Annex 5G - 3 - 19
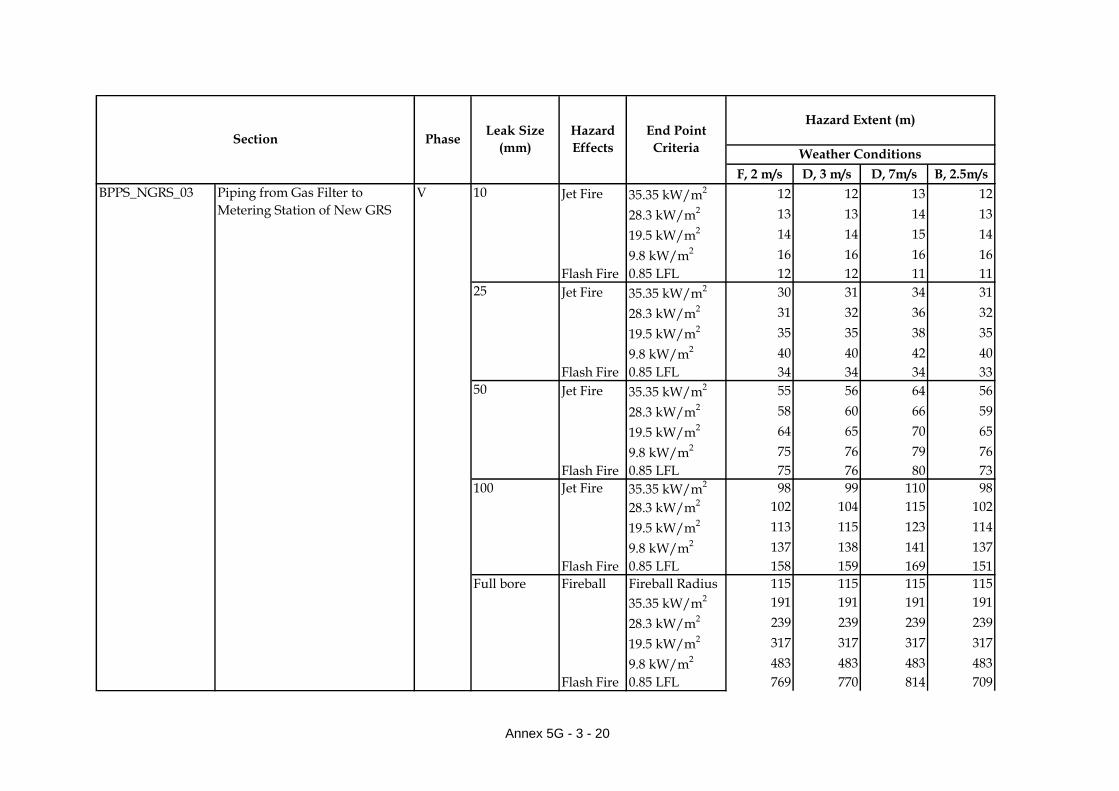
F, 2 m/s D, 3 m/s D, 7m/s B, 2.5m/s
Hazard
Effects
End Point
CriteriaSection Phase
Leak Size
(mm)
Hazard Extent (m)
Weather Conditions
Jet Fire 35.35 kW/m2 12 12 13 12
28.3 kW/m2 13 13 14 13
19.5 kW/m2 14 14 15 14
9.8 kW/m2 16 16 16 16
Flash Fire 0.85 LFL 12 12 11 11
Jet Fire 35.35 kW/m2 30 31 34 31
28.3 kW/m2 31 32 36 32
19.5 kW/m2 35 35 38 35
9.8 kW/m2 40 40 42 40
Flash Fire 0.85 LFL 34 34 34 33
Jet Fire 35.35 kW/m2 55 56 64 56
28.3 kW/m2 58 60 66 59
19.5 kW/m2 64 65 70 65
9.8 kW/m2 75 76 79 76
Flash Fire 0.85 LFL 75 76 80 73
Jet Fire 35.35 kW/m2 98 99 110 98
28.3 kW/m2 102 104 115 102
19.5 kW/m2 113 115 123 114
9.8 kW/m2 137 138 141 137
Flash Fire 0.85 LFL 158 159 169 151
Fireball Fireball Radius 115 115 115 115
35.35 kW/m2 191 191 191 191
28.3 kW/m2 239 239 239 239
19.5 kW/m2 317 317 317 317
9.8 kW/m2 483 483 483 483
Flash Fire 0.85 LFL 769 770 814 709
10
25
BPPS_NGRS_03 Piping from Gas Filter to
Metering Station of New GRS
V
50
100
Full bore
Annex 5G - 3 - 20

F, 2 m/s D, 3 m/s D, 7m/s B, 2.5m/s
Hazard
Effects
End Point
CriteriaSection Phase
Leak Size
(mm)
Hazard Extent (m)
Weather Conditions
Jet Fire 35.35 kW/m2 12 12 13 12
28.3 kW/m2 13 13 14 13
19.5 kW/m2 14 14 15 14
9.8 kW/m2 16 16 16 16
Flash Fire 0.85 LFL 12 12 11 11
Jet Fire 35.35 kW/m2 30 31 34 31
28.3 kW/m2 31 32 36 32
19.5 kW/m2 35 35 38 35
9.8 kW/m2 40 40 42 40
Flash Fire 0.85 LFL 34 34 34 33
Jet Fire 35.35 kW/m2 55 56 64 56
28.3 kW/m2 58 60 66 59
19.5 kW/m2 64 65 70 65
9.8 kW/m2 75 76 79 76
Flash Fire 0.85 LFL 75 76 80 73
Fireball 35.35 kW/m2 98 99 110 98
28.3 kW/m2 102 104 115 102
19.5 kW/m2 113 115 123 114
9.8 kW/m2 137 138 141 137
Flash Fire 0.85 LFL 158 159 169 151
Fireball Fireball Radius 115 115 115 115
35.35 kW/m2 191 191 191 191
28.3 kW/m2 239 239 239 239
19.5 kW/m2 317 317 317 317
9.8 kW/m2 483 483 483 483
Flash Fire 0.85 LFL 769 770 814 709
BPPS_NGRS_04 Piping from Metering Station to
WBH of New GRS
V 10
100
25
50
Full bore
Annex 5G - 3 - 21
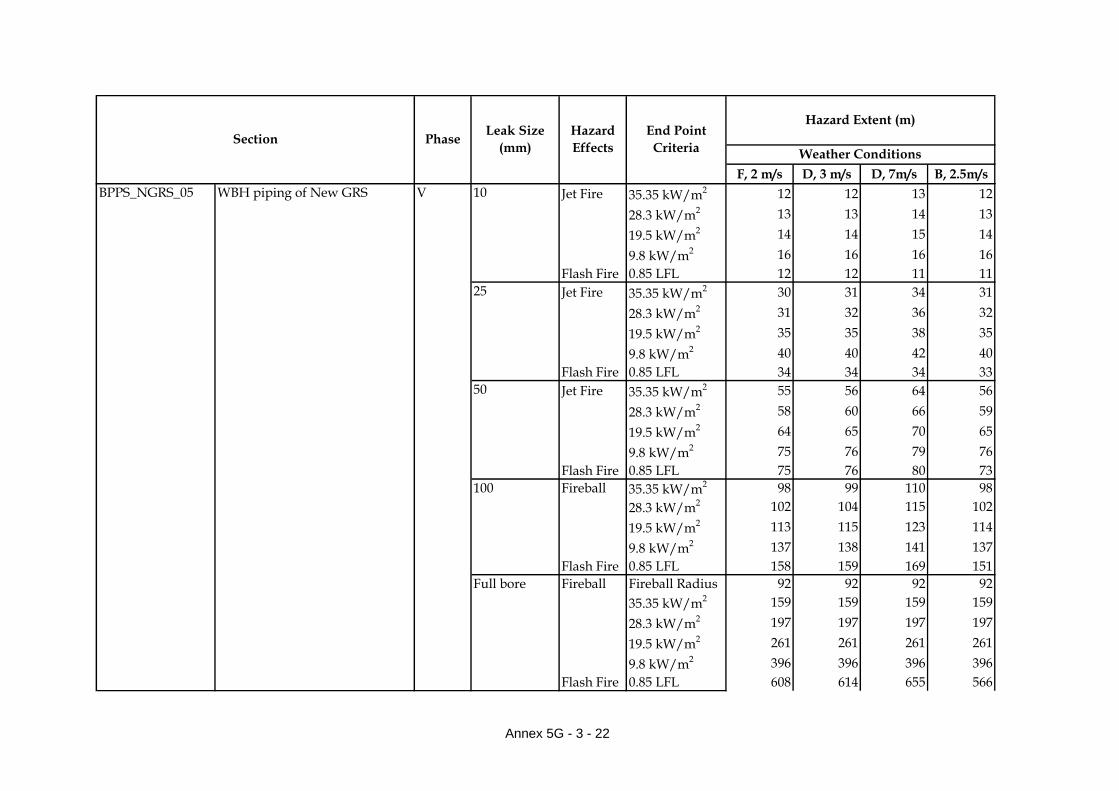
F, 2 m/s D, 3 m/s D, 7m/s B, 2.5m/s
Hazard
Effects
End Point
CriteriaSection Phase
Leak Size
(mm)
Hazard Extent (m)
Weather Conditions
Jet Fire 35.35 kW/m2 12 12 13 12
28.3 kW/m2 13 13 14 13
19.5 kW/m2 14 14 15 14
9.8 kW/m2 16 16 16 16
Flash Fire 0.85 LFL 12 12 11 11
Jet Fire 35.35 kW/m2 30 31 34 31
28.3 kW/m2 31 32 36 32
19.5 kW/m2 35 35 38 35
9.8 kW/m2 40 40 42 40
Flash Fire 0.85 LFL 34 34 34 33
Jet Fire 35.35 kW/m2 55 56 64 56
28.3 kW/m2 58 60 66 59
19.5 kW/m2 64 65 70 65
9.8 kW/m2 75 76 79 76
Flash Fire 0.85 LFL 75 76 80 73
Fireball 35.35 kW/m2 98 99 110 98
28.3 kW/m2 102 104 115 102
19.5 kW/m2 113 115 123 114
9.8 kW/m2 137 138 141 137
Flash Fire 0.85 LFL 158 159 169 151
Fireball Fireball Radius 92 92 92 92
35.35 kW/m2 159 159 159 159
28.3 kW/m2 197 197 197 197
19.5 kW/m2 261 261 261 261
9.8 kW/m2 396 396 396 396
Flash Fire 0.85 LFL 608 614 655 566
10
25
BPPS_NGRS_05 WBH piping of New GRS V
50
100
Full bore
Annex 5G - 3 - 22

F, 2 m/s D, 3 m/s D, 7m/s B, 2.5m/s
Hazard
Effects
End Point
CriteriaSection Phase
Leak Size
(mm)
Hazard Extent (m)
Weather Conditions
Jet Fire 35.35 kW/m2 9 0 0 0
28.3 kW/m2 12 12 13 12
19.5 kW/m2 13 13 14 13
9.8 kW/m2 15 15 16 15
Flash Fire 0.85 LFL 11 11 10 11
Jet Fire 35.35 kW/m2 29 29 32 29
28.3 kW/m2 30 31 34 30
19.5 kW/m2 33 34 36 33
9.8 kW/m2 38 38 40 38
Flash Fire 0.85 LFL 32 32 32 30
Jet Fire 35.35 kW/m2 53 54 61 53
28.3 kW/m2 55 57 63 56
19.5 kW/m2 61 63 67 62
9.8 kW/m2 72 72 75 72
Flash Fire 0.85 LFL 69 69 72 66
Fireball 35.35 kW/m2 93 95 106 94
28.3 kW/m2 97 100 110 98
19.5 kW/m2 108 110 118 109
9.8 kW/m2 130 132 135 131
Flash Fire 0.85 LFL 140 141 149 130
Fireball Fireball Radius 89 89 89 89
35.35 kW/m2 155 155 155 155
28.3 kW/m2 191 191 191 191
19.5 kW/m2 253 253 253 253
9.8 kW/m2 384 384 384 384
Flash Fire 0.85 LFL 489 493 520 435
BPPS_NGRS_06 Piping from WBH to Pressure
Reduction Station of New GRS
V 10
100
25
50
Full bore
Annex 5G - 3 - 23

F, 2 m/s D, 3 m/s D, 7m/s B, 2.5m/s
Hazard
Effects
End Point
CriteriaSection Phase
Leak Size
(mm)
Hazard Extent (m)
Weather Conditions
Jet Fire 35.35 kW/m2 0 0 0 0
28.3 kW/m2 0 0 0 0
19.5 kW/m2 8 0 0 8
9.8 kW/m2 10 10 10 10
Flash Fire 0.85 LFL 8 8 7 7
Jet Fire 35.35 kW/m2 20 20 22 20
28.3 kW/m2 21 21 23 21
19.5 kW/m2 22 23 24 23
9.8 kW/m2 26 26 27 26
Flash Fire 0.85 LFL 20 20 19 20
Jet Fire 35.35 kW/m2 38 39 44 38
28.3 kW/m2 40 41 45 40
19.5 kW/m2 44 45 48 44
9.8 kW/m2 51 51 53 51
Flash Fire 0.85 LFL 45 46 47 44
Jet Fire 35.35 kW/m2 68 69 78 69
28.3 kW/m2 71 73 81 72
19.5 kW/m2 79 81 86 80
9.8 kW/m2 93 94 97 94
Flash Fire 0.85 LFL 97 98 104 93
Fireball Fireball Radius 86 86 86 86
35.35 kW/m2 150 150 150 150
28.3 kW/m2 186 186 186 186
19.5 kW/m2 246 246 246 246
9.8 kW/m2 372 372 372 372
Flash Fire 0.85 LFL 520 527 561 474
10
25
BPPS_NGRS_07 Piping from Pressure Reduction
Station to Mixing Station of New
GRS
V
50
100
Full bore
Annex 5G - 3 - 24

F, 2 m/s D, 3 m/s D, 7m/s B, 2.5m/s
Hazard
Effects
End Point
CriteriaSection Phase
Leak Size
(mm)
Hazard Extent (m)
Weather Conditions
Jet Fire 35.35 kW/m2 12 12 13 12
28.3 kW/m2 13 13 14 13
19.5 kW/m2 14 14 15 14
9.8 kW/m2 16 16 16 16
Flash Fire 0.85 LFL 12 12 11 11
Jet Fire 35.35 kW/m2 30 31 34 31
28.3 kW/m2 31 32 36 32
19.5 kW/m2 35 35 38 35
9.8 kW/m2 40 40 42 40
Flash Fire 0.85 LFL 34 34 34 33
Jet Fire 35.35 kW/m2 55 56 64 56
28.3 kW/m2 58 60 66 59
19.5 kW/m2 64 65 70 65
9.8 kW/m2 75 76 79 76
Flash Fire 0.85 LFL 75 76 80 73
Jet Fire 35.35 kW/m2 98 99 110 98
28.3 kW/m2 102 104 115 102
19.5 kW/m2 113 115 123 114
9.8 kW/m2 137 138 141 137
Flash Fire 0.85 LFL 158 159 169 151
Fireball Fireball Radius 125 125 125 125
35.35 kW/m2 206 206 206 206
28.3 kW/m2 257 257 257 257
19.5 kW/m2 343 343 343 343
9.8 kW/m2 522 522 522 522
Flash Fire 0.85 LFL 838 837 889 778
BPPS_NGRS_08 Pig Receiver of Newe GRS V 10
50
100
Full bore
25
Annex 5G - 3 - 25

Annex 5G-4
Consequence Analysis
Results for GRSs at LPS

F, 2 m/s D, 3 m/s D, 7m/s B, 2.5m/s
Jet Fire 35.35 kW/m2 12 12 13 12
28.3 kW/m2 13 13 14 13
19.5 kW/m2 14 14 15 14
9.8 kW/m2 16 16 17 16
Flash Fire 0.85 LFL 12 12 11 12
Jet Fire 35.35 kW/m2 30 31 34 31
28.3 kW/m2 33 32 36 32
19.5 kW/m2 35 35 38 35
9.8 kW/m2 40 40 42 40
Flash Fire 0.85 LFL 34 35 35 34
Jet Fire 35.35 kW/m2 56 56 64 56
28.3 kW/m2 57 60 67 59
19.5 kW/m2 64 66 71 65
9.8 kW/m2 76 76 79 76
Flash Fire 0.85 LFL 76 77 81 74
Jet Fire 35.35 kW/m2 98 99 111 99
28.3 kW/m2 102 105 116 103
19.5 kW/m2 114 116 124 115
9.8 kW/m2 137 139 142 138
Flash Fire 0.85 LFL 160 161 171 154
Fireball Fireball Radius 93 93 93 93
35.35 kW/m2 160 160 160 160
28.3 kW/m2 198 198 198 198
19.5 kW/m2 263 263 263 263
9.8 kW/m2 398 398 398 398
Flash Fire 0.85 LFL 625 632 673 584
Jet Fire 35.35 kW/m2 12 12 13 12
28.3 kW/m2 13 13 14 13
19.5 kW/m2 14 14 15 14
9.8 kW/m2 16 16 17 16
Flash Fire 0.85 LFL 12 12 11 12
Jet Fire 35.35 kW/m2 30 31 34 31
100
Full bore
LPS_GRS_02 Piping from Filter Skid to Metering Skid (GT57 Stream)
V 10
25
LPS_GRS_01 Above ground existing piping from shore to existing GRS Trains
V 10
25
50
Section PhaseLeak Size
(mm)
Hazard
Effects
End Point
Criteria
Hazard Extent (m)
Weather Conditions
Annex 5G - 4 - 1

F, 2 m/s D, 3 m/s D, 7m/s B, 2.5m/s
Section PhaseLeak Size
(mm)
Hazard
Effects
End Point
Criteria
Hazard Extent (m)
Weather Conditions
28.3 kW/m2 33 32 36 32
19.5 kW/m2 35 35 38 35
9.8 kW/m2 40 40 42 40
Flash Fire 0.85 LFL 34 35 35 34
Jet Fire 35.35 kW/m2 56 56 64 56
28.3 kW/m2 57 60 67 59
19.5 kW/m2 64 66 71 65
9.8 kW/m2 76 76 79 76
Flash Fire 0.85 LFL 76 77 81 74
Jet Fire 35.35 kW/m2 98 99 111 99
28.3 kW/m2 102 105 116 103
19.5 kW/m2 114 116 124 115
9.8 kW/m2 137 139 142 138
Flash Fire 0.85 LFL 160 161 171 154
Fireball Fireball Radius 54 54 54 54
35.35 kW/m2 100 100 100 100
28.3 kW/m2 198 198 198 198
19.5 kW/m2 262 262 262 262
9.8 kW/m2 242 242 242 242
Jet Fire 35.35 kW/m2 194 196 210 195
28.3 kW/m2 204 205 221 205
19.5 kW/m2 222 226 239 224
9.8 kW/m2 274 277 280 275
Flash Fire 0.85 LFL 329 333 353 306
Jet Fire 35.35 kW/m2 12 12 13 12
28.3 kW/m2 13 13 14 13
19.5 kW/m2 14 14 15 14
9.8 kW/m2 16 16 17 16
Flash Fire 0.85 LFL 12 12 11 12
Jet Fire 35.35 kW/m2 30 31 34 31
28.3 kW/m2 33 32 36 32
Full bore
25
50
100
LPS_GRS_03 Piping from Metering Skid to Heater (GT57 Stream)
V 10
Annex 5G - 4 - 2

F, 2 m/s D, 3 m/s D, 7m/s B, 2.5m/s
Section PhaseLeak Size
(mm)
Hazard
Effects
End Point
Criteria
Hazard Extent (m)
Weather Conditions
19.5 kW/m2 35 35 38 35
9.8 kW/m2 40 40 42 40
Flash Fire 0.85 LFL 34 35 35 34
Jet Fire 35.35 kW/m2 56 56 64 56
28.3 kW/m2 57 60 67 59
19.5 kW/m2 64 66 71 65
9.8 kW/m2 76 76 79 76
Flash Fire 0.85 LFL 76 77 81 74
Jet Fire 35.35 kW/m2 98 99 111 99
28.3 kW/m2 102 105 116 103
19.5 kW/m2 114 116 124 115
9.8 kW/m2 137 139 142 138
Flash Fire 0.85 LFL 160 161 171 154
Fireball Fireball Radius 54 54 54 54
35.35 kW/m2 100 100 100 100
28.3 kW/m2 198 198 198 198
19.5 kW/m2 262 262 262 262
9.8 kW/m2 242 242 242 242
Jet Fire 35.35 kW/m2 194 196 210 195
28.3 kW/m2 204 205 221 205
19.5 kW/m2 222 226 239 224
9.8 kW/m2 274 277 280 275
Flash Fire 0.85 LFL 329 333 353 306
Jet Fire 35.35 kW/m2 10 10 0 10
28.3 kW/m2 12 12 13 12
19.5 kW/m2 13 13 14 13
9.8 kW/m2 15 15 16 15
Flash Fire 0.85 LFL 11 11 10 11
Jet Fire 35.35 kW/m2 29 30 33 30
28.3 kW/m2 30 31 34 30
19.5 kW/m2 33 34 36 34
Full bore
50
100
25
LPS_GRS_04 Piping from Heater to Pressure Reduction Station (GT57 Stream)
V 10
Annex 5G - 4 - 3

F, 2 m/s D, 3 m/s D, 7m/s B, 2.5m/s
Section PhaseLeak Size
(mm)
Hazard
Effects
End Point
Criteria
Hazard Extent (m)
Weather Conditions
9.8 kW/m2 38 39 40 38
Flash Fire 0.85 LFL 32 32 32 31
Jet Fire 35.35 kW/m2 53 55 62 54
28.3 kW/m2 56 58 64 57
19.5 kW/m2 62 63 68 63
9.8 kW/m2 72 73 76 73
Flash Fire 0.85 LFL 70 71 74 67
Jet Fire 35.35 kW/m2 94 96 107 95
28.3 kW/m2 98 101 111 99
19.5 kW/m2 109 112 119 111
9.8 kW/m2 132 133 136 132
Flash Fire 0.85 LFL 144 145 154 135
Fireball Fireball Radius 67 67 0 0
35.35 kW/m2 121 121 0 0
28.3 kW/m2 149 149 0 0
19.5 kW/m2 196 196 0 0
9.8 kW/m2 296 296 0 0
Jet Fire 35.35 kW/m2 265 268 284 267
28.3 kW/m2 280 282 299 281
19.5 kW/m2 305 306 326 305
9.8 kW/m2 372 377 385 374
Flash Fire 0.85 LFL 376 382 405 339
Jet Fire 35.35 kW/m2 0 0 0 0
28.3 kW/m2 0 0 0 0
19.5 kW/m2 0 0 0 0
9.8 kW/m2 8 8 8 8
Flash Fire 0.85 LFL 7 7 6 7
Jet Fire 35.35 kW/m2 18 18 20 18
28.3 kW/m2 18 19 20 19
19.5 kW/m2 20 20 21 20
9.8 kW/m2 23 23 24 23
Flash Fire 0.85 LFL 18 17 16 17
Full bore
LPS_GRS_05 Piping from Pressure Reduction Station (GT57 Stream) to GT57
V 10
25
100
50
Annex 5G - 4 - 4

F, 2 m/s D, 3 m/s D, 7m/s B, 2.5m/s
Section PhaseLeak Size
(mm)
Hazard
Effects
End Point
Criteria
Hazard Extent (m)
Weather Conditions
Jet Fire 35.35 kW/m2 34 14 39 34
28.3 kW/m2 35 14 40 36
19.5 kW/m2 39 14 43 39
9.8 kW/m2 45 14 47 45
Flash Fire 0.85 LFL 39 40 40 38
Jet Fire 35.35 kW/m2 61 63 71 62
28.3 kW/m2 64 66 73 65
19.5 kW/m2 71 73 78 72
9.8 kW/m2 84 85 88 84
Flash Fire 0.85 LFL 85 86 91 82
Fireball Fireball Radius 51 51 51 51
35.35 kW/m2 95 95 95 95
28.3 kW/m2 116 116 116 116
19.5 kW/m2 152 152 152 152
9.8 kW/m2 229 229 229 229
Jet Fire 35.35 kW/m2 179 181 194 180
28.3 kW/m2 188 189 204 189
19.5 kW/m2 205 209 221 207
9.8 kW/m2 253 255 258 254
Flash Fire 0.85 LFL 288 291 309 264
Jet Fire 35.35 kW/m2 12 12 13 12
28.3 kW/m2 13 13 14 13
19.5 kW/m2 14 14 15 14
9.8 kW/m2 16 16 17 16
Flash Fire 0.85 LFL 12 12 11 12
Jet Fire 35.35 kW/m2 30 31 34 31
28.3 kW/m2 33 32 36 32
19.5 kW/m2 35 35 38 35
9.8 kW/m2 40 40 42 40
Flash Fire 0.85 LFL 34 35 35 34
Jet Fire 35.35 kW/m2 56 56 64 56
Full bore
100
LPS_GRS_06 Piping from Filter Skid to Metering Skid (L9 Stream)
V 10
25
50
50
Annex 5G - 4 - 5
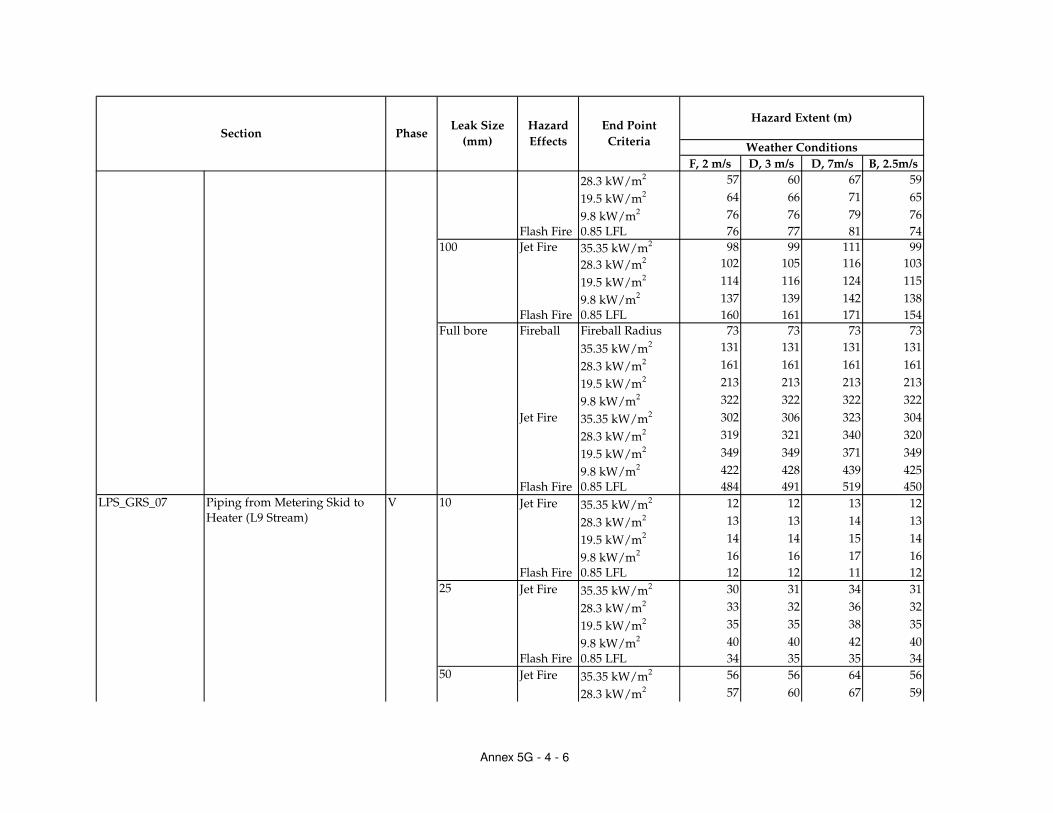
F, 2 m/s D, 3 m/s D, 7m/s B, 2.5m/s
Section PhaseLeak Size
(mm)
Hazard
Effects
End Point
Criteria
Hazard Extent (m)
Weather Conditions
28.3 kW/m2 57 60 67 59
19.5 kW/m2 64 66 71 65
9.8 kW/m2 76 76 79 76
Flash Fire 0.85 LFL 76 77 81 74
Jet Fire 35.35 kW/m2 98 99 111 99
28.3 kW/m2 102 105 116 103
19.5 kW/m2 114 116 124 115
9.8 kW/m2 137 139 142 138
Flash Fire 0.85 LFL 160 161 171 154
Fireball Fireball Radius 73 73 73 73
35.35 kW/m2 131 131 131 131
28.3 kW/m2 161 161 161 161
19.5 kW/m2 213 213 213 213
9.8 kW/m2 322 322 322 322
Jet Fire 35.35 kW/m2 302 306 323 304
28.3 kW/m2 319 321 340 320
19.5 kW/m2 349 349 371 349
9.8 kW/m2 422 428 439 425
Flash Fire 0.85 LFL 484 491 519 450
Jet Fire 35.35 kW/m2 12 12 13 12
28.3 kW/m2 13 13 14 13
19.5 kW/m2 14 14 15 14
9.8 kW/m2 16 16 17 16
Flash Fire 0.85 LFL 12 12 11 12
Jet Fire 35.35 kW/m2 30 31 34 31
28.3 kW/m2 33 32 36 32
19.5 kW/m2 35 35 38 35
9.8 kW/m2 40 40 42 40
Flash Fire 0.85 LFL 34 35 35 34
Jet Fire 35.35 kW/m2 56 56 64 56
28.3 kW/m2 57 60 67 59
Full bore
50
100
LPS_GRS_07 Piping from Metering Skid to Heater (L9 Stream)
V 10
25
Annex 5G - 4 - 6
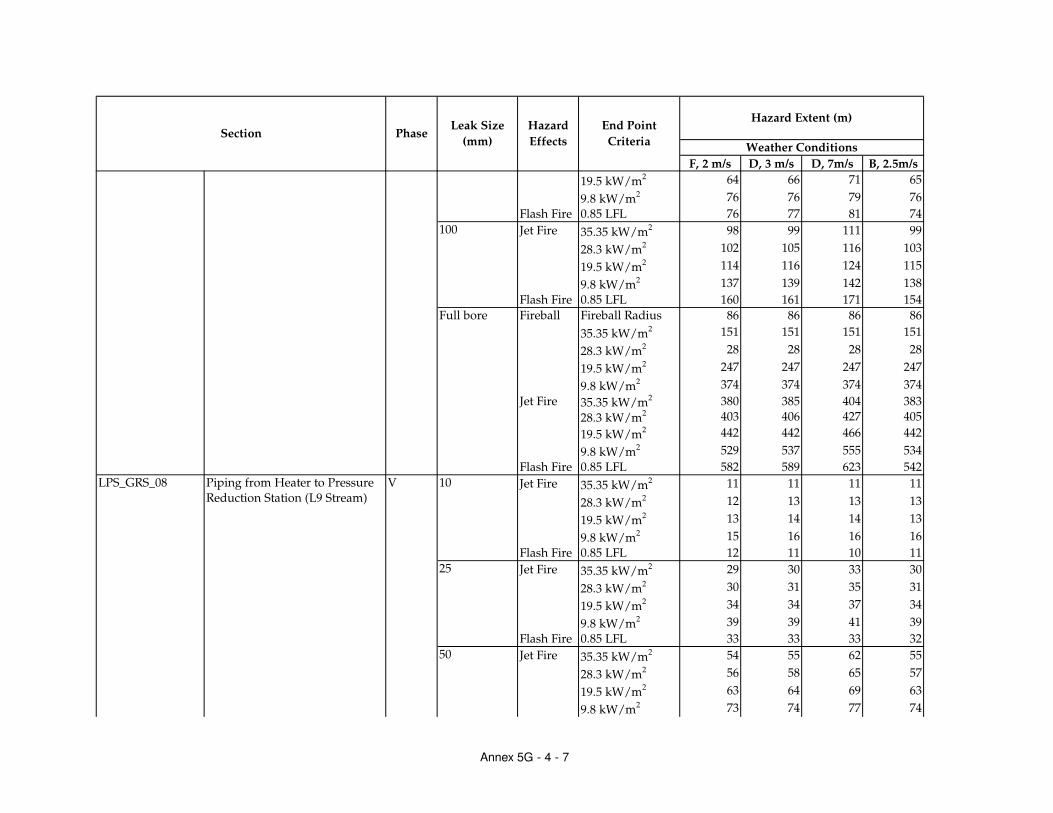
F, 2 m/s D, 3 m/s D, 7m/s B, 2.5m/s
Section PhaseLeak Size
(mm)
Hazard
Effects
End Point
Criteria
Hazard Extent (m)
Weather Conditions
19.5 kW/m2 64 66 71 65
9.8 kW/m2 76 76 79 76
Flash Fire 0.85 LFL 76 77 81 74
Jet Fire 35.35 kW/m2 98 99 111 99
28.3 kW/m2 102 105 116 103
19.5 kW/m2 114 116 124 115
9.8 kW/m2 137 139 142 138
Flash Fire 0.85 LFL 160 161 171 154
Fireball Fireball Radius 86 86 86 86
35.35 kW/m2 151 151 151 151
28.3 kW/m2 28 28 28 28
19.5 kW/m2 247 247 247 247
9.8 kW/m2 374 374 374 374
Jet Fire 35.35 kW/m2 380 385 404 383
28.3 kW/m2 403 406 427 405
19.5 kW/m2 442 442 466 442
9.8 kW/m2 529 537 555 534
Flash Fire 0.85 LFL 582 589 623 542
Jet Fire 35.35 kW/m2 11 11 11 11
28.3 kW/m2 12 13 13 13
19.5 kW/m2 13 14 14 13
9.8 kW/m2 15 16 16 16
Flash Fire 0.85 LFL 12 11 10 11
Jet Fire 35.35 kW/m2 29 30 33 30
28.3 kW/m2 30 31 35 31
19.5 kW/m2 34 34 37 34
9.8 kW/m2 39 39 41 39
Flash Fire 0.85 LFL 33 33 33 32
Jet Fire 35.35 kW/m2 54 55 62 55
28.3 kW/m2 56 58 65 57
19.5 kW/m2 63 64 69 63
9.8 kW/m2 73 74 77 74
Full bore
100
LPS_GRS_08 Piping from Heater to Pressure Reduction Station (L9 Stream)
V 10
25
50
Annex 5G - 4 - 7

F, 2 m/s D, 3 m/s D, 7m/s B, 2.5m/s
Section PhaseLeak Size
(mm)
Hazard
Effects
End Point
Criteria
Hazard Extent (m)
Weather Conditions
Flash Fire 0.85 LFL 71 72 76 69
Jet Fire 35.35 kW/m2 95 96 108 96
28.3 kW/m2 99 102 112 100
19.5 kW/m2 110 113 120 112
9.8 kW/m2 133 134 137 134
Flash Fire 0.85 LFL 148 149 159 139
Fireball Fireball Radius 84 84 84 84
35.35 kW/m2 148 148 148 148
28.3 kW/m2 183 183 183 183
19.5 kW/m2 241 241 241 241
9.8 kW/m2 366 366 366 366
Jet Fire 35.35 kW/m2 368 372 391 370
28.3 kW/m2 389 392 413 391
19.5 kW/m2 427 427 451 427
9.8 kW/m2 512 520 536 516
Flash Fire 0.85 LFL 504 509 542 457
Jet Fire 35.35 kW/m2 0 0 0 0
28.3 kW/m2 0 0 0 0
19.5 kW/m2 0 9 9 9
9.8 kW/m2 10 10 10 10
Flash Fire 0.85 LFL 8 8 8 8
Jet Fire 35.35 kW/m2 21 22 23 21
28.3 kW/m2 22 22 24 22
19.5 kW/m2 24 24 26 24
9.8 kW/m2 27 27 28 27
Flash Fire 0.85 LFL 22 21 21 21
Jet Fire 35.35 kW/m2 40 41 46 40
28.3 kW/m2 42 43 47 42
19.5 kW/m2 46 47 50 46
9.8 kW/m2 53 54 56 53
Flash Fire 0.85 LFL 48 48 50 47
Jet Fire 35.35 kW/m2 71 72 81 71
Full bore
50
100
100
LPS_GRS_09 Piping from Pressure Reduction Station (L9 Stream) to L9
V 10
25
Annex 5G - 4 - 8

F, 2 m/s D, 3 m/s D, 7m/s B, 2.5m/s
Section PhaseLeak Size
(mm)
Hazard
Effects
End Point
Criteria
Hazard Extent (m)
Weather Conditions
28.3 kW/m2 74 76 85 75
19.5 kW/m2 82 84 90 83
9.8 kW/m2 98 99 102 98
Flash Fire 0.85 LFL 103 104 111 99
Fireball Fireball Radius 57 57 57 57
35.35 kW/m2 105 105 105 105
28.3 kW/m2 128 128 128 128
19.5 kW/m2 169 169 169 169
9.8 kW/m2 254 254 254 254
Jet Fire 35.35 kW/m2 210 212 226 211
28.3 kW/m2 221 222 238 222
19.5 kW/m2 240 244 259 241
9.8 kW/m2 296 299 304 297
Flash Fire 0.85 LFL 338 343 363 310
Jet Fire 35.35 kW/m2 12 12 13 12
28.3 kW/m2 13 13 14 13
19.5 kW/m2 14 14 15 14
9.8 kW/m2 16 16 17 16
Flash Fire 0.85 LFL 12 12 11 12
Jet Fire 35.35 kW/m2 30 31 34 31
28.3 kW/m2 33 32 36 32
19.5 kW/m2 35 35 38 35
9.8 kW/m2 40 40 42 40
Flash Fire 0.85 LFL 34 35 35 34
Jet Fire 35.35 kW/m2 56 56 64 56
28.3 kW/m2 57 60 67 59
19.5 kW/m2 64 66 71 65
9.8 kW/m2 76 76 79 76
Flash Fire 0.85 LFL 76 77 81 74
Jet Fire 35.35 kW/m2 98 99 111 99
28.3 kW/m2 102 105 116 103
19.5 kW/m2 114 116 124 115
Full bore
100
LPS_GRS_10 Pig Receiver of the existing GRS V 10
25
50
Annex 5G - 4 - 9
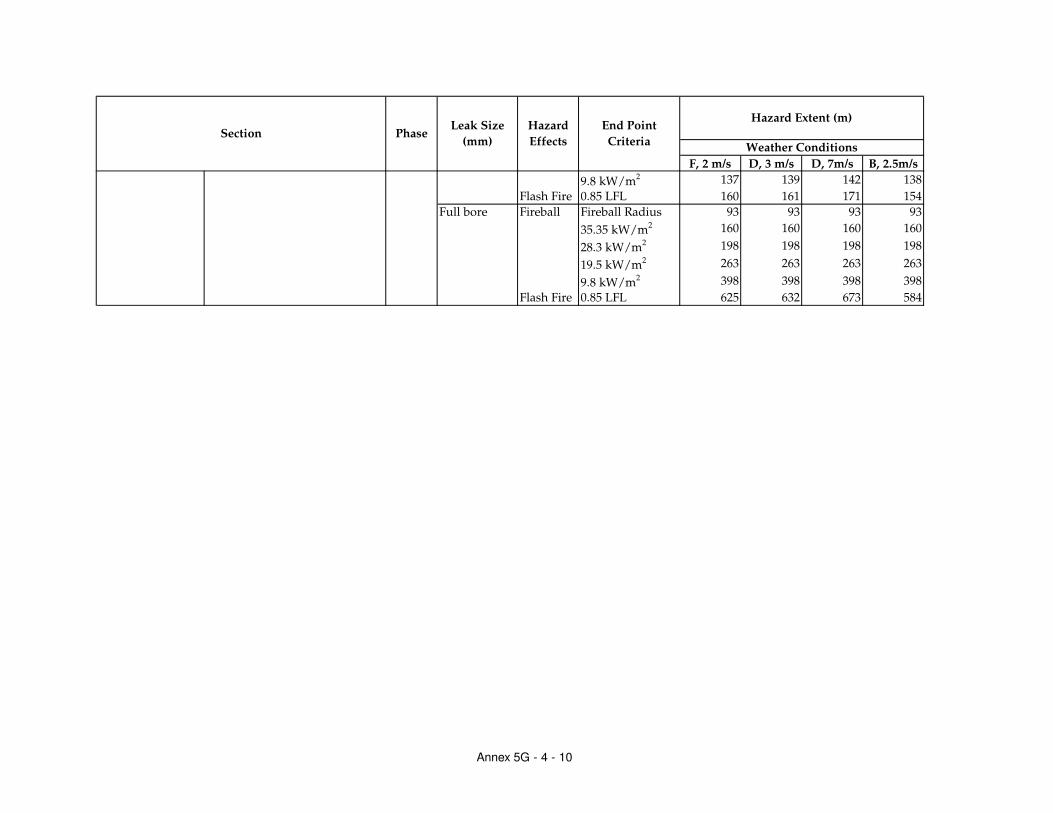
F, 2 m/s D, 3 m/s D, 7m/s B, 2.5m/s
Section PhaseLeak Size
(mm)
Hazard
Effects
End Point
Criteria
Hazard Extent (m)
Weather Conditions
9.8 kW/m2 137 139 142 138
Flash Fire 0.85 LFL 160 161 171 154
Fireball Fireball Radius 93 93 93 93
35.35 kW/m2 160 160 160 160
28.3 kW/m2 198 198 198 198
19.5 kW/m2 263 263 263 263
9.8 kW/m2 398 398 398 398
Flash Fire 0.85 LFL 625 632 673 584
Full bore
Annex 5G - 4 - 10

Annex 5G-5
Consequence Modelling
Parameters for the LNG
Terminal

PARAMETERS REPORT Unique Audit Number:
Study Folder:
12,656,493
0391939 - CLP HK Offshore LNG Terminal Hazard Assessment_IF Phast 6.7
0391939 - CLP HK Offshore LNG Terminal Hazard Assessment_IF
HKOLNGT
Discharge Parameters
Continuous Critical Weber number 12.5
Instantaneous Critical Weber number 12.5
Venting equation constant 24.82
Relief valve safety factor 1.2
Minimum RV diameter ratio 1
barCritical pressure greater than flow phase 0.3447
m/sMaximum release velocity 500
umMinimum drop diameter allowed 0.01
umMaximum drop diameter allowed 1E4
fractionDefault Liquid Fraction 1
Continuous Drop Slip factor 1
Instantaneous Drop Slip factor 1
100.00Number of Time Steps
1,000.00Maximum Number of Data Points
Tolerance 0.0001
Thermal coupling to the wall No modelling of heat transfer
Use Bernoulli for forced -phase liq-liq discharge Use compressible flow eqn
Capping of pipe flow rates Use leak scenario cap, disallow flashing
Velocity capping method FixedVelocity
Droplet Method - continuous only Modified CCPS
Thermodynamic Option for Gas Pipellines Non-ideal Gas
Excess Flow Valve velocity head losses 0
Non-Return Valve velocity head losses 0
Shut-Off Valve velocity head losses 0
/mFrequency of bends in long pipes 0
/mFrequency of couplings in long pipes 0
/mFrequency of junctions in long pipes 0
mLine length 10
mmPipe roughness 0.0457
/hrAir changes 3
mElevation 1
Atmospheric Expansion Method Closest to Initial Conditions
Tank Roof Failure Model Effects Instantaneous effects
/mFrequency of Excess Flow Valves 0
/mFrequency of Non-Return Valves 0
/mFrequency of Shut-Off Valves 0
Mechanism for forcing droplet breakup - Inst. Use flashing correlation
Mechanism for forcing droplet breakup - Cont Do not force correlation
Flashing in the orifice No flashing in the orifice
Handling of droplets Not Trapped
Indoor mass modification factor 3
Vacuum Relief Valve Operating
barVacuum Relief Valve Set Point 0
Dispersion Parameters
Expansion zone length/source diameter ratio 0.01
Near Field Passive Entrainment Parameter 1
Jet Model Morton et.al.
Jet entrainment coefficient alpha1 0.17
Jet entrainment coefficient alpha2 0.35
1 7 of Date: 7/5/2018 16:24:24Time:

PARAMETERS REPORT Unique Audit Number:
Study Folder:
12,656,493
0391939 - CLP HK Offshore LNG Terminal Hazard Assessment_IF Phast 6.7
Drag coefficient between plume and air 0
Dense cloud parameter gamma - continuous 0
Dense cloud parameter gamma - instant 0.3
Dense cloud parameter K - continuous 1.15
Dense cloud parameter K - instantaneous 1.15
Modeling of instantaneous expansion Standard Method
Maximum Cloud/Ambient Velocity Difference 0.1
Maximum Cloud/Ambient Density Difference 0.015
Maximum Non-passive entrainment fraction 0.3
Maximum Richardson number 15
Distance multiple for full passive entrainment 2
sCore Averaging Time 18.75
Ratio instantaneous/continuous sigma-y 1
Ratio instantaneous/continuous sigma-z 1
Droplet evaporation thermodynamics model Rainout, Non-equilibrium
Ratio Droplet/ expansion velocity for inst. release 0.8
kJ/kgExpansion energy cutoff for droplet angle 0.69
Coefficient of Initial Rainout 0
Flag to reset rainout position Do not reset rainout position
Richardson Number for passive transition above pool 0.015
Pool Vaporization entrainment parameter 1.5
Richardson number criterion for cloud lift-off -20
Flag for Heat/Water vapor transfer Heat and Water
Surface over which the dispersion occurs Land
degCMinimum temperature allowed -262.1
degCMaximum temperature allowed 626.9
m/sMinimum release velocity for cont. release 0.1
mMinimum Continuous Release Height 0
mMaximum distance for dispersion 5E4
mMaximum height for dispersion 1000
mMinimum cloud depth 0.02
Treatment of top mixing layer Constrained
Model In Use Best Estimate
Lee Length Calculate
Lee Half-Width Calculate
Lee Height Calculate
K-Factor Calculate
Switch Distance Calculate
mMaximum Initial Step Size 10
5.00Minimum Number of Steps per Zone
Factor for Step Increase 1.2
1,000.00Maximum Number of Output Steps
Flag for finite duration correction QI without Duration Adjustment
Quasi-instantaneous transition parameter 0.8
Relative tolerance for dispersion calculations 0.001
Relative tolerance for droplet calculations 0.001
sInitial integration step size - Instantaneous 0.01
mInitial integration step size - Continuous 0.01
sMaximum integration step size - Instantaneous 100
mMaximum integration step size - Continuous 100
Impingement Option Use Velocity Modification Factor
m/sImpinged velocity limit 500
Impinged Velocity Factor 0.25
Dispersion Model to use Version 2 model
sFixed step size - Instantaneous 0.01
2 7 of Date: 7/5/2018 16:24:24Time:
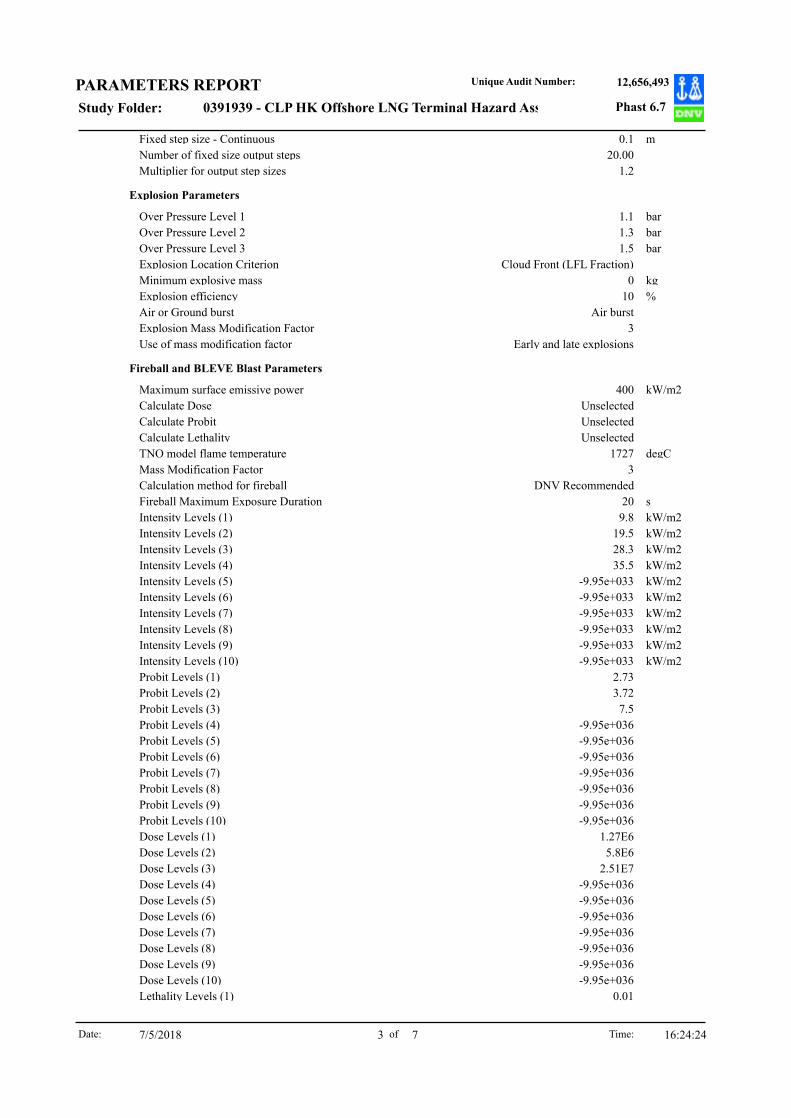
PARAMETERS REPORT Unique Audit Number:
Study Folder:
12,656,493
0391939 - CLP HK Offshore LNG Terminal Hazard Assessment_IF Phast 6.7
mFixed step size - Continuous 0.1
20.00Number of fixed size output steps
Multiplier for output step sizes 1.2
Explosion Parameters
barOver Pressure Level 1 1.1
barOver Pressure Level 2 1.3
barOver Pressure Level 3 1.5
Explosion Location Criterion Cloud Front (LFL Fraction)
kgMinimum explosive mass 0
%Explosion efficiency 10
Air or Ground burst Air burst
Explosion Mass Modification Factor 3
Use of mass modification factor Early and late explosions
Fireball and BLEVE Blast Parameters
kW/m2Maximum surface emissive power 400
Calculate Dose Unselected
Calculate Probit Unselected
Calculate Lethality Unselected
degCTNO model flame temperature 1727
Mass Modification Factor 3
Calculation method for fireball DNV Recommended
sFireball Maximum Exposure Duration 20
kW/m2Intensity Levels (1) 9.8
kW/m2Intensity Levels (2) 19.5
kW/m2Intensity Levels (3) 28.3
kW/m2Intensity Levels (4) 35.5
kW/m2Intensity Levels (5) -9.95e+033
kW/m2Intensity Levels (6) -9.95e+033
kW/m2Intensity Levels (7) -9.95e+033
kW/m2Intensity Levels (8) -9.95e+033
kW/m2Intensity Levels (9) -9.95e+033
kW/m2Intensity Levels (10) -9.95e+033
Probit Levels (1) 2.73
Probit Levels (2) 3.72
Probit Levels (3) 7.5
Probit Levels (4) -9.95e+036
Probit Levels (5) -9.95e+036
Probit Levels (6) -9.95e+036
Probit Levels (7) -9.95e+036
Probit Levels (8) -9.95e+036
Probit Levels (9) -9.95e+036
Probit Levels (10) -9.95e+036
Dose Levels (1) 1.27E6
Dose Levels (2) 5.8E6
Dose Levels (3) 2.51E7
Dose Levels (4) -9.95e+036
Dose Levels (5) -9.95e+036
Dose Levels (6) -9.95e+036
Dose Levels (7) -9.95e+036
Dose Levels (8) -9.95e+036
Dose Levels (9) -9.95e+036
Dose Levels (10) -9.95e+036
Lethality Levels (1) 0.01
3 7 of Date: 7/5/2018 16:24:24Time:

PARAMETERS REPORT Unique Audit Number:
Study Folder:
12,656,493
0391939 - CLP HK Offshore LNG Terminal Hazard Assessment_IF Phast 6.7
Lethality Levels (2) 0.1
Lethality Levels (3) 1
Lethality Levels (4) -9.95e+036
Lethality Levels (5) -9.95e+036
Lethality Levels (6) -9.95e+036
Lethality Levels (7) -9.95e+036
Lethality Levels (8) -9.95e+036
Lethality Levels (9) -9.95e+036
Lethality Levels (10) -9.95e+036
Ground Reflection Ground Burst
Ideal Gas Modeling Model as real gas
mMinimum Distance 0
100.00Number of Distance Points
Flammable Parameters
mHeight for calculation of flammable effects 0
mFlammable result grid step in X-direction 10
LFL fraction to finish 0.5
degAngle of inclination 0
Observer direction Variable
Flammable mass calculation method Mass between LFL and UFL
sFlammable Base averaging time 18.75
sCut Off Time for Short Continuous Releases 20
Observer type radiation modelling flag Planar
Probit A Value -36.38
Probit B Value 2.56
Probit N Value 1.333
Height for reports Centreline Height
degAngle of orientation 0
fractionRelative tolerance for radiation calculations 0.01
5.00Number of Lethality Ellipses
Ellipse linear spacing variable Probit
fractionMinimum Probability Of Death 0.01
50.00Number of radiation/distance points in linked radiation calculations
Method for fitting ellipse to flash fire shape ChiSq method
Absolute tolerance for linked radiation calcs 1e-010
Solar radiation Exclude from calculations
For time-varying releases Don't Model Short Duration Effects
Match fireball duration and mass released No
General Parameters
sMaximum release duration 3600
mHeight for concentration output 0
degRotation 0
mLower Elevation 0
Multicomponent aerosol behaviour Single aerosol modelling
Jet Fire Parameters
kW/m2Maximum SEP for a Jet Fire 400
sJet Fire Averaging Time 20
Calculate Dose Unselected
Calculate Probit Unselected
Calculate Lethality Unselected
degCrosswind Angle 0
Correlation DNV Recommended
Horizontal Options Use standard method
4 7 of Date: 7/5/2018 16:24:24Time:

PARAMETERS REPORT Unique Audit Number:
Study Folder:
12,656,493
0391939 - CLP HK Offshore LNG Terminal Hazard Assessment_IF Phast 6.7
Rate Modification Factor 3
sJet Fire Maximum Exposure Duration 20
Emissivity Method E and F calculated
kW/m2Intensity Levels (1) 9.8
kW/m2Intensity Levels (2) 19.5
kW/m2Intensity Levels (3) 28.3
kW/m2Intensity Levels (4) 35.5
kW/m2Intensity Levels (5) -9.95e+033
kW/m2Intensity Levels (6) -9.95e+033
kW/m2Intensity Levels (7) -9.95e+033
kW/m2Intensity Levels (8) -9.95e+033
kW/m2Intensity Levels (9) -9.95e+033
kW/m2Intensity Levels (10) -9.95e+033
Probit Levels (1) 2.73
Probit Levels (2) 3.72
Probit Levels (3) 7.5
Probit Levels (4) -9.95e+036
Probit Levels (5) -9.95e+036
Probit Levels (6) -9.95e+036
Probit Levels (7) -9.95e+036
Probit Levels (8) -9.95e+036
Probit Levels (9) -9.95e+036
Probit Levels (10) -9.95e+036
Dose Levels (1) 1.27E6
Dose Levels (2) 5.8E6
Dose Levels (3) 2.51E7
Dose Levels (4) -9.95e+036
Dose Levels (5) -9.95e+036
Dose Levels (6) -9.95e+036
Dose Levels (7) -9.95e+036
Dose Levels (8) -9.95e+036
Dose Levels (9) -9.95e+036
Dose Levels (10) -9.95e+036
Lethality Levels (1) 0.01
Lethality Levels (2) 0.1
Lethality Levels (3) 1
Lethality Levels (4) -9.95e+036
Lethality Levels (5) -9.95e+036
Lethality Levels (6) -9.95e+036
Lethality Levels (7) -9.95e+036
Lethality Levels (8) -9.95e+036
Lethality Levels (9) -9.95e+036
Lethality Levels (10) -9.95e+036
Pool Fire Parameters
sContinuous releases 10
Calculate Dose Not selected
Calculate Probit Not selected
Calculate Lethality Not selected
sMaxExposureDuration 20
fractionRadiative fraction for general fires 0.4
kW/m2Intensity Levels (1) 9.8
kW/m2Intensity Levels (2) 19.5
kW/m2Intensity Levels (3) 28.3
kW/m2Intensity Levels (4) 35.5
5 7 of Date: 7/5/2018 16:24:24Time:
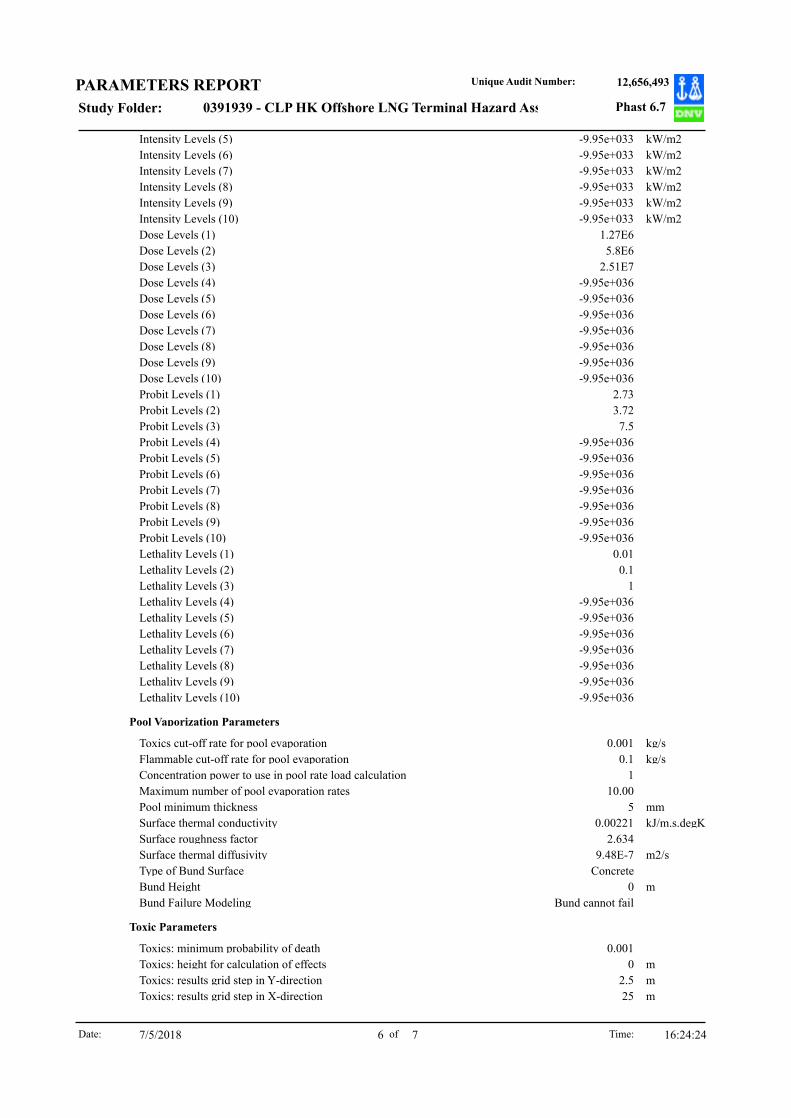
PARAMETERS REPORT Unique Audit Number:
Study Folder:
12,656,493
0391939 - CLP HK Offshore LNG Terminal Hazard Assessment_IF Phast 6.7
kW/m2Intensity Levels (5) -9.95e+033
kW/m2Intensity Levels (6) -9.95e+033
kW/m2Intensity Levels (7) -9.95e+033
kW/m2Intensity Levels (8) -9.95e+033
kW/m2Intensity Levels (9) -9.95e+033
kW/m2Intensity Levels (10) -9.95e+033
Dose Levels (1) 1.27E6
Dose Levels (2) 5.8E6
Dose Levels (3) 2.51E7
Dose Levels (4) -9.95e+036
Dose Levels (5) -9.95e+036
Dose Levels (6) -9.95e+036
Dose Levels (7) -9.95e+036
Dose Levels (8) -9.95e+036
Dose Levels (9) -9.95e+036
Dose Levels (10) -9.95e+036
Probit Levels (1) 2.73
Probit Levels (2) 3.72
Probit Levels (3) 7.5
Probit Levels (4) -9.95e+036
Probit Levels (5) -9.95e+036
Probit Levels (6) -9.95e+036
Probit Levels (7) -9.95e+036
Probit Levels (8) -9.95e+036
Probit Levels (9) -9.95e+036
Probit Levels (10) -9.95e+036
Lethality Levels (1) 0.01
Lethality Levels (2) 0.1
Lethality Levels (3) 1
Lethality Levels (4) -9.95e+036
Lethality Levels (5) -9.95e+036
Lethality Levels (6) -9.95e+036
Lethality Levels (7) -9.95e+036
Lethality Levels (8) -9.95e+036
Lethality Levels (9) -9.95e+036
Lethality Levels (10) -9.95e+036
Pool Vaporization Parameters
kg/sToxics cut-off rate for pool evaporation 0.001
kg/sFlammable cut-off rate for pool evaporation 0.1
Concentration power to use in pool rate load calculation 1
10.00Maximum number of pool evaporation rates
mmPool minimum thickness 5
kJ/m.s.degKSurface thermal conductivity 0.00221
Surface roughness factor 2.634
m2/sSurface thermal diffusivity 9.48E-7
Type of Bund Surface Concrete
mBund Height 0
Bund Failure Modeling Bund cannot fail
Toxic Parameters
Toxics: minimum probability of death 0.001
mToxics: height for calculation of effects 0
mToxics: results grid step in Y-direction 2.5
mToxics: results grid step in X-direction 25
6 7 of Date: 7/5/2018 16:24:24Time:

PARAMETERS REPORT Unique Audit Number:
Study Folder:
12,656,493
0391939 - CLP HK Offshore LNG Terminal Hazard Assessment_IF Phast 6.7
Multi-comp. toxic calc. method Mixture Probit
sToxic Averaging Time - New Parameter 600
Probit Calculation Method Use Probit
/hrBuilding Exchange Rate 4
sTail Time 1800
Indoor Calculations Unselected
Wind Dependent Exchange Rate Case Specified
Set averaging time equal to exposure time Use a fixed averaging time
fractionCut-off fraction of toxic load for exposure time calculation 0.05
fractionCut-off concentration for exposure time calculations 0
Weather Parameters
barAtmospheric pressure 1.013
Atmospheric molecular weight 28.97
kJ/kg.degKAtmospheric specific heat at constant pressure 1.004
mWind speed reference height 10
mTemperature reference height 0
mCut-off height for wind speed profile 1
Wind speed profile Power Law
Atmospheric T and P Profile Temp.Logarithmic; Pres.Linear
degCAtmospheric Temperature 23.3
fractionRelative Humidity 0.78
Parameter 0.1
mmLength 183.2
Surface Roughness Use Parameter
degCSurface Temperature for Dispersion Calculations 23.3
degCSurface Temperature for Pool Calculations 23.3
kW/m2Solar Radiation Flux 0.5
/hrBuilding Exchange Rate 4
sTail Time 1800
Surface Type 0.2mm - Open water
mMixing Layer Height for Pasquil Stability A 1300
mMixing Layer Height for Pasquil Stability A/B 1080
mMixing Layer Height for Pasquil Stability B 920
mMixing Layer Height for Pasquil Stability B/C 880
mMixing Layer Height for Pasquil Stability C 840
mMixing Layer Height for Pasquil Stability C/D 820
mMixing Layer Height for Pasquil Stability D 800
mMixing Layer Height for Pasquil Stability E 400
mMixing Layer Height for Pasquil Stability F 100
mMixing Layer Height for Pasquil Stability G 100
7 7 of Date: 7/5/2018 16:24:24Time:

Annex 5G-6
Consequence Modelling
Parameters for GRS
facilities at the BPPS

PARAMETERS REPORT Unique Audit Number:
Study Folder:
1,614,986
Task 4A Phast 6.7
Task 4A
BPPS_NGRS
Discharge Parameters
Continuous Critical Weber number 12.5
Instantaneous Critical Weber number 12.5
Venting equation constant 24.82
Relief valve safety factor 1.2
Minimum RV diameter ratio 1
barCritical pressure greater than flow phase 0.3447
m/sMaximum release velocity 500
umMinimum drop diameter allowed 0.01
umMaximum drop diameter allowed 1E4
fractionDefault Liquid Fraction 1
Continuous Drop Slip factor 1
Instantaneous Drop Slip factor 1
100.00Number of Time Steps
1,000.00Maximum Number of Data Points
Tolerance 0.0001
Thermal coupling to the wall No modelling of heat transfer
Use Bernoulli for forced -phase liq-liq discharge Use compressible flow eqn
Capping of pipe flow rates Use leak scenario cap, disallow flashing
Velocity capping method FixedVelocity
Droplet Method - continuous only Modified CCPS
Thermodynamic Option for Gas Pipellines Non-ideal Gas
Excess Flow Valve velocity head losses 0
Non-Return Valve velocity head losses 0
Shut-Off Valve velocity head losses 0
/mFrequency of bends in long pipes 0
/mFrequency of couplings in long pipes 0
/mFrequency of junctions in long pipes 0
mLine length 10
mmPipe roughness 0.0457
/hrAir changes 3
mElevation 1
Atmospheric Expansion Method Closest to Initial Conditions
Tank Roof Failure Model Effects Instantaneous effects
/mFrequency of Excess Flow Valves 0
/mFrequency of Non-Return Valves 0
/mFrequency of Shut-Off Valves 0
Mechanism for forcing droplet breakup - Inst. Use flashing correlation
Mechanism for forcing droplet breakup - Cont Do not force correlation
Flashing in the orifice No flashing in the orifice
Handling of droplets Not Trapped
Indoor mass modification factor 3
Vacuum Relief Valve Operating
barVacuum Relief Valve Set Point 0
Dispersion Parameters
Expansion zone length/source diameter ratio 0.01
Near Field Passive Entrainment Parameter 1
Jet Model Morton et.al.
Jet entrainment coefficient alpha1 0.17
Jet entrainment coefficient alpha2 0.35
1 7 of Date: 7/5/2018 16:15:42Time:

PARAMETERS REPORT Unique Audit Number:
Study Folder:
1,614,986
Task 4A Phast 6.7
Drag coefficient between plume and air 0
Dense cloud parameter gamma - continuous 0
Dense cloud parameter gamma - instant 0.3
Dense cloud parameter K - continuous 1.15
Dense cloud parameter K - instantaneous 1.15
Modeling of instantaneous expansion Standard Method
Maximum Cloud/Ambient Velocity Difference 0.1
Maximum Cloud/Ambient Density Difference 0.015
Maximum Non-passive entrainment fraction 0.3
Maximum Richardson number 15
Distance multiple for full passive entrainment 2
sCore Averaging Time 18.75
Ratio instantaneous/continuous sigma-y 1
Ratio instantaneous/continuous sigma-z 1
Droplet evaporation thermodynamics model Rainout, Non-equilibrium
Ratio Droplet/ expansion velocity for inst. release 0.8
kJ/kgExpansion energy cutoff for droplet angle 0.69
Coefficient of Initial Rainout 0
Flag to reset rainout position Do not reset rainout position
Richardson Number for passive transition above pool 0.015
Pool Vaporization entrainment parameter 1.5
Richardson number criterion for cloud lift-off -20
Flag for Heat/Water vapor transfer Heat and Water
Surface over which the dispersion occurs Land
degCMinimum temperature allowed -262.1
degCMaximum temperature allowed 626.9
m/sMinimum release velocity for cont. release 0.1
mMinimum Continuous Release Height 0
mMaximum distance for dispersion 5E4
mMaximum height for dispersion 1000
mMinimum cloud depth 0.02
Treatment of top mixing layer Constrained
Model In Use Best Estimate
Lee Length Calculate
Lee Half-Width Calculate
Lee Height Calculate
K-Factor Calculate
Switch Distance Calculate
mMaximum Initial Step Size 10
5.00Minimum Number of Steps per Zone
Factor for Step Increase 1.2
1,000.00Maximum Number of Output Steps
Flag for finite duration correction QI without Duration Adjustment
Quasi-instantaneous transition parameter 0.8
Relative tolerance for dispersion calculations 0.001
Relative tolerance for droplet calculations 0.001
sInitial integration step size - Instantaneous 0.01
mInitial integration step size - Continuous 0.01
sMaximum integration step size - Instantaneous 100
mMaximum integration step size - Continuous 100
Impingement Option Use Velocity Modification Factor
m/sImpinged velocity limit 500
Impinged Velocity Factor 0.25
Dispersion Model to use Version 2 model
sFixed step size - Instantaneous 0.01
2 7 of Date: 7/5/2018 16:15:42Time:
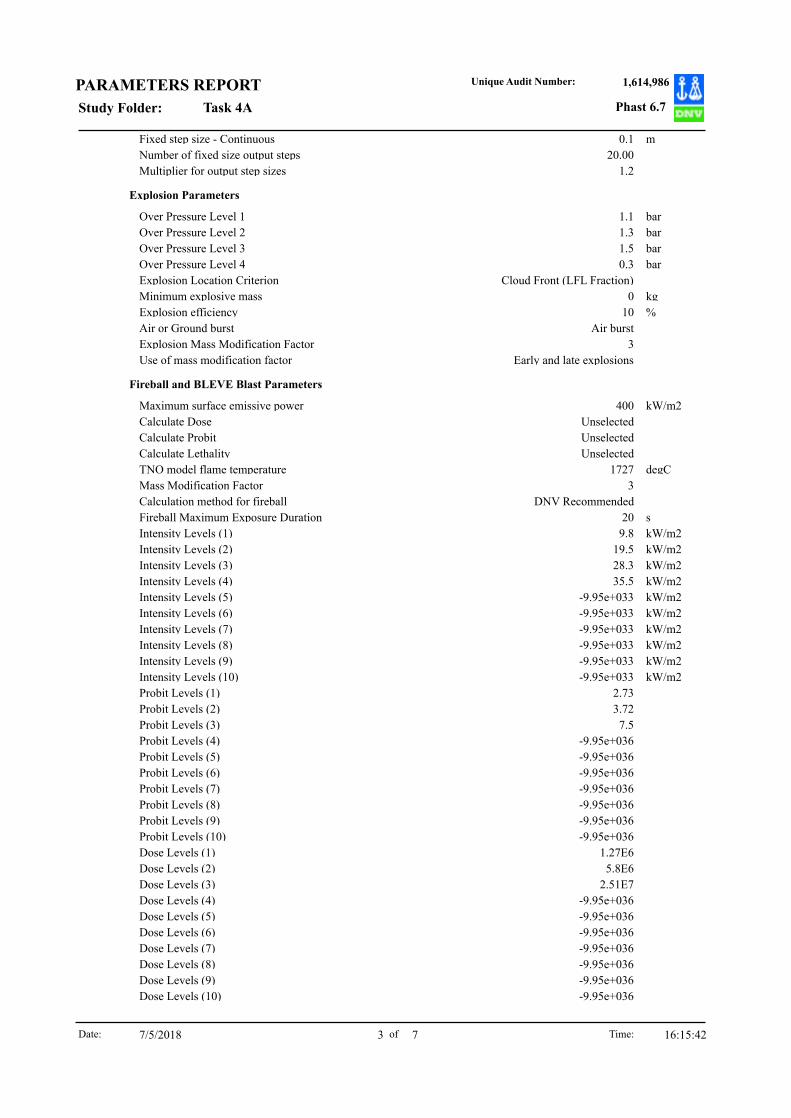
PARAMETERS REPORT Unique Audit Number:
Study Folder:
1,614,986
Task 4A Phast 6.7
mFixed step size - Continuous 0.1
20.00Number of fixed size output steps
Multiplier for output step sizes 1.2
Explosion Parameters
barOver Pressure Level 1 1.1
barOver Pressure Level 2 1.3
barOver Pressure Level 3 1.5
barOver Pressure Level 4 0.3
Explosion Location Criterion Cloud Front (LFL Fraction)
kgMinimum explosive mass 0
%Explosion efficiency 10
Air or Ground burst Air burst
Explosion Mass Modification Factor 3
Use of mass modification factor Early and late explosions
Fireball and BLEVE Blast Parameters
kW/m2Maximum surface emissive power 400
Calculate Dose Unselected
Calculate Probit Unselected
Calculate Lethality Unselected
degCTNO model flame temperature 1727
Mass Modification Factor 3
Calculation method for fireball DNV Recommended
sFireball Maximum Exposure Duration 20
kW/m2Intensity Levels (1) 9.8
kW/m2Intensity Levels (2) 19.5
kW/m2Intensity Levels (3) 28.3
kW/m2Intensity Levels (4) 35.5
kW/m2Intensity Levels (5) -9.95e+033
kW/m2Intensity Levels (6) -9.95e+033
kW/m2Intensity Levels (7) -9.95e+033
kW/m2Intensity Levels (8) -9.95e+033
kW/m2Intensity Levels (9) -9.95e+033
kW/m2Intensity Levels (10) -9.95e+033
Probit Levels (1) 2.73
Probit Levels (2) 3.72
Probit Levels (3) 7.5
Probit Levels (4) -9.95e+036
Probit Levels (5) -9.95e+036
Probit Levels (6) -9.95e+036
Probit Levels (7) -9.95e+036
Probit Levels (8) -9.95e+036
Probit Levels (9) -9.95e+036
Probit Levels (10) -9.95e+036
Dose Levels (1) 1.27E6
Dose Levels (2) 5.8E6
Dose Levels (3) 2.51E7
Dose Levels (4) -9.95e+036
Dose Levels (5) -9.95e+036
Dose Levels (6) -9.95e+036
Dose Levels (7) -9.95e+036
Dose Levels (8) -9.95e+036
Dose Levels (9) -9.95e+036
Dose Levels (10) -9.95e+036
3 7 of Date: 7/5/2018 16:15:42Time:
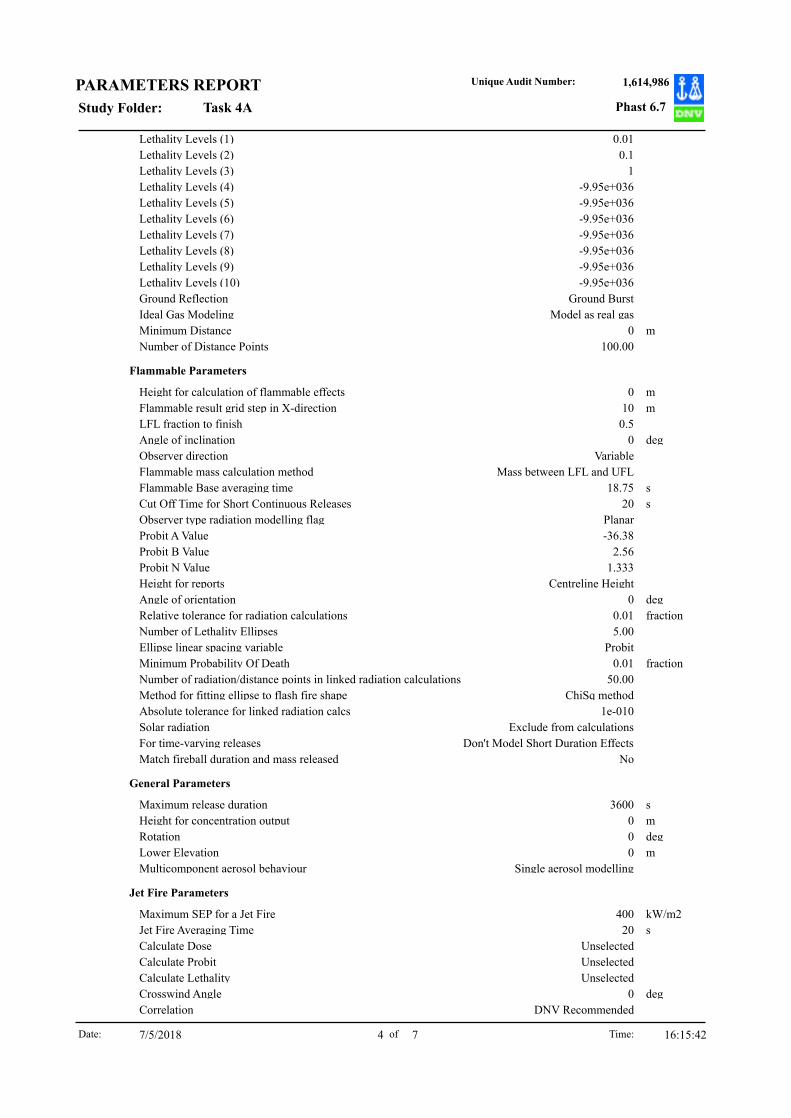
PARAMETERS REPORT Unique Audit Number:
Study Folder:
1,614,986
Task 4A Phast 6.7
Lethality Levels (1) 0.01
Lethality Levels (2) 0.1
Lethality Levels (3) 1
Lethality Levels (4) -9.95e+036
Lethality Levels (5) -9.95e+036
Lethality Levels (6) -9.95e+036
Lethality Levels (7) -9.95e+036
Lethality Levels (8) -9.95e+036
Lethality Levels (9) -9.95e+036
Lethality Levels (10) -9.95e+036
Ground Reflection Ground Burst
Ideal Gas Modeling Model as real gas
mMinimum Distance 0
100.00Number of Distance Points
Flammable Parameters
mHeight for calculation of flammable effects 0
mFlammable result grid step in X-direction 10
LFL fraction to finish 0.5
degAngle of inclination 0
Observer direction Variable
Flammable mass calculation method Mass between LFL and UFL
sFlammable Base averaging time 18.75
sCut Off Time for Short Continuous Releases 20
Observer type radiation modelling flag Planar
Probit A Value -36.38
Probit B Value 2.56
Probit N Value 1.333
Height for reports Centreline Height
degAngle of orientation 0
fractionRelative tolerance for radiation calculations 0.01
5.00Number of Lethality Ellipses
Ellipse linear spacing variable Probit
fractionMinimum Probability Of Death 0.01
50.00Number of radiation/distance points in linked radiation calculations
Method for fitting ellipse to flash fire shape ChiSq method
Absolute tolerance for linked radiation calcs 1e-010
Solar radiation Exclude from calculations
For time-varying releases Don't Model Short Duration Effects
Match fireball duration and mass released No
General Parameters
sMaximum release duration 3600
mHeight for concentration output 0
degRotation 0
mLower Elevation 0
Multicomponent aerosol behaviour Single aerosol modelling
Jet Fire Parameters
kW/m2Maximum SEP for a Jet Fire 400
sJet Fire Averaging Time 20
Calculate Dose Unselected
Calculate Probit Unselected
Calculate Lethality Unselected
degCrosswind Angle 0
Correlation DNV Recommended
4 7 of Date: 7/5/2018 16:15:42Time:
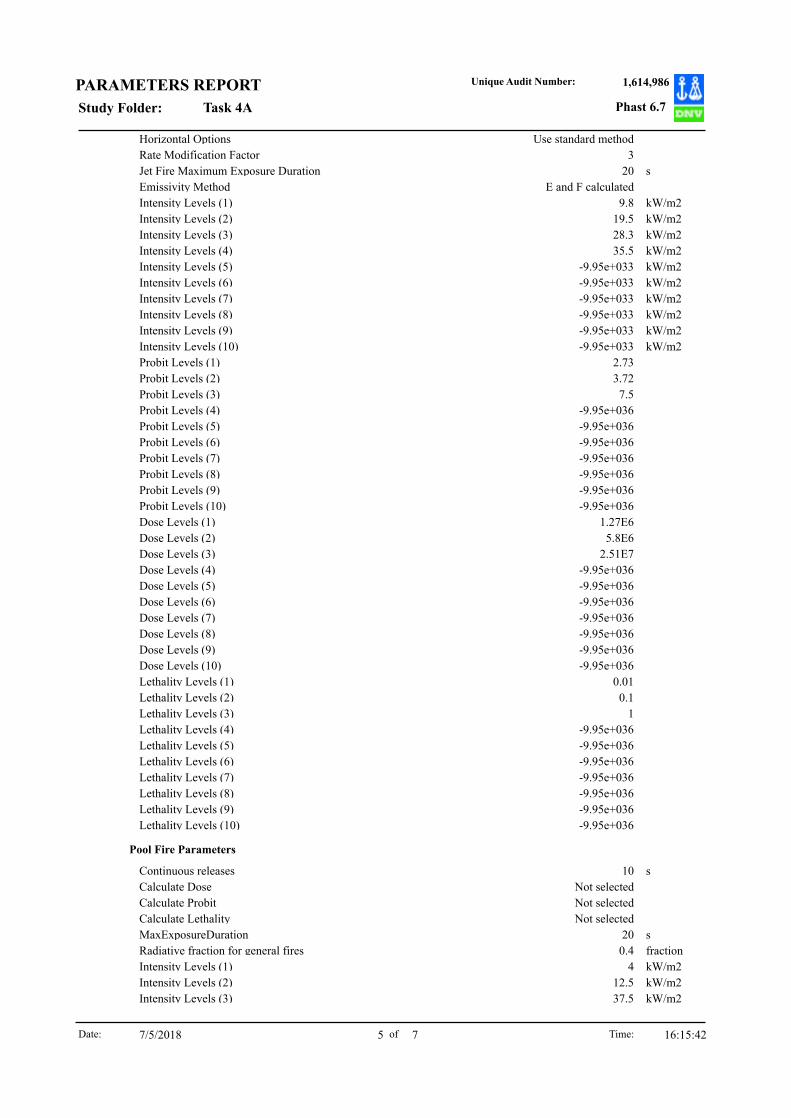
PARAMETERS REPORT Unique Audit Number:
Study Folder:
1,614,986
Task 4A Phast 6.7
Horizontal Options Use standard method
Rate Modification Factor 3
sJet Fire Maximum Exposure Duration 20
Emissivity Method E and F calculated
kW/m2Intensity Levels (1) 9.8
kW/m2Intensity Levels (2) 19.5
kW/m2Intensity Levels (3) 28.3
kW/m2Intensity Levels (4) 35.5
kW/m2Intensity Levels (5) -9.95e+033
kW/m2Intensity Levels (6) -9.95e+033
kW/m2Intensity Levels (7) -9.95e+033
kW/m2Intensity Levels (8) -9.95e+033
kW/m2Intensity Levels (9) -9.95e+033
kW/m2Intensity Levels (10) -9.95e+033
Probit Levels (1) 2.73
Probit Levels (2) 3.72
Probit Levels (3) 7.5
Probit Levels (4) -9.95e+036
Probit Levels (5) -9.95e+036
Probit Levels (6) -9.95e+036
Probit Levels (7) -9.95e+036
Probit Levels (8) -9.95e+036
Probit Levels (9) -9.95e+036
Probit Levels (10) -9.95e+036
Dose Levels (1) 1.27E6
Dose Levels (2) 5.8E6
Dose Levels (3) 2.51E7
Dose Levels (4) -9.95e+036
Dose Levels (5) -9.95e+036
Dose Levels (6) -9.95e+036
Dose Levels (7) -9.95e+036
Dose Levels (8) -9.95e+036
Dose Levels (9) -9.95e+036
Dose Levels (10) -9.95e+036
Lethality Levels (1) 0.01
Lethality Levels (2) 0.1
Lethality Levels (3) 1
Lethality Levels (4) -9.95e+036
Lethality Levels (5) -9.95e+036
Lethality Levels (6) -9.95e+036
Lethality Levels (7) -9.95e+036
Lethality Levels (8) -9.95e+036
Lethality Levels (9) -9.95e+036
Lethality Levels (10) -9.95e+036
Pool Fire Parameters
sContinuous releases 10
Calculate Dose Not selected
Calculate Probit Not selected
Calculate Lethality Not selected
sMaxExposureDuration 20
fractionRadiative fraction for general fires 0.4
kW/m2Intensity Levels (1) 4
kW/m2Intensity Levels (2) 12.5
kW/m2Intensity Levels (3) 37.5
5 7 of Date: 7/5/2018 16:15:42Time:

PARAMETERS REPORT Unique Audit Number:
Study Folder:
1,614,986
Task 4A Phast 6.7
kW/m2Intensity Levels (4) -9.95e+033
kW/m2Intensity Levels (5) -9.95e+033
kW/m2Intensity Levels (6) -9.95e+033
kW/m2Intensity Levels (7) -9.95e+033
kW/m2Intensity Levels (8) -9.95e+033
kW/m2Intensity Levels (9) -9.95e+033
kW/m2Intensity Levels (10) -9.95e+033
Dose Levels (1) 1.27E6
Dose Levels (2) 5.8E6
Dose Levels (3) 2.51E7
Dose Levels (4) -9.95e+036
Dose Levels (5) -9.95e+036
Dose Levels (6) -9.95e+036
Dose Levels (7) -9.95e+036
Dose Levels (8) -9.95e+036
Dose Levels (9) -9.95e+036
Dose Levels (10) -9.95e+036
Probit Levels (1) 2.73
Probit Levels (2) 3.72
Probit Levels (3) 7.5
Probit Levels (4) -9.95e+036
Probit Levels (5) -9.95e+036
Probit Levels (6) -9.95e+036
Probit Levels (7) -9.95e+036
Probit Levels (8) -9.95e+036
Probit Levels (9) -9.95e+036
Probit Levels (10) -9.95e+036
Lethality Levels (1) 0.01
Lethality Levels (2) 0.1
Lethality Levels (3) 1
Lethality Levels (4) -9.95e+036
Lethality Levels (5) -9.95e+036
Lethality Levels (6) -9.95e+036
Lethality Levels (7) -9.95e+036
Lethality Levels (8) -9.95e+036
Lethality Levels (9) -9.95e+036
Lethality Levels (10) -9.95e+036
Toxic Parameters
Toxics: minimum probability of death 0.001
mToxics: height for calculation of effects 0
mToxics: results grid step in Y-direction 2.5
mToxics: results grid step in X-direction 25
Multi-comp. toxic calc. method Mixture Probit
sToxic Averaging Time - New Parameter 600
Probit Calculation Method Use Probit
/hrBuilding Exchange Rate 4
sTail Time 1800
Indoor Calculations Unselected
Wind Dependent Exchange Rate Case Specified
Set averaging time equal to exposure time Use a fixed averaging time
fractionCut-off fraction of toxic load for exposure time calculation 0.05
fractionCut-off concentration for exposure time calculations 0
Weather Parameters
6 7 of Date: 7/5/2018 16:15:42Time:
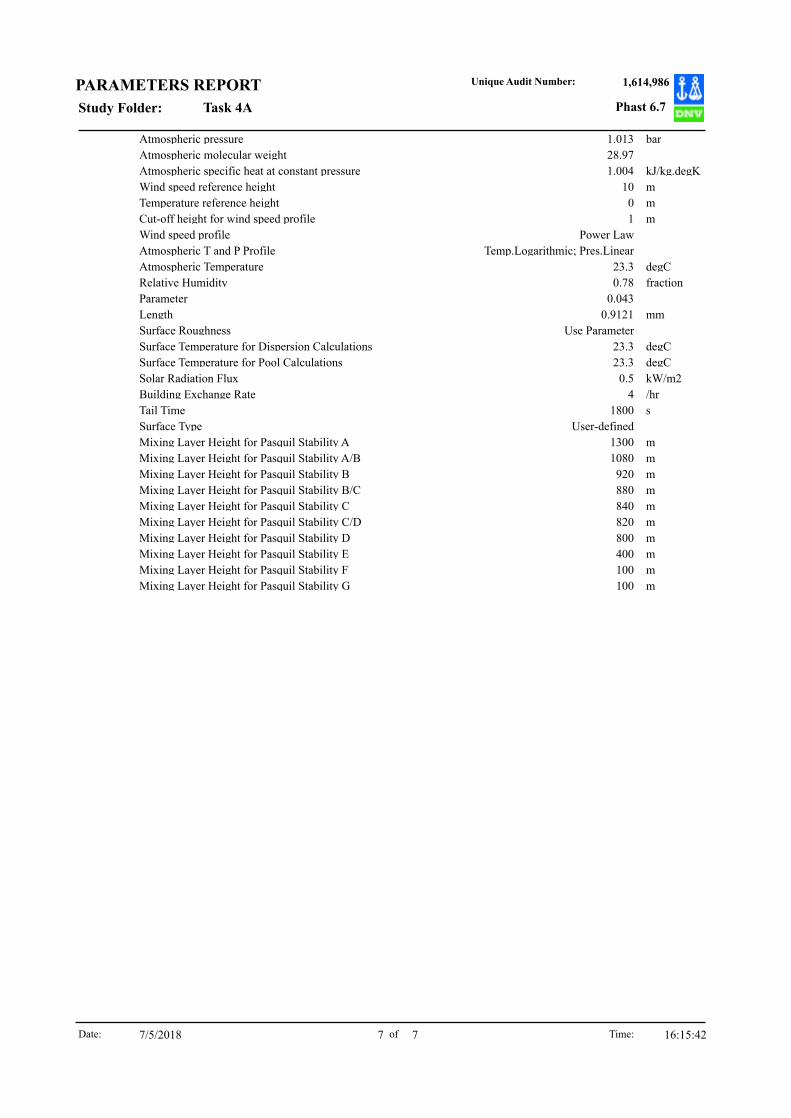
PARAMETERS REPORT Unique Audit Number:
Study Folder:
1,614,986
Task 4A Phast 6.7
barAtmospheric pressure 1.013
Atmospheric molecular weight 28.97
kJ/kg.degKAtmospheric specific heat at constant pressure 1.004
mWind speed reference height 10
mTemperature reference height 0
mCut-off height for wind speed profile 1
Wind speed profile Power Law
Atmospheric T and P Profile Temp.Logarithmic; Pres.Linear
degCAtmospheric Temperature 23.3
fractionRelative Humidity 0.78
Parameter 0.043
mmLength 0.9121
Surface Roughness Use Parameter
degCSurface Temperature for Dispersion Calculations 23.3
degCSurface Temperature for Pool Calculations 23.3
kW/m2Solar Radiation Flux 0.5
/hrBuilding Exchange Rate 4
sTail Time 1800
Surface Type User-defined
mMixing Layer Height for Pasquil Stability A 1300
mMixing Layer Height for Pasquil Stability A/B 1080
mMixing Layer Height for Pasquil Stability B 920
mMixing Layer Height for Pasquil Stability B/C 880
mMixing Layer Height for Pasquil Stability C 840
mMixing Layer Height for Pasquil Stability C/D 820
mMixing Layer Height for Pasquil Stability D 800
mMixing Layer Height for Pasquil Stability E 400
mMixing Layer Height for Pasquil Stability F 100
mMixing Layer Height for Pasquil Stability G 100
7 7 of Date: 7/5/2018 16:15:42Time:

Annex 5G-7
Consequence Modelling
Parameters for GRS
facilities at the LPS
PARAMETERS REPORT Unique Audit Number:
Study Folder:
6,334,233
Task 4B NGRS 2020 Phast 6.7
Task 4B NGRS 2020
LPS_NGRS
Discharge Parameters
Continuous Critical Weber number 12.5
Instantaneous Critical Weber number 12.5
Venting equation constant 24.82
Relief valve safety factor 1.2
Minimum RV diameter ratio 1
barCritical pressure greater than flow phase 0.3447
m/sMaximum release velocity 500
umMinimum drop diameter allowed 0.01
umMaximum drop diameter allowed 1E4
fractionDefault Liquid Fraction 1
Continuous Drop Slip factor 1
Instantaneous Drop Slip factor 1
100.00Number of Time Steps
1,000.00Maximum Number of Data Points
Tolerance 0.0001
Thermal coupling to the wall No modelling of heat transfer
Use Bernoulli for forced -phase liq-liq discharge Use compressible flow eqn
Capping of pipe flow rates Use leak scenario cap, disallow flashing
Velocity capping method FixedVelocity
Droplet Method - continuous only Modified CCPS
Thermodynamic Option for Gas Pipellines Non-ideal Gas
Excess Flow Valve velocity head losses 0
Non-Return Valve velocity head losses 0
Shut-Off Valve velocity head losses 0
/mFrequency of bends in long pipes 0
/mFrequency of couplings in long pipes 0
/mFrequency of junctions in long pipes 0
mLine length 10
mmPipe roughness 0.0457
/hrAir changes 3
mElevation 1
Atmospheric Expansion Method Closest to Initial Conditions
Tank Roof Failure Model Effects Instantaneous effects
/mFrequency of Excess Flow Valves 0
/mFrequency of Non-Return Valves 0
/mFrequency of Shut-Off Valves 0
Mechanism for forcing droplet breakup - Inst. Use flashing correlation
Mechanism for forcing droplet breakup - Cont Do not force correlation
Flashing in the orifice No flashing in the orifice
Handling of droplets Not Trapped
Indoor mass modification factor 3
Vacuum Relief Valve Operating
barVacuum Relief Valve Set Point 0
Dispersion Parameters
Expansion zone length/source diameter ratio 0.01
Near Field Passive Entrainment Parameter 1
Jet Model Morton et.al.
Jet entrainment coefficient alpha1 0.17
Jet entrainment coefficient alpha2 0.35
1 6 of Date: 7/5/2018 15:48:37Time:

PARAMETERS REPORT Unique Audit Number:
Study Folder:
6,334,233
Task 4B NGRS 2020 Phast 6.7
Drag coefficient between plume and air 0
Dense cloud parameter gamma - continuous 0
Dense cloud parameter gamma - instant 0.3
Dense cloud parameter K - continuous 1.15
Dense cloud parameter K - instantaneous 1.15
Modeling of instantaneous expansion Standard Method
Maximum Cloud/Ambient Velocity Difference 0.1
Maximum Cloud/Ambient Density Difference 0.015
Maximum Non-passive entrainment fraction 0.3
Maximum Richardson number 15
Distance multiple for full passive entrainment 2
sCore Averaging Time 18.75
Ratio instantaneous/continuous sigma-y 1
Ratio instantaneous/continuous sigma-z 1
Droplet evaporation thermodynamics model Rainout, Non-equilibrium
Ratio Droplet/ expansion velocity for inst. release 0.8
kJ/kgExpansion energy cutoff for droplet angle 0.69
Coefficient of Initial Rainout 0
Flag to reset rainout position Do not reset rainout position
Richardson Number for passive transition above pool 0.015
Pool Vaporization entrainment parameter 1.5
Richardson number criterion for cloud lift-off -20
Flag for Heat/Water vapor transfer Heat and Water
Surface over which the dispersion occurs Land
degCMinimum temperature allowed -262.1
degCMaximum temperature allowed 626.9
m/sMinimum release velocity for cont. release 0.1
mMinimum Continuous Release Height 0
mMaximum distance for dispersion 5E4
mMaximum height for dispersion 1000
mMinimum cloud depth 0.02
Treatment of top mixing layer Constrained
Model In Use Best Estimate
Lee Length Calculate
Lee Half-Width Calculate
Lee Height Calculate
K-Factor Calculate
Switch Distance Calculate
mMaximum Initial Step Size 10
5.00Minimum Number of Steps per Zone
Factor for Step Increase 1.2
1,000.00Maximum Number of Output Steps
Flag for finite duration correction QI without Duration Adjustment
Quasi-instantaneous transition parameter 0.8
Relative tolerance for dispersion calculations 0.001
Relative tolerance for droplet calculations 0.001
sInitial integration step size - Instantaneous 0.01
mInitial integration step size - Continuous 0.01
sMaximum integration step size - Instantaneous 100
mMaximum integration step size - Continuous 100
Impingement Option Use Velocity Modification Factor
m/sImpinged velocity limit 500
Impinged Velocity Factor 0.25
Dispersion Model to use Version 2 model
sFixed step size - Instantaneous 0.01
2 6 of Date: 7/5/2018 15:48:37Time:
PARAMETERS REPORT Unique Audit Number:
Study Folder:
6,334,233
Task 4B NGRS 2020 Phast 6.7
mFixed step size - Continuous 0.1
20.00Number of fixed size output steps
Multiplier for output step sizes 1.2
Explosion Parameters
barOver Pressure Level 1 0.02068
barOver Pressure Level 2 0.1379
barOver Pressure Level 3 0.2068
Explosion Location Criterion Cloud Front (LFL Fraction)
kgMinimum explosive mass 0
%Explosion efficiency 10
Air or Ground burst Air burst
Explosion Mass Modification Factor 3
Use of mass modification factor Early and late explosions
Fireball and BLEVE Blast Parameters
kW/m2Maximum surface emissive power 400
Calculate Dose Unselected
Calculate Probit Unselected
Calculate Lethality Unselected
degCTNO model flame temperature 1727
Mass Modification Factor 3
Calculation method for fireball DNV Recommended
sFireball Maximum Exposure Duration 20
kW/m2Intensity Levels (1) 4
kW/m2Intensity Levels (2) 12.5
kW/m2Intensity Levels (3) 37.5
kW/m2Intensity Levels (4) -9.95e+033
kW/m2Intensity Levels (5) -9.95e+033
kW/m2Intensity Levels (6) -9.95e+033
kW/m2Intensity Levels (7) -9.95e+033
kW/m2Intensity Levels (8) -9.95e+033
kW/m2Intensity Levels (9) -9.95e+033
kW/m2Intensity Levels (10) -9.95e+033
Probit Levels (1) 2.73
Probit Levels (2) 3.72
Probit Levels (3) 7.5
Probit Levels (4) -9.95e+036
Probit Levels (5) -9.95e+036
Probit Levels (6) -9.95e+036
Probit Levels (7) -9.95e+036
Probit Levels (8) -9.95e+036
Probit Levels (9) -9.95e+036
Probit Levels (10) -9.95e+036
Dose Levels (1) 1.27E6
Dose Levels (2) 5.8E6
Dose Levels (3) 2.51E7
Dose Levels (4) -9.95e+036
Dose Levels (5) -9.95e+036
Dose Levels (6) -9.95e+036
Dose Levels (7) -9.95e+036
Dose Levels (8) -9.95e+036
Dose Levels (9) -9.95e+036
Dose Levels (10) -9.95e+036
Lethality Levels (1) 0.01
3 6 of Date: 7/5/2018 15:48:37Time:
PARAMETERS REPORT Unique Audit Number:
Study Folder:
6,334,233
Task 4B NGRS 2020 Phast 6.7
Lethality Levels (2) 0.1
Lethality Levels (3) 1
Lethality Levels (4) -9.95e+036
Lethality Levels (5) -9.95e+036
Lethality Levels (6) -9.95e+036
Lethality Levels (7) -9.95e+036
Lethality Levels (8) -9.95e+036
Lethality Levels (9) -9.95e+036
Lethality Levels (10) -9.95e+036
Ground Reflection Ground Burst
Ideal Gas Modeling Model as real gas
mMinimum Distance 0
100.00Number of Distance Points
Flammable Parameters
mHeight for calculation of flammable effects 0
mFlammable result grid step in X-direction 10
LFL fraction to finish 0.5
degAngle of inclination 0
Observer direction Variable
Flammable mass calculation method Mass between LFL and UFL
sFlammable Base averaging time 18.75
sCut Off Time for Short Continuous Releases 20
Observer type radiation modelling flag Planar
Probit A Value -36.38
Probit B Value 2.56
Probit N Value 1.333
Height for reports Centreline Height
degAngle of orientation 0
fractionRelative tolerance for radiation calculations 0.01
5.00Number of Lethality Ellipses
Ellipse linear spacing variable Probit
fractionMinimum Probability Of Death 0.01
50.00Number of radiation/distance points in linked radiation calculations
Method for fitting ellipse to flash fire shape ChiSq method
Absolute tolerance for linked radiation calcs 1e-010
Solar radiation Exclude from calculations
For time-varying releases Don't Model Short Duration Effects
Match fireball duration and mass released No
General Parameters
sMaximum release duration 3600
mHeight for concentration output 0
degRotation 0
mLower Elevation 0
Multicomponent aerosol behaviour Single aerosol modelling
Jet Fire Parameters
kW/m2Maximum SEP for a Jet Fire 400
sJet Fire Averaging Time 20
Calculate Dose Unselected
Calculate Probit Unselected
Calculate Lethality Unselected
degCrosswind Angle 0
Correlation DNV Recommended
Horizontal Options Use standard method
4 6 of Date: 7/5/2018 15:48:37Time:

PARAMETERS REPORT Unique Audit Number:
Study Folder:
6,334,233
Task 4B NGRS 2020 Phast 6.7
Rate Modification Factor 3
sJet Fire Maximum Exposure Duration 20
Emissivity Method E and F calculated
kW/m2Intensity Levels (1) 9.8
kW/m2Intensity Levels (2) 19.5
kW/m2Intensity Levels (3) 28.3
kW/m2Intensity Levels (4) 35.5
kW/m2Intensity Levels (5) -9.95e+033
kW/m2Intensity Levels (6) -9.95e+033
kW/m2Intensity Levels (7) -9.95e+033
kW/m2Intensity Levels (8) -9.95e+033
kW/m2Intensity Levels (9) -9.95e+033
kW/m2Intensity Levels (10) -9.95e+033
Probit Levels (1) 2.73
Probit Levels (2) 3.72
Probit Levels (3) 7.5
Probit Levels (4) -9.95e+036
Probit Levels (5) -9.95e+036
Probit Levels (6) -9.95e+036
Probit Levels (7) -9.95e+036
Probit Levels (8) -9.95e+036
Probit Levels (9) -9.95e+036
Probit Levels (10) -9.95e+036
Dose Levels (1) 1.27E6
Dose Levels (2) 5.8E6
Dose Levels (3) 2.51E7
Dose Levels (4) -9.95e+036
Dose Levels (5) -9.95e+036
Dose Levels (6) -9.95e+036
Dose Levels (7) -9.95e+036
Dose Levels (8) -9.95e+036
Dose Levels (9) -9.95e+036
Dose Levels (10) -9.95e+036
Lethality Levels (1) 0.01
Lethality Levels (2) 0.1
Lethality Levels (3) 1
Lethality Levels (4) -9.95e+036
Lethality Levels (5) -9.95e+036
Lethality Levels (6) -9.95e+036
Lethality Levels (7) -9.95e+036
Lethality Levels (8) -9.95e+036
Lethality Levels (9) -9.95e+036
Lethality Levels (10) -9.95e+036
Pool Vaporization Parameters
kg/sToxics cut-off rate for pool evaporation 0.001
kg/sFlammable cut-off rate for pool evaporation 0.1
Concentration power to use in pool rate load calculation 1
10.00Maximum number of pool evaporation rates
mmPool minimum thickness 5
kJ/m.s.degKSurface thermal conductivity 0.00221
Surface roughness factor 2.634
m2/sSurface thermal diffusivity 9.48E-7
Type of Bund Surface Concrete
mBund Height 0
5 6 of Date: 7/5/2018 15:48:37Time:
PARAMETERS REPORT Unique Audit Number:
Study Folder:
6,334,233
Task 4B NGRS 2020 Phast 6.7
Bund Failure Modeling Bund cannot fail
Toxic Parameters
Toxics: minimum probability of death 0.001
mToxics: height for calculation of effects 0
mToxics: results grid step in Y-direction 2.5
mToxics: results grid step in X-direction 25
Multi-comp. toxic calc. method Mixture Probit
sToxic Averaging Time - New Parameter 600
Probit Calculation Method Use Probit
/hrBuilding Exchange Rate 4
sTail Time 1800
Indoor Calculations Unselected
Wind Dependent Exchange Rate Case Specified
Set averaging time equal to exposure time Use a fixed averaging time
fractionCut-off fraction of toxic load for exposure time calculation 0.05
fractionCut-off concentration for exposure time calculations 0
Weather Parameters
barAtmospheric pressure 1.013
Atmospheric molecular weight 28.97
kJ/kg.degKAtmospheric specific heat at constant pressure 1.004
mWind speed reference height 10
mTemperature reference height 0
mCut-off height for wind speed profile 1
Wind speed profile Power Law
Atmospheric T and P Profile Temp.Logarithmic; Pres.Linear
degCAtmospheric Temperature 23.3
fractionRelative Humidity 0.78
Parameter 0.043
mmLength 0.9121
Surface Roughness Use Parameter
degCSurface Temperature for Dispersion Calculations 23.3
degCSurface Temperature for Pool Calculations 23.3
kW/m2Solar Radiation Flux 0.5
/hrBuilding Exchange Rate 4
sTail Time 1800
Surface Type User-defined
mMixing Layer Height for Pasquil Stability A 1300
mMixing Layer Height for Pasquil Stability A/B 1080
mMixing Layer Height for Pasquil Stability B 920
mMixing Layer Height for Pasquil Stability B/C 880
mMixing Layer Height for Pasquil Stability C 840
mMixing Layer Height for Pasquil Stability C/D 820
mMixing Layer Height for Pasquil Stability D 800
mMixing Layer Height for Pasquil Stability E 400
mMixing Layer Height for Pasquil Stability F 100
mMixing Layer Height for Pasquil Stability G 100
6 6 of Date: 7/5/2018 15:48:37Time:

Annex 5H
Main Risk Contributor to Potential Loss of Life associated with the Proposed Project Facilities

ENVIRONMENTAL RESOURCES MANAGEMENT CLP POWER HONG KONG LIMITED ANNEX 5H_MAJOR RISK CONTRIBUTORS.DOC JUNE 2018
5H-1
Table 5H.1 Main Risk Contributor to PLL for LNGC and FSRU Vessel Transit to the LNG Terminal at Operational Year (2020)
Ranking Event Description PLL Percentage 1 Collision_1500_LNGC_
A Flammable effect (pool fire and flash fire) of a large hole size (1,500 mm) release scenario due to collision for LNGC during marine transit approaching the LNG Terminal
1.43E-06 57.1
2 Collision_1500_LNGC_E
Flammable effect (pool fire and flash fire) of a large hole size (1,500 mm) release scenario due to collision for LNGC during marine transit departing the LNG Terminal due to bad weather, emergency events
4.19E-07 16.7
3 Collision_1500_LNGC_T
Flammable effect (pool fire and flash fire) of a large hole size (1,500 mm) release scenario due to collision for LNGC during marine transit
3.46E-07 13.8
4 Collision_750_LNGC_T Flammable effect (pool fire and flash fire) of a medium hole size (750 mm) release scenario due to collision for LNGC during marine transit
8.74E-08 3.5
5 Collision_1500_FSRU_E Flammable effect (pool fire and flash fire) of a large hole size (1,500 mm) release scenario due to collision for FSRU during marine transit departing the LNG Terminal due to bad weather, emergency events
8.07E-08 3.2
Other 1.45E-07 5.8% Total 2.51E-06 100.0%

ENVIRONMENTAL RESOURCES MANAGEMENT CLP POWER HONG KONG LIMITED ANNEX 5H_MAJOR RISK CONTRIBUTORS.DOC JUNE 2018
5H-2
Table 5H.2 Main Risk Contributor to PLL for LNGC and FSRU Vessel Transit to the LNG Terminal at Operational Year (2030)
Ranking Event Description PLL Percentage 1 Collision_1500_LNGC_
A Flammable effect (pool fire and flash fire) of a large hole size (1,500 mm) release scenario due to collision for LNGC during marine transit approaching the LNG Terminal
1.69E-06 57.3
2 Collision_1500_LNGC_E
Flammable effect (pool fire and flash fire) of a large hole size (1,500 mm) release scenario due to collision for LNGC during marine transit departing the LNG Terminal due to bad weather, emergency events
4.92E-07 16.7
3 Collision_1500_LNGC_T
Flammable effect (pool fire and flash fire) of a large hole size (1,500 mm) release scenario due to collision for LNGC during marine transit
4.00E-07 13.5
4 Collision_750_LNGC_T Flammable effect (pool fire and flash fire) of a medium hole size (750 mm) release scenario due to collision for LNGC during marine transit
1.01E-07 3.4
5 Collision_1500_FSRU_E Flammable effect (pool fire and flash fire) of a large hole size (1,500 mm) release scenario due to collision for FSRU during marine transit departing the LNG Terminal due to bad weather, emergency events
9.59E-08 3.3
Other 1.70E-08 5.8% Total 2.95E-06 100.0%

ENVIRONMENTAL RESOURCES MANAGEMENT CLP POWER HONG KONG LIMITED ANNEX 5H_MAJOR RISK CONTRIBUTORS.DOC JUNE 2018
5H-3
Table 5H.3 Main Risk Contributor to PLL for LNG Terminal at Operational Year (2020)
Ranking Event Description PLL Percentage 1 HKOLNGT_06_LR_FB Fireball of a line rupture scenario
for Natural gas from Regasification Unit, via metering, to Jetty (including HP Gas Loading Arm)
3.49E-06 75.5%
2 HKOLNGT_01_L_PF Pool fire of a large leak scenario for LNG Loadout from LNGC, via Jetty, to LNG Storage Tank in FSRU Vessel
8.65E-07 18.7%
3 HKOLNGT_05_LR_FB Fireball of a line rupture scenario for Regasification Trains
7.75E-08 1.7%
4 HKOLNGT_04_M Flammable effect (jet fire and flash fire) of a medium leak scenario for LNG Booster Pump to Regasification Unit
1.83E-08 0.4%
5 HKOLNGT_03_L Flammable effect (jet fire and flash fire) of a large leak scenario for LNG Transfer from LNG Storage Tank Pump to LNG Booster Pump
1.71E-08 0.4%
6 HKOLNGT_04_L Flammable effect (jet fire and flash fire) of a large leak scenario for LNG Booster Pump to Regasification Unit
1.63E-08 0.4%
7 HKOLNGT_07_LR_FB Fireball of a line rupture scenario for Natural gas in Jetty to ESDV of Riser for BPPS Subsea Pipeline
1.56E-08 0.3%
8 HKOLNGT_10_LR_FB Fireball of a line rupture scenario for Natural gas in Jetty to ESDV of Riser for LPS Subsea Pipeline
1.56E-08 0.3%
9 HKOLNGT_04_S Flammable effect (jet fire and flash fire) of a small leak scenario for LNG Booster Pump to Regasification Unit
1.54E-08 0.3%
10 HKOLNGT_08_LR_FB Fireball of a line rupture scenario for Riser for BPPS Subsea Pipeline
1.14E-08 0.2%
Other 8.24E-08 1.8% Total 4.62E-06 100.0%

ENVIRONMENTAL RESOURCES MANAGEMENT CLP POWER HONG KONG LIMITED ANNEX 5H_MAJOR RISK CONTRIBUTORS.DOC JUNE 2018
5H-4
Table 5H.4 Main Risk Contributor to PLL for LNG Terminal at Future Scenario Year (2030)
Ranking Event Description PLL Percentage 1 HKOLNGT_06_LR_FB Fireball of a line rupture scenario
for Natural gas from Regasification Unit, via metering, to Jetty (including HP Gas Loading Arm)
4.15E-06 75.5%
2 HKOLNGT_01_L_PF Pool fire of a large leak scenario for LNG Loadout from LNGC, via Jetty, to LNG Storage Tank in FSRU Vessel
1.03E-06 18.7%
3 HKOLNGT_05_LR_FB Fireball of a line rupture scenario for Regasification Trains
9.22E-08 1.7%
4 HKOLNGT_04_M Flammable effect (jet fire and flash fire) of a medium leak scenario for LNG Booster Pump to Regasification Unit
2.18E-08 0.4%
5 HKOLNGT_03_L Flammable effect (jet fire and flash fire) of a large leak scenario for LNG Transfer from LNG Storage Tank Pump to LNG Booster Pump
2.03E-08 0.4%
6 HKOLNGT_04_L Flammable effect (jet fire and flash fire) of a large leak scenario for LNG Booster Pump to Regasification Unit
1.94E-08 0.4%
7 HKOLNGT_07_LR_FB Fireball of a line rupture scenario for Natural gas in Jetty to ESDV of Riser for BPPS Subsea Pipeline
1.86E-08 0.3%
8 HKOLNGT_10_LR_FB Fireball of a line rupture scenario for Natural gas in Jetty to ESDV of Riser for LPS Subsea Pipeline
1.86E-08 0.3%
9 HKOLNGT_04_S Flammable effect (jet fire and flash fire) of a small leak scenario for LNG Booster Pump to Regasification Unit
1.83E-08 0.3%
10 HKOLNGT_08_LR_FB Fireball of a line rupture scenario for Riser for BPPS Subsea Pipeline
1.35E-08 0.2%
Other 9.80E-08 1.8% Total 5.50E-06 100.0%
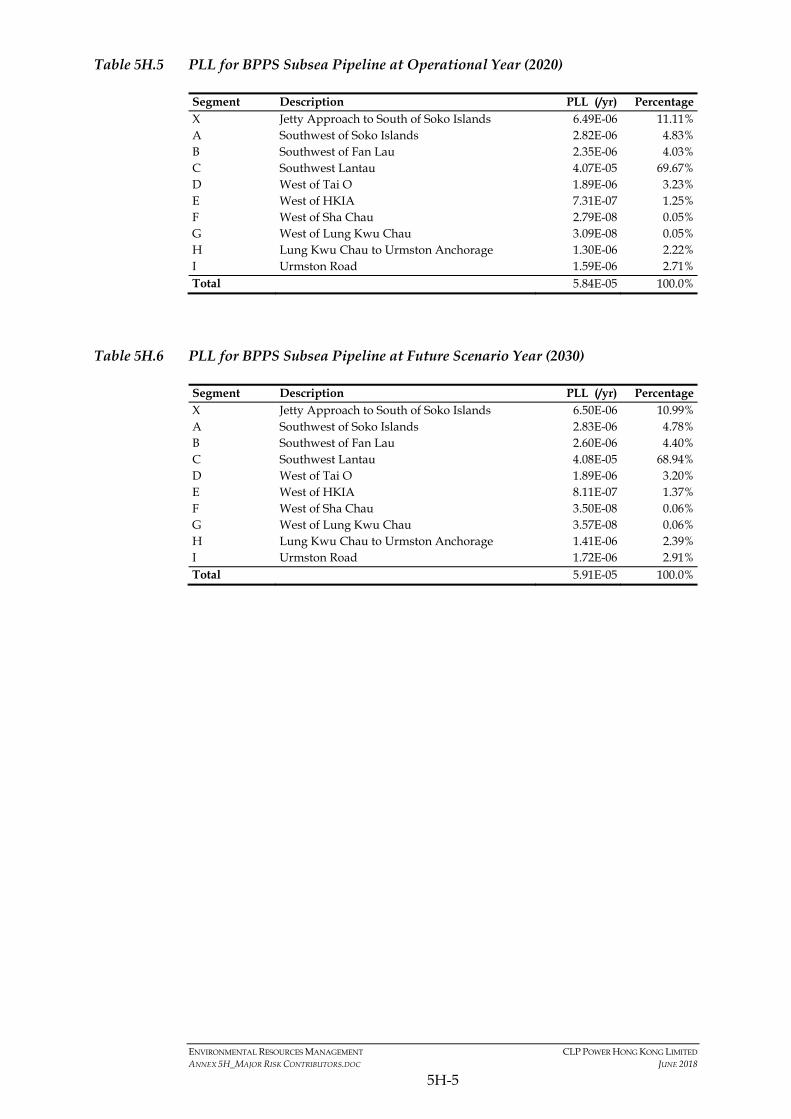
ENVIRONMENTAL RESOURCES MANAGEMENT CLP POWER HONG KONG LIMITED ANNEX 5H_MAJOR RISK CONTRIBUTORS.DOC JUNE 2018
5H-5
Table 5H.5 PLL for BPPS Subsea Pipeline at Operational Year (2020)
Segment Description PLL (/yr) Percentage X Jetty Approach to South of Soko Islands 6.49E-06 11.11% A Southwest of Soko Islands 2.82E-06 4.83% B Southwest of Fan Lau 2.35E-06 4.03% C Southwest Lantau 4.07E-05 69.67% D West of Tai O 1.89E-06 3.23% E West of HKIA 7.31E-07 1.25% F West of Sha Chau 2.79E-08 0.05% G West of Lung Kwu Chau 3.09E-08 0.05% H Lung Kwu Chau to Urmston Anchorage 1.30E-06 2.22% I Urmston Road 1.59E-06 2.71% Total 5.84E-05 100.0%
Table 5H.6 PLL for BPPS Subsea Pipeline at Future Scenario Year (2030)
Segment Description PLL (/yr) Percentage X Jetty Approach to South of Soko Islands 6.50E-06 10.99% A Southwest of Soko Islands 2.83E-06 4.78% B Southwest of Fan Lau 2.60E-06 4.40% C Southwest Lantau 4.08E-05 68.94% D West of Tai O 1.89E-06 3.20% E West of HKIA 8.11E-07 1.37% F West of Sha Chau 3.50E-08 0.06% G West of Lung Kwu Chau 3.57E-08 0.06% H Lung Kwu Chau to Urmston Anchorage 1.41E-06 2.39% I Urmston Road 1.72E-06 2.91% Total 5.91E-05 100.0%

ENVIRONMENTAL RESOURCES MANAGEMENT CLP POWER HONG KONG LIMITED ANNEX 5H_MAJOR RISK CONTRIBUTORS.DOC JUNE 2018
5H-6
Table 5H.7 PLL for LPS Subsea Pipeline at Operational Year (2020)
Segment Description PLL (/yr) Percentage A Jetty Approach to South of Shek Kwu Chau 1.54E-07 1.76% B South of Cheung Chau 2.81E-06 32.21% C West Lamma Channel 3.74E-06 42.85% D Alternative Shore Approach 2.02E-06 23.18% Total 8.73E-06 100.0%
Table 5H.8 PLL for BPPS Subsea Pipeline at Future Scenario Year (2030)
Segment Description PLL (/yr) Percentage A Jetty Approach to South of Shek Kwu Chau 1.90E-07 2.09% B South of Cheung Chau 3.00E-06 33.11% C West Lamma Channel 3.77E-06 41.59% D Alternative Shore Approach 2.10E-06 23.21% Total 9.07E-05 100.0%

ENVIRONMENTAL RESOURCES MANAGEMENT CLP POWER HONG KONG LIMITED ANNEX 5H_MAJOR RISK CONTRIBUTORS.DOC JUNE 2018
5H-7
Table 5H.9 Main Risk Contributor to PLL for Construction Year (2020) at the BPPS
Ranking Event Description PLL Percentage 1 GRS_01_LR_IF_FB Fire ball scenario due to a line rupture
of Above ground piping from shore end to pig receiver of Y13-1 GRS
2.53E-07 15.51%
2 GRS_05_LR_IF_FB Fire ball scenario due to a line rupture of Piping from gas heaters to pressure reduction station, including PRS of Y13-1 GRS
2.30E-07 14.09%
3 GRS_04_LR_IF_FB Fire ball scenario due to a line rupture of Piping from inlet gas filter separator to gas heater of Y13-1 GRS
2.04E-07 12.46%
4 GRS_18_LR_IF_FB Fire ball scenario due to a line rupture of Piping from PRS to manifold, including HIPPS of Dachan GRS
1.52E-07 9.32%
5 GRS_03_LR_IF_FB Fire ball scenario due to a line rupture of Piping from slug catcher to inlet gas filter separators of Y13-1 GRS
1.00E-07 6.13%
6 GRS_06_LR_IF_FB Fire ball scenario due to a line rupture of Piping from pressure reduction station to outlet gas filter separator of Y13-1 GRS
9.17E-08 5.62%
7 GRS_02_LR_IF_FB Fire ball scenario due to a line rupture of Piping from receiver to slug catcher of Y13-1 GRS
8.64E-08 5.29%
8 GRS_12_LR_IF_FB Fire ball scenario due to a line rupture of Piping from receiver to gas filter of Dachan GRS
7.04E-08 4.31%
9 GRS_11_LR_IF_FB Fire ball scenario due to a line rupture of Above ground piping from shore end to pig receiver of Dachan GRS
6.55E-08 4.01%
10 GRS_08_LR_IF_FB Fire ball scenario due to a line rupture of Pig receiver of Y13-1 GRS
6.15E-08 3.77%
Other 3.19E-07 19.5% Total 1.63E-06 100.0%

ENVIRONMENTAL RESOURCES MANAGEMENT CLP POWER HONG KONG LIMITED ANNEX 5H_MAJOR RISK CONTRIBUTORS.DOC JUNE 2018
5H-8
Table 5H.10 Main Risk Contributor to PLL for Operational Year (2020) at the BPPS
Ranking Event Description PLL Percentage 1 GRS_01_LR_IF_FB Fire ball scenario due to a line rupture
of Above ground piping from shore end to pig receiver of Y13-1 GRS
2.17E-07 11.58%
2 GRS_05_LR_IF_FB Fire ball scenario due to a line rupture of Piping from gas heaters to pressure reduction station, including PRS of Y13-1 GRS
1.79E-07 9.58%
3 GRS_04_LR_IF_FB Fire ball scenario due to a line rupture of Piping from inlet gas filter separator to gas heater of Y13-1 GRS
1.62E-07 8.66%
4 GRS_18_LR_IF_FB Fire ball scenario due to a line rupture of Piping from PRS to manifold, including HIPPS of Dachan GRS
1.38E-07 7.38%
5 NGRS_05_LR_IF_FB Fire ball scenario due to a line rupture of WBH piping of New GRS
1.07E-07 5.73%
6 NGRS_07_LR_IF_FB Fire ball scenario due to a line rupture of Piping from Pressure Reduction Station to Mixing Station of New GRS
1.05E-07 5.61%
7 NGRS_04_LR_IF_FB Fire ball scenario due to a line rupture of Piping from Metering Station to WBH of New GRS
8.34E-08 4.45%
8 GRS_03_LR_IF_FB Fire ball scenario due to a line rupture of Piping from slug catcher to inlet gas filter separators of Y13-1 GRS
5.98E-08 3.20%
9 GRS_12_LR_IF_FB Fire ball scenario due to a line rupture of Piping from receiver to gas filter of Dachan GRS
5.49E-08 2.93%
10 NGRS_04_LR_IF_FF Flash fire scenario due to a line rupture of Piping from Metering Station to WBH of New GRS
5.10E-08 2.72%
Other 7.14E-07 38.2% Total 1.87E-06 100.0%

ENVIRONMENTAL RESOURCES MANAGEMENT CLP POWER HONG KONG LIMITED ANNEX 5H_MAJOR RISK CONTRIBUTORS.DOC JUNE 2018
5H-9
Table 5H.11 Main Risk Contributor to PLL for Future Scenario Year (2030) at the BPPS
Ranking Event Description PLL Percentage
1 GRS_01_LR_IF_FB Fire ball scenario due to a line rupture of Above ground piping from shore end to pig receiver of Y13-1 GRS
2.23E-07 11.56%
2 GRS_05_LR_IF_FB Fire ball scenario due to a line rupture of Piping from gas heaters to pressure reduction station, including PRS of Y13-1 GRS
1.87E-07 9.70%
3 GRS_04_LR_IF_FB Fire ball scenario due to a line rupture of Piping from inlet gas filter separator to gas heater of Y13-1 GRS
1.68E-07 8.71%
4 GRS_18_LR_IF_FB Fire ball scenario due to a line rupture of Piping from PRS to manifold, including HIPPS of Dachan GRS
1.43E-07 7.42%
5 NGRS_05_LR_IF_FB Fire ball scenario due to a line rupture of WBH piping of New GRS
1.10E-07 5.71%
6 NGRS_07_LR_IF_FB Fire ball scenario due to a line rupture of Piping from Pressure Reduction Station to Mixing Station of New GRS
1.10E-07 5.70%
7 NGRS_04_LR_IF_FB Fire ball scenario due to a line rupture of Piping from Metering Station to WBH of New GRS
8.60E-08 4.46%
8 GRS_03_LR_IF_FB Fire ball scenario due to a line rupture of Piping from slug catcher to inlet gas filter separators of Y13-1 GRS
6.20E-08 3.21%
9 GRS_12_LR_IF_FB Fire ball scenario due to a line rupture of Piping from receiver to gas filter of Dachan GRS
5.55E-08 2.87%
10 NGRS_04_LR_IF_FF Flash fire scenario due to a line rupture of Piping from Metering Station to WBH of New GRS
5.21E-08 2.70%
Other 7.32E-07 37.9% Total 1.93E-06 100.0%

ENVIRONMENTAL RESOURCES MANAGEMENT CLP POWER HONG KONG LIMITED ANNEX 5H_MAJOR RISK CONTRIBUTORS.DOC JUNE 2018
5H-10
Table 5H.12 Main Risk Contributor to PLL for Construction Year (2020) at the LPS
Ranking Event Description PLL Percentage 1 GRS_01_LR_IF_FB Fire ball scenario due to a line rupture
of Above ground existing piping from shore to existing GRS Trains
2.13E-08 32.09%
2 GRS_10_LR_IF_FB Fire ball scenario due to a line rupture of Pig Receiver of the existing GRS
1.06E-08 15.91%
3 GRS_08_LR_IF_FB Fire ball scenario due to a line rupture of Piping from Heater to Pressure Reduction Station (L9 Stream)
7.17E-09 10.78%
4 GRS_07_LR_IF_FB Fire ball scenario due to a line rupture of Piping from Metering Skid to Heater (L9 Stream)
7.02E-09 10.56%
5 GRS_06_LR_IF_FB Fire ball scenario due to a line rupture of Piping from Filter Skid to Metering Skid (L9 Stream)
5.57E-09 8.38%
6 GRS_02_LR_IF_FB Fire ball scenario due to a line rupture of Piping from Filter Skid to Metering Skid (GT57 Stream)
3.05E-09 4.58%
7 GRS_03_LR_IF_FB Fire ball scenario due to a line rupture of Piping from Metering Skid to Heater (GT57 Stream)
2.54E-09 3.83%
8 GRS_04_LR_IF_FB Fire ball scenario due to a line rupture of Piping from Heater to Pressure Reduction Station (GT57 Stream)
2.35E-09 3.53%
9 GRS_01_LR_IF_FF2 Flash fire scenario due to a line rupture of Above ground existing piping from shore to existing GRS Trains
1.95E-09 2.93%
10 GRS_09_LR_IF_FB Fire ball scenario due to a line rupture of Piping from Pressure Reduction Station (L9 Stream) to L9
1.15E-09 1.72%
Other 3.78E-09 5.69% Total 6.65E-08 100.0%
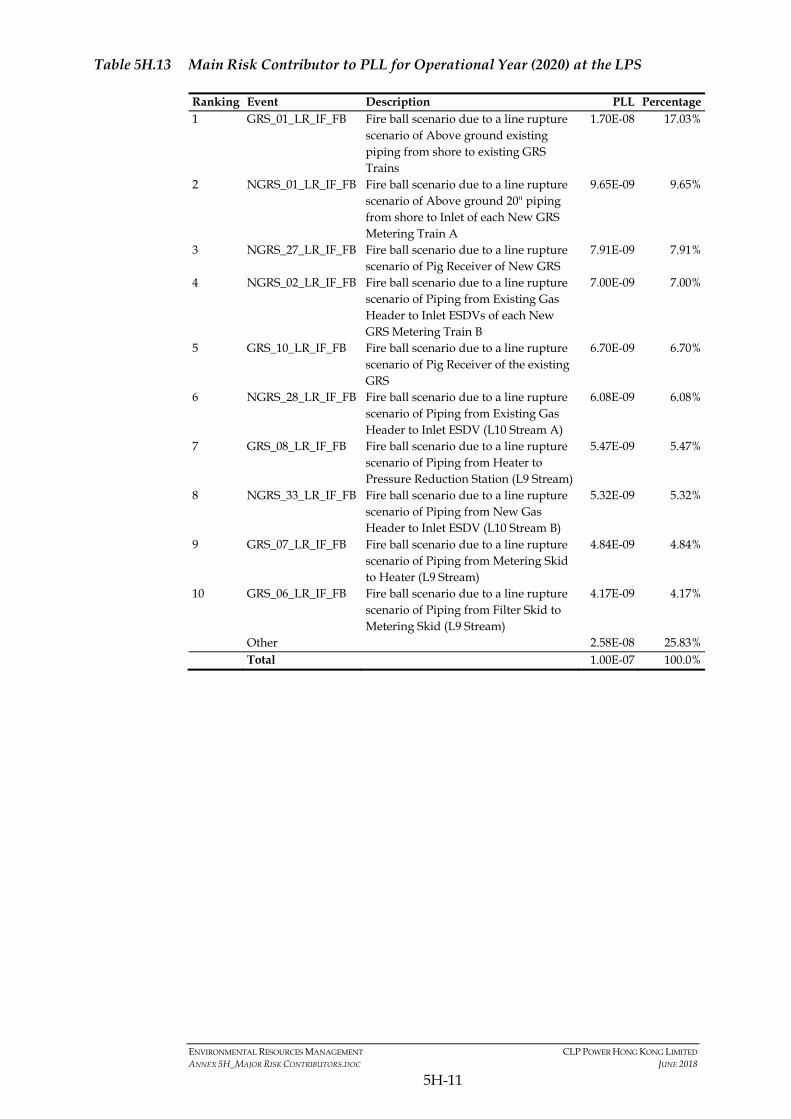
ENVIRONMENTAL RESOURCES MANAGEMENT CLP POWER HONG KONG LIMITED ANNEX 5H_MAJOR RISK CONTRIBUTORS.DOC JUNE 2018
5H-11
Table 5H.13 Main Risk Contributor to PLL for Operational Year (2020) at the LPS
Ranking Event Description PLL Percentage 1 GRS_01_LR_IF_FB Fire ball scenario due to a line rupture
scenario of Above ground existing piping from shore to existing GRS Trains
1.70E-08 17.03%
2 NGRS_01_LR_IF_FB Fire ball scenario due to a line rupture scenario of Above ground 20" piping from shore to Inlet of each New GRS Metering Train A
9.65E-09 9.65%
3 NGRS_27_LR_IF_FB Fire ball scenario due to a line rupture scenario of Pig Receiver of New GRS
7.91E-09 7.91%
4 NGRS_02_LR_IF_FB Fire ball scenario due to a line rupture scenario of Piping from Existing Gas Header to Inlet ESDVs of each New GRS Metering Train B
7.00E-09 7.00%
5 GRS_10_LR_IF_FB Fire ball scenario due to a line rupture scenario of Pig Receiver of the existing GRS
6.70E-09 6.70%
6 NGRS_28_LR_IF_FB Fire ball scenario due to a line rupture scenario of Piping from Existing Gas Header to Inlet ESDV (L10 Stream A)
6.08E-09 6.08%
7 GRS_08_LR_IF_FB Fire ball scenario due to a line rupture scenario of Piping from Heater to Pressure Reduction Station (L9 Stream)
5.47E-09 5.47%
8 NGRS_33_LR_IF_FB Fire ball scenario due to a line rupture scenario of Piping from New Gas Header to Inlet ESDV (L10 Stream B)
5.32E-09 5.32%
9 GRS_07_LR_IF_FB Fire ball scenario due to a line rupture scenario of Piping from Metering Skid to Heater (L9 Stream)
4.84E-09 4.84%
10 GRS_06_LR_IF_FB Fire ball scenario due to a line rupture scenario of Piping from Filter Skid to Metering Skid (L9 Stream)
4.17E-09 4.17%
Other 2.58E-08 25.83% Total 1.00E-07 100.0%

ENVIRONMENTAL RESOURCES MANAGEMENT CLP POWER HONG KONG LIMITED ANNEX 5H_MAJOR RISK CONTRIBUTORS.DOC JUNE 2018
5H-12
Table 5H.14 Main Risk Contributor to PLL for Future Scenario Year (2030) at the LPS
Ranking Event Description PLL Percentage 1 GRS_01_LR_IF_FB Fire ball scenario due to a line rupture
of Above ground existing piping from shore to existing GRS Trains
2.04E-08 17.03%
2 NGRS_01_LR_IF_FB Fire ball scenario due to a line rupture of Above ground 20" piping from shore to Inlet of each New GRS Metering Train A
1.16E-08 9.65%
3 NGRS_27_LR_IF_FB Fire ball scenario due to a line rupture of Pig Receiver of New GRS
9.49E-09 7.91%
4 NGRS_02_LR_IF_FB Fire ball scenario due to a line rupture of Piping from Existing Gas Header to Inlet ESDVs of each New GRS Metering Train B
8.40E-09 7.00%
5 GRS_10_LR_IF_FB Fire ball scenario due to a line rupture of Pig Receiver of the existing GRS
8.04E-09 6.70%
6 NGRS_28_LR_IF_FB Fire ball scenario due to a line rupture of Piping from Existing Gas Header to Inlet ESDV (L10 Stream, Train 1)
7.30E-09 6.08%
7 GRS_08_LR_IF_FB Fire ball scenario due to a line rupture of Piping from Heater to Pressure Reduction Station (L9 Stream)
6.56E-09 5.47%
8 NGRS_33_LR_IF_FB Fire ball scenario due to a line rupture of Piping from New Gas Header to Inlet ESDV (L10 Stream, Train 2)
6.38E-09 5.32%
9 GRS_07_LR_IF_FB Fire ball scenario due to a line rupture of Piping from Metering Skid to Heater (L9 Stream)
5.81E-09 4.84%
10 GRS_06_LR_IF_FB Fire ball scenario due to a line rupture of Piping from Filter Skid to Metering Skid (L9 Stream)
5.00E-09 4.16%
Other 3.10E-08 25.85% Total 1.20E-07 100.0%