5. Foreign exchange rates in Sweden...
53
5. Foreign exchange rates in Sweden 1658–1803 1 Rodney Edvinsson 5.1. Introduction This chapter deals with foreign exchange rates in Sweden in the period 1658–1803. Since Finland was part of Sweden up to 1808/9, Swedish currency was also current there. However, the primary data used in this study are from Stockholm and other towns in present-day Sweden. In the 18th century, the most frequently quoted exchange rates in Sweden were on Amsterdam, Hamburg, London, Paris, Copenhagen, Gdańsk and Swedish Pomerania. Of these seven, the exchange rates on Hamburg and Amsterdam were the most frequent. At that time, all seven currencies were based in one way or another on precious metals, primarily silver, and the par relations between them were, there- fore, largely determined by their intrinsic metal values. A classic distinction is made between exchange of coins and exchange by bills. 2 The bill of exchange is a written order by the drawer to the drawee to pay money to the payee. Before the spread of paper currency, payments in international trade were often made in bills. While foreign exchange was, at least from the 17th century, mainly conducted in bills, exchange between domestic currencies was mostly con- ducted in actual coins. Bills of exchange had different terms to maturity, from a few days (sight bills) up to more than 6 months. Nowadays, the spot exchange rate is usually calculated as the average of the buying and selling rates. For earlier times, the price of sight bills is often the only available source for the calculation of spot exchange rates. The price of 1 Some of the data presented in this chapter have been constructed in cooperation with Johan Söderberg, Martin Sutinen and Göran Hansson. For many insightful comments and sugges- tions, I want also to thank Göran Ahlström, Marc Flandreau, Klas Fregert, Jan T Klovland, Lars O Lagerqvist and Håkan Lobell. 2 McCusker (1978, p. 18).
Transcript of 5. Foreign exchange rates in Sweden...

5.Foreign exchange rates in Sweden 1658–18031
Rodney Edvinsson
5.1. Introduction
This chapter deals with foreign exchange rates in Sweden in the period 1658–1803. Since Finland was part of Sweden up to 1808/9, Swedish currency was also current there. However, the primary data used in this study are from Stockholm and other towns in present-day Sweden.
In the 18th century, the most frequently quoted exchange rates in Sweden were on Amsterdam, Hamburg, London, Paris, Copenhagen, Gdańsk and Swedish Pomerania. Of these seven, the exchange rates on Hamburg and Amsterdam were the most frequent. At that time, all seven currencies were based in one way or another on precious metals, primarily silver, and the par relations between them were, there-fore, largely determined by their intrinsic metal values.
A classic distinction is made between exchange of coins and exchange by bills.2 The bill of exchange is a written order by the drawer to the drawee to pay money to the payee. Before the spread of paper currency, payments in international trade were often made in bills. While foreign exchange was, at least from the 17th century, mainly conducted in bills, exchange between domestic currencies was mostly con-ducted in actual coins.
Bills of exchange had different terms to maturity, from a few days (sight bills) up to more than 6 months. Nowadays, the spot exchange rate is usually calculated as the average of the buying and selling rates. For earlier times, the price of sight bills is often the only available source for the calculation of spot exchange rates. The price of
1 Some of the data presented in this chapter have been constructed in cooperation with Johan Söderberg, Martin Sutinen and Göran Hansson. For many insightful comments and sugges-tions, I want also to thank Göran Ahlström, Marc Flandreau, Klas Fregert, Jan T Klovland, Lars O Lagerqvist and Håkan Lobell.
2 McCusker (1978, p. 18).

5. Foreign exchange rates in Sweden 1658–1803 239
bills with longer terms to maturity should be lower than the price of sight bills, and in theory the difference would be determined by the prevailing interest rate. In real-ity it is not as simple. The price of a sight bill does not necessarily equal the spot exchange rate, since it took time to transport the bill from one city to another and there was a grace period between the day when the bill was presented and the day when it was paid.3 In Hamburg, the grace period could be up to 12 days.4
A bigger problem with historical exchange rates is that the sources do not always provide information on the durations of the bills of exchange.5
Several authors emphasise that bills of exchange were useful instruments for evad-ing usury ceilings and hiding interest rates. By the 18th century, credit instruments had been developed that were based on exchange rate derivatives. A low bill price is tantamount to a high interest rate. Knowing the prices of bills of various terms to maturity enables one to calculate the short-term market interest rate, and knowing the interest rate enables one to calculate a theoretical spot exchange rate. According to Flandreau, Galimard, Jobst, and Marco, the interest rate calculated from bills of exchange on, for example, Amsterdam traded in London provides information on the interest rate in Amsterdam, not London, since it is Amsterdam money that is bought, not London money. Furthermore, they argue that such a shadow interest rate is somewhat higher than the actual rate, since it includes additional transaction costs because the foreign market is located further away than the domestic market.6
Several of the quoted foreign currencies have their origins in the German reichs-taler. According to the Leipzig convention in 1566, the German reichstaler as a coin was to contain 1/9 of a Cologne mark of silver, or 25.98 grams of fine silver. The unit was adopted in other countries and was widely used across Europe, as riksdaler in Sweden, rigsdaler in Denmark and rijksdaalder in Holland. Sometimes the term rix-dollar is used as a common label for the various national coins.7 In 1754 the Reichstaler was replaced by the Conventionsthaler, containing 1/10 of a Cologne mark of silver.
5.2. Current and bank money
Exchange rates on Amsterdam and Hamburg could be quoted in two different cur-rencies, one being actual coins or current money (courant) and the other notional or bank money (banco). Bank money existed in the form of credit on the books of the bank. Bank money supplied by the Bank of Amsterdam, founded in 1609, and Hamburger Bank, founded in 1619, included a premium or agio relative to current
3 See Flandreau, Galimard, Jobst, and Marco (2006, p. 23).4 Hayes (2001 [1740], p. 307).5 Lobell (2000, pp. 231–2).6 Flandreau, Galimard, Jobst, and Marco (2006).7 Hayes (2001 [1740]) and Attman (1983, p. 8).

Exchange rates, prices, and wages, 1277–2008240
money.8 For example, a premium of 4 percent on banco money implied that 100 guilders in banco money was the equivalent of 104 guilders in courant money. The premium was much higher in Hamburg (around 20 per cent in the 18th century)9 than in Amsterdam (around 4–5 per cent),10 although the two banks had much the same regulations.11
The premiums were a consequence of the two banks’ refusal to accept inferior coins at par with their bank monies,12 which were linked to the better coins, accord-ing to the standard of the mint.13 Inferior coins circulated widely (because of wear and tear, clipping and small increases in the mint equivalent) and tended to drive out better coins (unless the latter circulated at a premium). Most rix-dollar coins that circulated in the 17th and 18th centuries had a significantly lower fine silver content than the 25.98 grams established by the Leipzig convention. The Swedish riksdaler coins, weighing 25.3–25.7 grams, had, in fact, a higher fine silver content than in other countries.14 In addition, bank money had other advantages even compared to newly minted coins; since it was secure from fire, robbery and other accidents, it could easily be transferred between cities, etc. As pointed out by Adam Smith in The Wealth of Nations:15
Th e agio of the bank of Hamburg, for example, which is said to be commonly about fourteen per cent, is the supposed diff erence between the good standard money of the state, and the clipt, worn, and diminished currency poured into it from all the neighbouring states. Before 1609 the great quantity of clipt and worn foreign coin, which the extensive trade of Amsterdam brought from all parts of Europe, reduced the value of its cur-rency about nine per cent below that of good money fresh from the mint. Such money no sooner appeared than it was melted down or carried away, as it always is in such circumstances.
At some time in the 18th century (not known when) the Bank of Amsterdam stopped paying specie for banco notes. The currency supplied by the bank became de facto inconvertible. The premium on bank money was kept at a stable level since the bank usually bought bank money when the premium fell below 4.5 per cent and sold
8 McCusker (1978, pp. 42–79). 9 Monthly premiums on Hamburg bank money can be found in McCusker (1978, pp. 65–8) for
the period 1672–1775.10 Monthly premiums on Amsterdam bank money can be found in McCusker (1978, pp. 46–51)
for the period 1638–1775, and in Posthumus (1946, pp. 651–6) for the period 1648–1819.11 Hayes (2001 [1740], p. 301).12 However, in, for example, Amsterdam the premium was not offi cially sanctioned until the 1650s.
See Quinn and Roberds (2006).13 van Dillen (1936, pp. 89–90). 14 Sjöstrand (1908, p.10).15 Smith (1999 [1776], p. 57).
5. Foreign exchange rates in Sweden 1658–1803 241
whenever it rose above 4⅞ per cent16 (in this respect, it was a kind of specie exchange standard). This could not be sustained in some periods. Most notably in 1794–1802 there was a significant discount (negative premium) on banco money (at most 27 per cent in January 1795).17
In Sweden, the exchange rate on Hamburg was mostly quoted on banco money. In contrast, the exchange rate on Amsterdam was mostly quoted on current money.
5.3. Sources and calculations for this study
For the period after 1740, Sveriges Riksbank (1931) presents a continuous annual series of exchange rates on Amsterdam, Hamburg, Paris and London (the annual average of these series is arithmetic). The rates are based on quotations in various newspapers, such as Stockholms stads priscourant. All the data that were collected for Sveriges Riksbank (1931) is stored in the archive of Sweden’s central bank.18 The data have been used in this study, since the material includes weekly data, data for the period 1705–36 and notations on other foreign currencies.
For the period before 1740, several other sources are used in this study.The best data are for 1660–85. Monthly prices exist for bills of exchange of vari-
ous durations (8 days, 14 days, one month, two months, and longer) on Amsterdam and Hamburg, and for 1668–85 on Paris. There are also a few notations on Gdańsk, but none on London.19 After that period, such detailed price differentiation between bills with various terms to maturity is available only from the mid-19th century onwards.
The exchange rates in 1660–85 are calculated from monthly data on bills with various durations and an estimated average interest rate for the period.
When estimating interest rates, comparisons should not be made between bills of short duration, for example one-month bills relative to 14-day bills, since the price of bills was often rounded off, which could systematically distort the computed interest rate. Data on bills of longer duration, 4 to 8 months, exist mainly for the period 1662–9. To estimate an interest rate for this period, the prices of these bills have been compared to the prices of one-month bills. The interest rate r, in per cent, is calculated as:
16 van Dillen (1936, pp. 101–2).17 Posthumus (1946, p. 655).18 Riksbankens arkiv, ‘Växelkurser å Stockholms börs. Primärtabeller (1705–)/1740–1803’.19 Kammarkollegii, oordnade handlingar, no. 444 (Riksarkivet). Posthumus (1946, pp. 592–3)
presents the exchange rate in Amsterdam on Stockholm for 1664, 1665, 1669, 1671 and 1672.

Exchange rates, prices, and wages, 1277–2008242
( )100100
1212
2
1 − × ⎟⎟⎟
⎠
⎞
⎜⎜⎜
⎝
⎛⎟⎟⎠
⎞⎜⎜⎝
⎛=
− billbill TT
bill
bill
P
Pr
where P is the price and T the time duration in months of two bills, bill 1 and bill 2.
The 34 different interest rates that have been calculated range from -6.3 to 35.5 per cent (based on both Hamburg and Amsterdam exchange rates). The median value is 12.5 per cent, which seems to be quite a robust result.20 This is consistent with a monthly interest rate of one per cent (12.7 per cent on an annual basis), which according to Eli Heckscher was very common in the 17th century.21 The extreme values can be explained by market fluctuations during the month and price differ-ences between brokers. While the individual values are unreliable, especially the extreme values (and negative interest rates did, of course, not exist), the median should be quite reliable.
The high interest rate in 17th-century Sweden – despite a more homogeneous capital market in the latter part of the century and a statutory maximum rate of 8 per cent from 1666 and 6 per cent from 1687 – is known from many sources.22 Lower interest rates, 6–8 per cent, were common in this period, but mostly for loans with security and of a somewhat longer duration, involving lower risks.
Following the argument of Flandreau, Galimard, Jobst, and Marco (see above), the shadow interest rate calculated from bills on Amsterdam and Hamburg must be seen as reflecting the interest rate in those cities, not in Stockholm. Although the interest rate was probably lower in Amsterdam and Hamburg than in Stockholm, the shadow interest rate was probably higher than the actual one because of the addi-tional cost of acquiring information about the foreign markets. Christina Dalhede gives two examples of short-term interest rates in Lübeck, one of 10 per cent in 1664
20 Th e interest rate of the fi rst quartile is 9.3 per cent and of the third quartile 13.1 per cent, which was probably roughly the range for the actual short-term interest rate at the time. Th e median for the fi rst 17 values (in 1662–6) is 12.4 per cent and 12.9 percent for the last 17 values (in 1667–9), which is an indication that the market interest rate seems to have been quite stable over time, at least in the 1660s (which was a decade of some fi nancial turmoil in Sweden). Th e median interest rate estimated from Amsterdam bills is 12.7 percent and 12.3 percent estimated from Hamburg bills, which likewise is a negligible diff erence.
21 Heckscher (1936, vol I:2, p. 578).22 Heckscher (1936, vol I:2, pp. 577–81), and Montgomery (1920, p. 140). Heckscher mentions
an interest rate as high as 42 per cent in 1631; according to him, the interest rate fell towards the end of the 17th century. A table of interest rates published in 1690 shows that they varied between 5 and 12 per cent, despite the legislated maximum of 6 per cent. Th e variation can be explained by the variation in the risk premium.

5. Foreign exchange rates in Sweden 1658–1803 243
on a 3-month loan and the other of 12 per cent in 1667 on a 4–12-month loan,23 which conforms to the high interest rates calculated for Hamburg and Amsterdam in the present study.
The computed median interest rate of 12.5 per cent differs significantly from the interest rates in Amsterdam, London and Paris as estimated by Flandreau, Galimard, Jobst, and Marco for the 18th century (after 1720).24 Based on bills of exchange with various terms to maturity, they conclude that the average interest rate was around 3–5 per cent in that century. That would mean that the interest rate was more than halved between the 17th and 18th centuries. Further investigation is necessary before such a conclusion can be drawn. In Chapter 6, Håkan Lobell assumes that the shadow interest rate was 5 per cent in the first half of the 19th century; that is also the assumption in this chapter for the 18th century. For 1704–1804, it is also assumed that the term to maturity was 67 days for bills on Amsterdam and Hamburg and 90 days for bills on London and Paris, which corresponds to Lobell’s assump-tions for the early 19th century. The few notations on terms to maturity in the late 18th century are consistent with these conjectures.
Tables A5.1, A5.5 and A5.12 present monthly exchange rates on Hamburg, Amsterdam and Paris, respectively, for the period 1660–85 (for Paris 1668–85), based on bills with between 8 days and two months to maturity and an assumed interest rate of 12.5 per cent (which disregards the possibility that this rate may have
23 Dalhede (2006, p. 117).24 Flandreau, Galimard, Jobst, and Marco (2006, p. 24).
View of Stockholm, 1801, by Elias Martin (1739–1818).Source: Nationalmuseum.
Exchange rates, prices, and wages, 1277–2008244
fluctuated over time).25 Neither has allowance been made for the grace period between the day when the bill was presented and the day when it was paid (this could be viewed as a pure transaction cost). The data have been collected and the calculations have been made in collaboration with Göran Hansson for Amsterdam and with Martin Sutinen for Hamburg and Paris.
There are various sources for annual exchange rates in the period 1696–1739.26 For this period, annual averages have been estimated mainly by taking the geometric average of the highest and lowest quotations.
For the years when direct data are missing, cross rates have been calculated for the exchange rates on Amsterdam, Paris and London, based on the exchange rate in Stockholm on Hamburg, in Amsterdam on Hamburg,27 and in London on Ham-burg, Paris and Amsterdam.28 The cross rates are adjusted to take into account the difference between cross rates and actual rates in the adjacent periods where data on actual rates do exist.
When the sources do not provide information about the bills’ terms to maturity, the spot rates are calculated from the direct data on exchange rates by increasing the latter by 1.5 per cent in 1658–85, which is consistent with, for example, 1.5 month bills and a 12 per cent interest rate. For 1686–1703, the bills on Amsterdam and Hamburg are increased by one per cent and bills on London by 1.0590/365. For the period 1704–1804, the bills on Amsterdam and Hamburg are increased by 1.0567/365 and the bills on London and Paris by 1.0590/365, consistent with the assumption of a 5 per cent interest rate. See furthermore Tables A5.21 to A5.24 for annual series. The monthly data presented for the period 1705–1803 are raw data (mostly based on two- and three-month bills), not spot rates.
5.4. Notations on foreign currencies in Swedish currency
The presented foreign exchange rates are in Swedish currency, which changed during the studied period (see Chapter 4). As a consequence of inflation, the value of Swed-ish currency fell relative to the quoted foreign currencies during the course of the 18th century.
Up to 1776, foreign currencies were usually quoted in mark kopparmynt (one daler kopparmynt = 4 marks kopparmynt).
In 1716–9 so-called coin tokens circulated that fell in value relative to proper
25 Flandreau, Galimard, Jobst, and Marco (2006, p. 23).26 Sandbergska samlingen (Riksarkivet), O:1, folio 364, presents exchange rates on Hamburg from
1703 onwards, Riksarkivets ämnessamlingar (Riksarkivet), Handel och sjöfart, Ser. I, vol. 1 Järnhandel, exchange rates on Hamburg and Amsterdam from 1703 onwards (also on London in 1704), and Börstorpssamlingen (Riksarkivet), vol. 85, exchange rates on Hamburg in 1696–1704.
27 Found in Posthumus (1946).28 Found in McCusker (1978).

5. Foreign exchange rates in Sweden 1658–1803 245
money (mainly copper plates). The only exchange rates reported for this period were on Amsterdam and Hamburg, and these were most probably noted in proper money, not in coin tokens. As explained in Chapter 4, the use of coin tokens was not easy to enforce on the foreign exchange, although there are some uncertainties on this matter. Tables A5.21 to A5.22 present the estimated exchange rates in coin tokens as well, by using the premium on proper money to compute those rates (see Chapter 4).
In 1777–88 foreign currencies were usually quoted in skilling (one riksdaler was equal to 48 skilling). Since one Swedish riksdaler was exchanged for 72 marks kop-parmynt in 1777, this implies that one skilling was exchanged for 1.5 marks kop-parmynt in that year. In 1789–1803, Sweden had two currencies: riksdaler banco (= 48 skilling banco), still convertible into riksdaler specie coins, and riksdaler riksgälds (= 48 skilling riksgälds), which fell in value relative to the specie coins. For the period 1789–96 the foreign exchange rates were most likely expressed in banco notes, although there are some uncertainties about this. As discussed in Chapter 4, the pre-mium (agio) on banco notes cannot be used to transform exchange rates from banco to riksgälds, since the premium on banco notes was affected by market situations. From May 1797 to 1803 the foreign exchange rates are expressed both in riksdaler riksgälds and in riksdaler banco. The premium that can be estimated from these data differs somewhat from the noted agio (premium) in the domestic market.
Figure 5.1 compares an index of the quotations on Hamburg, Amsterdam and London with the Swedish inflation index (see Chapter 8) in 1658–1838. All three foreign currencies had a relatively stable precious metal content during the studied period (at least in the long run). The currency index clearly shows how Swedish cur-rency deteriorated relative to these three stable currencies, which was due to debase-ments and the circulation of fiat money. Up to the 1770s the currency and the infla-tion indices follow each other in the long run, but after the 1770s the price level rose more than the quotation on the three foreign currencies. Hence, part of the increase in prices in the late 18th century must be explained by other factors than a deterio-rating currency. Between 1658 and 1838 the currency index increased 35-fold, while the price level rose 53-fold. The sharpest devaluations of Swedish currency occurred in 1716–19, 1756–62, 1769–73, 1788–99 and 1808–20, which coincided with the circulation of fiat monies (see Chapter 2).
5.5. Quotations on Hamburg
During the studied period the Hamburg reichstaler banco was the most important foreign currency quoted in Sweden. Before 1777, quotations on the Hamburg reichs-taler banco were even more important than quotations on the domestic riksdaler.
Hamburg was the centre of exchange for the Baltic area. The bank money of Hamburg was viewed as one of the securest in Europe, and all foreign exchange was negotiated through the bank. Hamburg shared its current money with the city of Lübeck. As the circulated coins deteriorated, the premium on bank money increased from 3 per cent in 1672 to over 20 per cent in the 1770s (see Table A5.21).

Exchange rates, prices, and wages, 1277–2008246
Figure 5.1. Index of quotations on Hamburg, Amsterdam and London in Swedish currency and the Swedish infl ation index 1658–1838 (1658 = 100).
Sources: Tables A5.21 to A5.24, Sveriges Riksbank (1931) and Chapter 8.Note: Th e two indices follow mark kopparmynt in 1658–1776, riksdaler specie in 1777–88 and riksdaler riksgälds in 1789–1838. In the period 1716–19 they follow the coin tokens and assume that these tokens were devalued by 50 per cent in 1719.
The Hamburger reichstaler banco was equal to 3 marks banco.29 Eli Heckscher writes that the ‘Hamburg Rixdollar Banco was an ideal money, equivalent to one-ninth of the mark of Cologne, in fine silver, which ought to give it a weight in fine silver of 25.984 gr., though in Sweden it was generally considered as corresponding only to 25.276 gr.’30 In comparison, in the 18th century the minted Swedish riks-daler (specie) had a fine silver content of 25.6973 grams.
From 1790 the issue rate of one reichstaler banco was 9.25 per mark of fine silver and of the mark banco 27.75 per mark of fine silver. Since the mark of fine silver in Hamburg was equal to 233.855 grams (the Cologne mark), from then on one reichs-taler banco was the equivalent of 25.2816 grams.31
In Sweden, almost all exchange rates are quoted in bank money, but a few nota-tions on the current money of Lübeck are extant. Tables A5.1 to A5.4 present
29 Attman (1983, p. 8).30 Heckscher (1934, p. 194).31 Shaw (1895, p. 387).
100
1,000
10,000
1660 1680 1700 1720 1740 1760 1780 1800 1820 1840
Inflation index, Sweden Index, quotations on Hamburg, Amsterdamand London in Swedish currency

5. Foreign exchange rates in Sweden 1658–1803 247
monthly exchange rates on Hamburg; Tables A5.21 and A5.23 give the annual rates. Although the exchange rate on current money of Hamburg can be estimated by deducting the premium on Hamburger reichstaler banco, which is presented for the period 1672–1775 in Table A5.21, the few notations in Stockholm on the current money show that the premium on bank money estimated from the Stockholm data deviated somewhat from the noted premium in Hamburg.
An example of exchange rate notations in Stockholm in early 1668 (the year in which the Riksbank was founded). Prices for bills diff ered with their terms to maturity (8 days, 14 days, 1 month, 2 months, 4 months and 6 months). Bills of longer duration were cheaper, refl ecting a shadow interest rate. For example, in January a 2-month bill on Hamburg (reichstaler banco) was sold for 20¾ marks kopparmynt, while an 8-day bill was sold for 21¼ marks kopparmynt.Th ere were also diff erences between brokers. In March, a 2-month bill on Amsterdam was sold for somewhat less than a 4-month bill by another broker.Source: Kammarkollegii, oordnade handlingar, nr 444 (Riksarkivet).

Exchange rates, prices, and wages, 1277–2008248
Figure 5.2. Swedish riksdaler per Hamburger Reichstaler banco 1658–1808.
Sources: Tables A5.21 and A5.23, Sveriges Riksbank (1931) and Chapter 4.
Figure 5.2 presents the Hamburger Reichstaler banco in Swedish riksdaler (spe-cie/banco) in 1658–1808. The silver content of both currencies was stable through-out the period. The par level was slightly below 1 (0.984 in the late 18th century, but closer to 1 in the late 17th century). This level applied during most of the period but at times there were significant deviations, most notably in 1769 and after 1789, caused by monetary instability. In 1769, the high valuation of the Swedish riksdaler was an effect of deflationary policies (see Chapter 4), while after 1789 the riksdaler banco was valued less than Hamburger reichstaler banco because of the circulation of riksgälds notes and expectations that banco notes could become inconvertible as well, which in fact happened in 1808–9. The deviation in 1769 most likely went beyond the specie points (see Chapter 6).
5.6. Quotations on Amsterdam
Up to 1681, the guilder/florin32 was a unit of account rather than a minted coin. It was equal to 20 stuivers. The rijksdaalder coin that was minted in the late 16th cen-tury and the first half of the 17th century had a fine silver content of 25.7 grams; it was set equal to 42 stuivers in 1583, 46 stuivers in 1596, 47 stuivers in 1603, 48
32 Th e guilder as a money of account equal to 20 stuivers should not be confused with the silver carolus guilder, which was an actual coin minted in the 16th and early 17th centuries.
0.6
0.65
0.7
0.75
0.8
0.85
0.9
0.95
1
1.05
1.1
1.15
1660 1680 1700 1720 1740 1760 1780 1800

5. Foreign exchange rates in Sweden 1658–1803 249
stuivers in 1610–9 and 50 stuivers (i.e. 2.5 guilders) from 1619 onwards. According to the Dutch price historian Posthumus, the fine silver content of one guilder was 11.17 grams in 1597–1603, 10.94 grams in 1604–6, 10.89 grams in 1607–10, 10.71 grams in 1611–9 (since the rijksdaalder was equal to 48 stuivers), 10.28 grams in 1620–59 (since the rijksdaalder was equal to 50 stuivers) and 9.74 grams in 1660–81 (since the silver ducat contained 24.37 grams fine silver and was set equal to the rijksdaalder).33
On 25th December 1681 the states of Holland and West Friesland prescribed the minting of the first gulden (guilder) piece, which hitherto had existed only as money of account. The guilder was fixed at 9.613 grams of fine silver, which did not change until 1845. Thus the fine silver content of one rijksdaalder courant became 24.03 grams, i.e. 6.5 per cent below the fine silver content of the rijksdaalder coins minted in the first half of the 17th century. From 1845 the guilder contained 9.45 grams of fine silver.34
33 Posthumus (1946, pp. cviii–cix).34 Shaw (1895, pp. 350–5), and Posthumus (1936, p. lv).
Dam Square, Amsterdam, by Gerrit Berckheyde (1638–98), a Dutch specialist in town-scapes. Notations on Amsterdam were very frequent at the Stockholm exchange in the second half of the 17th century.Source: http://en.wikipedia.org/wiki/File:AmsterdamDamsquar.jpg

Exchange rates, prices, and wages, 1277–2008250
Figure 5.3. Amsterdam rijksdaalder courant in Hamburger reichstaler banco 1660–1810 based on Swedish foreign exchange.
Sources: Tables A5.21 and A5.23, Sveriges Riksbank (1931) and Chapter 4.
Tables A5.5 to A5.8 present monthly exchange rates on Amsterdam; Tables A5.21 and A5.23 give the annual rates. To express the exchange rate on Amsterdam in banco money, the exchange rate on rijksdaalder courant can be augmented with the premium on bank money, for which annual data are presented for 1660–1776.35
Figure 5.3 presents the cross rate of Amsterdam rijksdaalder in Hamburg reichs-taler banco in 1660–1810 based on the data from the foreign exchange in Sweden. The par level based on the fine silver contents of the two currencies in the late 19th century was 0.96, which was also the average and the median value in Sweden in 1660–1810. The coefficient of variation was only 2.7 percent, an indication of quite efficient markets and that the two currencies moved within the specie points.
5.7. Quotations on London
One pound sterling was equal to 20 shillings or 240 pence.36 Since the fine silver content of one penny was 0.479 grams in 1560–1600 and 0.464 grams in 1601–1815, the fine silver content of one pound sterling (if counted in pennies) was 115.1
35 See footnote 10.36 McCusker (1978, p. 35).
0.88
0.9
0.92
0.94
0.96
0.98
1
1.02
1.04
1.06
1660 1680 1700 1720 1740 1760 1780 1800
5. Foreign exchange rates in Sweden 1658–1803 251
grams in 1560–1600 and 111.4 grams in 1601–1815.37 However, in the period 1717–1815 the silver content of the pound was de facto somewhat lower. England had a bimetallic standard in 1717–1815, based on a value ratio of gold to silver of 15.072 to 1. This tended to overvalue gold and cause an outflow of silver and an inflow of gold. Britain introduced a mono-metallic gold standard de jure in 1816. The fine gold content of the sovereign with the nominal value of one pound was then fixed at 7.3224 grams.
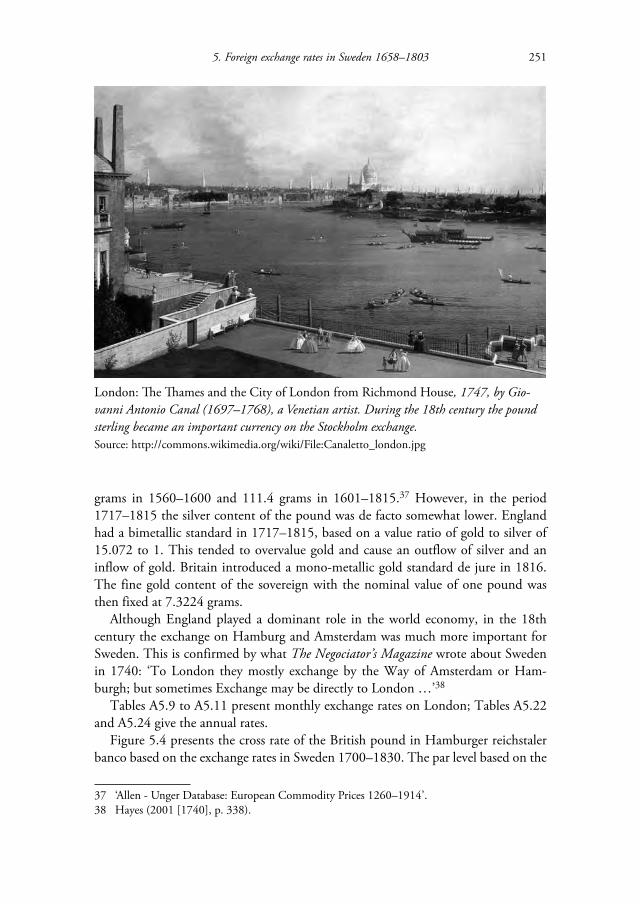
Although England played a dominant role in the world economy, in the 18th century the exchange on Hamburg and Amsterdam was much more important for Sweden. This is confirmed by what The Negociator’s Magazine wrote about Sweden in 1740: ‘To London they mostly exchange by the Way of Amsterdam or Ham-burgh; but sometimes Exchange may be directly to London …’38
Tables A5.9 to A5.11 present monthly exchange rates on London; Tables A5.22 and A5.24 give the annual rates.
Figure 5.4 presents the cross rate of the British pound in Hamburger reichstaler banco based on the exchange rates in Sweden 1700–1830. The par level based on the
37 ‘Allen - Unger Database: European Commodity Prices 1260–1914’.38 Hayes (2001 [1740], p. 338).
London: Th e Th ames and the City of London from Richmond House, 1747, by Gio-vanni Antonio Canal (1697–1768), a Venetian artist. During the 18th century the pound sterling became an important currency on the Stockholm exchange.Source: http://commons.wikimedia.org/wiki/File:Canaletto_london.jpg

Exchange rates, prices, and wages, 1277–2008252
Figure 5.4. Th e pound sterling in Hamburger reichstaler banco based on exchange rates in Sweden 1704–1830.
Sources: Tables A5.21 to A5.24, Sveriges Riksbank (1931) and Chapter 4.
silver contents of the two currencies was around 4.4 reichstaler per pound. During the 18th century the market rate was normally below this level because of the over-valuation of gold under the bimetallic standard, making British silver coins underval-ued. Very few silver coins were in fact minted after 1717, and Britain was, therefore, de facto on a gold standard in the 18th century.
During the French Revolutionary and Napoleonic wars, sterling reached its low-est level, due to excessive note issues and the suspension of conversion on demand in 1797.39 In the early 1810s sterling was one fourth below its par level against the reichstaler banco (see also Chapter 6). The situation led to the Bullionist Contro-versy, where the Bullionists, among them David Ricardo, argued that convertibility must be restored, while the Anti-Bullionists claimed that banks would not issue more notes than commerce demanded. Convertibility into gold was not restored until 1821.
39 Mayhew (1999, p. 132–52).
3.2
3.4
3.6
3.8
4
4.2
4.4
4.6
4.8
1700 1720 1740 1760 1780 1800 1820

5. Foreign exchange rates in Sweden 1658–1803 253
5.8. Quotations on Paris
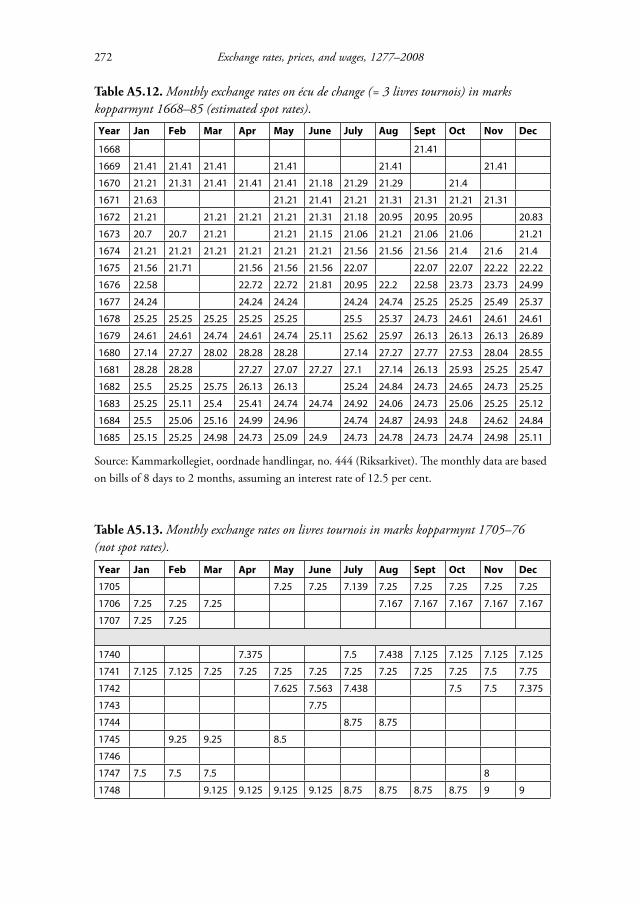
In the sources used in this study, the exchange rate on Paris is quoted in livres tournois in 1740–1794, but in écu de change in 1668–1707. The écu de change was the French equivalent of the reichstaler. One écu de change was equal to three livres tournois, and one livres tournois to 20 sou tournois. This accounting relation was stable in the 17th and 18th centuries up to the French revolution, despite the monetary chaos in the 17th and early 18th centuries.40 Livres tournois ceased to be minted in 1641 but continued to exist as a unit of account.41 In the 18th century some quotations were also made on Bordeaux and Marseille. Tables A5.12 to A5.15 present monthly exchange rates on Paris; Tables A5.22 and A5.24 give annual rates.
40 McCusker (1978, pp. 87–8).41 Lagerqvist and Nathorst-Böös (1968, p. 78).
Th e Storming of the Bastille in Paris, July 1789. Despite the dramatic events, the value of the livres tournois was quite stable relative to other currencies. Th e French currency did not start to deteriorate until 1791.Source: http://upload.wikimedia.org/wikipedia/commons/5/57/Anonymous_-_Prise_de_la_Bastille.jpg

Exchange rates, prices, and wages, 1277–2008254
Figure 5.5. Th e livres tournois (franc) in marks kopparmynt (= 1/72 riksdaler specie 1777–88 and 1/72 riksdaler riksgälds 1789–1810) and Hamburger reichstaler banco based on foreign exchange in Sweden 1668–1810 (estimated spot rates).
Sources: Tables A5.21 to A5.24, and Sveriges Riksbank (1931).
0
5
10
15
20
25
30
35
40
1660 1680 1700 1720 1740 1760 1780 1800
0
0.1
0.2
0.3
0.4
0.5
livres tournois in marks kopparmynt (left-hand scale)
livres tournois in Hamburger reichstaler banco (right-hand scale)
The French currency was unstable in 1681–1725 but for this period only a few notations exist from Sweden. The fine silver content of one livres tournois was 11.61 grams in 1603–35, 9.06–10.31 grams in 1636–41, 7.71–8.75 grams in 1642–99, 5.85–8.3 grams in 1700–17, 3.06–5.64 grams in 1718–26, and 4.7 grams in 1727–89.42 As can be seen from Table A5.22, French currency reached its lowest level in 1720, following the collapse of the shares in the Mississippi Company and John Law’s failed experimentation with bank notes.
In the aftermath of the French revolution the monetary system initially fell into disarray. As shown in Table A5.14, the exchange rate on Paris (in skilling banco) decreased by a third between 1789/90 and 1792/3. The franc was introduced in 1795, based on a decimal system (equal to 100 centimes), and was set equal to the old livres tournois. Its fine silver content was 4.5 grams,43 implying a par level of 8.4 skilling banco for one livre tournois.
In 1803 a bimetallic standard was introduced, based on a gold-silver (value) ratio of 15.5 to 1.44 The fine gold content of one franc was 0.29 grams.
42 ‘Allen - Unger Database: European Commodity Prices 1260–1914’43 Lagerqvist and Nathorst-Böös (1968, p. 78).44 Redish (1994, p. 70).
5. Foreign exchange rates in Sweden 1658–1803 255
Figure 5.5 presents the market value of the livres tournois (franc from 1795) in Swedish and Hamburg currencies in 1668–1808. It shows that while the value relation between French and Swedish currency in the 1750s was about the same as in the 1660s, in this period French currency fell relative to the stable Hamburger reichs taler banco. After the 1750s Swedish currency fell relative to French currency, while, with the exception of a dip after the French Revolution, French currency was stable against the Hamburger reichstaler banco. In the period 1740–88, the median value of one livres tournois was 0.19 Hamburger reichstaler banco, which was also the theoretical exchange rate between the two currencies based on their fine silver contents.
5.9. Quotations on Copenhagen
Before the union with Sweden in 1814, Norway was part of the Danish kingdom, with a common currency unit. Since the late medieval period (see Chapter 3), the Danish mark was set equal to roughly half the value of the Lübeck mark, although this could not be maintained in some periods. Like the Lübeck mark, the Danish mark was divided into 16 skillings. The Danish rigsdaler or speciedaler was linked to the German reichstaler, later at par with the Hamburg reichstaler banco. In the 18th century it contained 25.28 grams of fine silver, only slightly less than the Swedish riksdaler. Since the Hamburg reichstaler was divided into 3 German marks, this implies that the par level of the Danish rigsdaler was 6 marks. In 1625 the following relation was fixed: 1 rigsdaler or speciedaler = 6 marks = 96 skillings. In the late 17th century the crown was also minted, set equal to 64 skillings or 4 marks.45
The Danish rigsdaler as a unit of account, equal to 96 skillings in coins or notes, must be distinguished from the actual rigsdaler in specie coins. Given that low-stan-dard coins were minted, a premium arose on speciedaler in courant money (‘kurant-mønt’). The fine silver content of the crown was also debased. Therefore there was also a premium on the speciedaler in crown coins, although not as high as the pre-mium on speciedaler in courant money.
In his study of prices in Jämtland, which Sweden conquered from Denmark-Norway in 1645, Göran Hansson finds that prices were quoted in Swedish daler kopparmynt as well as in Norwegian rigsdaler in the period 1666–88, making it pos-sible to estimate the exchange rates between these two currencies.46 Throughout this period one Norwegian rigsdaler stood at around 4.5 Swedish daler kopparmynt, which was significantly below the market rate of the Swedish riksdaler specie and the Hamburg reichstaler banco. The quoted Norwegian rigsdaler is, therefore, mostly likely not the specie riksdaler. While in 1666–76 one Norwegian rigsdaler was val-ued at 0.8–0.9 Hamburg reichstaler banco, in 1677–88 it was valued at only around 0.7 Hamburg reichstaler banco. In comparison, the data of Friis and Glamann show
45 Friis and Glamann (1958, pp. 3–4 and 15).46 Hansson (2009).

Exchange rates, prices, and wages, 1277–2008256
Figure 5.6. Th e Danish rigsdaler kurant in marks kopparmynt (= 1/72 riksdaler specie 1777–88 and 1/72 riksdaler riksgälds 1789–1808) and Hamburger reichstaler banco based on foreign exchange in Sweden 1741–1815 (estimated spot rates).
Sources: Tables A5.16 to A5.18, Table A5.21 and A5.23, untitled volume with exchange rates 1804–89 (Riksbankens arkiv), Sveriges Riksbank (1931), and Chapter 6.
that the Danish rigsdaler in courant coins stood at around 0.9 Hamburg reichstaler banco in the 1690s.47 One possible explanation for the low exchange rate of the Norwegian rigsdaler in Jämtland is that inferior coins circulated in Jämtland during the 1680s. Friis and Glamann also show that the fine silver content of the minted coins varied significantly in the late 17th century. For example, in 1660–70, the most common coins that were minted contained only 65 per cent per unit of the nominal value of the fine silver of the speciedaler.48
In 1713–28, paper money circulated in Denmark but was not equivalent to coins in value. In 1737 the Kurantbanken was established as a privately-owned bank; it was nationalised in 1773. Although its notes were supposed to be convertible, con-vertibility was suspended in 1745–7 and from 1759. There were periods of varying length when the value of the Kurantbanken notes fell below the value of current money in coins. In 1791, the Dansk-Norske Speciesbank was established and issued notes that initially were convertible into speciedaler.49
Figure 5.6 presents the exchange rate on the Danish rigsdaler kurant 1741–1815 in Swedish and Hamburg currencies (based on Tables A5.16 to A5.18 up to 1803).
47 Friis and Glamann (1958, pp. 33–4).48 Friis and Glamann (1958, p. 6).49 Friis and Glamann (1958, pp. 5–16).
38 38
32,75
34
56 54 54
0
20
40
60
80
100
120
140
1740 1750 1760 1770 1780 1790 1800 1810
0
0.2
0.4
0.6
0.8
1
1.2
1.4
Danish rigsdaler kurant in marks kopparmynt (left-hand scale)
Danish rigsdaler kurant in Hamburger reichstaler banco (right-hand scale)
5. Foreign exchange rates in Sweden 1658–1803 257
The quotations on Copenhagen follow the Kurantbanken notes, not the courant coins, as is shown, for example, by the deterioration of the Danish currency in 1788–9.
Figure 5.6 shows that during most of the second half of the 19th century the Danish rigsdaler stood at around 0.8 Hamburger reichstaler banco, while appreciat-ing against the Swedish currency. Hence, the Danish currency was much more stable than the Swedish in the 18th century, despite the periods of inconvertibility. The worst Danish inflation occurred instead in the early 19th century, at the time of the Napoleonic wars, as is further discussed by Håkan Lobell in Chapter 6. After 1807, the Danish currency fell like a stone against the Swedish currency, even though the latter fell substantially against the Hamburger reichstaler banco. In 1813 one Danish rigsbankdaler was exchanged for 6 rigsdaler kurant.
5.10. Quotations on Gdańsk
Quotations on Gdańsk were quite common in the 18th century. Gdańsk was one of the largest cities on the Baltic seaboard and handled most of Poland’s maritime trade via the river Vistula.
In Poland in the late 17th century both good and bad coins circulated, forming parallel currencies. While the ducat was worth around 7.5 Polish florins (Gulden or złoty) in better coins, it was worth up to 18 Polish florins in inferior coins.50 The city of Gdańsk used the better coins, which was especially important in foreign trade, and that is the currency that was quoted in Stockholm. The florin was divided into 30 grosz[y] in better coins.
The best material exists for the period 1740–76 and is presented in Table A5.19. Figure 5.7 presents the Gdańsk florin in Swedish marks kopparmynt and Hamburger reichstaler banco for the same period. It shows that the value of both Gdańsk and Swedish currencies fell relative to the stable silver currency of Hamburg during the investigated period. Between 1750 and 1765 the fine silver content of the Gdańsk florin decreased, from around six to four grams, due to the debasement of coins.51 Since the Swedish currency deteriorated even more, the value of the Polish florin in marks kopparmynt increased somewhat between 1740 and 1776. Although the value of the Gdańsk florin doubled in Swedish currency between 1755 and 1762 in con-nection with the high inflation in Sweden, later the Gdańsk florin fell back to lower levels.
There are also some quotations from the periods 1675–81 and 1777–81, although not on the florin, but on a taler unit. After 1781 quotations on Gdańsk no longer appear in the Swedish sources, reflecting the decline of Gdańsk as an important sea-port.
50 Furtak (1935, p. 45).51 Furtak (1935, pp. 47 and 77).

Exchange rates, prices, and wages, 1277–2008258
Figure 5.7. Gdańsk fl orin in Swedish marks kopparmynt and Hamburger reichstaler banco 1740–76 (estimated spot rates).
Sources: Table 5.19 and Table 5.21.
5.11. Quotations on Swedish Pomerania
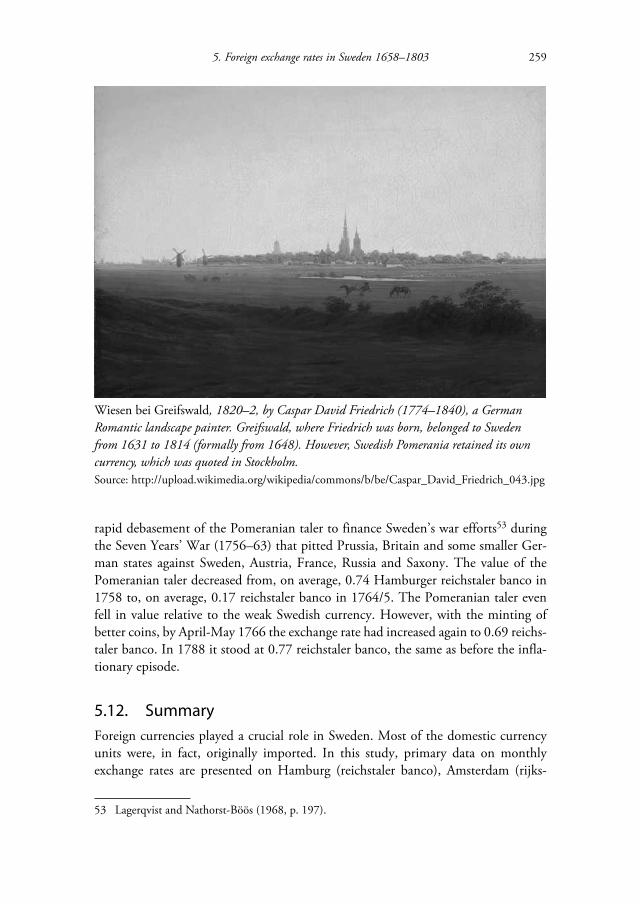
Western Pomerania and a strip of Eastern Pomerania, including the cities of Stral-sund och Greifswald and the island of Rügen, belonged to Sweden in the period 1637–1814 (formally from 1648). After the Napoleonic wars, Swedish Pomerania was ceded to Denmark in exchange for Norway in 1814 and was transferred to Prus-sia in 1815. Swedish Pomerania minted its own coins and had its own currency sys-tem, from 1690 adopting the Leipzig Money Convention (although some deviations occurred from this Convention). The taler was the main unit of account, and was of a lower fine silver content than the original reichstaler. Swedish notes were not accepted in Swedish Pomerania.52
Since Swedish Pomerania had its own currency system, the Pomeranian taler was often quoted at the foreign exchange in Sweden. Table A5.20 presents monthly exchange rates for the period 1740–1800, and Figure 5.8 the Pomeranian taler in Swedish marks kopparmynt and Hamburger reichstaler banco for the same period.
Most notable in Figure 5.8 is the falling exchange rate on the Swedish-Pomera-nian taler in the early 1760s, and the subsequent appreciation. This was caused by
52 Lagerqvist and Nathorst-Böös (1968, pp. 194–200).
0
5
10
15
20
25
30
1740 1744 1748 1752 1756 1760 1764 1768 1772 1776
0
0.05
0.1
0.15
0.2
0.25
0.3
Gdańsk florin in marks kopparmynt (left-hand scale)
Gdańsk florin in Hamburger reichstaler banco (right-hand scale)
5. Foreign exchange rates in Sweden 1658–1803 259
rapid debasement of the Pomeranian taler to finance Sweden’s war efforts53 during the Seven Years’ War (1756–63) that pitted Prussia, Britain and some smaller Ger-man states against Sweden, Austria, France, Russia and Saxony. The value of the Pomeranian taler decreased from, on average, 0.74 Hamburger reichstaler banco in 1758 to, on average, 0.17 reichstaler banco in 1764/5. The Pomeranian taler even fell in value relative to the weak Swedish currency. However, with the minting of better coins, by April-May 1766 the exchange rate had increased again to 0.69 reichs-taler banco. In 1788 it stood at 0.77 reichstaler banco, the same as before the infla-tionary episode.
5.12. Summary
Foreign currencies played a crucial role in Sweden. Most of the domestic currency units were, in fact, originally imported. In this study, primary data on monthly exchange rates are presented on Hamburg (reichstaler banco), Amsterdam (rijks-
53 Lagerqvist and Nathorst-Böös (1968, p. 197).
Wiesen bei Greifswald, 1820–2, by Caspar David Friedrich (1774–1840), a German Romantic landscape painter. Greifswald, where Friedrich was born, belonged to Sweden from 1631 to 1814 (formally from 1648). However, Swedish Pomerania retained its own currency, which was quoted in Stockholm.Source: http://upload.wikimedia.org/wikipedia/commons/b/be/Caspar_David_Friedrich_043.jpg

Exchange rates, prices, and wages, 1277–2008260
daalder courant), London (pound), Paris (livres tournois/franc), Gdańsk (florin/gul-den/złoty = 30 groszy), Copenhagen (rigsdaler kurant = 96 skillings) and Swedish Pomerania (taler) in 1660–1803. All of these foreign currencies were courant money, i.e. linked to actual coins, except for the Hamburg reichstaler banco, which was bank money. Bank money existed also in Amsterdam, but the quotations in Sweden were on its courant money. Since direct data are missing for some years, cross rates are used to fill in some gaps for the annual series.
The primary data are bills of various durations, in the 18th century mostly 67- and 90-day bills. To estimate spot rates, an assumption must be made of a shadow interest rate on these bills, which is problematic since no such rate is known for the 18th century. Only the monthly data 1660–85 are of sufficiently good quality for estimating reliable spot rates for this period. In the period 1662–9 the estimated median shadow interest rate on bills of exchange was as high as 12.5 per cent. This result deviates significantly from the shadow interest rates of 3–5 per cent in the 18th century recently estimated by Flandreau, Galimard, Jobst, and Marco. It is, there-fore, likely that interest rates decreased substantially between the 17th and 18th cen-turies.
Figure 5.8. Swedish Pomeranian taler in Swedish marks kopparmynt (= 1/72 riksdaler specie 1777–88 and 1/72 riksdaler riksgälds 1789–1800) and Hamburger reichstaler banco 1740–1800 (estimated spot rates).
Sources: Tables A5.20, A5.21 and A5.23.
0
10
20
30
40
50
60
70
80
90
0
0.1
0.2
0.3
0.4
0.5
0.6
0.7
0.8
0.9
1740 1750 1760 1770 1780 1790 1800
Pomeranian taler in markskopparmynt (left-hand scale)
Pomeranian taler in Hamburgerreichstaler banco (right-handscale)
5. Foreign exchange rates in Sweden 1658–1803 261
The quoted currencies were all based on precious metals, as was the Swedish riks-daler (specie), which implies that the par values between those currencies were deter-mined by their fine metal contents. The actual market rate deviated from these par relations, and on some occasions, at times of monetary instability, the deviation could be quite large.
Compared with its neighbours, Sweden had a weak currency in the 18th century. The quoted currencies on Hamburg, Amsterdam and London were relatively stable in the long term, and the Swedish currency fell substantially relative to these three currencies. Sweden experienced substantial inflation during the 18th century. The Hamburg and Amsterdam rix-dollars contained (more or less) fixed amounts of fine silver, and functioned as important reference points for the monetary system of Swe-den. The Hamburg reichstaler banco was even used as a proxy for the value of the riksdaler specie coin. The French livres tournois (franc from 1795), the Danish rigs-daler kurant and the Polish florin were also more stable than the Swedish currency in the 18th century, although the Danish rigsdaler kurant was significantly devalued after 1807. The Swedish-Pomeranian taler fell substantially against the Swedish cur-rency in 1758–65 but was also quite stable in other periods.

Exchange rates, prices, and wages, 1277–2008262
Appendix A5: Summary tables
Table A5.1. Monthly exchange rates on Hamburger reichstaler banco in marks kopparmynt 1660–85 (estimated spot rates).
Year Jan Feb Mar Apr May June July Aug Sept Oct Nov Dec
1660 17.63 17.63 17.72 17.5 17.63 17.18 17.12 17.7 17.5 17.67 17.89 17.71
1661 18.33 18.38 18.38 18.39 18.39 18.39 18.39 18.39 18.19 17.89 17.84 18.14
1662 18.34 18.38 18.49 18.49 18.03 17.92 18.05 18 18.14 18.3 18.18 18.25
1663 18.44 18.57 18.39 18.34 18.43 18.34 18.72 18.95 18.95 19.55 19.56 20.14
1664 21.45 21.4 20.04 20.05 19.67 19.24 19.55 19.86 19.91 19.06 20.45 20.93
1665 20.91 21.15 21.28 20.59 20.2 20.42 20.57 21 21 21.13 21.07 21.09
1666 21.18 20.95 21 20.91 20.93 20.98 20.88 21.05 21 20.93 20.7 20.4
1667 20.71 20.77 20.96 21.01 20.87 20.93 20.96 21.01 20.96 20.94 20.96 19.19
1668 21.21 20.9 21 21.13 21.13 21.25 21 20.82 20.77 20.75 20.8 20.82
1669 20.45 20.55 20.65 20.77 20.43 20.43 20.41 20.62 20.83 20.52 20.68 21
1670 20.82 20.84 21.04 21.07 20.87 20.22 20.24 20.5 20.8 21.07 21.09 21.13
1671 21 21 21.05 21.02 20.84 20.82 21.05 21.05 21 21.05 21.13 21
1672 20.91 20.88 21 20.89 21 20.75 20.94 20.97 20.89 20.97 20.97 20.97
1673 20.99 21.12 21.15 21.15 21 20.75 20.6 20.78 20.97 21.1 21.07 21.13
1674 21.38 21.51 21.26 21.26 21.26 21 21 21.07 21.57 22.14 22.26 22.39
1675 22.39 22.14 22.29 22.1 22.04 22.04 22.47 23.48 24.02 23.73 23.14 22.77
1676 22.66 22.51 22.56 22.66 22.73 22.39 22.76 23.14 23.35 23.52 24.02 24.18
1677 23.79 23.92 24.17 24.3 24.3 24.36 24.4 25.09 25.22 25.41 25.53 25.53
1678 24.9 25.41 24.97 24.78 24.78 24.53 24.36 24.31 24.27 24.24 24.27 24.24
1679 24.4 24.36 25.03 25.28 25.16 25.66 25.94 26.62 27.17 27.07 27.1 27.7
1680 27.88 27.9 27.97 28.14 27.29 26.92 26.79 27.14 27.62 27.39 27.52 27.82
1681 27.88 27.88 28.05 27.42 26.57 26.32 26.19 25.49 25.28 25.28 25.16 25.03
1682 24.99 24.74 25.11 25.52 25.02 24.99 25.03 24.74 24.92 24.61 24.44 25.12
1683 25.06 25.24 25.11 25.19 24.65 24.71 24.71 24.37 24.11 25.12 25.11 25.25
1684 25.31 25.52 25.25 25.06 24.86 24.99 24.87 24.87 24.74 24.8 24.68 24.75
1685 24.93 25.06 25.02 24.87 24.87 24.84 24.67 24.61 24.61 24.86 24.94 24.96
Sources: Kammarkollegiet, oordnade handlingar, no. 444 (Riksarkivet). Th e data have been col-lected and calculated in cooperation with Martin Sutinen. Th e monthly data are based on bills of 8 days to 2 months, assuming an interest rate of 12.5 per cent.

5. Foreign exchange rates in Sweden 1658–1803 263
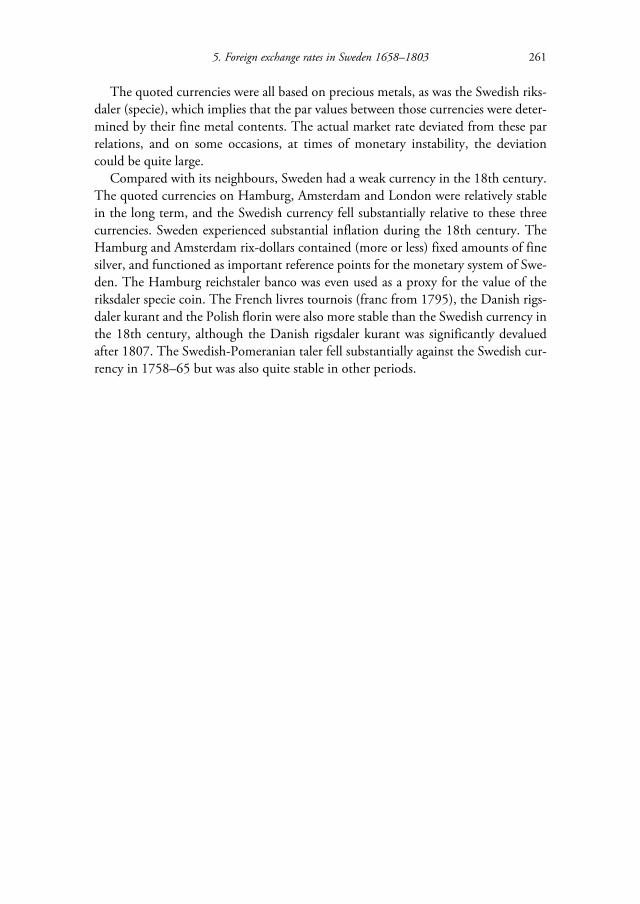
Table A5.2. Monthly exchange rates on Hamburger reichstaler banco in marks kopparmynt 1705–76 (not spot rates).
Year Jan Feb Mar Apr May June July Aug Sept Oct Nov Dec
1705 27 27.44 27.19 27.31 27.31 25.75 27.38 27.44
1706 27.44 27.31 27.31 26.94 27 27.06 27 26.94 26.81 26.81 26.5
1707 26.94 26.81
1722 37 37.13 37 37 36.88 36.88 37 37
1723 36.88 36.75 36.63
1727 33.75 34.88 34.5 34.94 35.13 35.38 35.75
1728 35.88 35.25 35.5 35.75 35 35 35.75 37.75 35.63 35.88 35.5
1729 36.5 36 35.5 34.75
1733 35.25 35.25 35.38 35.75 35.63 35 34.94 35.25 35.38 35 35.44 35.13
1734 35.38 35.25 35.56 35.69 35.44 35.31 35.06 35.19 35.38 35.38 35.5 35.31
1735 35.69 35.88 36 36.06 36.06 36.19 35.75 35.81 35.38 35.19 35.25 35.63
1740 37.13 37.19 37.13 37.31 37.25 36.5 37.06 37 37.13 37.19
1741 37.31 37.31 37.38 37.19 37.25 37.06 36.81 37.44 37.94 39 39.75 40.38
1742 41.06 40.44 40.63 41.25 41.13 40.94 40.75 39.5 37.38 37.38 38.19 38.25
1743 38.38 38.13 38.38 39.63 40.75 40.25 39 40.75 41.38 42.38 43.13 44.06
1744 43.13 43 42.75 43.75 44.63 43 43.25 43.25 44.38 44.94 45.25 45.5
1745 45.75 45.5 46.38 43.63 41.25 40 40 40 40 40 40 40
1746 40 40 40 40 40 40 40 40 40
1747 40 40 40 44.88 44.5 45.13 45.25 44.5 44.63 44.63 46.5
1748 46.38 45 45 45.13 44.38 43.56 43.44 43.63 44 44.13 44.13 44.38
1749 44.5 44.13 43.38 43 42.75 42.75 43.38 43.5
1750 43.63 43.38 43.13 42.5 41.88 41.88 41.69 41 40.25 40.31 40.5 40.5
1751 40.38 40.25 40.5 40.88 40.81 40.63 40.38 40.13 39.63
1752 39.88 39.38 39.38 38.75 38.38 37.5 36.38 36.88 36.75 37.38 37.88 38.25
1753 38.13 38.13 38.13 37.75 37.63 37.63 37.94 38.13 38.06 38 38.25 38.63
1754 38.63 38.63 38.63 38.63 38.63 38.69 38.88 38.81 38.81 38.81 38.81 38.81
1755 38.81 38.81 38.81 38.81 38.5 38.63 38.5 38.06 37.81 38.13 39 40
1756 41.38 41.88 40.75 39.38 39.5 39.63 39.63 39.63 39.38 39.38 41.13 41.88
1757 42.25 40.88 40.25 40.63 41.88 43.38 44.75 46.5 46.88 46.88 48 49.63
1758 49.63 53.13 55.5 54.13 53.38 52 50.38 49.5 49.25 49.25 49.25 49
1759 48.63 48.25 47.88 47.5 47.38 48.75 49.25 49.25 51 52.38 53.13 54.13
1760 56.75 59.75 61 58.13 59.75 60.13 63 65.88 66.88 68 70.13 73.38
1761 73.75 72.25 73.5 74.13 71.75 71.13 71.75 71.5 69.75 69.13 72 74.25
1762 73.63 74 75.5 77.63 77.75 80.5 88.25 89.25 92.88 102.6 101.8 91.5
1763 84.5 81.88 84 81 80 79 75 76.5 83 90 86.25 85.5

Exchange rates, prices, and wages, 1277–2008264
Year Jan Feb Mar Apr May June July Aug Sept Oct Nov Dec
1764 84.5 81.5 81.5 82.25 83.5 85.25 84.75 86.5 92.25 93.5 92 86
1765 82.75 82.75 84.75 85.13 85.13 91.5 90.5 88.5 86.5 83.5 80.5 79.5
1766 77.75 77 70 70 70 70 70 70 70 68.75 68.25 67.25
1767 66 66 65.75 65.25 64.5 62.75 57.75 48 43.5 43.5 43.25 42.75
1768 42 42 42 42 42 42 42 42 42 42 42 42
1769 42 42 42 42 42 42 42 42 42 42
1770 56 55.5 55 55 55 55 60.5 64.5 63.75 65 64.5 65
1771 65 65 65.25 63.5 61 61 62.25 61.5 62 62.5 63.5 64.25
1772 64.5 66 67 68.75 68.75 68.5 71 73.25 71 70.25 70 73
1773 73.75 82 81 81 81.5 81.5 80.5 79.38 80.13 80.38 80.63
1774 80.5 80.5 80.38 80.13 77.75 75.5 73.5 72.38 72.5 72.75 73.13 73.25
1775 71 70.5 70.13 69.38 68.63 68.25 68.38 68.63 69 69 69 69.13
1776 69.13 68.88 69.13 69 68.88 68.88 69 69 69 69 69.13 69.63
Source: ‘Växelkurser å Stockholms börs. Primärtabeller (1705–)/1740–1803’ (Riksbankens arkiv). Th e monthly data are estimated as the median of highest and lowest rates, and mostly based on two-month bills.
Table A5.3. Monthly exchange rates on Hamburger reichstaler banco in skilling banco 1777–1803 (not spot rates).
Jan Feb Mar Apr May June July Aug Sept Oct Nov Dec
1777 46.33 46.42 46.25 46.58 46.58 46.58 46.5 45.5 45.25 45.33 46.5 46.67
1778 46.67 47 46.83 46.29 46.29 45 44.75 44.83 45.08 45.58 46.75 46.58
1779 46.63 46.42 45.25 45.58 45.58 45.71 45.29 45.63 45.58 46.29 47.13 47.13
1780 47 47 46.67 46 45.58 45 45.58 45.71 45.42 46 47.08 47.08
1781 46.75 45.75 45.58 45.17 45.08 45.88 45.42 45.13 44.92 44.5 45.58 44.58
1782 45.17 45.5 45 45 45.13 45.63 45.13 45.5 45.42 45.42 46 46.13
1783 45.58 46 45.75 45.75 45.79 46.88 47.17 47.79 47.79 47.83 48 48
1784 48 48 48 48 48 48 48 48 50 49.25 52 53
1785 51.25 49.13 49.42 49.33 48.88 48.71 49.5 49.5 49.88 49.58 51.25 49.75
1786 48.75 47.75 47.5 47.38 47 47 46.63 47.13 47.63 47.42 48 48
1787 47.42 46.63 46.29 46.38 46.29 46.21 46.25 46.25 45.88 46.5 46.75 46.88
1788 46.5 46.75 46.5 46.13 46 46.75 46.88 47.5 46.88 46.5 46.75
1789 47 48 47.75 48.63 48.5 49.75 51 49.13 51.25 55.75 55.25
1790 53.5 55 56.5 54.5 55 56 56.75 54 54.5 55.5 54.5 54.5
1791 53.75 53.5 53.38 53.25 52.5 51.5 50 50.58 50.42 49.25 49.5 49.5
1792 49 49 50 50 50.75 51.75 50.88 51 52.25 52.25 52.25 52.25
1793 52.25 53 51.88 53.75 54.5 54.5 53.75 52.88 54.5 55.5 54.75 57.5
1794 57.25 52 51.25 51.38 50.75 50.88 51 49.5 49.25 49 49 48
1795 48 48 48 48 47 47 47 47 47 47 47 47
Table A5.2 (cont.). Monthly exchange rates on Hamburger reichstaler banco in marks kopparmynt 1705–76 (not spot rates).

5. Foreign exchange rates in Sweden 1658–1803 265
Jan Feb Mar Apr May June July Aug Sept Oct Nov Dec
1796 47 47 47 47 47 47.5 47 47 47 47.5 48 48
1797 49.25 49.13 49.63 50.5 50.13 50.13 50 51.5 50.75 50.25 51 51.5
1798 53.5 50 50.5 50.5
1799 50.5 52 53 52.75 52 53 53 52.38 51 52 53.5
1800 54 52 51 51 51 50 49.5 49.5 49.75
1801 50 52.75 52.75 52.5 52.5 52.75 52 51 51.25 51.5 51.13 51.5
1802 53 53 52 51.5 50.5 51.5 50.5 50.63 49.5 49 49.25 50
1803 50.5 50.33 50.67 51.5 51 52.21 52.25 52 48.5 49.25 48.88 50.5
Source: ‘Växelkurser å Stockholms börs. Primärtabeller (1705–)/1740–1803’ (Riksbankens arkiv). Monthly exchange rates are estimated from the mid-month fi gures, and mostly based on two-month bills.
Table A5.4. Monthly exchange rates on Hamburger reichstaler banco in skilling riksgälds 1797–1803 (not spot rates).
Jan Feb Mar Apr May June July Aug Sept Oct Nov Dec
1797 51.25 52.25 51.5 53 53 54 53.75 55.5
1798 56.88 56 54 53.75 53.25 51 51 53 52.5 54.25 56 69.5
1799 67.75 71 72 74 73.75 76 75.5 76 74.5 77.5 82
1800 75.25 72.25 68 69.25 69.75 70 69.75 69.75 70.75
1801 69.75 79.5 73.75 74.25 73.75 74.5 73.25 75 76.75 78 77.88 77.88
1802 79.5 76.75 76.75 75.25 74.5 75.25 75.75 75.25 73.75 73.13 76.25 75.75
1803 75.75 76.25 76 77.13 77.88 79.75 78.75 78.25
Source: ‘Växelkurser å Stockholms börs. Primärtabeller (1705–)/1740–1803’ (Riksbankens arkiv). Monthly exchange rates are estimated from the mid-month fi gures, and mostly based on two-month bills.
Table A5.5. Monthly exchange rates on Amsterdam rijksdaalder courant in marks kopparmynt 1660–85 (estimated spot rates).
Year Jan Feb Mar Apr May June July Aug Sept Oct Nov Dec
1660 17.2 17.33 17.02 17.12 16.56 16.31 16.43 16.93 16.98 16.98 17.02 17.25
1661 17.42 17.63 17.84 17.92 17.92 18.14 18.09 18.09 17.5 17.69 17.37 17.62
1662 17.7 17.86 17.99 18 17.65 17.31 17.33 17.5 17.55 17.81 17.94 18.07
1663 18.27 18.3 18.28 18.14 18.09 18.31 18.75 18.82 18.83 19.05 19.13 19.62
1664 21.38 21.45 20.75 19.8 19.39 19.32 19.1 19.39 19.2 19.38 20.1 20.1
1665 20.42 20.34 20.26 20.45 20.22 20.17 20.32 20.40 20.66 20.68 20.68 21
1666 20.3 20.28 20.28 20.37 20.57 20.68 20.91 20.71 20.25 20.28 19.91 20.2
1667 20.2 20.17 20.17 20.17 20.2 20.21 20.17 20.15 20.14 20.12 20.2 20.17
1668 20.21 20.17 20.21 20.23 20.2 20.4 20.21 20.07 20.13 20.17 20.07 20.05
Table A5.3 (cont). Monthly exchange rates on Hamburger reichstaler banco in skilling banco, 1777–1803 (not spot rates).

Exchange rates, prices, and wages, 1277–2008266
Year Jan Feb Mar Apr May June July Aug Sept Oct Nov Dec
1669 20.14 20 20.32 20.4 20.12 20.19 19.89 19.68 19.82 19.42 20.17 20.42
1670 20.5 20.65 20.96 20.94 20.2 20.09 19.7 19.84 20.19 20.56 20.69 20.44
1671 20.06 20.05 20.2 19.94 19.69 19.75 20.12 20.12 20.12 20.20 20.12 19.94
1672 19.87 19.93 20.18 20.34 20.25 20.20 20.11 20.05 20 20.28 20.75 20.63
1673 20.59 21.09 20.18 20.74 20.7 20.59 20.27 20.27 20.08 20.05 20.57 20.27
1674 20.44 20.56 20.52 20.2 20.2 20.03 20 20.12 20.34 20.58 20.38 20.38
1675 20.63 20.95 20.85 20.5 20.55 20.5 20.5 21.44 21.63 21.46 21.13 20.69
1676 20.55 20.7 21.15 20.65 20.45 20.5 21.7 21.56 22.04 22.33 22.83 23.05
1677 22.76 22.89 23.23 23.33 23.29 23.29 23.65 23.91 24.31 24.46 24.18 23.96
1678 24.42 24.36 23.86 23.79 23.73 23.5 23.35 23.35 23.32 23.16 23.26 23.12
1679 23.29 23.79 24.05 24.36 24.34 25.16 25.22 25.66 25.87 26.16 26 26.56
1680 26.79 26.94 27.07 27.19 26.12 25.81 25.53 26.51 26.37 26.49 26.12 26.82
1681 26.98 26.85 27 26.12 25.44 25.37 25.11 24.61 24.24 24.15 23.98 24.23
1682 24.31 24.01 24.31 24.61 24.11 23.98 23.89 23.73 23.48 23.1 23.1 24.05
1683 23.67 24.24 24.05 24.11 24.05 23.08 23.1 24.24 22.91 23.02 23.31 23.69
1684 23.83 24.02 23.79 23.67 23.52 23.44 23.44 23.61 23.5 23.35 23.35 23.51
1685 23.61 23.54 23.73 23.35 23.35 23.31 23.06 23.1 23.23 23.1 23.23 23.85
Sources: Kammarkollegiet, oordnade handlingar, no. 444 (Riksarkivet). Th e data have been col-lected and calculated in cooperation with Göran Hansson. Th e monthly data are based on bills of 8 days to 2 months, assuming an interest rate of 12.5 per cent.
Table A5.6. Monthly exchange rates on Amsterdam rijksdaalder courant in marks kopparmynt 1705–76 (not spot rates).
Year Jan Feb Mar Apr May June July Aug Sept Oct Nov Dec
1705 25.75 26.44 26 26.13 26.06 26 26.19 26.31
1706 26.13 26.19 26.06 25.94 25.88 25.94 25.94 25.94 25.81 25.81 25.5
1707 25.94 25.81
1724 33.75 34.5 34 33.75 33.63 33.75 33.75 33.63 33.75 33.5
1725 33.88 34
1726
1727 33.63 35 35 35
1728 35.5 35 35 35.5 35.25 34.5 35 35 34.88 34.75 35 34.38
1729 34.63 34.5 35.13 34.75 32.88 32.88
1733 34.25 34.38 34.56 34.88 34.88 34.25 34.44 34.94 34.81 34.38 34.75 34.38
1734 34.88 34.81 35 35.25 35.06 35 34.56 34.94 35.13 35.06 35.13
1735 34.19 34.5 34.69
1736 34.88 35.38 35.69 35.88 35.81 35.75 35.38 35.25 34.44 34.5 34.25 34.69
Table A5.5 (cont.). Monthly exchange rates on Amsterdam rijksdaalder courant in marks kopparmynt 1660–85 (estimated spot rates).

5. Foreign exchange rates in Sweden 1658–1803 267
Year Jan Feb Mar Apr May June July Aug Sept Oct Nov Dec
1740 35.44 35.56 35.63 35.69 35.75 35.13 35.5 35.56 35.81 35.75
1741 35.88 36 35.88 35.75 35.88 35.75 35.5 36.25 36.69 37.5 37.75 39
1742 39.38 39.19 39.19 39.63 39.38 39.13 39.19 37.75 35.88 35.88 36.25 36.31
1743 36.56 36.88 36.88 37.88 38.88 40 38.25 38.5 39.5 40.38 41.13 42.25
1744 41.31 41.13 40.81 41.75 42.63 41.13 41.5 41.5 42.69 43.13 43.5 43.75
1745 43.81 43.75 44.38 42 39.5 38.25 38.25 38.25 38.25 38.25 38.25 38.25
1746 38.25 38.25 38.25 38.25 38.25 38.25 38.25 38.25 38.25
1747 38.25 38.25 38.25 43.88 43.63 44.13 44.38 43.75 43.75 43.88 45.63
1748 45.13 44.13 44.38 44 43 42.38 42 41.88 41.88 41.88 42 42
1749 42.5 42 41.5 41.25 41 40.88 41.13 41
1750 41 41 40.88 40.5 39.88 39.94 39.69 38.88 38.38 38.25 38.25 38.25
1751 38.13 38.13 38.25 38.25 38.25 38.13 37.88 37.88 37.38
1752 37.63 37.25 36.88 36.63 36.13 35.25 34.25 34.63 34.75 35.25 35.75 36
1753 35.88 35.94 35.88 35.69 35.63 35.38 35.69 35.81 35.63 35.75 35.88 36
1754 36.13 36.13 36.13 36.13 36.06 36.19 36.13 36 36 36.06 36.13 36.06
1755 36 36.06 36.06 36.06 36.06 36.13 36.13 36.13 36.06 36.13 36.88 38.25
1756 39.38 39.88 39.25 38.13 38.25 38.5 38.63 38.63 38.5 38.63 40.5 41.38
1757 42 41.13 40.5 40.69 42.25 44.63 46.13 47.63 47.88 47.88 48.5 49.75
1758 50.44 54.13 56.38 55.13 55 53 51.88 51.13 51 51 50.88 50.63
1759 50.38 50.25 50.5 50.63 50.88 52.25 52.63 52 52.5 53.63 54.25 55.25
1760 57.38 60.75 62.5 59.5 59.75 58.5 60 62.38 62.5 63 64.63 67.75
1761 68.13 67.25 68.75 69 67 66.88 67.88 67.13 66 65.13 67.75 69.25
1762 68.88 70 71.5 74 75 79 86.75 85 93.63 102.5 101 89.5
1763 83 80.75 82.75 80 78.75 78 74 75.75 82.25 84.5 83.5 83
1764 80.63 77 77.75 78.25 79.5 81.25 81 82.75 88.25 90 88.5 82
1765 79.25 79.25 80.5 81 81 87.5 86 85 83.5 80.5 77.5 76.5
1766 75 74 69 69 69 69 69.5 70 70 69 69 67.25
1767 66 66 66 66 66 64 58.5 49 44.5 44.25 43.75 42.25
1768 41.38 41.63 41.63 41.75 41.75 41.75 41.75 41.13 41.25 41.75 40.5 41.75
1769 41.75 41.75 40.63 41.75 40.38 41.75 41.75 41.75 41.75 41.75
1770 54 53.5 53 53 53 53 58 61.75 60.5 61.5 60.75 61
1771 61 61 61 59 58.5 58 59.5 58.75 59 59.5 60 60
1772 60.5 62.25 63 65 64.75 64.75 67 69 67 66.25 68.25 69
1773 69.25 78 77.5 78.25 78.5 78.25 77.5 76.38 76.38 76.25 76
1774 75.88 76 76 76 73.75 71.5 70.38 69 69 69.13 69.13 69.13
1775 67 66.75 66.38 66 65.5 65.25 65.25 65.25 65.25 65.38 65.25 65.25
1776 65.13 64.88 65.25 65.25 65.25 65.13 65.13 64.88 64.75 64.75 64.38 64.75
Source: ‘Växelkurser å Stockholms börs. Primärtabeller (1705–)/1740–1803’ (Riksbankens arkiv). Th e monthly data are estimated as the median of highest and lowest rates, and mostly based on two-month bills.
Table A5.6 (cont.). Monthly exchange rates on Amsterdam rijksdaalder courant in marks kopparmynt 1705–76 (not spot rates).

Exchange rates, prices, and wages, 1277–2008268
Table A5.7. Monthly exchange rates on Amsterdam rijksdaalder courant in skilling banco 1777–1803 (not spot rates).
Jan Feb Mar Apr May June July Aug Sept Oct Nov Dec
1777 43.25 43.33 43.33 43.75 44 43.83 43.17 42.25 42.25 42.33 43.17 43.5
1778 43.33 44 44 43.33 43.25 42.17 42.08 42.75 43 43 43.88 44
1779 43.5 44.13 43.75 43.63 44.08 44 43.58 43.5 43.75 44.13 44.67 43.79
1780 45 45.08 45.08 44.13 44 43 43.42 43.42 43.42 43.75 44.5 44.17
1781 43.88 44 43.75 43.13 43.17 43.88 43.5 43.17 42.63 42.08 42.33 41.38
1782 41.88 42.25 42 42 42.25 42.38 42.21 42.08 41.5 40.88 41.5 40.75
1783 41.17 42.58 42.5 42 41.75 42.75 43.33 44.71 44.79 45.25 45.5 45.33
1784 45.33 45.33 45.33 45.5 45.5 45.5 46 46.5 46.5 46.33 48 48.5
1785 47.25 46 46 46 46 45.75 46.58 46.63 46.88 46.67 48.38 47
1786 46.63 45.5 45 45.5 45.25 45 44.63 44.5 44.75 44.5 45 45
1787 44.42 44 43.58 43.58 43.25 43.33 43.21 43.13 43 43.75 44 44
1788 43.42 43.75 43.75 43.38 43 43.5 42.88 43.67 42.75 42.5 42.42
1789 43.38 44.88 44.5 45.63 45.5 46.81 47 46.5 48.75 52.5 51.38
1790 50 52.13 53.5 52.25 52 53 53.75 51 51.5 52.5 51.5 51
1791 50.5 50.5 50 50.25 50 49.5 49.25 48.58 48.42 47 47.13 47.5
1792 47 47.25 48 48 48.5 49.5 48.75 49 50 49.75 49.75 49.75
1793 50 51 50.5 52.25 53 51.75 52.5 51.25 53.13 52.08 51.13 53.5
1794 53.25 48.25 47.75 48 47.75 47.38 47 45 45.5 45 45 46
1795 47 46 45.75 42 42 43 42.5 42.5 41.75
1796 41 43 42 42.5 42 42.33 41.88 41.25 40.33 41.25 41.75 42
1797 43.63 43 45 45.5 45 45 45.5 46.25 47 46.75 47.5
1798 51 45 44
1799 46.5 46 46 46 46.63 47.5 47.5 47 48
1800 50.5 48 47.75 47 47 46 46 46
1801 50 47.5 47 46.75 47 47
1802 47 47.63 47.38 47 47.13 47 46.5 45.75 45.88 46.5
1803 48 48.5 49 48.5 47.75 45.5 46 45.25 46.13
Source: ‘Växelkurser å Stockholms börs. Primärtabeller (1705–)/1740–1803’ (Riksbankens arkiv). Monthly exchange rates are estimated from the mid-month fi gures, and mostly based on two-month bills. For monthly exchange rates after 1803, see Chapter 6.

5. Foreign exchange rates in Sweden 1658–1803 269
Table A5.8. Monthly exchange rates on Amsterdam rijksdaalder courant in skilling riksgälds 1797–1803 (not spot rates).
Jan Feb Mar Apr May June July Aug Sept Oct Nov Dec
1797 46.5 48 47 48 49 50.5 50 51.38
1798 53.38 52 50 51.25 50.75 48 48 49 50.5 49.75 51 61.5
1799 60.5 63 63.75 65 64.75 67 69 69 68 71 71
1800 72 68.5 64 66 65.5 66 65.5 65.5 65.75
1801 64.25 74 67 69 69.5 70 68.25 69.5 70.5 72.25 72.38 71.75
1802 72.25 70.5 70.5 71.5 70.5 71.25 70.75 70.25 69.25 69.25 71.5 71.25
1803 70.25 72 71.25 73.25 73.25 75.25 74.88 72.38
Source: ‘Växelkurser å Stockholms börs. Primärtabeller (1705–)/1740–1803’ (Riksbankens arkiv). Monthly exchange rates are estimated from the mid-month fi gures, and mostly based on two-month bills.
Table A5.9. Monthly exchange rates on pound sterling in daler kopparmynt 1705–76 (not spot rates).
Year Jan Feb Mar Apr May June July Aug Sept Oct Nov Dec
1705 27 27 27.13 27.31 27.31 27.31 27.38 27.56
1706 27.56 27.63 27.44 27.5 27.5 27.38 27.31 27.19 27.25 27.81 28
1707 28.13 27.88
1727 37.5 36.5 37.5 37.25 37 37.38 37.88 38
1728 38.5 38.38 38.38 38.5 37.38 37 37.38 37 37.13 37.13 37.13 36.63
1729 37.25 37 37.13 37.5 36.88 33.38 33.38
1733 37.25 37.25 37.5 37.75 37.75 37.25 37.25 37.38 37.38 37.31 37.88 37.88
1734 38.38 38.75 39 39.38 39.25 39.25 38.81 38.88 39.19 39.25 39.38
1735 38.5 38.94 38.75
1736 39.5 39.25 39.63 39.56 39.31 39.13 38.63 38.38 37.63 37.5 37.63 37.69
1740 39.63 39.63 39.44 39.44 39.31 38.56 38.63 38.88 39.13 39
1741 39.25 39.13 39.19 39.13 39.13 38.75 38.31 39 39.13 39.94 40.63 42.5
1742 42.13 42 41.88 42.63 42.38 42.13 42.25 41.44 39.38 39.13 39.63 39.63
1743 40.38 40.63 41.13 41.25 42.13 41.75 41.19 41.75 42.63 43.5 44.5 46.13
1744 45 44.88 44.31 45.13 46.13 44.38 44.75 45.13 45.63 46.13 46.5 46.88
1745 47.13 47.38 48.63 45.88 44.25 41.5 41.5 41.5
1746 41.5 41.5 41.5 41.5 41.5 41.5 41.5
1747 41.5 41.5 41.5 48.63 48.25 48.63 48.75 48.5 48.5 48.63 50.5
1748 50 48.25 49 48.88 48.25 47.75 47.13 47.5 47.38 47.5 47.75 47.75
1749 48.5 48.13 47.25 46.63 46.38 45.63 45.63 45.63
Exchange rates, prices, and wages, 1277–2008270
Year Jan Feb Mar Apr May June July Aug Sept Oct Nov Dec
1750 45.5 45.25 44.88 44.38 43.5 43.13 43.13 42.38 41.63 41.5 42.38 42.5
1751 42.38 42.25 42.13 42.5 42.38 42.38 42.13 41.88 41.5
1752 42.13 41.63 40.88 40.38 39.88 39.25 37.75 38 38.25 38.25 39.13 39.63
1753 39.5 39.13 38.88 38.81 38.5 38.56 38.69 38.88 38.88 39.13 39.38 40
1754 39.88 39.88 39.94 39.88 39.88 40.13 40.06 40 40.13 40.25 40.44 40.44
1755 40.44 40.44 40.63 40.88 40.88 41 41.06 41.06 41 41.06 41.81 42.88
1756 44.25 45 44.13 43.5 42.75 43.63 44.25 43.75 43.75 44 45.5 47.25
1757 47.5 46.75 46 46.25 47.88 48.38 49.38 51.38 51.5 51.5 52.5 53.75
1758 54.25 57 60.5 58.75 58.38 56.5 55.5 54.88 54.88 54.63 54.63 54.75
1759 54.25 54.25 54.5 54.75 54.75 55.88 56.63 58.25 58.38 59.5 62.13
1760 62.75 64.25 67.63 65.5 65 63.75 64.75 67 67.25 67.25 69 72.5
1761 72.5 71.88 72.5 73.13 72 69.75 70.5 70.5 68.75 68.5 71.5 75.5
1762 74.5 76 78.25 81 81.63 84.38 92.25 95.75 100 110.5 108 96.5
1763 89.88 86.75 87.75 85 83.25 82.25 78 79.5 79.5 93 90 89.25
1764 86.75 85.5 86.75 86.75 89 90.5 91.5 93 98.75 100 99.5 92.5
1765 90.5 90.25 93 93.5 98.63 96 94.75 93 89 89.5 84
1766 83 83 76 76 76 76.5 76.5 76.5 74 75.13 73
1767 72 71.88 71.88 72 71.75 69.13 64 52.25 48.75 47.5 46.75 45.25
1768 46 46 45.38 46.25 44.5
1769
1770 56.13 57 56.38 56.5 66.5 65.25 64.5 65.5 64.75 65.75
1771 65.5 66 66 64.25 63.25 62 63.5 62.75 62.75 63.75 63.5 64
1772 67 67.25 71 69.5 69.5 72 74.5 72.75 72.5 74.5 76.5
1773 67.38 86.63 87.25 87.5 86.5 85.5 86.13 86 86
1774 86.5 86.5 86.5 84 81.25 79 77.25 77.38 77.38 77.25 77.38
1775 75.5 75 74.75 73.38 72.5 72 72 72 72.25 72.38 72.38 72
1776 72.06 71.75 72.13 71.88 71.63 71.25 70.25 70.38 70.25 70.13 70.06 70.19
Source: ‘Växelkurser å Stockholms börs. Primärtabeller (1705–)/1740–1803’ (Riksbankens arkiv). Th e monthly data are estimated as the median of highest and lowest rates, and mostly based on three-month bills.
Table A5.10. Monthly exchange rates on pound sterling in riksdaler banco 1777–1803 (not spot rates).
Jan Feb Mar Apr May June July Aug Sept Oct Nov Dec
1777 3.91 3.91 3.917 3.931 3.925 3.901 3.854 3.771 3.708 3.742 3.818 3.859
1778 3.859 3.888 3.927 3.953 3.953 3.938 3.948 3.979 3.979 3.99 4.063 4.099
1779 4.208 4.224 4.146 4.188 4.182 4.135 4.073 4.031 3.927 4.021 4.104 4.146
1780 4.156 4.198 4.194 4.099 4.078 4.042 4.026 4.021 4.021 4.047 4.073 4.052
1781 4.01 3.958 3.917 3.875 3.854 3.823 3.729 3.698 3.625 3.609 3.63 3.589
1782 3.677 3.708 3.698 3.724 3.734 3.75 3.76 3.755 3.708 3.688 3.688 3.688
Table A5.9 (cont.). Monthly exchange rates on pound sterling in daler kopparmynt 1705–76 (not spot rates).

5. Foreign exchange rates in Sweden 1658–1803 271
Jan Feb Mar Apr May June July Aug Sept Oct Nov Dec
1783 3.724 3.833 3.792 3.776 3.714 3.724 3.75 3.849 3.854 4 4.073 4.125
1784 4.229 4.25 4.281 4.297 4.281 4.344 4.333 4.37 4.406 4.385 4.521 4.688
1785 4.563 4.49 4.484 4.438 4.344 4.375 4.427 4.516 4.521 4.484 4.536 4.5
1786 4.38 4.323 4.333 4.281 4.181 4.104 4.125 4.161 4.167 4.182 4.271 4.26
1787 4.146 4.104 4.104 4.104 4.104 4.073 4.083 4.099 4.109 4.177 4.193 4.229
1788 4.208 4.214 4.245 4.208 4.156 4.177 4.161 4.208 4.151 4.141 4.151
1789 4.255 4.313 4.359 4.391 4.469 4.531 4.604 4.526 4.656 4.917 4.938
1790 5.042 5.083 5.208 5.167 5.25 5.219 5.208 5.167 5.042 5.01 4.917 4.896
1791 4.958 4.917 4.875 4.896 4.854 4.781 4.703 4.703 4.698 4.604 4.484 4.719
1792 4.375 4.458 4.479 4.448 4.438 4.469 4.448 4.448 4.51 4.552 4.583 4.625
1793 4.703 4.786 4.875 5.021 5.125 5.125 5.125 5.083 5.167 5.063 5.219 5.073
1794 5.036 4.818 4.823 4.823 4.75 4.625 4.625 4.5 4.458 4.375 4.313 4.188
1795 4.167 4.125 4.135 4.188 4.021 3.917 3.917 3.875 3.875 3.885 3.938 3.938
1796 3.938 4.01 3.979 4.167 4.104 4.094 4.01 4 4 4.104 4.188 4.25
1797 4.375 4.396 4.417 4.542 4.583 4.604 4.667 4.802 4.948 4.813 4.865 5
1798 4.833 4.833
1799 4.729 4.979 4.917 4.854 4.719 3.854 3.792
1800 4.083 4.125 4.104 4 4.021 4.01 3.938
1801 3.896 4.167 4.271 4.083 4.094 4.083 4.229 4.208 4.156
1802 4.323 4.24 4.208 4.26 4.198 4.219 4.156 4.156 4.24
1803 4.5 4.5 4.438 4.438 4.417 4.417 4.344 4.125 4.167 4.208 4.375
Source: ‘Växelkurser å Stockholms börs. Primärtabeller (1705–)/1740–1803’ (Riksbankens arkiv). Th e monthly data are estimated as the median of highest and lowest rates, and mostly based on three-month bills.
Table A5.11. Monthly exchange rates on pound sterling in riksdaler riksgälds 1797–1803 (not spot rates).
Jan Feb Mar Apr May June July Aug Sept Oct Nov Dec
1797 4.635 4.771 4.724 4.958 5.083 5.083 5.177 5.271
1798 5.271 5.375 5.167 5.203 5.172 4.979 4.958 5.125 5.208 5.208 5.375 6.708
1799 6.49 6.719 6.76 6.938 6.792 6.813 6.75 6.75 6.25 5.917 6.188
1800 5.917 5.833 5.708 5.813 5.729 5.688 5.688 5.688 5.479
1801 5.438 6.146 6.083 5.917 5.958 5.875 6.042 6.146 6.313 6.375 6.354
1802 6.521 6.354 6.323 6.313 6.167 6.271 6.302 6.313 6.25 6.292 6.417 6.448
1803 6.583 6.75 6.708 6.75 6.688 6.792 6.677 6.625
Source: ‘Växelkurser å Stockholms börs. Primärtabeller (1705–)/1740–1803’ (Riksbankens arkiv). Th e monthly data are estimated as the median of highest and lowest rates, and mostly based on three-month bills.
Table A5.10 (cont.). Monthly exchange rates on pound sterling in riksdaler banco 1777–1803 (not spot rates).
Exchange rates, prices, and wages, 1277–2008272
Table A5.12. Monthly exchange rates on écu de change (= 3 livres tournois) in marks kopparmynt 1668–85 (estimated spot rates).
Year Jan Feb Mar Apr May June July Aug Sept Oct Nov Dec
1668 21.41
1669 21.41 21.41 21.41 21.41 21.41 21.41
1670 21.21 21.31 21.41 21.41 21.41 21.18 21.29 21.29 21.4
1671 21.63 21.21 21.41 21.21 21.31 21.31 21.21 21.31
1672 21.21 21.21 21.21 21.21 21.31 21.18 20.95 20.95 20.95 20.83
1673 20.7 20.7 21.21 21.21 21.15 21.06 21.21 21.06 21.06 21.21
1674 21.21 21.21 21.21 21.21 21.21 21.21 21.56 21.56 21.56 21.4 21.6 21.4
1675 21.56 21.71 21.56 21.56 21.56 22.07 22.07 22.07 22.22 22.22
1676 22.58 22.72 22.72 21.81 20.95 22.2 22.58 23.73 23.73 24.99
1677 24.24 24.24 24.24 24.24 24.74 25.25 25.25 25.49 25.37
1678 25.25 25.25 25.25 25.25 25.25 25.5 25.37 24.73 24.61 24.61 24.61
1679 24.61 24.61 24.74 24.61 24.74 25.11 25.62 25.97 26.13 26.13 26.13 26.89
1680 27.14 27.27 28.02 28.28 28.28 27.14 27.27 27.77 27.53 28.04 28.55
1681 28.28 28.28 27.27 27.07 27.27 27.1 27.14 26.13 25.93 25.25 25.47
1682 25.5 25.25 25.75 26.13 26.13 25.24 24.84 24.73 24.65 24.73 25.25
1683 25.25 25.11 25.4 25.41 24.74 24.74 24.92 24.06 24.73 25.06 25.25 25.12
1684 25.5 25.06 25.16 24.99 24.96 24.74 24.87 24.93 24.8 24.62 24.84
1685 25.15 25.25 24.98 24.73 25.09 24.9 24.73 24.78 24.73 24.74 24.98 25.11
Source: Kammarkollegiet, oordnade handlingar, no. 444 (Riksarkivet). Th e monthly data are based on bills of 8 days to 2 months, assuming an interest rate of 12.5 per cent.
Table A5.13. Monthly exchange rates on livres tournois in marks kopparmynt 1705–76 (not spot rates).
Year Jan Feb Mar Apr May June July Aug Sept Oct Nov Dec
1705 7.25 7.25 7.139 7.25 7.25 7.25 7.25 7.25
1706 7.25 7.25 7.25 7.167 7.167 7.167 7.167 7.167
1707 7.25 7.25
1740 7.375 7.5 7.438 7.125 7.125 7.125 7.125
1741 7.125 7.125 7.25 7.25 7.25 7.25 7.25 7.25 7.25 7.25 7.5 7.75
1742 7.625 7.563 7.438 7.5 7.5 7.375
1743 7.75
1744 8.75 8.75
1745 9.25 9.25 8.5
1746
1747 7.5 7.5 7.5 8
1748 9.125 9.125 9.125 9.125 8.75 8.75 8.75 8.75 9 9

5. Foreign exchange rates in Sweden 1658–1803 273
Year Jan Feb Mar Apr May June July Aug Sept Oct Nov Dec
1749 8.75 8.75 8.5 8.375 8.375 8.375 8.375 8.375
1750 8.375 8.5 8.5 8.5 8.5 8.5 8.5 8.375 8.25 8 8 8
1751 8 8 8 8 8 8 8 8 7.875
1752 7.5 7.5 7.25
1753 7 7.5 7.375 7.5 7.5
1754 7.375 7.375 7.438 7.25
1755 7.5 7.5 7.5
1756 8.5 8.188 7.938 8 8 8 8 8 8 8 8
1757
1758 9.75 9.75
1759 9.75
1760 10.75 11.75 11.75 12 12 12.25 12.5 12.5
1761 14 12.75 12.75 13 13 13 13 13 13.25
1762 13.25 13.5 13.5 14 14 16 16 17
1763 17 17 17 16 16 16.25
1764 18 16.25 15 19
1765 16 18 18
1766 15 15 13.5
1767 13.5 13.5 13.5 13.5 13.5 12.75 12
1768
1769
1770
1771
1772
1773 14.5 14.5
1774 14.25
1775 13.06 12.5 12.5
1776 12.5 12.38 12.38 12.94 12.25 12.38
Source: ‘Växelkurser å Stockholms börs. Primärtabeller (1705–)/1740–1803’ (Riksbankens arkiv). Th e monthly data are estimated as the median of highest and lowest rates, and mostly based on three-month bills.
Table A5.13 (cont.). Monthly exchange rates on livres tournois in marks kopparmynt 1705–76 (not spot rates).
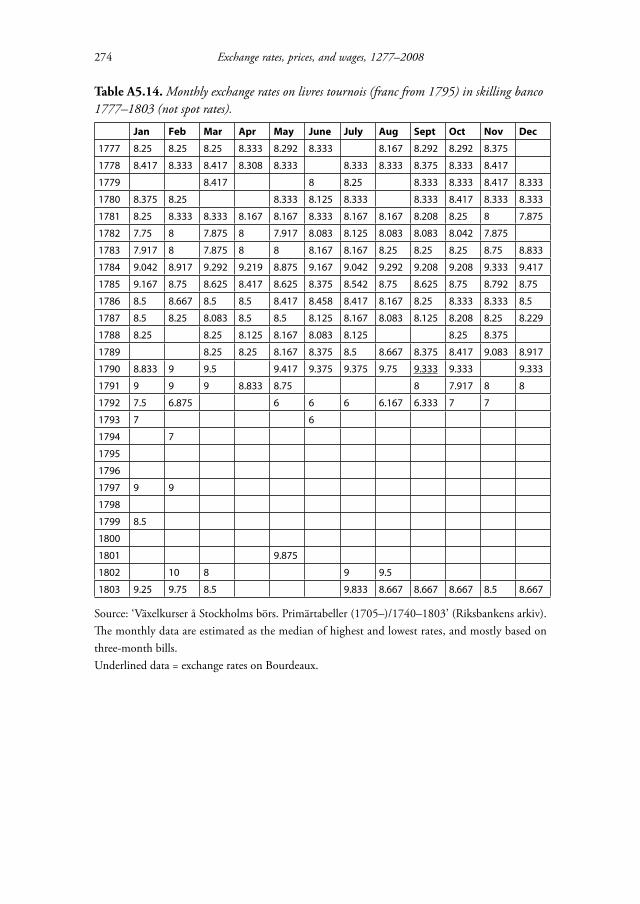
Exchange rates, prices, and wages, 1277–2008274
Table A5.14. Monthly exchange rates on livres tournois (franc from 1795) in skilling banco 1777–1803 (not spot rates).
Jan Feb Mar Apr May June July Aug Sept Oct Nov Dec
1777 8.25 8.25 8.25 8.333 8.292 8.333 8.167 8.292 8.292 8.375
1778 8.417 8.333 8.417 8.308 8.333 8.333 8.333 8.375 8.333 8.417
1779 8.417 8 8.25 8.333 8.333 8.417 8.333
1780 8.375 8.25 8.333 8.125 8.333 8.333 8.417 8.333 8.333
1781 8.25 8.333 8.333 8.167 8.167 8.333 8.167 8.167 8.208 8.25 8 7.875
1782 7.75 8 7.875 8 7.917 8.083 8.125 8.083 8.083 8.042 7.875
1783 7.917 8 7.875 8 8 8.167 8.167 8.25 8.25 8.25 8.75 8.833
1784 9.042 8.917 9.292 9.219 8.875 9.167 9.042 9.292 9.208 9.208 9.333 9.417
1785 9.167 8.75 8.625 8.417 8.625 8.375 8.542 8.75 8.625 8.75 8.792 8.75
1786 8.5 8.667 8.5 8.5 8.417 8.458 8.417 8.167 8.25 8.333 8.333 8.5
1787 8.5 8.25 8.083 8.5 8.5 8.125 8.167 8.083 8.125 8.208 8.25 8.229
1788 8.25 8.25 8.125 8.167 8.083 8.125 8.25 8.375
1789 8.25 8.25 8.167 8.375 8.5 8.667 8.375 8.417 9.083 8.917
1790 8.833 9 9.5 9.417 9.375 9.375 9.75 9.333 9.333 9.333
1791 9 9 9 8.833 8.75 8 7.917 8 8
1792 7.5 6.875 6 6 6 6.167 6.333 7 7
1793 7 6
1794 7
1795
1796
1797 9 9
1798
1799 8.5
1800
1801 9.875
1802 10 8 9 9.5
1803 9.25 9.75 8.5 9.833 8.667 8.667 8.667 8.5 8.667
Source: ‘Växelkurser å Stockholms börs. Primärtabeller (1705–)/1740–1803’ (Riksbankens arkiv). Th e monthly data are estimated as the median of highest and lowest rates, and mostly based on three-month bills.Underlined data = exchange rates on Bourdeaux.

5. Foreign exchange rates in Sweden 1658–1803 275
Table A5.15. Monthly exchange rates on franc in skilling riksgälds 1798–1803 (not spot rates).
Jan Feb Mar Apr May June July Aug Sept Oct Nov Dec
1798 10 9.5
1799 13 12.67 14 14
1800 13.75 12 12.71 12.75 12.75
1801 12.5 13.33 13.5 14 13.38 13.67 14 14 15 14.5
1802 14.5 13.25 13.25 13.25 13.5 12.79 12.75 13.38 13.13
1803 13.04 14 13.5 14.13 13.75 14.75 14 14
Source: ‘Växelkurser å Stockholms börs. Primärtabeller (1705–)/1740–1803’ (Riksbankens arkiv). Th e monthly data are estimated as the median of highest and lowest rates, and mostly based on three-month bills.
Table A5.16. Monthly exchange rates on Danish courant rigsdaler (= 6 marks in Kurant-banken notes) in marks kopparmynt 1741–67 (not spot rates).Year Jan Feb Mar Apr May June July Aug Sept Oct Nov Dec
1741 31.5 31.5 31.5 31.5 31.5 31.5
1752 38 38
1753 32.75
1754
1755 34
1760 56 54 54 55
1761
1762
1763 66 66
1764 66 65 66 65 68 72 72
1765 64
1766 50
1767 50 50 50
Source: ‘Växelkurser å Stockholms börs. Primärtabeller (1705–)/1740–1803’ (Riksbankens arkiv). Th e monthly data are estimated as the median of highest and lowest rates.

Exchange rates, prices, and wages, 1277–2008276
Table A5.17. Monthly exchange rates on Danish courant rigsdaler (= 6 marks in Kurantbanken notes) in skilling banco 1777–1803 (not spot rates).
Jan Feb Mar Apr May June July Aug Sept Oct Nov Dec
1780 36 37
1781 36
1782 35.5 36
1783 34 35 37 37.33 37 37
1784 36.5 37.5 36 36.5 36 38
1785 37 36.75 37 36.5 36.38 36.75 36.75 36.75 37 36.5 37
1786 36.5 35.75 36 35.5 34.5 35.38 35.5
1787 35 34.25 34.25 34 34 34 33.04
1788 33.25 33 33.5 33 32.25 32.5
1789 31.75 32.13 33 33 33.5 35.5 35.75
1790 37 35 36 37 37.25 38 40 40
1791 40 40.25 41 40.5 39 36.25 37.5 38.5 37 38
1792 36.75 37 38 38 38.5 38 38.13 39.25 39.75 39.5 40
1793 39.75 40 42 41 42 42.5
1794 40.5 42 41.5 41
1795 39 40.75 39 39.75 39 39 40 39.5 39.75 39.25 39.5
1796 39.5 39 39 39 39.5 40 38.88 38.5 38.5 39.5 40.25
1797 40.5 41 40.75 40.5 41 43 40.5 43 42 42.13 42 43.75
1798
1799 40 42.5 41
1800
1801 38 38 37 36.63
1802 36 34.5 34
1803 37 37 36 33.33 34.83 34.75 34 34.5
Source: ‘Växelkurser å Stockholms börs. Primärtabeller (1705–)/1740–1803’ (Riksbankens arkiv). Th e monthly data are estimated as the median of highest and lowest rates.
Table A5.18. Monthly exchange rates on Danish courant rigsdaler (= 6 marks in courant-money) in skilling riksgälds 1798–1803 (not spot rates).
Jan Feb Mar Apr May June July Aug Sept Oct Nov Dec
1798 45.75 46.25 45 44.75 44.5 41.25 42.63 43 43.75 43 45.25 56.5
1799 55.25 55.75 56.25 56.75 56.25 58.5 58.25 58 56 60.5 64
1800 59 55 55 57.25 55 55 54.25 54.5 54
1801 52 57 54.75 55.25 53.5 53.38 53.25 54.63 54.38 54.5 55.5 54.5
1802 55.5 54.75 54.38 53.5 51.75 53.25 52.25 51.75 51 51 52.5 52
1803 53.88 56.13 55.75 56.5 55.5 56 54.25 51.88
Source: ‘Växelkurser å Stockholms börs. Primärtabeller (1705–)/1740–1803’ (Riksbankens arkiv). Th e monthly data are estimated as the median of highest and lowest rates.

5. Foreign exchange rates in Sweden 1658–1803 277
Table A5.19. Monthly exchange rates on Gdańsk fl orin/gulden/złoty (= 30 grosz) in marks kopparmynt 1740–76 (not spot rates).
Year Jan Feb Mar Apr May June July Aug Sept Oct Nov Dec
1740 9 9. 5 9.5 9.5 9.5 9.5
1741 9.5 9.5 9.5 9.5 9.5 9.438 9.438 9.438 9.5 9.625 9.75 10
1742 10 9.75 9.75
1743 9.75 9 9.625 9.875 10.5 10.25 11.25
1744 11 10.75 10.75
1745 9.75
1746 9.75 9.75 9.75 11.5 11.5 11.5
1747
1748 12 12 12 12 12 11.38 11.38 11.5 11.5 11.5 11.5
1749 11.5 11.38 11.38 11.25 11.13 11.13 11.13 11.38
1750 11 11 11 11 11 10.75 10.5 10.5 10.5 10.25 10.25 10.13
1751 10 9.75 10 10 10 10 10 10 10
1752 9.875 9.563 9.5 9.5 9.375 9.375 9.25 9.25 9.625 9.375
1753 9.125 9.125 9.125 9.125 9 9.063 9.063 9
1754 9.25 9 9 9
1755 9 9
1756 9.5 9.5 9.5 9.5 9.5 9.5 9.5 9.5 9.5 9.5 9.5
1757 10.5
1758 12.63 12.63 12.25 12.25
1759 11.5 11.5 11.5 14
1760 14 14 14 14 12 12 13 14
1761 16 15.75 15 14.5 15 15 15 14 15.25
1762 16 19 19.25 21 22
1763 19 17
1764 17 15.5 16 16.25 15.5 15.5
1765 16 17 17
1766 13 14.56 12.88 12.88 12.88 12.88 12.88
1767 12.88 12.44 12 12 12 12.5 12
1768
1769
1770 11.5
1771 11
1772 11.5
1773 13.25 13
1774
1775 13.25
1776 14 11.38
Source: ‘Växelkurser å Stockholms börs. Primärtabeller (1705–)/1740–1803’ (Riksbankens arkiv). Th e monthly data are estimated as the median of highest and lowest rates.

Exchange rates, prices, and wages, 1277–2008278
Table A5.20. Monthly exchange rates on Swedish-Pomeranian taler courant in Swedish currency 1740–1800 (not spot rates).
Year Jan Feb Mar Apr May June July Aug Sept Oct Nov Dec
in marks kopparmynt
1740 28 27 27.5 27.5 27.5
1741 28.5 28.5 28.5 28.25 28 28.13 28.13 28.75 28.88 29.25 29.75 29.5
1742 30.5
1743 30.5 30
1744 32
1745 34.5 32
1746 29.25 29.25 29.25 33 33 33
1747
1748 34.88 35 35 35 33 32.75 32.5 32.5 33.25 33.63
1749 34 34 34 33 33 33.5
1750 33.75 33.5 32.75 32.5 32.5 32.5 32.5 32.5 32 30.5
1751 30.5 30.5 30.5 30 30 30 30 30 30
1752 27 28 27 25.25 26 26 28
1753 26.5 26.5 26 25.5
1754 26 26.5 26 26 26.75 26 25.63
1755 26 26.5 27
1756 28 28 28 28 28 28 28 27.5 27.5 27.75
1757 28.5 28.5 28.5 31.5
1758 48 42 41 34.5 33 33
1759
1760 32 31 28 27.5 27.5 29
1761 26.5 29.5 22 26
1762 23
1763 17.75 15.88 14
1764 16.5 13.38 14.5 15
1765 15.06 15 15
1766 49 49
in skilling banco
1788 36 35.5
1792 41.5
in skilling riksgälds
1799 44 48 48 48
1800 51 48 48
Source: ‘Växelkurser å Stockholms börs. Primärtabeller (1705–)/1740–1803’ (Riksbankens arkiv). Th e monthly data are estimated as the median of highest and lowest rates.

5. Foreign exchange rates in Sweden 1658–1803 279
Table A5.21. Th e exchange rate on Hamburg and Amsterdam 1658–1776.
Year Hamburg, 1 reichstaler banco in
marks kopparmynt
Premium
on Ham-
burg
bank
money
(%)
Amsterdam, 1 rijksdaalder cou-
rant in marks kopparmynt
Premium
on
Amster-
dam bank
money
(%)
Direct data (spot rates
1660-1685)
Esti-
mated
spot
rates
Direct data (spot rates
1660–85)
Esti-
mated
spot
ratesAver-
age
Low-
est
High-
est
Aver-
age
Low-
est
High-
est
1658 17 17.255
1659 17 17.255
1660 17.572 17.077 18.297 17.572 16.924 16.284 17.545 16.924 3.25
1661 18.258 17.672 18.548 18.258 17.768 17.081 18.297 17.768
1662 18.213 17.591 18.583 18.213 17.724 17.167 18.297 17.724
1663 18.857 18.177 20.302 18.857 18.628 18.051 19.839 18.628 3.25
1664 20.121 18.356 21.67 20.121 19.929 18.583 21.597 19.929 3.06
1665 20.866 19.375 21.555 20.866 20.465 20.09 21.095 20.465 3.06
1666 20.909 20.395 21.305 20.909 20.394 19.63 21.054 20.394
1667 20.767 19.187 21.555 20.767 20.171 19.692 20.302 20.171
1668 20.964 20.197 21.305 20.964 20.176 19.758 21.305 20.176
1669 20.61 20.302 21.095 20.61 20.044 19.313 20.702 20.044 3.65
1670 20.804 20.133 21.206 20.804 20.392 19.597 21.054 20.392
1671 21.003 20.592 21.206 21.003 20.026 19.613 20.905 20.026 3.88
1672 20.929 20.702 21.054 20.929 7.12 20.214 19.801 20.803 20.214 3.8
1673 20.984 20.512 21.206 20.984 20.446 20.051 21.206 20.446
1674 21.502 20.954 22.469 21.502 20.31 19.944 20.844 20.31 4.16
1675 22.708 21.964 24.062 22.708 20.895 20.302 21.711 20.895 3.66
1676 23.034 22.307 24.187 23.034 21.44 20.302 23.059 21.44 3.78
1677 24.661 23.731 25.566 24.661 23.599 22.721 24.563 23.599 3.96
1678 24.585 24.187 25.566 24.585 23.6 23.104 24.488 23.6 3.78
1679 25.934 24.312 27.77 25.934 25.017 23.226 26.769 25.017 4.16
1680 27.529 26.761 28.275 27.529 26.475 25.498 27.265 26.475 4.01
1681 26.354 24.993 28.072 26.354 25.316 23.606 27.07 25.316 3.58
1682 24.935 24.108 25.566 24.935 23.887 23.059 24.741 23.887 4.01
1683 24.884 23.983 25.372 24.884 23.616 22.601 24.359 23.616 4
1684 24.974 24.642 25.53 24.974 23.584 23.226 24.108 23.584 4.28
1685 24.854 24.488 25.239 24.854 23.371 23.037 23.964 23.371 4.25
1686 24.241 24.483 22.907 23.136 5.06
1687 25 25.25 10.21 24.252 24.495
1688 25 25.25 9.88 23.761 23.999 5.18
1689 25 25.25 10.12 23.432 23.666 5.47
1690 25 25.25 10.89
1691 25 25.25 10.73 23.376 23.609 5.42
1692 25 25.25 9.98 23.009 23.239 5.48
1693 25 25.25 9.6 23.572 23.808 7.38

Exchange rates, prices, and wages, 1277–2008280
Year Hamburg, 1 reichstaler banco in
marks kopparmynt
Premium
on Ham-
burg
bank
money
(%)
Amsterdam, 1 rijksdaalder cou-
rant in marks kopparmynt
Premium
on
Amster-
dam bank
money
(%)
Direct data (spot rates
1660-1685)
Esti-
mated
spot
rates
Direct data (spot rates
1660–85)
Esti-
mated
spot
ratesAver-
age
Low-
est
High-
est
Aver-
age
Low-
est
High-
est
1694 25 25.25 11.09 23.553 23.788 4.77
1695 25 25.25 12.67 23.925 24.164 4.83
1696 26.749 26.5 27 27.016 14.29 25.505 25.76 4.76
1697 26.685 26.25 27.25 26.952 13.98 26.216 26.478 4.96
1698 26.28 25 27.625 26.543 13.74 25.287 25.54 4.82
1699 24.625 24.5 24.75 24.871 13.57 23.495 23.73 5.17
1700 25.499 25.25 25.75 25.754 14.28 24.6 24.846 4.65
1701 24.749 24.5 25 24.996 13.39 24.247 24.489 4.73
1702 24.375 24.25 24.5 24.618 13.34 23.749 23.986 3
1703 26.209 24.5 26.875 26.471 15.1 24.855 23.875 25.875 25.103 2.81
1704 27.098 26.25 27.75 27.342 17.17 25.225 24.125 26.375 25.452 2.69
1705 27.311 27 27.75 27.557 18.8 25.872 25.5 26.25 26.105 3.27
1706 27.122 26.75 27.5 27.366 18.24 26.245 25.75 26.75 26.481 5.54
1707 26.998 26.75 27.5 27.241 17.56 25.875 25.75 26 26.107 5.62
1708 26.781 26.5 27 27.022 16.95 25.687 25.5 25.875 25.918 4.84
1709 27.299 26.5 28.75 27.545 16.78 26.921 26 27.875 27.163 4.83
1710 27.486 26.375 28.75 27.734 16.73 26.118 25.5 26.75 26.352 4.76
1711 26.711 26 27.75 26.951 16.71 25.367 24.75 26 25.596
1712 27.274 26.375 28 27.519 16.54 26.175 25.375 27 26.41
1713 26.608 25.5 28 26.847 17.28 26.58 26 27 26.819
1714 25.56 25 26 25.79 18.28 25.48 24.5 26.5 25.71 4.5
1715 25.793 25 27.5 26.025 19.7 23.979 23 25 24.195
1716 26.546 25 28.7526.785*
28.39**20.9 25.573 24 27.25
25.803*
27.35**
1717 33.952 29 39.7534.258*
38.37**24.72 32.473 27.75 38
32.765*
36.7**
1718 52.056 43.75 83.7552.525*
60.26**27.74 49.933 42 80
50.382*
57.8**4.59
1719 40.03 38 41 40.39 29.7 38.884 36 42 39.234
1720 36.289 36 37 36.615 28.33 35.123 34.75 35.5 35.439
1721 36.24 35 37 36.566 28.84 35.749 35.5 36 36.071
1722 36.616 35.25 37.25 36.945 29.53 35.999 35.75 36.25 36.323 5.25
1723 35.577 34.125 36.625 35.897 30.35 34.139 32.375 36 34.447 4.94
1724 35.209 34.125 36 35.526 31.35 34.242 33.5 35 34.55 4.57
1725 33.968 32 35.75 34.274 33.24 32.985 32 34 33.282 4.42
1726 33.552 32.5 34.5 33.854 16 32.606 31.5 33.75 32.899 4.88
1727 34.293 32.5 35.5 34.602 16 33.735 32.75 34.75 34.039 4.97
Table A5.21 (cont.) . Th e exchange rate on Hamburg and Amsterdam 1658–1776.

5. Foreign exchange rates in Sweden 1658–1803 281
Year Hamburg, 1 reichstaler banco in
marks kopparmynt
Premium
on Ham-
burg
bank
money
(%)
Amsterdam, 1 rijksdaalder cou-
rant in marks kopparmynt
Premium
on
Amster-
dam bank
money
(%)
Direct data (spot rates
1660-1685)
Esti-
mated
spot
rates
Direct data (spot rates
1660–85)
Esti-
mated
spot
ratesAver-
age
Low-
est
High-
est
Aver-
age
Low-
est
High-
est
1728 35.11 33.5 36 35.426 16 34.869 34.25 35.5 35.183 4.79
1729 34.806 34 35.5 35.119 16 34.227 33 35.5 34.535 4.77
1730 35.119 34.25 35.75 35.435 16 33.369 32.75 34 33.669 4.58
1731 34.933 34.25 35.5 35.247 16 33.496 33 34 33.798 4.52
1732 34.958 33.625 35.75 35.272 16 34.369 33.75 35 34.679 4.02
1733 35.308 34.75 35.875 35.626 16 34.623 34.25 35 34.934 3.8
1734 35.31 34.75 35.75 35.627 16 34.869 34.25 35.5 35.183 4.44
1735 35.369 34.75 36 35.688 16 34.992 34.25 35.75 35.307 4
1736 35.68 34.75 36.375 36.001 16 34.667 33.5 35.875 34.979 3.9
1737 36.028 35.5 36.5 36.352 16 34.936 34.625 35.25 35.25 4.02
1738 35.933 35.25 36.5 36.256 16.31 35.056 34.375 35.75 35.371 4.45
1739 36.305 35.25 37 36.632 17.48 34.996 34.5 35.5 35.311 5.11
1740 37.06 36 37.5 37.393 18.03 35.55 34.75 35.875 35.87 5.23
1741 37.86 36.75 41 38.201 17.49 36.44 35.375 39.5 36.768 4.64
1742 39.53 36.75 42 39.886 17.79 37.81 35.25 40 38.15 4.43
1743 40.48 37 44.25 40.844 18.85 38.74 35.75 42.5 39.089 4.8
1744 43.83 42 45.75 44.224 19.37 41.98 40 44 42.358 4.86
1745 43.57 40 47 43.962 20 41.75 38.25 45.25 42.126 4.93
1746 40 40 40 40.36 18.67 38.25 38.25 38.25 38.594 4.86
1747 44.23 40 47.5 44.628 16.5 43.11 38.25 46.25 43.498 4.65
1748 44.47 43.125 47.25 44.87 16.17 43.08 41.75 46 43.468 4.74
1749 43.45 42.25 44.75 43.841 17.05 41.53 40.5 42.75 41.904 4.64
1750 41.74 40 43.75 42.116 17.51 39.69 38.125 41 40.047 4.53
1751 40.28 39.25 41 40.642 17.68 37.92 37 38.25 38.261 4.88
1752 38 36 40 38.342 16.44 35.68 33.75 37.75 36.001 4.48
1753 37.99 37.5 38.75 38.332 17.34 35.75 35 36 36.072 4.63
1754 38.71 38.5 39 39.058 17.24 36.07 36 36.25 36.394 4.51
1755 38.63 37.5 40.75 38.978 17.56 36.33 36 39 36.657 4.18
1756 40.28 39 43 40.642 17.42 39.08 37.75 42.25 39.432 4.22
1757 43.84 40.25 49.75 44.234 11.7 44.7 40.25 50 45.102 3.76
1758 51.49 48.75 56.25 51.953 7.68 52.9 50.125 57.25 53.376 3.33
1759 49.55 47.25 55 49.996 8.02 51.89 50.25 56.25 52.357 2.27
1760 63.21 55 76 63.779 18.58 61.63 55.5 70 62.184 3.11
1761 72.04 67.75 75.75 72.688 24.83 67.41 63.75 70.75 68.016 4.53
1762 85.28 73 108 86.047 22.39 83.93 68.5 108 84.685 3.02
1763 81.82 73 94.5 82.556 23.85 80.43 71.5 93 81.154 2.36
Table A5.21 (cont.) . Th e exchange rate on Hamburg and Amsterdam 1658–1776.

Exchange rates, prices, and wages, 1277–2008282
Year Hamburg, 1 reichstaler banco in
marks kopparmynt
Premium
on Ham-
burg
bank
money
(%)
Amsterdam, 1 rijksdaalder cou-
rant in marks kopparmynt
Premium
on
Amster-
dam bank
money
(%)
Direct data (spot rates
1660-1685)
Esti-
mated
spot
rates
Direct data (spot rates
1660–85)
Esti-
mated
spot
ratesAver-
age
Low-
est
High-
est
Aver-
age
Low-
est
High-
est
1764 86.08 79 96 86.854 26.21 82.07 74 93 82.808 3.12
1765 88.87 79 94 89.669 21.44 81.69 76 90 82.425 3.76
1766 70.53 66.5 80 71.165 19.88 69.88 66.5 77 70.509 4.74
1767 56.42 42 66 56.928 17.72 56.41 41 66 56.917 4.76
1768 42 42 42 42.378 22.35 41.64 39.25 41.75 42.015 4.58
1769 42 42 42 42.378 24.6 41.59 39 41.75 41.964 4.87
1770 60.54 55 68 61.085 24.26 57.15 53 64 57.664 4.9
1771 62.93 60 65.5 63.496 24.64 59.41 57 61 59.944 4.88
1772 70.26 64 74.5 70.892 25.08 66.08 60 70 66.674 4.75
1773 80.23 73.5 82.5 80.952 24.71 76.88 69 79.5 77.572 4.66
1774 75.75 72 80.5 76.431 23.88 71.91 69 76 72.557 4.73
1775 69.3 68.25 72 69.923 21.88 65.72 65.25 68 66.311 4.7
1776 69.06 68.5 70 69.681 64.9 64 65.25 65.484 4.781
Underlined data = based on cross rates.Sources: See the main text. For 1660–85, the exchange rates on Hamburg and Amsterdam are esti-mated spot rates, based on bills of 8 days to 2 months, assuming an annual interest rate of 12.5 per cent, and the average calculated as the geometric average of the monthly data (see Table A5.5). To calculate spot rates for the period 1658–9 the direct data are increased by 1.5 per cent; for 1686–1703 the increase is 1 per cent. For 1704–77 the direct data is increased by 1.0567/365.* Estimated rates in proper coins 1716–18.** Estimated rate in coin tokens 1716–18.
Table A5.21 (cont.) . Th e exchange rate on Hamburg and Amsterdam 1658–1776.

5. Foreign exchange rates in Sweden 1658–1803 283
Table A5.22. Th e exchange rate on London and Paris 1658–1776.
Year London, 1 pound sterling in daler
kopparmynt
Paris, 1 livres tournois in marks
kopparmynt
Direct data Esti-
mated
spot
rates
Direct data (spot rates up to
1702)
Esti-
mated
spot
ratesAverage Lowest Highest Average Lowest Highest
1658 17.49 17.752
1659 18.197 18.47
1660 20.226 20.53
1661 21.137 21.454
1662
1663 21.206 21.525 6.914 6.914
1664 22.108 22.44 7.013 7.013
1665 22.026 22.356 7.043 7.043
1666 21.096 21.413
1667 21.81 22.137 7.151 7.151
1668 22.936 23.28 7.138 7.138 7.138 7.138
1669 22.517 22.855 7.138 7.138 7.138 7.138
1670 22.826 23.168 7.108 7.061 7.138 7.108
1671 22.921 23.265 7.108 7.069 7.209 7.108
1672 22.316 22.651 7.033 6.943 7.104 7.033
1673 21.487 21.809 7.018 6.901 7.069 7.018
1674 21.526 21.849 7.12 7.069 7.199 7.12
1675 23.315 23.665 7.286 7.188 7.405 7.286
1676 24.302 24.666 7.592 6.985 7.91 7.592
1677 26.424 26.82 8.259 8.079 8.498 8.259
1678 26.664 27.064 8.352 8.203 8.499 8.352
1679 26.235 26.628 8.477 8.203 8.71 8.477
1680 29.829 30.277 9.25 9.048 9.425 9.25
1681 28.784 29.216 8.939 8.415 9.425 8.939
1682 26.872 27.276 8.429 8.217 8.71 8.429
1683 26.556 26.954 8.327 8.021 8.469 8.327
1684 26.552 26.95 8.317 8.207 8.499 8.317
1685 26.831 27.234 8.31 8.243 8.415 8.31
1686
1687
1688
1689 25.869 26.182 8.294 8.294
1690 25.234 25.54
1691 25.39 25.698 7.302 7.302
1692 25.738 26.049 7.364 7.364
1693 24.711 25.01 7.191 7.191

Exchange rates, prices, and wages, 1277–2008284
Year London, 1 pound sterling in daler
kopparmynt
Paris, 1 livres tournois in marks
kopparmynt
Direct data Esti-
mated
spot
rates
Direct data (spot rates up to
1702)
Esti-
mated
spot
ratesAverage Lowest Highest Average Lowest Highest
1694 24 24.291 7.434 7.434
1695 22.224 22.493 7.332 7.332
1696 25.564 25.873 7.927 7.927
1697 29.253 29.607 7.732 7.732
1698 27.932 28.27 7.318 7.318
1699 25.846 26.159 6.882 6.882
1700 27.079 27.407 7.153 7.153
1701 26.985 27.312 6.875 6.875
1702 25.659 25.969 6.477 6.477
1703 26.351 26.67
1704 26.625 26.947
1705 27.25 26.875 27.625 27.58 7.222 7.111 7.333 7.31
1706 27.375 26.75 28 27.706 7.25 7.167 7.333 7.338
1707 28 27.75 28.25 28.339 7.333 7.167 7.5 7.422
1708 27.695 28.03 7.447 7.537
1709 27.624 27.959 7.583 7.675
1710 27.763 28.099 7.549 7.64
1711 27.483 27.815
1712 27.994 28.333
1713 28.281 28.623 6.263 6.339
1714 27.498 27.831 6.494 6.572
1715 27.972 28.311 7.936 8.032
1716 28.25628.598*
30.314**7.647
7.74*
8.2**
1717 35.45835.887*
40.193**10.02
10.14*
11.35**
1718 54.38155.039*
63.14**11.9
12.05*
13.82**
1719 42.695 43.212 7.229 7.317
1720 38.29 38.754 3.763 3.808
1721 38.262 38.725 5.55 5.617
1722 39.63 40.11 5.453 5.519
1723 37.957 38.417 5.105 5.166
1724 36.999 37.447 6.706 6.788
1725 35.611 36.042 8.078 8.176
1726 35.973 36.408 7.752 7.846
1727 37.25 36.5 38 37.701 7.256 7.343
Table 5.22 (cont.). Th e exchange rate on London and Paris 1658–1776.
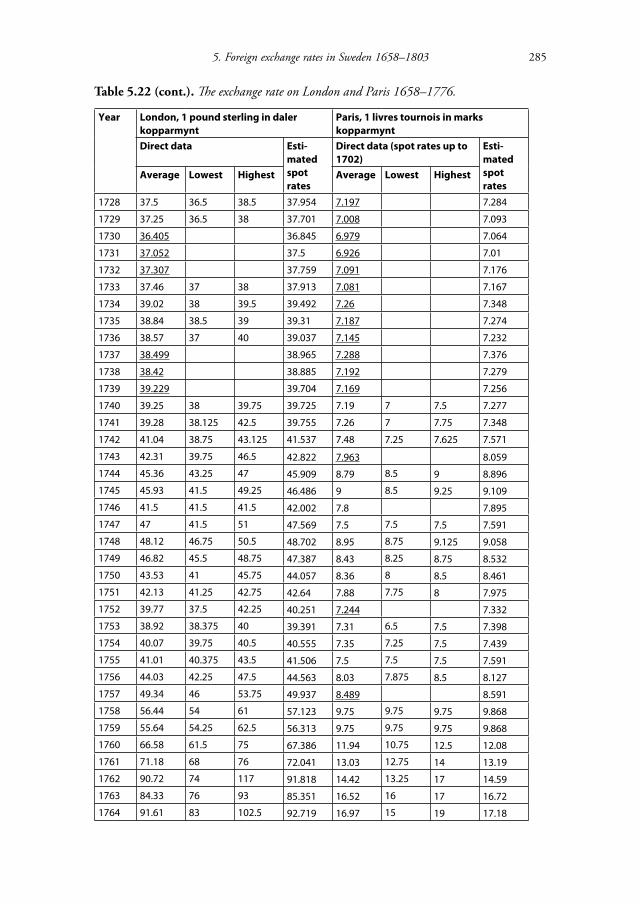
5. Foreign exchange rates in Sweden 1658–1803 285
Year London, 1 pound sterling in daler
kopparmynt
Paris, 1 livres tournois in marks
kopparmynt
Direct data Esti-
mated
spot
rates
Direct data (spot rates up to
1702)
Esti-
mated
spot
ratesAverage Lowest Highest Average Lowest Highest
1728 37.5 36.5 38.5 37.954 7.197 7.284
1729 37.25 36.5 38 37.701 7.008 7.093
1730 36.405 36.845 6.979 7.064
1731 37.052 37.5 6.926 7.01
1732 37.307 37.759 7.091 7.176
1733 37.46 37 38 37.913 7.081 7.167
1734 39.02 38 39.5 39.492 7.26 7.348
1735 38.84 38.5 39 39.31 7.187 7.274
1736 38.57 37 40 39.037 7.145 7.232
1737 38.499 38.965 7.288 7.376
1738 38.42 38.885 7.192 7.279
1739 39.229 39.704 7.169 7.256
1740 39.25 38 39.75 39.725 7.19 7 7.5 7.277
1741 39.28 38.125 42.5 39.755 7.26 7 7.75 7.348
1742 41.04 38.75 43.125 41.537 7.48 7.25 7.625 7.571
1743 42.31 39.75 46.5 42.822 7.963 8.059
1744 45.36 43.25 47 45.909 8.79 8.5 9 8.896
1745 45.93 41.5 49.25 46.486 9 8.5 9.25 9.109
1746 41.5 41.5 41.5 42.002 7.8 7.895
1747 47 41.5 51 47.569 7.5 7.5 7.5 7.591
1748 48.12 46.75 50.5 48.702 8.95 8.75 9.125 9.058
1749 46.82 45.5 48.75 47.387 8.43 8.25 8.75 8.532
1750 43.53 41 45.75 44.057 8.36 8 8.5 8.461
1751 42.13 41.25 42.75 42.64 7.88 7.75 8 7.975
1752 39.77 37.5 42.25 40.251 7.244 7.332
1753 38.92 38.375 40 39.391 7.31 6.5 7.5 7.398
1754 40.07 39.75 40.5 40.555 7.35 7.25 7.5 7.439
1755 41.01 40.375 43.5 41.506 7.5 7.5 7.5 7.591
1756 44.03 42.25 47.5 44.563 8.03 7.875 8.5 8.127
1757 49.34 46 53.75 49.937 8.489 8.591
1758 56.44 54 61 57.123 9.75 9.75 9.75 9.868
1759 55.64 54.25 62.5 56.313 9.75 9.75 9.75 9.868
1760 66.58 61.5 75 67.386 11.94 10.75 12.5 12.08
1761 71.18 68 76 72.041 13.03 12.75 14 13.19
1762 90.72 74 117 91.818 14.42 13.25 17 14.59
1763 84.33 76 93 85.351 16.52 16 17 16.72
1764 91.61 83 102.5 92.719 16.97 15 19 17.18
Table 5.22 (cont.). Th e exchange rate on London and Paris 1658–1776.

Exchange rates, prices, and wages, 1277–2008286
Year London, 1 pound sterling in daler
kopparmynt
Paris, 1 livres tournois in marks
kopparmynt
Direct data Esti-
mated
spot
rates
Direct data (spot rates up to
1702)
Esti-
mated
spot
ratesAverage Lowest Highest Average Lowest Highest
1765 92.06 83 101 93.174 17.2 16 18 17.41
1766 77.46 73 85 78.398 14.56 13.5 15 14.74
1767 60.41 45 72 61.141 13.24 12 13.5 13.4
1768 45.9 44.5 46.5 46.456 8.097 8.195
1769 42.207 42.718 7.996 8.093
1770 63.14 55.5 68 63.904 11 11 11 11.13
1771 63.96 61 66 64.734 11.88 12.03
1772 71.78 67 77 72.649 13.24 13.4
1773 85.78 67 88 86.818 14.5 14.5 14.5 14.68
1774 80.08 77 86.5 81.049 13.5 13 14.25 13.66
1775 72.71 71.75 76 73.59 12.8 12.38 13.125 12.95
1776 70.93 69.875 72.375 71.788 12.51 12.25 13.5 12.66
Underlined data = based on cross rates.Sources: See the main text. To calculate spot rates, the direct data are increased by 1.5 per cent for London in 1658–85, by 1.0590/365 for London in 1686–1703, and by 1.0590/365 for Paris and Lon-don in 1704–76. For Paris 1668–1685, see Table A5.12.* Estimated rates in proper coins 1716–18.** Estimated rate in coin tokens 1716–18.
Table 5.22 (cont.). Th e exchange rate on London and Paris 1658–1776.
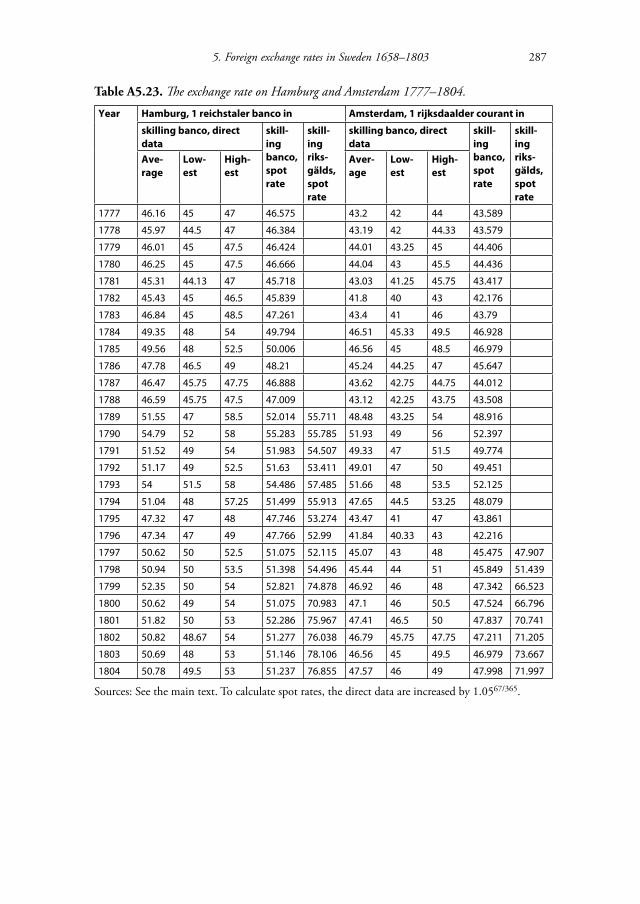
5. Foreign exchange rates in Sweden 1658–1803 287
Table A5.23. Th e exchange rate on Hamburg and Amsterdam 1777–1804.
Year Hamburg, 1 reichstaler banco in Amsterdam, 1 rijksdaalder courant in
skilling banco, direct
data
skill-
ing
banco,
spot
rate
skill-
ing
riks-
gälds,
spot
rate
skilling banco, direct
data
skill-
ing
banco,
spot
rate
skill-
ing
riks-
gälds,
spot
rate
Ave-
rage
Low-
est
High-
est
Aver-
age
Low-
est
High-
est
1777 46.16 45 47 46.575 43.2 42 44 43.589
1778 45.97 44.5 47 46.384 43.19 42 44.33 43.579
1779 46.01 45 47.5 46.424 44.01 43.25 45 44.406
1780 46.25 45 47.5 46.666 44.04 43 45.5 44.436
1781 45.31 44.13 47 45.718 43.03 41.25 45.75 43.417
1782 45.43 45 46.5 45.839 41.8 40 43 42.176
1783 46.84 45 48.5 47.261 43.4 41 46 43.79
1784 49.35 48 54 49.794 46.51 45.33 49.5 46.928
1785 49.56 48 52.5 50.006 46.56 45 48.5 46.979
1786 47.78 46.5 49 48.21 45.24 44.25 47 45.647
1787 46.47 45.75 47.75 46.888 43.62 42.75 44.75 44.012
1788 46.59 45.75 47.5 47.009 43.12 42.25 43.75 43.508
1789 51.55 47 58.5 52.014 55.711 48.48 43.25 54 48.916
1790 54.79 52 58 55.283 55.785 51.93 49 56 52.397
1791 51.52 49 54 51.983 54.507 49.33 47 51.5 49.774
1792 51.17 49 52.5 51.63 53.411 49.01 47 50 49.451
1793 54 51.5 58 54.486 57.485 51.66 48 53.5 52.125
1794 51.04 48 57.25 51.499 55.913 47.65 44.5 53.25 48.079
1795 47.32 47 48 47.746 53.274 43.47 41 47 43.861
1796 47.34 47 49 47.766 52.99 41.84 40.33 43 42.216
1797 50.62 50 52.5 51.075 52.115 45.07 43 48 45.475 47.907
1798 50.94 50 53.5 51.398 54.496 45.44 44 51 45.849 51.439
1799 52.35 50 54 52.821 74.878 46.92 46 48 47.342 66.523
1800 50.62 49 54 51.075 70.983 47.1 46 50.5 47.524 66.796
1801 51.82 50 53 52.286 75.967 47.41 46.5 50 47.837 70.741
1802 50.82 48.67 54 51.277 76.038 46.79 45.75 47.75 47.211 71.205
1803 50.69 48 53 51.146 78.106 46.56 45 49.5 46.979 73.667
1804 50.78 49.5 53 51.237 76.855 47.57 46 49 47.998 71.997
Sources: See the main text. To calculate spot rates, the direct data are increased by 1.0567/365.

Exchange rates, prices, and wages, 1277–2008288
Table A5.24. Th e exchange rate on London and Paris 1777–1804.
Year London, 1 pound sterling in Paris, 1 livres tournois (franc from 1795) in
riksdaler banco, direct
data
riks-
daler
banco,
spot
rate
riks-
daler
riks-
gälds,
spot
rate
skilling banco, direct
data
skill-
ing
banco,
spot
rate
skill-
ing
riks-
gälds,
spot
rate
Aver-
rage
Low-
est
High-
est
Aver-
age
Lowest High-
est
1777 3.835 3.688 3.938 3.881 8.27 8 8.75 8.3701
1778 3.948 3.854 4.01 3.9957 8.36 8.2 8.417 8.4612
1779 4.105 3.854 4.24 4.1549 8.23 7.917 8.417 8.3296
1780 4.089 3.99 4.229 4.1387 8.35 7.917 8.5 8.4511
1781 3.757 3.5 4.021 3.8028 8.16 7.5 8.333 8.2588
1782 3.713 3.656 3.771 3.7576 8.01 7.5 8.25 8.1069
1783 3.83 3.677 4.167 3.8761 8.21 7.75 9 8.3094
1784 4.382 4.229 4.792 4.4351 9.14 8.5 9.667 9.2506
1785 4.474 4.25 4.625 4.5281 8.64 8 9.333 8.7446
1786 4.238 4.083 4.438 4.2896 8.39 8.167 8.667 8.4915
1787 4.122 4.063 4.25 4.1718 8.19 7.833 8.5 8.2891
1788 4.179 4.125 4.281 4.2295 8.19 8 8.5 8.2891
1789 4.635 4.219 5.167 4.6909 8.54 8 9.167 8.6434
1790 5.113 4.792 5.333 5.1748 9.33 8.5 10 9.4429
1791 4.8 4.396 5.042 4.8585 8.33 7.833 9 8.4308
1792 4.492 4.333 4.667 4.5465 6.44 6 7.5 6.5179
1793 5.085 4.656 5.292 5.147 6.5 6 7 6.5787
1794 4.665 4.167 5.292 4.7213 7* 7 7 7.0847
1795 3.978 3.833 4.25 4.0263
1796 4.066 3.917 4.333 4.115
1797 4.618 4.333 5.104 4.6736 4.8834 9 9 9 9.1089
1798 4.833 4.833 4.833 4.8918 5.3253 9.949
1799 4.83 4.583 5 4.888 6.6383 8.5 8 9 8.6029 13.431
1800 4.054 3.938 4.25 4.1032 5.7667 13.036
1801 4.132 3.896 4.271 4.1817 6.1291 9.83 9.75 10 9.949 13.785
1802 4.209 4.146 4.323 4.2597 6.4131 8.9 8 10 9.0077 13.38
1803 4.268 3.917 4.5 4.3194 6.7727 8.87 8 10 8.9774 14.25
1804 4.565 4.333 4.75 4.62 6.9301 9.12 8.25 10 9.2304 13.846
Sources: See the main text. To calculate spot rates, the direct data are increased by 1.0590/365.* Bordeaux

5. Foreign exchange rates in Sweden 1658–1803 289
Unpublished sources
Riksarkivet (RA)
Börstorpssamlingen, vol. 85.Kammarkollegii, oordnade handlingar, no. 444.Riksarkivets ämnessamlingar, Handel och sjöfart, Ser. I, vol. 1 Järnhandel.Sandbergska samlingen, vol. O:1.
Riksbankens arkiv (RBA)
‘Växelkurser å Stockholms börs. Primärtabeller (1705–)/1740–1803’.Untitled volume with exchange rates 1804–89.
References
Attman, A (1983), Dutch Enterprise in the World Bullion Trade 1550–1800, Kungl. Vetenskaps- och Vitterhets-Samhället, Gothenburg.
Dalhede, C (2006), Handelsfamiljer på stormaktstidens Europamarknad. 4, Viner, kvinnor, kapital: en 1600-talshandel med potential? Fjärrhandelsfamiljerna Jeroni-mus Möller i Lübeck och Sibrant Valck i Göteborg, Warne förlag, Partille.
van Dillen, J G (1934), ‘Th e Bank of Amsterdam’, in Van Dillen, J G (ed.), History of the Principal Public Banks, Th e Hague.
Flandreau, M, C Galimard, C Jobst, and P Marco (2006), Th e Bell Jar: Interest Rates Between Two Revolutions, 1688–1789, http://coursenligne.sciences-po.fr/marc.fl andreau/fi chiers_articles/BELLJAR_draft121.pdf (2007-07-28).
Flandreau, M, and F Zumer (2004), Th e Making of Global Finance 1880–1913, OECD, Paris.
Friis, A, and K Glamann (1958), A History of Prices and Wages in Denmark 1660–1800, vol. 1, Institute of Economics and History, Copenhagen.
Furtak, T (1935), Ceny w Gdańsku w latach 1701-1815, Skład Glówny, Lwów.Hansson, G (2009), ‘Priser på spannmål i Jämtland och Härjedalen 1648–1721’,
http://www.ekhistmotet09.ekhist.uu.se/fi ledownload.php?id=116 (2009-03-28).Hayes, R (2001 [1740]), Th e negociator’s magazine: or the most authentick account yet
published of the monies, weights, and measures of the principal places of the world, Facsimile reprint, Elibron Classics.
Heckscher, E (1934), ‘Th e bank of Sweden in its connection with the bank of Am-sterdam’, in Van Dillen, J G (ed.), History of the Principal Public Banks, Th e Hague.
Heckscher, E (1935–49), Sveriges ekonomiska historia från Gustav Vasa, vol. I:1, I:2, II:1 and II:2, Bonnier, Stockholm.
Lagerqvist, L, and E Nathorst-Böös (1968), Mynt, Bokförlaget PAN/Norstedts, Stockholm.
Exchange rates, prices, and wages, 1277–2008290
Lobell, H (2000), Växelkurspolitik och marknadsintegration: De utländska växelkurser-na i Sverige 1834–1880, Almqvist & Wiksell International, Lund.
Mayhew, N (1999), Sterling: Th e History of a Currency, Wiley, New York.McCusker, J (1978), Money and Exchange in Europe and America, 1600–1775: A
Handbook. Kingsport Press, Kingsport, Tennessee.Montgomery, A (1920), ‘Riksbanken och de valutapolitiska problemen, 1719–1778’
in Sveriges riksbank 1668–1918: bankens tillkomst och verksamhet, vol. III, Nor-stedts, Stockholm.
Posthumus, N W (1946), Inquiry into the History of Prices in Holland, vol. I, E.J. Brill, Leiden.
Quinn, S, and W Roberds (2006), An Economic Explanation of the Early Bank of Am-sterdam, Debasement, Bills of Exchange, and the Emergence of the First Central Bank, Federal Reserve Bank of Atlanta, Working Paper Series, 2006-13, http://www.frbatlanta.org/fi lelegacydocs/wp0613.pdf (2007-08-04).
Redish, A (1994), ‘Th e Latin Monetary Union and the emergence of the internation-al gold standard’ in Bordo, M, and F Capie (eds.), Monetary Regimes in Transition, Cambridge University Press, Cambridge.
Shaw, W (1895), Th e History of Currency, Wilsons & Milne, London.Sjöstrand, E (1908), Mynt- och bankpolitik under hattväldet 1738–1764, Almqvist &
Wiksells Boktryckeri, Uppsala.Smith, A (1999 [1776]), Th e Wealth of Nations, Books IV-V, Penguin Books.
Internet resources
‘Allen - Unger Database: European Commodity Prices 1260–1914’, http://www2.history.ubc.ca/unger/htm_fi les/new_grain.htm (2007-06-17).