Á ALT+0193á ALT+0225 É ALT+0201é ALT+0233 Í ALT+0205í ALT+0237 Ó ALT+0211ó ALT+0243

AN
IN
N ALTERNATIV
5‐N THE WAT
VE RESTORAT
Tennessee D
‐alt REPORTAUGA RIV
TION APPROA
Department oDivision o
Septem
RT FOR GAVER WATE
ACH UNDER T
of Environmeof Water Reso
mber 16, 20
AP CREEK RSHED (06
THE LONG‐TE
ent and Conseources
19
6010103)
ERM VISION F
ervation
FOR TMDLs


Gap Creek 5‐alt Report TDEC/Water Resources
September 16, 2019 Page 1
Background.
EPA’s current Vision for the Clean Water Act (CWA) 303(d) program provides a more updated and collaborative framework for more efficient implementation of the program through the states. In particular, it encourages focusing attention on priority waters and acknowledges states have flexibility in using available tools beyond Total Maximum Daily Loads (TMDLs) to attain water quality restoration and protection. In the Integrated Reporting Guidance issued in 2016, EPA acknowledged the most effective method for achieving water quality standards for some water quality impaired segments may be through controls developed and implemented in advance of a TMDL. Alternative approaches designated in the Integrated Report as sub‐category 5‐alt—in advance of a TMDL—recognize that an alternative restoration approach may be more effective than TMDL reports in reaching the goal of re‐attaining support status for impaired waters. If an alternative restoration approach does not show progress in attaining water quality standards, the impaired segment will be reprioritized for TMDL development. In 2015, Tennessee developed a priority framework document outlining plans to implement prioritization of alternative restoration projects. In it, Tennessee has identified HUC‐12s with both nutrient‐impaired streams and source water protection areas. In keeping with Tennessee’s watershed approach and corresponding schedule, Tennessee considered Group 1 and Group 2 watersheds for alternative plans in FY‐2019. This report addresses Gap Creek in Subwatershed 060101030505 in the Watauga River Watershed (06010103).
HUC 10 HUC 12 IMPAIRED STREAM STREAM ID
0601010305 Boone Lake
060101030505 Gap Creek
Gap Creek
TN06010103008_0800
Table 1. Numbers and Names of HUCs and Nutrient‐Impaired Streams in the Report. HUC, Hydrologic Unit Code.
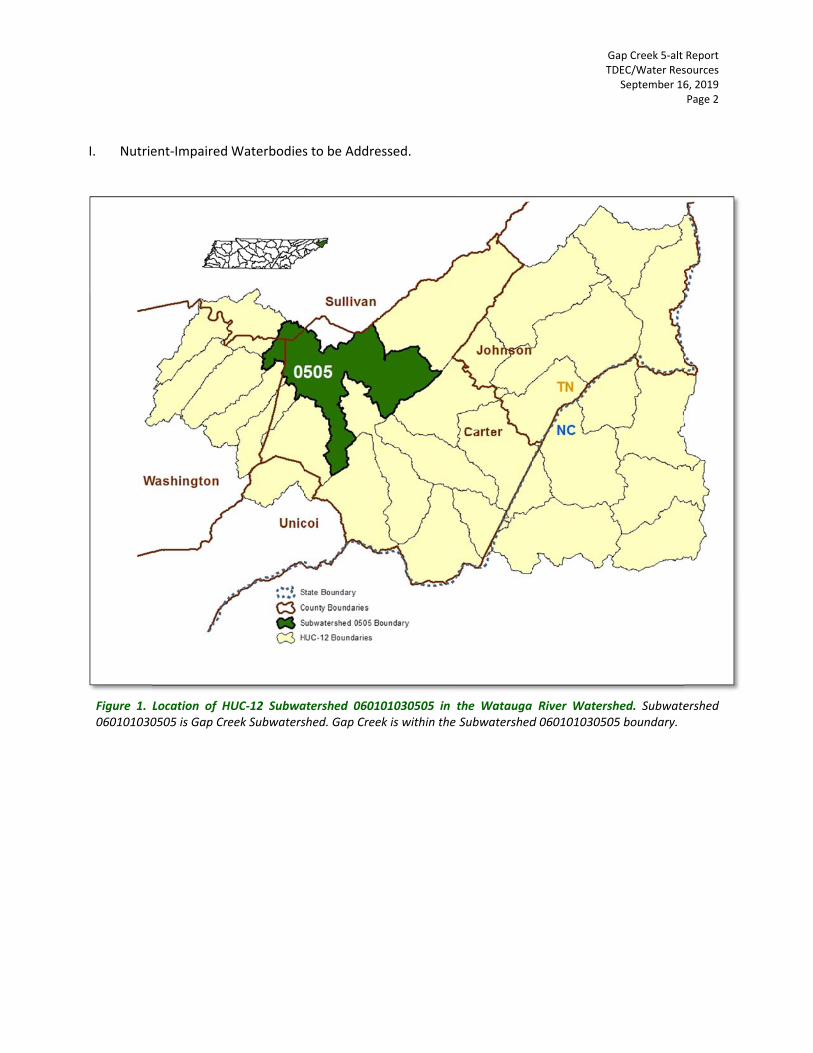
I. Nutrie
Figure 1. 060101030
ent‐Impaired
Location of H0505 is Gap Cre
Waterbodies
HUC‐12 Subwaeek Subwaters
s to be Addre
atershed 0601shed. Gap Cree
essed.
01030505 in ek is within the
the Watauga Subwatershed
GT
River Watersd 06010103050
Gap Creek 5‐alt TDEC/Water Res
September 16
shed. Subwate05 boundary.
Report sources 6, 2019 Page 2
ershed

SEGM
TN0601
Figure 2. I060101030
MENT NUMBE
10103008_08 Table 2. WImpaired S
Illustration of 0505. Only acti
ER
NAM
800 Gap C
Water QualityStreams (04/01
Nutrient‐Impaivities in Gap C
ME CO
Creek Ca
y Description 1/2018). Table
aired StreamsCreek will be ad
OUNTY MIL
arter 15.
of Gap Creeke 2 is the comp
and Source Wddressed in this
LES CAUS
.93
Nitrate(NitrateTMDL P
k in Subwaterlete listing of c
Water Protectiois report.
ES/TMDL PRI
s/Nitrite e + Nitrite as Priority: Low
rshed 0601010causes of impa
GT
on Area in HU
IORITY)
N) M(U
030505 from airment for Gap
Gap Creek 5‐alt TDEC/Water Res
September 16
UC‐12 Subwate
SOU
Municipal Urbanized Hig
Tennessee’s Lp Creek.
Report sources 6, 2019 Page 3
ershed
URCES
gh Density Ar
List of
ea)

II. Action Tennessethe Gap Reduction Point SouReferenceenrichmesources. informatio Figure 3. Leight HUC‐
n Plan that Ad
e is using botCreek subwan Framework
urces. Under ed Regressionnt factor (toNational Poon when sett
ocation of HU‐12s.
ddresses Poin
th a point soatershed. Ten(the Framew
the Framewons on Watersotal load divollutant Dischting permit lim
C‐10 Subwater
nt and Nonpo
urce and nonnnessee will work) to addre
ork, planningshed attributided by bacharge Eliminmits for nutrie
rshed 0601010
oint Sources.
npoint sourceuse the pro
ess these sou
is HUC‐10‐btes) nutrient kground loadnation Systements.
0305. Subwate
e (NPS) approocess describrces.
based and useloads to desd) and the pm (NPDES)
ershed 0601010
GT
oach for addrbed in the Te
es SPARROWcribe a procepercent contpermit writ
0305 is compo
Gap Creek 5‐alt TDEC/Water Res
September 16
essing nutrieennessee Nu
W‐derived (Spaess to calculatribution by ters consider
osed of
Report sources 6, 2019 Page 4
ents in utrient
atially ate an point r this

Figure 4. Idischarge hydroelect
Using datsubwater
Illustration of to Subwatershtric and their di
a from the USshed 060101
NPDES Permithed 06010103ischarges are r
SGS SPARROW0305 (Figures
t Locations in 30505 (TN0024river water (TN
W model, anas 5 and 6), no
HUC‐10 Subw4244, TN0023N0027545 and
alysis sheets hone of which d
watershed 06013515, TN00237TN0027553) so
have been credischarge to G
GT
1010305. Thre736). TVA pero will not be co
eated for theGap Creek dir
Gap Creek 5‐alt TDEC/Water Res
September 16
ee NPDES permrmitted facilitieonsidered furth
point sourcerectly.
Report sources 6, 2019 Page 5
mittees es are her.
es in

Figure 5. AFeet per SeGallons pebased on m
Based on in the Frabe necess
Analysis Sheet econd; DMR, Der Day; NA, Nomeasured flow,
the wastewaamework catesary.
for Total NitrDischarge Monot Applicable; S, not design flo
ater contributegorizes facili
rogen for NPDEitoring Report;STP, Sewage Tows. This data
tion (21.78%)ities in this H
ES Facilities in; EF, EnrichmeTreatment Planis presented fo
and the enriHUC‐10 as “Hi
n HUC‐10 Subwent Factor; ES,nt; UT, Unnamor informationa
ichment factoigh” for nitro
GT
watershed 060 Elementary Sc
med Tributary. Cal purposes on
or (2.76), the ogen, indicatin
Gap Creek 5‐alt TDEC/Water Res
September 16
01010305. CFS,chool; MGD, MCalculated loanly.
process descng reductions
Report sources 6, 2019 Page 6
, Cubic Million ads are
cribed s may

Figure 6. ACubic FeetMillion Galoads are bCreek is no
Based on in the Framay be ne These ana1) enrichmFramewowhich TDTennesse
Analysis Sheett per Second; Dallons per Day;based on meaot impaired for
the wastewaamework cateecessary.
alysis sheets ment factors rk. The analyDEC is in the e Valley Auth
t for Total PhDMR, Discharg; NA, Not Appsured flow, nophosphorus at
ater contributegorizes facil
act as a decisand 2) perceysis sheets inearly stages
hority (TVA) to
osphorus for ge Monitoring plicable; STP, Sot design flowst this time.
tion (38.6%) lities in this H
sion matrix anent contributndicate the ts of explorino explore the
NPDES FacilitiReport; EF, EnSewage Treatms. This data is
and the enricHUC‐10 as “H
nd help permion in the watrading poteng. In suppor feasibility of
ies in HUC‐10 nrichment Factment Plant; UTpresented for
chment factoHigh” for pho
mit writers estatershed usinntial betweenrt of that, TDf nutrient trad
GT
Subwatershetor; ES, ElemeT, Unnamed Tinformational
or (7.09), the osphorus, ind
tablish nutrieng the procesn point and DEC secured ding in the Te
Gap Creek 5‐alt TDEC/Water Res
September 16
ed 0601010305ntary School; Tributary. Calcl purposes only
process descdicating reduc
ent limits basss described inonpoint soua grant from
ennessee Vall
Report sources 6, 2019 Page 7
5. CFS, MGD,
culated y. Gap
cribed ctions
ed on in the urces, m the ey.

There aredischarge Figure 7. I12 SubwatRM 16.4. TCreek at mPollutant DCampbell Cplans are n
e three NPDE to Gap Creek
llustration of tershed 06010TN0023736 (Kemile 1.7. TN00Discharge ElimCreek is shownnot covered in
ES facilities thk.
Nutrient‐Impa01030505. TN0eenburg Eleme023515 (Elizabmination Systen to illustrate athis report.
hat discharge
aired Streams,0024244 (Johnentary School Sbethton STP) m; STP, Sewall nutrient‐imp
e within the 0
Source Waterson City‐BrushSTP) dischargedischarges to ge Treatment paired streams
0505 HUC‐12
r Protection Ah Creek WWTPes to UnnamedWatauga Riv
t Plant; WWTPin Subwatersh
GT
2 Subwatersh
Area, and NPDP) discharges td Tributary at mver at RM 24.P, Waste Wathed 060101030
Gap Creek 5‐alt TDEC/Water Res
September 16
hed; none of
ES Facilities into Watauga Rimile 0.2 to Cam.3. NPDES, Nater Treatment005. Implemen
Report sources 6, 2019 Page 8
them
n HUC‐iver at mpbell ational Plant.
ntation

Gap Creek 5‐alt Report TDEC/Water Resources
September 16, 2019 Page 9
Keenburg Elementary School is a minor discharger, so under Tennessee’s Framework is not being considered for revised permit limits. The remaining two permits will expire in 2021 and the SPARROW Analysis sheets will be considered when establishing nitrogen and phosphorus limits. Currently, nitrogen and phosphorus NPDES permit requirements are:
PERMIT NUMBER PERMITTEE NITROGEN PHOSPHORUS
TN0024244 Johnson City‐Brush Creek WWTP* Report Only Report Only
TN0023515 Elizabethton STP* Report Only Report Only Table 3. Summary of Nitrogen and Phosphorus Requirements for Select NPDES Facilities in HUC 12‐Subwatershed 060101030505. *Sample Type: Composite; Frequency: Quarterly; Statistical Base: Daily Maximum. STP, Sewage Treatment Plant; WWTP, Waste Water Treatment Plant. In addition, Tennessee is always evaluating if a facility would be a good candidate for plant optimization, the process by which waste water treatment plants develop standard operating procedures for optimizing nitrogen removal, phosphorus removal, and energy consumption. Tennessee has completed two rounds of plant optimization and plans to continue encouraging WWTPs to use this nutrient reduction approach. Both the Elizabethton STP and the Johnson City Brush Creek STP will evaluate the opportunities of biological nutrient removal in the next permit cycle. Nonpoint Sources. In rural areas of Tennessee, excess nutrients in streams are frequently due to several agricultural practices (mostly poor pasture management and livestock access to the stream) and failing septic systems. Proper pasture management has been known to improve water quality for some time. In the USDA publication “Nutrient Management in Pastures and Haylands,” authors Wood, et al. argue for the judicious use of nutrients in managing the nation’s pastures and haylands. The Land and Water Stewardship Section (LWSS) within the Tennessee Department of Agriculture (TDA), administers the Section 319 Nonpoint Source Program and the state‐funded Agricultural Resources Conservation Fund Program to assist landowners who wish to install Best Management Practices (BMPs). In the Watauga River’s Gap Creek Subwatershed 060101030505, practices installed by stakeholders were all United States Department of Agriculture, Natural Resources Conservation Service (USDA‐NRCS)‐approved practices designed to reduce sediment and nutrients. Two grants totaling over $85,000 have been awarded to stakeholders in this watershed. The initial 319‐funded Gap Creek Restoration project was led by the Boone Lake Partnership, Inc. (Boone Partnership), whose members are stakeholders from municipalities, businesses, watershed groups, state and federal agencies, universities, local educators, conservation groups, and unaffiliated citizens. The Boone Partnership built the initial project on the EPA guidance manual for illicit stormwater detection and elimination. Stakeholders used the Stream Corridor Assessment Survey (the survey) as a tool to identify restoration opportunities. The survey was also used to collect information on the general condition of both in‐stream and riparian corridor habitats, as well as healthy stream sections that may be in need of environmental protection.
Gap Creek 5‐alt Report TDEC/Water Resources
September 16, 2019 Page 10
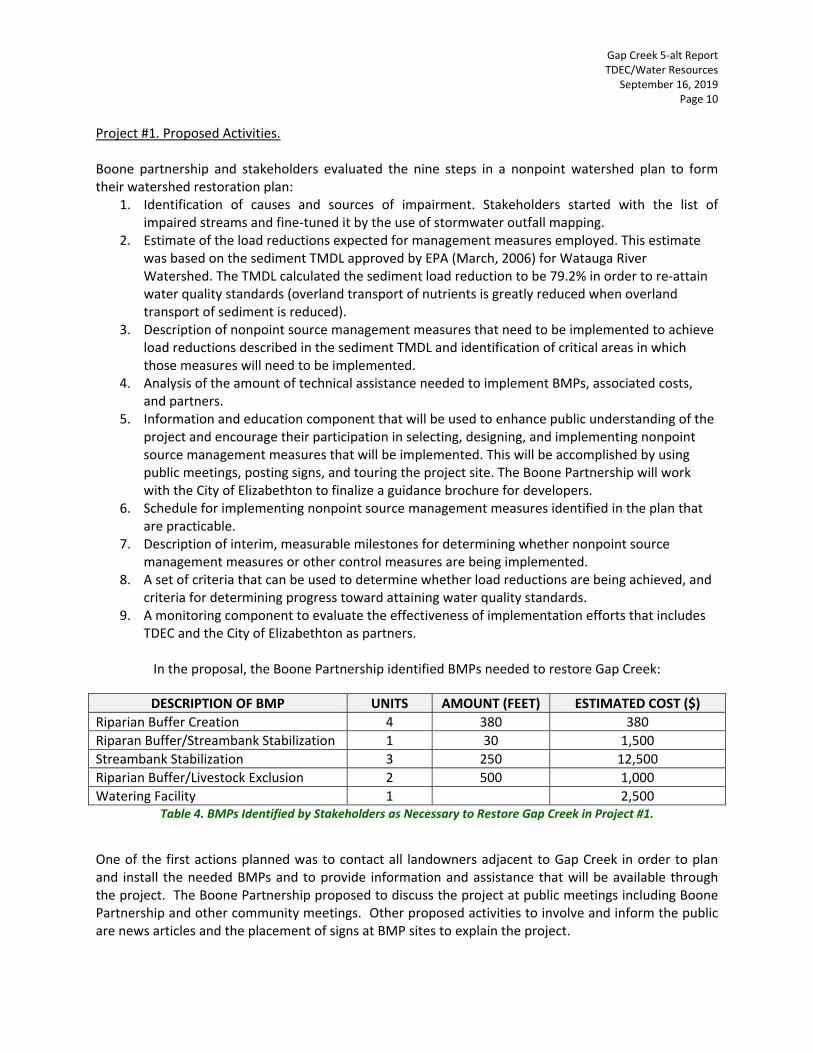
Project #1. Proposed Activities. Boone partnership and stakeholders evaluated the nine steps in a nonpoint watershed plan to form their watershed restoration plan:
1. Identification of causes and sources of impairment. Stakeholders started with the list of impaired streams and fine‐tuned it by the use of stormwater outfall mapping.
2. Estimate of the load reductions expected for management measures employed. This estimate was based on the sediment TMDL approved by EPA (March, 2006) for Watauga River Watershed. The TMDL calculated the sediment load reduction to be 79.2% in order to re‐attain water quality standards (overland transport of nutrients is greatly reduced when overland transport of sediment is reduced).
3. Description of nonpoint source management measures that need to be implemented to achieve load reductions described in the sediment TMDL and identification of critical areas in which those measures will need to be implemented.
4. Analysis of the amount of technical assistance needed to implement BMPs, associated costs, and partners.
5. Information and education component that will be used to enhance public understanding of the project and encourage their participation in selecting, designing, and implementing nonpoint source management measures that will be implemented. This will be accomplished by using public meetings, posting signs, and touring the project site. The Boone Partnership will work with the City of Elizabethton to finalize a guidance brochure for developers.
6. Schedule for implementing nonpoint source management measures identified in the plan that are practicable.
7. Description of interim, measurable milestones for determining whether nonpoint source management measures or other control measures are being implemented.
8. A set of criteria that can be used to determine whether load reductions are being achieved, and criteria for determining progress toward attaining water quality standards.
9. A monitoring component to evaluate the effectiveness of implementation efforts that includes TDEC and the City of Elizabethton as partners.
In the proposal, the Boone Partnership identified BMPs needed to restore Gap Creek:
DESCRIPTION OF BMP UNITS AMOUNT (FEET) ESTIMATED COST ($)
Riparian Buffer Creation 4 380 380
Riparan Buffer/Streambank Stabilization 1 30 1,500
Streambank Stabilization 3 250 12,500
Riparian Buffer/Livestock Exclusion 2 500 1,000
Watering Facility 1 2,500 Table 4. BMPs Identified by Stakeholders as Necessary to Restore Gap Creek in Project #1.
One of the first actions planned was to contact all landowners adjacent to Gap Creek in order to plan and install the needed BMPs and to provide information and assistance that will be available through the project. The Boone Partnership proposed to discuss the project at public meetings including Boone Partnership and other community meetings. Other proposed activities to involve and inform the public are news articles and the placement of signs at BMP sites to explain the project.

Gap Creek 5‐alt Report TDEC/Water Resources
September 16, 2019 Page 11
The Boone Lake Partnership planned several educational opportunities for stakeholders:
EDUCATIONAL EVENT QUANTITY BUDGET ESTIMATE ($)
Public Outreach 1 550
Media Materials (Brochures, flyers, publications)
1
500
Signage for BMP sites 2 1,000
BMP Tour 1 800
Technical and Administrative Assistance 4,000 Table 5. Educational Events Conducted by Stakeholders in Project #1.
Project #1. Accomplishments (11/01/2009‐10/03/2013). The primary focus of on‐the‐ground activities was for portions of HUC‐12 Subwatershed 060101030505 with agricultural, residential, and industrial land uses. In the first year, a team composed of the Boone Partnership, City of Elizabethton stormwater department, NRCS, TDEC, TVA, and land owners conducted field trips to identify potential projects. The team then approached land owners with riparian projects (stream bank stabilization or restoration) that had an added benefit of protecting septic tank field lines in a nearby trailer park from eroding stream banks. The fact that the restoration team was a mix of agency and stakeholders helped with obtaining contracts with landowners. Stream bank work using NRCS‐approved methods was conducted at eleven sites where landowners, Boone Partnership, and volunteers identified need. Activities included:
Restoring riparian zones with native plants
Sloping and terracing eroded stream banks
Stabilizing stream banks with rocks and root wads (successful in protecting septic field lines)
MILESTONE COMPLETED
Secure Technical Assistance √Initiate/Coordinate Monitoring (with TDEC) √ Complete Initial Public Outreach √ Develop/Distribute Educational Materials √ Complete Planning and Engineering Designs √ Install BMPs √ Install Signs at BMP Sites √ Guidance brochure for developers √Conduct Final Public meeting and Tour of BMPs √
Table 6. Tasks and Status of Boone Lake Partnership‐Led Project #1.
Boon
Boon
TVA
TDEC
TDA
Land
Land
City o
City o
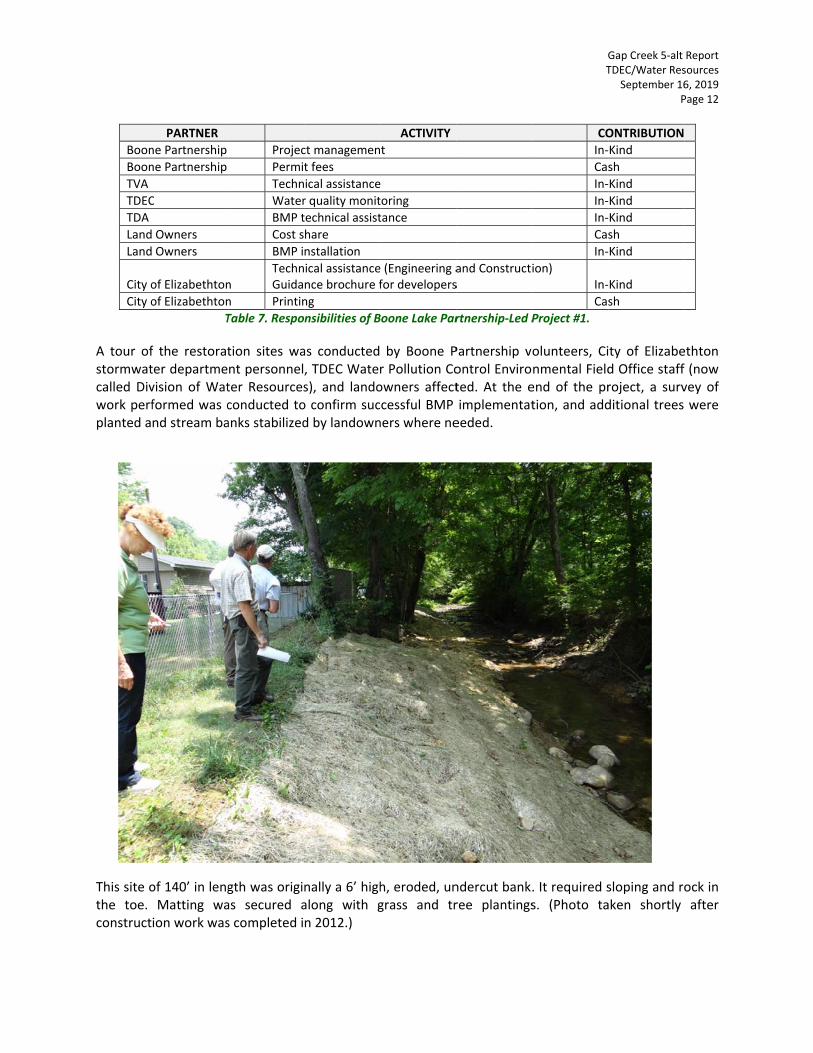
A tour ofstormwatcalled Divwork perfplanted a This site othe toe. construct
PARTNER
ne Partnership
ne Partnership
C
Owners
Owners
of Elizabethton
of Elizabethton
T
f the restoratter departmevision of Watformed was cnd stream ba
of 140’ in lengMatting waion work was
Projec
Permit
Techn
Water
BMP t
Cost s
BMP i
n TechnGuida
n Printin
Table 7. Respo
tion sites want personnelter Resourcesconducted toanks stabilized
gth was origias secured as completed i
ct managemen
t fees
ical assistance
r quality monit
technical assist
hare
nstallation
ical assistancence brochure f
ng
nsibilities of B
as conducted, TDEC Waters), and landoo confirm sucd by landown
nally a 6’ highalong with gn 2012.)
ACTIVITY
t
e
toring
tance
e (Engineering afor developers
Boone Lake Par
by Boone Pr Pollution Coowners affectcessful BMP ners where ne
h, eroded, ungrass and tr
and Constructis
rtnership‐Led P
Partnership voontrol Enviroted. At the eimplementateeded.
ndercut bank.ree plantings
GT
CO
In‐
Cas
In‐
In‐
In‐
Cas
In‐
ion) In‐
Cas
Project #1.
olunteers, Cinmental Fieldend of the prtion, and add
. It required ss. (Photo ta
Gap Creek 5‐alt TDEC/Water Res
September 16P
ONTRIBUTION
Kind
sh
Kind
Kind
Kind
sh
Kind
Kind
sh
ty of Elizabed Office staff roject, a survditional trees
sloping and roaken shortly
Report sources 6, 2019 Page 12
ethton f (now vey of were
ock in after

This site otree plant Section of
of 25’ in lengttings.
f the restored
th was a 3’ hig
d streambank
gh, eroded, b
k showing tree
bank. It requir
e and other v
red sloping al
vegetation gro
GT
ong with mat
owth
Gap Creek 5‐alt TDEC/Water Res
September 16P
tting, grass an
Report sources 6, 2019 Page 13
nd
Gap Creek 5‐alt Report TDEC/Water Resources
September 16, 2019 Page 14
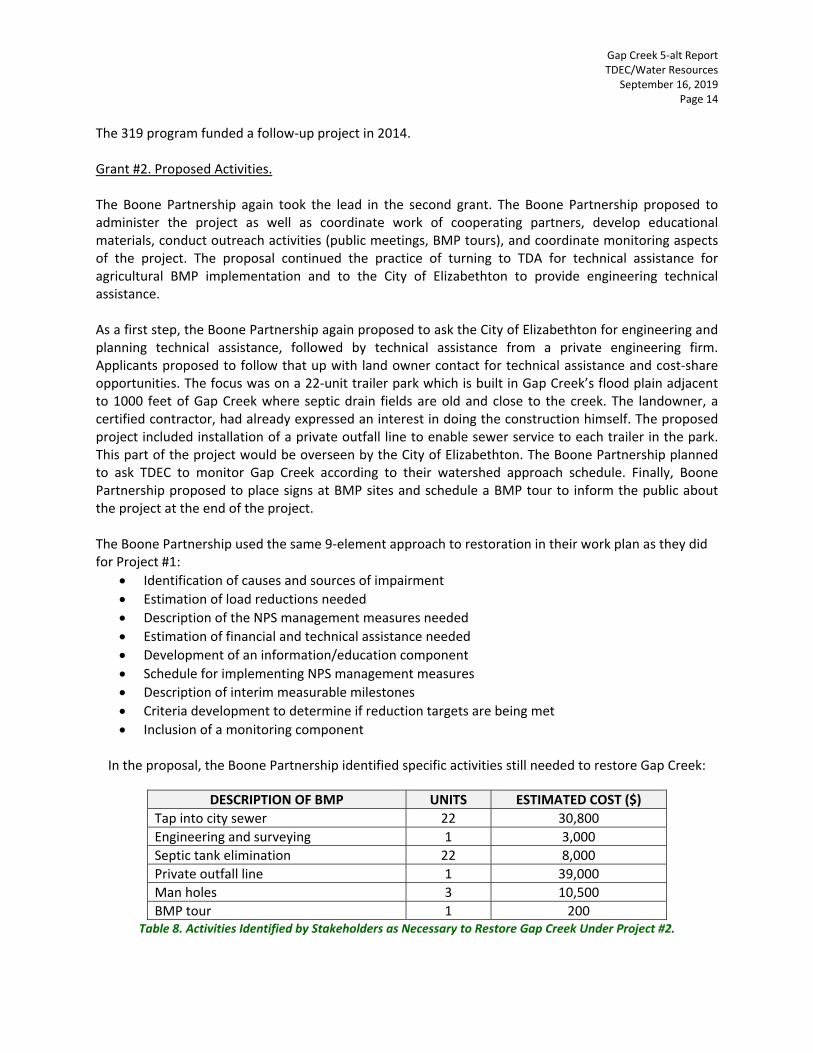
The 319 program funded a follow‐up project in 2014. Grant #2. Proposed Activities. The Boone Partnership again took the lead in the second grant. The Boone Partnership proposed to administer the project as well as coordinate work of cooperating partners, develop educational materials, conduct outreach activities (public meetings, BMP tours), and coordinate monitoring aspects of the project. The proposal continued the practice of turning to TDA for technical assistance for agricultural BMP implementation and to the City of Elizabethton to provide engineering technical assistance. As a first step, the Boone Partnership again proposed to ask the City of Elizabethton for engineering and planning technical assistance, followed by technical assistance from a private engineering firm. Applicants proposed to follow that up with land owner contact for technical assistance and cost‐share opportunities. The focus was on a 22‐unit trailer park which is built in Gap Creek’s flood plain adjacent to 1000 feet of Gap Creek where septic drain fields are old and close to the creek. The landowner, a certified contractor, had already expressed an interest in doing the construction himself. The proposed project included installation of a private outfall line to enable sewer service to each trailer in the park. This part of the project would be overseen by the City of Elizabethton. The Boone Partnership planned to ask TDEC to monitor Gap Creek according to their watershed approach schedule. Finally, Boone Partnership proposed to place signs at BMP sites and schedule a BMP tour to inform the public about the project at the end of the project. The Boone Partnership used the same 9‐element approach to restoration in their work plan as they did for Project #1:
Identification of causes and sources of impairment
Estimation of load reductions needed
Description of the NPS management measures needed
Estimation of financial and technical assistance needed
Development of an information/education component
Schedule for implementing NPS management measures
Description of interim measurable milestones
Criteria development to determine if reduction targets are being met
Inclusion of a monitoring component In the proposal, the Boone Partnership identified specific activities still needed to restore Gap Creek:
DESCRIPTION OF BMP UNITS ESTIMATED COST ($)
Tap into city sewer 22 30,800
Engineering and surveying 1 3,000
Septic tank elimination 22 8,000
Private outfall line 1 39,000
Man holes 3 10,500
BMP tour 1 200 Table 8. Activities Identified by Stakeholders as Necessary to Restore Gap Creek Under Project #2.

Gap Creek 5‐alt Report TDEC/Water Resources
September 16, 2019 Page 15
Landowners not involved in Project #1 were scheduled to be contacted to plan and install BMPs and to discuss financial and technical assistance available. The Boone Partnership proposed to engage stakeholders at public meetings, at Boone Partnership meetings, and in other community settings. Additional public involvement was proposed through news articles and signage at BMP sites explaining the project. Grant #2 Accomplishments (05/01/2014‐04/31/2017).
MILESTONE COMPLETED
Secure Technical Assistance (Landowner secured engineering firm to develop project design)
√
Initiate/Coordinate Monitoring (with TDEC) √ Complete Initial Public Outreach Meetings(Used contact list from Project #1)
√
Develop/Distribute Educational Materials(Used materials from Project #1)
√
Complete Planning and Engineering Designs √ Complete Septic System to Sewer Transition √Install BMPs √ Install Signs at BMP Sites √ Conduct Final Public Meeting and Tour of BMPs √
Table 9. Tasks and Status of Boone Partnership‐Led Project #2.
PARTNER ACTIVITY CONTRIBUTION
Boone Partnership Project management In‐Kind
TDEC Water quality monitoring In‐Kind
TDA BMP technical assistance In‐Kind
Land Owners Cost share Cash
Land Owners BMP installation In‐Kind
City of Elizabethton
Technical assistance (Engineering and Construction) Guidance brochure for developers
In‐Kind
Table 10. Responsibilities of Boone Partnership‐Led Project #2.
Septic system replacement in the trailer park was delayed for technical engineering reasons (the trailer park was not easily connected to the existing sewerage system). The solution was for the stakeholders to contract for a new main line on the opposite side of the trailer park and tie it into the city sewer system. Septic replacement was completed in April 2017 (note: this is after the most recent stream monitoring data were collected).
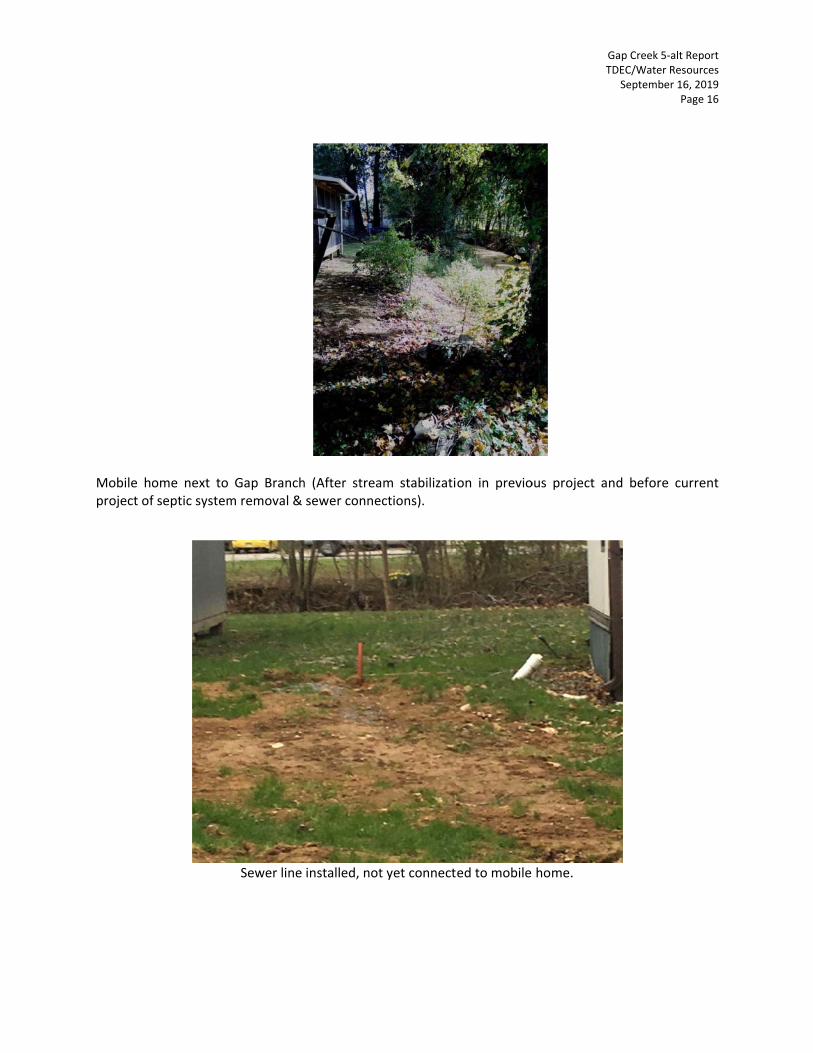
Mobile hoproject of
ome next tof septic system
Gap Branchm removal &
Sewer line
h (After streasewer conne
installed, not
am stabilizatiections).
t yet connect
on in previo
ed to mobile
GT
ous project a
home.
Gap Creek 5‐alt TDEC/Water Res
September 16P
nd before cu
Report sources 6, 2019 Page 16
urrent

Sewer line
Sewe
installed, not
er lines conne
t yet connect
ected to city s
ed to mobile
sewer system
GT
home.
m.
Gap Creek 5‐alt TDEC/Water Res
September 16P
Report sources 6, 2019 Page 17
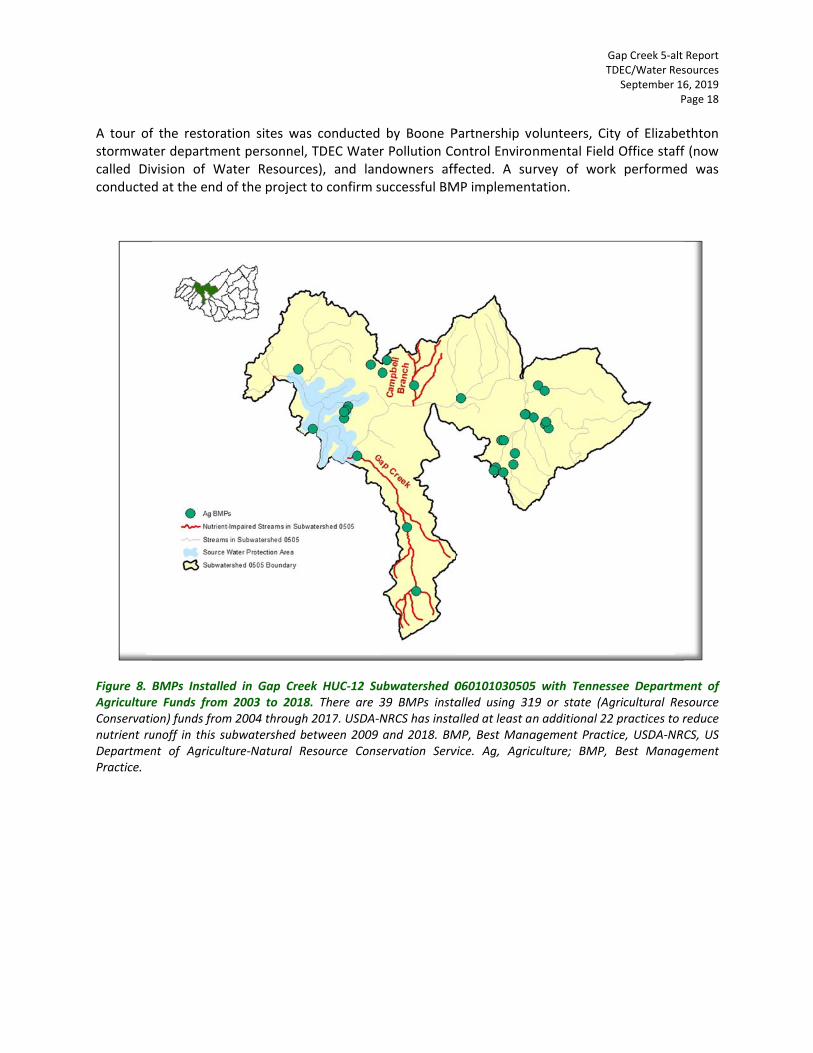
A tour ofstormwatcalled Divconducted Figure 8. AgricultureConservatinutrient ruDepartmenPractice.
f the restoratter departmevision of Wad at the end o
BMPs Installee Funds from ion) funds fromunoff in this sunt of Agricult
tion sites want personnelater Resourcof the project
ed in Gap Cre2003 to 2018
m 2004 throughubwatershed bture‐Natural R
as conducted, TDEC Waterces), and lant to confirm s
ek HUC‐12 Su8. There are 3h 2017. USDA‐Nbetween 2009Resource Cons
by Boone Pr Pollution Condowners affsuccessful BM
ubwatershed 039 BMPs instaNRCS has instaand 2018. BMservation Serv
Partnership voontrol Envirofected. A suMP implement
060101030505alled using 31alled at least aMP, Best Manavice. Ag, Agric
GT
olunteers, Cinmental Fieldrvey of wortation.
5 with Tennes19 or state (An additional 22agement Practculture; BMP,
Gap Creek 5‐alt TDEC/Water Res
September 16P
ty of Elizabed Office staff rk performed
ssee Departmegricultural Res2 practices to rtice, USDA‐NRCBest Manag
Report sources 6, 2019 Page 18
ethton f (now d was
ent of source reduce CS, US ement

Gap Creek 5‐alt Report TDEC/Water Resources
September 16, 2019 Page 19
CODE PRACTICE NUMBER UNITS
100 Comprehensive Nutrient Management Plan 2 Each
313 Waste Storage Facility 4 Each
340 Cover Crop 114.8 Acres
342 Critical Area Planting 2.3 Acres
360 Waste Facility Closure 1 Each
382 Fence 8849 Feet
390 Riparian Herbaceous Cover 12.5 Acres
484 Mulching 1.3 Acres
511 Forage Harvest Management 97.5 Acres
512 Forage and Biomass Planting 10 Acres
516 Livestock Pipeline 1916 Feet
528 Prescribed Grazing 29.7 Acres
561 Heavy Use Area Protection 0.1 Acres
578 Stream Crossing 1 Each
580 Streambank and Shoreline Protection 1700 Feet
584 Channel Bed Stabilization 50 Feet
590 Nutrient Management 178.8 Acres
614 Watering Facility 4 Each
620 Underground Outlet 1074 Feet
634 Waste Transfer 6 Each
666 Forest Stand Improvement 51.2 Acres
521D Pond Sealing or Lining, Compacted Clay Treatment 1 Each Table 11. Practices installed by NRCS in Subwatershed 060101030505 from 2004 to 2017.

Gap Creek 5‐alt Report TDEC/Water Resources
September 16, 2019 Page 20
The Tennessee Department of Agriculture has run EPA’s STEPL spreadsheet tool for BMPs implemented as part of 319 and Agricultural Resource Conservation Funds in Subwatershed 060101030505.
RUNOFF REDUCTIONS DUE TO BMPs
Nitrogen Phosphorus Sediment
1,042.3 lbs/yr 173.4 lbs/yr 77.1 tons/yr Table 12. Nitrogen, Phosphorus, and Sediment Reductions due to BMPs Calculated Using EPA STEPL Model. Additional reductions due to USDA‐NRCS‐implemented BMPs are not shown.
The 319 program continues to accept projects in Gap Creek Subwatershed. The next project submittal deadline is December 1, 2019.
Gap Creek 5‐alt Report TDEC/Water Resources
September 16, 2019 Page 21
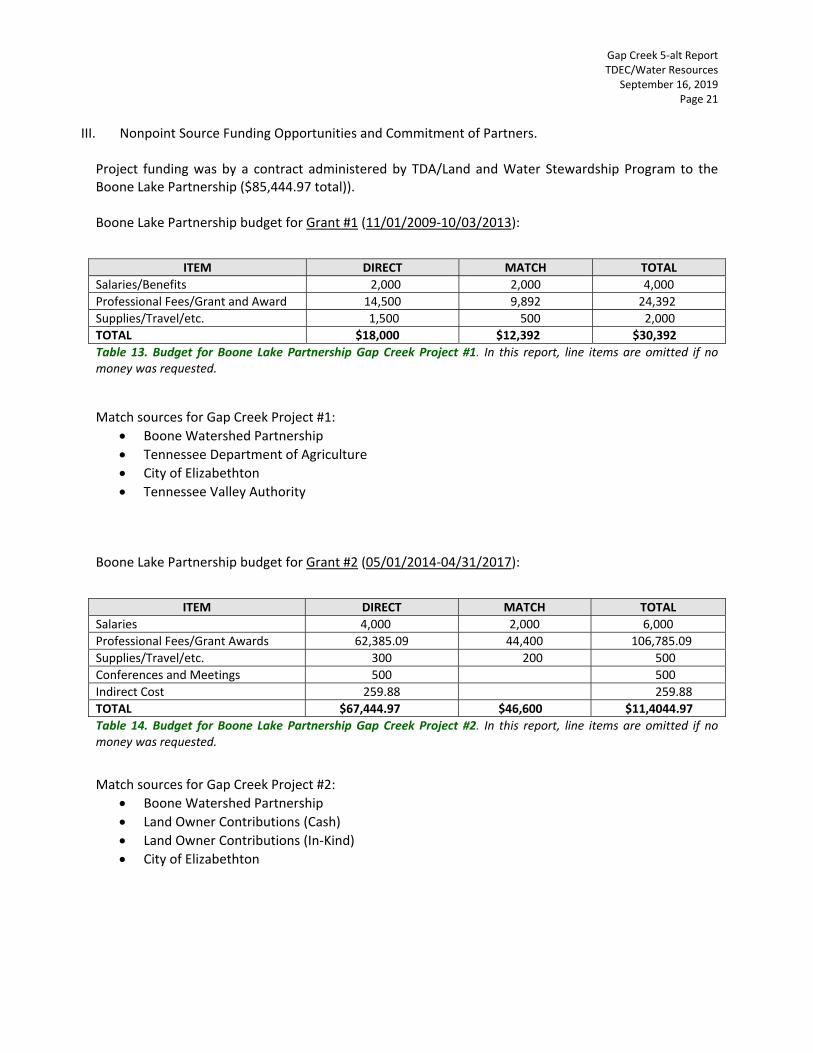
III. Nonpoint Source Funding Opportunities and Commitment of Partners.
Project funding was by a contract administered by TDA/Land and Water Stewardship Program to the Boone Lake Partnership ($85,444.97 total)). Boone Lake Partnership budget for Grant #1 (11/01/2009‐10/03/2013):
ITEM DIRECT MATCH TOTAL
Salaries/Benefits 2,000 2,000 4,000
Professional Fees/Grant and Award 14,500 9,892 24,392
Supplies/Travel/etc. 1,500 500 2,000
TOTAL $18,000 $12,392 $30,392
Table 13. Budget for Boone Lake Partnership Gap Creek Project #1. In this report, line items are omitted if no money was requested. Match sources for Gap Creek Project #1:
Boone Watershed Partnership
Tennessee Department of Agriculture
City of Elizabethton
Tennessee Valley Authority Boone Lake Partnership budget for Grant #2 (05/01/2014‐04/31/2017):
ITEM DIRECT MATCH TOTAL
Salaries 4,000 2,000 6,000
Professional Fees/Grant Awards 62,385.09 44,400 106,785.09
Supplies/Travel/etc. 300 200 500
Conferences and Meetings 500 500
Indirect Cost 259.88 259.88
TOTAL $67,444.97 $46,600 $11,4044.97
Table 14. Budget for Boone Lake Partnership Gap Creek Project #2. In this report, line items are omitted if no money was requested.
Match sources for Gap Creek Project #2:
Boone Watershed Partnership
Land Owner Contributions (Cash)
Land Owner Contributions (In‐Kind)
City of Elizabethton

Gap Creek 5‐alt Report TDEC/Water Resources
September 16, 2019 Page 22
IV. Date When Water Quality Standards are Expected to be Achieved. According to our watershed approach schedule, water quality assessment for the Watauga River Watershed, which includes the Gap Creek subwatershed, is scheduled for 2023. Comments from the most recent water quality assessment of Gap Creek (2019) do not include any discussion about stream improvements. The most recent data (see next section) shows a Tennessee Macroinvertebrate Index (TMI) score below passing (the score was 28 and passing is 32), had a low %EPT‐Cheum score (the score was 2.3 and a reference site value is expected to be greater than 43.5), and a nutrient tolerant score just failing (the score was 35.6 and a reference site value is expected to be less than 33.2). However, the site had a good habitat score (the score was 143 and passing is 132) suggesting that it could support a balanced benthic community. Gap Creek has shown improvement in chemistry—but not biology—in the last assessment. With enough time for the recently installed BMPs to make a difference, Gap Creek may come off the list of impaired waters in the 2023 assessment if the benthic macroinvertebrate community recovers. Alternatively—if the benthic community recovers by the 2023 assessment—Gap Creek may continue to be assessed as impaired for one more assessment cycle in order to confirm those assessment results.

V. Effect
tiveness Mon
Figure 9. Ill
itoring.
lustration of TDDEC Monitorin
ng Sites in HUCC‐12 Subwater
GT
rshed 0601010
Gap Creek 5‐alt TDEC/Water Res
September 16P
030505.
Report sources 6, 2019 Page 23
Gap Creek 5‐alt Report TDEC/Water Resources
September 16, 2019 Page 24
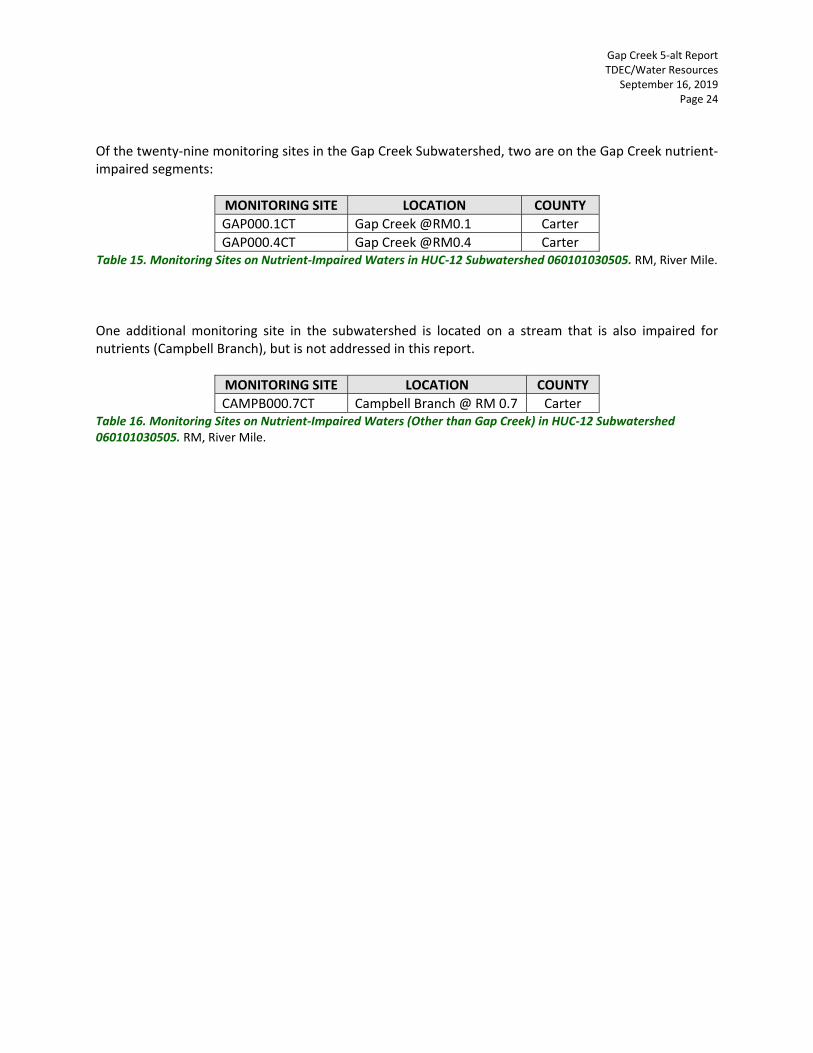
Of the twenty‐nine monitoring sites in the Gap Creek Subwatershed, two are on the Gap Creek nutrient‐impaired segments:
MONITORING SITE LOCATION COUNTY
GAP000.1CT Gap Creek @RM0.1 Carter
GAP000.4CT Gap Creek @RM0.4 Carter Table 15. Monitoring Sites on Nutrient‐Impaired Waters in HUC‐12 Subwatershed 060101030505. RM, River Mile.
One additional monitoring site in the subwatershed is located on a stream that is also impaired for nutrients (Campbell Branch), but is not addressed in this report.
MONITORING SITE LOCATION COUNTY
CAMPB000.7CT Campbell Branch @ RM 0.7 Carter Table 16. Monitoring Sites on Nutrient‐Impaired Waters (Other than Gap Creek) in HUC‐12 Subwatershed 060101030505. RM, River Mile.

Gap Creek 5‐alt Report TDEC/Water Resources
September 16, 2019 Page 25
Twenty‐six monitoring sites in the subwatershed are located on streams that are not impaired by nutrients:
MONITORING SITE LOCATION COUNTY
WATAU015.6WN Watauga River @ RM 15.6 Washington
WATAU015.6WNB Watauga River @ RM 15.6 Washington
WATAU015.6WNS Watauga River @RM 15.6 Washington
WATAU016.0WN Watauga River @ RM 16.0 Washington
WATAU016.4CT Watauga River @ RM 16.4 Carter
WATAU017.3CT Watauga River @ RM 17.3 Carter
WATAU020.1CT Watauga River @ RM 20.1 Carter
WATAU021.3CT Watauga River @ RM 21.3 Carter
WATAU023.4CT Watauga River @ RM 23.4 Carter
WATAU024.7CT Watauga River @ RM 24.7 Carter
WATAU025.1CT Watauga River @ RM 25.1 Carter
WATAU026.9CT Watauga River @ RM 26.9 Carter
WATAU028.3CT Watauga River @ RM 28.3 Carter
WATAU029.5CT Watauga River @ RM 29.5 Carter
WATAU031.0CT Watauga River @ RM 31.0 Carter
WATAU031.5CT Watauga River @ RM 31.5 Carter
WATAU032.5CT Watauga River @ RM 32.5 Carter
WATAU034.0CT Watauga River @ RM 34.0 Carter
WATAU034.0CTB Watauga River @ RM 34.0 Carter
WATAU034.6CT Watauga River @ RM 34.6 Carter
WATAU034.6CTB Watauga River @ RM 34.6 Carter
BSPRI000.2CT Big Spring @ RM 0.2 Carter
LICK000.9CT Lick Creek @ RM 0.9 Carter
DAVIS000.9CT Davis Creek @ RM 0.9 Carter
DAVIS002.0CT Davis Creek @ RM 2.0 Carter
DAVIS002.2CT Davis Creek @ RM 2.2 Carter Table 17. Additional Monitoring Sites in HUC‐12 Subwatershed 060101030505. RM, River Mile; WNB, Washington Bottom; WNT, Washington Surface.
Only monitoring sites that are on Gap Creek (Table 15) will be discussed in remainder of this report.

Monitorin Nitrogen
Figure 10.Monitoring
Figure 11.Monitoring
ng data from
Comparison g Seasons.
Comparison g Seasons. Num
m nutrient‐im
of Total Nitro
of Total Nitrombers indicate
mpaired wate
ogen at Gap
ogen at Gap e number of sa
rs in Gap Cre
Creek Monito
Creek Monitomples in the an
eek HUC‐12 S
oring Sites Bet
oring Sites Betnalysis (n).
GT
Subwatershe
tween 2005‐2
tween 2005‐2
Gap Creek 5‐alt TDEC/Water Res
September 16P
ed.
015 and 2016
015 and 2016
Report sources 6, 2019 Page 26
6‐2017
6‐2017

Figures 10monitorinthis obser Phosphor
Figure 12. Monitoring
Figure 13. Monitoring
0 and 11 illustng stations frorvation.
rus
Comparison og Seasons.
Comparison og Seasons. Num
trate that theom 2005‐201
of Total Phosp
of Total Phosphmbers indicate
ere were redu5 and 2016‐2
phorus at Gap
horus at Gap Ce number of sa
uctions in inst2017 sampling
p Creek Monito
Creek Monitorimples in the an
tream nitrogeg seasons. Mo
oring Sites Be
ing Sites Betwnalysis (n).
GT
en concentraore data are
etween 2005‐2
ween 2005‐2015
Gap Creek 5‐alt TDEC/Water Res
September 16P
tions at Gapneeded to co
2015 and 2016
5 and 2016‐20
Report sources 6, 2019 Page 27
Creek onfirm
6‐2017
017
Gap Creek 5‐alt Report TDEC/Water Resources
September 16, 2019 Page 28
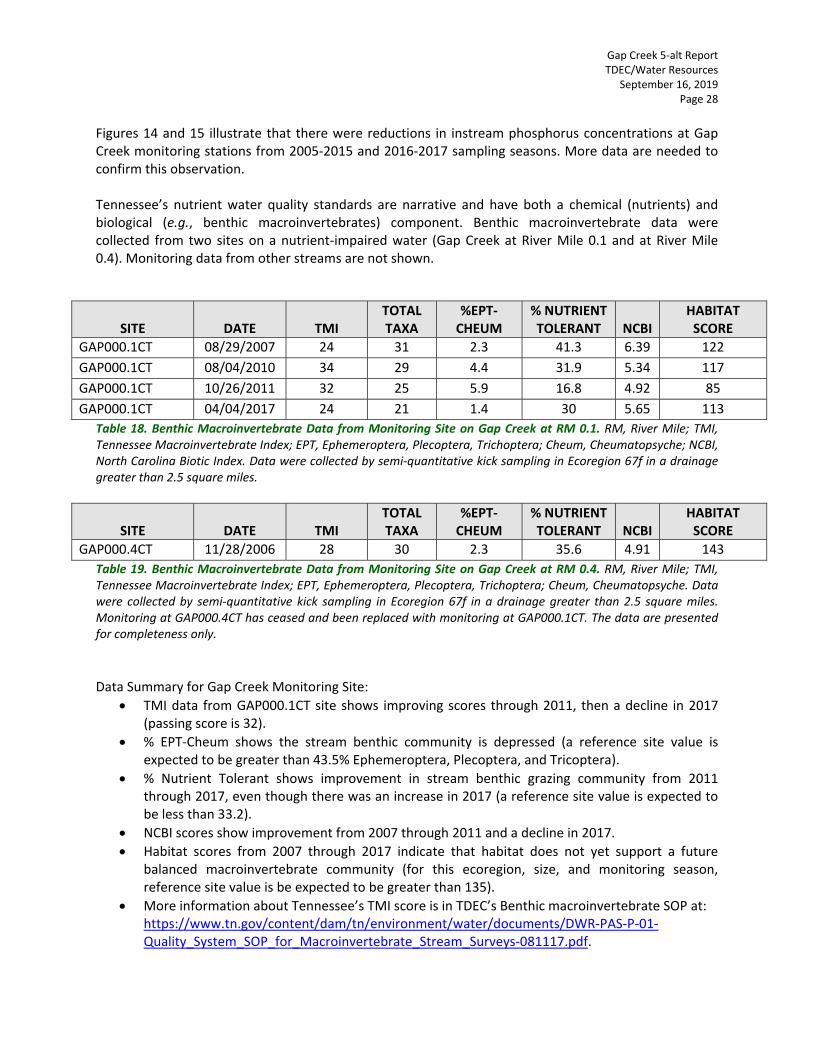
Figures 14 and 15 illustrate that there were reductions in instream phosphorus concentrations at Gap Creek monitoring stations from 2005‐2015 and 2016‐2017 sampling seasons. More data are needed to confirm this observation. Tennessee’s nutrient water quality standards are narrative and have both a chemical (nutrients) and biological (e.g., benthic macroinvertebrates) component. Benthic macroinvertebrate data were collected from two sites on a nutrient‐impaired water (Gap Creek at River Mile 0.1 and at River Mile 0.4). Monitoring data from other streams are not shown.
SITE
DATE
TMI
TOTAL TAXA
%EPT‐CHEUM
% NUTRIENT TOLERANT
NCBI
HABITAT SCORE
GAP000.1CT 08/29/2007 24 31 2.3 41.3 6.39 122
GAP000.1CT 08/04/2010 34 29 4.4 31.9 5.34 117
GAP000.1CT 10/26/2011 32 25 5.9 16.8 4.92 85
GAP000.1CT 04/04/2017 24 21 1.4 30 5.65 113
Table 18. Benthic Macroinvertebrate Data from Monitoring Site on Gap Creek at RM 0.1. RM, River Mile; TMI, Tennessee Macroinvertebrate Index; EPT, Ephemeroptera, Plecoptera, Trichoptera; Cheum, Cheumatopsyche; NCBI, North Carolina Biotic Index. Data were collected by semi‐quantitative kick sampling in Ecoregion 67f in a drainage greater than 2.5 square miles.
SITE
DATE
TMI
TOTAL TAXA
%EPT‐CHEUM
% NUTRIENT TOLERANT
NCBI
HABITAT SCORE
GAP000.4CT 11/28/2006 28 30 2.3 35.6 4.91 143
Table 19. Benthic Macroinvertebrate Data from Monitoring Site on Gap Creek at RM 0.4. RM, River Mile; TMI, Tennessee Macroinvertebrate Index; EPT, Ephemeroptera, Plecoptera, Trichoptera; Cheum, Cheumatopsyche. Data were collected by semi‐quantitative kick sampling in Ecoregion 67f in a drainage greater than 2.5 square miles. Monitoring at GAP000.4CT has ceased and been replaced with monitoring at GAP000.1CT. The data are presented for completeness only. Data Summary for Gap Creek Monitoring Site:
TMI data from GAP000.1CT site shows improving scores through 2011, then a decline in 2017 (passing score is 32).
% EPT‐Cheum shows the stream benthic community is depressed (a reference site value is expected to be greater than 43.5% Ephemeroptera, Plecoptera, and Tricoptera).
% Nutrient Tolerant shows improvement in stream benthic grazing community from 2011 through 2017, even though there was an increase in 2017 (a reference site value is expected to be less than 33.2).
NCBI scores show improvement from 2007 through 2011 and a decline in 2017.
Habitat scores from 2007 through 2017 indicate that habitat does not yet support a future balanced macroinvertebrate community (for this ecoregion, size, and monitoring season, reference site value is be expected to be greater than 135).
More information about Tennessee’s TMI score is in TDEC’s Benthic macroinvertebrate SOP at: https://www.tn.gov/content/dam/tn/environment/water/documents/DWR‐PAS‐P‐01‐Quality_System_SOP_for_Macroinvertebrate_Stream_Surveys‐081117.pdf.

Gap Creek 5‐alt Report TDEC/Water Resources
September 16, 2019 Page 29
Biological data indicate there was some improvement from 2007 through 2011 and that the poor benthic community may be the result of depressed habitat which is what the BMPs described in these projects are designed to address. Chemical data have shown an improvement over this same time period. It’s important to note that these data were collected as BMPs were being implemented, or shortly after some were implemented, suggesting that more time post‐BMP implementation is needed before additional improvement is documented. The next water quality assessment is scheduled for 2023.
VI. Current and Future Activities. The current 319 grant to the Boone Lake Partnership for work in Gap Creek Subwatershed has expired. The 319(h) program is accepting additional proposals designed to improve water quality in Gap Creek Subwatershed. Proposals for the next round of grants are due December 1, 2019. USDA‐NRCS continues to fund projects through the Environmental Quality Incentives Program (EQIP),
and other qualifying Farm Bill Conservation Title programs.
VIII. Further Information. For further information about TMDLs and 5‐alt documents in Tennessee, visit the TDEC/DWR web site: https://www.tn.gov/environment/program‐areas/wr‐water‐resources/watershed‐stewardship/tennessee‐s‐total‐maximum‐daily‐load‐‐tmdl‐‐program.html Technical questions regarding this 5‐alt report should be directed to:
David M. Duhl, Ph.D. Manager, Watershed Unit

Gap Creek 5‐alt Report TDEC/Water Resources
September 16, 2019 Page 30
LIST of INITIALS and ACRONYMS USED 303(d). Section 303(d) of the Clean Water Act that addresses impaired waters. ARCF. Agricultural Resources Conservation Fund. BMP. Best Management Practice. CFS. Cubic Feet per second. Cheum. Cheumatopsyche insect Genus. CWA. Clean Water Act. DMR. Discharge Monitoring Report. DWR. Division of Water Resources. EF. Enrichment Factor. EPA. Environmental Protection Agency. EPT. Ephemeroptera, Plecoptera, Trichoptera insect Orders. EQIP. Environmental Quality Incentives Program. ES. Elementary School. FY. Fiscal Year. HUC. Hydrologic Unit Code. HUC‐8, Eight‐Digit Hydrologic Unit Code. HUC‐10. Ten‐Digit Hydrologic Unit Code. HUC‐12. Twelve‐Digit Hydrologic Unit Code. LWSS. Land and Water Stewardship Section. MGD. Million Gallons per Day. NCBI. North Carolina Biotic Index.

Gap Creek 5‐alt Report TDEC/Water Resources
September 16, 2019 Page 31
NPDES. National Pollutant Discharge Elimination System. NA. Not Applicable. NPS. Nonpoint Source. STEPL. Spreadsheet Tool for Estimating Pollutant Load. USDA‐NRCS. Natural Resources Conservation Service. RC&D. Resource Conservation and Development. RFP. Request for Proposals. RM. River Mile. SCD. Soil Conservation District. SPARROW. Spatially Referenced Regression on Watershed attributes. STP. Sewage Treatment Plant. TDA. Tennessee Department of Agriculture. TDEC. Tennessee Department of Environment and Conservation. TMDL. Total Maximum Daily Load. TMI. Tennessee Macroinvertebrate Index. TVA. Tennessee Valley Authority. UD. Utility District. USDA. United States Department of Agriculture. UT‐Ext. University of Tennessee Extension. WECO. Call letters for a radio station in Wartburg, Tennessee. WWTP. Wastewater Treatment Plant.
Gap Creek 5‐alt Report TDEC/Water Resources
September 16, 2019 Page 32
REFERENCES CITED A Long‐Term Vision for Assessment, Restoration, and Protection under the Clean Water Act Section 303(d) Program” (December 2013) https://www.epa.gov/sites/production/files/2015‐07/documents/vision_303d_program_dec_2013.pdf
Illicit Discharge Detection and Elimination: A Guidance manual for Program Detection and Technical Assistance (2004). https://www3.epa.gov/npdes/pubs/idde_manualwithappendices.pdf. Tennessee Prioritization of TMDLs document under the New Vision https://www.tn.gov/content/dam/tn/environment/water/tmdl‐program/wr‐ws_tmdl‐priority‐framework‐101415.pdf TDEC Watershed Approach https://www.tn.gov/environment/program‐areas/wr‐water‐resources/watershed‐stewardship/watershed‐management‐approach.html C. Jerry Nelson (editor). Conservation Outcomes from Pastureland and Hayland Practices: Assessment, Recommendations, and Knowledge Gaps. Chapter 5: Nutrient Management on Pastures and Haylands (Wood, C.W., Moore, P.A., Joern, Brad C., Jackson, R.D., and Cabrera, M.L.). 2012. https://www.nrcs.usda.gov/Internet/FSE_DOCUMENTS/stelprdb1080496.pdf