5. all published paper
51
© 2010 WILEY-VCH Verlag GmbH & Co. KGaA, Weinheim Adv. Mater. 2010, 22, 3729–3734 3729 www.advmat.de www.MaterialsViews.com COMMUNICATION By Halei Zhai, Wenge Jiang, Jinhui Tao, Siyi Lin, Xiaobin Chu, Xurong Xu, and Ruikang Tang* Self-Assembled Organic–Inorganic Hybrid Elastic Crystal via Biomimetic Mineralization [*] H. Zhai, W. Jiang, J. Tao, S. Lin, X. Chu, Dr. X. Xu, Prof. R. Tang Center for Biomaterials and Biopathways and Department of Chemistry Zhejiang University Hangzhou, 310027 (P.R. China) E-mail: [email protected] Dr. X. Xu, Prof. R. Tang State Key Laboratory of Silicon Materials Zhejiang University Hangzhou, 310027 (P.R. China) DOI: 10.1002/adma.201000941 It is generally accepted that biomaterials have unique physi- cochemical properties. [1] Inspired by biological systems, sci- entists have been studying biomimetic methods to fabricate functional materials. [2] Almost all biomaterials possess a common multi-component feature. [1,3] These composites fre- quently have ordered organic–inorganic hybrid structures and their properties are distinct from the individual components. For example, in a multilayered complex of inorganic aragonite tablets and organic substrate, the fracture toughness of nacre is significantly improved to three thousand times greater than that of synthetic aragonite. [4] Another striking example is biological bone. In bone, the hydroxyapatite (HAP) phase crystallizes in the nanoscaled channels formed by the staggered alignment of the protein matrix. The typical HAP crystals in bone are plate-shaped with extremely thin thickness (1.5–2 nm), which is the smallest known dimension of the biologically formed crystals. [5] In nature the organic and inorganic components inti- mately associate into well-organized hybrid structures to ensure optimal strength and flexural stress. [6,7] Therefore, in biomi- metic designs and fabrications the formation of such ordered nanostructures is a key challenge. The formation of inorganic crystals in living organisms is regulated by the organic matrix. Generally, different organic templates and additives lead to variety in the morphology, size, orientation, and assembly of the inorganic crystal by medi- ating its nucleation and growth. [8,9] Although many organic– inorganic nanocomposites have been reported, [10] the self- formation of ultrathin organic–inorganic substructures is still difficult to achieve by using a simple bottom-up approach. But the self-formed ordered and intimate combination of organic additives and inorganic crystals at the nanoscale is a crucial requirement for bioactive composites. [11] Here we prepare an organic–inorganic hybrid crystal by the self-assembly of cal- cium phosphate, surfactant, and protein. This hybrid crystal is composed of uniform and alternate organic–inorganic layers at the nanoscale. Both the inorganic crystalline phase and organic phases in the hybrid crystals have an ultrathin thick- ness of 1–2 nm. The two ordered components form simultane- ously during the crystal generation so that they integrate well with each other to form a superstructure. It is of great impor- tance that such biomimetic crystals are considerably flexible and elastic. It is believed that functional organic molecules can interact with calcium species at the organic–inorganic interfaces to modulate the growth and assembly process of the inorganic crystals. The globular protein bovine serum albumin (BSA), which comprises a single chain of 583 amino acid residues, is one of the most studied proteins. It is widely used as a model protein in many fields including biomimetic miner- alization. [12] Surfactants are widely applied as the crystalliza- tion templates in many biomimetic studies. [13] However, the cooperation of different organic additives has been frequently overlooked in previous works because of the complicated inter- actions in the system. [14] Actually, the interactions of a sur- factant molecule and protein are widely found in biological systems, for example, the interaction of protein with cell mem- brane surfactants. The selected two compounds can represent the protein matrix and special small functional molecules in biomimetic mineralization studies. Usually, proteins and sur- factants can form complexes in solution, which are frequently described by a “necklace bead model”. The micelle-like clus- ters of surfactants scatter along the polypeptide chains like the pearls in a necklace. [15] The hydrophilic groups of micelles are exposed to aqueous solutions and their configuration can be adjusted. In such protein–surfactant complexes, the protein is functionalized by the surfactant; meanwhile the aggrega- tion behavior of the surfactant is also affected by the protein structure. Here we find that the complex of BSA and an ani- onic surfactant (sodium bis(2-ethylhexyl) sulfosuccinate, AOT) could self-assemble into regular rhombus plates with a spe- cific organic–inorganic substructure in a calcium phosphate solution. Scanning electron microscopy (SEM) shows the uniform rhombic plates formed by the collaboration of calcium phos- phate, BSA, and AOT (Figure 1a).The typical rhombs are 300–400 nm in the long axis and 200–300 nm in the short axis. Their typical thickness is 80–100 nm. These rhombs are stable and their structures can endure in solution or in air for months. The energy-dispersive X-ray spectroscopy (EDS) reveals the pres- ence of calcium and phosphate ions in the rhombs; the atomic ratio of Ca:P is around 1.5. In addition to the elements of C and O, S was also detected (Figure S1 and Table S1 of the Sup- porting Information), indicating the presence of AOT (–SO 3 2 − ). The organic–inorganic hybrid composite was also confirmed by
Transcript of 5. all published paper
www.advmat.dewww.MaterialsViews.com
CO
MM
Self-Assembled Organic–Inorganic Hybrid Elastic Crystal via Biomimetic Mineralization
UNIC
AT
By Halei Zhai , Wenge Jiang , Jinhui Tao , Siyi Lin , Xiaobin Chu , Xurong Xu , and Ruikang Tang*
ION
It is generally accepted that biomaterials have unique physi-cochemical properties. [ 1 ] Inspired by biological systems, sci-entists have been studying biomimetic methods to fabricate functional materials. [ 2 ] Almost all biomaterials possess a common multi-component feature. [ 1 , 3 ] These composites fre-quently have ordered organic–inorganic hybrid structures and their properties are distinct from the individual components. For example, in a multilayered complex of inorganic aragonite tablets and organic substrate, the fracture toughness of nacre is signifi cantly improved to three thousand times greater than that of synthetic aragonite. [ 4 ] Another striking example is biological bone. In bone, the hydroxyapatite (HAP) phase crystallizes in the nanoscaled channels formed by the staggered alignment of the protein matrix. The typical HAP crystals in bone are plate-shaped with extremely thin thickness (1.5–2 nm), which is the smallest known dimension of the biologically formed crystals. [ 5 ] In nature the organic and inorganic components inti-mately associate into well-organized hybrid structures to ensure optimal strength and fl exural stress. [ 6 , 7 ] Therefore, in biomi-metic designs and fabrications the formation of such ordered nanostructures is a key challenge.
The formation of inorganic crystals in living organisms is regulated by the organic matrix. Generally, different organic templates and additives lead to variety in the morphology, size, orientation, and assembly of the inorganic crystal by medi-ating its nucleation and growth. [ 8 , 9 ] Although many organic–inorganic nanocomposites have been reported, [ 10 ] the self-formation of ultrathin organic–inorganic substructures is still diffi cult to achieve by using a simple bottom-up approach. But the self-formed ordered and intimate combination of organic additives and inorganic crystals at the nanoscale is a crucial requirement for bioactive composites. [ 11 ] Here we prepare an organic–inorganic hybrid crystal by the self-assembly of cal-cium phosphate, surfactant, and protein. This hybrid crystal is composed of uniform and alternate organic–inorganic layers at the nanoscale. Both the inorganic crystalline phase and
© 2010 WILEY-VCH Verlag GAdv. Mater. 2010, 22, 3729–3734
[*] H. Zhai , W. Jiang , J. Tao , S. Lin , X. Chu , Dr. X. Xu , Prof. R. Tang Center for Biomaterials and Biopathways and Department of ChemistryZhejiang UniversityHangzhou, 310027 (P.R. China)E-mail: [email protected] Dr. X. Xu , Prof. R. Tang State Key Laboratory of Silicon MaterialsZhejiang UniversityHangzhou, 310027 (P.R. China)
DOI: 10.1002/adma.201000941
organic phases in the hybrid crystals have an ultrathin thick-ness of 1–2 nm. The two ordered components form simultane-ously during the crystal generation so that they integrate well with each other to form a superstructure. It is of great impor-tance that such biomimetic crystals are considerably fl exible and elastic.
It is believed that functional organic molecules can interact with calcium species at the organic–inorganic interfaces to modulate the growth and assembly process of the inorganic crystals. The globular protein bovine serum albumin (BSA), which comprises a single chain of 583 amino acid residues, is one of the most studied proteins. It is widely used as a model protein in many fi elds including biomimetic miner-alization. [ 12 ] Surfactants are widely applied as the crystalliza-tion templates in many biomimetic studies. [ 13 ] However, the cooperation of different organic additives has been frequently overlooked in previous works because of the complicated inter-actions in the system. [ 14 ] Actually, the interactions of a sur-factant molecule and protein are widely found in biological systems, for example, the interaction of protein with cell mem-brane surfactants. The selected two compounds can represent the protein matrix and special small functional molecules in biomimetic mineralization studies. Usually, proteins and sur-factants can form complexes in solution, which are frequently described by a “necklace bead model”. The micelle-like clus-ters of surfactants scatter along the polypeptide chains like the pearls in a necklace. [ 15 ] The hydrophilic groups of micelles are exposed to aqueous solutions and their confi guration can be adjusted. In such protein–surfactant complexes, the protein is functionalized by the surfactant; meanwhile the aggrega-tion behavior of the surfactant is also affected by the protein structure. Here we fi nd that the complex of BSA and an ani-onic surfactant (sodium bis(2-ethylhexyl) sulfosuccinate, AOT) could self-assemble into regular rhombus plates with a spe-cifi c organic–inorganic substructure in a calcium phosphate solution.
Scanning electron microscopy (SEM) shows the uniform rhombic plates formed by the collaboration of calcium phos-phate, BSA, and AOT (Figure 1 a).The typical rhombs are 300–400 nm in the long axis and 200–300 nm in the short axis. Their typical thickness is 80–100 nm. These rhombs are stable and their structures can endure in solution or in air for months. The energy-dispersive X-ray spectroscopy (EDS) reveals the pres-ence of calcium and phosphate ions in the rhombs; the atomic ratio of Ca:P is around 1.5. In addition to the elements of C and O, S was also detected (Figure S1 and Table S1 of the Sup-porting Information), indicating the presence of AOT (–SO 3 2 − ). The organic–inorganic hybrid composite was also confi rmed by
mbH & Co. KGaA, Weinheim 3729
3730
www.advmat.dewww.MaterialsViews.com
CO
MM
UN
ICATI
ON
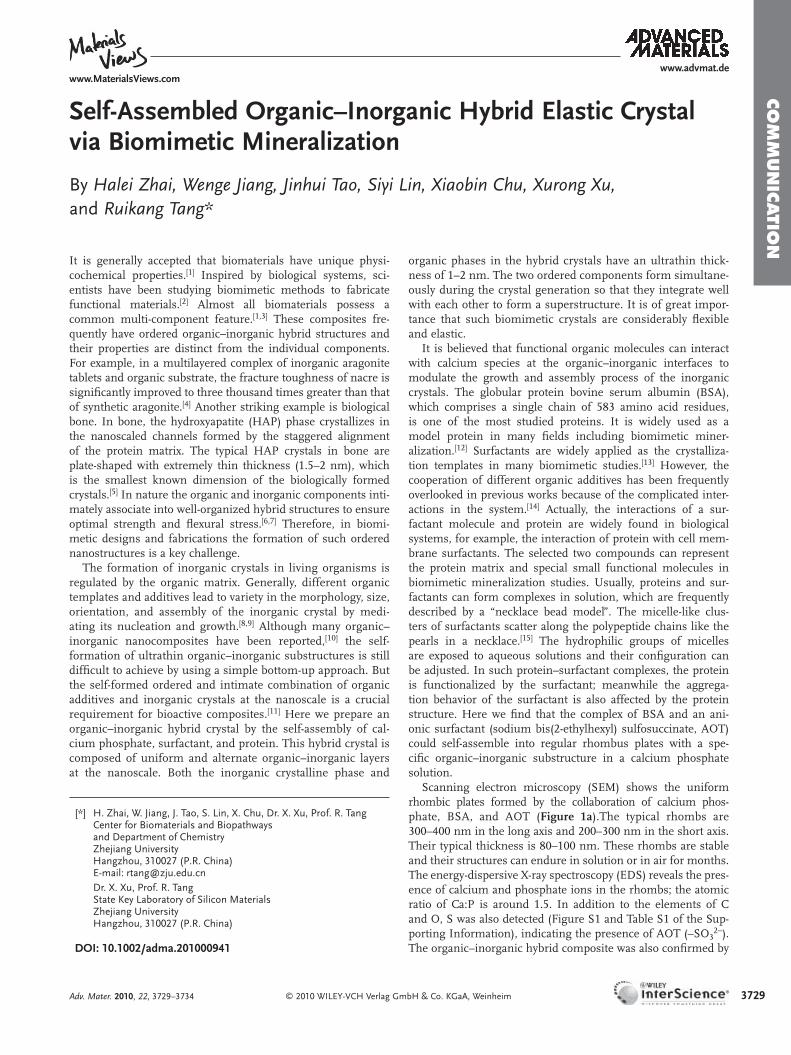
Figure 1 . a) SEM image of the rhombs. Inset: enlargement of the rhomb in the white circle. b) FTIR curves of the rhombs (bottom) and AOT (top). The characteristic peaks for BSA, AOT, and phosphate, are marked as circles, triangles, squares, respectively. c) TGA and DSC analysis under a nitrogen atmosphere. The weight percentages of water and organic component are labeled. d) Transmission electron microscopy (TEM) image of the rhombs. Inset: selected area electron diffraction (SAED) pattern corresponding to the white circled area. e) Wide-angle and small-angle (inset) X-ray diffraction (WAXD and SAXD, respectively) patterns of the rhombs. f) TEM side view of an ultrathin sectioned rhomb.
Fourier transform infrared spectroscopy (FTIR). The peaks at 1737, 1459, and 1419 cm − 1 are the characteristic peaks of AOT, while the bands at 1655 (amide I) and 1553 cm − 1 (amide II) indi-cate the presence of BSA. In addition, the broad peaks at 1023 and 567 cm − 1 are due to the presence of the inorganic phosphate group (Figure 1 b). Thermogravimetric analysis (TGA) and differential scanning calorimetry (DSC) showed the presence of 21.4 % organic component (the organics decomposed at temperatures of 200–500 ° C) and 62.1 % inorganic composite (the residue at temperatures above 500 ° C, Figure 1 c). From these results, we can conclude that the rhombs are the hybrid materials of inor-ganic (calcium phosphate) and organic phases (BSA and AOT).
The regular rhombs were examined by means of trans-mission electron microscopy (TEM, Figure 1 d). The selected area electron diffraction (SAED) pattern shows the inor-ganic phase is in a crystalline form and the pattern is similar to that of HAP tiny crystallites. Abnormally, the crystal has a
© 2010 WILEY-VCH Verlag G
characteristic substructure: two independent sets of diffrac-tion peaks were detected by using wide-angle X-ray diffraction (WAXD) and small-angle X-ray diffraction (SAXD) (Figure 1 e). In the small-angle region, a typical refl ection characteristic of lamellar structures is observed. The interspacing distance, d = 3.12 nm, was calculated by using the refl ection peak at 2 θ = 2.83 ° ((001) refl ection of the rhomb crystals). The (002) and (003) refl ections were detected at 2 θ = 5.71 ° ( d = 1.55 nm) in SAXD and 2 θ = 8.45 ° ( d = 1.05 nm) in WAXD, respectively. These sharp peaks show the rhombs had a highly ordered lamellar structure. The other WAXD peaks in the normal range (2 θ > 10 ° ) indicate that the crystallized mineral phase is a HAP-like phase. These examinations clearly demonstrate that there are two independent lattice structures within a rhomb crystal. It is important that the organic and inorganic phases are orderly arranged to form the hybrid materials rather than the simple and disordered mixture. By using a side view of the ultrathin
mbH & Co. KGaA, Weinheim Adv. Mater. 2010, 22, 3729–3734

www.advmat.dewww.MaterialsViews.com
CO
MM
UN
ICATIO
N
Figure 2 . a) TEM image of the rhombs etched by 5 % NaOCl; The inset is its fast Fourier trans-form (FFT) image. b) Substructures of the organic–inorganic rhombs. AOT: small molecules with round head; BSA: long dark chains; mineral phase: rectangles.
section of the rhombs under TEM, the lamellar structure is shown in Figure 1 f: the dark region corresponds to the inor-ganic phase (crystallized calcium phosphate) and the light one is the organic phase. The individual organic and inorganic phases are alternately stacked. Each layer structure could be identifi ed readily at the nanoscale in the hybrid crystal. These two distinct units are well integrated so that the complete hybrid crystals can be fi nally produced at the nanoscale. The thickness of each organic–inorganic unit is about 3.2 ± 0.2 nm, which is in good agreement with the calculated d value from the SAXD study. It is noted that the thickenss of the mineral layer is only about 2 nm; this dimension is close to that of biological ultrathin HAP crystallites formed between the collagen fi bers of bone.
In order to understand the substructure of the rhombs, the organic component was partially degraded by a 5 % NaOCl solu-tion. Thus, the mineral layer in the complex could be observed directly by TEM (Figure 2 a). Small crystalline platelets, tens of nanometers in dimension (length and width), were frequently observed. In a rhomb crystal, the locations of inorganic crystal-line platelets are restricted by the adjacent protein–BSA organic frames. Thus, the continuous inorganic ultrathin layers might be formed between the frames by using the nanocrystallites. The conductivity investigations showed that AOT molecules had
© 2010 WILEY-VCH Verlag GmbH & Co. KGaA, WeinhAdv. Mater. 2010, 22, 3729–3734
a strong binding effect with calcium ions as a result of the highly charged –SO 3 2 − groups (Figure S2, Supporting Information). But the interaction between calcium and BSA was rel-atively poor. Since AOT molecules aggregated onto the BSA chains according to the “neck-lace bead model”, the local concentrations of calcium around the BSA–AOT complex were greater than that in the bulk solution so that the AOT aggregates on BSA provided the het-erogeneous nucleation sites for calcium phos-phate. Moreover, the AOT molecules were organized by the BSA structure so that the complexes could induce the ordered assembly of calcium phosphate. We suggest that the mineral surfaces also act as the stable solid substrates for the self-assembly of the BSA–AOT complex. Thus, the lamellar organic–inorganic structures could be bottom-up assembled in the solutions spontaneously. Accordingly, the substructure of the hybrid rhombs is the alternate combination of the ultrathin nanocrystal layer and the BSA–AOT monolayer (Figure 2 b), which is analo-gous to the nanoscale characteristics of many natural hybrid composites. [ 1 , 3 , 6 , 7 ]
Structured materials are usually asso-ciated with unique physicochemical and biological properties. [ 16 ] Both advantages of inorganic and organic phases can be present in one hybrid material if these two components can be well-integrated at the nanoscale. [ 17 ] Although the main compo-nent of the rhombs is the crystallized cal-cium phosphate, a rigid inorganic phase, fl exile and elastic behavior of the hybrid ned. Figure 3 a illustrates a side view of a
crystal was obtairhomb: the whole crystal and its organic–inorganic layers are bent to some extent. Interestingly, a similar bent wave shape can be seen in the typical organic–inorganic hybrid reinforced materials such as some polymer–clay nanocoposites. [ 18 ] In order to confi rm the mechanical features of the material, a force curve examination using atomic force microscopy (AFM, Figure 3 b) was applied. The cantilever was very sensitive to the tip force and its defl ection curve could qualitatively repre-sent the hardness of the examined surface. In contrast to the typical sudden and straight force–defl ection lines for the rigid silicon substrate (modulus of 130 GPa, which is similar to that of pure HAP crystals: 112 GPa [ 19 ] ), the loading force increased smoothly with an increase of the defl ection degree of the AFM cantilever. The buffer effect in the AFM force examina-tion indicates that the rhombs are not rigid. This characteristic was similar to that of a typical soft material, polystyrene (PS, modulus of about 3 GPa). It is interesting that no obvious per-manent damage or indention point was detected on the rhomb surface after the loading–unloading cycles (inset of Figure 3 b) in the AFM examination. In order to quantitatively understand the mechanical properties of the hybrid, a nanoindentation measurement with a diamond indenter tip was additonally
3731eim

3732
www.advmat.dewww.MaterialsViews.com
CO
MM
UN
ICATI
ON
Figure 3 . a) TEM image of ultrathin section of the rhomb. b) Atomic force microscopy (AFM) force curves of silicon substrate, rhombs (Rh) and poly-styrene (PS). Cantilever defl ection represents the deformation distance of the sensitive AFM cantilever. Inset: AFM image of the plate after the loading–unloading cycle. c) The nanoindentation curves of rhombs. The displacement here means the indentation distance from the surface.
performed on the rhombs so that the modulus of the material could be calculated. [ 20 ] The solid and dashed lines represent the loading and unloading processes, respectively (Figure 3 c). The relatively great indentation depth with different loading forces from 25 to 40 μ N were used to demonstrate the elastic charac-teristic of the whole nanoplate well. Under such great external forces, the deformation of the plates was signifi cant. However, the thin crystals did not collapsed and the depressed surfaces
© 2010 WILEY-VCH Verlag G
could even partially recover during the unloading processes. In contrast, the unloading curves should be vertical if the solid phase was rigid. [ 20 ] Since the indentation depth was greater than 20 % of the sample thickness, the Bec model [ 21 ] for a thin soft material on a hard substrate was applied in the estimation of the modulus (see details in Supporting Information). By using the loading–unloading curves, the calculated modulus of the organic–inorganic rhombs was 6.64 ± 1.41 GPa. This value was even lower than the modulus of elastic-featured human vertebral trabeculae, 13.5 ± 2.0 GPa. [ 22 ] Similar to biological bone, both the elastic and hardness features were successfully integrated by the nanostructured assembly of organic and inor-ganic ultrathin phases, implying that the hybrid rhombs resolve the brittleness shortage of inorganic crystals and improve the material’s toughness. Actually, this is a smart and important strategy of living organisms to generate functional biomaterials by means of hybrid nanostructures.
Many research efforts often focus on the controlling effect of the organic matrix on inorganic mineralization processes, which mediates the size, morphology, and orientation of inor-ganic crystals. Such an understanding implies a one-way con-trol of inorganic phase formation by organic additives. Thus, the organic templates are often required prior to the controlled crystallization in order to obtain hybrid materials. However, this understanding is not suitable in the current case. It was noted that the BSA–AOT complexes could not form the rhomb structure spontaneously in calcium solutions. Neither our experiment nor the published literature detected the BSA–AOT rhomb in the absence of any mineral phase. Only poorly crystal-line calcium phosphate spherical particles were obtained if only BSA was added into the calcium phosphate solution. Besides, AOT alone resulted in the conventional rod-like HAP crystals (Figure S3, Supporting Information) without any substructure. Clearly, the formation of the hybrid rhombs is attributed to the coexistence of BSA, AOT, and calcium phosphate, which is an emergent process. As mentioned above, the presence of the inorganic part also induces the assembly and structure of the organic components during mineralization. [ 23 ] Additionally, the changes of BSA and AOT concentrations within a certain range only affects the size and morphology of the resultant rhombs (Figure S4, Supporting Information). However, their internal substructure was not altered at all (Figure S5). This phenomenon could be explained by the regulation effect of surfactant on the complex assembly, which has been demon-strated by previous work. [ 15 ]
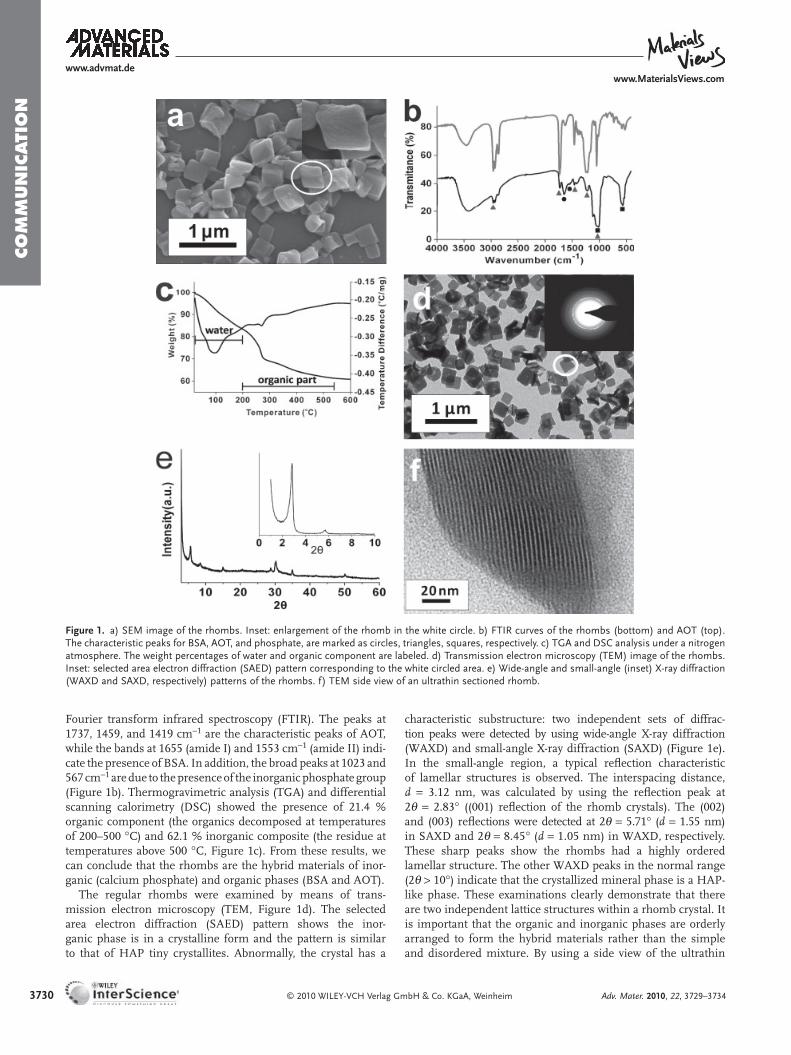
We noted that the assembly process rather than conven-tional crystal growth occurred in the rhomb formation. No obvious signal between 50 and 100 nm was observed during the whole reaction process by dynamic light scattering (DLS, Figure 4 ). At the initial stage of crystallization, two individual distribution peaks existed in the DLS pattern. The small one ( ∼ 20 nm) represented the BSA–AOT building block in the reac-tion solution (Figure S6, Supporting Information), while the large one ( ∼ 300 nm) belonged to the fi nal product. The frac-tion of the building block decreased gradually with the reaction, while the intensity of the product increased. Eventually, only the fi nal product could be found at the end of the experiment. The product size did not increase during the reaction. Accord-ingly, the ex situ electron microscopy studies also demonstrated
mbH & Co. KGaA, Weinheim Adv. Mater. 2010, 22, 3729–3734
www.advmat.dewww.MaterialsViews.com
CO
MM
UN
ICATIO
N
Figure 4 . Dynamic light scattering (DLS) size distribution curves at dif-ferent stages during the emergent formation of rhombs. The percentage values are calculated by using the statistics of the particle amounts.
the absence of intermediate solid or phase during the growth. The DLS result reveals an abnormal pathway in the organic–inorganic hybrid material assembly. We suppose that the BSA–AOT complexes induce the mineral crystallization fi rstly and then they are restructured by the mineral phase to form the alternative layer structure by a cooperative effect. However, the detailed mechanism needs further investigation.
In this Communication we demonstrate that organic–inor-ganic hybrid rhombs with a lamellar superstructure can be self-generated by protein, surfactant molecules, and mineral phases. Each crystal contains two basic nanoscaled subunits: the ultrathin inorganic mineral and organic ultrathin layers. These layers are formed simultaneously and integrate well by self-assembly to generate the hybrid crystals. During this process the cooperative effect between the organic and inorganic phases is key. The ordered organic–inorganic nanostructure confers the optimum mechanical properties on the resultant hybrid mate-rial. The current study provides further evidence of the biomi-metic fabrication of functional materials.
Experimental Section Materials : Triply distilled CO 2 -free water was used in the experiment.
Ca(NO 3 ) 2 and (NH 4 ) 2 HPO 4 were of analytical grade and their solutions were fi ltered twice through Millipore fi lms (0.22 μ m) prior to use. BSA (Albumin Bovine fraction V, BR, purity > 98 %) and AOT (Aldrich) were used directly without further purifi cation.
Preparation : An aqueous solution (100 mL) containing AOT (4 m M ) and BSA (1 mg mL − 1 ) was prepared. The solution pH was adjusted to 10.0 ± 0.5 at room temperature by ammonia solution (3 M ). Ca(NO 3 ) 2 solution (50 mL, 5m M , pH = 10.0 ± 0.5) was added to the mixed solution at a rate of 10 mL min − 1 and the solution was stired for 30 min. After that, (NH 4 ) 2 HPO 4 solution (50 mL, 5m M , pH = 10.0 ± 0.5) was added dropwise at a rate of 1.5 mL min − 1 . The slurry was examined by DLS periodically and the formed solids were collected by high-speed centrifugation at 10 000 rpm. All the solid samples were washed by water three times and were vacuum-dried at 35 ± 1 ° C. Freshly prepared rhombs were dispersed in ethanol ( ∼ 0.5 mg mL − 1 ) and collected on carbon-coated copper grids for TEM examination. Samples for AFM measurements
© 2010 WILEY-VCH Verlag GmAdv. Mater. 2010, 22, 3729–3734
and nanoindentation were prepared by spin-coating 100 μ L of slurry on silicon wafers (3000 rpm). For ultrathin-sectioned TEM examination, rhombs were embedded in 0.5 mL of epoxy. The mixture was solidifi ed at 80 ° C for 12 h and then carefully microtomed by a Reichert–Jung Ultracut E using a diamond knife. The typical thickness of the ultrathin sections was ∼ 80 nm.
Characterization : SEM was performed by using a HITACHI S-4800 microscope at an accelerating voltage of 5 kV. FTIR spectroscopy (Nicolet Nexus 670) was used to determine the composition of the products. Thermogravimetric analysis was carried out by a TA Instrument SDT Q600. The experiment was measured in a temperature range of 22–600 ° C at a heating rate of 10 ° C min − 1 under nitrogen atmosphere. TEM observations were performed by a Philips CM200UT microscope at a typical accelerating voltage of 160 kV. WAXD and SAXD were carried out by means of a Rigaku D/max-2550pc instrument with monochromatized Cu K α radiation and a scanning step of 0.02 ° . AFM images were collected by a Veeco multimode scanning probe microscope with Nano IVa controller. The measurements were performed using an E head and a silica tip (Veeco) on a cantilever with a spring constant of 40 N m − 1 in tapping mode with fi lters off, with a scanning rate of 20 − 60 Hz. The qualitative measurement of the mechanical properties was performed by the cantilever defl ection in the AFM force curve. The data was collected for 200 individual force curves on 10 different rhombs. The nanoindentation measurements were performed by a Tribo-Indenter In-Situ Nanomechanical Test System with a Berkovich diamond indenter (tip radius of about 50 nm). The system was calibrated by using fused quartz before indentation. The data was collected using TestWorks 4 (MTS Systems). The modulus was calculated using the Oliver and Pharr method and the substrate effect was corrected by the Bec model. The DLS measurements were taken by using a Brookhaven Instruments 90 Plus particle size analyzer. Conductivity measurements were carried out by Conducometer DDS-11A at 30 ° C. The conductivity electrode was calibrated using 0.01 M KCl solution prior to use.
Supporting InformationSupporting Information is available online from Wiley InterScience or from the author.
Acknowledgements We thank Haihua Pan and Yuan Su for their helpful discussions, Yuewen Wang, Jieru Wang, Yin Xu, and Xiaoming Tang for assistance in material characterization techniques. This work was supported by the National Natural Science Foundation of China (20601023 and 20871102), Zhejiang Provincial Natural Science Foundation (R407087), the Fundamental Research Funds for the Central Universities and Daming Biomineralization Foundation.
Received: March 16, 2010 Revised: April 5, 2010
Published online: July 21, 2010
[ 1 ] S. Mann , Biomineralization: Principles and Concepts in Bioinorganic Materials Chemistry , Oxford University Press , Oxford 2001 .
[ 2 ] a) L. P. Lee , R. Szema , Science 2005 , 310 , 1148 ; b) C. Sanchez , H. Arribart , M. M. G. Guille , Nat. Mater. 2005 , 4 , 277 ; c) T. Kato , A. Sugawara , N. Hosoda , Adv. Mater. 2002 , 14 , 869 ; d) T. Sun , L. Feng , X. Gao , L. Jiang , Acc. Chem. Res. 2005 , 38 , 644 .
[ 3 ] a) N. Watabe , J. Ultrastruct. Res. 1965 , 12 , 351 ; b) L. C. Palmer , C. J. Newcomb , S. R. Kaltz , E. D. Spoerke , S. I. Stupp , Chem. Rev. 2008 , 108 , 4754 ; c) H. O. Fabritius , C. Sachs , P. R. Triguero , D. Roobe , Adv. Mater. 2009 , 21 , 391 .
3733bH & Co. KGaA, Weinheim

3734
www.advmat.dewww.MaterialsViews.com
CO
MM
UN
ICATI
ON
[ 4 ] a) J. D. Currey , Proc. R. Soc. London, Ser. B 1977 , 196 , 443 ; b) A.P. Jackson , J. F. V. Vincent , R. M. Turner , J. Mater. Sci. 1990 , 25 , 3173 .
[ 5 ] C. Burger , H. W. Zhou , H. Wang , I. Sics , B. S. Hsiao , B. Chu , L. Graham , M. J. Glimcher , Biophys. J. 2008 , 95 , 1985 .
[ 6 ] S. Weiner , H. D. Wagner , Annu. Rev. Mater. Sci. 1998 , 28 , 271 . [ 7 ] D. Liu , H. D. Wagner , S. Weiner , J. Mater. Sci. Mater. Med. 2000 , 11 ,
49 . [ 8 ] F. C. Meldrum , H. Cölfen , Chem. Rev. 2008 , 108 , 4332 . [ 9 ] a) G. Falini , S. Albeck , S. Weiner , L. Addadi , Science 1996 , 271 ,
67 ; b) R. Kniep , S. Busch , Angew. Chem. Int. Ed. 1996 , 35 , 2624 ; c) J. Aizenberg , A. J. Black , G. M. Whitesides , Nature 1999 , 398 , 495 ; d) S. Sadasivan , D. Khushalani , S. Mann , Chem. Mater. 2005 , 17 , 2765 .
[ 10 ] a) S. Mann , Nat. Mater. 2009 , 8 , 781 ; b) R.-Q. Song , H. Cölfen , Adv. Mater. 2010 , 22 , 1301 .
[ 11 ] H. Gao , B. Ji , I. L. Jäger , E. Arzt , P. Fratzl , Proc. Natl. Acad. Sci. U. S. A. 2003 , 100 , 5597 .
[ 12 ] J. Xie , J. Y. Lee , D. I. C. Wang , J. Phy. Chem. C 2007 , 111 , 10226 . [ 13 ] C. E. Fowler , M. Li , S. Mann , H. C. Margolis , J. Mater. Chem. 2005 ,
15 , 3317. [ 14 ] a) L. Qi , J. Li , J. Ma , Adv. Mater. 2002 , 14 , 300 ; b) A. Kotachi ,
T. Miura , H. Imai , Chem. Mater. 2004 , 16 , 3191 . [ 15 ] a) N. J. Turro , X. Lei , K. P. Ananthapadmanabhan , M. Aronson ,
Langmuir 1995 , 11 , 2525 ; b) C. K. Ober , G. Wegner , Adv. Mater. 1997 , 9 , 17 ; c) S. De , A. Girigoswami , S. Das , J. Colloid Interface Sci.
© 2010 WILEY-VCH Verlag Gm
2005 , 285 , 562 ; d) S. Chodankar , V. K. Aswal , P. A. Hassan , A. G. Wagh , Phys. B 2007 , 398 , 112 ; e) T. Chakraborty , I. Chakraborty , S. P. Moulik , S. Ghosh , Langmuir 2009 , 25 , 3062 .
[ 16 ] a) J. Aizenberg , A. Tkachenko , S. Weiner , L. Addadi , G. Hendler , Nature 2001 , 412 , 819 ; b) B. Pokroy , V. Demensky , E. Zolotoyabko , Adv. Funct. Mater. 2009 , 19 , 1054 .
[ 17 ] a) Z. Tang , N. A. Kotov , S. Magonov , B. Ozturk , Nat. Mater. 2003 , 2 , 413 ; b) L. J. Bonderer , A. R. Studart , L. J. Gauckler , Science 2008 , 319 , 1069 .
[ 18 ] a) P. Podsiadlo , A. K. Kaushik , E. M. Arruda , A. M. Waas , B. S. Shim , J. Xu , H. Nandivada , B. G. Pumplin , J. Lahann , A. Ramamoorthy , N. A. Kotov , Science 2007 , 318 , 80 ; b) M. A. Priolo , D. Gamboa , J. C. Grunlan , ACS Appl. Mater. Interfaces 2009 , 2 , 312 .
[ 19 ] G. Dewith , H. J. A. Vandijk , N. Hattu , K. Prijs , J. Mater. Sci. 1981 , 16 , 1592 .
[ 20 ] W. C. Oliver , G. M. Pharr , J. Mater. Res. 1992 , 7 , 1564 . [ 21 ] a) S. Bec , A. Tonck , J. M. Georges , E. Georges , J. L. Loubet , Philos.
Mag. A-Phys. Condens. Matter Struct. Defect Mech. Prop. 1996 , 74 , 1061 ; b) S. Roche , S. Bec , J. L. Loubet , in Mechanical Properties Derived from Nanostructuring Materials , Vol. 778 (Eds: D. F. Bahr , H. Kung , N. R. Moody , K. J. Wahl ), Materials Research Society , Warrendale PA 2003 , p. 117 ; c) G. Hochstetter , A. Jimenez , J. P. Cano , E. Felder , Tribol. Int. 2003 , 36 , 973 .
[ 22 ] J. Y. Rho , T. Y. Tsui , G. M. Pharr , Biomaterials 1997 , 18 , 1325 . [ 23 ] M. Antonietti , M. Breulmann , C. G. Göltners , H. Cölfen , K. K. W.
Wong , D. Walsh , S. Mann , Chem. Eur. J. 1998 , 4 , 2493 .
bH & Co. KGaA, Weinheim Adv. Mater. 2010, 22, 3729–3734
PAPER www.rsc.org/nanoscale | Nanoscale
Publ
ishe
d on
13
Oct
ober
201
0. D
ownl
oade
d on
24/
01/2
016
05:5
8:33
. View Article Online / Journal Homepage / Table of Contents for this issue
Controlled formation of calcium-phosphate-based hybrid mesocrystals byorganic–inorganic co-assembly
Halei Zhai,a Xiaobin Chu,a Li Li,a Xurong Xuab and Ruikang Tang*ab
Received 28th July 2010, Accepted 27th August 2010
DOI: 10.1039/c0nr00542h
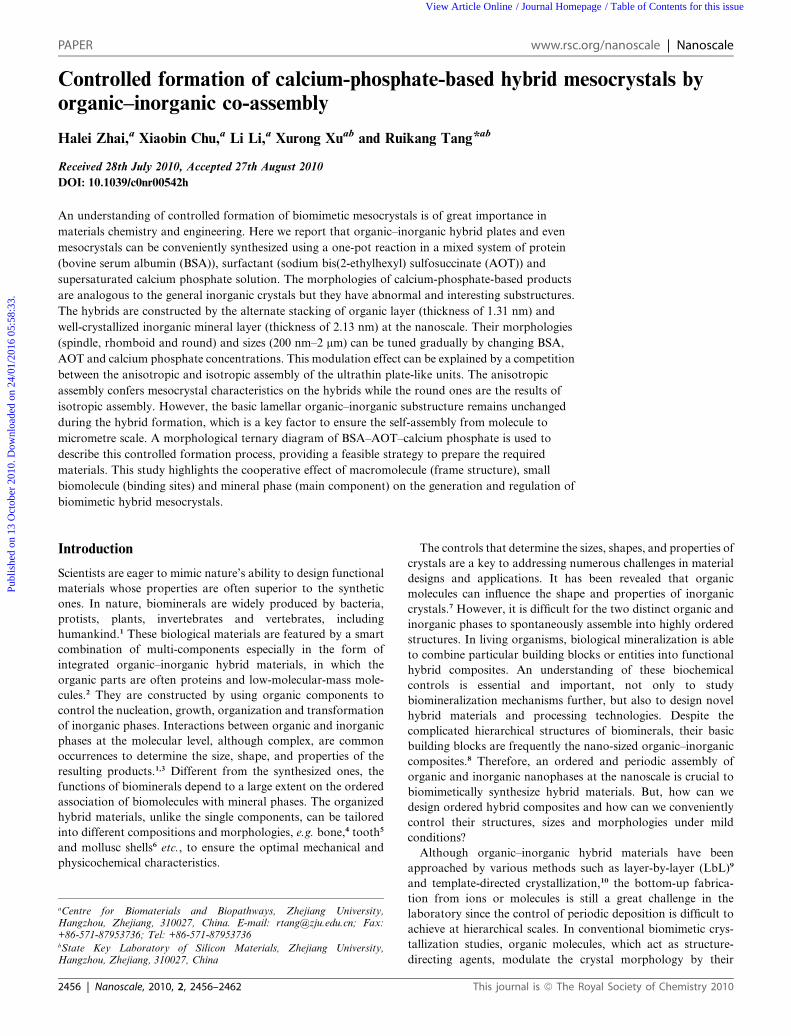
An understanding of controlled formation of biomimetic mesocrystals is of great importance in
materials chemistry and engineering. Here we report that organic–inorganic hybrid plates and even
mesocrystals can be conveniently synthesized using a one-pot reaction in a mixed system of protein
(bovine serum albumin (BSA)), surfactant (sodium bis(2-ethylhexyl) sulfosuccinate (AOT)) and
supersaturated calcium phosphate solution. The morphologies of calcium-phosphate-based products
are analogous to the general inorganic crystals but they have abnormal and interesting substructures.
The hybrids are constructed by the alternate stacking of organic layer (thickness of 1.31 nm) and
well-crystallized inorganic mineral layer (thickness of 2.13 nm) at the nanoscale. Their morphologies
(spindle, rhomboid and round) and sizes (200 nm–2 mm) can be tuned gradually by changing BSA,
AOT and calcium phosphate concentrations. This modulation effect can be explained by a competition
between the anisotropic and isotropic assembly of the ultrathin plate-like units. The anisotropic
assembly confers mesocrystal characteristics on the hybrids while the round ones are the results of
isotropic assembly. However, the basic lamellar organic–inorganic substructure remains unchanged
during the hybrid formation, which is a key factor to ensure the self-assembly from molecule to
micrometre scale. A morphological ternary diagram of BSA–AOT–calcium phosphate is used to
describe this controlled formation process, providing a feasible strategy to prepare the required
materials. This study highlights the cooperative effect of macromolecule (frame structure), small
biomolecule (binding sites) and mineral phase (main component) on the generation and regulation of
biomimetic hybrid mesocrystals.
Introduction
Scientists are eager to mimic nature’s ability to design functional
materials whose properties are often superior to the synthetic
ones. In nature, biominerals are widely produced by bacteria,
protists, plants, invertebrates and vertebrates, including
humankind.1 These biological materials are featured by a smart
combination of multi-components especially in the form of
integrated organic–inorganic hybrid materials, in which the
organic parts are often proteins and low-molecular-mass mole-
cules.2 They are constructed by using organic components to
control the nucleation, growth, organization and transformation
of inorganic phases. Interactions between organic and inorganic
phases at the molecular level, although complex, are common
occurrences to determine the size, shape, and properties of the
resulting products.1,3 Different from the synthesized ones, the
functions of biominerals depend to a large extent on the ordered
association of biomolecules with mineral phases. The organized
hybrid materials, unlike the single components, can be tailored
into different compositions and morphologies, e.g. bone,4 tooth5
and mollusc shells6 etc., to ensure the optimal mechanical and
physicochemical characteristics.
aCentre for Biomaterials and Biopathways, Zhejiang University,Hangzhou, Zhejiang, 310027, China. E-mail: [email protected]; Fax:+86-571-87953736; Tel: +86-571-87953736bState Key Laboratory of Silicon Materials, Zhejiang University,Hangzhou, Zhejiang, 310027, China
2456 | Nanoscale, 2010, 2, 2456–2462
The controls that determine the sizes, shapes, and properties of
crystals are a key to addressing numerous challenges in material
designs and applications. It has been revealed that organic
molecules can influence the shape and properties of inorganic
crystals.7 However, it is difficult for the two distinct organic and
inorganic phases to spontaneously assemble into highly ordered
structures. In living organisms, biological mineralization is able
to combine particular building blocks or entities into functional
hybrid composites. An understanding of these biochemical
controls is essential and important, not only to study
biomineralization mechanisms further, but also to design novel
hybrid materials and processing technologies. Despite the
complicated hierarchical structures of biominerals, their basic
building blocks are frequently the nano-sized organic–inorganic
composites.8 Therefore, an ordered and periodic assembly of
organic and inorganic nanophases at the nanoscale is crucial to
biomimetically synthesize hybrid materials. But, how can we
design ordered hybrid composites and how can we conveniently
control their structures, sizes and morphologies under mild
conditions?
Although organic–inorganic hybrid materials have been
approached by various methods such as layer-by-layer (LbL)9
and template-directed crystallization,10 the bottom-up fabrica-
tion from ions or molecules is still a great challenge in the
laboratory since the control of periodic deposition is difficult to
achieve at hierarchical scales. In conventional biomimetic crys-
tallization studies, organic molecules, which act as structure-
directing agents, modulate the crystal morphology by their
This journal is ª The Royal Society of Chemistry 2010

Publ
ishe
d on
13
Oct
ober
201
0. D
ownl
oade
d on
24/
01/2
016
05:5
8:33
. View Article Online
selective absorption onto crystal faces, altering crystal facet
stability and growth kinetics.7,11 Recently, a non-classical crystal
growth pathway based upon nano assembly has received
considerable attention.12 The nanoparticles, which are directed
by specific organic additives, can act as the basic building units to
assemble into superstructures or mesocrystals. During such
a process, the organic molecules (especially macromolecules)
selectively absorb and interact with primary nanocrystals. The
assembly process follows programmed arrangement into high
order hybrid structures.13 The morphology can be tuned by
varying the interactions between different organic and inorganic
phases. However, the one step bottom-up process, which starts
from the molecular level rather than from preformed nano-
particle precursors, may be readily able to control the orientation
and order of assembly processes to form integrated hybrid
nanocomposite. But this strategy requires a precise and sponta-
neous co-assembly of both organic and inorganic phases
alternately at both the molecular level and the nanoscale.14
In this paper, we reported an easy but effective method for
direct synthesis of organic–inorganic hybrid mesocrystals by
a emergent co-assembly process of protein (bovine serum
albumin (BSA)) and surfactant (sodium bis(2-ethylhexyl) sulfo-
succinate (AOT)) in a supersaturated calcium phosphate solu-
tion. The calcium-phosphate-based hybrid crystals with lamellar
structure have different properties from conventional ones. Here
we emphasize that the size and morphology of the resulting
hybrids could be regulated readily by varying BSA, AOT and
calcium phosphate concentrations according to a suggested
morphological ternary diagram. This study provided a novel
pathway to one-pot preparation of functional hybrid crystal
materials with tuneable size and morphologies by organic–inor-
ganic co-assembly.
Fig. 1 (A) SEM image of the rhombic plates. (B) Enlarged image of the
rhombic plate in the white circle; the double-headed arrow shows the
extended orientation. (C) FT-IR pattern of the products. (D) The
rhombic plates after calcination at 500 �C in air.
Results and discussion
It is believed that functional organic molecules can interact with
calcium species at the organic–inorganic interfaces to modulate
the growth and assemble of inorganic crystals. BSA is one of the
most studied proteins but this biological macromolecule is not an
effective modifier in calcium phosphate crystallization.15 It has
been previously confirmed that the interaction between BSA and
calcium or phosphate ions in aqueous solutions is poor.16 BSA
itself is inert in mineral deposition. In contrast, many surfactant
molecules are widely used as effective promoters and templates in
biomimetic calcium mineralization since their hydrophilic groups
(especially the sulfonate and carboxylate groups) provide active
binding sites to calcium ions. AOT is one among typical agents
that can modulate calcium phosphate precipitation significantly.
AOT molecules have a strong binding effect with calcium ions
due to their highly charged -SO32� groups.16,17 However, hierar-
chical or complicated biomineral-like structures cannot be
achieved by using this small molecule due to the lack of higher-
order structures. In our control experiments, only poor crystal-
line HAP was obtained if BSA was added into the supersaturated
calcium phosphate solutions; AOT alone produced the conven-
tional rod-like HAP crystals without any organized hybrid
structure. These results matched the previous studies and
understandings well. However, the cooperative effect of BSA and
This journal is ª The Royal Society of Chemistry 2010
AOT in the calcium phosphate solution could lead to the
formation of unique hybrids in a one-pot reaction.
Under an experimental condition of 2 mM AOT, 1 mg ml�1
BSA and 1.25 mM calcium ions (the molar ratio of calcium to
phosphate was fixed at 1.67 in all experiments), the uniform
rhombic plates precipitated spontaneously as shown by scanning
electron microscopy (SEM, Fig. 1(A)). Their size distribution
was homogeneous. The typical rhombic plates were 1.23 � 0.21
and 0.91 � 0.18 mm along their long and short axes, respectively
(statistical results from �100 plates); the aspect ratio was about
1.4. The thickness of the plates was 130 � 20 nm. These rhombic
plates had exactly same morphology (Fig. 1(B)) and this char-
acteristic was similar to the general inorganic crystals. However,
the chemical compositions of the obtained plates were relatively
complicated. Besides the elements of calcium and phosphorus,
the element of sulfur was detected in the solids by using energy-
dispersive X-ray spectroscopy (EDS). This result indicated the
presence of AOT (-SO32�) in the hybrid plates. It was also
revealed that inorganic part in the plates was a kind of calcium
phosphate minerals with Ca : P molar ratio of 1.5–1.6. The
coexistence of organic–inorganic components was also
confirmed by Fourier transform infrared spectroscopy (FT-IR,
Fig. 1(C)). The peaks at 1737, 1459 and 1419 cm�1 were the
characteristic signals of AOT, while the bands at 1656 (amide I)
and 1555 cm�1 (amide II) showed the involvement of BSA in the
solids.18 The broad peaks at 1022 and 564 cm�1 were assigned to
the inorganic phosphate groups.19 Thermogravimetric analysis
(TGA) showed that the mineral phase was the main composition
in the solids. The weight loss of 38% between 100 and 500 �C was
corresponded predominantly to removal of the organic phase,
while the weight contents of the inorganic phases were 62%. In
addition, the plates became ‘crimped-paper’-like after calcina-
tions at 500 �C in air for 2 h. Without the organic frame, the
solids became brittle and the structures were collapsed readily
into small pieces under an ultrasonic condition. Many previous
studies suggested that the organic compounds play a regulation
role in inorganic mineralization rather than being involved in
Nanoscale, 2010, 2, 2456–2462 | 2457

Publ
ishe
d on
13
Oct
ober
201
0. D
ownl
oade
d on
24/
01/2
016
05:5
8:33
. View Article Online
structural recombination. However, the current results implied
that BSA and AOT were the key components in the hybrid
construction. Thus, these solids were different from the other
precipitated inorganic crystals in the presence of organic addi-
tives.
The resulting rhombic plates shared the same size and aniso-
tropic morphology similar as general inorganic crystals.
However, in-depth examination revealed that they were distinct
from the conventional calcium phosphate crystals.20 The
rhombic plates were examined by wide angle X-ray diffraction
(WAXD, Fig. 2(A)) and as expectated, the crystalline HAP-like
calcium phosphate phase was detected. The WAXD pattern was
very similar to that of pure HAP but small peak shifts were also
observed. We suggested that the binding effect between the
organic component and calcium ions would cause the lattice
distortion. The lattice structure of the inorganic phase could be
revealed at the atomic scale by using high resolution transmission
electron microscopy from a top view of the plates (HRTEM,
Fig. 2(B)). This image represents a typical ultrathin inorganic
crystal layer embedded in the rhombic plates. However, another
independent set of diffraction peaks was found in the X-ray
diffraction (XRD) pattern, which revealed that a superstructure
was present in the hybrids. The characteristic peaks of lamellar
structure (interspacing distance, d ¼ 3.43 nm) could be found
from both small angle X-ray diffraction (SAXD) and WAXD
(Fig. 2(A)), indicating an ordered arrangement of subunits along
a crystallographic direction rather than a simple mixture of the
organic and inorganic phases. A side view of the ultra-thin
sectioned samples under transmission electron microscopy
(TEM, Fig. 2(C)) confirmed the internal structure: the organic
layers (light, 1.31 nm) and the inorganic layers (dark, 2.13 nm)
Fig. 2 (A) WAXD and SAXD (insert) patterns of the rhombi;
(B) HRTEM of a rhombus (top view). Insert: FFT simulation result;
(C) TEM image of ultra-thin sectioned rhomb from side view. The values
of 2.13, 1.31 and 3.44 nm corresponded to the thicknesses of inorganic
(dark), organic (light) and organic–inorganic complex layers, respec-
tively. Insert: TEM image of the side view of the ultra-thin sections of the
plates, bar is 0.5mm. (C) is the enlargement of the region within the white
circle; (D) TEM image of the hybrids. Insert was the SEAD pattern
(white circle area). The HRTEM image in (B) was also obtained on the
same area by the in situ technique. Arrows showed that each individual
inorganic plate in the hybrid shared the same crystallographic orienta-
tion, which was the long axis of the rhombus.
2458 | Nanoscale, 2010, 2, 2456–2462
alternately stacked at the nanoscale to form the compact hybrid
structure. Thus, the organic molecules (BSA and AOT) were well
organized to form the layered organic phase. Each organic–
inorganic ultra-thin unit had a thickness of 3.44 nm, which
agreed with the XRD data, 3.43 nm, and the individual inorganic
layer was a calcium phosphate crystal plate with a thickness of
only 2.13 nm. These nanoplates acted as the building blocks that
could self-assemble together with the organic layers to generate
the lamellar complex. Additionally, a wave-like superficial
texture of the hybrids could be observed (Fig. 1(B)) and the
profiles were similar to the hybrid crystal morphology. This
phenomenon indicated that the assembly might be an anisotropic
process.
In order to understand the orientation of each inorganic layer,
selected area electron diffraction study (SAED, Fig. 2(D)) was
applied. It was noted that the anisotropic diffraction dots rather
than the isotropic diffraction rings were obtained during the
examination of a whole rhombic crystal, which represented
a similar characteristic of single crystal. It was interesting that the
orientation reflected by these dots (arrow in the insert image) was
exactly same as the long axis of the examined rhombic crystal.
Such a coincidence implied that all the ultrathin inorganic crystal
layers within the hybrid plates should share the same crystallo-
graphic orientation. Additionally, the experimental diffractions
dots of the whole crystal were almost same as the fast Fourier
transform (FFT) result (Fig. 2(B)) of an individual crystal layer.
Therefore, the formed hybrid crystal exhibited similar features to
a single crystal; however, it had additional superlattice structure.
Since the rhombic plates had a specific morphology while they
were not constructed as the conventional single crystals, these
hybrids could be considered as a kind of artificial meso-
crystal.12,21 However, the imperfect dots on Fig. 2 (D) might
indicate that the misaligned orientation still occurred during
nano assembly. Since the material was constructed by ultrathin
calcium phosphate units, it was interesting that flexible and
elastic features were conferred onto the mesocrystal along the
lamellar packing direction in spite of that; its main composition
was a brittle ceramic phase. These mechanical properties of the
hybrids had been characterized by our previous study,16
demonstrating the advantages of organized assembly for
formation of mesocrystals in material functionalization.
The convenient control of the size and morphology of the
organic–inorganic hybrids and mesocrystals is a challenge,
although those for single hybrid crystals are nowadays sophis-
ticated. In our experiments, the calcium phosphate–BSA–AOT
hybrid mesocrystals with different size and morphology could be
feasibly regulated within a simple reaction system by changing
the reactant concentrations. We fixed BSA and calcium
concentration at 0.5 mg ml�1 and 1.25 mM, respectively. When
the AOT concentration was 1.00 mM, the obtained hybrid plates
were not rhombic plates any more. Their shapes became spindle-
like. The hybrid plates changed into a round shape when the
AOT concentration was increased to 4.00 mM. However, the
further decreasing or increasing of AOT concentration result into
the disappearance of the co-assembly or hybrid in the system. In
this experiment, their morphologies were gradually adjustable
from spindle, to rhombus to round by increasing the AOT
concentration from 1.00 to 4.00 mM (Fig. 3). During the
evolution process, the length along the short axis of the formed
This journal is ª The Royal Society of Chemistry 2010

Fig. 3 SEM images of the hybrids synthesised at AOT concentrations of
1.00 (A), 2.00 (B) and 4.00 mM (C). (D)–(F) are the corresponding XRD
patterns of (A)–(C), respectively.
Publ
ishe
d on
13
Oct
ober
201
0. D
ownl
oade
d on
24/
01/2
016
05:5
8:33
. View Article Online
hybrid plates did not change significantly, it was maintained at
300–400 nm. However, the long axis kept on decreasing from
1.50 mm to 300–400 nm with increasing AOT concentration.
Accordingly, the hybrid morphology became isotropic. This
phenomenon implied that AOT component was an important
factor to control the a degree of anisotropic co-assembly of the
hybrids.
Although the morphologies and sizes of the resulted hybrid
plates were influenced remarkably by the changing of AOT
concentrations in the reaction solutions, the internal organic–
inorganic subunit remained. The WAXD and SAXD patterns of
the spindles, rhombi and rounds were exactly same without any
change. But the misalignments of each individual inorganic layer
in the hybrid increased with the increasing of AOT concentra-
tion. The crystallographic mismatch of the inorganic layers could
be examined by using SEAD. During the evolution from the
regular rhombi to round shapes, the diffraction dots disappeared
gradually while the diffraction rings existed (Fig. 4). This
tendency indicated that the preferred orientation of the thin
calcium phosphate planes in the hybrid was weakened. Although
AOT itself could result in aggregates in solution to induce
calcium mineralization, the aggregation was simple and isotropic
Fig. 4 During the morphology change from rhombus (A) to round (B),
anisotropic diffraction dots became isotropic rings in the corresponding
SEAD pattern.
This journal is ª The Royal Society of Chemistry 2010
due to the lack of complicated configuration. Therefore, it was
reasonable that the excessive AOT could destroy the anisotropic
assembly of the ultrathin mineral plates in the hybrid rhombi.
Although the inorganic and organic layers were still packed
layer-by-layer strictly along the thickness direction, the crystal-
lographic directions of the inorganic crystal planes in the hybrids
became disordered. The anisotropic assembly transformed the
orientation of the long axes into the isotropic mode with
increasing AOT concentration; thus, the round plates were
finally yielded at 4.00 mM AOT and the hybrid was not meso-
crystalline any more. Besides, it should be mentioned that the
percentages of organic and inorganic contents in the hybrid
solids was not changed significantly during the morphology
modulation; in which the inorganic content was kept within
a range of 69–72% from the spindles to the rounds.
Besides the AOT concentrations, the formation of hybrid
crystals could be also adjustable by BSA concentration. In this
examination, the concentrations of AOT and calcium were
maintained at 2 mM and 1.25 mM, respectively, and the BSA
concentrations were increased from 0.25 to 2.00 mg ml�1. It was
noted that the morphologies of hybrid plates underwent another
gradual evolution from the irregular quadrilaterals to rhombi
and then to plump spindles (Fig. 5). The sizes and aspect ratios of
the hybrids increased from 200 nm to 2 mm and 1.1 to 2.0,
respectively, during the modulation. Although the hybrid width
increased along the short axis, the more extended length along
the long axis indicated that the anisotropy assembly process was
affected significantly by the protein concentration. It was noticed
that in biomineralization, the complicated hierarchical building
structures of biominerals are frequently contributed by the
ordered aggregates of proteins. Again, the basic organic–inor-
ganic units and their ordered packing behaviours were not
changed during the morphology and size regulations. It was
mentioned that, when the BSA concentration increased, the role
of AOT in the synthesis decreased. Therefore, the ratio or the
Fig. 5 SEM images of the hybrids at BSA concentration of 0.25 (A),
1.13 (B) and 2.00 mg ml�1 (C).
Nanoscale, 2010, 2, 2456–2462 | 2459

Publ
ishe
d on
13
Oct
ober
201
0. D
ownl
oade
d on
24/
01/2
016
05:5
8:33
. View Article Online
cooperative effect of BSA and AOT was another key factor in
mesocrystal formation and regulation.
It was known that the co-assembly could not occur in the
absence of the inorganic phase. Thereby, it was reasonable that
the concentrations of calcium and phosphate could control the
mesocrystal formation too (Fig. 6). Under BSA and AOT
concentrations of 1.00 mg ml�1 and 2.00 mM, respectively, the
resulting rhombi shared the same intermediate state with
increasing calcium and phosphate concentration in the reaction
solution. If calcium concentration was decreased to 0.63 mM, the
poly-dispersed quadrilaterals-like plates (size of 400–800 nm)
formed with the small aspect ratio of 1.1. If the concentration
was increased to 2.50 mM, the slender spindle-like plates were
obtained and their size distribution was 1.8–2.3 mm with an
aspect ratio was 2.5. From the evolution from quadrilaterals,
rhombi to slender spindles, it could be seen that the anisotropic
co-assembly process was enhanced.
The previous studies of biomimetic fabrication of hybrid
materials with artificial molecules such as peptide-amphiphile,22
block copolymer,23 and amphiphilic dendro-calixarene,24 sug-
gested that the specific sites and sterically constrained effect may
control the assembly of the organic template and then the size
and morphology of the final hybrid materials. Different from the
above-mentioned understanding, under our experimental
conditions, the change of BSA and AOT concentrations were
directly related to the different modification state of BSA. The
BSA protein, which was constituted by a single chain of
583 amino acid residues, acted as a stable and relatively rigid
fragment connected with the special motif (AOT aggregates).25
The hydrophilic groups of aggregates exposed to aqueous solu-
tions and their configuration can be adjusted. The highly charged
group (–SO32�) in AOT could greatly interact with calcium ions
and then modulated calcium phosphate precipitation
Fig. 6 SEM images of the hybrids at calcium concentration of 0.63 (A),
1.56 (B) and 2.50 mM. In all experiments, the ratio of calcium to phos-
phate in the reaction solution was maintained at 1.67.
2460 | Nanoscale, 2010, 2, 2456–2462
significantly, which had been demonstrated experimentally in
many works and in our previous paper.16,26 However, the binding
ability of BSA with calcium ions is weak and the controlling
effect on the mineral formation is relatively poor. As a result,
BSA acted as structural frame while the AOT aggregates
provided the nucleation sites of mineral during the co-assembly
process. In the current study, BSA macromolcules combined
with smaller AOT molecules to form a BSA–AOT complex and
such a modified protein could effective control the crysallization
and assembly of the calcium phosphate mineral. To some extent,
this method provides an efficient way to turn a non-mineraliza-
tion protein into a mineralization protein by using surfactants.
The conformation of the macromolecules restricts the assembly
only along certain specific directions. However, the larger
concentration of AOT is accompanied by an increase in the
amount and size of AOT aggregates, offering more sites for
the assembly process.27 As a result, the controlling effect from the
protein was counteracted and the assembly process could happen
at more directions to form the isotropic rounds. Furthermore,
increasing the amount or the relative amount of BSA concen-
trations partly restricted the assembly process in specific prefer-
ential orientations by spatial configuration to form the
anisotropic hybrids or mesocrystals.28 Thus, the co-assembly
process preferred to occur in certain directions, especially along
the long axis of the hybrid plates rather than the short axis.
Although the short axis partly extended under some experi-
mental cases, the greatly increase along the long axis resulted into
the spindles-like mesocrystal formation. The competitive
controlling effect of BSA and AOT led to the transformation of
an isotropic and anisotropic assembly process during hybrid
crystal construction. Thus, the formation of different hybrids
and mesocrystals with tuneable size and morphologies could be
achieved.
An anisotropic co-assembly process could also be promoted by
increasing the mineral ion concentrations. In the formation
process of mesocrystals, the inorganic precursor controlled the
size and morphology of the final product by tuning the amounts,
size and shapes of the nano-sized building blocks.29 Under our
experimental conditions, the controlling role of mesocrystal
growth became dominant in greater saturation to decide the
product size and structure. As the preferred orientation of
the calcium phosphate crystal plates is parallel to the long axis of
the rhombic plates, the fast growth of the calcium phosphate
plate crystals along this preferred orientation promoted the
formation of the slender spindle-like plates with larger aspect
ratios during the co-assembly process. However, the interaction
between BSA-AOT complex and calcium phosphate crystal was
also responsible for the co-assembly of the organic and inorganic
phase to form highly ordered hybrid materials and maintain their
internal structure.
Actually, the generation of hybrid material via the cooperative
effect of macromolecules (mainly proteins), small biomolecules
and the mineral phase is a common strategy in natural bio-
mineralization.30 In the biological construction, high-molecular-
weight macromolecules, such as collagen, act as support matrix
to provide a structural frame for the mineralization, the
biomineralization proteins themselves have nucleation sites
but most matrices receive mineralization function by binding
and stabilizing functional motifs that are carboxylate- or
This journal is ª The Royal Society of Chemistry 2010

Fig. 7 Controlled synthesis of hybrids by a morphological ternary diagram. The co-assembly occurred within the grey area and the formation of
mesocrystals was preferred in its left and bottom sections. The typical morphology of the final products were also demonstrated. Bar ¼ 1mm.
Publ
ishe
d on
13
Oct
ober
201
0. D
ownl
oade
d on
24/
01/2
016
05:5
8:33
. View Article Online
sulfonate-rich. Thus, the combination of organic–inorganic
mineralization interfaces and the organized organic matrices can
concentrate the mineral ions to induce the deposition as well as to
regulate the size, morphology and orientation of the inorganic
building blocks to form integrated organic–inorganic hybrid
composites with complicated structure. We suggest that in this
system, BSA is the structural frame to control the anisotropic
assembly; the adsorption of AOT onto BSA enhances the
mineralization ability of the protein; and the mineral acts as an
inorganic conjunction phase to solidify the organic–inorganic
hybrid structure. In the experiments, the increase of BSA
promoted the formation of larger hybrid plates with increased
aspect ratio, while AOT exhibited the opposite controlling effect.
The increasing of inorganic concentrations preferred the
formation of slender hybrid plates with a larger size. In order to
show the controlling effect of the reactant concentrations, the
simplified morphological maps in the form of solution ternary
diagrams was proposed (Fig. 7). The biomimetic formation
hybrid and mesocrystals could be yielded in the grey region. In
the specific regions, the formed hybrid plates had a similar size
and morphology. From points A to B, the increase of aspect ratio
was preferred as the hybrid rounds transformed into the spindle
ones. Since the anisotropic assembly behaviour was enhanced,
this evolution implied that the resulting mesocrystals became
more organized and the mismatch degrees of the inorganic layers
in the hybrids could be reduced. From points A to C, both the
size and aspect ratio of the resulted hybrids were increased and
their morphologies were changed from rounds to spindles. From
points B to C, the hybrids turned from wide spindles to slender
spindles with increased size and aspect ratio too. By using this
morphological ternary diagram, we could design readily hybrids
and mesocrystals with the required size and morphology.
Conclusions
We demonstrate that the ordered and uniform hybrids or mes-
ocrystals can be biomimetically synthesized by the co-assembly
of proteins, small functional molecules and minerals using
a simple one-pot reaction. Their size distributions and
This journal is ª The Royal Society of Chemistry 2010
morphologies can be adjusted by varying the component
concentration in reaction solutions. The anisotropic co-assembly
of the BSA–AOT complex and ultrathin calcium phosphate
crystal plates is a key to the control of mesocrystal formation.
A morphological ternary diagram can be used to design different
hybrid materials as requireed. This work may give another
inspiration to the assembly of multi components into one inte-
grated hybrid material with a highly ordered structure.
Furthermore, the bottom-up pathway of controlled fabrication
may be developed as a simple and effective strategy to prepare
feasibly functional hybrid and mesocrystal materials.
Experimental
Materials
Triply distilled water was used in all the experiments. Ca(NO3)2
and (NH4)2HPO4 were of analytical and their solution were
filtered twice using 0.22mm Millipore films prior to use. BSA
(Albumin Bovine fraction V, BR, purity > 98%, LABMAX) and
AOT (Aldrich) were used without any further purification.
Hybrid plate preparation
Using a typical experiment as an example, 100 ml aqueous
solution containing 4 mM AOT and 0.20 g BSA was mixed with
50 ml Ca(NO3)2 solution (5mM). The solution pH was adjusted
to 10.0 � 0.5 at room temperature by 3 M ammonia solution.
Then 50 ml (NH4)2HPO4 solution (3 mM, pH ¼ 10.0 � 0.5) was
added dropwise at a rate of 1.5 ml min�1. The reaction solution
contained 2.00 mM AOT, 1.00 mg ml�1 BSA, 1.25 mM Ca(NO3)2
and 0.75 mM (NH4)2HPO4. The mixture was gently stirred at
30 � 1 �C for 24 h. The precipitated solids were collected by
centrifugation at 6000 rpm. The solid were washed by water for
three times and were vacuum-dried at 35 � 1 �C. In order to
examine the controlling effect of reactant concentrations on
hybrid formation, different concentrations of AOT, BSA and
calcium phosphate ions were used and all the experimental
processes were the same.
Nanoscale, 2010, 2, 2456–2462 | 2461

Publ
ishe
d on
13
Oct
ober
201
0. D
ownl
oade
d on
24/
01/2
016
05:5
8:33
. View Article Online
Characterizations
SEM was performed by using a HITACHI S-4800 at a typical
acceleration voltage of 5 kV. FT-IR spectra (Nicolet Nexus 670)
were applied to analysis the hybrid compositions. WAXD and
SAXD were characterized by a Rigaku D/max-2550pc with
monochromatized Cu-Ka radiation; the scanning step was 0.02�.
TGA was performed by a TA Instrument SDT Q600. The
experiment was measured in a temperature range from room
temperature to 1000 �C under nitrogen atmosphere. TEM
observations were performed by a CM200UT TEM (Philips) at
an acceleration voltage of 160 kV. During the ultra-thin
sectioned TEM examination, rhombi were embedded in epoxy.
The mixture was solidified at 80 �C for 12 h and then carefully
microtomed by a Reichert-Jung Ultracut E using a diamond
knife.
Acknowledgements
We thank Jieru Wang, Xinting Cong, Xiaomin Tang, Yin Xu
and Linshen Chen for their help with characterization, Haihua
Pan and Yuan Su for discussions. This work was supported by
the Fundamental Research Funds for the Central Universities,
National Natural Science Foundation of China (20871102),
Zhejiang Provincial Natural Science Foundation (R407087) and
Daming Biomineralization Foundation.
Notes and references
1 S. Mann, Biomineralization: Principles and Concepts in BioinorganicMaterials Chemistry, Oxford University Press, 2001.
2 L. B�edouet, F. Rusconi, M. Rousseau, D. Duplat, A. Marie,L. Dubost, K. Le Ny, S. Berland, J. P�eduzzi and E. Lopez, Comp.Biochem. Physiol., Part B: Biochem. Mol. Biol., 2006, 144, 532–543;J. L. Arias and M. a. S. Ferna�cndez, Chem. Rev., 2008, 108,4475–4482.
3 C. E. Killian and F. H. Wilt, Chem. Rev., 2008, 108, 4463–4474;J. S. Evans, Chem. Rev., 2008, 108, 4455–4462.
4 S. Weiner and H. D. Wagner, Annu. Rev. Mater. Sci., 1998, 28,271–298.
5 S. Busch, U. Schwarz and R. Kniep, Chem. Mater., 2001, 13,3260–3271.
6 N. Watabe, J. Ultrastruct. Res., 1965, 12, 351–370.7 F. C. Meldrum and H. C€olfen, Chem. Rev., 2008, 108, 4332–4432.8 R. Z. Wang, Z. Suo, A. G. Evans, N. Yao and I. A. Aksay, J. Mater.
Res., 2001, 16, 2485–2493; H. J. Gao, B. H. Ji, I. L. Jager, E. Arzt andP. Fratzl, Proc. Natl. Acad. Sci. U. S. A., 2003, 100, 5597–5600.
9 Z. Tang, N. A. Kotov, S. Magonov and B. Ozturk, Nat. Mater., 2003,2, 413–418; P. Podsiadlo, A. K. Kaushik, E. M. Arruda, A. M. Waas,
2462 | Nanoscale, 2010, 2, 2456–2462
B. S. Shim, J. Xu, H. Nandivada, B. G. Pumplin, J. Lahann,A. Ramamoorthy and N. A. Kotov, Science, 2007, 318, 80–83.
10 N. Gehrke, N. Nassif, N. Pinna, M. Antonietti, H. S. Gupta andH. C€olfen, Chem. Mater., 2005, 17, 6514–6516; P. H. Kithva,L. Grondahl, R. Kumar, D. Martin and M. Trau, Nanoscale, 2009,1, 229–232.
11 N. A. J. M. Sommerdijk and G. d. With, Chem. Rev., 2008, 108,4499–4550.
12 R. Q. Song and H. C€olfen, Adv. Mater., 2010, 22, 1301–1330.13 M. Li, H. C€olfen and S. Mann, J. Mater. Chem., 2004, 14, 2269–2276.14 S. Mann, Nat. Mater., 2009, 8, 781–792.15 R. I. Martin and P. W. Brown, J. Mater. Sci.: Mater. Med., 1994, 5,
96–102; K. L. Yadav and P. W. Brown, J. Biomed. Mater. Res., 2003,65a, 158–163.
16 H. Zhai, W. Jiang, J. Tao, S. Lin, X. Chu, X. Xu and R. Tang, Adv.Mater., 2010, 22, 3729–3734.
17 C. E. Fowler, M. Li, S. Mann and H. C. Margolis, J. Mater. Chem.,2005, 15, 3317–3325.
18 G. Falini, S. Weiner and L. Addadi, Calcif. Tissue Int., 2003, 72,548–554.
19 S. J. Gadaleta, E. P. Paschalis, F. Betts, R. Mendelsohn andA. L. Boskey, Calcif. Tissue Int., 1996, 58, 9–16.
20 J. Song, V. Malathong and C. R. Bertozzi, J. Am. Chem. Soc., 2005,127, 3366–3372; A. Ethirajan, U. Ziener, A. Chuvilin, U. Kaiser,H. C€olfen and K. Landfester, Adv. Funct. Mater., 2008, 18,2221–2227; Y. Zhang and J. Lu, Cryst. Growth Des., 2008, 8,2101–2107.
21 A.-W. Xu, M. Antonietti, S.-H. Yu and H. C€olfen, Adv. Mater., 2008,20, 1333–1338.
22 J. D. Hartgerink, E. Beniash and S. I. Stupp, Science, 2001, 294,1684–1688; V. M. Yuwono and J. D. Hartgerink, Langmuir, 2007,23, 5033–5038.
23 Z. H. Nie, D. Fava, E. Kumacheva, S. Zou, G. C. Walker andM. Rubinstein, Nat. Mater., 2007, 6, 609–614; H. Wang, A. J. Patil,K. Liu, S. Petrov, S. Mann, M. A. Winnik and I. Manners, Adv.Mater., 2009, 21, 1805–1808.
24 M. Kellermann, W. Bauer, A. Hirsch, B. Schade, K. Ludwig andC. B€ottcher, Angew. Chem., Int. Ed., 2004, 43, 2959–2962.
25 N. J. Turro, X. G. Lei, K. P. Ananthapadmanabhan and M. Aronson,Langmuir, 1995, 11, 2525–2533; S. De, A. Girigoswami and S. Das,J. Colloid Interface Sci., 2005, 285, 562–573.
26 S. Sarda, M. Heughebaert and A. Lebugle, Chem. Mater., 1999, 11,2722–2727.
27 C. K. Ober and G. Wegner, Adv. Mater., 1997, 9, 17–31.28 H.-A. Klok, J. F. Langenwalter and S. Lecommandoux,
Macromolecules, 2000, 33, 7819–7826; X. Kong and S. A. Jenekhe,Macromolecules, 2004, 37, 8180–8183; L. Rubatat, X. Kong,S. A. Jenekhe, J. Ruokolainen, M. Hojeij and R. Mezzenga,Macromolecules, 2008, 41, 1846–1852; A. Sa�cnchez-Ferrer andR. Mezzenga, Macromolecules, 2010, 43, 1093–1100.
29 H. C€olfen and M. Antonietti, Angew. Chem., Int. Ed., 2005, 44,5576–5591.
30 N. Kroger, R. Deutzmann, C. Bergsdorf and M. Sumper, Proc. Natl.Acad. Sci. U. S. A., 2000, 97, 14133–14138; L. C. Palmer,C. J. Newcomb, S. R. Kaltz, E. D. Spoerke and S. I. Stupp, Chem.Rev., 2008, 108, 4754–4783.
This journal is ª The Royal Society of Chemistry 2010
Nanoscale
PAPER
Publ
ishe
d on
06
Febr
uary
201
3. D
ownl
oade
d by
Uni
vers
ity o
f C
alif
orni
a -
San
Fran
cisc
o on
24/
01/2
016
05:5
0:31
.
View Article OnlineView Journal | View Issue
aCentre for Biomaterials and Biopathways
University, Hangzhou, 310027, China. E-
8795-3736bDepartment of Physics and Department
Singapore, Singapore 117542, SingaporecQiushi Academy for Advanced Studies, Z
310027, China
† Electronic supplementary informationtables. See DOI: 10.1039/c3nr33782k
Cite this: Nanoscale, 2013, 5, 3006
Received 23rd November 2012Accepted 29th January 2013
DOI: 10.1039/c3nr33782k
www.rsc.org/nanoscale
3006 | Nanoscale, 2013, 5, 3006–301
Spontaneously amplified homochiral organic–inorganicnano-helix complexes via self-proliferation†
Halei Zhai,a Yan Quan,a Li Li,a Xiang-Yang Liu,b Xurong Xuc and Ruikang Tang*ac
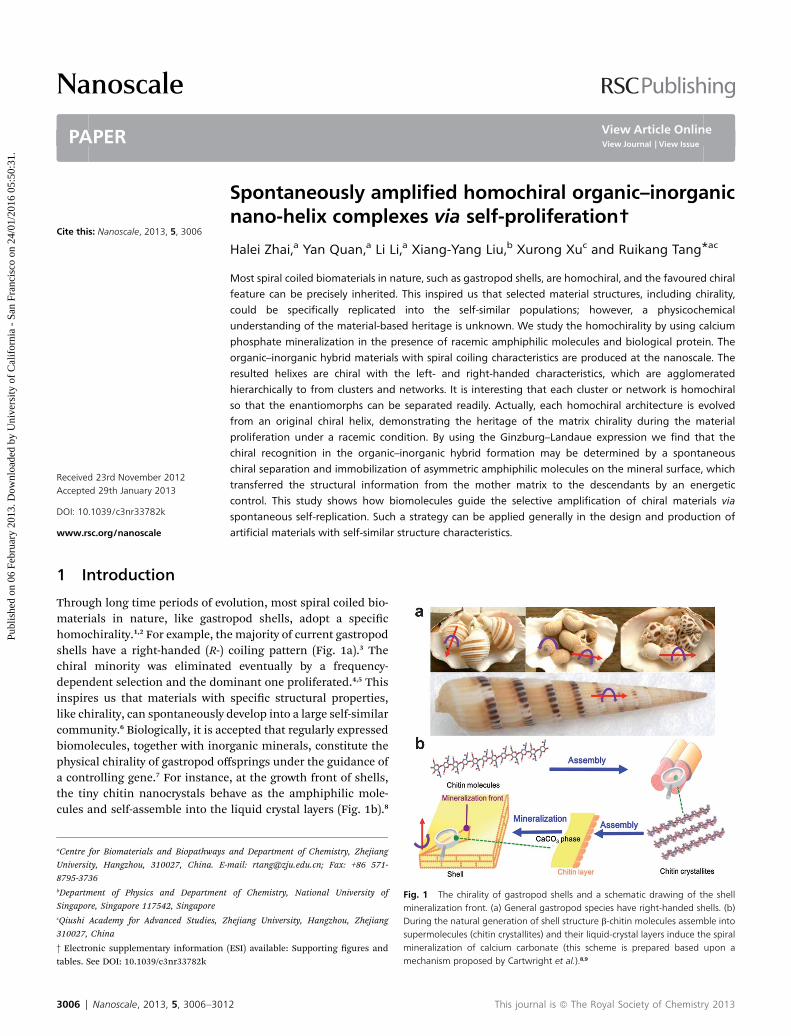
Most spiral coiled biomaterials in nature, such as gastropod shells, are homochiral, and the favoured chiral
feature can be precisely inherited. This inspired us that selected material structures, including chirality,
could be specifically replicated into the self-similar populations; however, a physicochemical
understanding of the material-based heritage is unknown. We study the homochirality by using calcium
phosphate mineralization in the presence of racemic amphiphilic molecules and biological protein. The
organic–inorganic hybrid materials with spiral coiling characteristics are produced at the nanoscale. The
resulted helixes are chiral with the left- and right-handed characteristics, which are agglomerated
hierarchically to from clusters and networks. It is interesting that each cluster or network is homochiral
so that the enantiomorphs can be separated readily. Actually, each homochiral architecture is evolved
from an original chiral helix, demonstrating the heritage of the matrix chirality during the material
proliferation under a racemic condition. By using the Ginzburg–Landaue expression we find that the
chiral recognition in the organic–inorganic hybrid formation may be determined by a spontaneous
chiral separation and immobilization of asymmetric amphiphilic molecules on the mineral surface, which
transferred the structural information from the mother matrix to the descendants by an energetic
control. This study shows how biomolecules guide the selective amplification of chiral materials via
spontaneous self-replication. Such a strategy can be applied generally in the design and production of
artificial materials with self-similar structure characteristics.
1 Introduction
Through long time periods of evolution, most spiral coiled bio-materials in nature, like gastropod shells, adopt a specichomochirality.1,2 For example, the majority of current gastropodshells have a right-handed (R-) coiling pattern (Fig. 1a).3 Thechiral minority was eliminated eventually by a frequency-dependent selection and the dominant one proliferated.4,5 Thisinspires us that materials with specic structural properties,like chirality, can spontaneously develop into a large self-similarcommunity.6 Biologically, it is accepted that regularly expressedbiomolecules, together with inorganic minerals, constitute thephysical chirality of gastropod offsprings under the guidance ofa controlling gene.7 For instance, at the growth front of shells,the tiny chitin nanocrystals behave as the amphiphilic mole-cules and self-assemble into the liquid crystal layers (Fig. 1b).8
Fig. 1 The chirality of gastropod shells and a schematic drawing of the shellmineralization front. (a) General gastropod species have right-handed shells. (b)During the natural generation of shell structure b-chitin molecules assemble intosupermolecules (chitin crystallites) and their liquid-crystal layers induce the spiralmineralization of calcium carbonate (this scheme is prepared based upon amechanism proposed by Cartwright et al.).8,9
and Department of Chemistry, Zhejiang
mail: [email protected]; Fax: +86 571-
of Chemistry, National University of
hejiang University, Hangzhou, Zhejiang
(ESI) available: Supporting gures and
2 This journal is ª The Royal Society of Chemistry 2013
Paper Nanoscale
Publ
ishe
d on
06
Febr
uary
201
3. D
ownl
oade
d by
Uni
vers
ity o
f C
alif
orni
a -
San
Fran
cisc
o on
24/
01/2
016
05:5
0:31
. View Article Online
These chitin layers provide growing sites for the inorganicphase and modulate the mineralization together with relatedproteins. Thus, it follows that the spiral micro-pattern consti-tuted by a chitin–calcium carbonate lamellar structure is grad-ually constructed (Fig. 1b).9 In this sense, an understanding onthe physicochemical regulations of the organic–inorganic bio-inspired materials with selective chirality will advance ourknowledge in chemistry and materials sciences. A challengingquestion to be addressed is whether we can mimic the self-evolution (symmetry breaking) process of shells in our labora-tories so that the chiral materials can be separated and propa-gated to generate self-similar articial production.
It has been demonstrated that some organic molecules cancontrol the morphology of biominerals, like calcium phosphateand calcium carbonate crystals.10 The chiral organic moleculesusually act as templates to control the crystal morphology,rather than incorporated organic composition to constitute thechiral hybrid materials.11,12 In the articial design of chiralnanomaterials, a variety of dispersed chiral superstructures,such as nano-helixes and nano-tubes, can be generated with thetwisted assembly of chiral molecules, or even nano-sized crys-talline units.13 However, each nano-helix or nano-tube is con-structed by independent assembly, rather than a successiveproliferation procedure to pass down the chirality and nalformation of the homochiral complex. As a result, the archi-tecture of a homochiral material complex is rarely achieved.14
Herein, by employing a racemic mixture of a chiral amphiphile(bis-(2-ethylhexyl) sulfosuccinate sodium salt, AOT) and bovineserum albumin (BSA) in supersaturated calcium phosphatesolution, two kinds of chiral organic–inorganic hybrid nano-helixes (L- and R-enantiomers) can spontaneously form andeach kind of chiral helix eventually proliferates into a largerhomochiral helix complex. We feel that such an experimentalphenomenon may be relevant to the proliferation of chiralmaterials.
2 Experimental section2.1 Materials
Triply distilled CO2-free water was used in the experiment.Ca(NO3)2 and (NH4)2HPO4 were of analytical grade and theirsolutions were ltered twice through 0.22 mm Millipore lmsprior to use. BSA (Albumin Bovine fraction V, BR, purity > 98%)and AOT (Aldrich, racemic mixture) were directly used withoutfurther purication.
2.2 Preparation of the homochiral nano-helix complex
The temperature during all the synthesis processes was main-tained at 30 � 1 �C. Briey, a 100 ml aqueous solution con-taining 1 mM AOT and 1 mg ml�1 BSA was prepared. Thesolution pH was adjusted to 10.0 � 0.5 by 3 M ammonia solu-tion. 50 ml Ca(NO3)2 solution (5 mM, pH ¼ 10.0 � 0.5) wasadded. Then 50 ml (NH4)2HPO4 solution (3 mM, pH ¼ 10.0 �0.5) was added dropwise at a rate of 1.5 ml min�1. The solutionwas gently stirred for 10 h and the formed solids werecollected by centrifugation at 3600 rpm. All the solid samples
This journal is ª The Royal Society of Chemistry 2013
were washed by water three times and were vacuum-dried at35 � 1 �C. Freshly prepared samples were dispersed in ethanol(�0.5 mg ml�1) and collected on carbon-coated copper grids forTEM examinations. In the seed growth experiment, 1/20 percentof the obtained product underwent intense ultrasonic treat-ment (KUDOS, 35 kHz, 20 min) and the helix clusters ornetworks were collapsed into dispersed helixes. Then thedispersed helixes were added as seeds into freshly preparedreaction solutions and the reaction solutions were collected bycentrifugation and observed with Transmission ElectronMicroscopy (TEM). For ultrathin sectioned TEM examination,dried samples were embedded in 0.5 ml epoxy. The mixture wassolidied at 80 �C for 12 h and then carefully microtomed by aReichert-Jung Ultracut E ultramicrotome using a diamondknife.
2.3 Au-labelled BSA absorptions
BSA-Au nanoparticles were synthesized according to the work byJ. Xie et al.15 Briey, 5 ml 10mMHAuCl4 solution was added into5 ml 50 mg ml�1 BSA solutions and stirred for 5 min. Then,0.5 ml 1 M NaOH was added and the solution was kept at 37 �Cfor 24 h. The product was dialyzed with 1000 ml distilled waterfor 24 h. The BSA-Au was used instead of pure BSA in order toprobe the location of BSA on the surface of the helix.
2.4 Examination of calcium concentrations
The concentration of free calcium ions in BSA, AOT, BSA + AOTsolutions were measured by a PCa-1 calcium ion selectiveelectrode with a saturated calomel electrode as the referenceelectrode. The electrode was calibrated according to theinstructions before use.
2.5 Characterizations
Scanning electron microscopy (SEM) was performed by using aHITACHI S-4800 eld-emission scanning electron microscopeat an acceleration voltage of 5 kV. Fourier-transform infraredspectroscopy (FT-IR, Nicolet Nexus 670) was used to determinethe composition of the products. Thermogravimetric analysis(TGA) was carried out by a TA Instrument SDT Q600. Theexperiments were measured over a temperature range of 22–800 �C at a rate of 10 �C min�1 under air atmosphere. TEMobservations were performed by a JEM-1200EX at a typicalacceleration voltage of 80 kV. Small angle X-ray diffraction(SAXRD) and Wide angle X-ray diffraction (WAXRD) were char-acterized by a Rigaku D/max-2550pc with monochromatized CuKa radiation and the scanning step was 0.02�. Solid statenuclear magnetic resonance (ssNMR) was kindly performed byProf. Jarry Chan's group at the National Taiwan University on aBruker DSX300 NMR spectrometer.
3 Results and discussion3.1 Structure and composition of the nano-helix
In our biomimetic case, AOT and BSA were adopted as themodels for biological amphiphilic and proteins, respectively.AOT is of asymmetric double-chain amphiphile (Fig. S1†). It can
Nanoscale, 2013, 5, 3006–3012 | 3007

Nanoscale Paper
Publ
ishe
d on
06
Febr
uary
201
3. D
ownl
oade
d by
Uni
vers
ity o
f C
alif
orni
a -
San
Fran
cisc
o on
24/
01/2
016
05:5
0:31
. View Article Online
assemble into various mesomorphous phases, which have beenwidely used in biomimetic crystallization.16 BSA is one of thecommon proteins in biomineralization studies.17 The syner-gistic effect of AOT and BSA on calcium phosphate minerali-zation gave rise to the formation of nano-helix (Fig. 2 and S2†).In the control experiments, the use of AOT and BSA alone onlygenerated the calcium phosphate nanorods and nanospheres,respectively (Fig. S3†). Clearly, the helix formation was attrib-uted to the coexistence of AOT, BSA and calcium phosphate.
It followed that the individual helixes could further developinto micron-sized aggregated clusters (Fig. 2a and b). In anindividual cluster, the nano helixes extended radially outwardfrom a dense core, indicating the successive proliferationprocedure. Furthermore, some clusters connected with eachother to form a larger network (Fig. 2 and S4†). As the basicbuilding blocks of the clusters, the helixes were chiral and theyhad two kinds of spiral enantiomers, L- and R-forms. Although
Fig. 2 Characterizations of nanohelixes. (a and b) Homochiral clusters consistingof R-helixes and L-helixes, respectively. (c) A homochiral helix network; circlesindicate the cluster centres; inset is a magnification of the rectangular region. (d)FT-IR of the helix and pure AOT. The typical and undisturbed peaks of AOT(1750 cm�1), BSA (1540 cm�1, amino) and phosphate ions could be noted. Thepeak located at 2342 cm�1 was generally attributed to CO2 from the air during theFT-IR determination. (e) SAXRD and WAXRD patterns of the helixes. d ¼ 3.34 nmand d ¼ 1.65 nm represent the first and the second diffractions of the lamellarstructure in the helixes, respectively. WAXRD also showed that the mineral phasewas similar to brushite. The XRD peaks of 11.3� and 31.0� were close to those ofbrushite (020) and (121), respectively. The case of the small left-shift of charac-teristic peaks could be found in small nanocrystals.18 The inset TEM image showseach organic (light line)–inorganic (dark line) unit in the helix. (f) 31P{1H}HETCORspectra between the 31P and 1H nuclei measured in the helixes. The spectra wasacquired at a spinning frequency of 10 kHz and the contact timewas set to 2.5 ms.A total of 64 transients with an increment of 100 ms was accumulated.
3008 | Nanoscale, 2013, 5, 3006–3012
the overall amounts of the L- and R-helixes in the reactionsystem were equal (Fig. S5†), only one helix enantiomer could beidentied within a cluster or connected network (Fig. 2a–c, seemore in ESI†). This suggested that the spontaneous chiralrecognition and chiral separation occurred during the clusterand network generation. Concerning the composition andstructure of the helixes, they were constituted by organic andmineral phases, which accounted for 20.5 wt% and 58.8 wt%,respectively (the rest 20.7% was attributed to absorbed andcrystal water, Fig. S6†). FT-IR (Fig. 2d) and energy-dispersiveX-ray spectroscopy (EDS, Fig. S7†) revealed that the maincomponents in the helixes were AOT and a calcium phosphatephase. X-ray diffraction (Fig. 2e) showed that the mineral phasewas close to brushite. Moreover, the mineral phase in the helixwas conrmed by Multiple Pulse Sequence Nuclear MagneticResonance spectroscopy (CRAMPS-NMR) and a HeteronuclearCorrelation (HETCOR) spectrum between the 31P and 1H nuclei31P{1H} combined rotation, indicating that the phosphategroups were protonated (HPO4
2�) in the calcium mineral(Fig. 2f, S8 and Table S1†). The NMR data indicated the absenceof PO4
3� in the complex. As a result, the calcium phosphatespecies containing PO4
3� groups such as hydroxyapatite, octa-calcium phosphate and tri-calcium phosphate could beexcluded in the phase analysis. Additionally, Ca(H2PO4)2 couldnot be precipitated under our experimental conditions due toits high solubility. Both examinations shows that the signals ofthe helix were close to those of brushite. Therefore, the brush-ite-like mineral was considered as the primary inorganiccomponent in the helixes.
The internal structure of the nano-helixes could be consid-ered as the alternative and spiral stacking of thin calciumphosphate phase and AOT bilayers. The cross-section images ofthe nano-helix showed that the thickness of the wall of thenano-helix was about 2.1–2.2 nm (Fig. 3a–c). Furthermore,SAXRD andWAXRD results also showed the alternative lamellarsuperstructure in the helixes with a constant interspacingdistance (d ¼ 3.34 nm). The lamellar structure was alsodemonstrated by TEM (Fig. 2e): the dark lines (1.7 nm) and lightlines (1.6 nm) correspond to the inorganic calcium phosphateand organic AOT ultrathin layers, respectively. The thickness ofeach organic–inorganic hybrid unit was about 3.3 � 0.2 nm,which is in agreement with the d value calculated from theSAXRD data. In the spiral helix, there existed a pitch angle ofabout 43� between the strip edge and the long axis. It was notedthat the AOT molecules preferred to assemble into a bilayerstructure. Concisely, the organic bilayer could have a thicknessof about 1.6 nm if the molecules tilted by 43�. There were twomirror forms for both the helix pitch angle and the AOT tiltangle, +43� or �43�, as the denitions (Fig. 3d and e). Themirror packing of AOT corresponded to the formation of R- andL-enantiomers of the helixes. Apart from AOT, a small amountof BSA was detected in the helix by FT-IR and 13C{1H} NMR(Fig. S9†). Using nano Au particle labelled BSA as the imagingagent, we found that the protein did not incorporate into thehybrid inner structure, but absorbed onto the helix wallsurfaces (Fig. S10†), which might be due to its relatively largedimension.19 We suggested that BSA served as a surface or
This journal is ª The Royal Society of Chemistry 2013

Fig. 3 (a and b) Cross-section images of nano-helixes under TEM. (c) Schematicstructure of the nano helixes (dark grey: inorganic phase; light grey: organicphase). (d and e) TEM and schemes of the R- and L-helix. The width of the AOTbilayer is 1.6 nm from TEM observation. As AOT molecules have a length of 1.1nm, AOT molecules in a bilayer should arrange with a tilt angle of about 43� .Note: the AOT molecules in the same bilayer are simply treated as direct contactand this small variation of tilt angle doesn't affect our qualitative analysis.
Fig. 4 TEM images of the evolution from a single helix to a homochiral clusterand then a homochiral network (community). (a) A sprouting bud from R-helix
Paper Nanoscale
Publ
ishe
d on
06
Febr
uary
201
3. D
ownl
oade
d by
Uni
vers
ity o
f C
alif
orni
a -
San
Fran
cisc
o on
24/
01/2
016
05:5
0:31
. View Article Online
structure stabilizer for the hybrid spiral strips. An experimentalfact was that no chiral product formed by using BSA alone.During biomineralization, some biomacromolecules can adoptan extended conformation when they interact with the inor-ganic phase surface.20 Therefore, there was a possibility that theBSA molecules might incorporate into the helix using theirextended forms. However, we could conrm that the AOTmolecules with highly charged sulphuric groups, rather thanBSA, were the primary organic composition in the nano-helix.For example, the FT-IR study showed a very weak amino peak(Fig. 2d) in the composites, implying the ignorable contents ofBSA in comparison with the strong AOT bands. Therefore, it wassuggested that the hybrid helixes were formed by the orderedassembly of the calcium phosphate mineralized layer and theAOT bilayer, and were stabilized by BSA absorption on thehybrid surfaces. In this architecture, the assembly behaviour ofchiral AOT molecules in the hybrid helixes determined thematerial’s chirality.
matrix for the new “daughter” helix generation. (b) Growth and twist of the“daughter” helix, which duplicated the chiral feature to be R-form; insets showthe details of the growth front on the matrix. (c) More buds formed and theyreplicated the structure of matrix precisely. (d) Rudiment of the homochiral helixcluster; insets: magnification of the branching sites. (e) Homochiral helix cluster(R-form); arrows indicate the proliferation directions of the cluster; inset showsthe new buds formed at an extended helix. (f) Homochiral helix networks (R-form); arrows show the proliferation directions.
3.2 Proliferation of the nano-helixes
Originally, the homochiral clusters and networks evolved from asingle nano-helix (mother matrix). The preformed chiral nano-helix spontaneously passed down the structure information(chirality) from one generation to the next and then generated
This journal is ª The Royal Society of Chemistry 2013
the homochiral complexes (Fig. 4). Firstly, tiny hybrid budssprouted from the surface of the matrix (Fig. 4a). Both organicand inorganic parts of the buds directly integrated with thecorresponding parts of mother matrix. This could be consideredas a kind of matrix outgrowth. Secondly, these hybrid buds grewlonger and twisted into the helical ribbons. At this stage, theorganic and inorganic parts at the growing front of hybrid budsdid not integrate with mother matrix any more. At this time,there should be a choice in the twist direction (L- or R-).Nevertheless, we noted that the newly formed helical ribbonsreplicated precisely the twist direction (chirality) of the mothermatrix. This meant that the mother matrix induced the laterAOT molecules to assemble into a coherent packing direction,even the AOT bilayers at the budding region and growth frontwere separated by calcium phosphate layers. Thus, the originalstructure was inherited through the budding and proliferationprocess (Fig. 4b). Thirdly, the homochiral proliferation processof the helixes continued by generating more “daughters” and“grand-daughters” based upon the matrix. Due to the spacelimitation, the newly formed helixes tended to stretch outward,which generated radial homochiral clusters (Fig. 4c). Finally, afew of the helixes at the cluster edge acted as “bridges” toprovide additional growing sites for new buds and initiatedanother proliferation process (Fig. 4e). This new proliferation
Nanoscale, 2013, 5, 3006–3012 | 3009

Nanoscale Paper
Publ
ishe
d on
06
Febr
uary
201
3. D
ownl
oade
d by
Uni
vers
ity o
f C
alif
orni
a -
San
Fran
cisc
o on
24/
01/2
016
05:5
0:31
. View Article Online
could happen at multiple directions (Fig. 4f). Through the self-repeating processes, a single nano-sized helix eventually evolvedinto a large homochiral complex (network) at the micrometerscale (Fig. 4f). In each network, the chirality of the newly bornhelixes was precisely “inherited” from the original mothermatrix from generation to generation, which can be consideredas a spontaneous process of material-based self-proliferation.
We note that it is impossible for the dispersed helixes aerintense ultrasonic treatment to aggregate into homochiralclusters again. However, aer the dispersed helixes are re-dispersed into the freshly prepared reaction solutions as seeds,the time to induce the formation of helix clusters can be rela-tively reduced according to the seed amount, indicating that themother helix acts as the seed to induce the proliferation of newhelixes to form helix clusters (Fig. S11†). As a result, in eachnetwork, the chirality of the newly born helixes was precisely“inherited” from the original mother matrix from generation togeneration, which can be considered as a spontaneous processof material-based self-proliferation.
3.3 Model for the homochiral material
Analogous to the shell formation, the co-assembly of organic andinorganic phases is restricted at the local domains of the growthfront (Fig. 4a and b). AOT molecules are more able of bindingcalcium ions than BSA (Table S2†) and these amphiphilicmolecules greatly modulate the growth of calcium phosphatespecies.21 In this case, the helix formation and replication arecontrolled dominantly by the assembly behaviours of AOT at thegrowth front. The AOT molecules can tightly absorb onto thesurface of calcium phosphate species with a strong bindingeffect between calcium ions and sulphuric groups, which facili-tates the assembly of AOT bilayers.22 Unlike the free AOT mole-cules in aqueous solution, the relatively rigid CaP crystal, ratherthan the mobile water layer, can imobilize the adjacent AOTbilayers. Thus, the hybrid structure could be ‘solidied’ andstabilized with a decreasing disordered uctuation of AOTmolecules comparing the free state, which then induces the nextlayer mineralization.23 This alternative and cooperated deposi-tion of the AOT bilayer and calcium phosphate phase layergradually constitutes a thin AOT–calcium phosphate hybridstrip, which is similar to the associated assembly of lipids andinorganic phase reported by Seddon, et.al.13b
In our work, the chiral AOTmolecules are responsible for thetwist of the hybrid strip to form the L- and R-nano-helixes.Although the BSA used here is constituted with chiral L-aminoacids, the chirality of nano-helixes are unlikely to be controlledby BSA. Due to its large size, it is difficult to incorporate into theordered structure with ultra-small units of 1.7 nm (calciumphosphate layer) and 1.6 nm (organic layer), while the twistedarrangement of these units forms the chirality at the nanoscale.In addition, the equal number of L- and R-nano-helixes alsoindicates that the BSA with single chiral units (L-amino acids)has little contribution to the chirality of the nano-helixes. Manyworks have been reported that strips constituted with chiralmolecules tend to twist into nano-helixes to reduce the elasticenergy.24 Similarly, the chirality of the nano-helixes in our
3010 | Nanoscale, 2013, 5, 3006–3012
system is determined by the assembly behaviour of chiral AOTmolecules.
However, the racemic mixture generally dilutes the chiralinteraction between the chiral molecules, so that the chiralsuperstructure might fail to form.25 Nevertheless, some studieshave shown that both R- and L-enantiomers can emerge inracemic systems if an energy favoured chiral phase separationoccurs, especially for the lipids with chiral headgroups andinexible double chains structures.26 Interestingly, AOT owns asimilar structure and phase behaviour to these lipids.27 More-over, chiral molecules can also undergo a phase separationwhen they are restricted at interfaces.28 Therefore, in oursystem, it follows that a spontaneous chiral phase separation ofamphiphilic AOT may occur on the calcium phosphate mineralsubstrate, resulting in the bilayers with exactly the samemolecular packing behaviour.
Due to the complicated structure, the conformation infor-mation (chirality) of AOT in each nano-sized helix is difficult toidentify. Besides, methods of the synthesis or separation of AOTdiastereoisomers is rarely reported.29 Based upon the mirrorarrangement of AOT in L- and R-helixes, we divide the AOTmolecules into two types with different tilt directions of +43�
or �43�. Aer this simplication, only the tilt angle needs to betaken into account in the qualitative analysis of the energyduring the formation process. The AOT molecules in the bila-yers have two different tilt angles, +43� or �43�, which can beconsidered as the enantiomers to induce R- and L-chiral helixformations, respectively (Fig. 3d and e). The favoured tilt angleshould maintain the same value during the alternative dispo-sition. Thus, the energy favoured recognition is a key to main-tain the molecular assembly according to the chiral breakingmodel supposed by Selinger et al.30 The model suggests that theelastic energy of the strip can be reduced by a chiral separationeven under racemic conditions. An order parameter, j, isintroduced, which is treated as the local net amount of right-handed minus le-handed molecular packing here. The elasticfree energy, F, of the thin chiral bilayer strip can be written aseqn (1)
F ¼ðdS
�1
2k
�1
r
�2
þ 1
2k0�1
r
�2
cos2 f� lHPj
�1
r
�sin f cos f
þ 1
2KðVjÞ2 þ 1
2tj2 þ 1
4uj4
�þ Eedge (1)
where, S is the area, the rst term is the standard Helfrichbending energy of the hybrid membrane and the coefficient k isthe isotropic rigidity. In the right side of eqn (1), the secondterm represents the anisotropy of the rigidity and the coefficientk0 is the anisotropic term and f is the title angle of the chiralmolecules (Fig. 5a); the third term is a chiral term that favourstwisting in a tilt angle f; the coefficient lHP, is the chiralityparameter, which exists only in chiral membranes and dependson the chiral order. The sign of lHP can be changed when themembrane transforms into its mirror image. lHPj increaseswith the greater chiral phase separation degree of j. The lastthree terms in the bracket are the Ginzburg–Landau expres-sions in powers of j, which represent the free energy change
This journal is ª The Royal Society of Chemistry 2013

Fig. 5 (a) Thegeometry ofAOTmolecules in the helix discussed in eqn (1) for helixformation. (b) Two local minima of the elastic free energy (F) with symmetrypacking (jm+ or jm�) lead to an energy barrier of DF, which ensures the orientedpacking vector of AOTbilayers to produce chiral helix andhomochiral proliferation.
Paper Nanoscale
Publ
ishe
d on
06
Febr
uary
201
3. D
ownl
oade
d by
Uni
vers
ity o
f C
alif
orni
a -
San
Fran
cisc
o on
24/
01/2
016
05:5
0:31
. View Article Online
during the ordering transition. The values of K and u aretemperature independent constants while the coefficient of trelates to temperature and t < 0 for chiral phase separation.30,31
Because AOT molecules in the helix have the xed tilt angle of43�, the domain wall energy on the edge is a constant.
When simultaneously minimizing the free energy over tiltangle and radius, r, in eqn (1), the following is obtained,
f0 ¼ arctan
��kþ k0
k
�1 =
4
�(2)
r0 ¼k
1 =
4ðkþ k0Þ1 =
4
hk
1 =
2 þ ðkþ k0Þ1 =
2
ilHPj
(3)
in which, (k + k0)/k represents the energy cost for the ratio of thebend parallel to the tilt direction to bend perpendicular tothe tilt direction. In our system, its value is about 0.76 becausefAOT ¼ 43�, which indicates that the hybrid strip favourstwisting parallel to the AOT tilt direction. Besides, the radius ofthe nano-helix equals 1.33k/lHPj. Usually, the lipid amphi-philes form helical tubes or a helix with a larger diameter ofhundreds nanometres or even a few micrometers. Since theorganic–inorganic hybrid structure exists in our helixes, it isreasonable that the rigidity coefficient k should be greater thansingle component chiral lipid membranes. As a result, lHPj
must be signicantly greater to produce such a slender helixwith a very small radius (�10 to 25 nm).
We note that the favoured energy barrier DF plays anessential role to control the twist direction and chiral prolifer-ation of nano-helixes (eqn (1)). Here, the qualitative descriptionenergy barrier DF between the racemic state (j ¼ 0) and sepa-ration state (jm�) can be described by eqn (4),30
DF ¼ðdS
�lHPjm�
�1
r
�sin f cos f þ 1
2KðVjm�Þ2
þ 1
2tjm�
2 þ 1
4ujm�
4
�(4)
As the radius of the nano-helix is r f 1/lHPj, the relativelysmall radius of the helix (10–25 nm) implies that lHPj is of greatvalue in our case, which facilitates the chiral separation. Theequation shows that the free energy of the strip has two local
This journal is ª The Royal Society of Chemistry 2013
minima representing the two types of energy favoured AOTpacking with the mirror symmetry (Fig. 5b) if chiral phaseseparation occurs. Without chiral phase separation, the stripcannot twist into a helix because the radius becomes innitewhen j ¼ 0 (r / N).
Fig. 5b shows the constant arrangement of AOT molecules(constant tilt angle of +43� or �43�) within a strip is energeti-cally preferred due to an energy barrier. First, the energy barrierDF can promote the formation of energy favoured and stablenano-helixes, rather than unstable hybrid strips. If the differentarrangements of AOT molecules (L- and R-) coexist in the samestrip, the elastic energy increases so that the resulting stripbecomes unstable (Fig. 5b, middle). Therefore, the elasticenergy cannot be reduced and generate twisted nano-helixes. Bycontrast, the same arrangements of AOTmolecules (L- or R-) cansuccessfully reduce the unfavoured elastic energy and twist toform L- or R-nano-helixes, respectively (Fig. 5b, le and right).Second, the energy barrier of DF is also responsible for thehomochiral proliferation. In our system, the preformed helixmatrix has an inductive effect on the sequent proliferationbecause the emerging organic and inorganic parts in the newbuds directly extend from their mother matrix. Thus, new budsshare the same AOT packing form with the mother matrix. Thesame AOT packing can be replicated under the guidance of themother matrix due to the favoured energy reduction, whichmeans that L- to L- or R- to R-proliferation is a preferential way.Subsequently, the buds grow following the determined AOTpacking to form a new chiral helix with the same chirality. Forexample, the new buds generated from the R-nano-helixes inFig. 4 faithfully adopt the R-twist direction and keep the selectedform during the growth process. The mutated proliferation ofL- to R- or R- to L- also require extra energy to overcome DF incomparison with the matched L- to L- or R- to R-. Accordingly,the chiral structure proliferation always initiates at the pre-formed helixes and amplies the chiral structure from themother matrix to subsequent generations. Finally, largehomochiral complexes (helix clusters and networks) can begenerated under the guidance of the energy controlled recog-nition of AOT packing.
4 Conclusions
This study reveals that the homochiral complex of the organic–inorganic hybrid helix can form via a self-proliferation process.The energy controlled chiral recognitions and separations ofasymmetric chiral AOT molecules are essential in both helixformation and homochiral proliferation. The nding is ofimportance to approach homochiral biomimetic materials inthe laboratory. We expect this strategy of bio-inspired chiralstructure proliferation can be developed into a convenientpathway for the articial synthesis of self-similar functionalmaterials.
Acknowledgements
We thank Prof. Jerry Chen for the ssNMR studies, Dr Jinhui Tao,Dr Haihua Pan and Yuan Su for discussions, Hua Wang, Jieru
Nanoscale, 2013, 5, 3006–3012 | 3011
Nanoscale Paper
Publ
ishe
d on
06
Febr
uary
201
3. D
ownl
oade
d by
Uni
vers
ity o
f C
alif
orni
a -
San
Fran
cisc
o on
24/
01/2
016
05:5
0:31
. View Article Online
Wang, Yin Xu and Xiaoming Tang, Xinting Cong, Yalin Li forcharacterizations. This work was supported by the NationalNatural Science Foundation of China (91127003) and theFundamental Research Funds for the Central Universities.
Notes and references
1 (a) M. J. French, Invention and evolution: design in nature andengineering, Cambridge Univ Pr, 1994; (b) S. Mann,Biomineralization: Principles and Concepts in BioinorganicMaterials Chemistry, Oxford University Press, 2001.
2 (a) R. Ueshima and T. Asami, Nature, 2003, 425, 679–679; (b)C. Grande and N. H. Patel, Nature, 2008, 457, 1007–1011.
3 M. Schilthuizen and A. Davison, Naturwissenschaen, 2005,92, 504–515.
4 (a) G. J. Vermeij, A natural history of shells, Princeton Univ Pr,1995; (b) P. Y. Parkhaev, Paleontological Journal, 2007, 41,233–240.
5 (a) O. Lipton, Malacologia, 1979, 19, 129–146; M. S. Johnson,Heredity, 1982, 49, 145–151; (b) T. Asami, R. H. Cowie andK. Ohbayashi, Am. Nat., 1998, 152, 225–236.
6 (a) S. Mann and G. A. Ozin, Nature, 1996, 382, 313–318; (b)H. Colfen and S. Mann, Angew. Chem., Int. Ed., 2003, 42,2350–2365; (c) S. Zhang, Nat. Biotechnol., 2003, 21, 1171–1178.
7 R. Kuroda, B. Endo, M. Abe and M. Shimizu, Nature, 2009,462, 790–794.
8 J. H. E. Cartwright and A. G. Checa, J. R. Soc. Interface, 2007,4, 491–504.
9 J. H. E. Cartwright, A. G. Checa, B. Escribano and C. I. Sainz-Dıaz, Proc. Natl. Acad. Sci. U. S. A., 2009, 106, 10499–10504.
10 (a) M. Antonietti, M. Breulmann, C. G. Goltner, H. Colfen,K. K. W. Wong, D. Walsh and S. Mann, Chem.–Eur. J.,1999, 4, 2493–2500; (b) A. Bigi, B. Bracci and S. Panzavolta,Biomaterials, 2004, 25, 2893–2899; (c) D. Gebauer,H. Colfen, A. Verch and M. Antonietti, Adv. Mater., 2008,21, 435–439; (d) L. Wang and G. H. Nancollas, Chem. Rev.,2008, 108, 4628.
11 (a) G. Falini, M. Gazzano and A. Ripamonti, J. Mater. Chem.,2000, 10, 535–538; (b) C. Orme, A. Noy, A. Wierzbicki,M. McBride, M. Grantham, H. Teng, P. Dove andJ. DeYoreo, Nature, 2001, 411, 775–779; (c) M. Olszta,E. Douglas and L. Gower, Calcif. Tissue Int., 2003, 72, 583–591; (d) O. Casse, K. Kita-Tokarczyk, A. H. E. Muller,W. Meier, A. Taubert, O. Casse, K. Kita-Tokarczyk,A. H. E. Muller, W. Meier and A. Taubert, Faraday Discuss.,2008, 139, 179–197.
12 (a) C. Gobel, P. Simon, J. Buder, H. Tlatlik and R. Kniep,J. Mater. Chem., 2004, 14, 2225–2230; (b) T. Tsuji, K. Onuma,A. Yamamoto, M. Iijima and K. Shiba, Proc. Natl. Acad. Sci.U. S. A., 2008, 105, 16866–16870; (c) Y. J. Wu, T. W. T. Tsaiand J. C. C. Chan, Cryst. Growth Des., 2012, 12, 547–549.
13 (a) T. Kunitake and N. Yamada, J. Chem. Soc., Chem.Commun., 1986, 655–656; (b) A. M. Seddon, H. M. Patel,S. L. Burkett and S. Mann, Angew. Chem., Int. Ed., 2002, 41,2988–2991; (c) H. Imai and Y. Oaki, Angew. Chem., 2004,
3012 | Nanoscale, 2013, 5, 3006–3012
116, 1387–1392; (d) T. Shimizu, M. Masuda andH. Minamikawa, Chem. Rev., 2005, 105, 1401–1444.
14 (a) M. Fischlechner and E. Donath, Angew. Chem., Int. Ed.,2007, 46, 3184–3193; (b) H. Robson Marsden and A. Kros,Angew. Chem., Int. Ed., 2010, 49, 2988–3005.
15 J. Xie, Y. Zheng and J. Y. Ying, J. Am. Chem. Soc., 2009, 131,888–889.
16 (a) C. E. Fowler, M. Li, S. Mann and H. C. Margolis, J. Mater.Chem., 2005, 15, 3317–3325; (b) H. Chen, Z. Tang, J. Liu,K. Sun, S. R. Chang, M. C. Peters, J. F. Manseld,A. Czajka-Jakubowska and B. H. Clarkson, Adv. Mater.,2006, 18, 1846–1851.
17 (a) G. Yin, Z. Liu, J. Zhan, F. Ding and N. Yuan, Chem. Eng. J.,2002, 87, 181–186; (b) J. Xie, J. Y. Lee and D. I. C. Wang,J. Phys. Chem. C, 2007, 111, 10226–10232.
18 R. Yogamalar, R. Srinivasan, A. Vinu, K. Ariga and A. C. Bose,Solid State Commun., 2009, 149, 1919–1923.
19 A. Wright and M. Thompson, Biophys. J., 1975, 15, 137–141.
20 Y. Y. Kim, L. Ribeiro, F. Maillot, O. Ward, S. J. Eichhorn andF. C. Meldrum, Adv. Mater., 2010, 22, 2082–2086.
21 (a) S. Sarda, M. Heughebaert and A. Lebugle, Chem. Mater.,1999, 11, 2722–2727; (b) M. Bujan, M. Sikiric, N. Filipovic-Vincekovic, N. Vdovic, N. Garti and H. Furedi-Milhofer,Langmuir, 2001, 17, 6461–6470.
22 (a) Z. Li, A. Weller, R. Thomas, A. Rennie, J. Webster,J. Penfold, R. Heenan and R. Cubitt, J. Phys. Chem. B, 1999,103, 10800–10806; (b) M. S. Hellsing, A. R. Rennie andA. V. Hughes, Langmuir, 2011, 27, 4669–4678.
23 Z. X. Li, J. R. Lu, R. K. Thomas, A. Weller, J. Penfold,J. R. P. Webster, D. S. Sivia and A. R. Rennie, Langmuir,2001, 17, 5858–5864.
24 J. Selinger, F. MacKintosh and J. Schnur, Phys. Rev. E: Stat.Phys., Plasmas, Fluids, Relat. Interdiscip. Top., 1996, 53,3804–3838.
25 P. Nelson and T. Powers, J. Phys. II, 1993, 3, 1535–1569.26 (a) A. Singh, T. G. Burke, J. M. Calvert, J. H. Georger,
B. Herendeen, R. R. Price, P. E. Schoen and P. Yager,Chem. Phys. Lipids, 1988, 47, 135–148; (b) M. S. Spector,J. V. Selinger, A. Singh, J. M. Rodriguez, R. R. Price andJ. M. Schnur, Langmuir, 1998, 14, 3493–3500.
27 U. Olsson, T. C. Wong and O. Soederman, J. Phys. Chem.,1990, 94, 5356–5361.
28 (a) C. J. Eckhardt, N. M. Peachey, D. R. Swanson,J. M. Takacs, M. A. Khan, X. Gong, J. H. Kim, J. Wang andR. A. Uphaus, Nature, 1993, 362, 614–616; (b) H. Fang,L. C. Giancarlo and G. W. Flynn, J. Phys. Chem. B, 1998,102, 7311–7315; (c) S. De Feyter, A. Gesquiere,P. C. M. Grim, F. C. De Schryver, S. Valiyaveettil,C. Meiners, M. Sieffert and K. Mullen, Langmuir, 1999, 15,2817–2822.
29 C. Larpent and X. Chasseray, Tetrahedron, 1992, 48, 3903–3914.
30 J. V. Selinger, M. S. Spector and J. M. Schnur, J. Phys. Chem. B,2001, 105, 7157–7169.
31 L. M. Blinov, Structure and Properties of Liquid Crystals,Springer Verlag, 2010, vol. 123.
This journal is ª The Royal Society of Chemistry 2013

Lamellar organic–inorganic architecture via classical screw growth
Yan Quan,a Halei Zhai,a Zhisen Zhang,a Xurong Xu*b and Ruikang Tang*ab
Received 22nd May 2012, Accepted 6th July 2012
DOI: 10.1039/c2ce25805f
The fabrication of organic–inorganic composites with well-defined lamellar internal structure is of
great interest in current materials society. Inspired by the biomineralization of nacre, we found that
an organic–inorganic lamellar hybrid can be achieved spontaneously and readily using classical screw
growth, which is well-described by Burton–Cabrera–Frank (BCF) theory for solution crystal growth.
Herein, we demonstrate that a combination of calcium phosphate and sodium bis(2-ethylhexyl)
sulfosuccinate in the presence of bovine serum albumin leads to hybrid crystals with nacre-like
structure via the conventional crystallization strategy. Accordingly, solution techniques for
crystallization regulation can be used readily to control product habits. This study demonstrates how
the BCF mechanism is of relevance in biomimetic composition generation. Such a biomimetic
approach may aid in creating novel organic–inorganic composites through classical pathways.
1 Introduction
In biological systems, organic and inorganic components
intimately associate into well-organized nanocomposite materi-
als with optimized performances.1,2 Nacre, the inner shell layer
of mother of pearl, provides a fascinating example of the power
of nature, which can assemble structures with remarkable
mechanical strength and toughness (Fig. 1a).3–5 To ensure
optimal mechanical characteristics, the calcium carbonate
crystals in nacre arrange into parallel laminas and these
inorganic layers are separated by sheets of organic matrix
composed of biological macromolecules, such as chitin and
proteins.6–8 This wonderful arrangement of organic–inorganic
lamellar structure can improve the material’s toughness sig-
nificantly. For example, the toughness of nacre is 3000 times
higher than that of pure calcium carbonate crystals.9,10 Inspired
by such a remarkable characteristic, scientists have endeavoured
to design hybrid composites with nacre-like architecture.11
Various methods such as layer-by-layer (LbL) assembly,12,13
freeze casting14,15 and colloidal-based synthesis16 etc. have been
used. In laboratories, LbL may be the most common technique,
which, as suggested by its name, consists of a layer-by-layer
assembly by dipping the material into first one component then
another to make multilayered composites like nacre.17
However, nature is more sophisticated in using self-assembly
strategies to construct structurally well-defined arrays,18 provid-
ing the basis of a wide variety of complex structures. Cartwright
et al. and Wada revealed that nacre is generated by simulta-
neously integrating the growth of the inorganic and organic
phases via a conventional crystal growth process rather than by
the artificial LbL deposition.19,20 At the growth fronts of nacre,
chitin crystallites act as amphiphilic molecules and self-assemble
into liquid crystal layers. Then, chitin layers along with protein
serve as templates and modulate the mineralization process. In
the ultimate section, chitin–calcium carbonate lamellar is
gradually constructed at the growing surface.21 An experimental
proof is that spiral patterns (Fig. 1b) are frequently found on the
growing surface of nacre under a scanning electron microscope
(SEM), which suggests a classical mechanism of screw growth.21
It is well known that either inorganic ions or biomolecules can be
organized into highly ordered structures at the atom scale by
forming corresponding crystals via screw growth.22,23 This screw
growth mechanism, as suggested by BCF theory,24 can give rise
to crystals universally under various conditions including
biomineralization.25 The natural formation of nacre inspires us
to design functional materials using more efficient pathways.26
An attempt at biomimetic lamellar hybrid fabrication through
conventional crystal growth will have many important techno-
logical applications in materials science and will provide an in-
depth understanding of the physicochemical mechanisms about
aCentre for Biomaterials and Biopathways, Department of Chemistry andState Key Laboratory of Silicon Materials, Zhejiang University,Hangzhou, Zhejiang, 310027, China. E-mail: [email protected];Fax: +86 571 87953736; Tel: +86 571 87953736bQiushi Academy for Advanced Studies, Zhejiang University, Hangzhou,Zhejiang, 310027, China. E-mail: [email protected]
Fig. 1 (a) Nacre is the inner shell layer with optimized mechanical
strength. (b) The spiral growth pattern on nacre’s growing surface
indicates a BCF mechanism in this biomineralization process; this image
was prepared based upon Cartwright et al.’s observations.21
CrystEngComm Dynamic Article Links
Cite this: CrystEngComm, 2012, 14, 7184–7188
www.rsc.org/crystengcomm PAPER
7184 | CrystEngComm, 2012, 14, 7184–7188 This journal is � The Royal Society of Chemistry 2012
Publ
ishe
d on
06
July
201
2. D
ownl
oade
d by
Uni
vers
ity o
f C
alif
orni
a -
San
Fran
cisc
o on
24/
01/2
016
05:5
4:24
. View Article Online / Journal Homepage / Table of Contents for this issue

bio-constructions of composite materials with complicated
structures.
We have found that a combination of sodium bis(2-ethylhexyl)
sulfosuccinate (AOT, an anionic amphiphilic molecule) and
bovine serum albumin (BSA, one of the common proteins in
biomineralization studies) on calcium phosphate biomimetic
mineralization gives rise to a spontaneous assembly of hybrid
crystals with regular rhombus morphology.27 These hybrid
crystals have a lamellar structure with the alternate stacking of
inorganic phase layers and organic phase layers, which has been
demonstrated in our previous work.27 Although the mechanical
properties of the material have been studied, the formation
mechanism is still a mystery.27 Herein, we reveal that the nacre-
like lamellar structure can be constructed artificially via a
classical screw growth mechanism, which is similar to the
biological pathway for nacre formation. Furthermore, the
morphology of the hybrid crystals can be tuned using crystal
growth techniques, exhibiting a significant advantage over the
other synthesis strategies such as LbL. Coincidentally, biominer-
alization systems are also sophisticated in such crystallization
regulation to produce various composite materials in nature.
2 Experimental section
2.1 Materials and preparation
BSA and AOT were purchased from LABMAX and Sigma,
respectively. Ca(NO3)2?4H2O and (NH4)2HPO4 were from
Aladdin. All chemicals were used without any further purifica-
tion and all solutions were filtered through 0.22 mm Millipore
membranes prior to use.
In a typical synthesis experiment, 50 ml Ca(NO3)2 (5 mM) was
added to 100 ml solution containing 4 mM AOT and 2 mg ml21
BSA and the pH was adjusted to 10.0 ¡ 0.5 using 5 M
NH3?H2O. Then, 50 ml (NH4)2HPO4 (3 mM, pH of 10.0 ¡ 0.5)
was added dropwise at a rate of 1.5 ml min21 to initiate the
precipitation. The typical reaction period was 24 h and the solids
were collected by centrifugation (6000 rpm) at the end of the
experiment.
2.2 Re-growth and dissolution
The above-prepared solids were used as seed crystals. About 1 mg
seeds were immersed into 50 mL freshly prepared aqueous solutions
with different compositions: (i) 2.0 mM AOT, 1.0 mg ml21 BSA,
1.25 mM Ca(NO3)2, 0.75 mM (NH4)2HPO4; (ii) 2.0 mM AOT,
1 mg ml21 BSA, 2.50 mM Ca(NO3)2, 1.50 mM (NH4)2HPO4. The
different solutions could result in an alteration of crystal habit. The
re-growth period was 12 h.
In a dissolution experiment, about 1 mg crystals were
dispersed in 10 ml 10 mM tris(hydroxymethyl)aminomethane
buffer solution with a pH of 8.8. During the experiment, solids
were withdrawn periodically from the slurry for examination.
2.3 Characterization
In transmission electron microscopy (TEM) studies, the reaction
suspensions were dropped on carbon-coated copper grids and
dried in air. The observations were performed using a Philips CM
200UT at a typical accelerating voltage of 160 kV. For ultrathin-
sectioned TEM examination, the dried rhombic crystals were
embedded in 0.5 ml of epoxy. The mixture was solidified at 80 uCfor 12 h and sliced using a Reichert-Jung Ultracut. The typical
thickness of an ultrathin section was 80 nm.
SEM was performed by using a HITACHI S-4800 at an
accelerating voltage of 5 kV. Wide angle X-ray diffraction
(WAXD) and small angle X-ray diffraction (SAXD) were carried
out with a Rigaku D/max-2550pc with monochromatized Cu-Ka
radiation. AFM was performed with a Nanoscope IVa (Veeco,
USA) on the seed crystals. All images were acquired in contact
mode. The tip force exerted on the surface was optimized to
reduce the imaging artefacts.
3 Results and discussion
The obtained hybrids had a rhombic crystal-like morphology
and contained two basic nanoscale subunits: the organic layer
and the ultrathin calcium phosphate (CaP) inorganic layer. A
sectioned TEM study revealed that both organic and inorganic
components were orderly integrated to generate the lamellar
hybrid structure (Fig. 2a) within the hybrid: the dark lines and
bright lines represent mineral and organic phases, respectively
(under TEM, the inorganic phase result in higher contrast due to
the relatively greater electron density, e.g. the electron densities
of Ca and P in the mineral phase are much greater than those of
C and H in the organic phase). The inorganic layers (2.13 nm),
together with organic layers (1.31 nm), constituted a basic unit
(3.44 nm) for the complex. This ordered structure was also
demonstrated by WAXD and SAXD (Fig. 2b), showing an
alternate structure (d = 3.44 nm) and brushite phase in the CaP
layer. Such an organic–inorganic nanostructure conferred
optimized mechanical properties on this artificial material,
especially elastic properties. For example, its modulus, 6.64 ¡
1.41 GPa,25 is even lower than that of elastic-featured human
vertebral trabeculae, 13.5 ¡ 2.0 GPa.27 In contrast, typical
moduli of pure CaP compounds are always >90 GPa.28 This
elastic property shows that the hybrid can be an excellent
candidate for a mechanical substitute in tissue engineering and
also directs to a bone-like structural design.
With the magnification under SEM, we could note that the
hybrid crystal surfaces were made up of a striking arrangement
Fig. 2 (a) SEM image of the spontaneously formed AOT–calcium
phosphate organic–inorganic hybrid architecture; insert shows the
lamellar structure inside the hybrid from a side view of an ultrathin
section: dark and light lines represent the inorganic calcium phosphate
layers and the organic AOT bilayers, respectively. (b) WAXD and SAXD
patterns showing the lamellar structure. Note: the WAXD pattern could
be fitted using brushite (JCPDS 09-0077); however, the peaks of the
standard brushite, 30.51u and 29.26u, were shifted to 30.14u and 28.59u,respectively. These shifts could be explained by the nano size effect of the
ultrathin mineral layer.
This journal is � The Royal Society of Chemistry 2012 CrystEngComm, 2012, 14, 7184–7188 | 7185
Publ
ishe
d on
06
July
201
2. D
ownl
oade
d by
Uni
vers
ity o
f C
alif
orni
a -
San
Fran
cisc
o on
24/
01/2
016
05:5
4:24
. View Article Online

of spiral and labyrinthine patterns. Different types of spirals, such
as left-handed-coiled (Fig. 3a), right-handed-coiled (Fig. 3b) and
paired (Fig. 3c), spread over the hybrid surfaces. These typical
patterns were exactly similar to those observed in nacre
formation.21 Generally, such microscopic spirals often appear
on crystal surfaces when crystals grow slowly in solution. About
sixty years ago, Frank et al. proposed an explanation, suggesting
that dislocations lead to crystal growth.24 Because the crystal
plane around a screw dislocation is a helicoid, the steps advance in
a spiral staircase fashion without any need of nucleating new
layers. The emerged steps gradually wave from centre to edges and
then continuously form new surface. Analogously, the alternate
layered structure was constructed by the spontaneous generation
and movement of the hybrid step outward in this case. If the
movements of spiral steps were blocked or failed to reach the edge
of the crystal, the growth of crystal would be restricted at the local
region but keep on promoting protuberant spirals. This step
termination could be demonstrated by some ‘‘incomplete’’ crystal
(Fig. 3d); the layered structure inside the hybrid could be
identified readily. The observed spiral stair was solid experimental
proof to confirm the screw mechanism for the hybrid formation.
The classical crystal growth theory suggests that the tangential
growth mechanism leads to growth hillocks formed of piles of
the original dislocation resource of the hillocks.29,30 Fig. 4a
shows details about the original dislocation resource of a hillock
on the surface of a hybrid. In our experiments, the sizes of
original steps were located within a range of 12–20 nm. This
dimension could be roughly considered as the critical diameter
size of the growth steps. A simplified spiral model, the
Archimedean spiral, was used to describe the screw around the
hillock. If the rates of advance of the steps in every direction
were the same, the terrace width, W, in the screw should equal to
4prc, in which rc was the radius of curvature of the step at the
emergence point of dislocation.31 The averaged values of W were
70–125 nm and thereby, the calculated 2rc from W values were
about 12–20 nm, which agreed with the direct measurements.
We found that the deviations for measurements of W and 2rc
were relatively great in this case, which should be attributed to
the anisotropic characteristics of the screws. Accordingly, we
introduced Wx and Wy to represent the terrace widths along the
different directions (Fig. 4b). Wx mostly lay in a range of 70 ¡
10 nm, while Wy, 110 ¡ 15 nm (Fig. 4c). The ratio of Wy to Wx
was about 1.5. This value was close to the ratio of the hybrid
crystal dimensions along the same directions. This consistence
indicated that the morphology of the crystals was dominated by
the geometrical feature of steps, which was also proposed by the
single screw growth model in BCF theory.
AFM characterizations revealed more details about the spiral
steps (Fig. 4d), the height between each terrace always raised
approximately 6.88 ¡ 0.30 nm (Fig. 4e). Occasionally, the
dislocation step at the growth hillock was developed into an out
extended layer (Fig. 4f) when the newly formed step terrace failed
to extend on the presented surface. The ‘‘unexpected born’’ layer
had a thickness of approximately 7 nm. This phenomenon could
be used to represent the step height independently. Our study has
showed that the inorganic and organic layers had thicknesses of
2.13 nm and 1.31 nm, respectively (Fig. 2a). The dimension of each
integrated organic–inorganic layered structure was 3.44 nm
(Fig. 2b) and therefore, each step composed two composite
layers. Why the hybrid material selected two units of the mineral–
AOT complexes to establish a step has not been resolved yet.
Nevertheless, this hybrid step was relevant to the spiral growth
fronts in nacre formation. In nature, the step front for nacre
growth typically involves three components: mineral, protein and
chitin acting as amphiphilic molecules. Coincidentally, the three
Fig. 3 SEM images of hybrid crystals. (a) Left-handed spiral pattern.
(b) Right-handed spiral pattern. (c) Paired spiral pattern. (d) Spiral stairs
in an ‘‘incomplete’’ crystal.
Fig. 4 Measurement of the growth step on hybrid surfaces. (a) SEM
image of a hillock source, 2rc represents the critical diameter of the spiral
step. (b) Scheme of the anisotropic screw, x is the short axis, y is the long
axis. (c) Statistical histogram of the Wx and Wy measurements; the curves
are produced based on the Gaussian fits. (d–e) AFM height image and
section analysis of the hybrid surface revealing that the step height may
correspond to the dimension of two organic–inorganic composite layers.
(f) SEM of an independent grown layer with a thickness of y7 nm.
7186 | CrystEngComm, 2012, 14, 7184–7188 This journal is � The Royal Society of Chemistry 2012
Publ
ishe
d on
06
July
201
2. D
ownl
oade
d by
Uni
vers
ity o
f C
alif
orni
a -
San
Fran
cisc
o on
24/
01/2
016
05:5
4:24
. View Article Online

biological components were represented by calcium phosphate,
BSA and AOT, respectively, in our biomimetic case.
We emphasized that the lamellar architectures could not be
produced without BSA or AOT. Our previous work showed that
if only BSA or AOT existed in the calcium phosphate solution,
CaP nanoparticles or nanorods could be induced, respectively,27
which were not organic–inorganic structured. It has been
concluded that the cooperative effect of BSA and AOT on
CaP mineralization was essential in the hybrid formation.27 In
the hybrid, the AOT bilayers and the CaP ultrathin layers were
the primary component but BSA played an adsorption role to
stabilize the structure.27 The relatively large size of BSA made it
impossible for the molecule to be present inside the hybrid.
Actually, we also labelled BSA using Au nanoparticles and
examinations showed that BSA only adsorbed onto the material
surfaces. Another proof is that the hybrids could also be
produced if BSA was replaced by silk fibroin, implying that BSA
did not participate in the inner structure but was an important
additive to ensure the hybrid formation. During the solution
growth, the anisotropic adsorption of additives on the steps
always results in a change of step morphology at the microscopic
level,32 leading to an alternation of crystal habit at the
macroscopic level. Accordingly, we have found that different
BSA concentrations could lead to expected changes of hybrid
morphology.33 This phenomenon implied that the hybrid crystal
could be tunable by conventional crystallization techniques to
obtain the required dimensions and morphologies.
A hybrid crystal with size 736 nm 6 558 nm 6 135 nm
(Fig. 5a) was used as a seed crystal. By incubation in a freshly
prepared reaction solution (see experimental section for
details), the crystal could become large with new dimensions of
1260 nm 6 949 nm 6 176 nm (Fig. 5b), demonstrating an ideal
3-dimensional growth behaviour. In contrast, the LbL deposi-
tion resulted in only 1-dimensional (thickness) increase in the
products. It was noticed that the screw steps remained, which
were similar to the original ones on the seed. Generally, crystal
habit or morphology is relevant to the steps.34,35 The above-
mentioned anisotropic growth spiral (Wy to Wx was about 1.5)
led to rhombic crystal formation. Under conditions in which
the concentrations of calcium and phosphate were doubled in
the reaction solution, the anisotropic feature of the spiral
was enhanced; the spiral elongated in a spindle-like fashion.
Accordingly, the grown crystal evolved from a rhomb into a
spindle (Fig. 5c) with significantly increased dimensions along
the y axis. This was a specific example of the morphology and
dimensions of the hybrid crystals being adjusted by solution
composition in conventional crystallization methods. Such
solution-based regulation is sophisticated in natural biominer-
alization but was unavailable in other artificial techniques for
lamellar fabrication.
Dissolution is not a simple reversed process of crystal growth.
Actually, dissolution was initiated from etched pits, which were
always produced at the point characterized by the highest stress
on crystal surfaces.36 It is well known that the presence of screw
dislocations causes stress and that the stress is also radiating
outward from the screw centre and decreasing with radial
distance. It follows that the greatest stress on the crystal surface
is at the screw centre. Fig. 5d–f show a typical dissolution
process of the nacre-like hybrids. At the initial stage, the
dissolution pits were always born at the screw centres, which
were also the centres of crystal surfaces (Fig. 5d). During the
dissolutions, the pits become deeper and larger to provide
dissolution contributions and they shared similar anisotropic
features with the growth ones. The layered structure inside the
pits could also be observed under TEM (Fig. 5e). Interestingly,
the pits shared similar anisotropic features with the growth steps.
Analogous to a single screw growth mechanism, a single pit was
frequently observed in the dissolution and this feature resulted in
an eye-like structure (Fig. 5f). Again, the observed dissolution
phenomenon supported the BCF model for the hybrid forma-
tion. On the contrary, if the hybrid had formed by the LbL
deposition, the hybrid would be peeled layer by layer rather than
by dissolution from the centre.
Fig. 5 Growth of rhombic crystals in different conditions and with
different periods of dissolution in solution. (a) SEM of seed crystal. (b)
SEM of the re-grown crystal. (c) SEM of re-grown crystal under different
solution conditions; the morphologies of crystals are changing with the
step morphology change. (d) Initially formed pit on the dissolving hybrid
surfaces. (e) TEM of an intermediate dissolution state. (f) SEM of an
‘‘eye-like’’ crystal resulting from dissolution.
Fig. 6 Scheme of the classical growth model. The spiral hillock
represents the steps on the surface of a crystal. The magnification shows
the step consists of two hybrid layers. The grey part in the right corner
represents calcium phosphate; the molecule with two tails represents
AOT, BSA proteins adsorbed on the step stabilize the structure.
This journal is � The Royal Society of Chemistry 2012 CrystEngComm, 2012, 14, 7184–7188 | 7187
Publ
ishe
d on
06
July
201
2. D
ownl
oade
d by
Uni
vers
ity o
f C
alif
orni
a -
San
Fran
cisc
o on
24/
01/2
016
05:5
4:24
. View Article Online
Based on above experimental results, we proposed a model for
the hybrid formation (Fig. 6). A screw hillock emerging on the
growing surface dominated the crystallization. The complete step
contained two organic–inorganic complex units and the lamellar
organic–inorganic crystals were generated by the continued
generation and expansion of steps from the surface centre. The
anisotropic movement and the morphological characteristics of
the hillock step controlled the habit of hybrid crystals, which
could be adjusted by either solution composition or BSA
adsorption.
4 Conclusions
In summary, we have shown an alternative understanding of
complicated lamellar composite generation using the classical
screw crystal growth mechanism. The study brings inspiration to
biomimetic materials preparation using conventional pathways.
Such a simple attempt at lamellar hybrid crystal fabrication will
have many important technological applications in materials
science and will also provide an in-depth understanding about
biomimetic constructions of composite materials.
References
1 H. Colfen and S. Mann, Angew. Chem., Int. Ed., 2003, 42, 2350.2 G. K. Xu, W. Lu, X. Q. Feng and S. W. Yu, Soft Matter, 2011, 7,
4828.3 L. Xie, F. Zhu, Y. Zhou, C. Yang and R. Zhang, Prog. Mol. Subcell.
Biol., 2011, 52, 331.4 X. Li, W. C. Chang, Y. J. Chao, R. Wang and M. Chang, Nano Lett.,
2004, 4, 613.5 E. Munch, M. E. Launey, D. H. Alsem, E. Saiz, A. P. Tomsia and
R. O. Ritchie, Science, 2008, 322, 1516.6 M. Suzuki, K. Saruwatari, T. Kogure, Y. Yamamoto, T. Nishimura,
T. Kato and H. Nagasawa, Science, 2009, 325, 1388.7 S. Blank, M. Arnoldi, S. Khoshnavaz, L. Treccani, M. Kuntz, K.
Mann, G. Grathwohl and M. Fritz, J. Microsc., 2003, 212, 280.8 F. Nudelman, B. A. Gotliv, L. Addadi and S. Weiner, J. Struct. Biol.,
2006, 153, 176.9 K. S. Katti, D. R. Katti, S. M. Pradhan and A. Bhosle, J. Mater.
Res., 2005, 20, 1097.
10 L. Bedouet, M. Jose Schuller, F. Marin, C. Milet, E. Lopez and M.Giraud, Comp. Biochem. Physiol., Part B: Biochem. Mol. Biol., 2001,128, 389.
11 L. Wang and M. C. Boyce, Adv. Funct. Mater., 2010, 20, 3025.12 Z. Tang, N. A. Kotov, S. Magonov and B. Ozturk, Nat. Mater.,
2003, 2, 413.13 P. Podsiadlo, Z. Liu, D. Paterson, P. B. Messersmith and N. A.
Kotov, Adv. Mater., 2007, 19, 949.14 E. Munch, M. E. Launey, D. H. Alsem, E. Saiz, A. P. Tomsia and
R. O. Ritchie, Science, 2008, 322, 1516.15 S. Deville, E. Saiz, R. K. Nalla and A. P. Tomsia, Science, 2006, 311,
515.16 L. J. Bonderer, A. R. Studart and L. J. Gauckler, Science, 2008, 319,
1069.17 C. Jiang and V. V. Tsukruk, Adv. Mater., 2006, 18, 829.18 Y. Oaki and H. Imai, Angew. Chem., Int. Ed., 2005, 44, 6571.19 J. H. E. Cartwright, A. G. Checa, B. Escribano and C. I. Sainz-Dıaz,
Proc. Natl. Acad. Sci. U. S. A., 2009, 106, 10499.20 K. Wada, Nature, 1966, 211, 1427.21 J. H. E. Cartwright and A. G. Checa, J. R. Soc. Interface, 2007, 4,
491.22 J. Christoffersen and M. R. Christoffersen, J. Cryst. Growth, 1990,
100, 203.23 T. A. Land, A. J. Malkin, Y. G. Kuznetsov, A. McPherson and J. J.
De Yoreo, Phys. Rev. Lett., 1995, 75, 2774.24 W. K. Burton, N. Carbrera and F.C. Frank, Philos. Trans. R. Soc.
London, Ser. A, 1951, 243, 299.25 J. De Yoreo, L. Zepeda-Ruiz, R. Friddle, S. Qiu, L. Wasylenki, A.
Chernov, G. Gilmer and P. Dove, Cryst. Growth Des., 2009, 9, 5135.26 A. Sellinger, P. M. Weiss, A. Nguyen, Y. Lu, R. A. Assink, W. Gong
and C. J. Brinker, Nature, 1998, 394, 256.27 H. Zhai, W. Jiang, J. Tao, S. Lin, X. Chu, X. Xu and R. Tang, Adv.
Mater., 2010, 22, 3729.28 M. Milosevski, J. Bossert, D. Milosevski and N. Gruevska, Ceram.
Int., 1999, 25, 693.29 A. Chernov, Sov. Phys. Usp., 1961, 4, 116.30 C. M. Pina Martınez, U. Becker, P. Risthaus, D. Bosbach and A.
Putnis, Nature, 1998, 395, 483.31 I. V. Markov, Crystal Growth for Beginners: Fundamentals of
Nucleation, Crystal Growth and Epitaxy, World Scientific Pub. Co.Inc., Singapore, 2003.
32 G. Fu, S. R. Qiu, C. A. Orme, D. E. Morse and J. J. De Yoreo, Adv.Mater., 2005, 17, 2678.
33 H. Zhai, X. Chu, L. Li, X. Xu and R. Tang, Nanoscale, 2010, 2, 2456.34 J. J. De Yoreo and P. M. Dove, Science, 2004, 306, 1301.35 H. H. Teng, P. M. Dove, C. A. Orme and J. J. De Yoreo, Science,
1998, 282, 724.36 A. C. Lasaga and A. Luttge, Science, 2001, 291, 2400.
7188 | CrystEngComm, 2012, 14, 7184–7188 This journal is � The Royal Society of Chemistry 2012
Publ
ishe
d on
06
July
201
2. D
ownl
oade
d by
Uni
vers
ity o
f C
alif
orni
a -
San
Fran
cisc
o on
24/
01/2
016
05:5
4:24
. View Article Online

RSC Advances
COMMUNICATION
Publ
ishe
d on
30
May
201
4. D
ownl
oade
d by
Uni
vers
ity o
f C
alif
orni
a -
San
Fran
cisc
o on
24/
01/2
016
05:5
4:02
.
View Article OnlineView Journal | View Issue
aCenter for Biomaterials and Biopathway
University, Hangzhou, China. E-mail: rtan
Tel: +86 571 87953736bQiushi Academy for Advanced Studies, Zhe
† Electronic supplementary informa10.1039/c4ra02821j
‡ These authors contributed equally to th
Cite this: RSC Adv., 2014, 4, 25398
Received 31st March 2014Accepted 30th May 2014
DOI: 10.1039/c4ra02821j
www.rsc.org/advances
25398 | RSC Adv., 2014, 4, 25398–254
Biomimetic graphene oxide–hydroxyapatitecomposites via in situ mineralization andhierarchical assembly†
Yaling Li,‡a Cuilian Liu,‡a Halei Zhai,a Genxing Zhu,a Haihua Pan,ab Xurong Xuab
and Ruikang Tang*ab
A graphene oxide–hydroxyapatite hybrid is synthesized via in situ
mineralization. The integrated HAP nanoplates share similar size,
morphology and orientations with those of natural bones. With their
excellent mechanical properties and biocompatibility, the composites
offer potential applications in load-bearing bone repair, scaffold
materials and as an alternative model for biomimetic research.
Nature has created various excellent materials during theprocess of evolution. The huge diversity of elaborate hierar-chical structures existing in biological systems is increasinglybecoming a source of inspiration for scientists to designadvanced materials.1 These biominerals are usually integratedorganic–inorganic hybrids with distinguished mechanicalproperties, which are quite distinct from individual compo-nents. Despite of the highly controlled hierarchical structures,another common feature is that the biominerals oen involvenanocrystals as building block arranged in high order withorganic molecule as the supporting matrix.2 For example, boneis mainly composed of ultrathin plate-like hydroxyapatite (HAP)nanocrystals (2–5 nm in thickness) and collagen, in which HAPcrystals are parallel aligned and tightly interact with thecollagen bers.3 As one of the most remarkable materials innature, bone usually serves as an elastic structural frame andinternal organ protection in body (with modulus about 10 to 20GPa (ref. 4 and 5)). The nanoscale feature of bone minerals canconfer the optimum strength and the maximum tolerance ofaws on the tissues.2 Although there have been a mass ofresearches on fabrication of bone-like composites,6,7 the arti-cial design of materials mimicking bone both in structure andmechanical property still remains a great challenge.
s, Department of Chemistry, Zhejiang
[email protected]; Fax: +86 571 87953736;
jiang University, Hangzhou, China
tion (ESI) available. See DOI:
e work.
03
Biominerals in tissues are usually formed under the controlof macromolecular templates of proteins, peptides, and poly-saccharides.8–10 During the mineralization process, the organicmatrixes are required to provide not only mechanical supportbut also effective control over minerals crystal nucleation andgrowth to obtain highly ordered deposition and integration.11
Accordingly, the organic templates are desired to possess theadvantages of localized nucleation and ordered assembly atnanoscale. Graphene, a single layer of carbon atoms tightlypacked into a honeycomb lattice, has attracted tremendousattention for its remarkable physical properties.12 Grapheneoxide (GO), one of the most important derivatives of graphene,can be considered as consisting of graphene sheets decoratedwith hydrophilic oxygen functional groups (hydroxyl, epoxide,and carboxyl group).13 Accordingly, it can act as a usefulbuilding block for versatile functional materials synthesis.Various GO-based composites with specic functions have beenreported,14 especially for medical and biological applications,such as tissue engineering,15 drug delivery,16 cellular imaging,17
biosensor,18 and antibacterial materials.19 However, theprevious in vitro and in vivo studies show that GOmight becomea health hazard.20 GO can be internalized by cells, and thenescape from subcellular compartments, travel within the cyto-plasm, and translocate into the nucleuses.21 To adjust thecytotoxicity, biomacromolecules such as chitosan,16 gelatin,22
Tween,23 have been used to modify GO sheets so as to alleviatethe potential risks. Biominerals, like HAP, exhibiting excellentbiocompatibility, have also been suggested to composite withGO to improve weak mechanical properties of the pure HAP aswell as reducing the toxicity of GO.24,25However, we note that thereported fabrication methods are relatively complicated or timeconsuming, and specic macromolecules are usually requiredto pre-modify the GO sheets. More importantly, the uncon-trolled precipitation process of calcium phosphate on GOsurface usually leads to random and weak combination betweenHAP and GO sheets.
In this work, we directly used GO as a mineralizationsubstrate and reinforce component to produce the biomimetic
This journal is © The Royal Society of Chemistry 2014

Communication RSC Advances
Publ
ishe
d on
30
May
201
4. D
ownl
oade
d by
Uni
vers
ity o
f C
alif
orni
a -
San
Fran
cisc
o on
24/
01/2
016
05:5
4:02
. View Article Online
GO–HAP composites via a facile one-step in situ crystallizationmethod. GO could be considered as a two-dimensional (2-D)hydrophilic macromolecule26 with abundant mineralizationrelated groups (hydroxyl, and carboxyl group). The unique 2-Dgeometry of GO could regulate the inorganic phase depositiononto the surface of GO.27 With precise control of mineralization,plate-like HAP could nucleate and growth on GO surface. TheseHAP plates tightly bind with GO with their (100) face. Thus, itwas rather readily to obtain parallel arrangement at 3-D scale asthe layered stack and assembly of the GO sheets.28 Via a vacuumassisted self-assembly process, a GO–HAP paper would be easilyobtained, in which the plate-like nanocrystals were in parallelarrangement on GO. Accordingly, the elastic modulus of theresulted paper could be comparable to modules of natural boneand the resulted composite material exhibited excellentbiocompatibility.
GO was prepared from pristine graphite by a modiedHummers and Offema method.29 GO and calcium chloride weredispersed in ethylene glycol–water mixture solvent (170 mlethylene glycol and 30 ml water), followed by ultrasonication for30 min. Aerwards, disodium hydrogen phosphate aqueoussolution was added to initiate the in situ mineralization ofcalcium phosphate on GO sheets and the reaction was kept at85 � 1 �C for 12 h to accelerate the mineralization process.Under transmission electron microscopy (TEM), the GO sheetswere multilayers with size of a few micrometers (Fig. 1A). Aerthe mineralization process (Fig. 1B), the GO surfaces werecovered by the newly formed nanoplates, which were typicallytens of nanometers in length and width (Fig. 1C). The thicknessof HAP plate was several nanometers by measuring the standingones (Fig. 1C, white arrows), which might be induced by thewrinkle or the fold of GO (Fig. 1C, black arrows). A direct
Fig. 1 TEM images of GO (A) and GO–HAP (B and C) composites, inset iGO and GO–HAP showed good dispersity in water. (D) HRTEM image of H(E) XRD patterns of GO and GO–HAP powder samples. (F) TGA profiles ofand GO–HAP. A large loss of oxygen-functional groups after a one-step
This journal is © The Royal Society of Chemistry 2014
measurement by atomic force microscopy (AFM, Fig. S1†) alsoconrmed that the thickness of the plates was 4.12 � 0.52 nm.The strong diffraction ring in selected area electron diffraction(SAED, Fig. 1B) could be assigned to the (002), (211) and (222)planes of HAP. The Ca/P ratios determined by energy dispersivespectroscopy analysis (EDS, Fig. S2†) were about 1.676 and thevalue was consistent with the stoichiometric ratio of Ca/P inHAP. HRTEM image (Fig. 1D) showed that the exposed surfaceof HAP nanoplates was (100) planes, indicating that the HAPnanoplates bind with GO by the (100) planes. X-Ray Diffractionpatterns (XRD, Fig. 1E) further demonstrated the formation ofHAP. The XRD peaks at 25.9�, 31.8� and 39.8� were indexed tothe (002), (211) and (310) of HAP (JCPDF card # 09-0432),respectively. The strong and sharp peak of GO at 2q ¼ 10.44�
indicate the (001) interlayer spacing of 0.85 nm and AFMexamination showed that GO sheets had a thickness of 0.97 �0.39 nm. This value was much larger than that of pristinegraphite (0.34 nm) due to the introduction of oxygen-containingfunctional groups on the graphite sheets.30 However, aer themineralization, the (001) reection peak of layered GO almostdisappeared, which was consistent with previous studies thatthe diffraction peaks became weakened or even disappearwhenever the regular stacks of GO sheets were exfoliated.31
Further, the small differences between GO and GO–HAP in theRaman study (Fig. S3†) indicated that the GO was not thor-oughly reduced to graphene during the mineralization.32 Theweight ratio of HAP–GO in composites was 2.12 from TGAresults (Fig. 1F, the inuence of adsorbed water was elimi-nated). The initial weight loss around 100 �C in the samples wasdue to the evaporation of absorbed water. Around 250 �C, therewas an obvious weight loss in GO and GO–HAP, which wasattributed to the decomposition of the residual oxygen-
n B (right, up) is selected area electron diffraction (SAED) pattern. BothAP nanoplates on GO sheets, inset was the FFT image of crystal lattice.GO–HAP, GO and HAP. (G and H) XPS analysis of the C1s region in GOsynthesis procedure is evident.
RSC Adv., 2014, 4, 25398–25403 | 25399
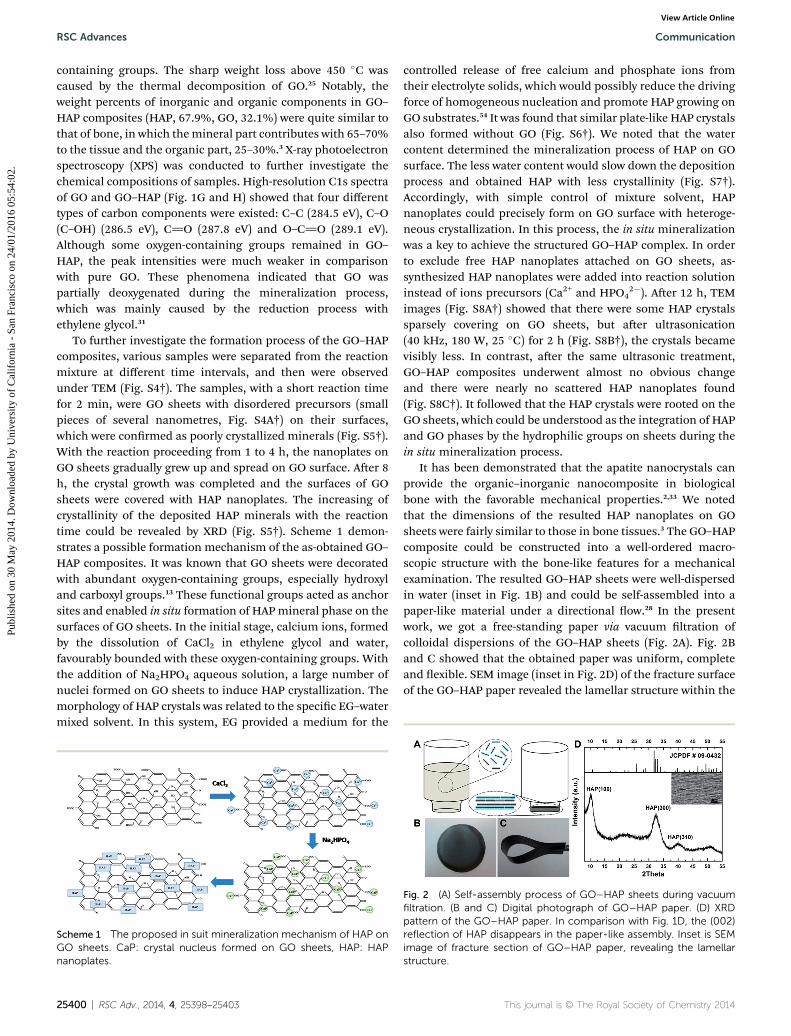
RSC Advances Communication
Publ
ishe
d on
30
May
201
4. D
ownl
oade
d by
Uni
vers
ity o
f C
alif
orni
a -
San
Fran
cisc
o on
24/
01/2
016
05:5
4:02
. View Article Online
containing groups. The sharp weight loss above 450 �C wascaused by the thermal decomposition of GO.25 Notably, theweight percents of inorganic and organic components in GO–HAP composites (HAP, 67.9%, GO, 32.1%) were quite similar tothat of bone, in which themineral part contributes with 65–70%to the tissue and the organic part, 25–30%.3 X-ray photoelectronspectroscopy (XPS) was conducted to further investigate thechemical compositions of samples. High-resolution C1s spectraof GO and GO–HAP (Fig. 1G and H) showed that four differenttypes of carbon components were existed: C–C (284.5 eV), C–O(C–OH) (286.5 eV), C]O (287.8 eV) and O–C]O (289.1 eV).Although some oxygen-containing groups remained in GO–HAP, the peak intensities were much weaker in comparisonwith pure GO. These phenomena indicated that GO waspartially deoxygenated during the mineralization process,which was mainly caused by the reduction process withethylene glycol.31
To further investigate the formation process of the GO–HAPcomposites, various samples were separated from the reactionmixture at different time intervals, and then were observedunder TEM (Fig. S4†). The samples, with a short reaction timefor 2 min, were GO sheets with disordered precursors (smallpieces of several nanometres, Fig. S4A†) on their surfaces,which were conrmed as poorly crystallized minerals (Fig. S5†).With the reaction proceeding from 1 to 4 h, the nanoplates onGO sheets gradually grew up and spread on GO surface. Aer 8h, the crystal growth was completed and the surfaces of GOsheets were covered with HAP nanoplates. The increasing ofcrystallinity of the deposited HAP minerals with the reactiontime could be revealed by XRD (Fig. S5†). Scheme 1 demon-strates a possible formation mechanism of the as-obtained GO–HAP composites. It was known that GO sheets were decoratedwith abundant oxygen-containing groups, especially hydroxyland carboxyl groups.13 These functional groups acted as anchorsites and enabled in situ formation of HAPmineral phase on thesurfaces of GO sheets. In the initial stage, calcium ions, formedby the dissolution of CaCl2 in ethylene glycol and water,favourably bounded with these oxygen-containing groups. Withthe addition of Na2HPO4 aqueous solution, a large number ofnuclei formed on GO sheets to induce HAP crystallization. Themorphology of HAP crystals was related to the specic EG–watermixed solvent. In this system, EG provided a medium for the
Scheme 1 The proposed in suit mineralization mechanism of HAP onGO sheets. CaP: crystal nucleus formed on GO sheets, HAP: HAPnanoplates.
25400 | RSC Adv., 2014, 4, 25398–25403
controlled release of free calcium and phosphate ions fromtheir electrolyte solids, which would possibly reduce the drivingforce of homogeneous nucleation and promote HAP growing onGO substrates.54 It was found that similar plate-like HAP crystalsalso formed without GO (Fig. S6†). We noted that the watercontent determined the mineralization process of HAP on GOsurface. The less water content would slow down the depositionprocess and obtained HAP with less crystallinity (Fig. S7†).Accordingly, with simple control of mixture solvent, HAPnanoplates could precisely form on GO surface with heteroge-neous crystallization. In this process, the in situ mineralizationwas a key to achieve the structured GO–HAP complex. In orderto exclude free HAP nanoplates attached on GO sheets, as-synthesized HAP nanoplates were added into reaction solutioninstead of ions precursors (Ca2+ and HPO4
2�). Aer 12 h, TEMimages (Fig. S8A†) showed that there were some HAP crystalssparsely covering on GO sheets, but aer ultrasonication(40 kHz, 180 W, 25 �C) for 2 h (Fig. S8B†), the crystals becamevisibly less. In contrast, aer the same ultrasonic treatment,GO–HAP composites underwent almost no obvious changeand there were nearly no scattered HAP nanoplates found(Fig. S8C†). It followed that the HAP crystals were rooted on theGO sheets, which could be understood as the integration of HAPand GO phases by the hydrophilic groups on sheets during thein situ mineralization process.
It has been demonstrated that the apatite nanocrystals canprovide the organic–inorganic nanocomposite in biologicalbone with the favorable mechanical properties.2,33 We notedthat the dimensions of the resulted HAP nanoplates on GOsheets were fairly similar to those in bone tissues.3 The GO–HAPcomposite could be constructed into a well-ordered macro-scopic structure with the bone-like features for a mechanicalexamination. The resulted GO–HAP sheets were well-dispersedin water (inset in Fig. 1B) and could be self-assembled into apaper-like material under a directional ow.28 In the presentwork, we got a free-standing paper via vacuum ltration ofcolloidal dispersions of the GO–HAP sheets (Fig. 2A). Fig. 2Band C showed that the obtained paper was uniform, completeand exible. SEM image (inset in Fig. 2D) of the fracture surfaceof the GO–HAP paper revealed the lamellar structure within the
Fig. 2 (A) Self-assembly process of GO–HAP sheets during vacuumfiltration. (B and C) Digital photograph of GO–HAP paper. (D) XRDpattern of the GO–HAP paper. In comparison with Fig. 1D, the (002)reflection of HAP disappears in the paper-like assembly. Inset is SEMimage of fracture section of GO–HAP paper, revealing the lamellarstructure.
This journal is © The Royal Society of Chemistry 2014
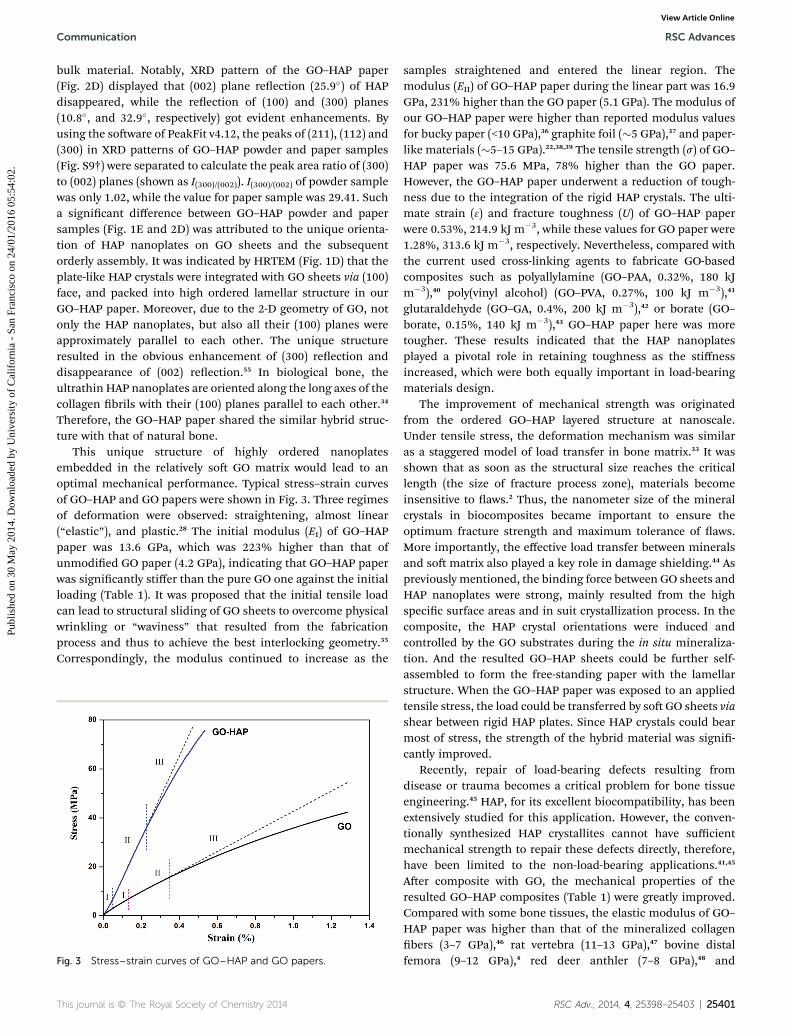
Communication RSC Advances
Publ
ishe
d on
30
May
201
4. D
ownl
oade
d by
Uni
vers
ity o
f C
alif
orni
a -
San
Fran
cisc
o on
24/
01/2
016
05:5
4:02
. View Article Online
bulk material. Notably, XRD pattern of the GO–HAP paper(Fig. 2D) displayed that (002) plane reection (25.9�) of HAPdisappeared, while the reection of (100) and (300) planes(10.8�, and 32.9�, respectively) got evident enhancements. Byusing the soware of PeakFit v4.12, the peaks of (211), (112) and(300) in XRD patterns of GO–HAP powder and paper samples(Fig. S9†) were separated to calculate the peak area ratio of (300)to (002) planes (shown as I(300)/(002)). I(300)/(002) of powder samplewas only 1.02, while the value for paper sample was 29.41. Sucha signicant difference between GO–HAP powder and papersamples (Fig. 1E and 2D) was attributed to the unique orienta-tion of HAP nanoplates on GO sheets and the subsequentorderly assembly. It was indicated by HRTEM (Fig. 1D) that theplate-like HAP crystals were integrated with GO sheets via (100)face, and packed into high ordered lamellar structure in ourGO–HAP paper. Moreover, due to the 2-D geometry of GO, notonly the HAP nanoplates, but also all their (100) planes wereapproximately parallel to each other. The unique structureresulted in the obvious enhancement of (300) reection anddisappearance of (002) reection.55 In biological bone, theultrathin HAP nanoplates are oriented along the long axes of thecollagen brils with their (100) planes parallel to each other.34
Therefore, the GO–HAP paper shared the similar hybrid struc-ture with that of natural bone.
This unique structure of highly ordered nanoplatesembedded in the relatively so GO matrix would lead to anoptimal mechanical performance. Typical stress–strain curvesof GO–HAP and GO papers were shown in Fig. 3. Three regimesof deformation were observed: straightening, almost linear(“elastic”), and plastic.28 The initial modulus (EI) of GO–HAPpaper was 13.6 GPa, which was 223% higher than that ofunmodied GO paper (4.2 GPa), indicating that GO–HAP paperwas signicantly stiffer than the pure GO one against the initialloading (Table 1). It was proposed that the initial tensile loadcan lead to structural sliding of GO sheets to overcome physicalwrinkling or “waviness” that resulted from the fabricationprocess and thus to achieve the best interlocking geometry.35
Correspondingly, the modulus continued to increase as the
Fig. 3 Stress–strain curves of GO–HAP and GO papers.
This journal is © The Royal Society of Chemistry 2014
samples straightened and entered the linear region. Themodulus (EII) of GO–HAP paper during the linear part was 16.9GPa, 231% higher than the GO paper (5.1 GPa). The modulus ofour GO–HAP paper were higher than reported modulus valuesfor bucky paper (<10 GPa),36 graphite foil (�5 GPa),37 and paper-like materials (�5–15 GPa).22,38,39 The tensile strength (s) of GO–HAP paper was 75.6 MPa, 78% higher than the GO paper.However, the GO–HAP paper underwent a reduction of tough-ness due to the integration of the rigid HAP crystals. The ulti-mate strain (3) and fracture toughness (U) of GO–HAP paperwere 0.53%, 214.9 kJ m�3, while these values for GO paper were1.28%, 313.6 kJ m�3, respectively. Nevertheless, compared withthe current used cross-linking agents to fabricate GO-basedcomposites such as polyallylamine (GO–PAA, 0.32%, 180 kJm�3),40 poly(vinyl alcohol) (GO–PVA, 0.27%, 100 kJ m�3),41
glutaraldehyde (GO–GA, 0.4%, 200 kJ m�3),42 or borate (GO–borate, 0.15%, 140 kJ m�3),43 GO–HAP paper here was moretougher. These results indicated that the HAP nanoplatesplayed a pivotal role in retaining toughness as the stiffnessincreased, which were both equally important in load-bearingmaterials design.
The improvement of mechanical strength was originatedfrom the ordered GO–HAP layered structure at nanoscale.Under tensile stress, the deformation mechanism was similaras a staggered model of load transfer in bone matrix.33 It wasshown that as soon as the structural size reaches the criticallength (the size of fracture process zone), materials becomeinsensitive to aws.2 Thus, the nanometer size of the mineralcrystals in biocomposites became important to ensure theoptimum fracture strength and maximum tolerance of aws.More importantly, the effective load transfer between mineralsand so matrix also played a key role in damage shielding.44 Aspreviously mentioned, the binding force between GO sheets andHAP nanoplates were strong, mainly resulted from the highspecic surface areas and in suit crystallization process. In thecomposite, the HAP crystal orientations were induced andcontrolled by the GO substrates during the in situ mineraliza-tion. And the resulted GO–HAP sheets could be further self-assembled to form the free-standing paper with the lamellarstructure. When the GO–HAP paper was exposed to an appliedtensile stress, the load could be transferred by soGO sheets viashear between rigid HAP plates. Since HAP crystals could bearmost of stress, the strength of the hybrid material was signi-cantly improved.
Recently, repair of load-bearing defects resulting fromdisease or trauma becomes a critical problem for bone tissueengineering.45 HAP, for its excellent biocompatibility, has beenextensively studied for this application. However, the conven-tionally synthesized HAP crystallites cannot have sufficientmechanical strength to repair these defects directly, therefore,have been limited to the non-load-bearing applications.41,45
Aer composite with GO, the mechanical properties of theresulted GO–HAP composites (Table 1) were greatly improved.Compared with some bone tissues, the elastic modulus of GO–HAP paper was higher than that of the mineralized collagenbers (3–7 GPa),46 rat vertebra (11–13 GPa),47 bovine distalfemora (9–12 GPa),4 red deer anthler (7–8 GPa),48 and
RSC Adv., 2014, 4, 25398–25403 | 25401
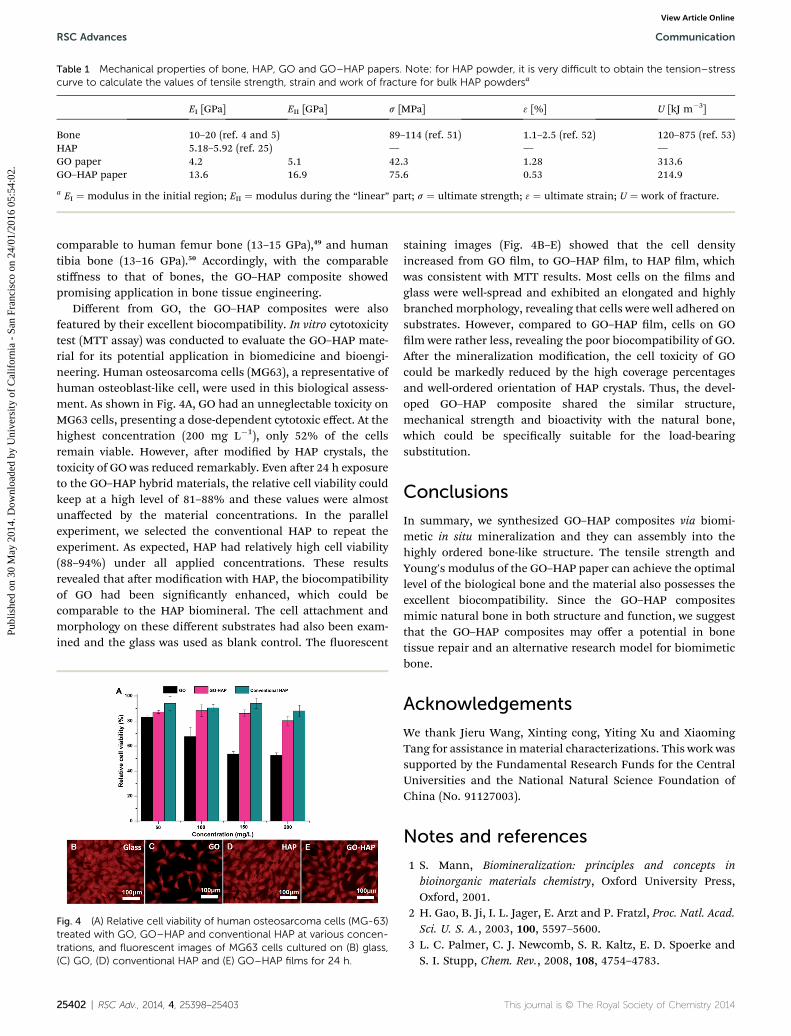
Table 1 Mechanical properties of bone, HAP, GO and GO–HAP papers. Note: for HAP powder, it is very difficult to obtain the tension–stresscurve to calculate the values of tensile strength, strain and work of fracture for bulk HAP powdersa
EI [GPa] EII [GPa] s [MPa] 3 [%] U [kJ m�3]
Bone 10–20 (ref. 4 and 5) 89–114 (ref. 51) 1.1–2.5 (ref. 52) 120–875 (ref. 53)HAP 5.18–5.92 (ref. 25) — — —GO paper 4.2 5.1 42.3 1.28 313.6GO–HAP paper 13.6 16.9 75.6 0.53 214.9
a EI ¼ modulus in the initial region; EII ¼ modulus during the “linear” part; s ¼ ultimate strength; 3 ¼ ultimate strain; U ¼ work of fracture.
RSC Advances Communication
Publ
ishe
d on
30
May
201
4. D
ownl
oade
d by
Uni
vers
ity o
f C
alif
orni
a -
San
Fran
cisc
o on
24/
01/2
016
05:5
4:02
. View Article Online
comparable to human femur bone (13–15 GPa),49 and humantibia bone (13–16 GPa).50 Accordingly, with the comparablestiffness to that of bones, the GO–HAP composite showedpromising application in bone tissue engineering.
Different from GO, the GO–HAP composites were alsofeatured by their excellent biocompatibility. In vitro cytotoxicitytest (MTT assay) was conducted to evaluate the GO–HAP mate-rial for its potential application in biomedicine and bioengi-neering. Human osteosarcoma cells (MG63), a representative ofhuman osteoblast-like cell, were used in this biological assess-ment. As shown in Fig. 4A, GO had an unneglectable toxicity onMG63 cells, presenting a dose-dependent cytotoxic effect. At thehighest concentration (200 mg L�1), only 52% of the cellsremain viable. However, aer modied by HAP crystals, thetoxicity of GO was reduced remarkably. Even aer 24 h exposureto the GO–HAP hybrid materials, the relative cell viability couldkeep at a high level of 81–88% and these values were almostunaffected by the material concentrations. In the parallelexperiment, we selected the conventional HAP to repeat theexperiment. As expected, HAP had relatively high cell viability(88–94%) under all applied concentrations. These resultsrevealed that aer modication with HAP, the biocompatibilityof GO had been signicantly enhanced, which could becomparable to the HAP biomineral. The cell attachment andmorphology on these different substrates had also been exam-ined and the glass was used as blank control. The uorescent
Fig. 4 (A) Relative cell viability of human osteosarcoma cells (MG-63)treated with GO, GO–HAP and conventional HAP at various concen-trations, and fluorescent images of MG63 cells cultured on (B) glass,(C) GO, (D) conventional HAP and (E) GO–HAP films for 24 h.
25402 | RSC Adv., 2014, 4, 25398–25403
staining images (Fig. 4B–E) showed that the cell densityincreased from GO lm, to GO–HAP lm, to HAP lm, whichwas consistent with MTT results. Most cells on the lms andglass were well-spread and exhibited an elongated and highlybranched morphology, revealing that cells were well adhered onsubstrates. However, compared to GO–HAP lm, cells on GOlm were rather less, revealing the poor biocompatibility of GO.Aer the mineralization modication, the cell toxicity of GOcould be markedly reduced by the high coverage percentagesand well-ordered orientation of HAP crystals. Thus, the devel-oped GO–HAP composite shared the similar structure,mechanical strength and bioactivity with the natural bone,which could be specically suitable for the load-bearingsubstitution.
Conclusions
In summary, we synthesized GO–HAP composites via biomi-metic in situ mineralization and they can assembly into thehighly ordered bone-like structure. The tensile strength andYoung's modulus of the GO–HAP paper can achieve the optimallevel of the biological bone and the material also possesses theexcellent biocompatibility. Since the GO–HAP compositesmimic natural bone in both structure and function, we suggestthat the GO–HAP composites may offer a potential in bonetissue repair and an alternative research model for biomimeticbone.
Acknowledgements
We thank Jieru Wang, Xinting cong, Yiting Xu and XiaomingTang for assistance inmaterial characterizations. This work wassupported by the Fundamental Research Funds for the CentralUniversities and the National Natural Science Foundation ofChina (No. 91127003).
Notes and references
1 S. Mann, Biomineralization: principles and concepts inbioinorganic materials chemistry, Oxford University Press,Oxford, 2001.
2 H. Gao, B. Ji, I. L. Jager, E. Arzt and P. Fratzl, Proc. Natl. Acad.Sci. U. S. A., 2003, 100, 5597–5600.
3 L. C. Palmer, C. J. Newcomb, S. R. Kaltz, E. D. Spoerke andS. I. Stupp, Chem. Rev., 2008, 108, 4754–4783.
This journal is © The Royal Society of Chemistry 2014
Communication RSC Advances
Publ
ishe
d on
30
May
201
4. D
ownl
oade
d by
Uni
vers
ity o
f C
alif
orni
a -
San
Fran
cisc
o on
24/
01/2
016
05:5
4:02
. View Article Online
4 R. B. Ashman and R. Jae Young, J. Biomech., 1988, 21, 177–181.
5 J.-Y. Rho, L. Kuhn-Spearing and P. Zioupos, Med. Eng. Phys.,1998, 20, 92–102.
6 E. D. Spoerke, S. G. Anthony and S. I. Stupp, Adv. Mater.,2009, 21, 425–430.
7 A. M. Collins, N. J. V. Skaer, T. Gheysens, D. Knight,C. Bertram, H. I. Roach, R. O. C. Oreffo, S. Von-Aulock,T. Baris, J. Skinner and S. Mann, Adv. Mater., 2009, 21, 75–78.
8 R. Lakshminarayanan, R. M. Kini and S. Valiyaveettil, Proc.Natl. Acad. Sci. U. S. A., 2002, 99, 5155–5159.
9 Y.-Y. Hu, A. Rawal and K. Schmidt-Rohr, Proc. Natl. Acad. Sci.U. S. A., 2010, 107, 22425–22429.
10 J. Aizenberg, G. Lambert, S. Weiner and L. Addadi, J. Am.Chem. Soc., 2001, 124, 32–39.
11 S. Weiner, W. Traub and S. B. Parker, Philos. Trans. R. Soc., B,1984, 304, 425–434.
12 A. K. Geim and K. S. Novoselov, Nat. Mater., 2007, 6, 183–191.13 D. R. Dreyer, S. Park, C. W. Bielawski and R. S. Ruoff, Chem.
Soc. Rev., 2010, 39, 228–240.14 X. Huang, X. Qi, F. Boey and H. Zhang, Chem. Soc. Rev., 2012,
41, 666–686.15 S. H. Ku, M. Lee and C. B. Park, Adv. Healthcare Mater., 2013,
2, 244–260.16 H. Bao, Y. Pan, Y. Ping, N. G. Sahoo, T. Wu, L. Li, J. Li and
L. H. Gan, Small, 2011, 7, 1569–1578.17 Y. Wang, W. C. Lee, K. K. Manga, P. K. Ang, J. Lu, Y. P. Liu,
C. T. Lim and K. P. Loh, Adv. Mater., 2012, 24, 4285–4290.18 Y. Liu, D. Yu, C. Zeng, Z. Miao and L. Dai, Langmuir, 2010, 26,
6158–6160.19 W. Hu, C. Peng, W. Luo, M. Lv, X. Li, D. Li, Q. Huang and
C. Fan, ACS Nano, 2010, 4, 4317–4323.20 K. H. Liao, Y. S. Lin, C. W. Macosko and C. L. Haynes, ACS
Appl. Mater. Interfaces, 2011, 3, 2607–2615.21 A. Bianco, Angew. Chem., Int. Ed., 2013, 52, 4986–4997.22 C. Wan, M. Frydrych and B. Chen, SoMatter, 2011, 7, 6159.23 S. Park, N. Mohanty, J. W. Suk, A. Nagaraja, J. An, R. D. Piner,
W. Cai, D. R. Dreyer, V. Berry and R. S. Ruoff, Adv. Mater.,2010, 22, 1736–1740.
24 S. Kim, S. H. Ku, S. Y. Lim, J. H. Kim and C. B. Park, Adv.Mater., 2011, 23, 2009–2014.
25 M. Li, Y. Wang, Q. Liu, Q. Li, Y. Cheng, Y. Zheng, T. Xi andS. Wei, J. Mater. Chem. B, 2013, 1, 475.
26 L. J. Cote, F. Kim and J. Huang, J. Am. Chem. Soc., 2008, 131,1043–1049.
27 S. Chen, J. Zhu, X. Wu, Q. Han and X. Wang, ACS Nano, 2010,4, 2822–2830.
28 D. A. Dikin, S. Stankovich, E. J. Zimney, R. D. Piner,G. H. B. Dommett, G. Evmenenko, S. T. Nguyen andR. S. Ruoff, Nature, 2007, 448, 457–460.
29 W. Chen and L. Yan, Adv. Mater., 2012, 24, 6229–6233.30 C. Xu, X. Wu, J. Zhu and X. Wang, Carbon, 2008, 46, 386–389.
This journal is © The Royal Society of Chemistry 2014
31 C. Xu, X. Wang and J. Zhu, J. Phys. Chem. C, 2008, 112,19841–19845.
32 K. N. Kudin, B. Ozbas, H. C. Schniepp, R. K. Prud'Homme,I. A. Aksay and R. Car, Nano Lett., 2008, 8, 36–41.
33 H. S. Gupta, J. Seto, W. Wagermaier, P. Zaslansky,P. Boesecke and P. Fratzl, Proc. Natl. Acad. Sci. U. S. A.,2006, 103, 17741–17746.
34 M. J. Olszta, X. Cheng, S. S. Jee, R. Kumar, Y.-Y. Kim,M. J. Kaufman, E. P. Douglas and L. B. Gower, Mater. Sci.Eng., R, 2007, 58, 77–116.
35 S. Park, K.-S. Lee, G. Bozoklu, W. Cai, S. T. Nguyen andR. S. Ruoff, ACS Nano, 2008, 2, 572–578.
36 X. Zhang, T. Sreekumar, T. Liu and S. Kumar, J. Phys. Chem.B, 2004, 108, 16435–16440.
37 M. Dowell and R. Howard, Carbon, 1986, 24, 311–323.38 D. Zhong, Q. Yang, L. Guo, S. Dou, K. Liu and L. Jiang,
Nanoscale, 2013, 5, 5758–5764.39 Y. Xu, W. Hong, H. Bai, C. Li and G. Shi, Carbon, 2009, 47,
3538–3543.40 S. Park, D. A. Dikin, S. T. Nguyen and R. S. Ruoff, J. Phys.
Chem. C, 2009, 113, 15801–15804.41 K. W. Putz, O. C. Compton, M. J. Palmeri, S. T. Nguyen and
L. C. Brinson, Adv. Funct. Mater., 2010, 20, 3322–3329.42 Y. Gao, L.-Q. Liu, S.-Z. Zu, K. Peng, D. Zhou, B.-H. Han and
Z. Zhang, ACS Nano, 2011, 5, 2134–2141.43 Z. An, O. C. Compton, K. W. Putz, L. C. Brinson and
S. T. Nguyen, Adv. Mater., 2011, 23, 3842–3846.44 B. Ji and H. Gao, J. Mech. Phys. Solids, 2004, 52, 1963–1990.45 A. J. Wagoner Johnson and B. A. Herschler, Acta Biomater.,
2011, 7, 16–30.46 F. Yuan, S. R. Stock, D. R. Haeffner, J. D. Almer,
D. C. Dunand and L. C. Brinson, Biomech. Model.Mechanobiol., 2011, 10, 147–160.
47 E. Hamed, I. Jasiuk, A. Yoo, Y. Lee and T. Liszka, J. R. Soc.,Interface, 2012, 9, 1654–1673.
48 J. Currey, T. Landete-Castillejos, J. Estevez, F. Ceacero,A. Olguin, A. Garcia and L. Gallego, J. Exp. Biol., 2009, 212,3985–3993.
49 P. K. Zysset, X. Edward Guo, C. Edward Hoffler, K. E. Mooreand S. A. Goldstein, J. Biomech., 1999, 32, 1005–1012.
50 J. Y. Rho, R. B. Ashman and C. H. Turner, J. Biomech., 1993,26, 111–119.
51 M. Akao, H. Aoki and K. Kato, J. Mater. Sci., 1981, 16, 809–812.
52 D. L. Kopperdahl and T. M. Keaveny, J. Biomech., 1998, 31,601–608.
53 P. Zioupos and J. D. Currey, Bone, 1998, 22, 57–66.54 J. Tao, W. Jiang, H. Zhai, H. Pan, X. Xu and R. Tang, Cryst.
Growth Des., 2008, 8, 2227–2234.55 Z. Zhuang and M. Aizawa, J. Mater. Sci.: Mater. Med., 2013,
24, 1211–1216.
RSC Adv., 2014, 4, 25398–25403 | 25403
Controls of Tricalcium Phosphate Single-Crystal Formation from ItsAmorphous Precursor by Interfacial Energy
Jinhui Tao,† Haihua Pan,† Halei Zhai,† Jieru Wang,‡ Li Li,† Jia Wu,† Wenge Jiang,†
Xurong Xu,† and Ruikang Tang*
Department of Chemistry and Center for Biomaterials and Biopathways and Centers of Analysis andMeasurement, Zhejiang UniVersity, Hangzhou 310027, China
ReceiVed October 10, 2008; ReVised Manuscript ReceiVed February 3, 2009
ABSTRACT: Different from the conventional solution precipitation, amorphous precursor involves widely in biomineralizations.It is believed that the development of crystalline structures with a well-defined shape in biological systems is essentially facilitatedby the occurrence of these transient amorphous phases. However, the previous studies have not elucidated the physicochemicalfactors influencing the transformation from the transient phase into the stable phase. In this study, the evolutions from the amorphouscalcium phosphate to the different-shaped (hexagon and octahedron; octahedron is an unexpected morphology of the crystal withspace group of R3jc) single crystals of �-tricalcium phosphate (�-TCP) were examined. The hexagonal �-TCP crystals were formedvia the phase transformation of amorphous precursor in CaCl2-Na2HPO4-ethylene glycol solution; however, the octahedral �-TCPcrystals were formed in Ca(OH)2-(NH4)2HPO4-ethylene glycol solution. Because the interfacial energies between amorphous phaseand crystals were much smaller than those between solutions and crystals, the crystallization of the �-TCP phase occurred directlyin the amorphous substrate rather than from the solution. It was interesting that the final morphology of product was also determinedby the interfacial energy between the transformed crystal and solution. The current work demonstrated that the amorphous precursorepitaxial nucleation process and morphology selection of crystals in the amorphous phase could also be understood by an interfacialenergy control. This result might provide an in-depth understanding of the biomimetic synthesis of crystals via a pathway of amorphousprecursors.
Introduction
The ability to synthetically tune sizes, structures, and mor-phologies of inorganic crystals is an important objective incurrent materials science and device fabrications. The samecrystal may have different applications as its properties changewith size or shape.1 For example, the catalytic property ofplatinum has been found to be highly dependent on which facetsterminate the surface.2 In our previous study, the mineralizationand demineralization behaviors of biomaterials such as �-tri-calcium phosphate (�-TCP, Ca3(PO4)2) and hydroxyapatite(HAP) are highly dependent on their exposed surfaces tobiological milieus,3 which are also related to the proteinadsorptions and cell attachments.4 Size- and shape-controlledsynthesis of many inorganic compounds such as noble metals,5
semiconductors,6 and magnetites7 have been achieved tomodulate their electrical, optical, magnetic, and catalytic proper-ties. In contrast, the challenge of controlling crystal shape ofbiominerals has been met with a limited success. But crystalpolymorph is an important feature of natural biominerals.Different from the conventional solution precipitation, it hasbeen observed that amorphous precursor involves widely inbiological crystallizations. Living organisms usually use amor-phous phases as the building materials, stabilizing them overtheir lifetime, or depositing them as transient phases thattransform in a controlled manner into the specific crystallinestructure and morphology. For example, during the formationof calcitic sea urchin spine and larval spicules, the amorphouscalcium carbonate is first formed before the final crystalgeneration.8,9 Amorphous materials are also identified duringthe formations of mollusk and skeletal minerals.9-11 It is
believed that the development of crystalline structures with awell-defined shape in biological systems is essentially facilitatedby the occurrence of these transient amorphous phases.8-11
However, the previous studies have not elucidated the physi-cochemical factors influencing the transformation from thetransient phase into the stable phase. Biological control overthe selection of mineral form and morphology indicates complexinteractions between the organism and the amorphous precursor,which are not fully discovered. In this study, we examine theevolution from the amorphous precursor to the different-shaped(hexagon and octahedron, octahedron is an unexpected mor-phology of the crystal with space group R3jc) single crystals. Itis revealed experimentally that crystal nucleated directly fromthe amorphous precursor. The epitaxial nucleation process andshape selection of crystals in the amorphous phase can beaddressed by an interfacial energetic control. This result providesan in-depth understanding of the biomimetic crystallizations viaa pathway of amorphous precursors.
Calcium phosphates have excellent biocompatible propertiessince they are main component of biological bone and tooth.12
In particular, �-TCP, an important resorbable calcium phosphatebiomaterials, is an intermediate phase of calcium phosphate.�-TCP has been used as an ideal candidate for bone substitute,13
inorganic filling of biodegradable composites,14 substrate forevaluation of cell seeding efficacy, proliferation, osteogenicdifferentiation,15 and carrier for bone growth factors to stimulatebone healing and formation, because of its excellent osteocon-ductive and biodegenerative characteristics.16 Besides, it canalso find other applications of this compound, which involvedrug carrier, luminescence materials, and catalyst.17 It has beenreported that the protein adsorption property of �-TCP isdependent upon its size and terminal facets.4 The synthesismethod with size and shape control ability may provide aneffective way for the biological modulation. There are severalsynthesis methods to produce �-TCP but none of them can form
* Corresponding author. Tel/Fax: 86-571-87953736. E-mail: [email protected].
† Department of Chemistry and Center for Biomaterials and Biopathways,Zhejiang University.
‡ Centers of Analysis and Measurement, Zhejiang University.
CRYSTALGROWTH& DESIGN
2009VOL. 9, NO. 7
3154–3160
10.1021/cg801130w CCC: $40.75 2009 American Chemical SocietyPublished on Web 05/12/2009
Dow
nloa
ded
by Z
HE
JIA
NG
UN
IV o
n Ju
ly 2
7, 2
009
Publ
ishe
d on
May
12,
200
9 on
http
://pu
bs.a
cs.o
rg |
doi:
10.1
021/
cg80
1130
w

the uniform and faceted crystals. These conventional methodsinclude solid-state reactions between CaHPO4 and CaCO3,(NH4)2HPO4 and CaCO3, NH4H2PO4 and CaCO3, Ca2P2O7 andCaCO3,
18 or wet-chemical methods.19 The solid-state reactionsusually take place at high temperatures (∼1000 °C) and theformed products are usually agglomerated without any definedshapes. The wet-chemical route results in calcium deficientapatite (CDHA), which is then transformed into �-TCP bycalcination at 700-800 °C. Although some other methods havebeen tried to fabricate nano �-TCP, the shape and structure-property relationship for this material can hardly be controlled.19e
All these methods cannot be used to understand the biologicalformations of calcium phosphate. Herein, we propose a bioin-spired pathway for a large scale synthesis of �-TCP usingamorphous calcium phosphate (ACP) as the precursor. Hexagonand octahedron of the well-crystallized �-TCP can be achievedfrom the identical ACP precursor under the different solventconditions.
Experimental Section
Amorphous Precursor. One-tenth of a gram of CaCl2 ·2H2O wasadded into 50 mL of ethylene glycol (EG), and the mixture was heatedto 150 °C under vigorous stirring. Next, 1.36 mL of 0.3 M Na2HPO4
(aqueous solution) and 120 µL of 1.3 M NaOH (aqueous solution) weremixed with 20 mL of EG at a temperature of 105 °C. The phosphate-containing EG solution was poured into the calcium-containing ethyleneglycol solution within 10 s. The precipitation sustained for 5 s and theslurry was then poured into a vial immersed in ice-acetone bath (-16°C) to quench reaction. The solids were collected by centrifugation(10 000 g) and -4 °C. They were washed with ethanol for 3 times.
Synthesis of �-TCP via Amorphous Precursor. For hexagons, 20mg of amorphous precursor was dispersed in 70 mL of EG containingCaCl2 (7.6 mM) and Na2HPO4 (3.7 mM), and the slurry was heated to150 °C. For octahedron, 20 mg of precursor was dispersed in 70 mLof ethylene glycol containing Ca(OH)2 (7.6 mM) and (NH4)2HPO4 (3.7mM), and the slurry was heated to 150 °C. In the size-controlledsynthesis, the precursor amounts were altered accordingly. For the studyof evolution process, the samples were withdrawn from the reactionmilieu periodically using a glass pipet. The extractions were injectedinto vials immersed in ice-acetone bath (-16 °C) to quench thereaction. All the above solids were harvested by centrifuging at 4000 gand -4 °C. The tablets were washed with ethanol and water repeatedly3 times to remove the residual solvent and other impurities. The crystalswere dried under a vacuum condition at room temperature.
Interfacial Energy Determinations. Solid samples were dispersedin chloroform-ethanol mixed solvent (v:v ) 2:1) with a weight ratioof 0.6%. A 100 µL of this dispersion was carefully dipped onto thesilicon substrates. The solvent was evaporated in air at room temperatureand the films could be formed on the substrates. The growth solutionsof hexagon and octahedron were filtered through membrane with porediameter of 220 nm before use. The surface tensions of these solutionswere measured by pendant method at 20 °C and relative humidity was70%. To measure the interfacial energy of solid films in air, we usedfour probing liquids: water, EG, n-octane, and DMSO. The contactangles were measured by sessile drop and thin layer wicking at 20 °Cand relative humidity of 70%. At least five independent values weremeasured for each solid film and liquid.
Characterizations. Transmission electron microscopy (TEM) ob-servations were performed by using JEM-200CX TEM (JEOL, Japan)at an acceleration voltage of 160 kV and JEM-2010HR HRTEM (JEOL,Japan) at an acceleration voltage of 200 kV. Scanning electronmicroscopy (SEM) characterization was performed on S-4800 field-emission scanning electron microscope (HITACHI, Japan) at anacceleration voltage of 5 kV. The phase of the solids was examinedby X-ray diffraction (XRD, D/max-2550pc Rigaku, Japan) withmonochromatized Cu KR radiation. The FT-IR spectra were collectedform 4000 to 400 cm-1 in transmission mode by a Nexus-670spectrometer (Nicolet, USA). The contact angle data were measuredon an OCA15+ optical contact-measuring device (Data PhysicsInstruments GmbH, Germany).
Simulations. Computer simulations were performed using themorphology modules of Material Studio 3.1 packages. The initialconfiguration of �-TCP crystal was taken from the X-ray crystalstructure. Initial face list was generated by Bravais-Friedel Donnay-Harker (BFDH) method, which used the crystal lattice and symmetryto generate a list of possible growth faces. The minimum d-spacingwas set to be 1.3 Å. The maximum of indices along a, b, c was chosento be 5, 5, 10 respectively. Finally, A face list consist of 1942 uniquecrystal facets was generated. This face list was used as input for furthercalculation of attachment energy. In the part of energy calculationconsistent-valence force field (CVFF) was used. Ewald summationmethod was adopted for treatment of electrostatic terms with accuracyof 0.001 kcal/mol. An atom-based summation method was applied forvan der Waals terms with the cutoff distance of 1.25 nm.
Results and Discussion
ACP is the least stable of the calcium phosphate phases andit is identified at the early stage of the biological formations ofapatite.11 Amorphous mineral is moldable; this characteristicresults in the diverse crystal structures of bioinorganic crystals.In the current study, the precursor ACP is synthesized andstabilized in the laboratory by mixing of CaCl2 and Na2HPO4
in EG. TEM and SEM images of the resulting ACP precipitatesare shown in Figure 1. Energy-dispersive spectroscopy (EDS)and chemical analysis (atomic adsorption for calcium and UVfor phosphate) shows the solids mainly contained calcium andphosphorus and their molar ratio is 1.47 ( 0.05. The chemicalcomposition of the resulted ACP is similar to Ca3(PO4)2. Theselected area electron diffraction (SAED) pattern is weak anddispersive, indicating the poor crystallinity of the phase (insertof Figure 1A). FT-IR result shows the broad and featurelessphosphate absorption bands (Figure 1D). The triply degeneratedasymmetric stretching (1087, 1046, and 1032 cm-1) and bendingvibrations of PO4
3- (602, 574, and 561 cm-1) in crystallizedsolids are not detected.20 These results confirm that theprecipitate in EG is the amorphous phase. The peaks of CO3
2-
(1419 and 874 cm-1) in FT-IR implies that some carbonate ionsincorporated into the ACP.20 The incorporation of carbonate isa common phenomenon during the formation of biologicalcalcium phosphate. The presence of HPO4
2- in the amorphousprecursor may also contributes to the absorption at 874 cm-1.20
It is previously revealed that the short-range order is alwayspresent in the bulk of amorphous phase including ACP.21 Thesimilar result is also observed in our samples. The high-resolution TEM (HRTEM) study shows a few of nano ordereddomains in the amorphous phase for their different contrastscompared with the surrounding disordered regions (Figure 1B).Such an order-related contrast has also been reported in someamorphous binary alloys.22 However, this short-range ordercannot be detected by conventional XRD and the amorphousnature of the precipitates is clarified by the featureless humpsin its pattern (Figure 1E).
The formed ACP solids can be stabilized up to several monthsunder vacuum conditions at room temperature. We study thephase transformation at temperature of 150 °C in EG in thepresence of calcium and phosphate ions (these ions are used toprevent the dissolution of ACP in the solvent). ACP solids areredispersed in a CaCl2-Na2HPO4-EG solution. The hexagoncan be eventually formed from ACP (Figure 2A, 2B). Thetypical diameter of the hexagonal face can be tuned from 550nm to 1 µm by changing precursor concentration from 10 mg/70 mL to 40 mg/70 mL (powder to solution). The thickness ofthe hexagon, ∼220-250 nm, keeps almost unchanged underthe different experimental conditions (Figure 3). The XRDpattern collected on the hexagons can be indexed to �-TCP (R3jc,a ) b ) 10.42 Å, c ) 37.38 Å; R ) � ) 90°, γ ) 120°, JCPDS
Calcium Phosphate Phase Transformation Crystal Growth & Design, Vol. 9, No. 7, 2009 3155
Dow
nloa
ded
by Z
HE
JIA
NG
UN
IV o
n Ju
ly 2
7, 2
009
Publ
ishe
d on
May
12,
200
9 on
http
://pu
bs.a
cs.o
rg |
doi:
10.1
021/
cg80
1130
w

09-0169). Ca, P, and O elements are detected by EDS, andthe measured calcium to phosphate molar ratio is 1.51 ( 0.02.3a
HRTEM and SAED show that the hexagon is terminated by{100} and {001} planes (Figures 2C, 2D, and 3). The size ofproduct increases in proportional to precursor concentration inthe range from 10 mg/70 mL to 40 mg/70 mL (Figure 3). Furtherincrease in precursor concentration (>40 mg/70 mL) has noobvious influence on the product size any more. However, it isalso noted that the different concentrations of calcium (5-8mM) and phosphate ions (2.5-4 mM) cannot result in asignificant change of crystal sizes. This result implies theessential role of ACP precursor in the formation of �-TCP. Thereaction temperature can influence the phase and shape of theproducts. �-TCP hexagons with rough {100} planes are formedat a temperature of 115 °C. At 100 °C, the hexagons withsmooth apex, surface cracks, and holes (see Figure S1 in the
Supporting Information) can be resulted and they becomeroundlike. Thus, the crystal perfection and crystallinity aretemperature-dependent.
The morphology of transformed �-TCP is dependent on thesolution conditions. It is abnormal but interesting that octahe-drons with dimensions of 300∼400 nm can be observed inCa(OH)2-(NH4)2HPO4-EG solution by using ACP as thestarting material (Figure 2E). Even though �-TCP indexed inthe space group R3jc is not expected to grow with thisexceptional morphology.23 XRD experiments of samples con-firm that the resulted material is �-TCP (see Figure S2 in theSupporting Information). It is found that the surface ofoctahedron is not atomic flat under HRTEM and SEM (Figure2E-H). Some atomic steps can be observed on the surfaces.The lattice planes parallel to the surfaces are uniquely indexedas (006) and (101j) according to the lattice spacings, 0.622 and
Figure 1. (A) TEM image and the corresponding SAED pattern of ACP, the precursor, extracted from the reaction at 15 s. (B) HRTEM image ofthe amorphous precursor in and no crystal lattice fringe is observed. (C) SEM image of the amorphous precursor. (D, E) FT-IR spectrum and XRDpattern of the precursor.
Figure 2. SEM and HRTEM images of final �-TCP hexagon and octahedron. (A) SEM of a typical hexagon. (B) TEM of �-TCP hexagon recordedalong [001] zone axis. (C, D) HRTEM images of the right and left side marked in B. (E) SEM of a typical octahedron. (F) TEM image of �-TCPoctahedron recorded along the [010] direction; the angle between the adjacent surfaces is 76°. (G) HRTEM image recorded from the left sidesurface marked in F; the lattice fringe parallel with the outer surface is corresponding to (006) lattice plane. (H) HRTEM image recorded from theright side surface marked in F. The lattice fringe parallel with the outer surface is corresponding to (101j) lattice plane.
3156 Crystal Growth & Design, Vol. 9, No. 7, 2009 Tao et al.
Dow
nloa
ded
by Z
HE
JIA
NG
UN
IV o
n Ju
ly 2
7, 2
009
Publ
ishe
d on
May
12,
200
9 on
http
://pu
bs.a
cs.o
rg |
doi:
10.1
021/
cg80
1130
w

0.877 nm, respectively. As a confirmation of these indices, theangle between the planes is 77° by calculation, which isconsistent with the measured value, 76°. It is important tomention that biominerals usually have shapes that defy the strictgeometric restrictions of 230 classical space groups. Thesymmetry breaking during the phase transformation fromisotropic amorphous to anisotropic crystal is an interestingphenomenon. Its reason is unclear and further efforts will bepaid for an explanation.
It is well-reported that �-TCP cannot be formed in aqueoussolution as the involvement of proton and hydroxyl ions.19 Ifthe same amorphous phase is dispersed in water or calciumphosphate aqueous solution, the resulted products are the rodlikehydroxyapatite nanocrystals (Figure 4). However, the pure�-TCP phase can be synthesized in nonaqueous solvent suchas EG or methanol.3a,19e EG is a solvent with relatively high
dielectric constant that can dissolve many salts. Another propertyof EG is its high boiling points (∼196 °C), which is suitablefor synthesis of highly crystallized materials.5d Xia and co-workers have successfully controlled the shape of noble metalsnanocrystals using EG.5a,c,d It is found that EG has a strongeffect on mechanism of ion solvation and dissociation.3a Themolar conductivity of ions in aqueous environment is ap-proximately one order larger than that in EG, which indicatesthat greater activities of ions in water than in EG. It is suggestedthat the relatively low driving force for precipitation in EG maybe beneficial to the formations of uniform crystals.6c,24
To some extent, our results have phenomenological similari-ties to the “gel-sol” mechanism proposed by Sugimoto.25 Thismechanism is first proposed on the basis of a metal hydroxidegel to be transformed into uniform metal oxide sol through adissolution-recrystallization process. During this process, ahighly viscous metal hydroxide gel network is used as a matrixfor holding the nuclei and growing particles to protect themfrom aggregation even in strong ionic strength conditions, andalso as a reservoir of metal ions or hydroxide ions to compensatea drastically reduced supersaturation during the growth ofcrystal. The dissolution-recrystallization model is frequentlydiscussed in the phase transformation of calcium minerals.However, our system shows a different pathway that the crystalnucleates directly at the precursor and its shape can be controlledjust by changing the growth environment. The precursor neednot to dissolve to provide nutrient for crystallization, and it canbe understood by an energetic controls of the interfaces. Toinvestigate the evolution process of the ACP precursor in EG,we withdrew the samples from the same reaction systemperiodically (Figure 5). The extracted mixture is quickly
Figure 3. TEM and SEM images and SAED pattern of samples synthesized at 150 °C using different precursor amounts. The total volume of EGis 70 mL (CaCl2 and Na2HPO4 concentrations of 7.6 and 3.7 mM, respectively). (A, C) 10 mg precursor. (B) SAED pattern of the hexagon markedin A. (D, E) 15 mg precursor. (F, G) 26 mg precursor. (H, I) 40 mg precursor. This study shows that the size of hexagonal plates can be adjustableby the amorphous precursor amounts.
Figure 4. Hydroxyapatite nanorods formed after phase transformationby amorphous precursor in water. (A) TEM image of the sample. (B)Corresponding SAED pattern of this sample in A clarified the phase ishydroxyapatite.
Calcium Phosphate Phase Transformation Crystal Growth & Design, Vol. 9, No. 7, 2009 3157
Dow
nloa
ded
by Z
HE
JIA
NG
UN
IV o
n Ju
ly 2
7, 2
009
Publ
ishe
d on
May
12,
200
9 on
http
://pu
bs.a
cs.o
rg |
doi:
10.1
021/
cg80
1130
w
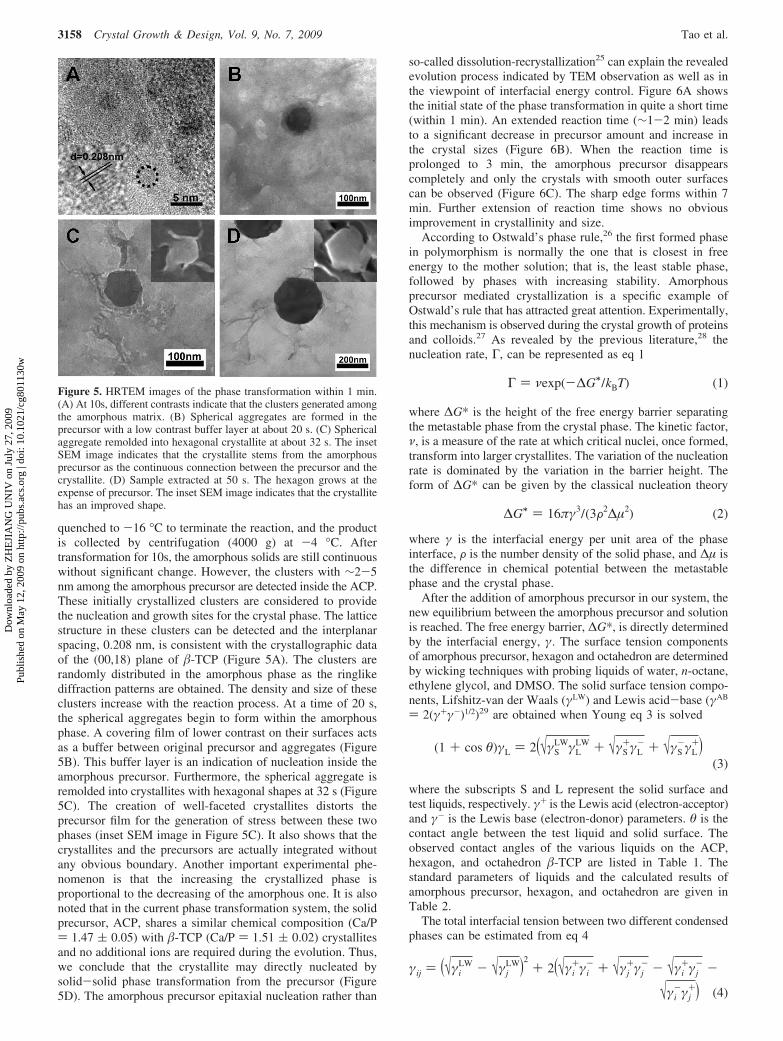
quenched to -16 °C to terminate the reaction, and the productis collected by centrifugation (4000 g) at -4 °C. Aftertransformation for 10s, the amorphous solids are still continuouswithout significant change. However, the clusters with ∼2-5nm among the amorphous precursor are detected inside the ACP.These initially crystallized clusters are considered to providethe nucleation and growth sites for the crystal phase. The latticestructure in these clusters can be detected and the interplanarspacing, 0.208 nm, is consistent with the crystallographic dataof the (00,18) plane of �-TCP (Figure 5A). The clusters arerandomly distributed in the amorphous phase as the ringlikediffraction patterns are obtained. The density and size of theseclusters increase with the reaction process. At a time of 20 s,the spherical aggregates begin to form within the amorphousphase. A covering film of lower contrast on their surfaces actsas a buffer between original precursor and aggregates (Figure5B). This buffer layer is an indication of nucleation inside theamorphous precursor. Furthermore, the spherical aggregate isremolded into crystallites with hexagonal shapes at 32 s (Figure5C). The creation of well-faceted crystallites distorts theprecursor film for the generation of stress between these twophases (inset SEM image in Figure 5C). It also shows that thecrystallites and the precursors are actually integrated withoutany obvious boundary. Another important experimental phe-nomenon is that the increasing the crystallized phase isproportional to the decreasing of the amorphous one. It is alsonoted that in the current phase transformation system, the solidprecursor, ACP, shares a similar chemical composition (Ca/P) 1.47 ( 0.05) with �-TCP (Ca/P ) 1.51 ( 0.02) crystallitesand no additional ions are required during the evolution. Thus,we conclude that the crystallite may directly nucleated bysolid-solid phase transformation from the precursor (Figure5D). The amorphous precursor epitaxial nucleation rather than
so-called dissolution-recrystallization25 can explain the revealedevolution process indicated by TEM observation as well as inthe viewpoint of interfacial energy control. Figure 6A showsthe initial state of the phase transformation in quite a short time(within 1 min). An extended reaction time (∼1-2 min) leadsto a significant decrease in precursor amount and increase inthe crystal sizes (Figure 6B). When the reaction time isprolonged to 3 min, the amorphous precursor disappearscompletely and only the crystals with smooth outer surfacescan be observed (Figure 6C). The sharp edge forms within 7min. Further extension of reaction time shows no obviousimprovement in crystallinity and size.
According to Ostwald’s phase rule,26 the first formed phasein polymorphism is normally the one that is closest in freeenergy to the mother solution; that is, the least stable phase,followed by phases with increasing stability. Amorphousprecursor mediated crystallization is a specific example ofOstwald’s rule that has attracted great attention. Experimentally,this mechanism is observed during the crystal growth of proteinsand colloids.27 As revealed by the previous literature,28 thenucleation rate, Γ, can be represented as eq 1
where ∆G* is the height of the free energy barrier separatingthe metastable phase from the crystal phase. The kinetic factor,ν, is a measure of the rate at which critical nuclei, once formed,transform into larger crystallites. The variation of the nucleationrate is dominated by the variation in the barrier height. Theform of ∆G* can be given by the classical nucleation theory
where γ is the interfacial energy per unit area of the phaseinterface, F is the number density of the solid phase, and ∆µ isthe difference in chemical potential between the metastablephase and the crystal phase.
After the addition of amorphous precursor in our system, thenew equilibrium between the amorphous precursor and solutionis reached. The free energy barrier, ∆G*, is directly determinedby the interfacial energy, γ. The surface tension componentsof amorphous precursor, hexagon and octahedron are determinedby wicking techniques with probing liquids of water, n-octane,ethylene glycol, and DMSO. The solid surface tension compo-nents, Lifshitz-van der Waals (γLW) and Lewis acid-base (γAB
) 2(γ+γ-)1/2)29 are obtained when Young eq 3 is solved
where the subscripts S and L represent the solid surface andtest liquids, respectively. γ+ is the Lewis acid (electron-acceptor)and γ- is the Lewis base (electron-donor) parameters. θ is thecontact angle between the test liquid and solid surface. Theobserved contact angles of the various liquids on the ACP,hexagon, and octahedron �-TCP are listed in Table 1. Thestandard parameters of liquids and the calculated results ofamorphous precursor, hexagon, and octahedron are given inTable 2.
The total interfacial tension between two different condensedphases can be estimated from eq 4
Figure 5. HRTEM images of the phase transformation within 1 min.(A) At 10s, different contrasts indicate that the clusters generated amongthe amorphous matrix. (B) Spherical aggregates are formed in theprecursor with a low contrast buffer layer at about 20 s. (C) Sphericalaggregate remolded into hexagonal crystallite at about 32 s. The insetSEM image indicates that the crystallite stems from the amorphousprecursor as the continuous connection between the precursor and thecrystallite. (D) Sample extracted at 50 s. The hexagon grows at theexpense of precursor. The inset SEM image indicates that the crystallitehas an improved shape.
Γ ) νexp(-∆G∗/kBT) (1)
∆G∗ ) 16πγ3/(3F2∆µ2) (2)
(1 + cos θ)γL ) 2(√γSLWγL
LW + √γS+γL
- + √γS-γL
+)(3)
γij ) (√γiLW - √γj
LW)2+ 2(√γi
+γi- + √γj
+γj- - √γi
+γj- -
√γi-γj
+) (4)
3158 Crystal Growth & Design, Vol. 9, No. 7, 2009 Tao et al.
Dow
nloa
ded
by Z
HE
JIA
NG
UN
IV o
n Ju
ly 2
7, 2
009
Publ
ishe
d on
May
12,
200
9 on
http
://pu
bs.a
cs.o
rg |
doi:
10.1
021/
cg80
1130
w

The interfacial energies between the amorphous precursor and�-TCP hexagon (γAm-Hex), amorphous precursor and �-TCPoctahedron (γAm-Oct) are 0.026 and 0.006 mJ/m2, respectively,which are calculated from eq 4 using the data in Table 2. Incontrast, the interfacial energy between �-TCP hexagon andCaCl2-Na2HPO-EG solution (γSH-Hex), �-TCP octahedron andCa(OH)2-(NH4)2HPO4-EG solution (γSO-Oct) are 1.65 and 1.50mJ/m2, respectively, by using eq 5 and data in Tables 1 and 2
The interfacial energy between crystal and amorphous precursor(γAm-Hex or γAm-Oct) is lower compared to that between crystaland solution (γSH-Hex or γSO-Oct) by about two magnitudes. Hence,the free energy barrier between amorphous precursor and �-TCPis far lower than that between �-TCP crystals and solutions
according to eq 2. Thus, the nucleation of �-TCP in theamorphous precursor is thermodynamically preferred as shownin eq 1. The amorphous precursor epitaxial nucleation processoccurs during the formation of both hexagon and octahedron.Interestingly, the life spans of amorphous precursor in thesetwo solutions are quite different. The amorphous precursordisappeared at 2.3 min in the formation of hexagon (Figure 6C).In the case of octahedron formation, the precursor still exists widelyat the reaction time of 2.5 min (Figure 6F). Besides, the interfacialenergies between the growth solutions and crystals with differentshapes are quite different. The interfacial energies betweenoctahedron and CaCl2-Na2HPO4-EG solution (γSH-Oct), hexagon,and Ca(OH)2-(NH4)2HPO4-EG solution (γSO-Hex) are 2.24 and1.80 mJ/m2, respectively. It is mentioned that γSO-Hex is largerthan γSH-Hex and γSH-Oct is larger than γSO-Oct. Therefore, bothformations of octahedron in CaCl2-Na2HPO4-EG solution andhexagon in Ca(OH)2-(NH4)2HPO4-EG solution are thermo-dynamically unfavorable for their relatively large interfacialenergies. This also indicates that the final morphology of crystalis determined by the crystal-solution interfacial energies,because the amorphous precursor disappears eventually. Onlythe crystal-solution interfaces are present at the end of phasetransformation. Therefore, the amorphous precursor alters thekinetic evolution pathway instead of changes the thermodynami-cally stable shape of product. Furthermore, our attachmentenergy calculation of �-TCP without any additives have selectedout the lattice planes with the lowest attachment energy, thatis, the planes with the lowest growth rate that determine thefinal morphology.30 The lattice planes that enclose the hexagonand octahedron have the lowest attachment energies in the planelist of �-TCP phase, as shown in Table 3.
Conclusion
In summary, �-TCP crystals with different morphologies andsizes are synthesized in an organic solvent using ACP as thestarting material. In this method, the resulted nano octahedronscan be even against the classical crystal symmetry of �-TCP. It
Figure 6. SEM images of the sample evolutions. (A) Initial hexagon sample in the amorphous phase at 30 s, the crystallites are indicated by thewhite arrows. (B) Samples at 1.2 min. The crystallites increase in both density and size; at this stage, the precursor coexists with the crystals. (C)Samples at 2.3 min. The precursor has completely disappeared and the hexagons result. (D) The 3D atomic model of �-TCP hexagon. (E) Initialoctahedrons at 30 s; their morphology is spherelike. (F) Octahedron sample at 2.5 min, The white arrow indicates the crystallites, but they are notfully developed; octahedral shape can be observed at this stage but the amorphous precursor still exists. (G) Sample at 90 min; the uniform octahedralcrystals formed. The inset is a high-magnification image of the �-TCP octahedron. (H) The 3D atomic model of �-TCP octahedron.
Table 1. Contact Angles of Probing Liquids on AmorphousPrecursor, �-TCP Hexagon, and Octahedron Surfaces at 20 °C and
Relative Humidity of 70%
ACP hexagon octahedron
DMSO 21.9 ( 3.0 19.4 ( 4.1 19.0 ( 0.5EG 22.6 ( 2.8 16.3 ( 0.7 22.8 ( 2.0n-octane 0 0 0water 21.6 ( 3.6 ≈0 18.8 ( 2.7CaCl2-Na2HPO4-EG 19.3 ( 0.9 25.5 ( 0.6Ca(OH)2-(NH4)2HPO4-EG 18.7 ( 0.6 22.4 ( 3.5
Table 2. Surface Tension Components of Different Solvents andParameters of Amorphous Precursor, �-TCP Hexagon, and �-TCP
Octahedron Determined by Wicking Method at 20 °C (mJ/m2)
γ γLW γAB γ+ γ-
DMSO 44.00 36.00 8.00 0.50 32.00EG 48.00 29.00 19.00 1.92 47.00n-octane 21.62 21.62 0 0 0water 72.80 21.80 51.00 25.50 25.50CaCl2-Na2HPO4-EG 48.45Ca(OH)2-(NH4)2HPO4-EG 48.12ACP 45.63 21.86 23.77 2.14 65.87hexagon 47.38 21.79 25.59 2.21 74.11octahedron 45.98 22.03 23.95 2.12 67.62
γsolid-solution ) γsolid - γsolutioncos θ (5)
Calcium Phosphate Phase Transformation Crystal Growth & Design, Vol. 9, No. 7, 2009 3159
Dow
nloa
ded
by Z
HE
JIA
NG
UN
IV o
n Ju
ly 2
7, 2
009
Publ
ishe
d on
May
12,
200
9 on
http
://pu
bs.a
cs.o
rg |
doi:
10.1
021/
cg80
1130
w
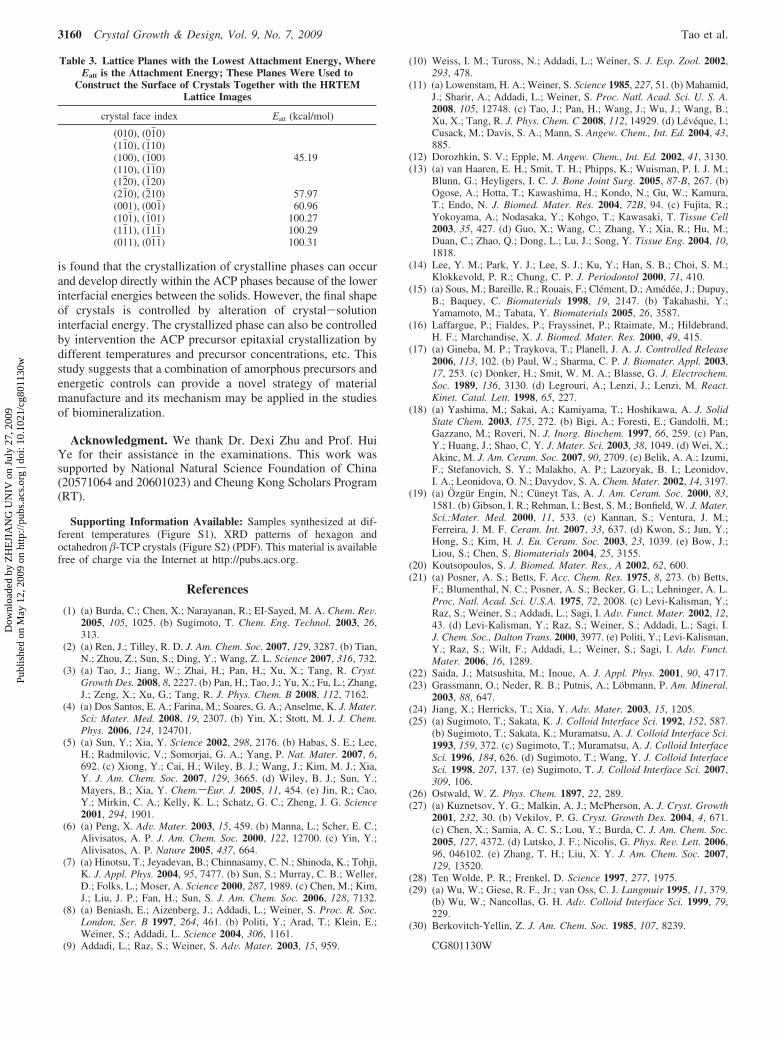
is found that the crystallization of crystalline phases can occurand develop directly within the ACP phases because of the lowerinterfacial energies between the solids. However, the final shapeof crystals is controlled by alteration of crystal-solutioninterfacial energy. The crystallized phase can also be controlledby intervention the ACP precursor epitaxial crystallization bydifferent temperatures and precursor concentrations, etc. Thisstudy suggests that a combination of amorphous precursors andenergetic controls can provide a novel strategy of materialmanufacture and its mechanism may be applied in the studiesof biomineralization.
Acknowledgment. We thank Dr. Dexi Zhu and Prof. HuiYe for their assistance in the examinations. This work wassupported by National Natural Science Foundation of China(20571064 and 20601023) and Cheung Kong Scholars Program(RT).
Supporting Information Available: Samples synthesized at dif-ferent temperatures (Figure S1), XRD patterns of hexagon andoctahedron �-TCP crystals (Figure S2) (PDF). This material is availablefree of charge via the Internet at http://pubs.acs.org.
References
(1) (a) Burda, C.; Chen, X.; Narayanan, R.; EI-Sayed, M. A. Chem. ReV.2005, 105, 1025. (b) Sugimoto, T. Chem. Eng. Technol. 2003, 26,313.
(2) (a) Ren, J.; Tilley, R. D. J. Am. Chem. Soc. 2007, 129, 3287. (b) Tian,N.; Zhou, Z.; Sun, S.; Ding, Y.; Wang, Z. L. Science 2007, 316, 732.
(3) (a) Tao, J.; Jiang, W.; Zhai, H.; Pan, H.; Xu, X.; Tang, R. Cryst.Growth Des. 2008, 8, 2227. (b) Pan, H.; Tao, J.; Yu, X.; Fu, L.; Zhang,J.; Zeng, X.; Xu, G.; Tang, R. J. Phys. Chem. B 2008, 112, 7162.
(4) (a) Dos Santos, E. A.; Farina, M.; Soares, G. A.; Anselme, K. J. Mater.Sci: Mater. Med. 2008, 19, 2307. (b) Yin, X.; Stott, M. J. J. Chem.Phys. 2006, 124, 124701.
(5) (a) Sun, Y.; Xia, Y. Science 2002, 298, 2176. (b) Habas, S. E.; Lee,H.; Radmilovic, V.; Somorjai, G. A.; Yang, P. Nat. Mater. 2007, 6,692. (c) Xiong, Y.; Cai, H.; Wiley, B. J.; Wang, J.; Kim, M. J.; Xia,Y. J. Am. Chem. Soc. 2007, 129, 3665. (d) Wiley, B. J.; Sun, Y.;Mayers, B.; Xia, Y. Chem.sEur. J. 2005, 11, 454. (e) Jin, R.; Cao,Y.; Mirkin, C. A.; Kelly, K. L.; Schatz, G. C.; Zheng, J. G. Science2001, 294, 1901.
(6) (a) Peng, X. AdV. Mater. 2003, 15, 459. (b) Manna, L.; Scher, E. C.;Alivisatos, A. P. J. Am. Chem. Soc. 2000, 122, 12700. (c) Yin, Y.;Alivisatos, A. P. Nature 2005, 437, 664.
(7) (a) Hinotsu, T.; Jeyadevan, B.; Chinnasamy, C. N.; Shinoda, K.; Tohji,K. J. Appl. Phys. 2004, 95, 7477. (b) Sun, S.; Murray, C. B.; Weller,D.; Folks, L.; Moser, A. Science 2000, 287, 1989. (c) Chen, M.; Kim,J.; Liu, J. P.; Fan, H.; Sun, S. J. Am. Chem. Soc. 2006, 128, 7132.
(8) (a) Beniash, E.; Aizenberg, J.; Addadi, L.; Weiner, S. Proc. R. Soc.London, Ser. B 1997, 264, 461. (b) Politi, Y.; Arad, T.; Klein, E.;Weiner, S.; Addadi, L. Science 2004, 306, 1161.
(9) Addadi, L.; Raz, S.; Weiner, S. AdV. Mater. 2003, 15, 959.
(10) Weiss, I. M.; Tuross, N.; Addadi, L.; Weiner, S. J. Exp. Zool. 2002,293, 478.
(11) (a) Lowenstam, H. A.; Weiner, S. Science 1985, 227, 51. (b) Mahamid,J.; Sharir, A.; Addadi, L.; Weiner, S. Proc. Natl. Acad. Sci. U. S. A.2008, 105, 12748. (c) Tao, J.; Pan, H.; Wang, J.; Wu, J.; Wang, B.;Xu, X.; Tang, R. J. Phys. Chem. C 2008, 112, 14929. (d) Leveque, I.;Cusack, M.; Davis, S. A.; Mann, S. Angew. Chem., Int. Ed. 2004, 43,885.
(12) Dorozhkin, S. V.; Epple, M. Angew. Chem., Int. Ed. 2002, 41, 3130.(13) (a) van Haaren, E. H.; Smit, T. H.; Phipps, K.; Wuisman, P. I. J. M.;
Blunn, G.; Heyligers, I. C. J. Bone Joint Surg. 2005, 87-B, 267. (b)Ogose, A.; Hotta, T.; Kawashima, H.; Kondo, N.; Gu, W.; Kamura,T.; Endo, N. J. Biomed. Mater. Res. 2004, 72B, 94. (c) Fujita, R.;Yokoyama, A.; Nodasaka, Y.; Kohgo, T.; Kawasaki, T. Tissue Cell2003, 35, 427. (d) Guo, X.; Wang, C.; Zhang, Y.; Xia, R.; Hu, M.;Duan, C.; Zhao, Q.; Dong, L.; Lu, J.; Song, Y. Tissue Eng. 2004, 10,1818.
(14) Lee, Y. M.; Park, Y. J.; Lee, S. J.; Ku, Y.; Han, S. B.; Choi, S. M.;Klokkevold, P. R.; Chung, C. P. J. Periodontol 2000, 71, 410.
(15) (a) Sous, M.; Bareille, R.; Rouais, F.; Clement, D.; Amedee, J.; Dupuy,B.; Baquey, C. Biomaterials 1998, 19, 2147. (b) Takahashi, Y.;Yamamoto, M.; Tabata, Y. Biomaterials 2005, 26, 3587.
(16) Laffargue, P.; Fialdes, P.; Frayssinet, P.; Rtaimate, M.; Hildebrand,H. F.; Marchandise, X. J. Biomed. Mater. Res. 2000, 49, 415.
(17) (a) Gineba, M. P.; Traykova, T.; Planell, J. A. J. Controlled Release2006, 113, 102. (b) Paul, W.; Sharma, C. P. J. Biomater. Appl. 2003,17, 253. (c) Donker, H.; Smit, W. M. A.; Blasse, G. J. Electrochem.Soc. 1989, 136, 3130. (d) Legrouri, A.; Lenzi, J.; Lenzi, M. React.Kinet. Catal. Lett. 1998, 65, 227.
(18) (a) Yashima, M.; Sakai, A.; Kamiyama, T.; Hoshikawa, A. J. SolidState Chem. 2003, 175, 272. (b) Bigi, A.; Foresti, E.; Gandolfi, M.;Gazzano, M.; Roveri, N. J. Inorg. Biochem. 1997, 66, 259. (c) Pan,Y.; Huang, J.; Shao, C. Y. J. Mater. Sci. 2003, 38, 1049. (d) Wei, X.;Akinc, M. J. Am. Ceram. Soc. 2007, 90, 2709. (e) Belik, A. A.; Izumi,F.; Stefanovich, S. Y.; Malakho, A. P.; Lazoryak, B. I.; Leonidov,I. A.; Leonidova, O. N.; Davydov, S. A. Chem. Mater. 2002, 14, 3197.
(19) (a) Ozgur Engin, N.; Cuneyt Tas, A. J. Am. Ceram. Soc. 2000, 83,1581. (b) Gibson, I. R.; Rehman, I.; Best, S. M.; Bonfield, W. J. Mater.Sci.:Mater. Med. 2000, 11, 533. (c) Kannan, S.; Ventura, J. M.;Ferreira, J. M. F. Ceram. Int. 2007, 33, 637. (d) Kwon, S.; Jun, Y.;Hong, S.; Kim, H. J. Eu. Ceram. Soc. 2003, 23, 1039. (e) Bow, J.;Liou, S.; Chen, S. Biomaterials 2004, 25, 3155.
(20) Koutsopoulos, S. J. Biomed. Mater. Res., A 2002, 62, 600.(21) (a) Posner, A. S.; Betts, F. Acc. Chem. Res. 1975, 8, 273. (b) Betts,
F.; Blumenthal, N. C.; Posner, A. S.; Becker, G. L.; Lehninger, A. L.Proc. Natl. Acad. Sci. U.S.A. 1975, 72, 2008. (c) Levi-Kalisman, Y.;Raz, S.; Weiner, S.; Addadi, L.; Sagi, I. AdV. Funct. Mater. 2002, 12,43. (d) Levi-Kalisman, Y.; Raz, S.; Weiner, S.; Addadi, L.; Sagi, I.J. Chem. Soc., Dalton Trans. 2000, 3977. (e) Politi, Y.; Levi-Kalisman,Y.; Raz, S.; Wilt, F.; Addadi, L.; Weiner, S.; Sagi, I. AdV. Funct.Mater. 2006, 16, 1289.
(22) Saida, J.; Matsushita, M.; Inoue, A. J. Appl. Phys. 2001, 90, 4717.(23) Grassmann, O.; Neder, R. B.; Putnis, A.; Lobmann, P. Am. Mineral.
2003, 88, 647.(24) Jiang, X.; Herricks, T.; Xia, Y. AdV. Mater. 2003, 15, 1205.(25) (a) Sugimoto, T.; Sakata, K. J. Colloid Interface Sci. 1992, 152, 587.
(b) Sugimoto, T.; Sakata, K.; Muramatsu, A. J. Colloid Interface Sci.1993, 159, 372. (c) Sugimoto, T.; Muramatsu, A. J. Colloid InterfaceSci. 1996, 184, 626. (d) Sugimoto, T.; Wang, Y. J. Colloid InterfaceSci. 1998, 207, 137. (e) Sugimoto, T. J. Colloid Interface Sci. 2007,309, 106.
(26) Ostwald, W. Z. Phys. Chem. 1897, 22, 289.(27) (a) Kuznetsov, Y. G.; Malkin, A. J.; McPherson, A. J. Cryst. Growth
2001, 232, 30. (b) Vekilov, P. G. Cryst. Growth Des. 2004, 4, 671.(c) Chen, X.; Samia, A. C. S.; Lou, Y.; Burda, C. J. Am. Chem. Soc.2005, 127, 4372. (d) Lutsko, J. F.; Nicolis, G. Phys. ReV. Lett. 2006,96, 046102. (e) Zhang, T. H.; Liu, X. Y. J. Am. Chem. Soc. 2007,129, 13520.
(28) Ten Wolde, P. R.; Frenkel, D. Science 1997, 277, 1975.(29) (a) Wu, W.; Giese, R. F., Jr.; van Oss, C. J. Langmuir 1995, 11, 379.
(b) Wu, W.; Nancollas, G. H. AdV. Colloid Interface Sci. 1999, 79,229.
(30) Berkovitch-Yellin, Z. J. Am. Chem. Soc. 1985, 107, 8239.
CG801130W
Table 3. Lattice Planes with the Lowest Attachment Energy, WhereEatt is the Attachment Energy; These Planes Were Used to
Construct the Surface of Crystals Together with the HRTEMLattice Images
crystal face index Eatt (kcal/mol)
(010), (01j0)(11j0), (1j10)(100), (1j00) 45.19(110), (1j1j0)(12j0), (1j20)(21j0), (2j10) 57.97(001), (001j) 60.96(101j), (1j01) 100.27(11j1), (1j11j) 100.29(011), (01j1j) 100.31
3160 Crystal Growth & Design, Vol. 9, No. 7, 2009 Tao et al.
Dow
nloa
ded
by Z
HE
JIA
NG
UN
IV o
n Ju
ly 2
7, 2
009
Publ
ishe
d on
May
12,
200
9 on
http
://pu
bs.a
cs.o
rg |
doi:
10.1
021/
cg80
1130
w

Structural Components and Anisotropic Dissolution Behaviors inOne Hexagonal Single Crystal of �-Tricalcium Phosphate
Jinhui Tao, Wenge Jiang, Halei Zhai, Haihua Pan, Xurong Xu, and Ruikang Tang*
Department of Chemistry and Center for Biomaterials and Biopathways, Zhejiang UniVersity,Hangzhou, 310027, P. R. China
ReceiVed August 27, 2007; ReVised Manuscript ReceiVed NoVember 20, 2007
ABSTRACT: Large-scale �-tricalcium phosphate (�-TCP) hexagonal single crystals were synthesized at a relatively low temperature(150 °C) by using a solution-phase method. The solvent, ethylene glycol, played an important role during the formation of thehomogeneous submicron-sized crystals. Unlike the conventional understanding of a single crystal, the wall of the formed �-TCPhexagonal was well crystallized, showing different physicochemical properties from the bulk part. The dissolution spots wereanisotropically distributed throughout the single crystal. The bulk part dissolved readily from the top and bottom planes in theundersaturated solutions, but the thin hexagonal wall could be stable against any dissolution even in pure water. These differencesbetween the wall and the bulk part were attributed to the different crystallinities and defect densities in their structures. It wassuggested that the low defect number might stem from the solvent-interface exchange that was allowed the edge surfaces in contactwith the solution. And the rapid growth of the particles resulted in the randomly distributed defects in the bulk part, which induceda selective dissolution along the c-axis of �-TCP. Furthermore, the stability of wall could be explained by a size effect during thenanodemineralization. It was interesting that both the wall and the bulk part shared the exact same lattice fringes under the transmissionelectron microscope. This phenomenon implied that both components were crystallographically identical so that they were constructedinto an integral single crystal of �-TCP. The distinct dissolution behaviors of these two parts in one single crystal resulted in theformation of porous, gearlike, and ringlike single crystals at different demineralization stages, which demonstrated an easy controlof crystal morphology patterns by using the anisotropic dissolution behavior.
Introduction
Because of the dependence of physical and chemical proper-ties on the size, morphology and microstructure of materials,1–3
controllable synthesis of nanocrystals with various shapes andstructural complexities with high precision presents a greatchallenge in nanosized materials synthesis.4–7 The morphologycontrol of single crystals of natural minerals such as calciumcarbonates and calcium phosphates is also an essential charac-teristic of biomineralization.8–11 The precise control of crystalsis intensively investigated in biominerals.12–16 Many organismsshows exceptional control over the gross morphology, physicalproperties, and nanoscale organization of biomaterials, creatingshapes that defy strict geometrical restrictions.8,10,13–16 Aremarkable category of biominerals is the single crystal withcomplex form although they have the complicated structures.8,14,15
Inspired by biomineralization, various approaches have beendeveloped to the large-scale control of structures and morphol-ogiesofnanoparticles,mainlybyalteringadditivesorsolvents,17–19
template-aided synthesis,20–24 and self-assembly.25 These meth-ods usually include relatively complicated operations, low yields,or poor controllability in uniformities and shapes. Besidesbiomineralization, it is also noted that biodemineralization isanother useful strategy in the control of single crystals in livingsystems. Here, we demonstrate that polymorph control of�-tricalcium phosphate (�-TCP) can be conveniently achievedby an anisotropic dissolution behavior of the hexagonal singlecrystals. A series of the derivative morphologies includingporous, gearlike, and ringlike are achieved at different timescales of demineralization.
�-TCP is an important biomineral since it has potentialapplications in bone grafting, calcium phosphate cements and
surgical implants.26 In the present work, we report that thehexagonal single crystals of �-TCP are first synthesized by usinga solution method under a relatively low temperature. Unlikethe conventional understanding of a single crystal, the crystal-linities of six edges and the bulk part in as-prepared �-TCP aredifferent although their chemical compositions, phases, andcrystallographic structures are exactly identical. The improvedcrystallinity and thin thickness of the edge wall can protect thispart against dissolution reaction in water even though the bulkpart is completely etched. It shows that the anisotropic dissolu-tion of the structural complex in one single crystal can result inan easy but effective control of morphologies of the singlecrystal.
Experimental Section
The hexagonal �-TCP plates were synthesized by a solution-phasemethod. Ethylene glycol was used as solvent and CaCl2 and Na2HPO4
were used as calcium and phosphate sources for the precipitation,respectively. 0.10 g CaCl2 ·2H2O was mixed with 50 mL of ethyleneglycol and the slurry was heated to 150 °C under vigorous magneticstirring. A mixed aqueous solution of 1.36 mL of 0.3 M Na2HPO4 and120 µL of 1.3 M NaOH was added to 20 mL of ethylene glycol at atemperature of 95 °C. The phosphate-containing ethylene glycol solutionwas added dropwise into the calcium containing ethylene glycol solutionat a rate of 20 mL/min. The mixture was bathed at 150 °C for 90min and then was cooled in air. The solids were separated bycentrifugation at 2000g and were washed using ethanol and wateralternatively 3 times to remove the residual solvent or other impurities.The products were dried under a vacuum condition at 30 °C. Thechemical compositions and structures of the solids were characterizedby chemical analysis (atomic adsorption for calcium and UV forphosphate). The molar conductivities of CaCl2 and Na2HPO4 in waterand in ethylene glycol were also examined to discuss the roles of solventin the formation of �-TCP.
In the demineralization experiments, 1.5 mg of solids was dispersedinto 50 mL of water (pH ) 7.0) under a stirring condition. One milliliterslurry samples were withdrawn at different experimental periods. The
* Corresponding author: Department of Chemistry, Zhejiang University,Hangzhou, 310027, China, Tel/fax: +86-571-87953736. E-mail: [email protected].
CRYSTALGROWTH& DESIGN
2008VOL. 8, NO. 7
2227–2234
10.1021/cg700808h CCC: $40.75 2008 American Chemical SocietyPublished on Web 06/05/2008
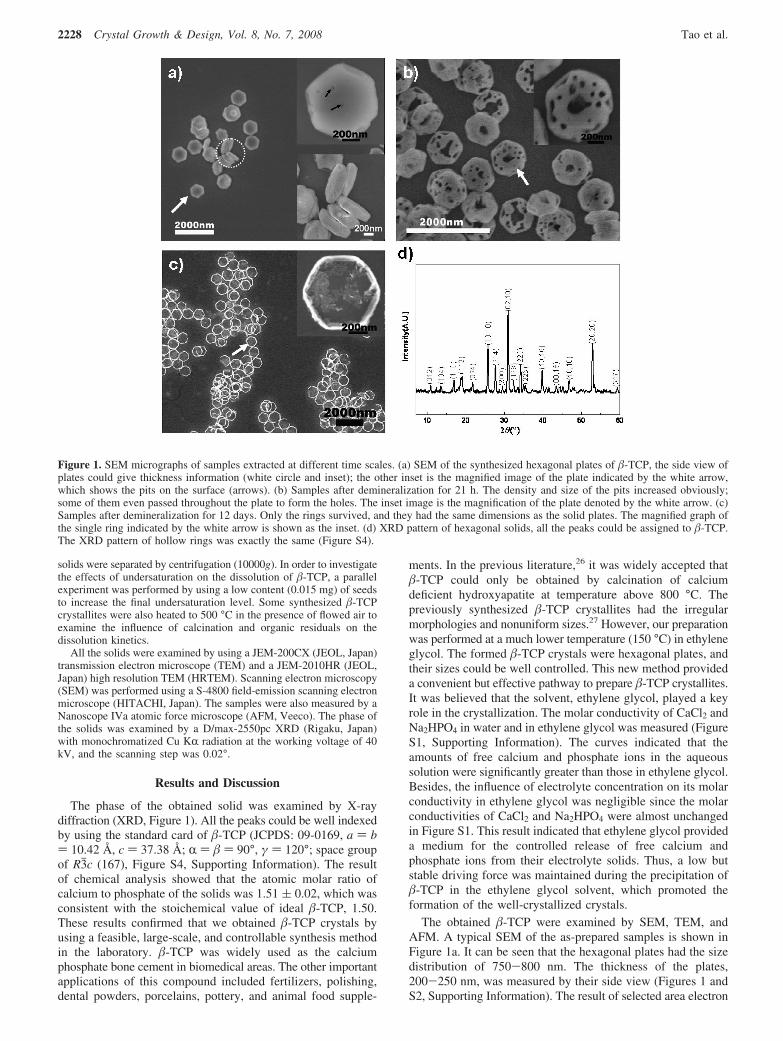
solids were separated by centrifugation (10000g). In order to investigatethe effects of undersaturation on the dissolution of �-TCP, a parallelexperiment was performed by using a low content (0.015 mg) of seedsto increase the final undersaturation level. Some synthesized �-TCPcrystallites were also heated to 500 °C in the presence of flowed air toexamine the influence of calcination and organic residuals on thedissolution kinetics.
All the solids were examined by using a JEM-200CX (JEOL, Japan)transmission electron microscope (TEM) and a JEM-2010HR (JEOL,Japan) high resolution TEM (HRTEM). Scanning electron microscopy(SEM) was performed using a S-4800 field-emission scanning electronmicroscope (HITACHI, Japan). The samples were also measured by aNanoscope IVa atomic force microscope (AFM, Veeco). The phase ofthe solids was examined by a D/max-2550pc XRD (Rigaku, Japan)with monochromatized Cu KR radiation at the working voltage of 40kV, and the scanning step was 0.02°.
Results and Discussion
The phase of the obtained solid was examined by X-raydiffraction (XRD, Figure 1). All the peaks could be well indexedby using the standard card of �-TCP (JCPDS: 09-0169, a ) b) 10.42 Å, c ) 37.38 Å; R ) � ) 90°, γ ) 120°; space groupof R3jc (167), Figure S4, Supporting Information). The resultof chemical analysis showed that the atomic molar ratio ofcalcium to phosphate of the solids was 1.51 ( 0.02, which wasconsistent with the stoichemical value of ideal �-TCP, 1.50.These results confirmed that we obtained �-TCP crystals byusing a feasible, large-scale, and controllable synthesis methodin the laboratory. �-TCP was widely used as the calciumphosphate bone cement in biomedical areas. The other importantapplications of this compound included fertilizers, polishing,dental powders, porcelains, pottery, and animal food supple-
ments. In the previous literature,26 it was widely accepted that�-TCP could only be obtained by calcination of calciumdeficient hydroxyapatite at temperature above 800 °C. Thepreviously synthesized �-TCP crystallites had the irregularmorphologies and nonuniform sizes.27 However, our preparationwas performed at a much lower temperature (150 °C) in ethyleneglycol. The formed �-TCP crystals were hexagonal plates, andtheir sizes could be well controlled. This new method provideda convenient but effective pathway to prepare �-TCP crystallites.It was believed that the solvent, ethylene glycol, played a keyrole in the crystallization. The molar conductivity of CaCl2 andNa2HPO4 in water and in ethylene glycol was measured (FigureS1, Supporting Information). The curves indicated that theamounts of free calcium and phosphate ions in the aqueoussolution were significantly greater than those in ethylene glycol.Besides, the influence of electrolyte concentration on its molarconductivity in ethylene glycol was negligible since the molarconductivities of CaCl2 and Na2HPO4 were almost unchangedin Figure S1. This result indicated that ethylene glycol provideda medium for the controlled release of free calcium andphosphate ions from their electrolyte solids. Thus, a low butstable driving force was maintained during the precipitation of�-TCP in the ethylene glycol solvent, which promoted theformation of the well-crystallized crystals.
The obtained �-TCP were examined by SEM, TEM, andAFM. A typical SEM of the as-prepared samples is shown inFigure 1a. It can be seen that the hexagonal plates had the sizedistribution of 750-800 nm. The thickness of the plates,200-250 nm, was measured by their side view (Figures 1 andS2, Supporting Information). The result of selected area electron
Figure 1. SEM micrographs of samples extracted at different time scales. (a) SEM of the synthesized hexagonal plates of �-TCP, the side view ofplates could give thickness information (white circle and inset); the other inset is the magnified image of the plate indicated by the white arrow,which shows the pits on the surface (arrows). (b) Samples after demineralization for 21 h. The density and size of the pits increased obviously;some of them even passed throughout the plate to form the holes. The inset image is the magnification of the plate denoted by the white arrow. (c)Samples after demineralization for 12 days. Only the rings survived, and they had the same dimensions as the solid plates. The magnified graph ofthe single ring indicated by the white arrow is shown as the inset. (d) XRD pattern of hexagonal solids, all the peaks could be assigned to �-TCP.The XRD pattern of hollow rings was exactly the same (Figure S4).
2228 Crystal Growth & Design, Vol. 8, No. 7, 2008 Tao et al.
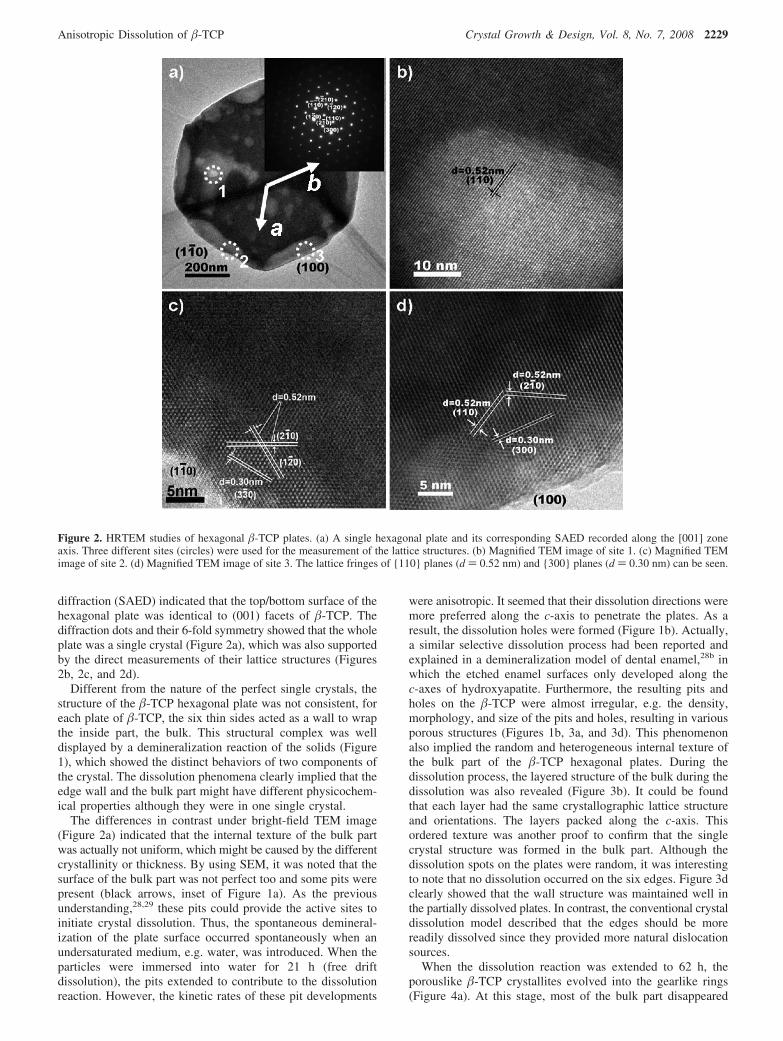
diffraction (SAED) indicated that the top/bottom surface of thehexagonal plate was identical to (001) facets of �-TCP. Thediffraction dots and their 6-fold symmetry showed that the wholeplate was a single crystal (Figure 2a), which was also supportedby the direct measurements of their lattice structures (Figures2b, 2c, and 2d).
Different from the nature of the perfect single crystals, thestructure of the �-TCP hexagonal plate was not consistent, foreach plate of �-TCP, the six thin sides acted as a wall to wrapthe inside part, the bulk. This structural complex was welldisplayed by a demineralization reaction of the solids (Figure1), which showed the distinct behaviors of two components ofthe crystal. The dissolution phenomena clearly implied that theedge wall and the bulk part might have different physicochem-ical properties although they were in one single crystal.
The differences in contrast under bright-field TEM image(Figure 2a) indicated that the internal texture of the bulk partwas actually not uniform, which might be caused by the differentcrystallinity or thickness. By using SEM, it was noted that thesurface of the bulk part was not perfect too and some pits werepresent (black arrows, inset of Figure 1a). As the previousunderstanding,28,29 these pits could provide the active sites toinitiate crystal dissolution. Thus, the spontaneous demineral-ization of the plate surface occurred spontaneously when anundersaturated medium, e.g. water, was introduced. When theparticles were immersed into water for 21 h (free driftdissolution), the pits extended to contribute to the dissolutionreaction. However, the kinetic rates of these pit developments
were anisotropic. It seemed that their dissolution directions weremore preferred along the c-axis to penetrate the plates. As aresult, the dissolution holes were formed (Figure 1b). Actually,a similar selective dissolution process had been reported andexplained in a demineralization model of dental enamel,28b inwhich the etched enamel surfaces only developed along thec-axes of hydroxyapatite. Furthermore, the resulting pits andholes on the �-TCP were almost irregular, e.g. the density,morphology, and size of the pits and holes, resulting in variousporous structures (Figures 1b, 3a, and 3d). This phenomenonalso implied the random and heterogeneous internal texture ofthe bulk part of the �-TCP hexagonal plates. During thedissolution process, the layered structure of the bulk during thedissolution was also revealed (Figure 3b). It could be foundthat each layer had the same crystallographic lattice structureand orientations. The layers packed along the c-axis. Thisordered texture was another proof to confirm that the singlecrystal structure was formed in the bulk part. Although thedissolution spots on the plates were random, it was interestingto note that no dissolution occurred on the six edges. Figure 3dclearly showed that the wall structure was maintained well inthe partially dissolved plates. In contrast, the conventional crystaldissolution model described that the edges should be morereadily dissolved since they provided more natural dislocationsources.
When the dissolution reaction was extended to 62 h, theporouslike �-TCP crystallites evolved into the gearlike rings(Figure 4a). At this stage, most of the bulk part disappeared
Figure 2. HRTEM studies of hexagonal �-TCP plates. (a) A single hexagonal plate and its corresponding SAED recorded along the [001] zoneaxis. Three different sites (circles) were used for the measurement of the lattice structures. (b) Magnified TEM image of site 1. (c) Magnified TEMimage of site 2. (d) Magnified TEM image of site 3. The lattice fringes of {110} planes (d ) 0.52 nm) and {300} planes (d ) 0.30 nm) can be seen.
Anisotropic Dissolution of �-TCP Crystal Growth & Design, Vol. 8, No. 7, 2008 2229
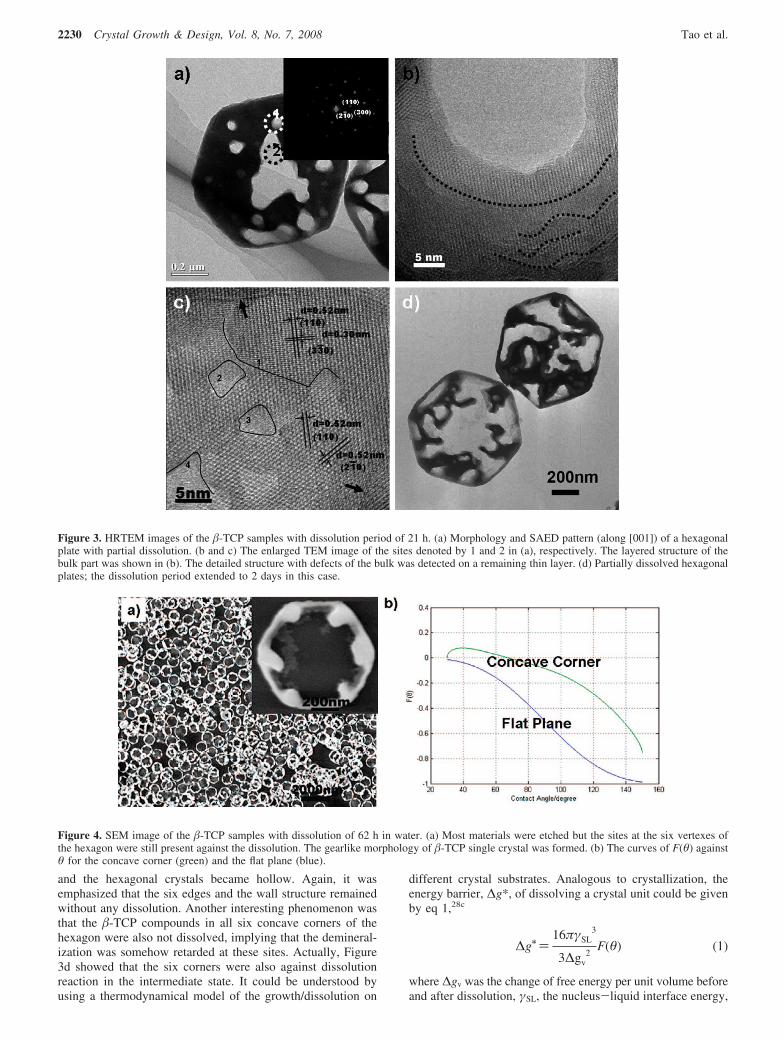
and the hexagonal crystals became hollow. Again, it wasemphasized that the six edges and the wall structure remainedwithout any dissolution. Another interesting phenomenon wasthat the �-TCP compounds in all six concave corners of thehexagon were also not dissolved, implying that the demineral-ization was somehow retarded at these sites. Actually, Figure3d showed that the six corners were also against dissolutionreaction in the intermediate state. It could be understood byusing a thermodynamical model of the growth/dissolution on
different crystal substrates. Analogous to crystallization, theenergy barrier, ∆g*, of dissolving a crystal unit could be givenby eq 1,28c
∆g/)16πγSL
3
3∆gv2
F(θ) (1)
where ∆gv was the change of free energy per unit volume beforeand after dissolution, γSL, the nucleus-liquid interface energy,
Figure 3. HRTEM images of the �-TCP samples with dissolution period of 21 h. (a) Morphology and SAED pattern (along [001]) of a hexagonalplate with partial dissolution. (b and c) The enlarged TEM image of the sites denoted by 1 and 2 in (a), respectively. The layered structure of thebulk part was shown in (b). The detailed structure with defects of the bulk was detected on a remaining thin layer. (d) Partially dissolved hexagonalplates; the dissolution period extended to 2 days in this case.
Figure 4. SEM image of the �-TCP samples with dissolution of 62 h in water. (a) Most materials were etched but the sites at the six vertexes ofthe hexagon were still present against the dissolution. The gearlike morphology of �-TCP single crystal was formed. (b) The curves of F(θ) againstθ for the concave corner (green) and the flat plane (blue).
2230 Crystal Growth & Design, Vol. 8, No. 7, 2008 Tao et al.

and F(θ), a function of shape of crystal face and contact angleof the unit and substrate. For the dissolution cases, F1(θ) onthe flat crystal face could be described by eq 2.
F1(θ))-14
(2- 3 cos θ+ cos3 θ) (2)
At the concave corners (the angle was set as 120°), F2(θ) wasmuch more complicated as a description by Trivedi andSholl,30,31
F2(θ))- 14π{ 2sin2θcosθcos-1(√3
3cotθ)+
2√33
cos2θ√sin2θ- 13
cos2θ- 4cosθcos-1(√33
cotθ)+cos-1( 1
2sinθ)} (3)
therefore, a difference of the energy barrier at the concavecorner, ∆g2
/ to that on the flat surface, ∆g1/could be represented
by
∆g2/-∆g1
/)16πγSL
3
3∆gv2
{F2(θ)-F1(θ)} (4)
and a curve of F(θ) vs θ was also illustrated in Figure 4b. Itwas noted that F1(θ) was always less than F2(θ) within a rangeof all contact angle zone. The curves implied that, under thesame experimental condition, the dissolution barrier at theconcave corner was always greater than that in the bulk or on
the edge. Besides the wall itself, the sites around the hexagonalcorners of the wall were more difficult to be dissolved. Thus,the formation of the gearlike structure could be understood.
Unlike the wall, which was really stable against the dissolu-tion, the remained �-TCP at the corner sites could be dissolvedeventually with the reaction time. At the end of dissolution (12days), the hexagonal dentations almost disappeared and onlythe six edges survived, forming the hexagonal ring (Figures 1cand 5). Most of the rings could keep their hexagonal structureswithout any deformation. No obvious dissolution was detectedeven that the resulting rings were redispersed in pure water.The sizes of the hollow rings were 750-800 nm, and the heightswere 200-250 nm (Figure S3, Supporting Information), whichwere in good agreement with the dimensions of the originalsolid hexagons of �-TCP. The chemical composition and phaseof the remaining rings were also checked by using XRD (FigureS4) and SAED (Figure 5b). The results confirmed that theremaining walls were still pure �-TCP and there was nodetectable phase transformation during the reaction. Thus, it wassurprising that the wall and the bulk have different dissolutionproperties even though they are identical in the crystal.
By increasing the undersaturation level in the demineralizationsolution, similar dissolution results could be observed (FigureS5, Supporting Information). However, a promoted dissolutionrate of the bulk part was detected since the hollow hexagonalrings could be obtained within only 5 days. This experimentindicated that the anisotropic dissolution behaviors could notbe affected by the change of undersaturation.
Figure 5. HRTEM images of the hollow rings at the end of dissolution (12 days). (a) The remaining rings. (b) The SAED pattern of the rings alongthe [001] zone axis, showing that the plate had a top/bottom (001) surface and outer (100) surface. (c) The detailed structure of the boundary ofwall and bulk (white circle in a). (d) The lattice fringes of the edge wall (dark circles in a).
Anisotropic Dissolution of �-TCP Crystal Growth & Design, Vol. 8, No. 7, 2008 2231
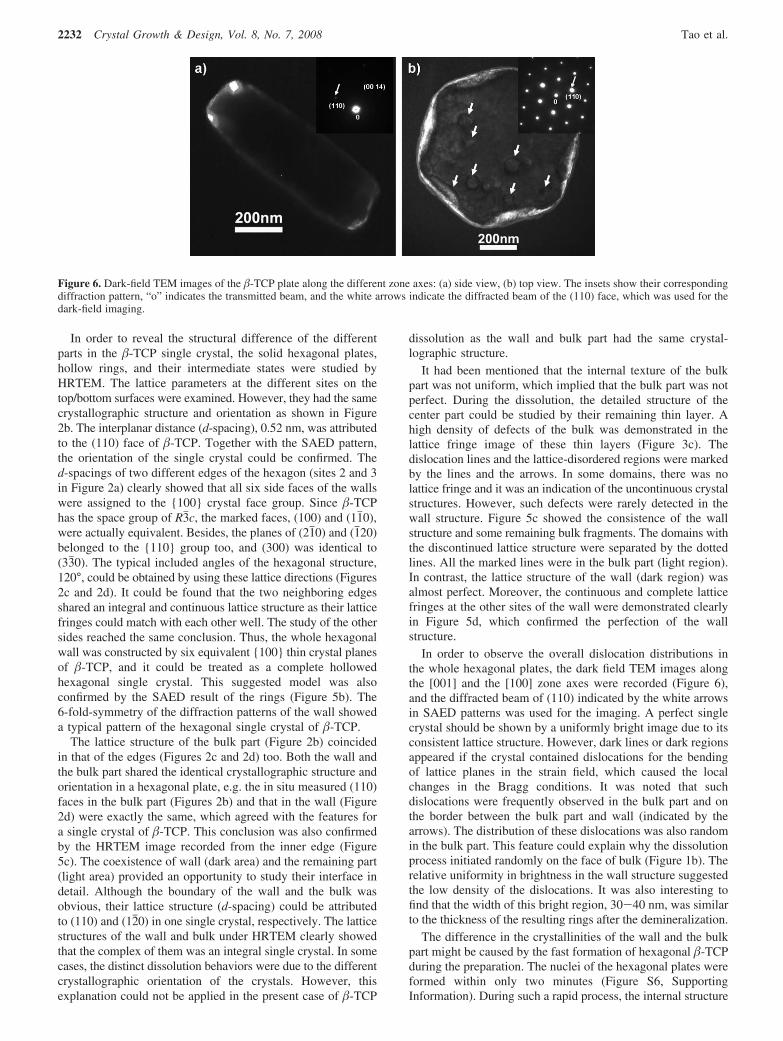
In order to reveal the structural difference of the differentparts in the �-TCP single crystal, the solid hexagonal plates,hollow rings, and their intermediate states were studied byHRTEM. The lattice parameters at the different sites on thetop/bottom surfaces were examined. However, they had the samecrystallographic structure and orientation as shown in Figure2b. The interplanar distance (d-spacing), 0.52 nm, was attributedto the (110) face of �-TCP. Together with the SAED pattern,the orientation of the single crystal could be confirmed. Thed-spacings of two different edges of the hexagon (sites 2 and 3in Figure 2a) clearly showed that all six side faces of the wallswere assigned to the {100} crystal face group. Since �-TCPhas the space group of R3jc, the marked faces, (100) and (11j0),were actually equivalent. Besides, the planes of (21j0) and (1j20)belonged to the {110} group too, and (300) was identical to(33j0). The typical included angles of the hexagonal structure,120°, could be obtained by using these lattice directions (Figures2c and 2d). It could be found that the two neighboring edgesshared an integral and continuous lattice structure as their latticefringes could match with each other well. The study of the othersides reached the same conclusion. Thus, the whole hexagonalwall was constructed by six equivalent {100} thin crystal planesof �-TCP, and it could be treated as a complete hollowedhexagonal single crystal. This suggested model was alsoconfirmed by the SAED result of the rings (Figure 5b). The6-fold-symmetry of the diffraction patterns of the wall showeda typical pattern of the hexagonal single crystal of �-TCP.
The lattice structure of the bulk part (Figure 2b) coincidedin that of the edges (Figures 2c and 2d) too. Both the wall andthe bulk part shared the identical crystallographic structure andorientation in a hexagonal plate, e.g. the in situ measured (110)faces in the bulk part (Figures 2b) and that in the wall (Figure2d) were exactly the same, which agreed with the features fora single crystal of �-TCP. This conclusion was also confirmedby the HRTEM image recorded from the inner edge (Figure5c). The coexistence of wall (dark area) and the remaining part(light area) provided an opportunity to study their interface indetail. Although the boundary of the wall and the bulk wasobvious, their lattice structure (d-spacing) could be attributedto (110) and (12j0) in one single crystal, respectively. The latticestructures of the wall and bulk under HRTEM clearly showedthat the complex of them was an integral single crystal. In somecases, the distinct dissolution behaviors were due to the differentcrystallographic orientation of the crystals. However, thisexplanation could not be applied in the present case of �-TCP
dissolution as the wall and bulk part had the same crystal-lographic structure.
It had been mentioned that the internal texture of the bulkpart was not uniform, which implied that the bulk part was notperfect. During the dissolution, the detailed structure of thecenter part could be studied by their remaining thin layer. Ahigh density of defects of the bulk was demonstrated in thelattice fringe image of these thin layers (Figure 3c). Thedislocation lines and the lattice-disordered regions were markedby the lines and the arrows. In some domains, there was nolattice fringe and it was an indication of the uncontinuous crystalstructures. However, such defects were rarely detected in thewall structure. Figure 5c showed the consistence of the wallstructure and some remaining bulk fragments. The domains withthe discontinued lattice structure were separated by the dottedlines. All the marked lines were in the bulk part (light region).In contrast, the lattice structure of the wall (dark region) wasalmost perfect. Moreover, the continuous and complete latticefringes at the other sites of the wall were demonstrated clearlyin Figure 5d, which confirmed the perfection of the wallstructure.
In order to observe the overall dislocation distributions inthe whole hexagonal plates, the dark field TEM images alongthe [001] and the [100] zone axes were recorded (Figure 6),and the diffracted beam of (110) indicated by the white arrowsin SAED patterns was used for the imaging. A perfect singlecrystal should be shown by a uniformly bright image due to itsconsistent lattice structure. However, dark lines or dark regionsappeared if the crystal contained dislocations for the bendingof lattice planes in the strain field, which caused the localchanges in the Bragg conditions. It was noted that suchdislocations were frequently observed in the bulk part and onthe border between the bulk part and wall (indicated by thearrows). The distribution of these dislocations was also randomin the bulk part. This feature could explain why the dissolutionprocess initiated randomly on the face of bulk (Figure 1b). Therelative uniformity in brightness in the wall structure suggestedthe low density of the dislocations. It was also interesting tofind that the width of this bright region, 30-40 nm, was similarto the thickness of the resulting rings after the demineralization.
The difference in the crystallinities of the wall and the bulkpart might be caused by the fast formation of hexagonal �-TCPduring the preparation. The nuclei of the hexagonal plates wereformed within only two minutes (Figure S6, SupportingInformation). During such a rapid process, the internal structure
Figure 6. Dark-field TEM images of the �-TCP plate along the different zone axes: (a) side view, (b) top view. The insets show their correspondingdiffraction pattern, “o” indicates the transmitted beam, and the white arrows indicate the diffracted beam of the (110) face, which was used for thedark-field imaging.
2232 Crystal Growth & Design, Vol. 8, No. 7, 2008 Tao et al.

of the plate could not be well organized and the defects resulted.However, as the outer surfaces contacted with the reactionmedium, the precipitated ions on the surfaces had the op-portunity to exchange with the reaction solution at the solid-liquidinterfaces. The lattice structure could be reorganized during anaging period so that the crystallinity of the wall could beimproved. Figure S6 shows that the smooth edges of the platesevolved within five minutes. However, this reorganization effectonly occurred at the interface and it could not penetrate intothe bulk. Thus, the formed defects were proposed to be“kinetically trapped” within the bulk part. This rapid growthinduced defect formation phenomenon had been previouslyobserved in other crystal system such as KDP.32,33 The darkfield TEM image recorded by the diffraction of (110) faces inFigure 6b indicated that the six side surfaces were different fromthe central part. The brightness of the side surfaces was muchstronger and more uniform than the top/bottom surfaces,indicating the well-crystallized structure of the edge wall. Thecurves and holelike lines in the bulk part demonstrated thedistortions of crystal faces, which were caused by the existeddislocations and defects. The difference in face flatness betweenside faces and top/bottom faces was also confirmed in the brightfield TEM image of side view of the hexagonal plates (FiguresS2 and S3). That the side faces had different crystallinities fromthe top/bottom faces could be understood by the intrinsicstructural features of the �-TCP.34 Only three calcium ions weredistributed in the different ways over the six sites lining frombottom to top along the [001] direction. The incompletedistributions of calcium ions over these sites could inevitablygenerate calcium vacancies, which led to the local residualcharge or the dangling bond along the [001] direction. The top/bottom (001) facets were the polar ones of �-TCP. The surfaceenergies calculation also confirmed that the surface stability ofthe {100} side faces was greater than the {001}.35 The polarsurface (001) was usually considered as an energeticallyunfavorable one in the solution where the dislocations were morereadily generated on it than on the six equivalent nonpolarsurfaces {100}. A similar effect was also observed in the caseof ZnO dissolution.6 Furthermore, the strain field of thesedislocations in the bulk could induce the formation of etch pitsmuch more readily than the defect-free wall.29 These differencesof dislocation distribution between the bulk part and the wall,
the side faces and the top/bottom faces, might result in theanisotropic dissolutions in one single crystal.
Besides, the size effect was the most important factor for theabnormal stability of the wall. It had been suggested, andconfirmed by experiment, that demineralization of sparinglysoluble salts such as calcium phosphate was generally initiatedand accompanied by the formation and development of pits onthe crystal surfaces and that the dissolution rates were alsodetermined by the pit densities and spreading velocities.28
However, only the large pits (greater than a critical size) couldprovide the active dissolution sites, contributing to the reaction.The anisotropic behavior of the hexagonal �-TCP dissolutionhad already been described. It implied that the dissolution along[001] was initiated by the large pits on the top/bottom surfaceof the plate, or the (001) crystal facet as shown by SEM (Figure1), TEM (Figures 2 and S2) and AFM surface height profiles(Figure 7). The wall had a relatively defect-free structure, andthe initiation of dissolution was more difficult than that of thebulk. In order to dissolve the wall, the active pits on the (001)narrow surface of the wall were required. The dimension (width)of this facet was less than 40 nm. However, the critical size forthe active pit for �-TCP dissolution was of tens of nanometers.27a,28c
Thus, the active pit was extremely difficult to be produced on thelimited dimensions. As the nanodissolution model proposed,28a thethin edge wall could be dynamically self-presevered by the sizeeffect.
A similar size effect was also found in biodemineralizaitonof tooth enamel.28a,b However, they were not single crystalsbut polycrystallites. The identical chemical and crystal propertiesof apatite in cores and on walls were observed in the rods.Analogous to the present work, the demineralization of theenamel cores around the rod c-axis was privileged as the corewas always emptied while the wall remained. However,the dissolution inhibition of the wall of the enamel rod may beexplained by the presence of some organic residuals in theframe. In order to examine the possible effect of the remainingorganic solvent on the abnormal dissolution, the hexagonal plateswere calcinated at 500 °C for 2 h to remove the organiccompounds. TEM characterizations showed that the size,morphology, and the structure of the plates were almostunaffected after the calcination. Furthermore, they underwentthe same demineralization to form the hexagonal rings (FigureS7, Supporting Information) eventually. Therefore, the interest-
Figure 7. AFM height image of hexagonal plates. (a) AFM image shows the smooth edge (wall surface) of a single hexagonal plate. (b) The roughtop (001) surface of the bulk contains many domains in the size of 20-60 nm.
Anisotropic Dissolution of �-TCP Crystal Growth & Design, Vol. 8, No. 7, 2008 2233
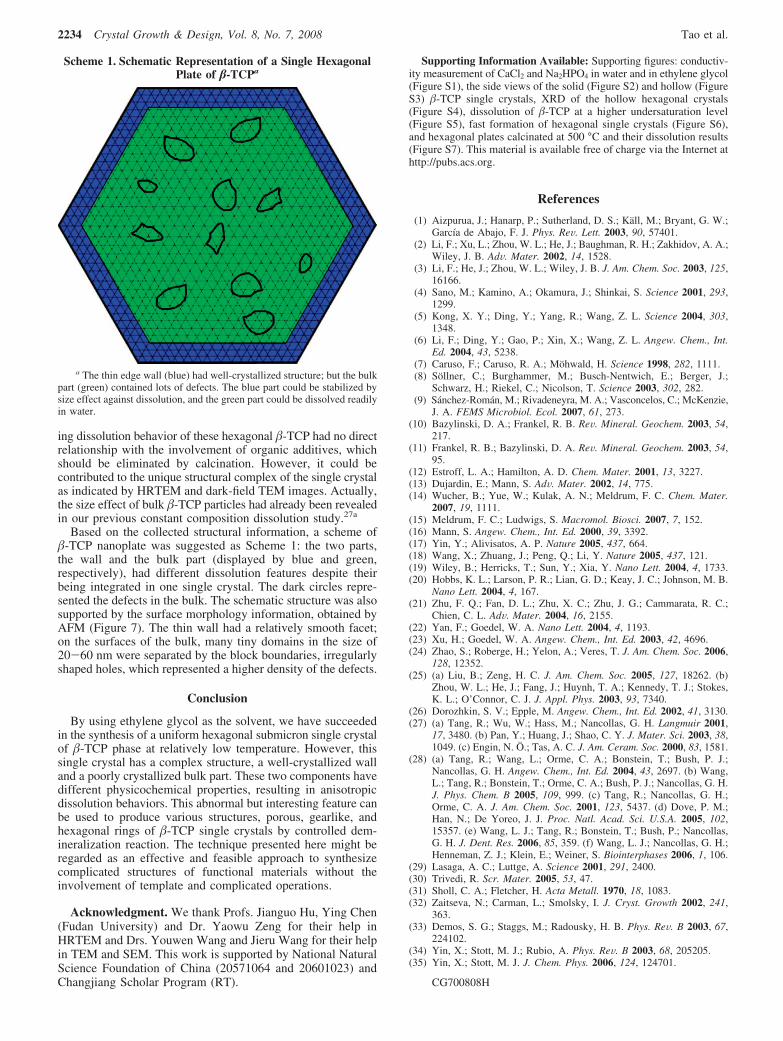
ing dissolution behavior of these hexagonal �-TCP had no directrelationship with the involvement of organic additives, whichshould be eliminated by calcination. However, it could becontributed to the unique structural complex of the single crystalas indicated by HRTEM and dark-field TEM images. Actually,the size effect of bulk �-TCP particles had already been revealedin our previous constant composition dissolution study.27a
Based on the collected structural information, a scheme of�-TCP nanoplate was suggested as Scheme 1: the two parts,the wall and the bulk part (displayed by blue and green,respectively), had different dissolution features despite theirbeing integrated in one single crystal. The dark circles repre-sented the defects in the bulk. The schematic structure was alsosupported by the surface morphology information, obtained byAFM (Figure 7). The thin wall had a relatively smooth facet;on the surfaces of the bulk, many tiny domains in the size of20-60 nm were separated by the block boundaries, irregularlyshaped holes, which represented a higher density of the defects.
Conclusion
By using ethylene glycol as the solvent, we have succeededin the synthesis of a uniform hexagonal submicron single crystalof �-TCP phase at relatively low temperature. However, thissingle crystal has a complex structure, a well-crystallized walland a poorly crystallized bulk part. These two components havedifferent physicochemical properties, resulting in anisotropicdissolution behaviors. This abnormal but interesting feature canbe used to produce various structures, porous, gearlike, andhexagonal rings of �-TCP single crystals by controlled dem-ineralization reaction. The technique presented here might beregarded as an effective and feasible approach to synthesizecomplicated structures of functional materials without theinvolvement of template and complicated operations.
Acknowledgment. We thank Profs. Jianguo Hu, Ying Chen(Fudan University) and Dr. Yaowu Zeng for their help inHRTEM and Drs. Youwen Wang and Jieru Wang for their helpin TEM and SEM. This work is supported by National NaturalScience Foundation of China (20571064 and 20601023) andChangjiang Scholar Program (RT).
Supporting Information Available: Supporting figures: conductiv-ity measurement of CaCl2 and Na2HPO4 in water and in ethylene glycol(Figure S1), the side views of the solid (Figure S2) and hollow (FigureS3) �-TCP single crystals, XRD of the hollow hexagonal crystals(Figure S4), dissolution of �-TCP at a higher undersaturation level(Figure S5), fast formation of hexagonal single crystals (Figure S6),and hexagonal plates calcinated at 500 °C and their dissolution results(Figure S7). This material is available free of charge via the Internet athttp://pubs.acs.org.
References
(1) Aizpurua, J.; Hanarp, P.; Sutherland, D. S.; Kall, M.; Bryant, G. W.;Garcıa de Abajo, F. J. Phys. ReV. Lett. 2003, 90, 57401.
(2) Li, F.; Xu, L.; Zhou, W. L.; He, J.; Baughman, R. H.; Zakhidov, A. A.;Wiley, J. B. AdV. Mater. 2002, 14, 1528.
(3) Li, F.; He, J.; Zhou, W. L.; Wiley, J. B. J. Am. Chem. Soc. 2003, 125,16166.
(4) Sano, M.; Kamino, A.; Okamura, J.; Shinkai, S. Science 2001, 293,1299.
(5) Kong, X. Y.; Ding, Y.; Yang, R.; Wang, Z. L. Science 2004, 303,1348.
(6) Li, F.; Ding, Y.; Gao, P.; Xin, X.; Wang, Z. L. Angew. Chem., Int.Ed. 2004, 43, 5238.
(7) Caruso, F.; Caruso, R. A.; Mohwald, H. Science 1998, 282, 1111.(8) Sollner, C.; Burghammer, M.; Busch-Nentwich, E.; Berger, J.;
Schwarz, H.; Riekel, C.; Nicolson, T. Science 2003, 302, 282.(9) Sanchez-Roman, M.; Rivadeneyra, M. A.; Vasconcelos, C.; McKenzie,
J. A. FEMS Microbiol. Ecol. 2007, 61, 273.(10) Bazylinski, D. A.; Frankel, R. B. ReV. Mineral. Geochem. 2003, 54,
217.(11) Frankel, R. B.; Bazylinski, D. A. ReV. Mineral. Geochem. 2003, 54,
95.(12) Estroff, L. A.; Hamilton, A. D. Chem. Mater. 2001, 13, 3227.(13) Dujardin, E.; Mann, S. AdV. Mater. 2002, 14, 775.(14) Wucher, B.; Yue, W.; Kulak, A. N.; Meldrum, F. C. Chem. Mater.
2007, 19, 1111.(15) Meldrum, F. C.; Ludwigs, S. Macromol. Biosci. 2007, 7, 152.(16) Mann, S. Angew. Chem., Int. Ed. 2000, 39, 3392.(17) Yin, Y.; Alivisatos, A. P. Nature 2005, 437, 664.(18) Wang, X.; Zhuang, J.; Peng, Q.; Li, Y. Nature 2005, 437, 121.(19) Wiley, B.; Herricks, T.; Sun, Y.; Xia, Y. Nano Lett. 2004, 4, 1733.(20) Hobbs, K. L.; Larson, P. R.; Lian, G. D.; Keay, J. C.; Johnson, M. B.
Nano Lett. 2004, 4, 167.(21) Zhu, F. Q.; Fan, D. L.; Zhu, X. C.; Zhu, J. G.; Cammarata, R. C.;
Chien, C. L. AdV. Mater. 2004, 16, 2155.(22) Yan, F.; Goedel, W. A. Nano Lett. 2004, 4, 1193.(23) Xu, H.; Goedel, W. A. Angew. Chem., Int. Ed. 2003, 42, 4696.(24) Zhao, S.; Roberge, H.; Yelon, A.; Veres, T. J. Am. Chem. Soc. 2006,
128, 12352.(25) (a) Liu, B.; Zeng, H. C. J. Am. Chem. Soc. 2005, 127, 18262. (b)
Zhou, W. L.; He, J.; Fang, J.; Huynh, T. A.; Kennedy, T. J.; Stokes,K. L.; O’Connor, C. J. J. Appl. Phys. 2003, 93, 7340.
(26) Dorozhkin, S. V.; Epple, M. Angew. Chem., Int. Ed. 2002, 41, 3130.(27) (a) Tang, R.; Wu, W.; Hass, M.; Nancollas, G. H. Langmuir 2001,
17, 3480. (b) Pan, Y.; Huang, J.; Shao, C. Y. J. Mater. Sci. 2003, 38,1049. (c) Engin, N. O.; Tas, A. C. J. Am. Ceram. Soc. 2000, 83, 1581.
(28) (a) Tang, R.; Wang, L.; Orme, C. A.; Bonstein, T.; Bush, P. J.;Nancollas, G. H. Angew. Chem., Int. Ed. 2004, 43, 2697. (b) Wang,L.; Tang, R.; Bonstein, T.; Orme, C. A.; Bush, P. J.; Nancollas, G. H.J. Phys. Chem. B 2005, 109, 999. (c) Tang, R.; Nancollas, G. H.;Orme, C. A. J. Am. Chem. Soc. 2001, 123, 5437. (d) Dove, P. M.;Han, N.; De Yoreo, J. J. Proc. Natl. Acad. Sci. U.S.A. 2005, 102,15357. (e) Wang, L. J.; Tang, R.; Bonstein, T.; Bush, P.; Nancollas,G. H. J. Dent. Res. 2006, 85, 359. (f) Wang, L. J.; Nancollas, G. H.;Henneman, Z. J.; Klein, E.; Weiner, S. Biointerphases 2006, 1, 106.
(29) Lasaga, A. C.; Luttge, A. Science 2001, 291, 2400.(30) Trivedi, R. Scr. Mater. 2005, 53, 47.(31) Sholl, C. A.; Fletcher, H. Acta Metall. 1970, 18, 1083.(32) Zaitseva, N.; Carman, L.; Smolsky, I. J. Cryst. Growth 2002, 241,
363.(33) Demos, S. G.; Staggs, M.; Radousky, H. B. Phys. ReV. B 2003, 67,
224102.(34) Yin, X.; Stott, M. J.; Rubio, A. Phys. ReV. B 2003, 68, 205205.(35) Yin, X.; Stott, M. J. J. Chem. Phys. 2006, 124, 124701.
CG700808H
Scheme 1. Schematic Representation of a Single HexagonalPlate of �-TCPa
a The thin edge wall (blue) had well-crystallized structure; but the bulkpart (green) contained lots of defects. The blue part could be stabilized bysize effect against dissolution, and the green part could be dissolved readilyin water.
2234 Crystal Growth & Design, Vol. 8, No. 7, 2008 Tao et al.
RESEARCH ARTICLE
The luminescent enhancement of LaPO4:Ce3+,Tb3+ nano
phosphors by radial aggregation
Xin JI1, Fei-Jian ZHU2, Ha-Lei ZHAI1, Rui-Kang TANG (✉)1
1 Department of Chemistry, Zhejiang University, Hangzhou 310027, China2 Research and Development Department, Hangzhou Daming Fluorescent Materials Co. Ltd., Hangzhou 311200, China
© Higher Education Press and Springer-Verlag Berlin Heidelberg 2010
Abstract The rare earth nano phosphors can meet thechallenging demand for new functional devices but theirluminescence is always poor. Here we report on a simplemethod to prepare uniform LaPO4:Ce
3+,Tb3+ sphere-likenano aggregates from the precipitated nano phosphorcrystallites without using any additive. The spontaneousaggregation is induced and controlled only by thesuspension pH conditions. It is found that the 100 nmspherical aggregates can significantly improve the greenemissions of the LaPO4:Ce
3+,Tb3+ nano particles. Theintensity of the aggregates can be about 10 times as that ofthe 80 nm-sized individual ones. This study may provide auseful yet convenient strategy in the improvement andapplication of nano phosphors.
Keywords nano phosphor, lanthanide phosphate, aggre-gation, luminescence, enhancement
1 Introduction
Nowadays the development and performance of the newgeneration of energy saving lighting, flat displays withliquid crystal display, and biologic marker and signal havebeen credited a lot to luminescent properties of rare earthmaterials [1–4]. Nanometric materials have attracted greatinterests because they may serve as active components innew functional devices. However, synthesized nanophosphors always have extremely lower luminescentefficiency than the corresponding bulk materials [5].Many approaches have been tried to improve emission ofnano phosphors. Among these studies, a significantresearch interest is toward the control of nano particlesize, morphology and aggregate by using various organic
templates [6,7]. It is noted that the template assembly ofnano particles into spatially well-defined architectures canoffer new properties to the functional materials, whichseem distinctly different from the isolated ones [8,9].Structural characteristics of these assembled nano particleslike lanthanide(Ln)-doped materials endow them with awide range of potential applications, such as for phosphors,optical amplifiers, biochemical probes, and medicaldiagnostics [10,11]. Unfortunately, the template-directedmethod needs some special instruments and harsh condi-tions, and usually leads to impurities due to the incompleteremoval of the templates [12]. Here we describe a facileprecipitation approach for the preparation of LnPO4
sphere-like nanostructures by isolated nano-particle aggre-gation in the absence of any template agent. And theaggregation can greatly enhance the luminescence of thenano phosphors.LnPO4 (Ln = La, Ce, and Tb) is an excellent light-
emitting phosphor, which has been extensively used inluminescent lighting industry. The green luminescence ofthe terbium ions is observed after a UV excitation of thecerium ions at the optimum wavelength of 272 nm. Theexcitation can further migrate from cerium to cerium untilit reaches a terbium luminescent center. Although thequantum yields of nano-particles are always lower than thecorresponding bulk materials, nano materials may increasethe luminescence of the 5D4 –
7F5 of Tb3+ via energytransfer of Ce3+! Tb3+ due to hindrance of boundary andsize [5]. So the preparation and characteristics ofLaPO4:Ce
3+,Tb3+ nano-particles are of great importance,and one of the most effective strategies to improveemission is to construct architectures. However, thepresence of organic additives such as surfactants in thetemplated nano-assembly often results in an increasedluminescence quenching [12,13], which leads to a negativeeffect on theluminescence. Therefore, it is a challenge toobtain the nano-architecture without any additive.
Received October 21, 2010; accepted November 2, 2010
E-mail: [email protected]
Front. Mater. Sci. China 2010, 4(4): 382–386DOI 10.1007/s11706-010-0115-z
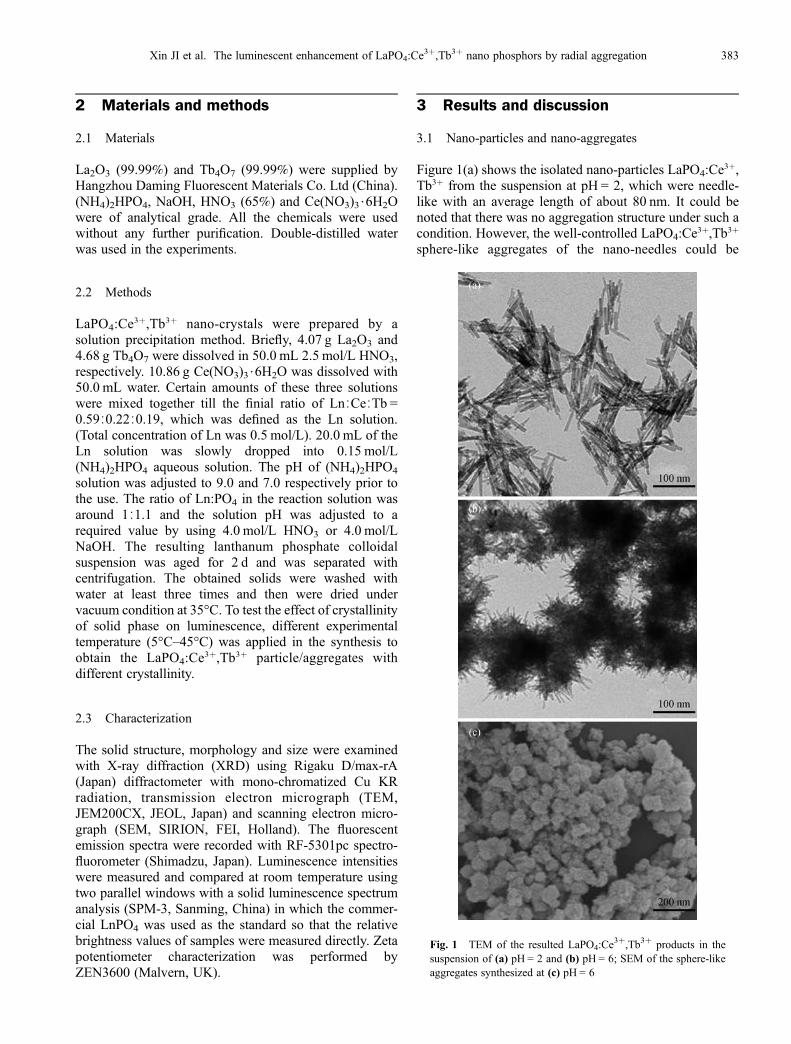
2 Materials and methods
2.1 Materials
La2O3 (99.99%) and Tb4O7 (99.99%) were supplied byHangzhou Daming Fluorescent Materials Co. Ltd (China).(NH4)2HPO4, NaOH, HNO3 (65%) and Ce(NO3)3$6H2Owere of analytical grade. All the chemicals were usedwithout any further purification. Double-distilled waterwas used in the experiments.
2.2 Methods
LaPO4:Ce3+,Tb3+ nano-crystals were prepared by a
solution precipitation method. Briefly, 4.07 g La2O3 and4.68 g Tb4O7 were dissolved in 50.0 mL 2.5 mol/L HNO3,respectively. 10.86 g Ce(NO3)3$6H2O was dissolved with50.0 mL water. Certain amounts of these three solutionswere mixed together till the finial ratio of Ln∶Ce∶Tb =0.59∶0.22∶0.19, which was defined as the Ln solution.(Total concentration of Ln was 0.5 mol/L). 20.0 mL of theLn solution was slowly dropped into 0.15 mol/L(NH4)2HPO4 aqueous solution. The pH of (NH4)2HPO4
solution was adjusted to 9.0 and 7.0 respectively prior tothe use. The ratio of Ln:PO4 in the reaction solution wasaround 1∶1.1 and the solution pH was adjusted to arequired value by using 4.0 mol/L HNO3 or 4.0 mol/LNaOH. The resulting lanthanum phosphate colloidalsuspension was aged for 2 d and was separated withcentrifugation. The obtained solids were washed withwater at least three times and then were dried undervacuum condition at 35°C. To test the effect of crystallinityof solid phase on luminescence, different experimentaltemperature (5°C–45°C) was applied in the synthesis toobtain the LaPO4:Ce
3+,Tb3+ particle/aggregates withdifferent crystallinity.
2.3 Characterization
The solid structure, morphology and size were examinedwith X-ray diffraction (XRD) using Rigaku D/max-rA(Japan) diffractometer with mono-chromatized Cu KRradiation, transmission electron micrograph (TEM,JEM200CX, JEOL, Japan) and scanning electron micro-graph (SEM, SIRION, FEI, Holland). The fluorescentemission spectra were recorded with RF-5301pc spectro-fluorometer (Shimadzu, Japan). Luminescence intensitieswere measured and compared at room temperature usingtwo parallel windows with a solid luminescence spectrumanalysis (SPM-3, Sanming, China) in which the commer-cial LnPO4 was used as the standard so that the relativebrightness values of samples were measured directly. Zetapotentiometer characterization was performed byZEN3600 (Malvern, UK).
3 Results and discussion
3.1 Nano-particles and nano-aggregates
Figure 1(a) shows the isolated nano-particles LaPO4:Ce3+,
Tb3+ from the suspension at pH = 2, which were needle-like with an average length of about 80 nm. It could benoted that there was no aggregation structure under such acondition. However, the well-controlled LaPO4:Ce
3+,Tb3+
sphere-like aggregates of the nano-needles could be
Fig. 1 TEM of the resulted LaPO4:Ce3+,Tb3+ products in the
suspension of (a) pH = 2 and (b) pH = 6; SEM of the sphere-likeaggregates synthesized at (c) pH = 6
Xin JI et al. The luminescent enhancement of LaPO4:Ce3+,Tb3+ nano phosphors by radial aggregation 383
formed spontaneously in the suspension at pH = 6(Figs. 1(b) and 1(c)). The nano-spheres had the uniformmorphology and size distribution; their diameters wereabout 100 nm. The basic building units, the needle-likecrystallites, could be identified clearly under TEM andSEM (Figs. 1(b) and 1(c)). The similar sphere-aggregatescould be obtained in the suspensions within the pH rangeof 5.5–6.5 and no significant difference of these aggregateswas detected. These phenomena implied that solution pHmight play a key role in the spontaneous aggregations.The XRD patterns (Fig. 2) of the isolated solids (nano-
aggregates and nano-particles) could be indexed to therhabdophane-type structure of lanthanum phosphate andall the peaks were assigned by using Joint Committee onPowder Diffraction Standards (JCPDS, No.04-0635). Theresults implied that the aggregation did not alter the latticestructure of LaPO4:Ce
3+,Tb3+. To our expectation, theproduct crystallinity was sensitive to the reaction tempera-ture. The increase of reaction temperature resulted in theimprovement of product crystallinities. For example, thediffraction peaks of the products synthesized at tempera-ture of 35°C were significantly sharper than those of thesamples prepared at 5°C, indicating a higher crystallinity.However, at the same reaction temperature, the individualnano-particles synthesized under lower pH conditionsalways had a greater crystallinity than the nano-aggregatesprepared under higher pH conditions, implying theinfluence of solution pH on the crystallinity.
3.2 Zeta-potential
Zeta-potential is a key factor in the studies of particleaggregation in solutions, which is sensitive to the solutionconditions such as pH and ionic strength. In our study, theionic strength in the reaction solution was relativelyconstant though the conditions might differ. And we noted
that the spontaneous aggregation only occurred within thepH range of 5.5–6.5. Thus, we examined the zeta-potentialof the isolated LaPO4:Ce
3+,Tb3+ nano needles in the waterunder different pH conditions (Fig. 3). The measuredpotential of the particle was about 41 mVat pH of 2.0. Theparticle surface charge value decreased slightly with theincrease of pH within the pH of 2.0–5.0. At the point ofpH = 5, zeta-potential of the nano-particles was about28 mV, but then the value suddenly dropped, which wasonly – 3 mV at pH = 6. However, around pH = 7 the zeta-potential of LaPO4:Ce
3+,Tb3+ reached the lowest value,about – 38 mV and the value began to increase slightlywith the further increase of solution pH. The repulsiveforce of particles in solution is proportional to zeta-potential due to the electrostatic interaction. It is widelyaccepted that the aggregation of particles can be effectivelydispersed when the absolute value of their zeta-potentialwas greater than 30 mV. The strong electrostatic repulsiveforces between particles can prevent them fromaggregating [14]. We noted that under our aggregationexperiment conditions with the pH of 5.5–6.5, the zeta-potential values located within the range from+ 15 to– 20 mV, providing a preferred experimental conditionfor the particle aggregation.
3.3 Luminescence
The nano-crystal aggregations of LaPO4:Ce3+,Tb3+ led to
the remarkable luminescence enhancement of the nanophosphor. As the common limitation of nano phosphor, theneedle-shaped nano LaPO4:Ce
3+,Tb3+ exhibited a littlevisible luminescence under UV excitation (l = 254 nm,Fig. 4, left). However, under the same UV excitation, thenano-aggregates (prepared at pH = 6) emitted much moregreen lights (Fig. 4, right). A quantitative measurement byusing the solid luminescence spectrum analysis showedthat the lighting intensity of LaPO4:Ce
3+,Tb3+ aggregateswas almost 10 times greater than the correspondingisolated nano-particles. Figure 5 shows the emission
Fig. 2 XRD patterns of LaPO4:Ce3+,Tb3+ aggregates prepared
for 2 d at (a) 5°C, (b) 15°C, (c) 25°C, (d) 35°C, (e) 45°C, and of(f) individual nano needles prepared at 35°C
Fig. 3 Zeta-potentials of LaPO4:Ce3+,Tb3+ particles at different
solution pH values
384 Front. Mater. Sci. China 2010, 4(4): 382–386

spectrum of the nano-aggregates under excitation of l =272 nm, which was exactly the same as that of the standardLaPO4:Ce
3+,Tb3+ nano phosphors. This result demon-strated that the aggregation actually did not alter theluminescent properties of the nano materials. The typicalemission peaks of terbium were observed around 486, 547,587 and 619 nm assigned to the transitions of 5D4 – 7FJ (J =6, 5, 4 and 3) respectively [15]. Ce3+ ions had a relativelybroad absorption band from 200 to 300 nmwith an allowed4f–5d transition, and transfered their energy to the dopedTb3+ ions, emitting the green light [16–18].The previous study of bulk phosphors suggested that the
luminescence is highly dependent upon the crystallinity ofmaterials [19,20], which is another important pathway toimprove the luminescence. In the current study, thecrystallinity of the nano LnPO4 was increased by usinghigh reaction temperature (Fig. 2). However, the nano-aggregates with improved crystallinity could not enhancethe emission intensity significantly (Fig. 6). Although thenano needles were even featured by the highest
crystallinity among the samples, their luminescence wasstill weak. It should be noted that the crystallinity of thesenano needles were even better than most aggregates.Therefore, it could be concluded that the aggregationplayed the most important role in the luminescentenhancement rather than the crystallinity in our case. Wesupposed that the effect of crystallinity on the lumine-scence improvement could be ignored in the LaPO4:Ce
3+,Tb3+ nano phosphors. Actually, the nano-sized materialslimit the number of primitive cells per particle andtherefore, there are only a few traps in the nano-particles.The energy of a luminescence center can only betransferred resonantly within one particle since the energytransfer is hindered by the particle boundary [4]. Soquenching occurs at high concentration in the isolated
Fig. 4 LaPO4:Ce3+,Tb3+ powders under UV excitation (l = 254 nm): isolated needle-liked particles (left) and sphere-like aggregates
(right)
Fig. 5 Emission spectrum of LaPO4:Ce3+,Tb3+ under UV
excitation of l = 272 nm Fig. 6 Relative luminescent intensities of different aggregates ofLaPO4:Ce
3+,Tb3+ nano-phases prepared at 5°C, 15°C, 25°C,35°C, 45°C (top), and of individual nano phosphors prepared at35°C (below). The luminescence intensity of a commercial bulkmaterial (provided by Hangzhou Daming Fluorescent MaterialsCo. Ltd.) was used as the standard sample and its relativeluminescent intensity was defined as 100.
Xin JI et al. The luminescent enhancement of LaPO4:Ce3+,Tb3+ nano phosphors by radial aggregation 385

nano-sized particles, which is the main reason for the poorluminescent characteristics for the nano phosphors.Although the crystallinity is a key factor in the improve-ment of bulk phosphor materials, its influences on thenano-phase is very weak. However, such a negative effecton luminescence by quenching may be effectively reducedby the nano-particle aggregation even the aggregation isvery simple [6]. Thus, the new luminescence property isconferred on the nano-aggregates. However, if an organictemplate is used additionally to assist in such anaggregation, the strong adsorption of the cross-linkers orsurfactants may also be assistant in the unexpectedquenching process. However, this negative influence canbe avoided by using a strategy of additive-free aggregation,which is demonstrated by our current study.
4 Conclusions
We suggest a simple approach for the preparation ofuniform LnPO4 nanostructures without any assistance oforganic additive in this article. The luminescent intensityof the spontaneously formed spherical aggregates can bealmost 10 times greater than the corresponding individualnano-particles. And we also reveal that in the case of nanosystem of LaPO4:Ce
3+,Tb3+, the effect of aggregation mayplay much more important role in the luminescentenhancement rather than the particle crystallinity. Thesefindings may provide a useful strategy to improve thesynthesis and application of various nano phosphors.
Acknowledgements This work was supported by Daming Biomineraliza-tion Foundation and the Fundamental Research Funds for the CentralUniversities.
References
1. Giaume D, Buissette V, Lahlil K, et al. Emission properties and
applications of nanostructured luminescent oxide nanoparticles.
Progress in Solid State Chemistry, 2005, 33(2–4): 99–106
2. Bunzli J C G, Comby S, Chauvin A S, et al. New opportunities for
lanthanide luminescence. Journal of Rare Earths, 2007, 25(3): 257–
274
3. Jüstel T, Nikol H, Ronda C. New developments in the field of
luminescent materials for lighting and displays. Angewandte
Chemie International Edition, 1998, 37(22): 3085–3103
4. Hu H, Zhang W. Synthesis and properties of transition metals and
rare-earth metals doped ZnS nanoparticles. Optical Materials, 2006,
28(5): 536–550
5. Yu L X, Song H W, Liu Z X, et al. Remarkable improvement of
brightness for the green emissions in Ce3+ and Tb3+ co-activated
LaPO4 nanowires. Solid State Communications, 2005, 134(11):
753–757
6. Yang M, You H, Song Y, et al. Synthesis and luminescence
properties of sheaflike TbPO4 hierarchical architectures with
different phase structures. The Journal of Physical Chemistry C,
2009, 113(47): 20173–20177
7. Li L, Jiang W G, Pan H H, et al. Improved luminescence of
lanthanide(III)-doped nanophosphors by linear aggregation. Journal
of Physical Chemistry C, 2007, 111(11): 4111–4115
8. Horiuchi S, Nakao Y. Polymer/Metal Nanocomposites: Assembly
of metal nanoparticles in polymer films and their applications.
Current Nanoscience, 2007, 3(3): 206–214
9. Sun Y J, Lu Y, Yu Y, et al. Template-assemble synthesis of ZnO:Er
nanostructure and their upconversion luminescence properties.
Journal of Nanoscience and Nanotechnology, 2009, 9(2): 1316–
1320
10. Tissue B M. Synthesis and luminescence of lanthanide ions in
nanoscale insulating hosts. Chemistry of Materials, 1998, 10(10):
2837–2845
11. Arellano I, Nazarov M, Byeon C C, et al. Luminescence and
structural properties of Y(Ta,Nb)O4:Eu3+,Tb3+ phosphors. Materi-
als Chemistry and Physics, 2010, 119(1–2): 48–51
12. Fang J, Saunders M, Guo Y, et al. Green light-emitting
LaPO4:Ce3+:Tb3+ koosh nanoballs assembled by p-sulfonato-calix
[6]arene coated superparamagnetic Fe3O4. Chemical Communica-
tions, 2010, 46(18): 3074–3076
13. Wang L Y, Li P, Li Y D. Down- and up-conversion luminescent
nanorods. Advanced Materials, 2007, 19(20): 3304–3307
14. Rabinovich-Guilatt L, Couvreur P, Lambert G, et al. Extensive
surface studies help to analyse zeta potential data: the case of
cationic emulsions. Chemistry and Physics of Lipids, 2004, 131(1):
1–13
15. Wang L Y, Li Y D. Na(Y1.5 Na0.5)F6 single-crystal nanorods as
multicolor luminescent materials. Nano Letters, 2006, 6(8): 1645–
1649
16. Kojima Y, Doi S, Yasue T. Synthesis of cerium (III) and terbium
(III) codoped vaterite phosphor emitting by black light irradiation
and its fluorescence property. Journal of the Ceramic Society of
Japan, 2002, 110: 755–760
17. Sohn K S, Park D H, Cho S H, et al. Genetic algorithm-assisted
combinatorial search for a new green phosphor for use in tricolor
white LEDs. Journal of Combinatorial Chemistry, 2006, 8(1): 44–49
18. Ding S J, Zhang W, Xu B Q, et al. [Spectra of Ce3+, Tb3+ and Gd3+
ions in Ln(BO3,PO4) [Ln = La, Y]]. Spectroscopy and Spectral
Analysis, 2001, 21(3): 275–278 (Ln = La, Y)
19. Mari B, Singh K C, Sahal M, et al. Preparation and luminescence
properties of Tb3+ doped ZrO2 and BaZrO3 phosphors. Journal of
Luminescence, 2010, 130(11): 2128–2132
20. Kim S W, Masui T, Matsushita H, et al. Enhancement in
photoluminescence of Gd2O2CO3:Tb3+ submicron particles by
introducing yttrium into the oxycarbonate lattice. Journal of the
Electrochemical Society, 2010, 157(5): 181–185
386 Front. Mater. Sci. China 2010, 4(4): 382–386