
4Q05 Analyst Final - JPMorgan Chase · $467.5 $450.3 $430.9 ... 1 Prior period amounts have been...
38
FINANCIAL RESULTS J A N U A R Y 1 8, 2006 Fourth Quarter 2005
Transcript of 4Q05 Analyst Final - JPMorgan Chase · $467.5 $450.3 $430.9 ... 1 Prior period amounts have been...

FINANCIAL RESULTS
J A N U A R Y 1 8, 2 0 0 6
Fourth Quarter 2005

2
Agenda
n Firm results – 4Q
n 2006 Outlook
n Appendix

3
Fourth Quarter 2005 Earnings
n Operating earnings per share of $0.73
n Card results reflect impact of new bankruptcy legislation
n Investment Bank – strong IB fees; weak trading results
n Retail Financial Services - good deposit and account growth
n Strong earnings growth in Commercial Banking, Treasury & Securities Services and Asset & Wealth Management
n Merger savings at $2.2bn annualized run rate
n Capital strength with Tier 1 estimate of 8.5%— Stock buyback: $1bn in 4Q05

4
($ in millions, except per share) 4Q05 3Q05 4Q04
Reported Net Income $2,698 $2,527 $1,666
Non-Operating Charges (after-tax) (81) 137 650
Operating Earnings $2,617 $2,664 $2,316
Reported EPS $0.76 $0.71 $0.46
Operating EPS $0.73 $0.75 $0.64
4Q05 Earnings Comparison
Non-Operating Charges (After-Tax) 4Q05 3Q05 4Q04
Merger Costs $48 $137 $324
Litigation Expense (129) 0 0
Card Decertification 0 0 447 Conforming Allowance 0 0 (121)
Total ($81) $137 $650

5
4Q05 Significant Operating Items
($ in millions)
Pre-tax
After-Tax Per Share
Line of Business
Gain on sale of BrownCo $1,254 $0.21 Corporate
Impact of bankruptcy law (650)
(0.11) Card Services
Capital losses:
Treasury portfolio repositioning (547) (0.10) Corporate
Hybrid ARMs mark to market (120) (0.02) Retail Financial Services
Accelerated vesting of out-of-money options (145) (0.03) Corporate
Reduction in wholesale allowance 132 0.02 IB/CB/TSS/AWM

6
$ O/(U) % O/(U) ($ in millions) 4Q05 3Q05 4Q04 3Q05 4Q04
Revenue (FTE)1 $14,955 ($599) $806 (4%) 6%
Credit Costs1 2,286 174 643 8% 39%
Expense 8,666 (577) (197) (6%) (2%)
Earnings $2,617 ($47) $301 (2%) 13%
EPS $0.73 ($0.02) $0.09 (3%) 14%
Quarterly Results2 4Q05 3Q05 4Q04
Return on Equity 10% 10% 9%
Return on Equity-Net of GW 17% 17% 15%
4Q05 Operating Performance Comparison
1 Operating basis excludes merger costs, litigation charges deemed non-operating, card decertification and accounting policy conformity adjustments incurred in 4Q05, 3Q05 and 4Q04 and presents revenues and credit costs without the effect of credit card securitizations. All references to credit costs refer to managed provision for credit losses
2 Actual numbers for all periods, not over/under

7
$ O/(U) % O/(U)
($ in millions) 4Q05 3Q05 4Q04 3Q05 4Q04
Investment Bank $664 ($399) $4 (38%) 1%
Retail Financial Services 803 147 28 22% 4%
Card Services 302 (239) (213) (44%) (41%)
Commercial Banking 289 (12) 35 (4%) 14%
Treasury & Securities Services 300 37 155 14% 107%
Asset & Wealth Management 342 27 79 9% 30%
Corporate (83) 392 213 83% 72%
Total Firm $2,617 ($47) $301 (2%) 13%
LOB Operating Earnings Comparison

8
2005 2004 Rank Share Rank Share
Global Announced M&A #3 24% #3 24%
Global Syndicated Loans #1 16% #1 19%
Global Debt, Equity and Equity-Related #4 6% #3 7%
Global Long Term Debt #4 6% #2 7%
Global Equity and Equity-Related #6 7% #6 6%
Investment Bank $O/(U) ($ in millions) 4Q05 3Q05 4Q04
Revenue $3,187 ($1,274) ($14)
Investment Bkg. Fees 1,161 176 81
Fixed Income Mkts 1,104 (1,327) (426)
Equities Markets 458 (255) 215
Credit Portfolio 464 132 116
Credit Costs (83) (37) 90
Expense 2,161 (714) (229)
Earnings $664 ($399) $4
Key Statistics1
ROE 13% 21% 13%
Overhead 68% 64% 75%
Comp./Rev. 34% 42% 43%
VAR ($mm)2 $95 $86 $79
¹ Actual numbers for all periods, not over/under2 Average Trading and Credit Portfolio VAR
Source: Thomson Financial
n Earnings of $664mm flat YoY and down 38% from strong 3Q
n IB fees of $1.2 billion are highest since 1Q00, driven primarily by strong advisory and equity underwriting fees
n Fixed Income Markets reflect weak trading results primarily from poor positioning in U.S. interest rate and commodities markets
n Equities Markets reflect improvement from prior year trading loss, although lower than a strong 3Q
n Credit Portfolio reflects higher gains from loan workouts; credit costs continue to benefit from strong credit quality
n Q4 Compensation to Revenue ratio of 34% reflects year-end adjustments which resulted in a full year ratio of 40%

9
4Q05 3Q05 4Q04
Consumer & Small Business
Checking Accts (MM)1 8.8 8.7 8.1
# of Branches 2,641 2,549 2,508
# of ATMs 7,312 7,136 6,650
Avg Total Deposits ($B) $177.4 $174.2 $171.8
Overhead 66% 66% 65%
Home Finance ($B) Mortgage loan originations $31.9 $39.3 $32.4
3rd party mortgage loans serviced
$467.5 $450.3 $430.9
Home equity originations $12.1 $14.3 $12.0
Avg mortgage loans retained $46.6 $47.6 $44.6
Avg home equity & other loans owned
$73.0 $71.8 $70.1
Net charge-off rate 0.12% 0.13% 1.57%
Auto & Education Finance
Avg loan & lease related assets ($B)
$50.8 $52.1 $62.6
Net charge-off rate 0.66% 0.56% 0.65%
Retail Financial Services – Business Drivers
n Key metrics growth YoY - Checking accounts up 8%- Average total deposits up 3%- Branch sales of credit cards up 47%- Branch sales of mortgage loans up 107%
n Distribution growth this quarter- Opened 99 new branches- ATMs increased by 176- Personal bankers in the branches
increased by 348- Retail mortgage salesforce up 121
n Credit trends remain good- Still reviewing exposures in Katrina-
affected areas
1 Prior period amounts have been restated to reflect inactive accounts that should have been closed during those periods

10
($ in millions, after-tax) $ O/(U)
4Q05 3Q05 4Q04
Earnings $803 $147 $28 Less: Katrina provision - - 155 - - Less: Portfolio Repositioning2 (74) (47) (101)
Less: MSR risk mgmt results 30 54 146
Adjusted earnings $847 ($15) ($17)
$ O/(U) ($ in millions) 4Q05 3Q05 4Q04
Revenue $3,594 $4 $49
Credit Costs 158 (220)
80
Expense 2,141 (15) (74)
Earnings $803 $147 $28
ROE1 23% 19% 24%
($ in millions, after-tax) $ O/(U)
4Q05 3Q05 4Q04
Adjusted Earnings $847 ($15) ($17) Consumer & Small Bus. 414 2 (16) Home Finance 311 (35) (17) Auto & Ed.Finance 87 1 3 Insurance 35 17 13
Retail Financial Services
n Consumer & Small Business- Good deposit growth with some margin compression as expected
n Home Finance- Decline in Prime Mortgage QoQ due to seasonality and market
- Decrease in Home Equity originations QoQ due to rate environment
1 Actual numbers for all periods, not over/under2 Portfolio repositioning includes the following pre-tax items:
- 4Q05: Hybrid ARM mark-to-market of ($120)mm - 3Q05: Loss on transfer of auto loans to held-for-sale of ($43)mm- 4Q04: Gain on sale of Manufactured Housing of $95mm and Hybrid ARM mark-to-market of ($52)mm

11
$O/(U) ($ in millions) 4Q05 3Q05 4Q04
Revenue $3,721 ($259) ($109)
Credit Costs 2,236 403 501
Expense 1,017 (269) (265)
Earnings $302 ($239) ($213)
Key Statistics1
ROE 10% 18% 17%
ROO (Pre-tax) 1.34% 2.48% 2.45%
Managed Margin 8.14% 8.55% 8.79%
Net Charge-Off Rate 6.39% 4.70% 5.24%
30 Day Delinquency Rate 2.79% 3.39% 3.70%
Avg Outstandings ($B) $138.9 $137.8 $131.8
Charge Volume ($B) $79.6 $76.4 $75.3
Net Accts Opened (MM) 12.5 3.0 2.7
Card Services (Managed)
¹ Actual numbers for all periods, not over/under
n Earnings of $302mm down 41% YoY
n New bankruptcy legislation negatively impacted pre-tax earnings by $650 million, primarily through higher credit costs, but also through reversal of revenue
n New merchant services agreement results in deconsolidation of Paymentech driving decreases in revenue, expense and pre-tax earnings; no bottom line impact
n Purchased Sears Canada credit card operation adding 9.7 million new accounts and $1.2 billion in average outstandings

12
Card Services (Managed)
$ O/(U)
($ in millions) 4Q05 3Q05 4Q04 3Q05 4Q04
Revenue $3,721 $3,980 $3,830 ($259) ($109)
Bankruptcy estimate 75 - - - -
Paymentech deconsolidation - - (151) (146)
Adjusted Revenue $3,796 $3,829 $3,684 ($33) $112
Adjusted Managed Margin 8.36% 8.53% 8.78%
Credit Costs $2,236 $1,8331 $1,735 $403 $501
Bankruptcy estimate (575) (100) - -
Adjusted Credit Costs $1,661 $1,7331 $1,735 ($72) ($74)
Expense $1,017 $1,286 $1,282 ($269) ($265)
Paymentech deconsolidation - - (134) (129)
Adjusted Expense $1,017 $1,152 $1,153 ($135) ($136)
Pretax Earnings $468 $861 $813 ($393) ($345)
Bankruptcy estimate 650 100 - -
Paymentech deconsolidation - - (17) (17)
Adjusted Pretax Earnings $1,118 $944 $796 $174 $322
Earnings $302 $541 $515 ($239) ($213)
Adjusted Earnings $715 $605 $515 $110 $200
ROO 1.34% 2.48% 2.45%
Adjusted ROO 3.19% 2.72% 2.40%
1 Includes $100mm of Katrina-related provision taken in 3Q05
n Revenue up YoY driven by higher loan balances and charge volume, partially offset by lower spread. Continued margin compression QoQ
n Credit Costs− $575mm management estimate
of bankruptcy impact in 4Q05− Loan loss allowance unchanged
n Expense down YoY and QoQ due to merger savings. QoQ decline also driven by lower marketing expense
Adjusted for Paymentech deconsolidation and Bankruptcy

13
$O/(U) ($ in millions) 4Q05 3Q05 4Q04
Revenue $937 $28 $52
Middle Market 611 19 40
Mid-Corporate Banking 147 7 5
Real Estate 141 (2) 8
Other 38 4 (1)
Credit Costs (17) 29 (38)
Expense 480 19 29
Earnings $289 ($12) $35
Key Statistics1
ROE 34% 35% 30%
Overhead 51% 51% 51%
Net Charge-Off Rate 0.15% 0.05% 0.35%
Avg Loans & Leases ($B) $54.2 $51.8 $50.5
Avg Liability Balances2 ($B) $76.7 $72.7 $69.4
Commercial Banking
¹ Actual numbers for all periods, not over/under 2 Includes deposits and deposits swept to on-balance sheet liabilities
n Earnings of $289mm up 14% YoY
n Loans up 7% YoY and 5% QoQ - Solid growth across all segments
n Liability balances up 11% YoY as a result of continued growth in Middle Market sweeps and Real Estate
n Record revenue of $937mm up 6% YoY driven by wider spreads and higher volume related to liability balances and increased loans across all businesses, partially offset by narrower loan spreads

14
$O/(U) ($ in millions) 4Q05 3Q05 4Q04
Revenue $1,615 $59 $202
Treasury Services 674 26 32
Investor Services 567 31 113
Institutional Trust Svcs 374 2 57
Expense 1,104 (3) (42) Earnings $300 $37 $155
Key Statistics1
ROE 63% 55% 30%
Pre-tax Margin 29% 26% 16%
TSS Firmwide Revenue $2,308 $2,214 $2,009
TSS Firmwide OH Ratio 59% 62% 69%
TS Firmwide Revenue $1,367 $1,306 $1,238
Avg. Liability Balances ($B)2 $171.5 $166.8 $147.8
Assets under Custody ($T)3 $11.2 $11.0 $9.3 Corp. Trust Securities under Admin ($T)
$6.8
$6.7
$6.7
Treasury & Securities Services
¹ Actual numbers for all periods, not over/under2 Includes deposits and deposits swept to on-balance sheet liabilities3 Includes an estimated $400 billion of assets under custody from ITS as of 3/31/2005 and an additional estimated $130 billion as of 9/30/20054 Excludes ITS assets under custody
n Record earnings of $300mm - Up 107% YoY and 14% QoQ
n Liability balances up 16% YoY; Assets under custody up 15% YoY4
n Revenue up 14% YoY primarily driven by increased product volume and market appreciation, wider liability balance spreads, higher liability balances and the impact of the Vastera acquisition
n Expense down 4% YoY- Pre-tax margin of 29%

15
$O/(U) ($ in millions) 4Q05 3Q05 4Q04
Revenue $1,511 $62 $201
Credit Costs (10) 9 11
Expense 1,033 57 114
Earnings $342 $27 $79
Key Statistics1
ROE 57% 52% 44%
Pre-tax Margin 32% 34% 31%
Assets under Supervision($B) $1,1492 $1,153 $1,106
Assets under Mgmt($B) $847 $828 $791
Average Loans ($B) $26.73 $26.9 $26.0
Average Deposits ($B) $44.23 $41.5 $43.4
Asset & Wealth Management
1 Actual numbers for all periods, not over/under2 Excludes BrownCo assets under supervision for 4Q05, while prior periods include them3 Includes two months of BrownCo
n Earnings of $342mm - Up 30% YoY and 9% QoQ
n Assets under management up 7% YoY; Net asset inflows driven by retail flows from third party distribution primarily in equity-related products, as well as institutional flows in liquidity products
n Closed sale of BrownCo on Nov. 30th

16
$O/(U) ($ in millions) 4Q05 3Q05 4Q04
Earnings by Unit
Private Equity $121 ($20) ($118)
Treasury ex sec. gains/(losses) (235) 38 45
Other Corporate ex. BrownCo (382) (66) (79)
Total ex. sec. g/(l) & BrownCo ($496) ($48) ($152)
Securities gains/(losses) (339) (312) (387)
Gain on sale of BrownCo 752 752 752
Total ($83) $392 $213
Balance sheet ($B)1
Avg. Treasury Invst Portfolio $37.8 $39.4 $63.4
EOP Private Equity Portfolio $6.2 $5.9 $7.5
Corporate
1 Actual numbers for all periods, not over/under
n Private Equity− Gains of $289mm− Portfolio of $6.2bn at year end
n Treasury excluding securities gains/(losses) shows modest improvement as expected
n Other Corporate includes:− $1.3bn pre-tax gain on sale of
BrownCo − $145mm pre-tax impact of
accelerated vesting of out-of-money options
− $55mm tax benefit related to the American Jobs Creation Act

17
Capital Strength
4Q05
3Q05
4Q04
Capital/Balance Sheet ($B)1
Tier 1 capital $72.5 $70.7 $68.6
Risk weighted assets $849.9 $866.3 $791.4
Tier 1 capital ratio 8.5% 8.2% 8.7%
Total capital ratio 12.1% 11.3% 12.2%
Leverage ratio 6.3% 6.2% 6.2%
Common shareholders’ equity less goodwill $63.5 $62.4 $62.1
Tangible common equity $55.1 $53.6 $51.7
TCE/Managed RWA 6.1% 5.9% 6.2%
Common Dividends ($MM)
Dividends Paid $1,198 $1,206 $1,223
Share Repurchase
Shares Repurchased (MM) 26.32 14.4 15.8
Purchase Cost ($MM) $1,0002 $500 $600 1 Estimated for 4Q052 There is $1.9B remaining capacity from the $6B authorized by the Board in July 2004.

18
Agenda
n Firm results – 4Q
n 2006 Outlook− Overview− Lines of Business
n Appendix

19
2006 Highlights and Observations
n Comments assume steady-state economy and implied rate curve
n Wholesale credit costs trend more toward normalized levels during 2006
n On track to achieve $3.0 billion in merger savings
n Business as usual expense management – ongoing waste-cutting & investing

20
n Expense excluding IB total compensation expected to be flat to 2005
n Merger savings will reach annualized run-rate of $2.8 billion in 4Q06
n Quality expense growth
− Acquisitions (Sears Canada – 4Q05, Collegiate Funding Services- est. 1Q06)
− New branches
− Marketing
Comments on Expense ($ in millions)
Proforma 2004
2005
% Change O/(U) 2005 vs. 2004
Total firm expense $35,439 $35,549 0.3%
Expense (ex. IB total comp) 30,326 29,764 (1.9%)
($ in millions)
Proforma 2004
2005
$ Change O/(U) 2005 vs. 2004
Expense (ex. IB total comp) $30,326 $29,764 ($562)
Less: Merger savings (400) (1,875)
Less: Acquisitions1 0 800
Adjusted expense (ex. IB total comp) $30,726 $30,839 $113
1 Includes Highbridge, Cazenove, Vastera and Sears Canada.
Selected Expense Components

21
n Continue to build fortress balance sheet
n Tier 1 capital target above 8%
− 12/31/05 Tier 1 estimate of 8.5%
n Excess capital generation creates capital flexibility
− Dividend payout target: 30-40%
− Stock buyback: $3.4 bn in 2005
− Investments in the business
n Modest increase in risk-weighted assets and risk profile
Comments on Capital

22
Allocated Capital1 ($B)
4Q05
Estimated 1Q06
Key rationale2
Investment Bank $20.0 $20.0 Net asset leverage Retail Financial Services 13.7 13.5 Tier 1
Card 11.8 14.0 Managed receivables leverage
Commercial Banking 3.4 5.5 Tier 1
Treasury & Securities Services 1.9 2.5 Competitor comparison
Asset & Wealth Management 2.4 3.5 Competitor comparison/Tier 1
Corporate3 10.3 5.5 Unallocated & excess capital
Common shareholders’ equity less goodwill $63.5 $64.5
Allocated Capital by Line of Business
n LOB equity represents common shareholders’ equity less goodwill
n Amount of capital for LOB’s required to support standalone “A” rating
n Changes in LOB capital will be deliberate management decision
1 Businesses receive NII credit on allocated capital2 Represents principal factor for each LOB. Many other factors were taken into account to determine appropriate capital requirements3 Corporate includes capital allocated to private equity and unallocated capital

23
Agenda
n Firm results – 4Q
n 2006 Outlook− Overview− Lines of Business
n Appendix

24
Investment Bank
Performance Target
2006 Outlook
n Strong IB fee pipeline entering 2006
n Better trading revenues in 2006 than 2005; reduced volatility
n Continued benefit from growth initiatives
n Decline in Credit Portfolio revenues and higher credit costs
n 43% compensation/revenue ratio is a reasonable expectation− Appropriate versus peers
n Expense excluding incentives reflect net investments
n 20% ROE on $20 billion in equity
− Strive to achieve by 2007

25
Retail Financial ServicesPerformance Targets
2006 Outlook
n Retail Financial Services − 28-30% ROE with volatility
− Strive to achieve by 2007− 50% Overhead Ratio (ex.CDI)
− Pressure from ramp-up in new builds
n Revenue improvement− NII runs flat to 4Q05; deposit margin remains under pressure− Fee revenue up in branches and mortgage− No MSR risk management revenue planned
n Credit stable − Still monitoring Katrina-related exposure
n Expense up modestly from 2005 level− Continued investment in build-out of branches and mortgage business
n Community Banking − New segment; comparable to peers− Will include branches, small business,
loan portfolio and education− Managed against Overhead Ratio
n Mortgage – managed against ROE
n Auto – managed against ROE

26
Card Services
Performance Targets
2006 Outlook
n 3.5% +/- Pre-tax ROO− Min pay is a big 2006 swing factor− Substantial progress in 2006; strive to achieve in 2007
n 20% ROE through the cycle
n As nature of business changes, will convert more to ROE target
n Expect outstandings and charge volume growth − Depends on environment and competition
n Charge-offs improve in first half from bankruptcy benefit, partially offset by min pay impact in the second half
n Expense to increase modestly with full year impact of Sears Canada acquisition and continued marketing spend
n Full annual effect of Paymentech deconsolidation in 2006

27
Commercial Banking
Performance Target
2006 Outlook
n 50% Overhead Ratio
n Strive to achieve by end of 2006
n Continued growth in loan and liability balances; pressure on lending spreads
n Credit costs trend more toward normal
n Slight increase in expense
28
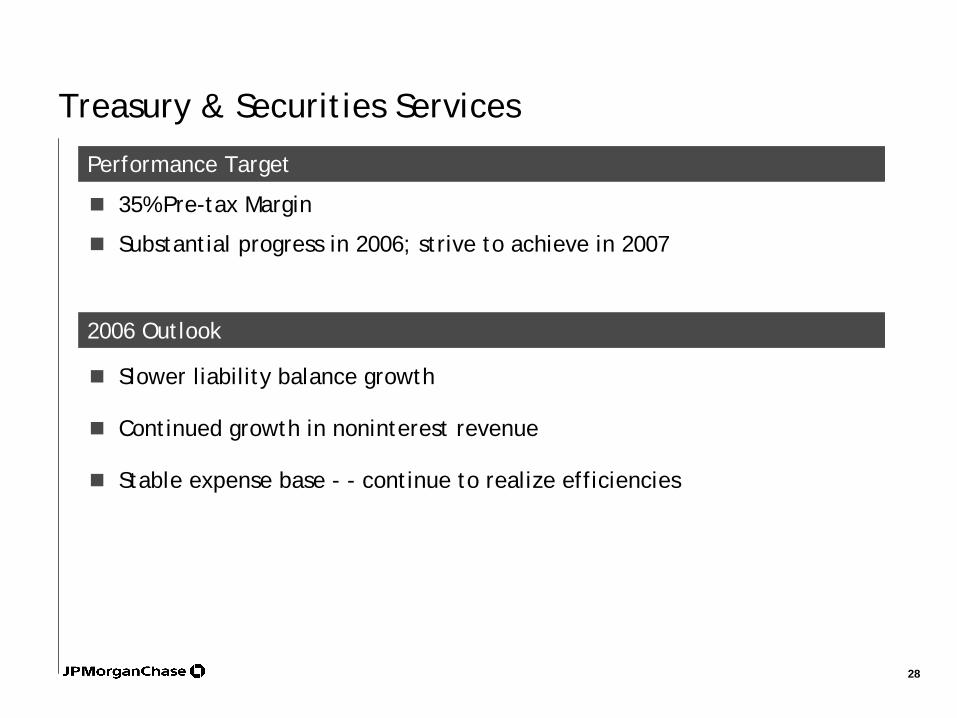
Treasury & Securities Services
Performance Target
2006 Outlook
n 35% Pre-tax Margin
n Substantial progress in 2006; strive to achieve in 2007
n Slower liability balance growth
n Continued growth in noninterest revenue
n Stable expense base - - continue to realize efficiencies

29
Asset & Wealth Management
Performance Target
2006 Outlook
n 35% Pre-tax Margin while investing for growth
n Strive to achieve by end of 2006
n Continued inflows expected to drive AUM growth
n Expense to increase due to ongoing investments in growth areas
n Credit costs trend to more normal levels
n 2006 does not include BrownCo

30
Corporate2006 Outlook
n Private Equity− $300mm/qtr in private equity gains is a reasonable expectation ($1,691mm in 2005)− Hard to predict; market-driven; will be lumpy
n Treasury− Treasury NII of ($1.7)bn in 2005 improves by approximately $400mm − Lumpy but gradual improvement− 2006 NII exit rate of approximately ($1.0)bn
n Other Corporate− ($1.3)bn operating net loss excluding BrownCo in 2005− Improves by $500mm+ in 2006; very lumpy but gradual improvement− Includes central tech & ops retained expense, vacant excess real estate, other
unallocated corporate expense, pension and other corporate assets and related accounting, etc.

31
2006 Tech & Ops Major InitiativesConversion
n Tri-state market integration (est. Consumer: 3Q06; Wholesale: mid 2007)
− Lending platforms− Deposit systems− Check processing− Treasury platforms− Retail channels
n Insource core Card processing
n Commercial lending platform conversions
n Strategic Data Center migrations
n Network refresh of major processing centers and large corporate business hubs
n Domestic/Operational general ledger conversions
n Corporate Internet Group− BankOne.com customer migration− CardMemberServices.com customer migration− Insource Private Bank Morgan Online (MOL)− Customer portal for Treasury Services and Commercial Bank
Investments
n Investment Bank:− Credit infrastructure transformation− Global equities cash expansion− Prime brokerage initiatives
n Retail Financial Services:− Upgrade Loan Origination Systems− Implement new mortgage servicing system
n Treasury & Securities Services:− Global Client Access Stability/Scalability (TS)− International expansion – Mass Payments (TS)− Alternative Investment Platform (WSS)− Views Portfolio Reporting (WSS)
n Expand offshore staffing capabilities

32
Conclusions
n Balance sheet continues to strengthen− Better capital generation looking forward− Less legal uncertainty
n Good expense control while investing for growth
n Strong management team
n World-class franchises
n Tremendous progress on conversions, technology, branding
n Still a lot of work to do

33
Agenda
n Firm results – 4Q
n 2006 Outlook
n Appendix

34
n Higher NII in 2006
− Reduced IB non-trading NII
− NII in RFS flat on average to 4Q05; deposit margin remains under pressure
− Growth in Card NII on higher outstandings
− Improvement in Treasury margin
n Noninterest revenue growth across most LOBs
− IB trading – expect to do better in 2006 than 2005; reduced volatility
− Reduction in IB Credit Portfolio
n Private equity gains
− $300mm/qtr is a reasonable expectation
− Hard to predict; market-driven; will be lumpy
n Do not plan for MSR risk management or treasury securities gains or losses
Comments on Revenue

35
Net Charge-off Rate (%) Proforma
2004 2005
Approximate through the
Cycle
2006 Comments
Investment Bank 0.06% (0.29%) 1.00% Moves to normal, but not in 2006 Commercial Banking 0.12% 0.05% 0.65% Moves to normal, but not in 2006 Card Servicesa 5.28% 5.21% 5.25% Improved 1H; 2H tbd – min pay Retail Financial Services Home Finance 0.65% 0.13% 0.33% Trends to more normal loss levels Auto Finance (incl. Educ.) 0.61% 0.54% 0.75% Trends to more normal loss levels Consumer and Small Bus. 1.24% 0.98% 1.30% Trends to more normal loss levels
Note: All ratios exclude impact of loans held for sale(a) Card is shown on a managed basis (excludes impact of securitizations)
Comments on Credit
Allowance for loan losses/loans 12/31/05
Wholesale 1.85%
Retail Financial Services 0.75%
Card 4.56%
($ in millions) 20041 2005
Net Charge-offs $8,209 $7,595
Change in Allowance ($1,719) ($336)
Credit Costs $6,490 $7,259
1 Proforma Basis

36
Corporate Private Equity Treasury Other Corporate Total ($ in millions) 20041 2005 20041 2005 20041 2005 20041 2005
Revenue (adjusted)
Securities/Private Equity Gains (Losses) $1,466 $1,691 - - - - $11 $11 $1,477 $1,702
Other Income 49 40 95 (95) 250 202 394 147
Noninterest Revenue 1,515 1,731 95 (95) 261 213 1,871 1,849
Net Interest Income (370) (209) (748) (1,674) (652) (853) (1,770) (2,736)
Revenue (adjusted) 1,145 1,522 (653) (1,769) (391) (640) 101 (887)
Expense (adjusted)
Gross Expense 251 218 141 35 7,366 7,105 7,758 7,358
Allocations 58 26 78 80 (5,894) (5,449) (5,758) (5,343)
Net Expense (adjusted) 309 244 219 115 1,472 1,656 2,000 2,015
Operating Earnings (adjusted) 546 821 (551) (1,094) (850) (1,279) (855) (1,552)
Treasury Portfolio Repositioning - - - - 222 (931) - - - - 222 (931)
BrownCo sale - - - - - - - - - - 752 - - 752
Operating Earnings $546 $821 (329) (2,025) ($850) ($527) ($633) (1,731)
1 On a proforma basis

37
2005 Significant Items1
($ in millions)
Pre-tax
Line of Business
Private equity gains $1,691 Corporate
Sale of BrownCo $1,254 Corporate
Reduction in wholesale allowance2 $785 IB/CB/TSS/AWM
MSR risk management results $283 Retail Financial Services
Joint venture dissolution charge ($40) Retail Financial Services
Termination of client contract ($93) Treasury & Securities Services
RFS Portfolio repositioning3 ($207) Retail Financial Services
Katrina impact on provision ($400) RFS/Card/CB/AWM/Corporate
Impact of bankruptcy law ($750) Card Services
Treasury portfolio repositioning ($1,502) Corporate
¹As previously disclosed2 Excludes Katrina impact on provision 3 RFS Portfolio repositioning includes the following pre-tax items:
- 4Q05: Hybrid ARM’s MTM of ($120mm)- 3Q05: Loss on transfer of auto loans to held-for-sale of ($43mm)- 1Q05: Loss on transfer of auto loans to held-for-sale of ($78mm) and gain on sale of RV portfolio of $34mm

38
Disclaimer
This earnings release contains forward-looking statements within the meaning of the Private Securities Litigation Reform Act of 1995. Such statements are based upon the current beliefs and expectations of JPMorgan Chase’s management and are subject to significant risks and uncertainties. Actual results may differ from those set forth in the forward-looking statements. Factors that could cause JPMorgan Chase’s results to differ materially from those described in the forward-looking statements can be found in the Quarterly Report on Form 10-Q for the quarter ended September 30, 2005, and in the 2004 Annual Report on Form 10-K for the year ended December 31, 2004, of JPMorgan Chase, each filed with the Securities and Exchange Commission and available at the Securities and ExchangeCommission’s Internet site (http:///www.sec.gov).

![Presentaci.n Eng Ps.2.ppt [S.lo lectura]...6.5 2005 2006 $8,317 + 30% $3,313 + 21% Ps. Million, Millions of Accounts $32,242 $33,665 $29,529 $27,556 $35,873 4Q05 1Q06 2Q06 3Q06 4Q06](https://static.fdocuments.in/doc/165x107/5f78eaec088f3b5d15200685/presentacin-eng-ps2ppt-slo-lectura-65-2005-2006-8317-30-3313-.jpg)


![Dewey-Burdock Uranium In Situ Recovery Project · 680 4090.0 1192.7 143000 2400 0.172 681 656.0 430.9 462000 930 0.0117 EPA MCL 15 5 [2] 300 [3] 500 [1] -0.03 Groundwater Quality](https://static.fdocuments.in/doc/165x107/60fa649fa39b09301307d155/dewey-burdock-uranium-in-situ-recovery-project-680-40900-11927-143000-2400-0172.jpg)

