
4Paper Jahir Pinjari Breakthrough Improvement in … · Breakthrough Improvement in quality &...
15
1 Breakthrough Improvement in quality & manufacturing cost of MIG welding process by using Classical Design of experiment Jahir Ahamad Pinjari Sharda Motor Industries Ltd (SMIL), Chakan [email protected] 1.0 Abstract: In automotive industry welding is considered as both critical and as special process. SMIL with its major product range is having almost 70 % processes as welding. SMIL’s vision till 2022 is to increase its foot print from current 45 % to 70 % (w.r.t. exhaust market of four wheeler) and to meet BSVI requirements. Achieving quality at lowest processing cost is key factor to achieve companies vision. We have challenge achieving multiple quality characteristics from welding process. Some of them are variable type and many are attribute data. Few characteristics need destructive testing. Several welding companies use trial and error, one factor at a time (OFAT) methodology including SMIL. We had feeling that our process is at optimum as parameters were set during development after several trials. These trials were taken by internal welding experts along with welding expert coming from foreign country. After various trials parameters were set and important parameters’ specification is derived. DOE is not attempted in past due to insufficient knowledge. We had assumption that process experts are setting parameters at optimum. MSES stand for Mahindra Supplier Evaluation Standard. Long term strategic suppliers of Mahindra and Mahindra Limited get opportunity for MSES evaluation. Mahindra team assigns their pilot who invests time in coaching, reviewing at shop floor, guiding us to improve our processes and make our organization more effective and efficient. As a part of supplier capability building various trainings organized by Mahindra team helps us to improve our competence which results in meeting customer quality and cost expectations. Mahindra team helps us to implement better system and improve our processes. This helps us to compete with MNCs. SMIL is selected for MSES A drive from Mahindra &Mahindra. One of the requirement is to implement DOE for process parameter dominant processes. SMIL team attended training of Mr.Mahesh Hegde – (LearnEx Consulting) is introduced as TQM Guru for our MSES A
Transcript of 4Paper Jahir Pinjari Breakthrough Improvement in … · Breakthrough Improvement in quality &...
1
Breakthrough Improvement in quality & manufacturing cost of MIG
welding process by using Classical Design of experiment
Jahir Ahamad Pinjari
Sharda Motor Industries Ltd (SMIL), Chakan
1.0 Abstract:
In automotive industry welding is considered as both critical and as special process. SMIL
with its major product range is having almost 70 % processes as welding. SMIL’s vision till
2022 is to increase its foot print from current 45 % to 70 % (w.r.t. exhaust market of four
wheeler) and to meet BSVI requirements.
Achieving quality at lowest processing cost is key factor to achieve companies vision. We
have challenge achieving multiple quality characteristics from welding process. Some of
them are variable type and many are attribute data. Few characteristics need destructive
testing. Several welding companies use trial and error, one factor at a time (OFAT)
methodology including SMIL.
We had feeling that our process is at optimum as parameters were set during development
after several trials. These trials were taken by internal welding experts along with welding
expert coming from foreign country. After various trials parameters were set and important
parameters’ specification is derived. DOE is not attempted in past due to insufficient
knowledge. We had assumption that process experts are setting parameters at optimum.
MSES stand for Mahindra Supplier Evaluation Standard. Long term strategic suppliers of
Mahindra and Mahindra Limited get opportunity for MSES evaluation. Mahindra team
assigns their pilot who invests time in coaching, reviewing at shop floor, guiding us to
improve our processes and make our organization more effective and efficient. As a part of
supplier capability building various trainings organized by Mahindra team helps us to
improve our competence which results in meeting customer quality and cost expectations.
Mahindra team helps us to implement better system and improve our processes. This helps
us to compete with MNCs.
SMIL is selected for MSES A drive from Mahindra &Mahindra. One of the requirement is to
implement DOE for process parameter dominant processes. SMIL team attended training of
Mr.Mahesh Hegde – (LearnEx Consulting) is introduced as TQM Guru for our MSES A

2
journey by Mahindra Team, who is training and guiding TQM implementation for all MSES A
suppliers. We were trained along with other suppliers and learnt about how to plan, design,
conduct and analyse experiments. We got opportunity to learn Full factorial 2 level Design,
General Full factorial, Fractional Factorial, Plackett- Burman, Response Surface Methods,
Mixture DOE and Taguchi.
DOE team was formed by SMIL and detailed experimental plan made, among 16 affecting
factors, “Experimental”, “Control / Must be OK” and “Noise factors” are identified.
Finally 4 experimental factors are selected to meet 5 responses. Full factorial DOE is
conducted. We have studied totally 10 responses. Detailed analysis helped us to set process
parameters at optimum level. Quality trend improved for OK ratio (first time right) from 80 to
98%, estimated saving in input process parameters (Power) and consumables (Weld wire,
Gas) for this plant is @ Rs 24 Lacs/annum.
Likewise all systemic documents ex. PFMEA, Control plan & SOP & Managing documents
are updated. New product Development procedure revised adding DOE study as mandatory
tool for future products.
2.0 What is design of experiment?
It is a scientific way to set process at optimum level.
Experiment Design
The formal plan for conducting the experiment is called the “experiment design”
(also the “experiment pattern”)
Planning experiments, execution of experiments, collecting data, analysis of data
using statistical techniques and making inference about the real world.
It is about understanding the real world, not just explaining the data. It is about
understanding why a change in process parameter is affecting product parameter
that way.
Classical DOE is a tool to design experiment by systematically choosing responses, factors,
levels, blocks, Treatments, making experimental plan considering randomization, replication
etc and then conducting these experiments and analysing the data by using defined
statistical procedures such that meaningful conclusions made.

3
3.0 Need for DOE
Experiment is to KNOW Something. DOE is not necessary for known and proven things.
Product Quality and processing cost of several processes like casting, injection moulding,
heat treatment, welding, painting, machining, plating, chemical process are mainly
dependent on process parameters. These process parameters are conventionally set by
people with technical knowledge by taking various trials. Final specification of these
processes are set and mentioned in control plan. Process experts tend to set the process
parameters based on the best of their technical knowledge and trials. However, it becomes
difficult to establish the exact relationship with output quality parameters and input process
parameters. This is due to various “interaction effects” and complicated relationships
among several process parameters and output product parameters.
When these parameters are not at optimum there will be chronic problems in quality
resulting into rejection, rework on routine basis. Cost of manufacturing also de-pends on
consumable items like tool consumption, gas, power, material etc. So it becomes very
important to set process parameters at optimum.
Changing One Factor at A time Vs DOE
In DOE decision about each factor is made considering all experiments, by averaging factor
high and low level effects by nullifying effects of other factors. This helps to make right
decision even if there is special cause in one of the experiment.
4
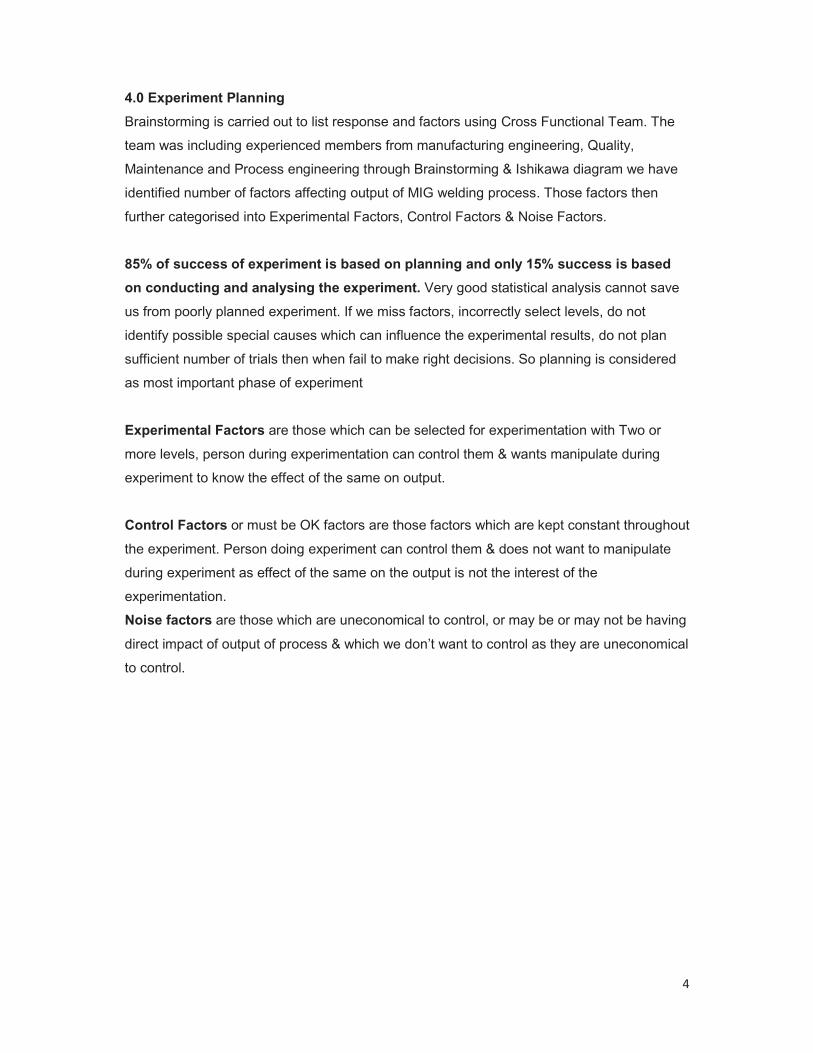
4.0 Experiment Planning
Brainstorming is carried out to list response and factors using Cross Functional Team. The
team was including experienced members from manufacturing engineering, Quality,
Maintenance and Process engineering through Brainstorming & Ishikawa diagram we have
identified number of factors affecting output of MIG welding process. Those factors then
further categorised into Experimental Factors, Control Factors & Noise Factors.
85% of success of experiment is based on planning and only 15% success is based
on conducting and analysing the experiment. Very good statistical analysis cannot save
us from poorly planned experiment. If we miss factors, incorrectly select levels, do not
identify possible special causes which can influence the experimental results, do not plan
sufficient number of trials then when fail to make right decisions. So planning is considered
as most important phase of experiment
Experimental Factors are those which can be selected for experimentation with Two or
more levels, person during experimentation can control them & wants manipulate during
experiment to know the effect of the same on output.
Control Factors or must be OK factors are those factors which are kept constant throughout
the experiment. Person doing experiment can control them & does not want to manipulate
during experiment as effect of the same on the output is not the interest of the
experimentation.
Noise factors are those which are uneconomical to control, or may be or may not be having
direct impact of output of process & which we don’t want to control as they are uneconomical
to control.

5
5. 1 Experimental Planning sheet
Sl. No.
Factor UOM Present Status Range
Nature offactor
(E,C,N) 1 2 3 Remark Control Method
1 Current Amp 140-180 100 -150
E 100 150 Weld penetration, spatters , burn
though
2 Voltage Volt 20 -24 18-22 E 18 22 Spatter, Weld bead etc.
3 Gas flow LPM 15 -20 10' - 20'
E 10 20 Blow Hole, Porosity, discontinuous welding etc.
4 Drive Speed HZ 15 -20 13-15 E 13 15 Weld penetration.,
Weld bead etc.
5 Stick Out mm 15 10
C Weld penetration, Blow hole porosity
etc.
Template for maintaining the gap between nozzle and workpiece
6 Torch Angle
Degree 45 45
C Weld Bead, welding shift etc.
Template for maintaining the torch angle
7 Clean Part Ok
No Oil and dust
No Oil and dust
C Blow hole, porosity, weld penetration etc.
verified before conducting trial for each run
8 Fixture condition Ok
free from
spatter
free from
spatter
C Welding Shift, part orientation etc.
verified before conducting trial for each run
9 Environment - Ok Ok
N verified before conducting trial for each run
10 Air Pressure Bar 4 to 5 4 to 5
C Insufficient clamping,weld shift etc.
verified before conducting trial for each run
11 Operator Skill Level 3 3
C As per Required skill operator ensured for eachtrial run
12 Weld Wire Type Flux core
Flux core C
verified before conducting trial for each run
13 Weld Wiredia. mm 1.2 1.2 C
Weld Bead , Cycle time
verified before conducting trial for each run
14 Nozzle cleaning Ok
free from
spatter
free from
spatterC
Blow hole, porosity etc.
Ensured before each trial run
15 Liner cleaning Ok Ok Ok C Discontinuous
welding Ensured before each trial run
16 Earthen Ok Firm Firm C Discontinuous welding
Ensured before each trial run

6
Check sheet has been made to verify the control condition before conducting each trial of an
experiment.
5.2 Experiment design in MINITAB:
There were 4 experimental factors with 2 levels are selected in our experiment on MIG
welding, so total experiments are 16
6.0 Conducting practical experiment:
Before conducting experiment in practical, we checked and ensured that all must OK factors
are in control. Samples are numbered according to their run order. Experimental factors set
by adjusting those process parameters as per operation adjustment worksheet with trained
operator. During experiment the responses measurable in experiment are captured at same
time, like Weld wire consumption and Cycle time etc. for each experiment.
After conducting practical trial all parts are visually inspected for attribute responses like
Blow Hole, Porosity and Spatter etc. and made a note of each response for all parts. Those
parts are further given for destructive testing of Weld to get variable responses like Lug
length, throat height, Weld penetration etc.

7
Flow of conducting experiment
After getting results of experiment as weld penetration report, responses are put in MINITAB
in respective column.
7.0 Analyse Experiment:
Step 1• Set Parameter as
per DOE experiment in Machine
• Keep Control Factor constant
Step 2•Conduct trial as
per run order
Step 3•Record variable
response during experiment
Step 4•Inspect part for
Aesthetic Weld Defect
Step 5•Test Samples in
lab •Generate weld
test report
Pareto Chart for standardized
effectResidual plot Main Effect Plot
Interaction plotContour PlotResponse Optimizer
Multi Response optimizer
For Each Response
For All Responses
8
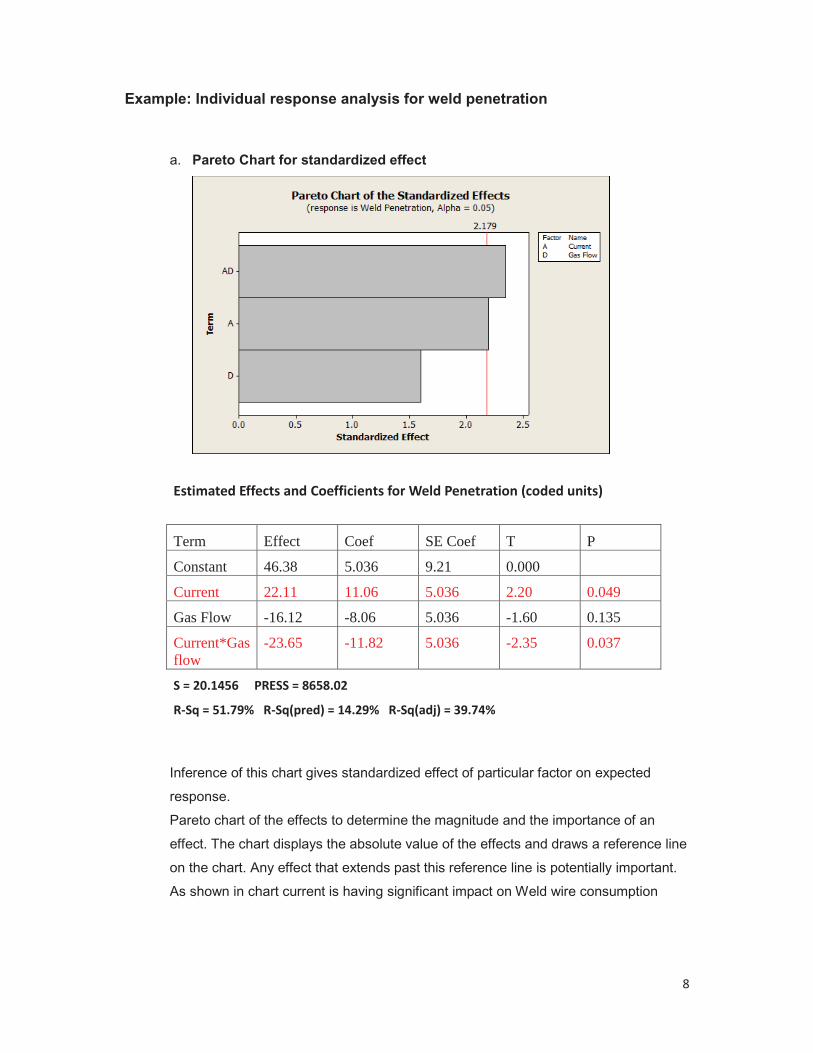
Example: Individual response analysis for weld penetration
a. Pareto Chart for standardized effect
Inference of this chart gives standardized effect of particular factor on expected
response.
Pareto chart of the effects to determine the magnitude and the importance of an
effect. The chart displays the absolute value of the effects and draws a reference line
on the chart. Any effect that extends past this reference line is potentially important.
As shown in chart current is having significant impact on Weld wire consumption
Estimated Effects and Coefficients for Weld Penetration (coded units)
Term Effect Coef SE Coef T P
Constant 46.38 5.036 9.21 0.000
Current 22.11 11.06 5.036 2.20 0.049
Gas Flow -16.12 -8.06 5.036 -1.60 0.135
Current*Gas flow
-23.65 -11.82 5.036 -2.35 0.037
S = 20.1456 PRESS = 8658.02 R-Sq = 51.79% R-Sq(pred) = 14.29% R-Sq(adj) = 39.74%

9
b. Residual Plots
In the normal probability plot of the effects, points that do not fall near the line usually
signal important effects. Important effects are larger and generally further from the
fitted line than unimportant effects. Unimportant effects tend to be smaller and
cantered around zero.
c. Main Effect plot
Inference of main effects gives main effect of particular experiment factor on
response
As current increasing from 100 to 150 A weld penetration increases from 35 to 60 % -
Significant effect
As Gas flow increases from 10 to 20 weld penetration decreases from 55 to 35 % -
Significant Effect

10
d. Interaction plot
Inference of Interaction plot gives effect of interaction of two factors on response
At current 100 A- Increasing gas flow from 10 to 20 decreases weld penetration
significantly.
At Voltage 18 V - Increasing gas flow from 10 to 20 decreases weld penetration
significantly.
At Drive speed – 15 Hz increasing gas flow from 10 to 20 decreases weld penetration
significantly.
11
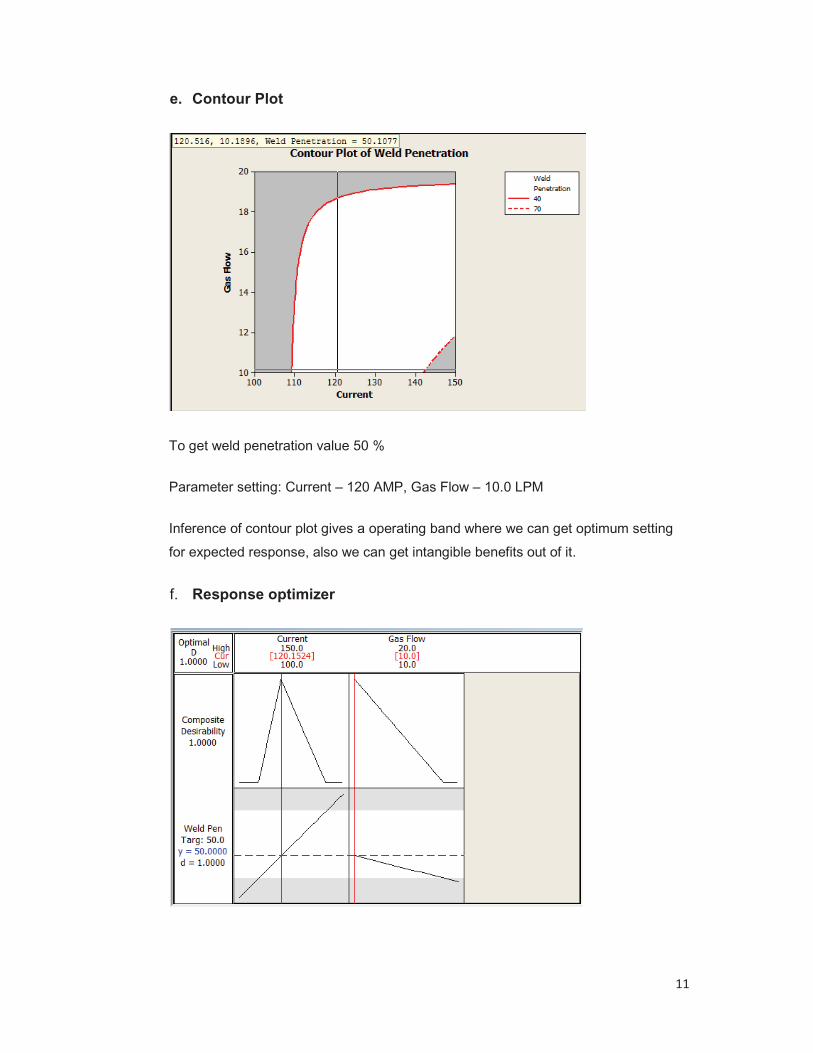
e. Contour Plot
To get weld penetration value 50 %
Parameter setting: Current – 120 AMP, Gas Flow – 10.0 LPM
Inference of contour plot gives a operating band where we can get optimum setting
for expected response, also we can get intangible benefits out of it.
f. Response optimizer
12
Result optimizer inference gives optimal solution for the input variable
combinations. The optimization plot is interactive; we can adjust input variable
settings on the plot to search for more desirable solutions.
For different expected response same method can be followed for getting
optimum setting different for different responses
8.0 Multi Response study:
By using contour plot & result optimizer for multiple response we can get
optimum setting of multiple input variables for all expected variable responses
in one DOE experiment.
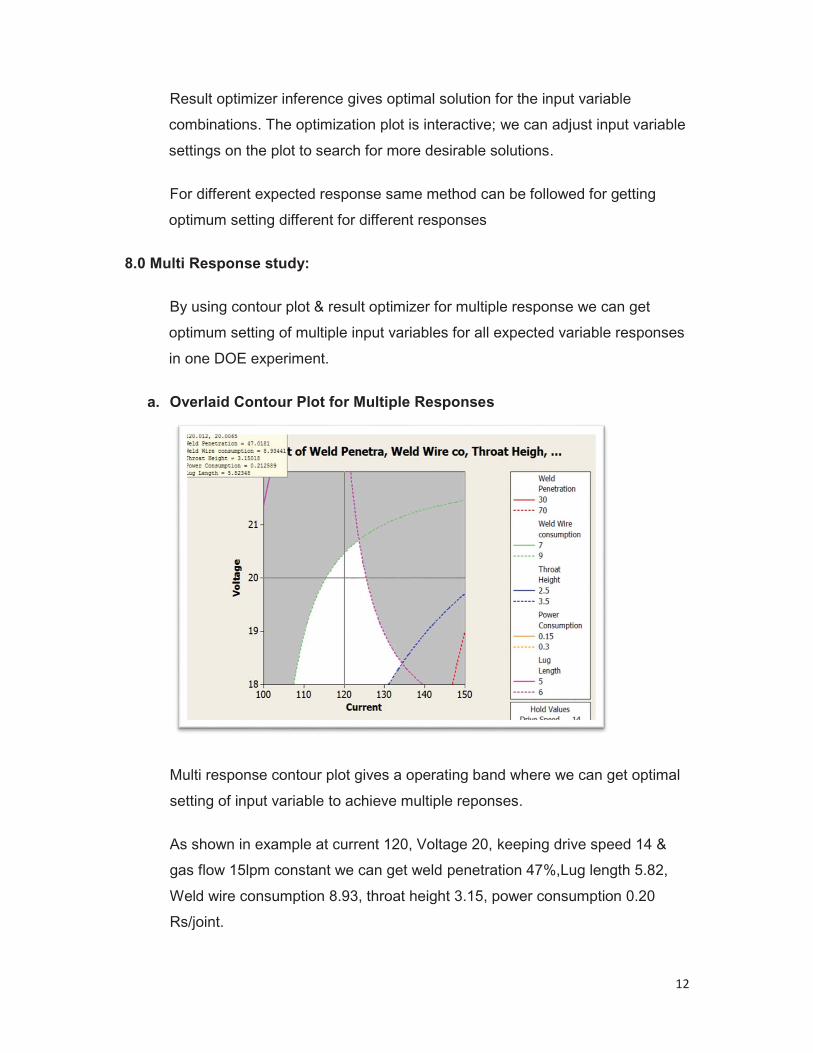
a. Overlaid Contour Plot for Multiple Responses
Multi response contour plot gives a operating band where we can get optimal
setting of input variable to achieve multiple reponses.
As shown in example at current 120, Voltage 20, keeping drive speed 14 &
gas flow 15lpm constant we can get weld penetration 47%,Lug length 5.82,
Weld wire consumption 8.93, throat height 3.15, power consumption 0.20
Rs/joint.
13
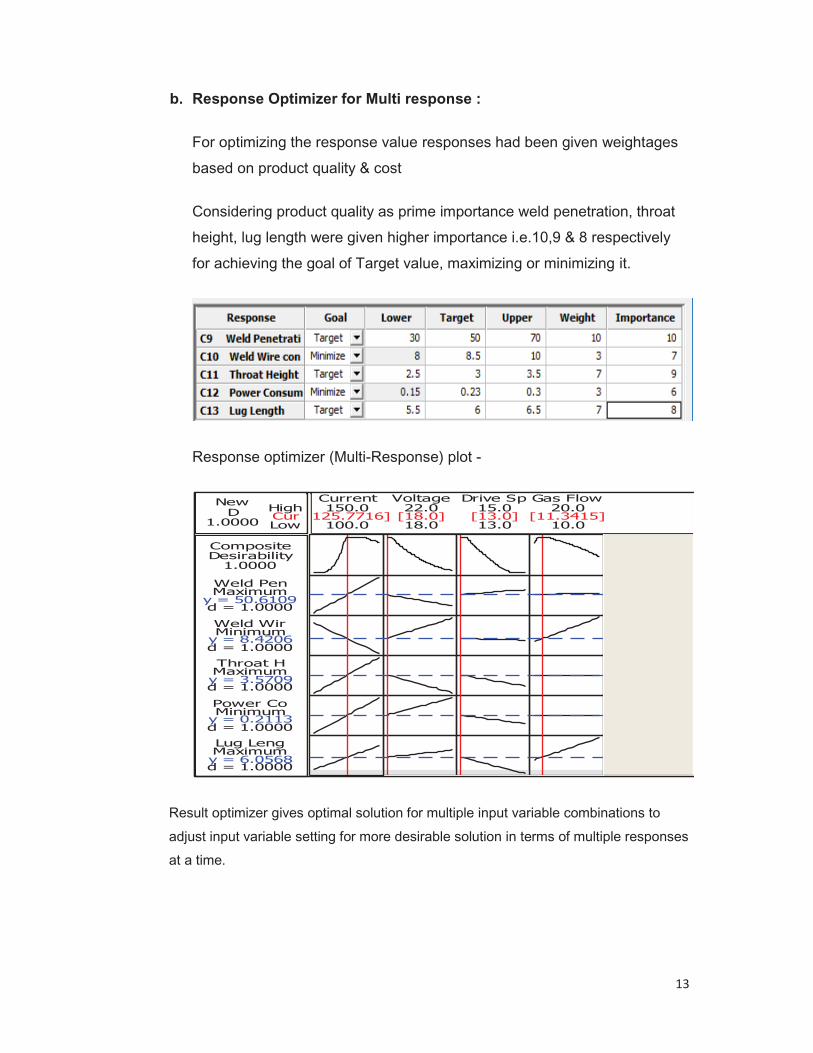
b. Response Optimizer for Multi response :
For optimizing the response value responses had been given weightages
based on product quality & cost
Considering product quality as prime importance weld penetration, throat
height, lug length were given higher importance i.e.10,9 & 8 respectively
for achieving the goal of Target value, maximizing or minimizing it.
Response optimizer (Multi-Response) plot -
Result optimizer gives optimal solution for multiple input variable combinations to
adjust input variable setting for more desirable solution in terms of multiple responses
at a time.
CurHighLow1.0000
DNew
d = 1.0000MaximumWeld Pen
y = 50.6109
d = 1.0000MinimumWeld Wiry = 8.4206
d = 1.0000MaximumThroat H
y = 3.5709
d = 1.0000MinimumPower Coy = 0.2113
d = 1.0000MaximumLug Leng
y = 6.0568
1.0000DesirabilityComposite
10.020.0
13.015.0
18.022.0
100.0150.0
Voltage Drive Sp Gas FlowCurrent
125.7716] [18.0] [13.0] [11.3415]

14
9.0 Benefits in MIG welding by implementing DOE
Parameter Before DOE After DOE Improvement
Straight Through
Ratio 80% 98% 22.5 % Improved
Weld Penetration 26.34 - 103.2% 54.12% - 55.56 % Consistent
Lug length inconsistent 5.5-6.5 Consistent Throat Height Inconsistent 3-3.4 Consistent
Weld Wire
Consumption 9.79 gm/Joint 8.57 gm/Joint 14.23 % Reduction
Power Consumption Rs. 0.5 / Joint Rs. 0.2 / Joint 60% Reduced
Shielding Gas
Consumption 18 lpm 12 lpm 33.3% Reduced
For SMIL Chakan plant expected future saving 24Lacs/Annum
For SMIL Group expected future saving 1.25 Cr./Annum
10.0 Conclusion
DOE techniques offer a structured approach for changing many factor settings within
a process at once and observing the data collectively for improvement. DOE analyses not
only yield a significance test of the factor levels but also give a prediction model for the
response. In DOE the effects of several independent factors (variables) can be considered
simultaneously in one experiment without evaluating all possible combinations of factor
levels.
Maximum numbers of weld joints are there in exhaust system for different variants &
we will be generating benchmarking library for each joint which be a guideline in upcoming
projects to follow.
DOE training to other members:
DOE training has been imparted in plant for members of Production, Quality & New
Product development department, total 19 members covered.

15
Future Plans:
Future plan is to conduct Design of experiment on all products joints available in
plant on SPM & Robotic joints. Parallel the learning would be implemented across SMIL
group companies.
Key learning from this entire exercise is “We must follow Scientifically Proven Methods” As
told by Dr.Deming “Before doing your best, you must know what is the best method” We
were doing our best way of optimization in the past and learnt new way of doing it. There is
enormous scope among Indian Industries to apply this technique which can deliver large
benefit by improving quality and reducing processing cost.
References
Note: All the theory part of DOE is mentioned in this paper is taken from “Training Material
of Design of Experiments – Mahesh Hegde – LearnEx Consulting”
11.0 Acknowledgments
I sincerely thank Mr Mahesh Hegde for sharing, teaching & mentoring DOE method. It has
provided immense help to implement DOE fruitfully.
Thanks to Mr Jagannath Burli & Mr Sagar Vispute SQD-CDMM-Mahindra and Mahindra
Automotive sector for driving implementation of TQM as a part of supplier capability building
initiatives through training, workshops & projects. & Thanks to Mr Prashant Patil, Mr Sachin
Jagtap, Mr Sandeep Rokade & team SMIL for support on conducting experiment .