4G mobile communication system LTE - EIT, Electrical · PDF filePlan of lecture • Some...
42
ETSF15 Communication Systems and Networks Stefan Höst 4G mobile communication system LTE
Transcript of 4G mobile communication system LTE - EIT, Electrical · PDF filePlan of lecture • Some...
ETSF15CommunicationSystemsandNetworksStefanHöst
4GmobilecommunicationsystemLTE

Planoflecture
• Somehistoryofmobilenetworks—Pastandfuture• Ideaofnetworkstructure• EPCpacketnetworks• LTEradiochannel• Whatcomesnext?
2
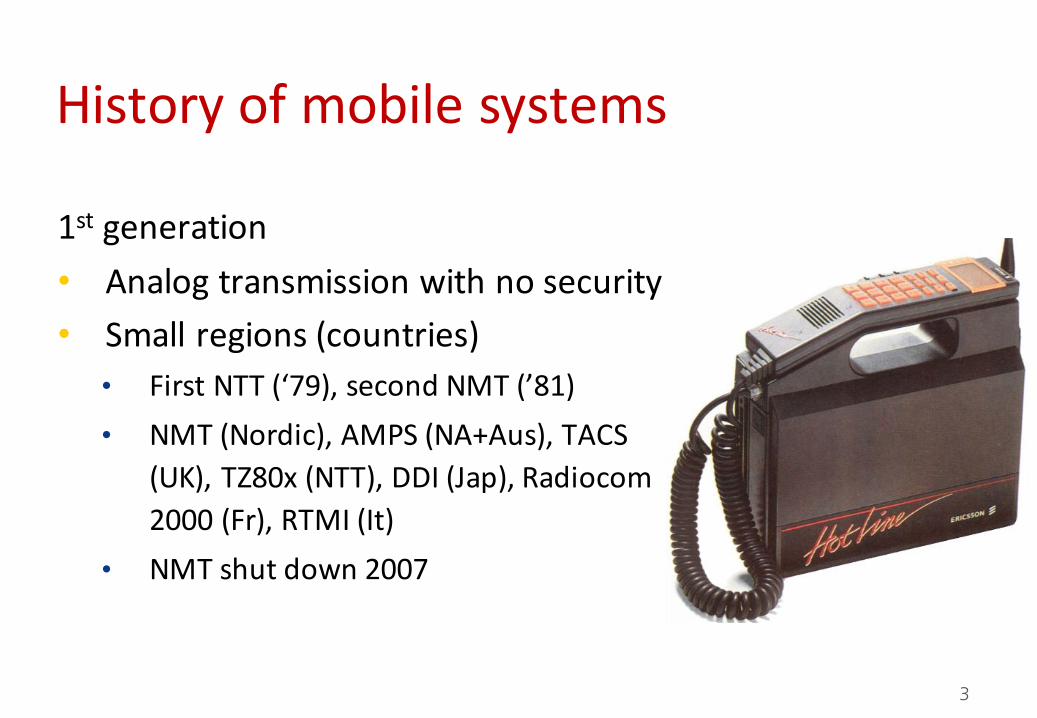
Historyofmobilesystems
1st generation• Analogtransmissionwithnosecurity• Smallregions(countries)• FirstNTT(‘79),secondNMT(’81)• NMT(Nordic),AMPS(NA+Aus),TACS
(UK),TZ80x(NTT),DDI(Jap),Radiocom2000(Fr),RTMI(It)
• NMTshutdown2007
3
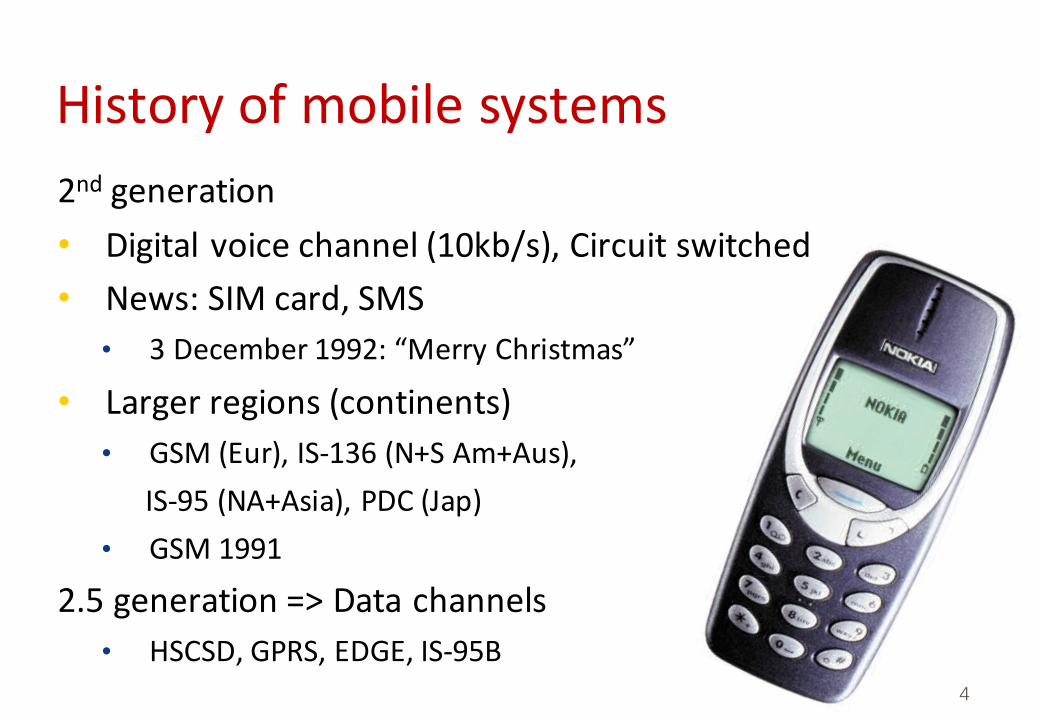
Historyofmobilesystems2nd generation• Digitalvoicechannel(10kb/s),Circuitswitched• News:SIMcard,SMS• 3December1992:“MerryChristmas”
• Largerregions(continents)• GSM(Eur),IS-136(N+SAm+Aus),
IS-95(NA+Asia),PDC(Jap)• GSM1991
2.5generation=>Datachannels• HSCSD,GPRS,EDGE,IS-95B
4
Historyofmobilesystems
5
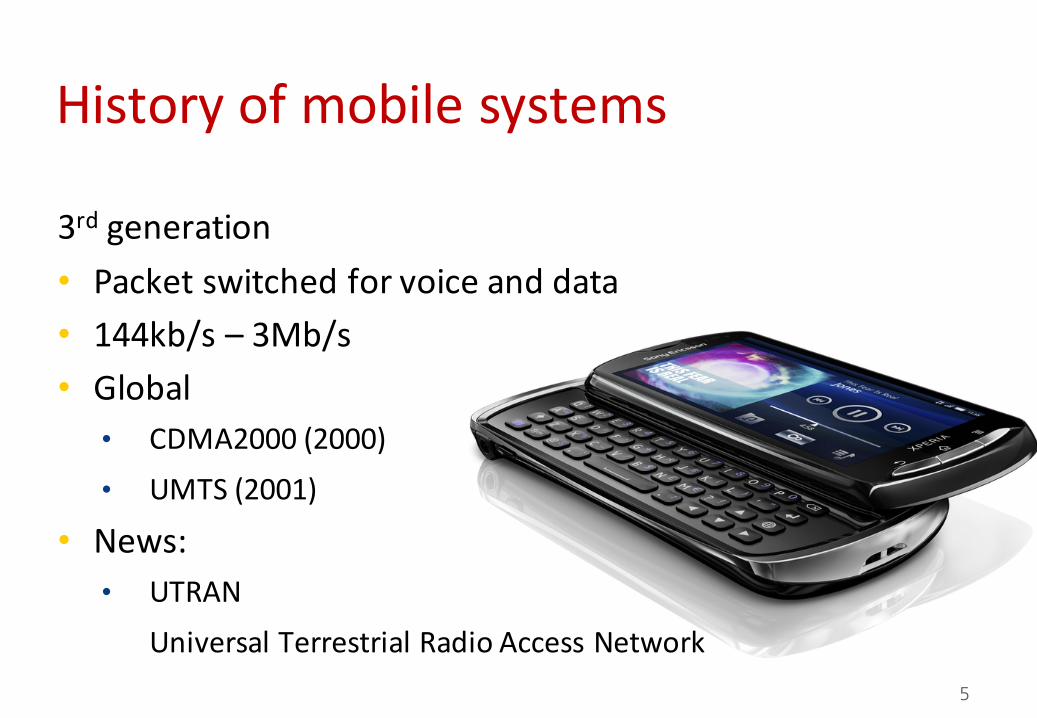
3rd generation• Packetswitchedforvoiceanddata• 144kb/s– 3Mb/s• Global• CDMA2000(2000)• UMTS(2001)
• News:• UTRAN
UniversalTerrestrialRadioAccessNetwork

Historyofmobilesystems
6
4th generation• Packetswitcheddatatraffic
(VoiceoverIPor3G)• 100Mb/s-1Gb/s• Global:LTE• Dec2009(StockholmandOsloby
TeliaSonera)
• News:Smartphonesandapps• iPhone2007
Historyofmobilesystems
7
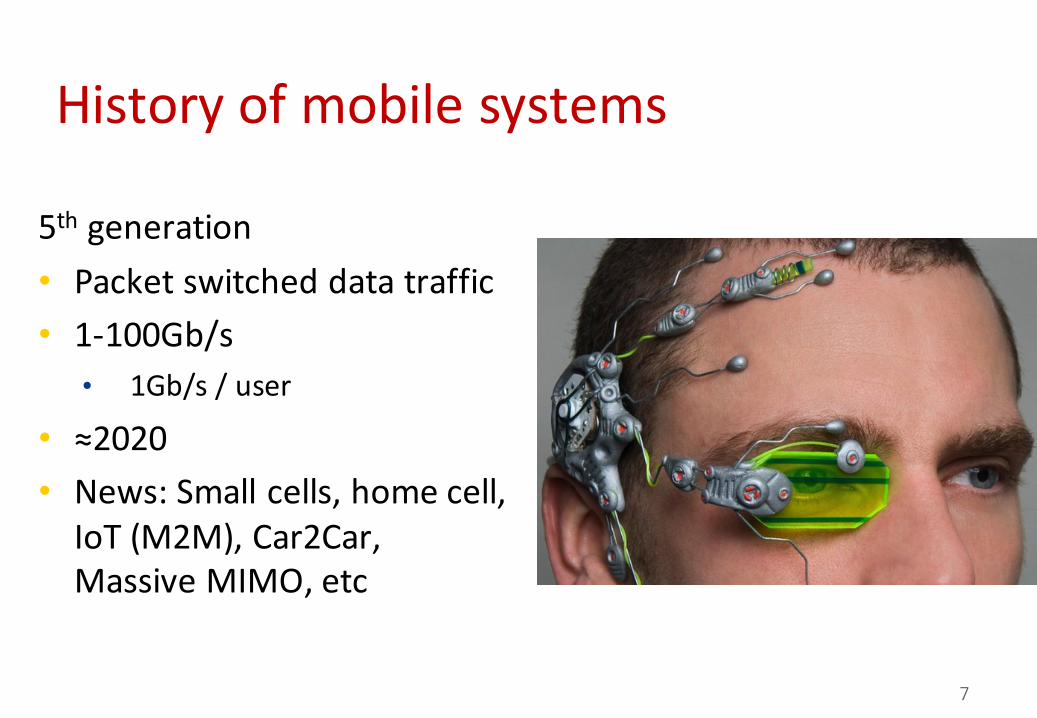
5th generation• Packetswitcheddatatraffic• 1-100Gb/s• 1Gb/s/user
• ≈2020• News:Smallcells,homecell,IoT (M2M),Car2Car,MassiveMIMO,etc
Mobiletraffic(CISCOVNI)
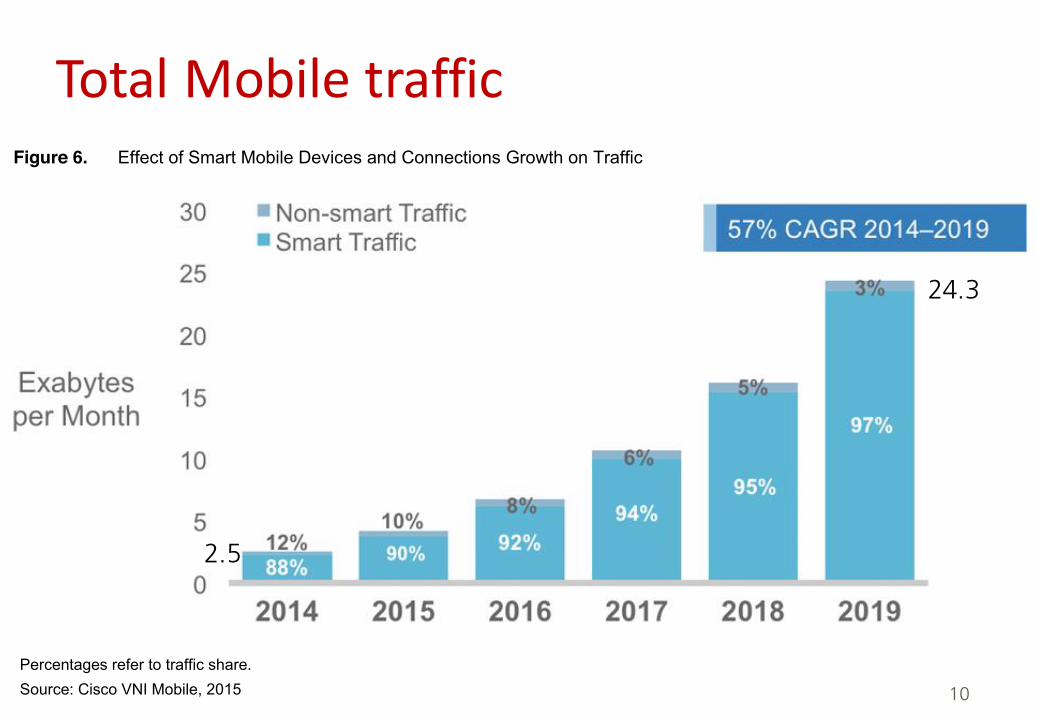
• Globalmobiledatatrafficgrew69%in2014• 1.5EBinDec’13to2.5EBinDec’14
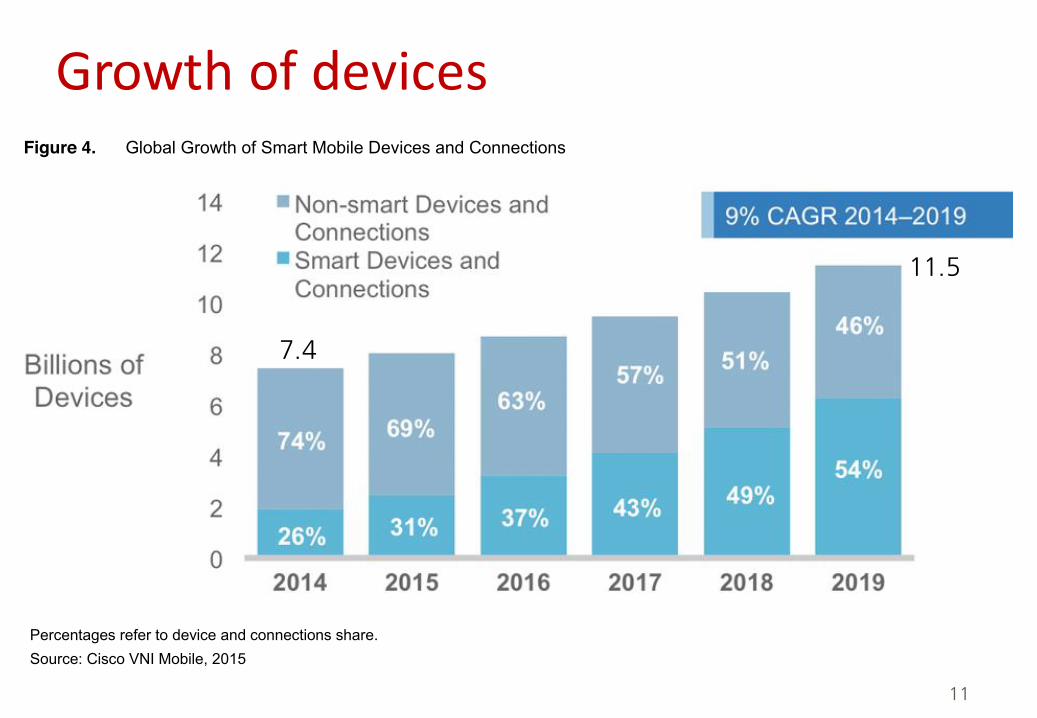
• Globalmobiledevicesandconnectionsin2014grewto7.4billion(11.5Bin2019)• 26%smartdevicesgenerate80%oftraffic• 4Gdevicesgenerate10timesmoretrafficthannon-4G
8
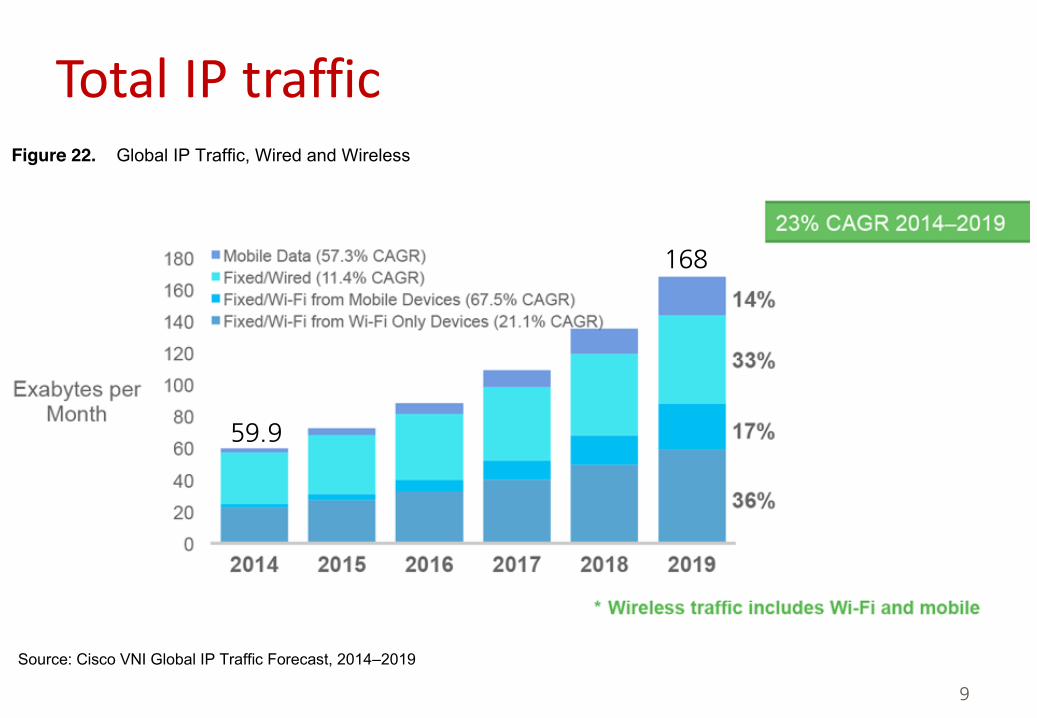
TotalIPtraffic
9
© 2015 Cisco and/or its affiliates. All rights reserved. This document is Cisco Public. Page 23 of 29
Figure 22. Global IP Traffic, Wired and Wireless
Source: Cisco VNI Global IP Traffic Forecast, 2014–2019
Narrowing the focus to Internet traffic and excluding managed IP traffic yields a more pronounced trend. By 2019, wired devices will account for 19 percent of Internet traffic, and Wi-Fi and mobile devices will account for 81 percent of Internet traffic (Figure 23). In 2014, wired devices accounted for less than half of Internet traffic, at 39 percent.
Figure 23. Global Internet Traffic, Wired and Wireless
Source: Cisco VNI Global IP Traffic Forecast, 2014–2019
59.9
168
TotalMobiletraffic
10
© 2015 Cisco and/or its affiliates. All rights reserved. This document is Cisco Public. Page 10 of 42
Figure 6 shows the impact of the growth of mobile smart devices and connections on global traffic. Globally, smart traffic is going to grow from 88 percent of the total global mobile traffic to 97 percent by 2019. This percentage is significantly higher than the ratio of smart devices and connections (54% by 2019), because on average a smart device generates much higher traffic than a nonsmart device.
Figure 6. Effect of Smart Mobile Devices and Connections Growth on Traffic
Percentages refer to traffic share. Source: Cisco VNI Mobile, 2015
2.5
24.3
Growthofdevices
11
© 2015 Cisco and/or its affiliates. All rights reserved. This document is Cisco Public. Page 8 of 42
Although there is an overall growth in the number of mobile devices and connections, there is also a visible shift in the device mix. This year we see a slight slowdown in the growth of tablets as a new device category, phablets (included in our smartphone category), were introduced. Tablet growth was also affected by the availability of lightweight laptops, which are quite similar to tablets in form factor but have more enhanced capabilities. Throughout the forecast period, we see that the device mix is getting smarter with an increasing number of devices with higher computing resources, and network connection capabilities that create a growing demand for more capable and intelligent networks. We define smart devices and connections as those having advanced computing and multimedia capabilities with a minimum of 3G connectivity. As mentioned previously, 497 million mobile devices and connections were added in 2014, and smartphones accounted for 88 percent of that growth at 439 million net adds. The share of smart devices and connections as a percentage of the total will increase from 26 percent in 2014 to more than half, at 54 percent, by 2019, growing 3.3-fold during the forecast period (Figure 4).
Figure 4. Global Growth of Smart Mobile Devices and Connections
Percentages refer to device and connections share. Source: Cisco VNI Mobile, 2015
This year we are also including Low Power Wide Area (LPWA) connections in our analysis. This wireless network connectivity is meant specifically for M2M modules that require low bandwidth and wide geographic coverage. Because these modules have very low bandwidth requirements and tolerate high latencies, we do not include them in the smart devices and connections category. For some regions, such as North America where the growth of LPWA is expected to be high, their inclusion in the mix would skew the smart devices and connections percentage, so for regional comparison we have taken them out of the mix. Figure 5 provides a comparable global smart-to-nonsmart devices and connections split, excluding LPWA.
7.4
11.5
Growthoftechnology
12
© 2015 Cisco and/or its affiliates. All rights reserved. This document is Cisco Public. Page 11 of 42
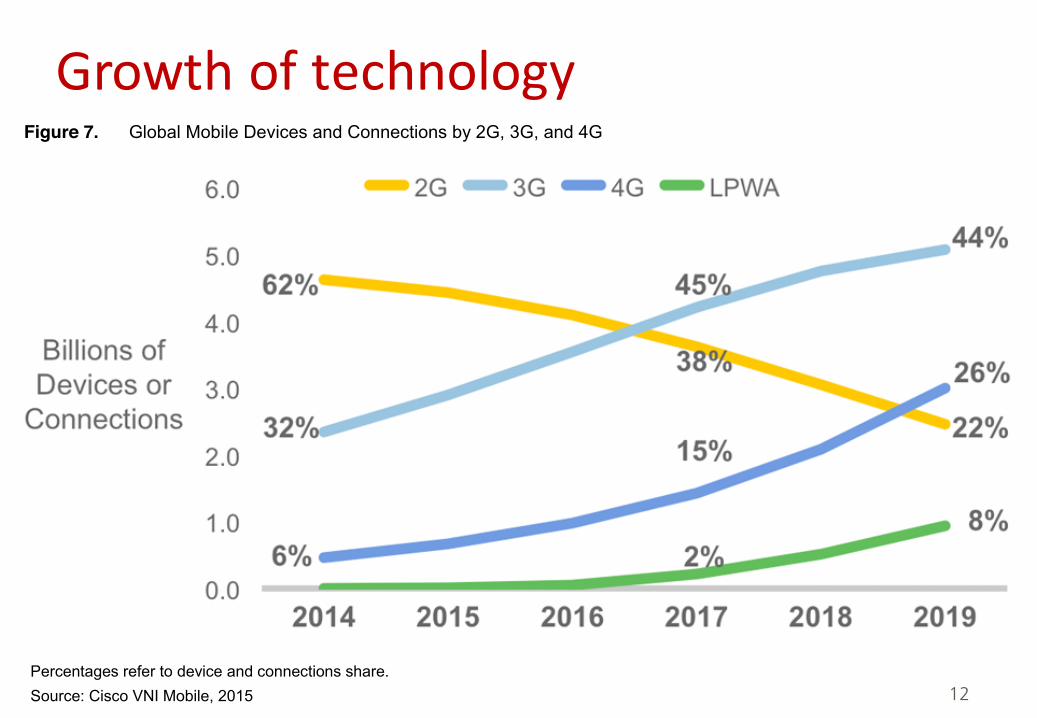
Trend 2: Defining Cellular Network Advances (2G, 3G, and 4G) Mobile devices and connections are not only getting smarter in their computing capabilities but are also evolving from lower-generation network connectivity (2G) to higher-generation network connectivity (3G, 3.5G, and 4G or LTE). When device capabilities are combined with faster, higher bandwidth and more intelligent networks, it leads to wide adoption of advanced multimedia applications that contribute to increased mobile and Wi-Fi traffic.
The explosion of mobile applications and phenomenal adoption of mobile connectivity by end users on the one hand and the need for optimized bandwidth management and network monetization on the other hand is fueling the growth of global 4G deployments and adoption. Service providers around the world are busy rolling out 4G networks to help them meet the growing end-user demand for more bandwidth, higher security, and faster connectivity on the move (Appendix B).
Globally, the relative share of 3G- and 3.5G-capable devices and connections will surpass 2G-capable devices and connections by 2017 (45 percent and 38 percent relative share). The other significant cross-over will occur in 2019, when 4G will also surpass 2G connection share. By 2019, 26 percent of all global devices and connections will be 4G-capable (Figure 7). The global mobile 4G connections will grow from 459 million in 2014 to 3 billion by 2019 at a CAGR of 46 percent.
Figure 7. Global Mobile Devices and Connections by 2G, 3G, and 4G
Percentages refer to device and connections share. Source: Cisco VNI Mobile, 2015
4G– LTELongTermEvolution
Standardizedby3GPP(3rd GenerationPartnershipProject)• RadioAccessNetworks(RAN)• Service&SystemsAspects(SA)• CoreNetwork&Terminals(CT)• GSMEDGERadioAccess
Networks(GERAN).
13

EPS(EvolvedPacketSystem)
14
SGW
MME HSS
PGW
eNodeB
Internet
E-UTRAN EPC
UE

EPSchallenges
• Highspeedradiolink• Bandwidthisextremelyexpensive.Squeezeoutallbitsyoucan
• AccesstoInternet• HowtosendIPpackets
• Authenticationandsecurity• Andacounting
• Usermobility• WhentochangeeNB andhowtotransferdatainthenetwork
• Costefficientuseofinfrastructure
15
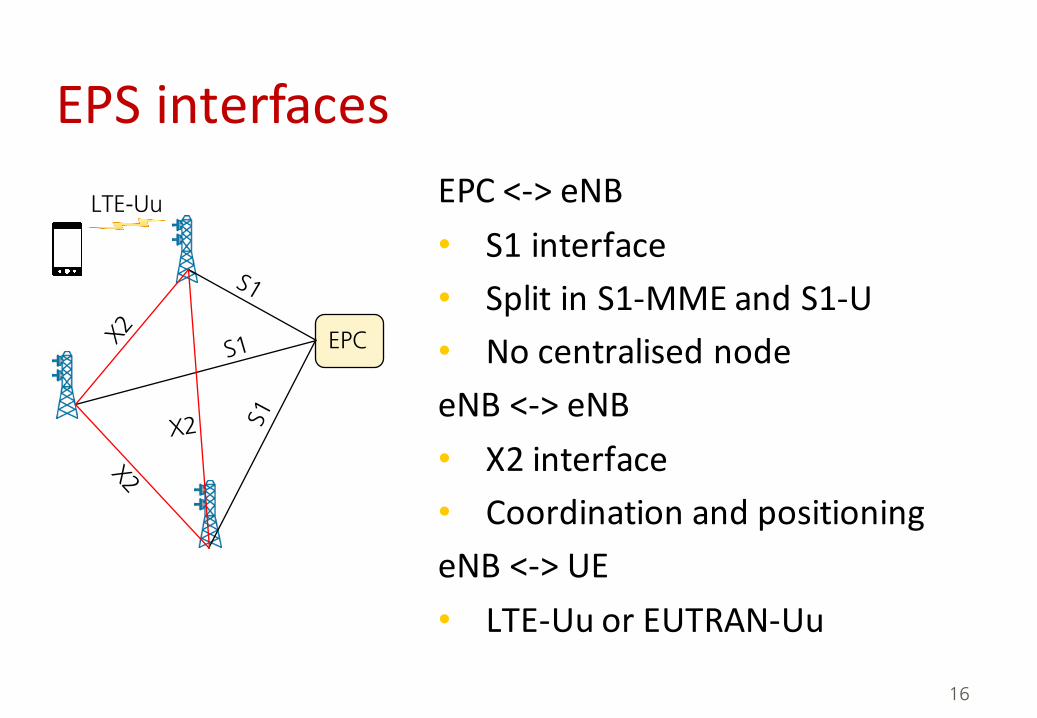
EPSinterfacesEPC<->eNB• S1interface• SplitinS1-MMEandS1-U• Nocentralised nodeeNB <->eNB• X2interface• CoordinationandpositioningeNB <->UE• LTE-Uu orEUTRAN-Uu
16
EPC
LTE-Uu

E-UTRANEvolvedUniversalTerrestrialRadioAccessNetwork
RANresponsiblefor• Resourcemanagement
• Schedulinganddynamicresouce allocation
• Compression• IPheadcompressionreduces
overhead
• Security• Encryptionofdata
17
• Positioning• UEphysicalposition
• ConnectiontoEPC• Userandcontrolplane
Protocolstack
• S1oftentunneledoverthefixnetworkarchitecture• Atunnelisawaytosendpacketsoverothertypesof
network.E.g.• IPv4overIPv6andviceversa• IPoverIPsec
• GTP:GPRSTunnelingProtocol
18
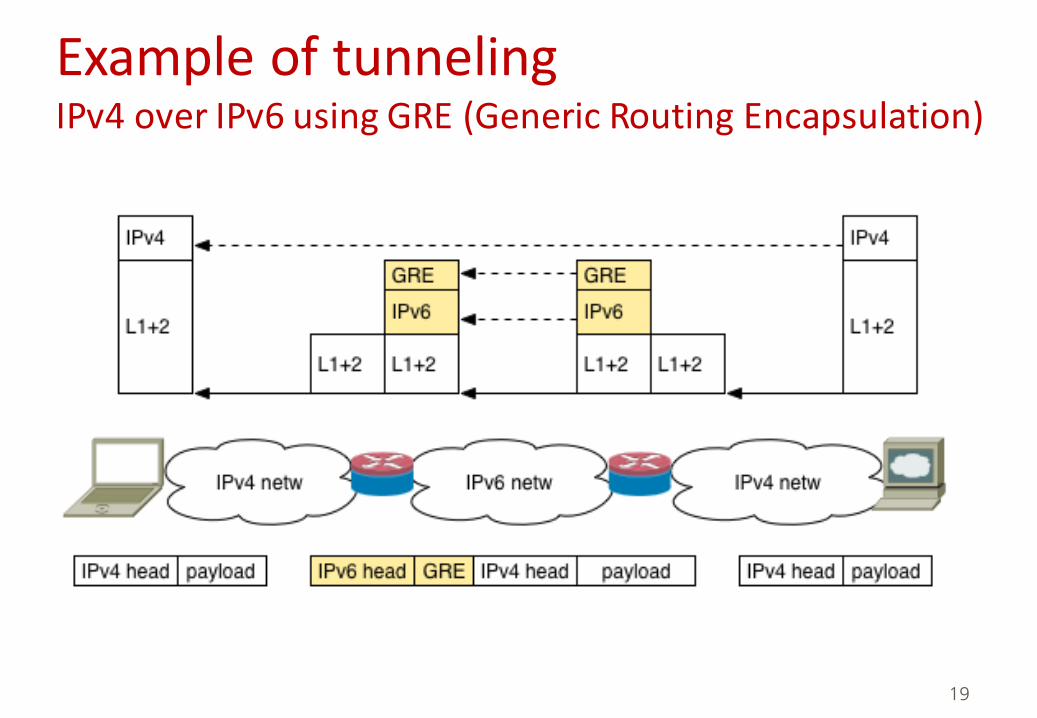
ExampleoftunnelingIPv4overIPv6usingGRE(GenericRoutingEncapsulation)
19
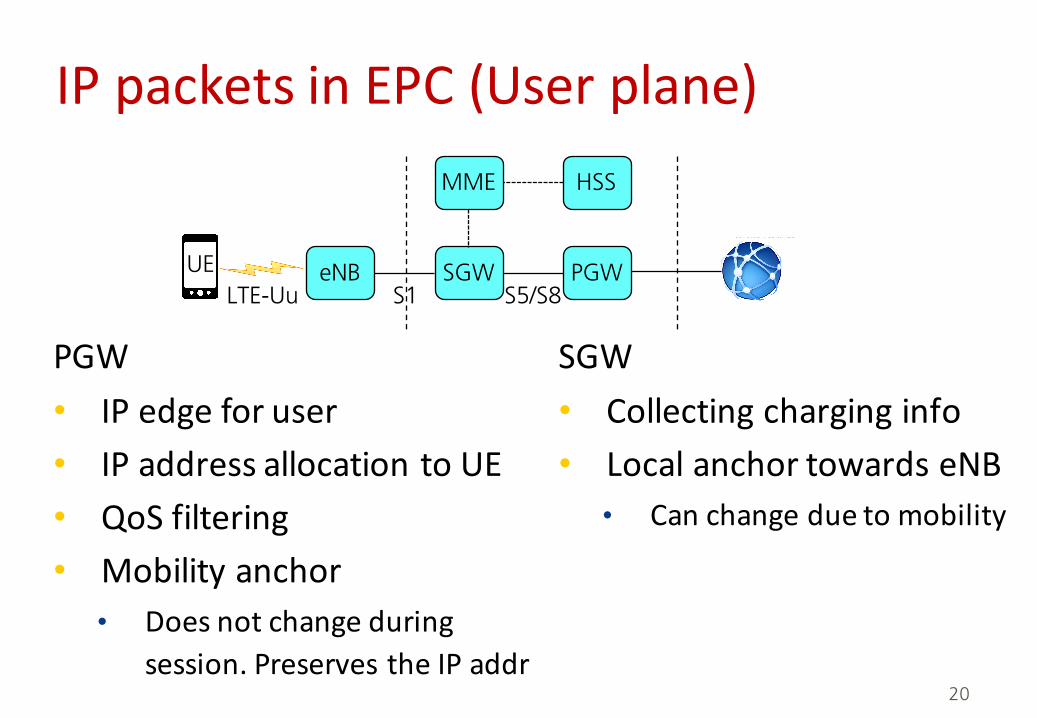
IPpacketsinEPC(Userplane)
SGW• Collectingcharginginfo• LocalanchortowardseNB• Canchangeduetomobility
20
SGW
MME HSS
PGWeNB
PGW• IPedgeforuser• IPaddressallocationtoUE• QoS filtering• Mobilityanchor• Doesnotchangeduring
session.PreservestheIPaddr
S5/S8S1LTE-UuUE

IPpacketsinEPC(Usermobility)
21
SGW PGW
eNB
eNB
UE
SGW PGWeNB
UE
UE
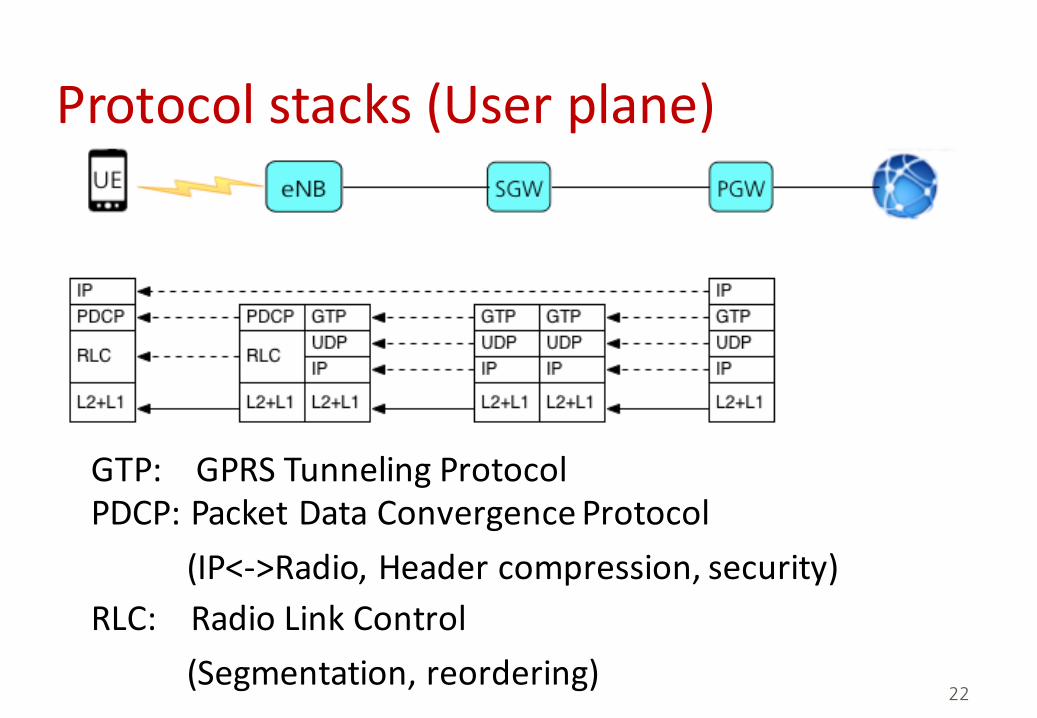
Protocolstacks(Userplane)
22
GTP:GPRSTunnelingProtocolPDCP:PacketDataConvergenceProtocol
(IP<->Radio,Headercompression,security)RLC:RadioLinkControl
(Segmentation,reordering)
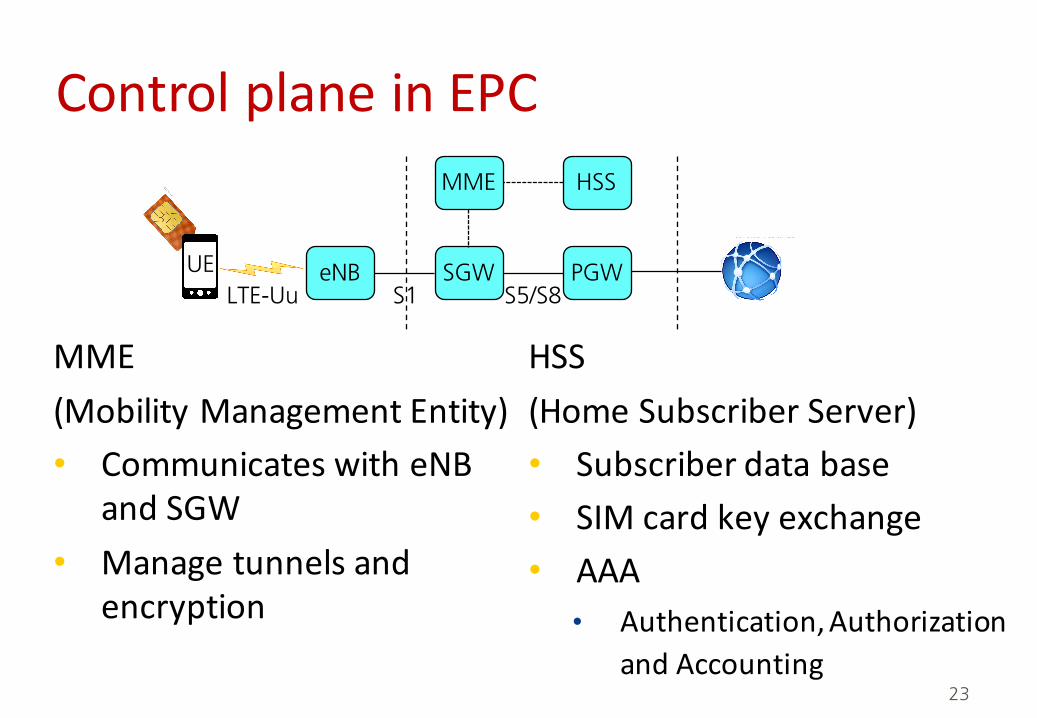
ControlplaneinEPC
HSS(HomeSubscriberServer)• Subscriberdatabase• SIMcardkeyexchange• AAA• Authentication,Authorization
andAccounting23
SGW
MME HSS
PGWeNB
MME(MobilityManagementEntity)• CommunicateswitheNB
andSGW• Managetunnelsand
encryption
S5/S8S1LTE-UuUE
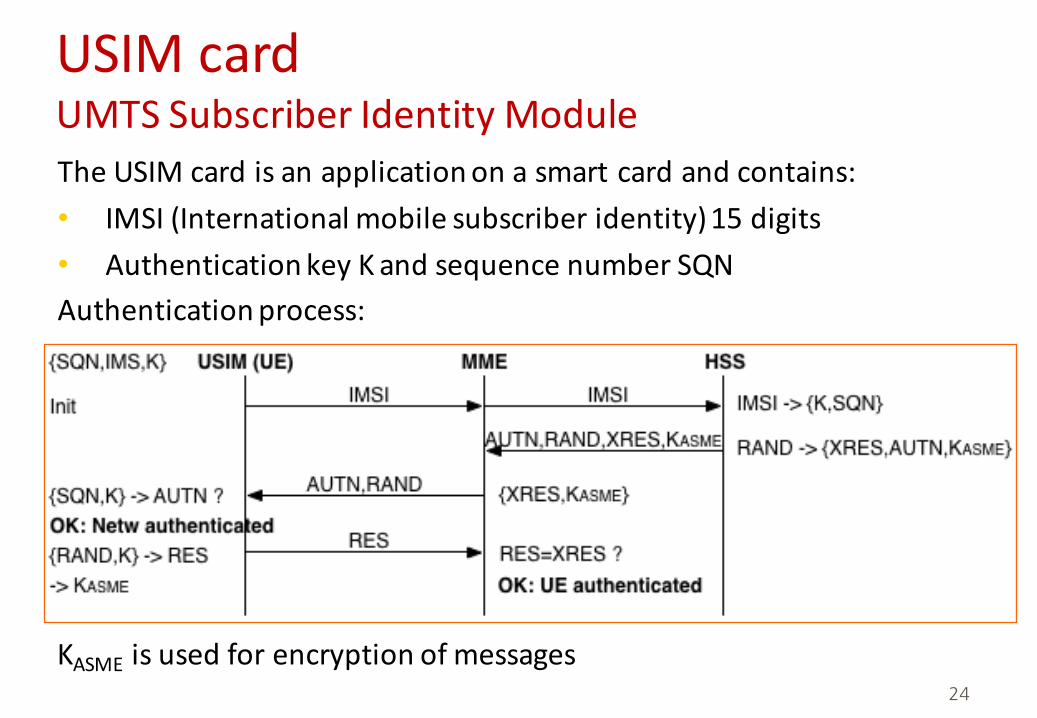
USIMcardUMTSSubscriberIdentityModuleTheUSIMcardisanapplicationonasmartcardandcontains:• IMSI(Internationalmobilesubscriberidentity)15digits• AuthenticationkeyK andsequencenumberSQNAuthenticationprocess:
24
KASME isusedforencryptionofmessages
Theradiochannel
• Licensedfrequencybands(slotsof20MHz)• In0.5-4GHz
• CostinorderofBillions$• Alternative:FDDandTDD• MostcommonFDD
• Efficienttransmission• UElowpower=>long(er)batterylife
=>verylowpoweratreceiver25
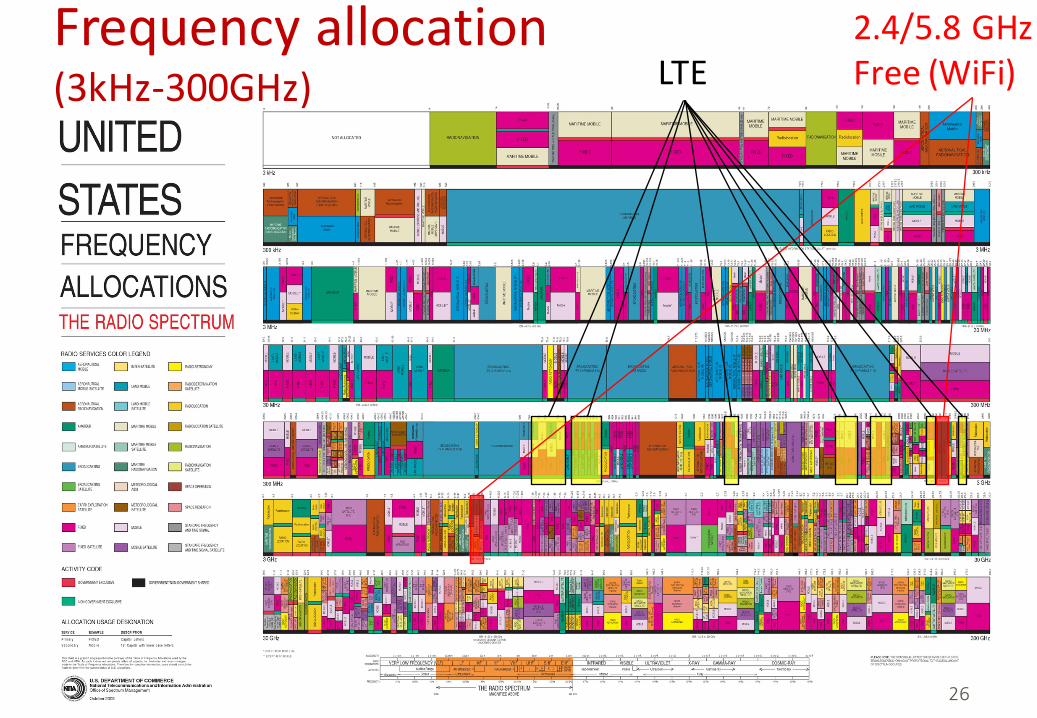
Frequencyallocation(3kHz-300GHz)
26
2.4/5.8GHzFree(WiFi)LTE
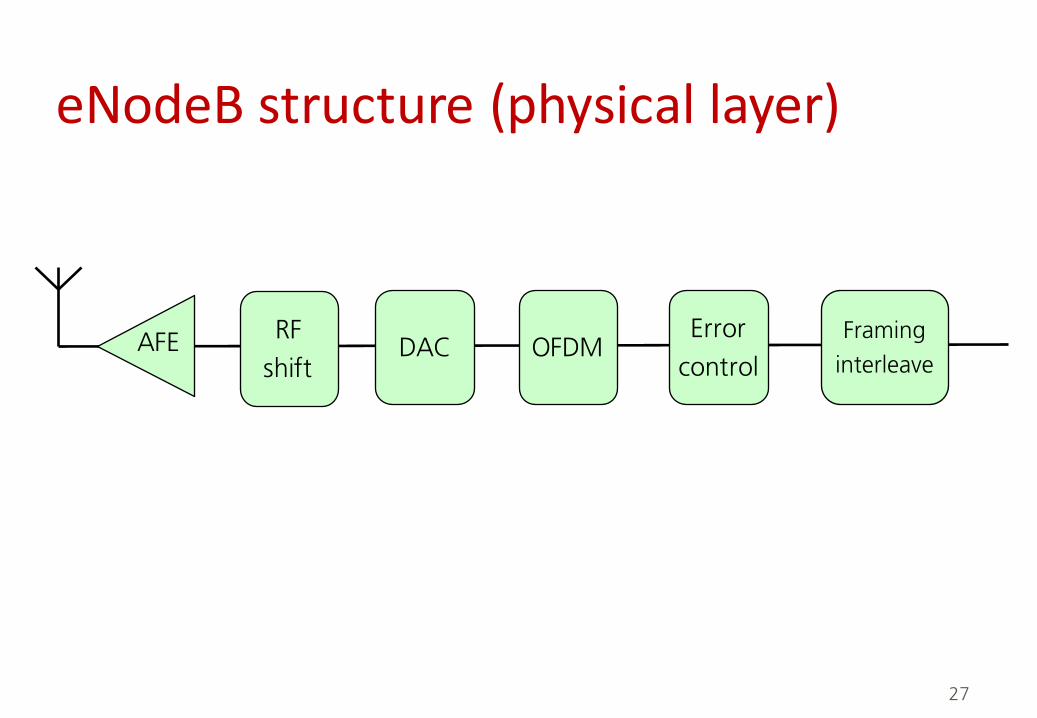
eNodeBstructure(physicallayer)
27
OFDMError
controlFraming
interleaveDACAFE RF
shift

OFDMOrthogonalFrequencyDivisionMultiplexing
28
P2S
S2P
(a1,...,aN )
ai ∈Z16
16-QAM mapping:
(x1,..., xN ) (y1,..., yN ) = IFFT (
!x)
(yN−L+1,..., yN ,y1,..., yN )
QAM
QAM
QAM
IFFT
cos2π f0t
sin2π f0ts(t)
Re DAC
CP
Im DAC
Can be used with M=4, 16, 64 or 256

Time-frequecymultipleaccess
29
TDMA:
Time
Freq
uenc
y
…
User 1User 2User 3User 4
FDMA:
Time
Freq
uenc
y
…
Time-frequecymultipleaccess
30
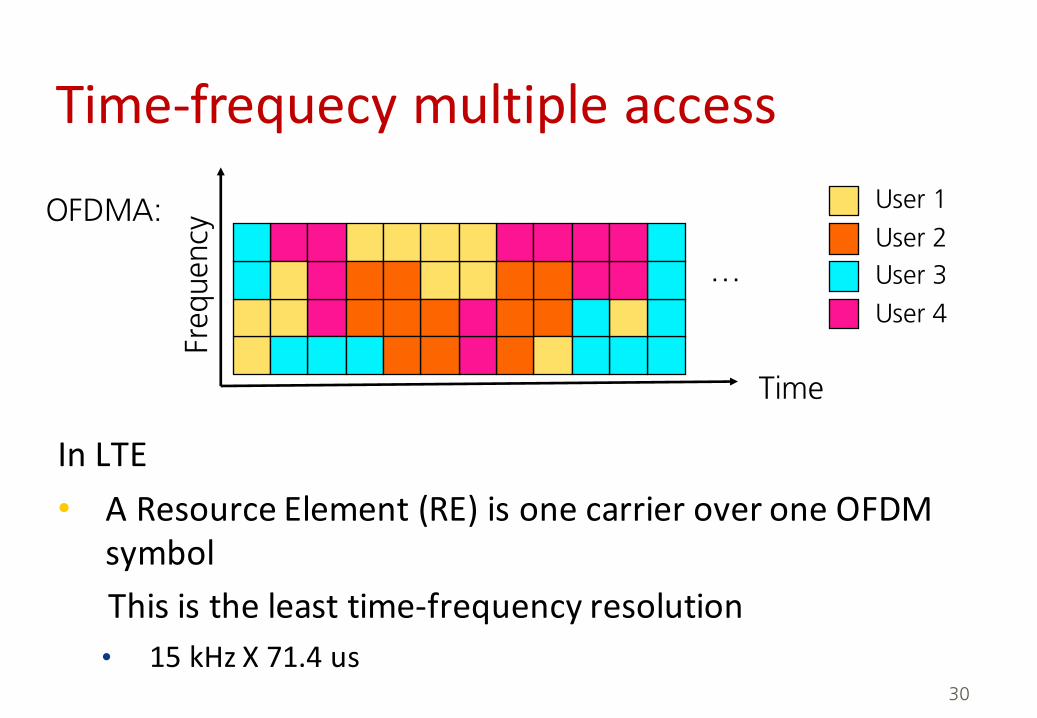
OFDMA:
Time
Freq
uenc
y
…
User 1User 2User 3User 4
InLTE• AResourceElement(RE)isonecarrieroveroneOFDM
symbolThisistheleasttime-frequencyresolution• 15kHzX71.4us
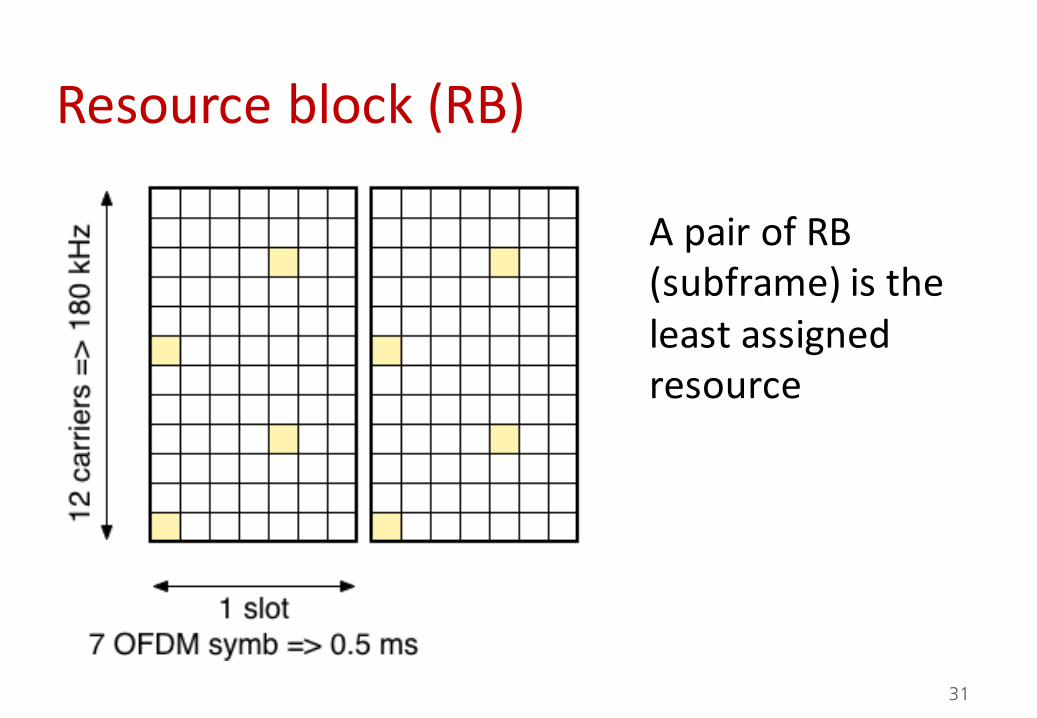
Resourceblock(RB)
ApairofRB(subframe)istheleastassignedresource
31

Framestructureintime
32
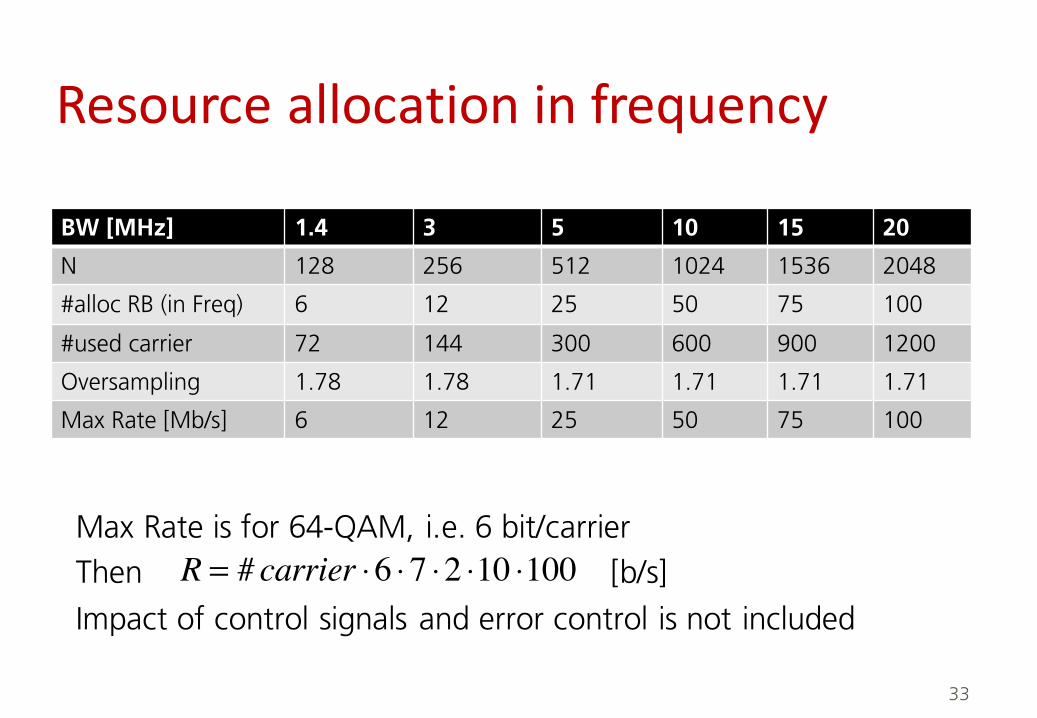
Resourceallocationinfrequency
BW [MHz] 1.4 3 5 10 15 20
N 128 256 512 1024 1536 2048
#alloc RB (in Freq) 6 12 25 50 75 100
#used carrier 72 144 300 600 900 1200
Oversampling 1.78 1.78 1.71 1.71 1.71 1.71
Max Rate [Mb/s] 6 12 25 50 75 100
33
Max Rate is for 64-QAM, i.e. 6 bit/carrierThen [b/s]Impact of control signals and error control is not included
R = # carrier ⋅6 ⋅7 ⋅2 ⋅10 ⋅100
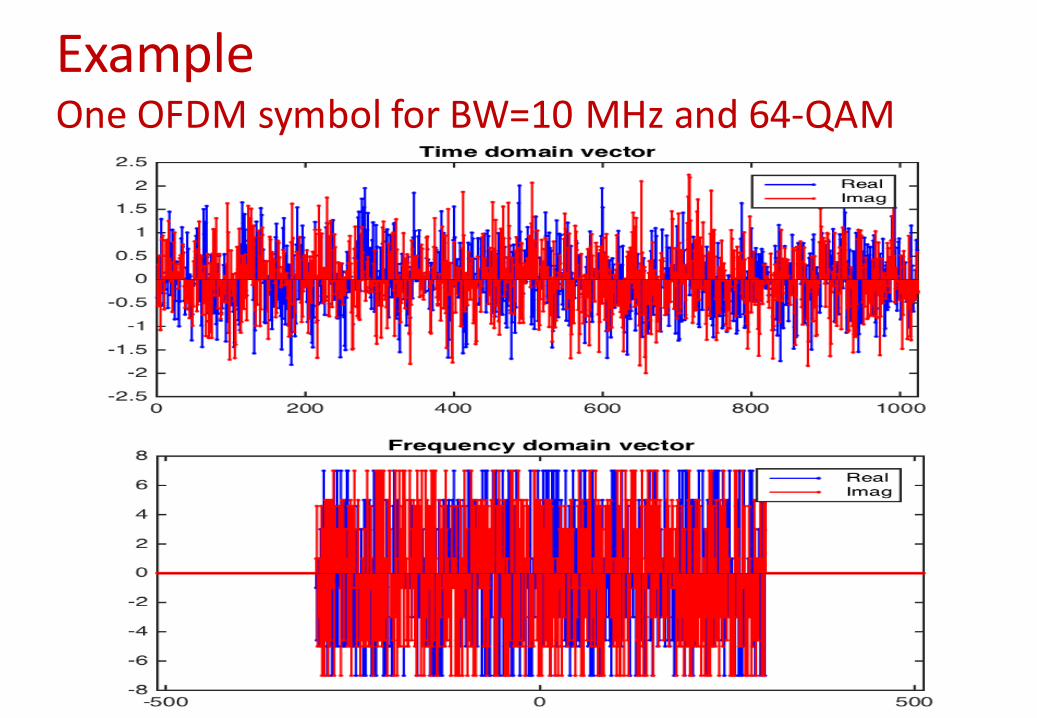
ExampleOneOFDMsymbolforBW=10MHzand64-QAM
34
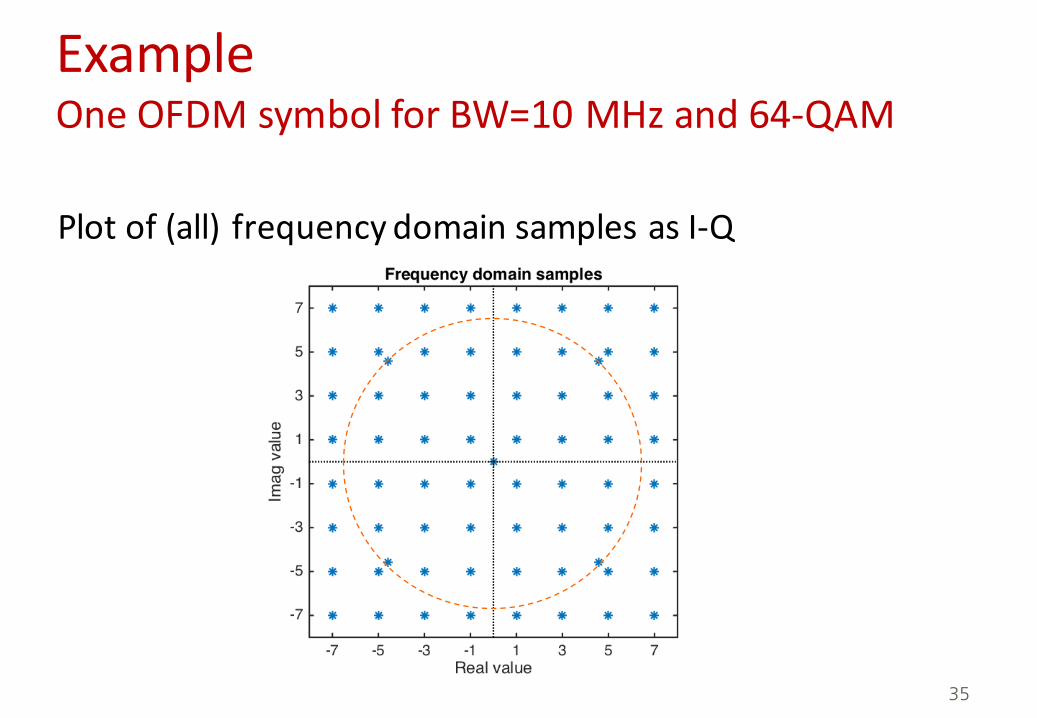
ExampleOneOFDMsymbolforBW=10MHzand64-QAM
35
Plotof(all) frequencydomainsamplesasI-Q
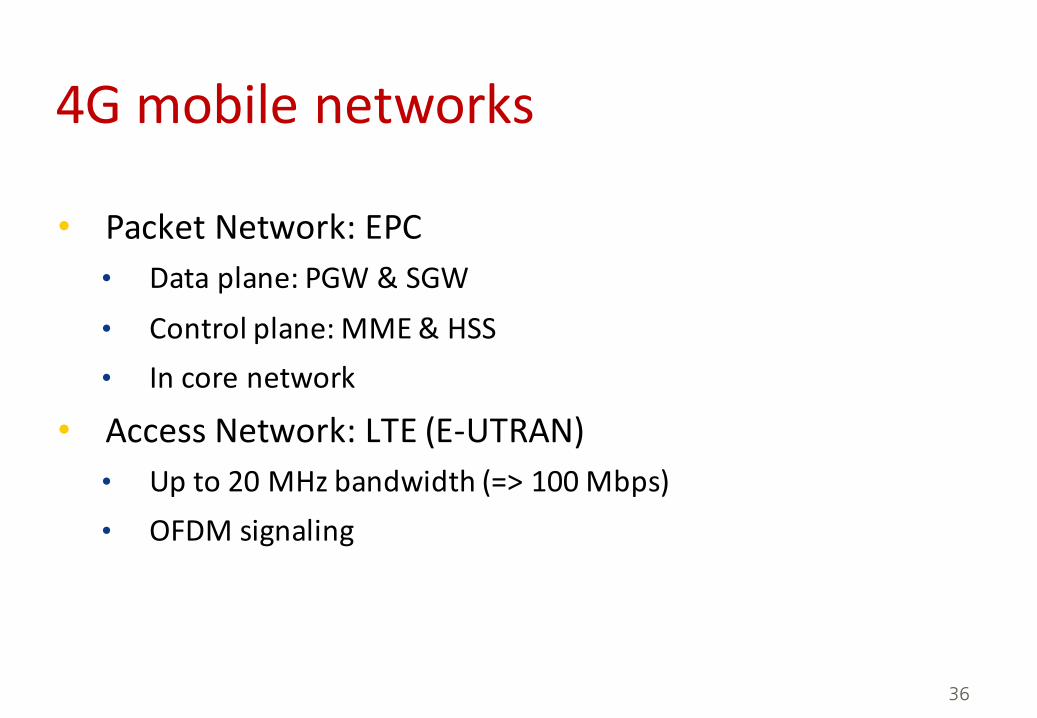
4Gmobilenetworks
• PacketNetwork:EPC• Dataplane:PGW&SGW• Controlplane:MME&HSS• Incorenetwork
• AccessNetwork:LTE(E-UTRAN)• Upto20MHzbandwidth(=>100Mbps)• OFDMsignaling
36
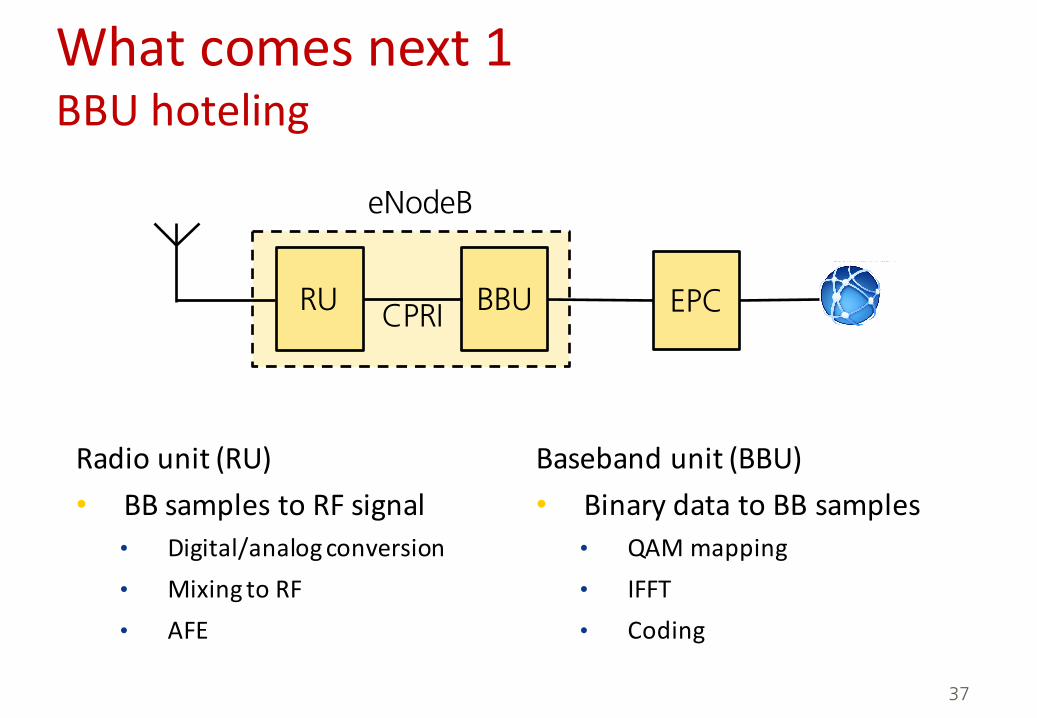
Whatcomesnext1BBUhoteling
Basebandunit(BBU)• BinarydatatoBBsamples
• QAMmapping• IFFT• Coding
37
BBU EPCRU
eNodeB
Radiounit(RU)• BBsamplestoRFsignal
• Digital/analogconversion• MixingtoRF• AFE
CPRI

BBU hotel@ Data center
BBU
Whatcomesnext1BBUhotelingToutilizerecoursesbettersplitBBUandRRUinnetwork• UseCPRItotransmitBBsamplesbetweenBBUandRRU
38
BBU EPCRRU
RRU
RRU=RemoteRadioUnit
Problem:Datarateexpansionintransmissionofradiosamplesofapproximatelyafactor10
backhaulfronthaul
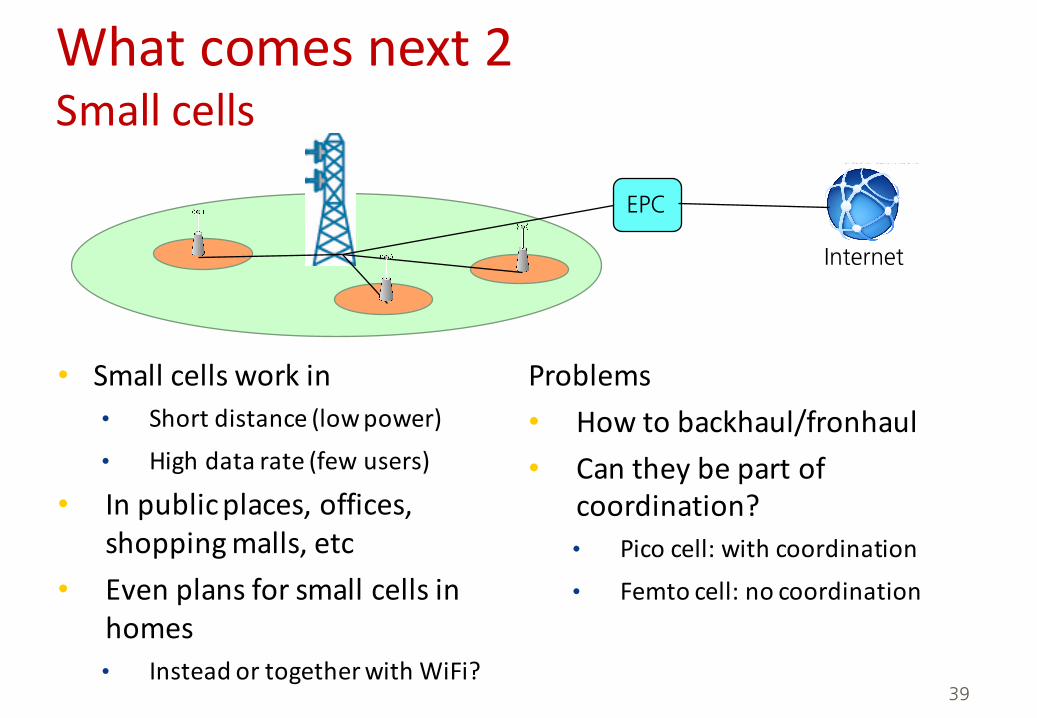
Whatcomesnext2Smallcells
• Smallcellsworkin• Shortdistance(lowpower)• Highdatarate(fewusers)
• Inpublicplaces,offices,shoppingmalls,etc
• Evenplansforsmallcellsinhomes• InsteadortogetherwithWiFi?
39
EPC
Internet
Problems• Howtobackhaul/fronhaul• Cantheybepartof
coordination?• Picocell:withcoordination• Femto cell:nocoordination
Whatcomesnext3Convergednetwork• Usersbecomesmoremobile
• Whenpriceandratedifferencesdiminishmostuserwillnotcareaboutchoiceofconnection
• Convergence:• Onenetwork,manyaccesses• Flexiblenetwork• OneAAA(andpricing)• Handoverbetweene.g.LTE-WiFi• Dualconnectionsandtrafficoff-loading• Allunitseverywhere
• Problem:• Partlynewnetworkstructure(e.g.commonIPedge)
40

Whatcomesnext3Convergednetwork
41
Fixedormobilenetwork(separated,SoA)
Fixedandmobilenetwork(convergednetwork)
Whatcomesnext45G
• Roughlyafactorof10inperformance• 10timesfaster,bandwidth,Datarate,etc• 10batterylife(forlowpowerdevices)• 1000timestrafficvolume• 10timesharder(atleast)
• Smallcellseverywhere• M2M;Everythingisconnected
• Car2Car,IoT,Skynet,…
• Expectedtolaunchlatest2020• Problems:
• Backhaul/fronthaul,RANsync,Energyefficiency,etc
42


![[Vietnam Mobile Day 2013] - Mobile marketing và mobile ad networks.](https://static.fdocuments.in/doc/165x107/54535b24b1af9f8c228b458e/vietnam-mobile-day-2013-mobile-marketing-va-mobile-ad-networks.jpg)