48863981-Gallo Ortega Digital Transformation FMCG
76
Manufacturing Digital Transformation Strategy for FMCG by Sara Viviana Gallo Orjuela Bachelor Mechanical Engineering, Los Andes University and Anais Ortega Camacho M. Sc. Mechanical Engineering, Technische Universität München SUBMITTED TO THE PROGRAM IN SUPPLY CHAIN MANAGEMENT IN PARTIAL FULFILLMENT OF THE REQUIREMENTS FOR THE DEGREE OF MASTER OF APPLIED SCIENCE IN SUPPLY CHAIN MANAGEMENT AT THE MASSACHUSETTS INSTITUTE OF TECHNOLOGY May 2020 © 2020 Sara Viviana Gallo Orjuela and Anais Ortega Camacho. All rights reserved. The authors hereby grant to MIT permission to reproduce and to distribute publicly paper and electronic copies of this capstone document in whole or in part in any medium now known or hereafter created. Signature of Author: ____________________________________________________________________ Sara Viviana Gallo Orjuela Department of Supply Chain Management May 8, 2020 Signature of Author: ____________________________________________________________________ Anais Ortega Camacho Department of Supply Chain Management May 8, 2020 Certified by: __________________________________________________________________________ Dr. María Jesús Sáenz Executive Director, Supply Chain Management Blended Program Capstone Advisor Certified by: __________________________________________________________________________ Dr. Ozden Tozanli Postdoctoral Associate, Digital Supply Chain Transformation Capstone Co-Advisor Accepted by: __________________________________________________________________________ Prof. Yossi Sheffi Director, Center for Transportation and Logistics Elisha Gray II Professor of Engineering Systems Professor, Civil and Environmental Engineering
Transcript of 48863981-Gallo Ortega Digital Transformation FMCG

Manufacturing Digital Transformation Strategy for FMCG
by
Sara Viviana Gallo Orjuela Bachelor Mechanical Engineering, Los Andes University
and
Anais Ortega Camacho M. Sc. Mechanical Engineering, Technische Universität München
SUBMITTED TO THE PROGRAM IN SUPPLY CHAIN MANAGEMENT
IN PARTIAL FULFILLMENT OF THE REQUIREMENTS FOR THE DEGREE OF
MASTER OF APPLIED SCIENCE IN SUPPLY CHAIN MANAGEMENT AT THE
MASSACHUSETTS INSTITUTE OF TECHNOLOGY
May 2020
© 2020 Sara Viviana Gallo Orjuela and Anais Ortega Camacho. All rights reserved. The authors hereby grant to MIT permission to reproduce and to distribute publicly paper and electronic
copies of this capstone document in whole or in part in any medium now known or hereafter created.
Signature of Author: ____________________________________________________________________ Sara Viviana Gallo Orjuela
Department of Supply Chain Management May 8, 2020
Signature of Author: ____________________________________________________________________
Anais Ortega Camacho Department of Supply Chain Management
May 8, 2020
Certified by: __________________________________________________________________________ Dr. María Jesús Sáenz
Executive Director, Supply Chain Management Blended Program Capstone Advisor
Certified by: __________________________________________________________________________ Dr. Ozden Tozanli
Postdoctoral Associate, Digital Supply Chain Transformation Capstone Co-Advisor
Accepted by: __________________________________________________________________________ Prof. Yossi Sheffi
Director, Center for Transportation and Logistics Elisha Gray II Professor of Engineering Systems Professor, Civil and Environmental Engineering

2
Manufacturing Digital Transformation Strategy for FMCG
by
Sara Viviana Gallo Orjuela
and
Anais Ortega Camacho
Submitted to the Program in Supply Chain Management on May 8, 2020 in Partial Fulfillment of the
Requirements for the Degree of Master of Applied Science in Supply Chain Management
ABSTRACT
Manufacturing companies are facing serious challenges to survive and succeed in the market in this ever-changing economy. The FMCG industry is not unaware of these challenges, and therefore, many leading manufacturing companies are creating initiatives of Smart Manufacturing or Industry 4.0. However, the literature on Digital Manufacturing mainly addresses technical aspects of the implementation and not the design of a complete strategy, which involves not only technologies but also the organization and external components like customers or suppliers. Our project aimed to close the gap between the technological components of a Digital Transformation and the human factor. Therefore, this project could be considered a multiple methodological approach. On one side, the study is based on the collection and analysis of data obtained from the ERP System of the company. On the other hand, the project relies on a survey to discover the digital maturity of the bottling plants to include the human factor. Thus, the sponsor company will have the base information to implement a Digital Manufacturing strategy. With the information captured from the ERP System, we performed a cluster analysis to group the bottling plants into smaller groups that have similar performance characteristics. Moreover, with the results of the surveys, we examined the perspectives of the operational team from all bottling plants. Consequently, plants can be group depending on their operational performance and digital maturity of their organizations. Finally, managerial recommendations for all clusters were provided. In some cases, where digital technologies are more advanced, the goal is to exploit this competitive advantage and introduce more sophisticated methodologies to analyze the data and create value-driven decisions. In other cases, before starting with the implementation of new digital technologies, employees must be prepared to receive new technologies and learn how to work in a digital world. Capstone Advisor: Dr. María Jesús Sáenz Title: Executive Director, Supply Chain Management Blended Program
Capstone Co-Advisor: Dr. Ozden Tozanli Title: Postdoctoral Associate, Digital Supply Chain Transformation

3
ACKNOWLEDGMENTS
We would like express our deep and sincere gratitude to our MIT advisors Maria Jesús Sáenz and Ozden Tozanli for their immense support along these many months and their wise advice through the difficult moments. Thank you for your invaluable guidance throughout this project. We could not have imagined better advisors for our project.
We would also specially thank Rafael Ramos, Jesús Vera, Alfonso Argüelles y Andrés Sánchez from BeverageCo. Without their knowledge and expertise this project would not have been possible.
The completion of this project could not have been accomplished without the moral and emotional support from our cohort. Thank you for the uncountable hours of study and laughs. We will treasure these moments forever.
Sara: I will like to thank Anais for her wonderful collaboration. Without you this couldn’t be possible!
Anais: Thank you Sara. I was lucky to have you a partner; but I now I am even luckier to have you as a friend. And last, but not least, my deepest appreciation goes to Daniel and my family. Thank you for challenging me to go a step further and for believing in me, even in the moments when I do not. Without your caring support none of this could have happened.

4
Table of Contents LIST OF FIGURES .................................................................................................................... 5 LIST OF TABLES ...................................................................................................................... 5 1 INTRODUCTION .............................................................................................................. 6 2 BACKGROUND .............................................................................................................. 10
2.1 Fast-Moving Consumer Goods Industry .............................................................................. 10
2.2 BeverageCo ....................................................................................................................... 11 3 LITERATURE REVIEW ..................................................................................................... 14
3.1 Manufacturing Digital Transformation ............................................................................... 14 3.1.1 Manufacturing Digital Transformation Technologies ............................................................................ 15
3.2 Manufacturing Digital Transformation Strategy ................................................................. 18 4 DATA AND METHODOLOGY .......................................................................................... 20
4.1 Methodological Approach ................................................................................................. 20 4.1.1 Interviews .............................................................................................................................................. 21
4.2 Scorecard Data .................................................................................................................. 22 4.2.1 Data Collection ....................................................................................................................................... 22 4.2.2 Variable Selection .................................................................................................................................. 24 4.2.3 Research Methodology .......................................................................................................................... 26
4.3 Survey............................................................................................................................... 26 4.3.1 Survey Design ......................................................................................................................................... 26 4.3.2 Data Collection ....................................................................................................................................... 28 4.3.3 Research Methodology .......................................................................................................................... 31
5 RESULTS AND ANALYSIS ................................................................................................ 32
5.1 Scorecard Data .................................................................................................................. 32 5.1.1 Exploratory Factor Analysis Results ....................................................................................................... 32 5.1.2 Clustering Analysis Results ..................................................................................................................... 34 5.1.3 Clusters Composition Analysis ............................................................................................................... 39
5.2 Survey............................................................................................................................... 40 5.2.1 Survey Results ........................................................................................................................................ 40 5.2.2 Exploratory Factor Analysis Results ....................................................................................................... 43 5.2.3 Regression Results ................................................................................................................................. 47 5.2.4 Survey Analysis ...................................................................................................................................... 51
6 MANAGERIAL RECOMMENDATIONS ............................................................................. 53 6.1.1 General Recommendations ................................................................................................................... 53 6.1.2 Recommendations by Cluster ................................................................................................................ 57
7 CONCLUSIONS .............................................................................................................. 63
7.1 Opportunities for future research ...................................................................................... 65 REFERENCES ........................................................................................................................ 66 APPENDIX............................................................................................................................ 72
Appendix A. Semi structured interview BeverageCo executives ..................................................... 72
Appendix B. Survey for employees in BeverageCo ......................................................................... 73

5
LIST OF FIGURES Figure 1. BeverageCo - Plants and lines per Country .................................................................................. 11 Figure 2. Diagram of methodology steps. ................................................................................................... 21 Figure 3. Manufacturing final variables ...................................................................................................... 25 Figure 4. External factors ............................................................................................................................ 25 Figure 5. TOE Framework. ........................................................................................................................... 29 Figure 6. Scree plot of eigenvalues and factors .......................................................................................... 32 Figure 7. Dendrogram for number of clusters selection ............................................................................. 35 Figure 8. Representation of clusters within the 3 factors in 2D .................................................................. 37 Figure 9. Representation of clusters within the 3 factors in 3D .................................................................. 38 Figure 10. Representation of survey constructions ..................................................................................... 50 Figure 11. Results expected benefits of Digital Manufacturing .................................................................. 54 Figure 12. Results of training questions ...................................................................................................... 54
LIST OF TABLES Table 1. Manufacturing KPIs ....................................................................................................................... 23 Table 2. External factors ............................................................................................................................. 24 Table 3. Constructs for TOE framework ...................................................................................................... 30 Table 4. Factor matrix for Scorecard data .................................................................................................. 33 Table 5. Component matrix for external factors ......................................................................................... 34 Table 6. K-means with k=3 to k=6 ............................................................................................................... 36 Table 7. Descriptive analysis of the clusters ................................................................................................ 38 Table 8. ANOVA ........................................................................................................................................... 39 Table 9. Demographic composition of the survey results ........................................................................... 41 Table 10. Analysis of technologies .............................................................................................................. 41 Table 11. Survey results for early and late respondents ............................................................................. 42 Table 12. Results survey for corporate and non-corporate respondents .................................................... 43 Table 13. EFA results for construct “Expected Benefits” ............................................................................. 44 Table 14. EFA results for construct “Challenges” ........................................................................................ 44 Table 15. EFA results for constructs in “Adoption of technologies” ............................................................ 45 Table 16. EFA results for constructs in “Organization I” ............................................................................. 45 Table 17. EFA results for constructs in “Organization II” ............................................................................ 46 Table 18. EFA results for constructs in “External Factors” .......................................................................... 47 Table 19. Correlation coefficients ............................................................................................................... 48 Table 20. Regression results for Adoption of technologies ......................................................................... 49 Table 21. Differences between clusters ...................................................................................................... 51 Table 22. Strengths and weaknesses per cluster ........................................................................................ 62

6
1 INTRODUCTION Manufacturing companies across all major industries are facing serious challenges trying to survive and
succeed in the market in this ever-changing economy. Even established corporations with long traditions
and successful pasts have been losing value because of their inability to change (Henderson & Clark, 1990).
In fact, many companies have started a major transformational change trying to integrate digital
technologies into their businesses (Tekic & Koroteev, 2019).
Therefore, leading manufacturing companies are starting to implement initiatives in their plants such as
Smart Manufacturing, Industry 4.0 and the factory of the future in order to create new opportunities to
transform, differentiate and compete (Poliakine, 2019). Through these initiatives, manufacturers can
connect people, equipment and systems, making relevant information available in real time to facilitate
agile decision-making and elevating the role of manufacturing (Jacobson, 2018).
However, manufacturing companies still lack a strategy that allows them to achieve a successful Digital
Transformation in their operations. Although a wide range of models are presented in the literature
regarding Digital Manufacturing, they mainly address technological aspects of the implementation of
smart systems without taking into account organizational aspects like training of the employees or change
management, that are also essential for this type of transformation (Carolis et al., 2017).
A Digital Transformation strategy for manufacturing is not just about introducing digital technologies such
as Additive Manufacturing, Augmented Reality or Big Data to the factories. It should consider different
dimensions such as maturity levels of the plants, people (organization and talent), processes &
methodologies, technology, networks, data and information, and financial aspects. Digital technologies
can provide possibilities to increase efficiency. However, if people lack the right mindset to change and
the current processes are not prepared, Digital Transformation will not succeed (Savastano et al., 2019).

7
This is the problem that the sponsor company, BeverageCo, is currently facing. BeverageCo is a multi-
category beverage leader of the Fast-Moving Consumer Goods (FMCG) sector that is under pressure to
transform their manufacturing strategy due to changes in consumers’ needs and preferences as well as
low profit margins. Therefore, the company’s primary objective is to explore new opportunities: finding
and connecting new and enriching existing resources such as people, products and platforms in their
productive plants.
Although BeverageCo had an initial strategy to transform its manufacturing facilities, the level of
implementation significantly varies from plant to plant. One of the reasons for the different levels of
implementation of digital technologies is that all plants have been treated in the same way, without taking
into consideration their particularities.
To develop the most effective strategy for the plants, it is fundamental to understand the current situation
and readiness of each bottling plant as well as their main characteristics from both operational and
organizational perspectives. This information will enable BeverageCo to apply the technological change
that the digital technologies envision (Carolis et al., 2017). For this reason, the aim of this project is to
develop a Digital Transformation strategy for BeverageCo’s manufacturing plants that considers all these
aspects to attain their competitive advantage.
To understand the situation of each plant and its readiness to implement a Manufacturing Digital
Transformation, it was necessary to use a multiple research methodology approach. The proposed
multiple research methodology considers data gathered from BeverageCo’s ERP system and data from
surveys.
The data from the ERP System was used to standardize and compare the technical information about the
performance of the plants. According to several indicators, plants are divided into smaller groups, viz.

8
clusters. Each cluster includes plants with similar characteristics, where it is expected that their response
to Manufacturing Digital Transformation is similar.
The data from the surveys was used to incorporate the human factor and the knowledge of operational
administration. The goal is to measure the adoption level of digital technologies and the digital culture of
the plants. Both data, permit to incorporate technological aspects as well as the cultural characteristics of
the plants.
The research questions of this projects are:
RQ1. What are the most relevant indicators that have an impact in the performance of the
plants?
RQ2. Are there any external factors that also impact the performance of the plants?
RQ3. How can plants be grouped according to similar characteristics?
RQ4. What is the current digital culture of the plants?
RQ5. What are the recommendations to implement Manufacturing Digital Transformation?
Therefore, the overall hypothesis of this capstone project is that the development of clusters of plants
that considers technical, cultural and organizational similarities will allow the company to create a more
successful Manufacturing Digital Transformation strategy.
This document is structured as follows: Chapter 2 explains the current situation in the FMCG industry and
BeverageCo. Chapter 3 provides a review of previous works in Digital Transformation strategies, their key
drivers and technologies to be implemented in manufacturing. It also describes the methodologies
considered to obtain and analyze the data provided by the plants. Chapter 4 explains the methodology
chosen and the process of data gathering and explores the resulting data of the validation steps and
clustering of the plants. Chapter 5 presents and validates the results from both methodologies. Next,

9
chapter 6 the discusses the results and proposes managerial recommendations for the Manufacturing
Digital Transformation strategy. Finally, Chapter 7 concludes the documents with a summary of the
findings and the recommendations for next steps for the sponsor company.

10
2 BACKGROUND
This chapter presents a brief description of the fast-moving consumer goods industry and the challenges
that this industry as a whole and BeverageCo are currently facing.
2.1 Fast-Moving Consumer Goods Industry
Fast-moving consumer goods (FMCG) such as food, beverages and personal care goods are defined as
“nondurable retail products” that typically have three characteristics: 1) They are cheap, 2) They are
bought frequently, and 3) They have a short service life (Kuzmina et al., 2019).
Taking into account that these products are quickly substituted, FMCG corporations are trying to meet
the changing taste and demand from customers who are expecting healthier options (products that
contain fewer additives and preservatives), low-calorie products and more sustainable packaging.
The key brands of top FMCGs hardly make the list of the top ten most valuable global brands because
people no longer consider valuable what is not healthy. According to the market trends, healthy food
items will drive sales of products for the next five years, therefore, FMCG companies need to transform
their current business model in order to satisfy the new consumers’ needs (Lorange & Rembiszewski,
2014).
During past decades, FMCG manufacturers were focused on achieving economies of scale to be more
competitive. This trend led to centralized productions systems where one single facility served a large
area making possible to reduce costs. However, by doing this, FMCG companies could not adapt to local
preferences/demands and lost local communication between customer and producer (Angeles-Martinez
et al., 2018). For this reason, FMCG companies did not expect such radical consumer changes and they

11
were not prepared for faster innovation cycles. This led to an innovation gap that generates pricing
pressure and low margins (Lorange & Rembiszewski, 2014).
In order to be competitive, the FMCG industry is moving towards Industry 4.0, which involves fast and
disruptive changes that will allow improvements in efficiency and productivity (Pereira & Romero, 2017).
The implementation of Industry 4.0 could also increase revenues and provide the flexibility, adaptability
and agility that manufacturing companies currently need because of the changes in the market that will
lead to a new source of value creation (Mohamed, 2018).
2.2 BeverageCo
In the last decades, BeverageCo has grown from a Mexico-based bottler to a multinational multi-category
beverage leader, serving 290 million people across 10 countries, through 52 plants and 263 production
lines (see Figure 1). They produce a diversified portfolio: low- or no-sugar sparkling beverages, refreshing
juices, hydrating purified water and energy drinks; that can satisfy its consumers’ and clients’ evolving
preferences.
Figure 1. BeverageCo - Plants and lines per Country
263
6
6
8
10
10
16
22
32
61
92
52
1
1
1
2
3
2
4
7
10
21
Total
Nicaragua
Panama
Uruguay
Costa Rica
Guatemala
Argentina
Venezuela
Colombia
Brazil
Mexico
Number of Plants Number of lines

12
BeverageCo is aware of the need to move the FMCG towards Industry 4.0, but most of the efforts at supply
chain digitalization were located in logistics (planning) and distribution, not in manufacturing. For
example, in logistics, JDA software was implemented in all BeverageCo’s operations to create a unique
Supply Chain Planning model that enhances their customer service while optimizing costs and capital
allocation. In distribution, a Digital Distribution platform was implemented to improve customer
satisfaction, deliver increased resource optimization and enhance driver safety.
However, for manufacturing, the resources were mainly focused on how the plants should be operated
and maintained. The priority was the standardization of the operating models and the centralized
maintenance planning model. The aim was to consolidate the maintenance planning and budgeting of the
manufacturing plants at country level. Although some attempts were made to apply digital systems like
Manufacturing Execution System (MES) or Statistical Process Control (SPC), the effort to implement
digitalization in manufacturing was still lower than the one executed in logistics and distribution.
Moreover, these first digital implementations in manufacturing did not have the results that the company
was expecting.
Therefore, before making any further investments in digitalization, the company is currently re-evaluating
its approach to the Digital Transformation. However, the creation of a new strategy is not simple.
According to Cimini et al. (2017) there is a lack of knowledge about the practices required in an Industry
4.0 implementation. There are no clear guidelines, much less a path that explains how to transition from
a traditional factory to a smart factory. Although in the literature are plenty of models about Industry 4.0,
researchers have been focused on the technical aspects of the technologies to be implemented (Carolis
et al., 2017). They have not considered elements such as the organization and the people that are key
players for this type of transformation.

13
For this reason, BeverageCo aims to create a centrally, standard and global digital strategy to transform
its bottling plants that considers not only technological features but also aspects of the bottling plants
such as the economy of the region where the plant is located, country’s market, people’s capabilities,
cultural behaviors, operating models, supplier’s technology, SKUs produced and product life cycle in order
to increment the probability of having a successful Digital Transformation.

14
3 LITERATURE REVIEW
This chapter reviews the existing literature on Manufacturing Digital Transformation. This study will
introduce the terminologies that will be used throughout the project to create a common framework and
discuss the gaps identified in previous researches.
3.1 Manufacturing Digital Transformation
The world is going through a Digital Transformation and manufacturing companies are aware of this.
Digital Transformation has become a high priority for manufacturing leaders around the globe that desire
to increase their companies’ chances for survival and success in today’s market. For this reason, many
manufacturing enterprises have been trying to integrate digital technologies into their processes and use
it as a competitive advantage (Hess et al., 2016).
However, to remain competitive, manufacturing leaders must create and execute strategies that embrace
the implications of Digital Transformation. Strategy, not technology, is the key for driving a Digital
Transformation (Kane et al., 2015).
According to the literature, the definition of Digital Transformation is “the use of new digital technologies
to enable major business improvements” (Fitzgerald et al., 2013). For manufacturing, the Digital
Transformation is known with the terms of Industry 4.0 in Germany or Smart Manufacturing in the United
States (Osterrieder et al., 2019). The term Industry 4.0, also known as the Fourth Industrial Revolution,
was presented by the German Government as a strategic initiative for the development of advanced
production systems that integrate a set of emergent and convergent technologies in order to increase
efficiency and productivity in the industrial sector (Frank et al., 2019a).

15
One of the key concepts in Industry 4.0 is the term Smart Factory. A traditional factory is responsible for
converting raw materials into finished products through the interaction between physical flow and
information flow. In contrast, a smart factory is a fully connected manufacturing system that embraces a
set of industrial developments such as Internet of Things (IoT), Big Data, robotics, Cloud Manufacturing,
Artificial Intelligence (AI), Augmented Reality (AR) and advanced analytics, that will bind the digital and
physical worlds through technology (Pereira & Romero, 2017).
Despite its benefits, the Digital Transformation will bring new challenges to the organizations since they
will need to overcome some obstacles to implement Industry 4.0 successfully. Some of these obstacles
are the lack of digital skills in workforce, high investment requirements, uncertainty of the economic
benefits in investing in technology, data security (more connectivity, more security risks for sharing
information) (Kiel et al., 2017), low maturity level of technology, lack of standards and regulations, lack of
digital infrastructure, ensuring data quality, lack of internal digital capabilities and culture, resistance of
change, ineffective change management and inadequate top management level (Raj et al., 2019).
According to Raj et al. (2019), the lack of a digital strategy and the shortage of financial resources are the
most prominent barriers to the adoption of Industry 4.0. Therefore, it is clear that the management level
needs to create a strategy that contemplates not only the technology but also the people’s involvement
and organizational aspects (Savastano et al., 2019).
3.1.1 Manufacturing Digital Transformation Technologies
Technological advances have driven major transformations in the manufacturing sector since the
industrial revolution. In the nineteenth century, in the first industrial revolution, steam engines powered
factories. In the twentieth century, during the second industrial revolution, electrification led to mass
production, and in the 1970’s, in the third industrial revolution, industry became automated. Now, in the

16
rise of the fourth industrial revolution, new digital technologies are changing the traditional relationships
among suppliers, producers, and customers, as well as between humans and machines (Gerbert et al.,
2015).
According to Büchi et al. (2020), there are ten foundational technologies transforming manufacturing.
These technologies embrace the integration of all elements such as data, human and machine agents,
materials, products, production systems and processes in a value adding system, by eliminating the
boundaries between the digital and the physical world. The nine pillars come from a study done by Boston
Consulting Group (Gerbert et al., 2015). The technologies in the nine pillars are:
- Additive Manufacturing: Also known as 3D-Printing. The technology allows to create parts from
diverse materials and with complicated structures better than traditional technologies. Additive
Manufacturing provides the capability to customize products in an affordable and faster way
(D’Aveni, 2018).
- Augmented Reality: This relates to the devices that enriches human sensory perception by
accessing to virtual environments through sensory elements that can be added to smart devices
or other sensors that can augment vision (augmented-reality glasses), sound (earphones) or touch
(globes), providing multimedia information (Büchi et al., 2020).
- Autonomous robots: The concept behind robotics is to design machines that move autonomously
and assist humans in some of the most monotonous or dangerous activities or even perform these
tasks (Davenport & Kirby, 2015). This pillar is also related to automation that consists on
delegating tasks to machines that were previously made by humans. Depending on the level of
automation machines first take away the heavy or dangerous tasks; next, they take control of the
monotonous activities and finally, in the third step, machines are also able to take decisions by
themselves (Davenport & Kirby, 2015).

17
- Cloud Computing: The technology is based on the power of computing without having the
information and the software “on premise”. This way the information is available at anytime and
anywhere. It is proved to be a tool that increases the efficiency and the collaboration between
the employees (McAfee, 2011).
- Data Analytics: Usually also known as Big Data Analytics. It bundles a bunch of techniques for
collecting, transforming and combining data (coming multiple sources) to support a data driven
decision making process. The main goal is to extract insights value and information from raw data
and identify or predict patterns (LaValle et al., 2011).
- Digital Twin (Simulation): A Digital Twin is a virtual representation of a product or a model that
behaves like the original model. The virtual model can be updated also with information from the
real world and it is usually used to simulate different scenarios to predict the response of the real
model (Purdy et al., 2020).
- Industrial Internet of Things: The term Industrial Internet of Things refers to the ability of
products and equipment to communicate with each other and be “smart”. The idea is to have
products and equipment connected to the network through high-quality microprocessors to keep
track of equipment status on a real-time basis (Porter & Heppelmann, 2015).
- Cybersecurity: When the processes more automatized than ever and all the data generated, every
company must focus on potential threats and their impact on the business activities. The goal is
to protect all systems and to reduce the risks of both intentional and unintentional breaks
(Parenty & Domet, 2019).
- Horizontal and Vertical System Integration: This concept relates to the integration of companies,
suppliers and customers, using data-integration networks that will enable truly automated value
chains.

18
Also, various techniques can be used for Manufacturing Digital Transformation. The most significant
techniques are:
- Artificial Intelligence: Under the term Artificial Intelligence there are several techniques involved.
All these techniques are characterized by the fact that can perform tasks efficiently and
intelligently without being explicitly instructed (Cagle, 2019).
- Machine Learning: It is a technique included in the Artificial Intelligence practices. Machine
Learning algorithms learn from past data and improve themselves recursively to better identify
data (Cagle, 2019).
- Blockchain: It is a technique that allows transactions between two parties efficiently. The
information is not centralized, but all parties have access to the data and can verify it. Once a
transaction is recorded in the database, it cannot be altered; making the information almost
incorruptible (Iansiti & Lakhani, 2017).
3.2 Manufacturing Digital Transformation Strategy
Digital Transformation strategies have certain elements in common that can be attributed to four
dimensions: the use of technologies, changes in value creation, structural changes and financial aspects.
These elements must be aligned with each other, to have a successful Digital Transformation that fully
exploits its expected benefits (Matt et al., 2015).
A winning Digital Transformation strategy must provide direction to the manufacturing leaders, take into
account the existing capabilities and competitive advantage of the plant (Ross et al., 2017). A successful
Digital Transformation strategy should consider the current state of the plants (“where they are”), the
future state (“where they need to be”) and how to get there (Ustundag & Cevikcan, 2018).

19
Even though manufacturing is on its way to being digital, it is important to know that changes are not
confined to the production floor (White et al., 2019). It requires a strong support from the upper
management that convince people about the advantages that this transformation can bring (Cimini et al.,
2017).
Without a clear digital strategy, it will be very difficult that the factories can achieve all the benefits that
this type of transformation involves.
Following the best practices for Digital Transformation strategies found in the literature, the goal of this
project is to recommend a certain roadmap for the BeverageCo plants attending similar idiosyncrasies. To
discover the similitudes and differences between plants, in Chapter 4, we analyzed the data from the
Scorecard data and the surveys.

20
4 DATA AND METHODOLOGY
This chapter presents the multiple research methodology approach used in this project. It includes the
methods for data gathering and data analyzing (Exploratory Factor Analysis and clustering) for both
Scorecard data (ERP Data) and surveys. This approach that will help to underpin the creation of the Digital
Transformation strategy for BeverageCo manufacturing plants.
4.1 Methodological Approach
This capstone project uses a multimethodological approach to analyze quantitative and qualitative data
that came from two different sources: BeverageCo’s ERP system and a survey carried out all the plants.
The methodology used is visualized in Figure 2. The first step was an extensive literature review and a
series of interviews with BeverageCo’s executives. In the second step, once the basic concepts about
Digital Manufacturing were established, two methodologies were developed; one for the Scorecard data
and other one for the survey. In the first methodology, data was gathered from the ERP system, was
analyzed through Exploratory Factor Analysis and then was clustered. In the second methodology, data
was gathered from a survey, designed by the authors and performed by BeverageCo’s plant managers.
The data from the survey was analyzed with Exploratory Factor and Cronbach Alpha analyses.
Finally, managerial recommendations for the next steps in BeverageCo’s Manufacturing Digital
Transformation were suggested considering the results from the cluster analysis and the survey. Each
cluster had a distinct set of recommendations that will be the basis for the roadmap of the Manufacturing
Digital Transformation strategy for BeverageCo’s plants.

21
Figure 2. Diagram of methodology steps. 4.1.1 Interviews
To understand the current situation of the sponsor company, the authors conducted semi structured
interviews with BeverageCo corporate executives, with more than 20 years of experience in
manufacturing and supply chain. The questions asked about the company’s manufacturing situation and
considerations for a Manufacturing Digital Transformation. The structure of the interview can be found in
Appendix A.
According to the interview responses, the main aspects to be considered for Manufacturing Digital
Transformation strategy are:
1. According to the executives, the level of automation of the plants will differentiate the approach to
the implementation of Digital Transformation. For example, some plants are 30 years old and
equipped with basic technology while other plants are 3 years old and have cutting-edge equipment.
Therefore, the technologies to be implemented (and the velocity of these implementations) cannot
be the same.

22
2. Aspects such as economy of the region, the situation of the market in the country, people’s
capabilities (some operators are engineers while others only attended high school), cultural
behaviors, operating models, supplier’s technology, SKUs produced and product life cycle will also
play a key role in the performance and therefore they must be considered when creating the Digital
Transformation strategy.
4.2 Scorecard Data
4.2.1 Data Collection
Considering that data from the majority of the plants is available for the last three years, data from 2017
to 2019 was collected from the sponsor’s ERP system. The gathered data provided quantitative
information of the performance on the manufacturing plants. The collected data covered 45 plants of the
52 plants because 3 plants are new acquisitions and they do not have information in the ERP system yet;
and 4 plants have an unusual operation because of the current situation in the country where they are
located.
For BeverageCo, the most relevant manufacturing Key Performance Indicators (KPIs) are shown in Table
1. The indicators cover the 8 areas related to manufacturing. The idea is to create a holistic view, so not
only were pure manufacturing indicators analyzed but also indicators from departments that contribute
to the good performance of production, such as Quality, Maintenance, and Human Resources.

23
Table 1. Manufacturing KPIs
Area Indicators Sustainability Water Use Ratio
Energy Use Ratio Quality CpK Compliance
Microbiology Index Sensory Index
Assets Management Maintenance Cost Loss points of efficiency
Safety Lost Time Incident Rate Work Fatalities
Manufacturing Cost to make Utilization Productivity Volume (Liters/Unit cases) Efficiency Losses SKUs
Human Resources Headcount Infrastructure Number of lines
Digital Manufacturing Digitalization
However, not all of the indicators were directly in the BeverageCo’s ERP System. Some of them are still
measured in Excel spreadsheets and they do not have the granularity needed (for example, safety
indicators are only available at country level). Consequently, these indicators were not considered for
further analysis.
During the interviews, BeverageCo executives mentioned that external factors such as economy of the
region and cultural behavior could affect the performance of the plants. Therefore, data from the
statistical entities of each country was gathered to determine the effect of these variables (see Table 2).

24
Depending on the countries and their national statistical entities, some indicators can be calculated by
region (for example, unemployment) while other indicators are reported only at the country level (like
GDP per person or rural population). Although regional indicators were desirable to compare the impact
of external factors within plants of the same country, most indicators are provided only at a country level.
However, this information is also useful, since it provides at least the possibility to compare the plants
from different nations.
Table 2. External factors
External Factors Unemployment rate [%] Employed labor/Total population [%] GDP per Person [USD/year] Minimum Wage [USD/month] Literacy Rate [%] Location of the plant [rural or metropolitan] Rural population [%]
4.2.2 Variable Selection
As shown in Table 1, BeverageCo uses several manufacturing variables (or KPIs) to control and monitor
the performance of the plants. However, some of these variables were not available for analysis or they
were not valid descriptors, so it was necessary to determine which ones were going to be used for
subsequent analyses.
The original dataset had 30 variables but some of these were highly correlated so they were discarded.
There were also variables that measure the same business feature but with different units, for example,
volume is measured in liters of beverage but also in unit cases (measurement unit created by BeverageCo),
so only one of these variables was chosen. The eight selected variables are shown in Figure 3.

25
Figure 3. Manufacturing final variables
Before Exploratory Factor Analysis was performed, the data was cleaned and standardize to scale
variables to have values between -1 and 1. During the cleaning process, it was noticed that data from 2017
and 2019 was incomplete, so only data from 2018 was considered for further analyses.
The KPI Efficiency was not included in the performance of the Exploratory Factor Analysis because it was
set as a target metric to validate clusters after the model outcome.
For the external factors, only two variables (out of the initial seven) were chosen: GDP per Person and
Literacy Rate (see Figure 4). Some variables were rejected since the calculation was not standardized
between countries and therefore not comparable. For example, Unemployment or the Employed
Labor/Total Population. In some countries, like Mexico, unemployment is not calculated with only the
official jobs, but also the informal works which are neither taxed nor monitored.
Figure 4. External factors
26
4.2.3 Research Methodology
Data analysis consisted of two main steps. In the first step, an Exploratory Factor Analysis (EFA) was
conducted to reduce the number of variables and linear combinations of the original set. In the second
step, a cluster analysis was performed to i) Define the number of possible groups of plants with similar
characteristics according to their performance (Manufacturing KPIs), using hierarchical clustering, and ii)
Refine the clusters solution through K-means cluster algorithm (Marodin et al., 2016).
According to Frank et al., (2019b), the final clusters should present high homogeneity within the cluster
and high heterogeneity between different clusters so descriptive analyses were performed also in order
to validate the final clusters.
All data analyses were performed with SPSS Statistics 26 Software.
4.3 Survey
4.3.1 Survey Design
Many robust frameworks to assess the diffusion of any innovation can be found in the literature, such as
the Technology Acceptance Model (TAM) (Davis et al., 1989), the Innovation Diffusion Theory (IDT)
(Rogers, 2003) or Technology – Organization – Environment (TOE) (Tornatzky & Fleischer, 1990).
Although all of these models could be suitable to assess the adoption of Digital Manufacturing within
BeverageCo, a deeper analysis reveals that TAM is primarily focused on technological aspects. It does not
consider the impact of organizations and neglects the human components in every implementation
(Agarwal & Prasad, 1998); (Venkatesh & Bala, 2008). Since one of the hypotheses of this capstone project
is that the organizational aspect must be always considered in the adoption of innovative technologies,
the TAM model is rejected.

27
Despite the fact that the IDT methodology already includes the organizational and technological
frameworks simultaneously, it does not include the external factors (Rogers, 2003). The company cannot
change these external factors, but it could be strongly affected by them. Since the plants of BeverageCo
are scattered across South America the external factors will vary extremely from plant to plant and could
also affect the adoption of Digital Manufacturing and therefore, the ID methodology is also rejected.
Alternatively, TOE includes all aspects mentioned above and it also has robust empirical support in
technologies included in the Digital Manufacturing context like Augmented Reality (Masood & Egger,
2019), 3D-printing (Yeh & Chen, 2018) and even Industry 4.0 (Arnold et al., 2018). Therefore, the TOE
methodology is used in this capstone project.
The TOE methodology is composed of 3 different constructs: technologies, organization and external
factors.
- The technological construct describes the current technologies implemented in the company as
well as the technologies not yet in place, but still considered important for the business and under
consideration (Baker, 2012).
- The organizational construct relates the structures, relations and boundaries of employees and
groups within the company. It could also contain the perception of the leadership and the
communication methodologies (Baker, 2012).
- The third construct is named “environment,” however this term could be easily misinterpreted.
To avoid confusion, this term was renamed “external factors”. It represents the external setting
of the company (Lippert & Govindarajulu, 2006). It usually refers to the external operational
moderators and inhibitors for the adoption of the technologies (Awa, 2016), the support
infrastructure for the technologies and the interactions with extern partners, like suppliers or
even governments (Baker, 2012).

28
4.3.2 Data Collection
The survey was developed in English and then translated into Spanish (by the authors) because the native
language of most respondents is Spanish. There were two preliminary assessments. First, the survey was
pre-tested with students in MIT Supply Chain Management Master’s program and BeverageCo employees.
Based on their feedback, the wording of some questions was modified and some questions were deleted
to ensure that the survey was understandable. After the changes, the survey was tested again and
approved by the sponsors.
The survey consists of 3 parts. The first seeks information about the location and some personal data
about the respondent (e.g. position in the company and number of years working for BeverageCo). The
second gives a brief explanation of Digital Manufacturing and asks the respondents about their knowledge
and opinion about different technologies commonly associated with Digital Manufacturing. The third part
contains questions regarding Digital Manufacturing and it is designed to assess the current level of
diffusion that these technologies already have. These questions are Likert-scale reaching from 1 (strongly
disagree) to 5 (strongly agree).
The survey was sent to the 52 bottling plants as well as the responsible executives in the regional divisions.
At each plant, five managers of diverse departments (manufacturing, maintenance, quality and human
resources) received the survey, generating a total of 250 possible respondents.

29
The survey provides an excellent opportunity to assess the opinion of the bottling plants on the benefits
and challenges associated with the implementation of Digital Manufacturing. Consequently, in addition
to the 3 constructs proposed in the TOE Framework (Technologies, Organization & External Factors), a
fourth construct named “Acceptance of technologies” was added to the survey (Figure 5).
Figure 5. TOE Framework.
More details about the definition of the constructs employed and the previous scholars works that we
used as a foundation to create the questions are summarized in
Table 3.

30
Table 3. Constructs for TOE framework Construct Description Based on
Expected benefits (EBen)
There is an expected benefit if the advantages of Digital Manufacturing surpass the negative effects of its implementation.
(Arnold et al., 2018)
Challenges (Cha)
The challenges associated with the implementation of Digital Manufacturing should be also considered.
(Arnold et al., 2018)
Compatibility (Compa)
Digital Manufacturing is considered a compatible methodology if it fits the processes and values of the company.
(Masood & Egger, 2019)
Ambidextery (Amb)
For a company to be ambidextrous requires to use both exploration and exploitation techniques.
(Yeow et al., 2017) (Hess et al., 2016)
Cyber Security (CS)
The capacity to protect the data and make the processes robust once the new technologies are implemented.
(Ichsan et al., 2017)
Training (Tra)
During and after the implementation of Digital Manufacturing employees must be educated in the use of the technologies associated with it.
(Gangwar et al., 2015)
Top Management Support
(TMS)
The role of Top Management could play and key role during the implementation and sustainability of Digital Manufacturing.
(Yeh & Chen, 2018)
Change Management (CM)
The change management construct measures the help of the organization while transitioning to the new processes and technologies.
(Pejic et al., 2017)
Techno-stress (TS)
Employees can experience stress influenced by new technologies and affect their job satisfaction and commitment to the organization.
(Ragu-Nathan et al., 2008)
Culture (Cul)
The culture and the values of the organization may contribute to adapt faster and easier the new methodologies and/ or technologies.
(Gangwar et al., 2015)
Competitors (Compe)
The adoption of Digital Manufacturing could be also affected if the competitors are more willing to invest in such technologies.
(Jia et al., 2017)
External support (ESup)
If there is a perceived outside support (from headquarter & governments), Digital Manufacturing is more likely to be implemented.
(Arnold et al., 2018)
Integration with SC (ISC)
The goal is to measure the degree of collaboration All stakeholders along the supply chain.
(Flynn et al., 2010)

31
4.3.3 Research Methodology
In order to validate the model, the methodology used was the one recommended in Arnold et al. (2018):
1. Validation of the applied constructs with the Exploratory Factor Analysis (EFA).
2. Validation of the reliability of constructs calculating the Cronbach’s alpha.
3. Assessment of multicollinearity between the dependent constructs.
4. Multiple linear regression to assess the impact of the independent factors on “Adoption of
technologies”, measuring the willingness of employees of BeverageCo to adopt the
technologies of Digital Manufacturing.
Also, as in Section 4.2.3, all data analyses were performed with SPSS Statistics 26 Software.
Considering the methodology described before, the following Chapter 5 presents in detail the results
obtained from the analysis of the Scorecard data and the survey in order to support the digital
manufacturing strategy for BeverageCo.
32
5 RESULTS AND ANALYSIS This chapter presents the results and analysis of the Scorecard data and survey.
5.1 Scorecard Data
5.1.1 Exploratory Factor Analysis Results
Exploratory factor analysis (EFA) was performed using varimax rotation to extract the orthogonal
components. This method was used both for Scorecard data and external factors.
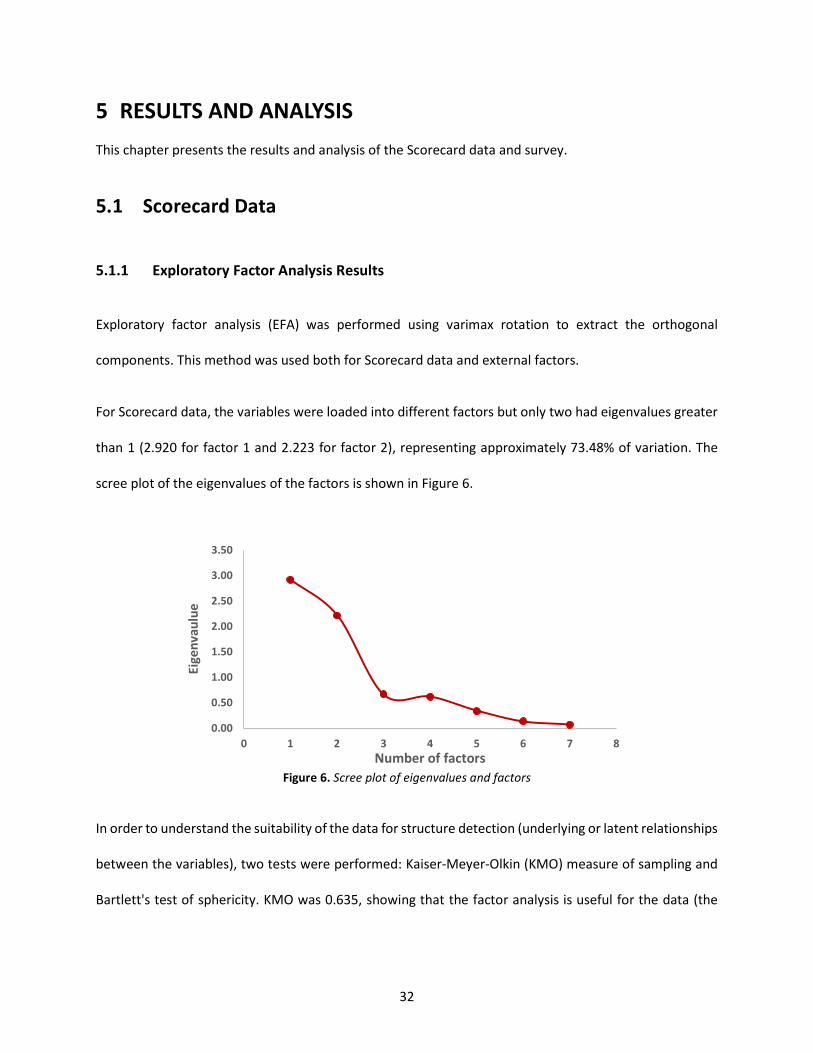
For Scorecard data, the variables were loaded into different factors but only two had eigenvalues greater
than 1 (2.920 for factor 1 and 2.223 for factor 2), representing approximately 73.48% of variation. The
scree plot of the eigenvalues of the factors is shown in Figure 6.
Figure 6. Scree plot of eigenvalues and factors
In order to understand the suitability of the data for structure detection (underlying or latent relationships
between the variables), two tests were performed: Kaiser-Meyer-Olkin (KMO) measure of sampling and
Bartlett's test of sphericity. KMO was 0.635, showing that the factor analysis is useful for the data (the
0.00
0.50
1.00
1.50
2.00
2.50
3.00
3.50
0 1 2 3 4 5 6 7 8
Eige
nvau
lue
Number of factors

33
variance in the variables is not caused by underlying factors); Bartlett’s level of significance was 0.000,
demonstrating that the variables are related and therefore suitable for structure detection.
According to these results, factor 1 includes liters of beverage, changeovers, utilization and SKUs, while
factor 2 is composed by SKUs, productivity and fixed costs. Because of this composition, factor 1 was
renamed Complexity and factor 2 Expenses. The loading factors of each variable in both of factors are
shown in Table 4.
The finding that SKUs was in both factors, although with different loading factors (0.7 for Complexity
Factor and 0.6 for Expenses factor), was expected because one of the major drivers for complexity is the
number of SKUs that a plant has. At the same time, it is a significant driver for expenses because with
more SKUs, it will require more storage space, suppliers and labor cost. Moreover, it could increase excess
and obsolescence inventory provisioning.
Also, it is important to mention that in the Expenses factor, productivity has a loading factor of -0.923.
This negative sign was also expected because productivity and expenses have a negative correlation (if
one variable increases, the other decreases). For example, if productivity is low, the expenses will be
higher.
Table 4. Factor matrix for Scorecard data
Scorecard Data
Variables Factors
1 - Complexity 2 - Expenses Liters of Beverage 0.938 Changeovers 0.674 Utilization 0.717 Digitalization 0.690 SKUs 0.700 0.614 Productivity -0.923 Fixed Costs 0.929

34
Analogously, for external factors, the analysis resulted in one single factor with an eigenvalue of 1.852
and a percent of variance explained of 92.624%. KMO was 0.500 and Bartlett’s level of significance was
0.000, showing that the data is suitable for structure detection. The results are shown in Table 5.
Considering that there was only one factor and it evaluated the external factors of each plant, this factor
was renamed External Factor.
Table 5. Component matrix for external factors
External Factors
Variables Factor
1 – External GDP per person 0.962 Literacy Rate 0.962
5.1.2 Clustering Analysis Results
Clustering methodologies are used to discover similarities between data items and grouping them
according common characteristics into several categories, known as clusters (Milligan & Cooper, 1985).
The clustering analysis was used to divide the total amount of 45 bottling plants into smaller groups with
similar characteristics. As done by Frank et al., (2019) the first step in the cluster analysis was using
hierarchical cluster analysis (HCA) to determine the adequate number of clusters for the data followed by
the use of K-means cluster algorithm for the refinement of the cluster solution.
The main advantage of hierarchical clustering is that is not necessary to assume the number of clusters.
Hierarchical cluster analysis was performed using Ward’s method with the Euclidean distance as the
measure of similarity. To perform it, the three factors found in the Exploratory Factor Analysis
(Complexity, Expenses and External) were used.

35
To visualize the analysis a dendrogram was created (see Figure 7). The dendrogram represents the
similarities between plants based on the factors previously mentioned.
Figure 7. Dendrogram for number of clusters selection
As it shows, the plants can be grouped into three to six main clusters. Considering that the number of
groups of plants should be sufficient to be differentiated but also not too numerous, so the groups can
still count with representativeness, the number of clusters that seemed appropriate was five. With 3 and
4 clusters, the dendrogram does not show a significant difference, while with more than 5 clusters, the
differences between groups would be significantly reduced and would provide less insights to
BeverageCo.
To confirm that the classification using the five clusters represented the best solution, k-means analysis
was performed for k ranging from 3 to 6. K-means clustering is one of the most used algorithms in research
and together with the hierarchical clustering can overcome one of its major disadvantages, the necessity
to define the appropriate number of clusters.

36
The results of performing k-means with the three factors Complexity, Expenses and External for different
numbers cluster are shown in Table 6.
Table 6. K-means with k=3 to k=6
k Cluster 1 Cluster 2 Cluster 3 Cluster 4 Cluster 5 Cluster 6 3 24 plants 19 plants 2 plants
4 19 plants 8 plants 2 plants 16 plants
5 14 plants 2 plants 10 plants 11 plants 8 plants
6 12 plants 3 plants 2 plants 12 plants 8 plants 8 plants
Performing a composition analysis of the clusters for k=3 to k=6, confirmed that the ideal number of
clusters for BeverageCo plants was five because with k=5, dissimilarities between plants can be captured
and also the clusters formed were the ones that made good business sense due to business usability and
actionability. For example, cluster 5 is composed of 8 plants that produce only drinking water and have
only 1 or 2 SKUs. Before doing clustering analysis, these plants were identified as “bottled water plants”
so it was expected that these plants would be grouped together during clustering. However, this cluster
is only formed when k is equal to 5. This is explained with more details in Section 5.1.3.
After determining the appropriate number of clusters, it was necessary to evaluate if the final clusters
presented high heterogeneity between the different clusters and high homogeneity within the cluster. In
order to accomplish this, the graphical representations of the clusters were analyzed.
The first step was to graph the possible combinations of factors (Complexity-External, Expenses-External
and Complexity-Expenses) for all clusters (see Figure 8). As it shows, all clusters except for Cluster 2, are
centered at 0 on the x-axis.

37
Also, in the graphs External vs. Expenses and External vs. Complexity, Cluster 2 is away from the others,
indicating that this cluster is an outlier. This cluster is composed by two plants that do not belong to none
of the other clusters because of their correlation with the external factor.
Figure 8. Representation of clusters within the 3 factors in 2D
Figure 9 shows the graphical representation (3D) of the five clusters for the three factors. It clearly shows
that the clusters are separated and they are not overlapping with each other (they are heterogeneous).
Also, it can be identified that cluster 2 lies significantly outside the other clusters, confirming that this
cluster is an outlier as it was mentioned before.

38
Figure 9. Representation of clusters within the 3 factors in 3D
The second step was to characterize the clusters based on the final centers. We used ANOVA comparison
test in order to identify significant differences among clusters. Table 7 shows descriptive statistics (mean
and standard deviation values) and ANOVA results for each factor (Complexity, Expenses and External) for
the clusters. For example, while Cluster 3 is characterized by the highest level of complexity, Cluster 5 is
characterized by the lowest level of complexity. This is explained with more details in Section 5.1.3.
Table 7. Descriptive analysis of the clusters
Mean (SD) of cluster group CLUSTER 1 CLUSTER 2 CLUSTER 3 CLUSTER 4 CLUSTER 5 F (ANOVA)
Complexity 0.465 (0.302)
0.153 (0.042)
1.199 (0.369)
-0.711 (0.394)
-1.372 (0.528) 64.351*
Expenses 0.401 (0.397)
0.997 (0.469)
-0.669 (0.448)
0.949 (0.48)
-1.419 (0.642) 37.477*
External 0.187 (0.531)
-4.142 (0.47)
0.289 (0.304)
-0.004 (0.478)
0.352 (0.227) 49.689*
*Significant at p < 0.001
- Intermediate Complexity and Expenses- Outlier- High Complexity- High Expenses- Low Complexity and Expenses

39
Also, a comparison of performance outcomes among the clusters was done. In order to do this, ANOVA
comparison test was performed again. Table 8 shows descriptive statistics and ANOVA test results for the
performance outcome chosen (efficiency).
Table 8. ANOVA
Cluster 1 Cluster 2 Cluster 3 Cluster 4 Cluster 5 F (ANOVA) Efficiency -0.69
(0.44) -1.24 (0.11)
-0.16 (0.6)
0.06 (0.69)
1.62 (0.6) 1.809*
* Significant at p < 0.1 5.1.3 Clusters Composition Analysis
With the clustering results in hand, it became clear that even though each plant has certain particularities,
they could be classified in groups that can be used in the industry and are statistically valid. Based on the
results, BeverageCo plants can be grouped in 5 clusters. However, one of these clusters (Cluster 2) is an
outlier so this cluster was not considered for further analyses.
Cluster 1, which comprises 14 plants, is characterized by intermediate levels of complexity and expenses.
The plants included in Cluster 1 do not have the highest values in neither of the factors but they do not
have the lowest values either. From the industry point of view, these plants have a good overall
performance but they do not possess high levels of automation, although; some of them are working on
this.
Cluster 2, the outliers, is composed of only 2 plants that have in common a strong negative correlation
with the External Factor (composed by GDP per Capita and Literacy Rate variables). This result, although
unexpected, is logical because these plants are located in less developed countries (comparing to the
other ones where BeverageCo has a presence), proving the high impact that the external factors has.
Cluster 3, with 10 plants, is characterized by the highest levels of complexity. This group is consistent with
the industry perspective because these plants have several production lines and the highest production

40
volumes of the system. Because of this, most of the plants in this cluster are highly automated (specially
the new ones) and have adopted, or at least implemented, some technologies of Industry 4.0.
Cluster 4, composed of 11 plants, is characterized by the highest levels of expenses. From an industry
point of view, this cluster has medium-size plants, with SKUs that are not very profitable and require
special lines to produce them. This cluster has basic level of automation and a moderate overall
performance.
Finally, Cluster 5, which comprises 8 plants, is characterized by the lowest levels both in complexity and
expenses. This group is composed of plants that only produce drinking water in a specific package called
a jug (only two plants produce also in PET plastic bottles) and have fewer complex operations. In fact, the
majority of these plants have only 1 SKU, need less people to operate and their volumes are low. Since
bottled water is less profitable than other BeverageCo products, the company is more concerned about
investment and the plants are still not automated. However, and since these plants do not have
changeovers, these bottling plants are very efficient.
5.2 Survey
5.2.1 Survey Results
We obtained 149 complete responses from a total of 245 surveys sent to the 52 bottling plants,
representing a response rate of 61%. The survey was created and tested in an open platform and sent to
all respondents by an executive of the corporate team. The initial email included a description of this
project, the purpose of the survey and a claim to their participation, explaining that the understanding of
the organization is essential for this project and for the development of the Digital Manufacturing
strategies for the bottling plants.

41
The first part of the survey asked the participants about their personal information and their location.
Table 9 shows the composition of the surveys regarding country, position of the respondents and years
that they have been working for BeverageCo.
Table 9. Demographic composition of the survey results
Country Number Response rate Position Number %
Years in the company Number %
Argentina 6 55% Director 6 4% 1 – 3 16 11% Brazil 9 36% Manager 56 38% 3 – 5 8 5%
Colombia 28 48% Leader 58 40% 5 – 10 26 18% Costa Rica 5 56% Other 26 18% 10 – 15 24 16%
Guatemala 19 90% 15 – 20 32 22% Mexico 58 71% 20 – 25 25 17%
Nicaragua 3 38% 25 – 30 11 8% Panamá 6 75% more 30 4 3% Uruguay 3 43%
Venezuela 9 56% Total 146 60%
The second part of the survey asked the respondents about their knowledge of Digital Manufacturing
technologies and their opinion about the benefits of implementing these technologies. Results are
summarized in Table 10.
Table 10. Analysis of technologies
Number Media Std Dev Number
% Do not know the technology
Additive Manufacturing 109 3.98 0.948 37 25% Artificial Intelligence 116 4.20 0.949 30 21%
Augmented Reality 100 4.11 0.871 43 30% Automation 141 4.67 0.846 5 3%
Blockchain 49 3.98 0.958 97 66% Cloud Computing 131 4.49 0.868 15 10%
Data Analytics 135 4.64 0.837 11 8% Digital twin 52 4.25 0.998 94 64%
Internet of Things 109 4.29 0.912 37 25% Machine Learning 102 4.51 0.789 40 28%
Robotics 124 4.51 0.884 22 15% Cybersecurity 129 4.52 0.855 16 11%

42
Before analyzing more deeply the results of the survey, two general tests were performed to assess two
possible biases: late potential bias and position potential bias.
The survey was sent to BeverageCo employees on March 11, 2020. Due to the evolution of the Covid-19
pandemic, on March 14, 2020, BeverageCo decided that all employees whose tasks could be done from
home, will continue their work from their houses and not from the BeverageCo facilities. This unexpected
situation and their uncertain consequences could lead to biased answers to the survey and therefore; we
wanted to test if the bias could be confirmed.
We split the answers into two groups: the early respondents (from March 11 to March 13) and late
respondents (from March 14 to March 31). The results in Table 11 show p-values bigger than 0.05 for the
four constructs; consequently, we cannot reject the hypothesis that the means were the same.
Table 11. Survey results for early and late respondents
Construct Group Number Mean Standard Deviation t p-value
Expected Benefits Early 46 4.420 0.523 1.363 0.176 Late 103 4.288 0.598
Challenges Early 46 4.327 0.446 0.389 0.698 Late 103 4.286 0.594
Adoption of technologies
Early 46 3.422 0.640 -0.129 0.898 Late 103 3.437 0.626
Organization Early 44 3.457 0.593 -0.630 0.531 Late 99 3.521 0.485
External factors Early 46 3.457 0.615 -0.286 0.776 Late 101 3.488 0.594
The survey was answered by people working at the bottling plants as well as people in corporate
departments. We defined that a respondent belongs to the corporate group if the person works in the
headquarter; either the headquarter of the company in Mexico or the country group leading the
operations in some of the regions where BeverageCo has presence. We wanted to identify if the answers

43
from corporate are statistically different from the answers coming directly from the bottling plants. The
results of the tests are shown in Table 12.
All constructs (except Organization) have a p-value below 0.05; therefore, the null hypothesis can be
rejected and we can conclude that the assessment of corporate and bottling plants employees is
statistically different for these four constructs. This means that the perception of Digital Manufacturing
for people working at a more operative level is different than the perception of people working in the
central departments of the country or even region.
Table 12. Results survey for corporate and non-corporate respondents
Construct Group Number Mean Standard Deviation t p-value
Expected Benefits Corporate 25 4.040 0.778 -2.143 0.041 Bottling plant 105 4.391 0.518
Challenges Corporate 25 4.020 0.696 -2.275 0.030 Bottling plant 105 4.355 0.491
Adoption of technologies
Corporate 25 3.1429 0.498 -2.892 0.006 Bottling plant 105 3.484 0.649
Organization Corporate 25 3.441 0.473 -.702 0.487 Bottling plant 105 3.518 0.556
External factors Corporate 25 3.229 0.594 -2.335 0.026 Bottling plant 105 3.543 0.595
5.2.2 Exploratory Factor Analysis Results
With the data from the survey also an EFA analysis was performed. The initial run of EFA consisted on
loading all the variables of the model. However, the results were not as consistent with the model that
we have planned and so much noise was introduced in the methodology. Consequently, we performed
several smaller EFAs including only the questions from the related constructs.
We performed the first EFA with the construct “Expected benefits”. The validation of the construct is
carried out with the Cronbach’s alpha. It is commonly considered that the good reliability of a construct
is validated it alpha is equal or bigger than 0.7 (Nunnally & Bernstein, 1994). In this case, although the

44
value is at the limit, but we could consider that the alpha is big enough and therefore, the construct
“Expected benefit” is considered valid.
Table 13. EFA results for construct “Expected Benefits”
Questions Expected Benefits Cronbach’s α 0.699
Expected Benefit 1 0.840 Expected Benefit 2 0.768 Expected Benefit 3 0.762
Analogously, an EFA was performed for the construct “Challenges”. In this case the Cronbach’s alpha is
bigger than 0.7; and therefore, the reliability of the construct is also valid.
Table 14. EFA results for construct “Challenges”
Questions Challenges Cronbach’s α 0.794 Challenges 1 0.714 Challenges 2 0.791 Challenges 3 0.838 Challenges 4 0.827
Next, the initial constructs “Compatibility”, “Ambidexterity” and “Cyber Security” are grouped in a
common construct named “Adoption of technologies”. Since the three initial constructs are related, we
decided to perform the EFA with a single construct. The Cronbach’s alpha is also greater than 0.7,
validating the reliability of the construct.

45
Table 15. EFA results for constructs in “Adoption of technologies”
Questions Adoption of technologies
Cronbach’s α 0.822 Compatibility 1 0.609 Compatibility 2 0.514 Compatibility 3 0.540
Ambidexterity 1 0.759 Ambidexterity 2 0.837 Cyber Security 1 0.486 Cyber Security 2 0.610
For the constructs included in the category “Organization”, we decided to organize the constructs
according to their conceptual meaning. “Training” and “Culture” (see Table 16) were considered together
as they aimed to measure the willingness of both employees and the whole organization to adopt Digital
Manufacturing. Separately, the role of change and evolution and its relation with the management level
are considered in another group (
Table 17). The first question in the construct “Techno stress” has a loading factor below 0.4 and therefore,
it was eliminated for the following analysis. However, all Cronbach’s alphas are greater than 0.7 and the
reliability of the constructs is valid.
Table 16. EFA results for constructs in “Organization I”
Questions Training Culture Cronbach’s α 0.796 0.816
Training 1 0.410 Training 2 0.987 Training 3 0.650 Culture 1 0.746

46
Culture 2 0.728 Culture 3 0.823
Table 17. EFA results for constructs in “Organization II”
Questions Top Management
Support Change
Management Techno stress Cronbach’s α 0.885 0.776 0.744
Top Management Support1
0.809
Top Management Support 2
0.818
Top Management Support 3
0.834
Top Management Support 4
0.768
Change Management 1 0.793 Change Management 2 0.860 Change Management 3 0.541
Techno Stress 1 Techno Stress 2 0.650 Techno Stress 3 0.704 Techno Stress 4 0.782
Finally, all constructs related with the “External Factors” were considered to perform the last EFA. For this
analysis the question 3 of the construct “External Support” had a loading factor smaller than 0.4 and
therefore this question was eliminated for further analysis. Moreover, the remaining 2 questions of
“External Support” (see Table 18) were loaded together with the questions from “Integration of Supply
Chain”. Accordingly, the factor was named “External factors”. The question from the construct
“Competitors” loaded in the same factor, but the Cronbach’s alpha was smaller than 0.7; therefore, the
construct “Competitors” was eliminated for the subsequent analysis.

47
Table 18. EFA results for constructs in “External Factors”
Questions External factors Competitors Cronbach’s α 0.874 0.555
Competitors 1 0.780 Competitors 2 0.586 Competitors 3 0.710
External Support 1 0.453 External Support 2 0.610 External Support 3
Integration of Supply Chain 1
0.833
Integration of Supply Chain 2
0.871
5.2.3 Regression Results
The model remains like shown in Figure 10. A regression analysis was performed to determine the
contribution of each construct to the dependent construct, the “Adoption of technologies.”
Before carrying out the regression models, we tested the collinearity of the constructs. The results can be
found in Table 19. There are two pairs “Expected benefits – Challenges” and “Technostress – Culture” with
a coefficient greater than 0.6; which could mean moderate collinearity between the constructs. However,
the VIF in Table 20 shows values below 5; indicating that the multicollinearity between the constructs
could be disregarded (Belsey et al., 2005)

48
Table 19. Correlation coefficients 1 2 3 4 5 6 7 8 9
1 -Adoption of technologies 1
2 - Training 0.565* 1 3 – Top
Management Support
0.480* 0.397* 1
4 – Change Management 0.593* 0.574* 0.437* 1
5 – Techno stress -0.065 -0.114 0.151 0.041 1 6 – Culture 0.467* 0.369* 0.647* 0.461* 0.258* 1
7 – Expected benefits 0.064 -0.022 0.131 -0.034 0.065 0.086 1
8 – Challenges 0.182 0.034 0.140 0.033 -0.001 0.102 0.702* 1 9 – External
factors 0.550* 0.488* 0.340* 0.453* 0.040 0.311* 0.147 0.067 1
*Correlation is significant at the 0.01 level (2-tailed)
A regression analysis was performed to validate the model of the survey. In the first step it was assessed
the direct effect of the five organizational constructs in the adoption of technologies. In the second model,
we included the constructs “Expected Benefits” and “Challenges”. In the third step we included as well
the “External Factor” construct with the variables of External Support and Integration of Supply Chain.
Finally, in the fourth model, we assessed the moderating effect that the “External Factors” have in the
“Expected Benefits” and “Challenges” for the adoption of Digital technologies.
The results of the regression analysis (see Table 20) shows a significant direct relationship between the
constructs of organization and the adoption of technologies. Adding the constructs “Expected Benefits”
and “Challenges” slightly improved the predictive power of the model. In the third step, when the
“External factors” were included, the R2 improved again significantly, proving that the “External factors”
also contributed to the adoption of the technologies. Finally, the interaction of the external factors within
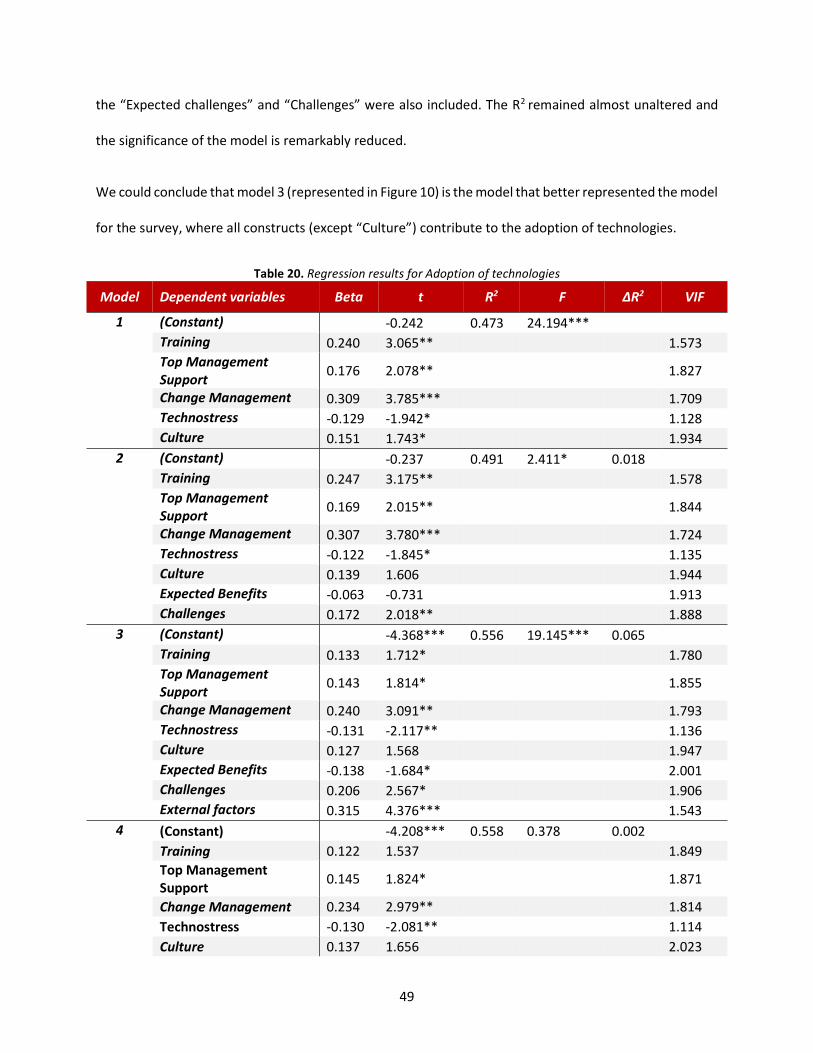
49
the “Expected challenges” and “Challenges” were also included. The R2 remained almost unaltered and
the significance of the model is remarkably reduced.
We could conclude that model 3 (represented in Figure 10) is the model that better represented the model
for the survey, where all constructs (except “Culture”) contribute to the adoption of technologies.
Table 20. Regression results for Adoption of technologies
Model Dependent variables Beta t R2 F ΔR2 VIF
1 (Constant) -0.242 0.473 24.194*** Training 0.240 3.065** 1.573 Top Management
Support 0.176 2.078** 1.827
Change Management 0.309 3.785*** 1.709 Technostress -0.129 -1.942* 1.128 Culture 0.151 1.743* 1.934
2 (Constant) -0.237 0.491 2.411* 0.018 Training 0.247 3.175** 1.578 Top Management
Support 0.169 2.015** 1.844
Change Management 0.307 3.780*** 1.724 Technostress -0.122 -1.845* 1.135 Culture 0.139 1.606 1.944 Expected Benefits -0.063 -0.731 1.913 Challenges 0.172 2.018** 1.888
3 (Constant) -4.368*** 0.556 19.145*** 0.065 Training 0.133 1.712* 1.780 Top Management
Support 0.143 1.814* 1.855
Change Management 0.240 3.091** 1.793 Technostress -0.131 -2.117** 1.136 Culture 0.127 1.568 1.947 Expected Benefits -0.138 -1.684* 2.001 Challenges 0.206 2.567* 1.906 External factors 0.315 4.376*** 1.543
4 (Constant) -4.208*** 0.558 0.378 0.002 Training 0.122 1.537 1.849 Top Management
Support 0.145 1.824* 1.871
Change Management 0.234 2.979** 1.814 Technostress -0.130 -2.081** 1.114 Culture 0.137 1.656 2.023

50
Expected Benefits -0.121 -1.377 2.266 Challenges 0.202 2.404** 2.082 External factors 0.307 4.189*** 1.578 Expected
Benefits*External Factors
0.052 0.519 2.988
Challenges*External Factors 0.005 0.055 2.775
*Significant at p < 0.10 **Significant at p<0.05 ***Significant at p<0.001
Figure 10. Representation of survey constructions
Finally, we checked if the assessment of the plants belonging to different clusters had some statistical
differences (details in Table 21). Since cluster 2 was an outlier, it was not considered in this analysis. In
general, there were minor or no differences between the assessment of the different clusters. However,
we could conclude that people working at plants in clusters 3 and 4 assess different 6 out of 9 constructs
in the model.

51
Table 21. Differences between clusters
Construct 1-3 1-4 1-5 3-4 3-5 4-5
t t t t t t Expected Benefits -0.931 1.031 -3.631** 1.830* -2.726** -4.207**
Challenges -0.959 1.241 -1.293 2.038** -0.807 -1.920 Adoption of
technologies -0.973 1.274 -0.250 2.269** 0.312 -1.084
Training -1.773 0.030 0.124 1.673 1.051 0.104 Top
Management Support
-1.031 1.415 -0.672 2.241** -0.155 -1.428
Change Management 0.286 1.271 0.163 1.032 0.061 -0.351
Technostress 0.511 0.428 -0.977 -0.103 -1.229 -1.190 Culture -1.799 1.276 -0.680 2.906** 1.131 -1.903*
External factors -1.313 1.571 -1.346 2.505** -0.271 -2.411** *Significant at p < 0.10 **Significant at p<0.05
5.2.4 Survey Analysis
The survey was sent to 245 employees of BeverageCo working in 10 different countries and we obtained
149 complete responses; what made a response rate of 60%. Most of the respondents worked in a
Manager or Leader position (78%) and more than 80% of the respondents have been working for the
company more than 5 years as could be seen in Table 9. Therefore, we could consider that the results of
the survey reflected a deep knowledge of the company and the FMCG industry.
However, the assessment is not consistent for all group of employees. As shown in Table 12, the
perception of Digital Manufacturing for people working at a more operative level is different than the
perception of people working in the central departments of the country or even region. This finding could
be especially relevant when the new Digital Manufacturing strategy is designed.
In general terms, BeverageCo employees are familiar with most of the technologies related with Digital
Manufacturing (see Table 10). The technologies they considered would be more beneficial in BeverageCo
are Automation, Cloud Computing and Data Analytics. More than 80% of the employees agree or totally

52
agree with the statement that the implementation of these technologies would be beneficial for the
company. The more unknown technologies are Blockchain and Digital Twin. This finding provides a
guidance of which technologies could be “easier” to implement and for which technologies a deeper
training and analysis is necessary.
As it was mentioned in Section 5.2.2, after performing EFA analysis and calculating the Cronbach’s Alpha,
only 9 constructs remained statistically relevant. The resulting model and the results per clusters were
used to build the Digital Manufacturing strategy recommendations in Section 6.1.1.

53
6 MANAGERIAL RECOMMENDATIONS
This chapter discusses the results of clustering the BeverageCo plants and survey analyses and offers
managerial recommendations that the company should consider for the creation of their Manufacturing
Digital Transformation strategy.
This capstone project is based on the premise that BeverageCo is already involved in a Digital
Transformation journey. Therefore, the company already has a holistic vision for the manufacturing digital
transformation. For this reason, the recommendations described in this chapter are not starting with the
creation of digital transformation vision and objectives as the literature suggests (Albukhitan, 2020).
However, it relies on the vision already created by BeverageCo executives.
Following the framework used along throughout this document, TOE (Technology – Organization –
External factors), the recommendations in this chapter will be structured using these three factors. These
three factors were evaluated through the survey and the Scorecard data. The recommendations
considered results from both Scorecard data and survey.
6.1.1 General Recommendations
In general, according to the survey results, the way BeverageCo employees perceived Digital
Manufacturing and its benefits is satisfactory. As seen in Figure 11, for the questions related to the
expected benefits of Digital Manufacturing, most employees agree with the statements that Digital
Manufacturing will provide cost reduction, better use of resources, and increase the flexibility at
production. However, there are some improvement opportunities that BeverageCo should consider if the
company aims to pursue a successful Digital Manufacturing Transformation.

54
Figure 11. Results expected benefits of Digital Manufacturing
Organization
For the organization factor, one of the biggest improvement opportunities in Digital Manufacturing, that
is common for all clusters, is training. As mentioned in Section 5.2, the construct “training” was composed
of three questions to measure employee’s perception of BeverageCo training programs for Digital
Manufacturing. According to the results on the training construct (see Figure 12), only 27% of employees
totally agree or agree with the statement that the company has training programs for Digital
Manufacturing. Moreover, the percentage of people that consider that they are getting the effective
training they need is further reduced to 22%.
Figure 12. Results of training questions
0
10
20
30
40
50
60
70
80
90
100
Totally disagree Disagree Neutral Agree Totally agree
Freq
uenc
y
Cost Reduction Better use of resources Increase flexibility at production
0% 10% 20% 30% 40% 50% 60% 70% 80% 90% 100%
I am getting training
There is training programs
Totally agree Agree Neutral Disagree Totally disagree

55
Based on interviews with BeverageCo executives, this finding is aligned with the initial strategy that
BeverageCo had for Manufacturing Digital Transformation, where only the employees that were going to
use new technology were trained. The training programs were not for all the employees; thus, the Digital
Manufacturing capabilities are not built yet. For this reason, BeverageCo should consider first create a
training program for all their manufacturing employees with the basic concepts of Digital Manufacturing,
making faster the adoption of new processes and technologies in the future. According to Albukhitan
(2020), without relevant knowledge, the introduction of new technology alone is not enough to make it
work. Therefore, the enhancement of employee’s knowledge is a key element for the integration of Digital
Manufacturing technologies.
Another improvement opportunity found through the survey was related to the “techno-stress”
construct. Although employees stated that the use of Digital Manufacturing technologies fits their
organization culture and that top management supports the adoption of Digital Manufacturing, they also
think they are forced to change their work habits to adopt to Digital Manufacturing technologies. This is
not what Manufacturing Digital Transformation aims to achieve. A core benefit of Digital Manufacturing
is to ease employees’ work so that people can invest their time in activities that add value to the company.
This finding is also related to past Digital Manufacturing experiences. Previous Digital Manufacturing
technologies implemented in BeverageCo were not simple to implement, where employees stuck with
the idea that Digital Manufacturing technologies are not easy to adopt. Therefore, BeverageCo should
consider a change management program (with successful internal examples) for its employees to show
that Digital Manufacturing technologies are convenient to use. It is normal that people have resistance to
change. However, once BeverageCo can reset and retest their employees, it could create an opportunity
to improve employee status and cost savings.
56
External Factors
From BeverageCo employees’ general perspective, the construct “Integration with Supply Chain Partners”
should be improved. Employees think that the company should be working more closely with both
customers and suppliers for the implementation of technologies of Digital Manufacturing. This should also
be pursued in the Digital Manufacturing Transformation strategy that the company aims to create.
Additionally, it is important to mention that the external factors were also considered in the cluster
analysis, using the official statistics published by government agencies for each country where BeverageCo
has presence, so the resulting clusters have already included the weight of this factor.
Technology
From the survey results, there are two main improvement opportunities for the implementation of Digital
Manufacturing technologies that are common to all clusters: IT infrastructure and Digital Manufacturing
physical integration. Only 30% of the employees believe that the company has built an IT infrastructure
that supports the implementation of Digital Manufacturing and the percentage of employees that
consider that the physical integration of Digital Manufacturing would be straightforward is barely 17%.
For these reasons, Digital Manufacturing Transformation strategy should analyze first the current IT
infrastructure of the plants and, depending on the case, try to leverage it in the facilities where it is
needed. According to Albukhitan (2020), this step should be done by a dedicated group of digitally
qualified experts and a specialized leadership to ensure a successful transformation.
Nevertheless, the responsibility for digital technologies introduction should be a shared goal by the whole
organization and not limited to few employees or departments. This is important to mention because in
previous implementations, the responsibility was exclusively of one department (Center of Excellence of
Manufacturing); therefore, employees did not develop accountability for the technologies implemented.
57
It is important to remark that some digital technologies are already implemented in certain bottling plants.
We described the maturity of these digital technologies with the variable Digitalization as it was described
in Section 4.2.2. However, this Digitalization level has yet no impact on the Efficiency of the plants. As it is
shown in Table 8 there is no statistical difference on efficiency independently on the Digitalization level
of the plants. This unexpected result confirmed that previously efforts in the implementation of digital
technologies did not provide the expected results.
6.1.2 Recommendations by Cluster
Although, Digital Transformation is driven by the advent of digital technologies, if the organization is not
ready, the Digital transformation will fail. In order to prevent this, the current strengths and weaknesses
for each cluster were analyzed. The recommended focus and technologies proposed are based on our
literature research, understanding of Digital Transformation efforts and knowledge of BeverageCo.
As shown in Table 22, the proposed strategy for Clusters 1, 3 and 5 is focused on digital technologies that
could help the bottling plants to improve their capabilities and achieve their digital vision. However, for
Cluster 4, the main focus we proposed should concentrate on the organization factor, specifically in the
“culture” construct.
As it was mentioned previously, Cluster 2 was considered as an outliner and it represented only two
bottling plants, its statistical results were not conclusive and therefore, was not included in this analysis.
A detailed description of the different Clusters and their main characteristics was provided in Section
5.1.3. Taking into consideration these business characteristics, the Scorecard data and the results of the
surveys specific managerial recommendations are proposed for each cluster.
58
Cluster 1 – Intermediate complexity and expenses
Cluster 1 strengths are “ambidexterity”, “compatibility” (included in “adoption of technologies”) and
“change management”. Plants from Cluster 1 consider that 1) the company is working for the
identification, exploring and implementation of Digital Manufacturing technologies, 2) the physical
integration of Digital Manufacturing will be straightforward, and 3) they have available change managers,
documentation and support once a new Digital Manufacturing technology is introduced. However,
employees also feel threatened of losing their job because of the adoption of new technologies (“techno-
stress”). According to this, BeverageCo strategy for this cluster must be based on a transparent and
effective communication so that they can get employees motivated about the potential of new
technologies. Knowing that managers in this cluster are engaged with Digital Manufacturing, they can pass
high commitment onto employees as part of the digital transformation process.
Likewise, Cluster 1 plants believe that the adoption of Digital Manufacturing technologies will increase
production flexibility. As mentioned previously, Cluster 1 has an intermediate complexity, therefore, the
implementation of technologies that could help them reduce complexity and increase flexibility must be
the main objective for them. Cluster 1 could start implementing Automation and Internet of Things (IoT),
therefore, they can have more data available, and start using big data analytics for their processes.
Cluster 3 – High Complexity
Cluster 3 is prepared for more advanced Digital Manufacturing technologies due to its levels of
automation and people readiness. Plants from Cluster 3 have strengths such as “top management
support” and “culture” that show that they are ready for biggest challenges. For example, they believe
that the use of Digital Manufacturing technologies is consistent with business practices, as well as fitting
the organizational culture (DNA KOF). They also consider that the adoption of Digital Manufacturing will

59
help them attain their competitive advantage and that top management is willing to take risks in this topic.
Although they think that the physical integration of Digital Manufacturing would not be straightforward,
this can be managed in the Digital Manufacturing strategy.
Plants in Cluster 3 have already implemented some digital technologies (higher values for Digitalization in
the Scorecard data). Thus, they should start working with more advanced Digital Manufacturing
technologies such as Machine Learning as part of predictive maintenance and Additive Manufacturing for
spare parts. These technologies could help them mitigate the high complexity that plants of this cluster
have. In terms of the organization, the most challenging task to achieve is to develop a digital culture.
Considering that those plants already have their own digital cultures, this should be used as an advantage
for the implementation of technologies of Digital Manufacturing.
Plants in Cluster 3 have a high Digitalization score due to their ongoing implementation of some digital
tools. To continue the Manufacturing Digital Transformation journey, these plants will need to invest.
However, these investments could not just follow the latest trends in digital technologies. Proper planning
for the investment process is essential for the success of the Manufacturing Digital Transformation.
Additionally, digital technologies solutions must be selected if they have a solid ROI (return of investment)
and proof-of-concept (POC) that can be developed.
Cluster 4– High Expenses
Cluster 4 differs from the others because they should focus first on the organizational aspect instead of
technologies that they could implement. These plants showed that they are not prepared for a Digital
Manufacturing Transformation due to several reasons: 1) they do not expect major benefits from the
adoption of Digital Manufacturing technologies, 2) they do not view that top management is willing to
invest in Digital Manufacturing, 3) they do not believe that Digital Manufacturing technologies are

60
consistent with their business practices and part of their supply chain strategy, or fits the organization
culture, 4) they do not think that company is identifying and exploring Digital Manufacturing technologies,
and 5) they consider they do not have change management.
Therefore, before BeverageCo starts implementing Digital Manufacturing technologies, they should
evaluate what can be done to change the mindset of the people. In case they try to implement something
before this is improved, the probability of failure is going to be higher.
This cluster requires systematic change management. This process must start with the communication of
the manufacturing digital transformation vision to all employees. Also, it should have an action plan with
concrete milestones for digital transformation. This plan must be communicated comprehensively and
should ensure coordinated and targeted actions. Finally, commitment across all levels is needed. From
top management to the “last” employee, they should feel committed. Once all elements are equally
considered, change can most likely be achieved. If one element is neglected, it probably fails (Kreutzer et
al., 2018).
Cluster 5 – Low complexity, Low expenses
Plants in cluster 5 associate the Digital Manufacturing adoption with cost reduction, increased resource
efficiency and internal communication and coordination among departments and locations. They believe
that top management supports Digital Manufacturing with funds and they are willing to take risks. Also,
they perceive that Digital Manufacturing is part of the supply chain strategy and, above all, they do not
think that Digital Manufacturing technologies threat their job security nor are too complex nor they are
forced to change their work habits to adopt to Digital Manufacturing technologies. This is very important
because it shows that Cluster 5 employees are non-resistant to changes, and therefore, BeverageCo can
implement new technologies easily.

61
Although they do not consider that BeverageCo is implementing Digital Manufacturing technologies
(ambidexterity) and that IT infrastructure that they have is going to support the implementation of Digital
Manufacturing, the culture for a Digital Transformation can be noticed.
Plants for Cluster 5 have low budgets so that BeverageCo should start implementing lower cost digital
solutions that replace repetitive, redundant and time-consuming tasks that are performed manually by a
task force that consumes a huge number of man-hours.
Also, Cluster 5 could start with the implementation of the Internet of Things sensors and Automation in
the processes that have high variability only (e.g., higher CpK). It is not necessary to do it for the whole
plant since they already have good performance. They need to generate digital data, so it can be analyzed
to create initiatives for improvement.
Table 22 summarized the strengths and weaknesses of each clusters, as well as the proposals for each
group of plants.

62
Table 22. Strengths and weaknesses per cluster Cluster Strengths Weaknesses Strategy Focus
Cluster 1 – Intermediate
Complexity and Expenses
Compatibility Ambidexterity Change Management
Techno-stress Technologies
Automation – IoT
Big Data Analytics
Cluster 3 – High Complexity
Top Management Support Culture
Compatibility Technologies
Machine Learning Additive
Manufacturing
Cluster 4 – High Expenses Competitors
Expected Benefits and Challenges Change Management Ambidexterity Techno-stress Culture
Organization Culture
Cluster 5 – Low Complexity
and Expenses
Expected Benefits and Challenges Top Management Support Culture Techno-Stress
Compatibility Ambidexterity Technologies Sensors for IoT
Analytics
During this project, the clusters for the companies were defined based on the information from the
Scorecard data from 2018. However, since the methodology was already created and the necessary
variables were discovered, this clustering could be dynamic. To incorporate new acquisitions or even
bottling plants that did not have information in the ERP system at the moment of this analysis could
remain the same and will not demand a significant effort for BeverageCo.
One of the possible improvements of the methodology for Beverage would be the incorporation of new
variables into the model. At the time of the modeling, only production fixed costs were available for all
the bottling plants. We believe that the inclusion of the cost-to-make variable per plant could also add
relevant information on the performance of the bottling plants.

63
7 CONCLUSIONS
The present study had the objective of creating a Digital Transformation strategy for BeverageCo’s
manufacturing plants that considers the current situation and readiness of each bottling plant as well as
their main characteristics from both the operational and organizational perspectives. To achieve this, a
multiple research methodology approach was used to analyze data from two different sources:
BeverageCo’s ERP system (Scorecard data) and a survey administered to all the plants. The aim is to close
the gap found in the literature, where most scholars address technological aspects of the implementation
of smart systems without taking into account external and organizational aspects like employees’ training
or change management.
For Scorecard data analysis, an Exploratory Factor Analysis (EFA) was conducted to reduce the number of
variables and linear combinations of the original set. Following this, a clustering analysis was performed
to define the number of possible groups of plants with similar characteristics according to their
performance (Manufacturing KPIs).
The results of the Scorecard data show that even though each plant has certain particularities, they can
be classified in groups that can be used in the industry and are statistically valid. For this reason,
BeverageCo plants can be grouped into 5 clusters. The first cluster, Cluster 1, with 14 plants, is
characterized by intermediate levels of complexity and expenses. Cluster 2 is composed of only 2 plants
that have a strong negative correlation with the External Factor. For this reason, this cluster is away from
the others, indicating that this cluster is an outlier. Cluster 3, with 10 plants, is characterized by the highest
levels of complexity, while Cluster 4, composed of 11 plants, is characterized by the highest levels of
expenses. Finally, Cluster 5, with 8 plants, is characterized by the lowest levels both in complexity and
expenses.

64
For the survey analysis, a TOE framework was designed. This framework incorporates not only a
technologic approach but also the organizational and external factors that could affect the adoption of
Digital Manufacturing. The survey was designed based on the existing literature about digital technologies
and how organizations prepare themselves to embrace the new changes. Although the constructs were
already proven by other scholars, we found the construct “External Support” that included external
support and integration with Supply Chain, was not statistically relevant for the BeverageCo model.
The main conclusion that can be drawn from the survey is that employees from BeverageCo have a fair
knowledge of what are the Digital Manufacturing technologies. However, it is important to remark that
people working in corporative positions and the people working directly at the bottling plants have a
different assessment of the benefits and challenges that a Digital Manufacturing Transformation requires.
Although the Digital Manufacturing should be an initiative initially driven by a corporate department, to
align all efforts, the understanding of Digital Manufacturing for employees involved in the design and
implementation phase should be common.
According to most employees of BeverageCo, the two fields where the company had the most room for
improvement are the adaptability and compatibility of IT Systems. This provides the company with the
ability of a smooth transition to the new technologies and the change management & training processes
when new processes or technologies are implemented.
For the overall strategy, BeverageCo should work in three main aspects to improve the adoption and
effectiveness of the Manufacturing Digital Transformation:
Create a framework to train employees in Digital Manufacturing. The training should not be based only
on digital technologies, but also to create a company environment that increases the benefits and goals
of the Manufacturing Digital Transformation.

65
Analyze IT infrastructure and physical integration with legacy systems already in BeverageCo. The first
step is to identify if the current IT infrastructure and organization could handle the implementation of
new technologies. Moreover, if new technologies are to be implemented, it is crucial to define if these
new technologies could be integrated with the legacy systems already implemented in the bottling plants
in order to avoid duplicate or even incompatible systems.
Improve the integration of Supply Chain stakeholders. Although the Manufacturing Digital Transformation
is driven by and implemented in Operations, the initiative must be aligned with the rest of players in the
Supply Chain; like Distribution, Procurement, and even Sales. A Digital Transformation aims to reduce the
silos within a company; thus, also other departments should be integrated (or at least informed) about
the roadmap that manufacturing creates.
7.1 Opportunities for future research
One possible opportunity that would enrich the analysis would be the incorporation of new variables into
the model. During the construction of the model, only production fixed costs were available to measure
the financial performance of BeverageCo bottling plants. Considering that the variable “Cost-to-Make”
would be a better indicator to measure manufacturing’s financial results, we believe that its inclusion
could reflect the actual cost structure of the plants.
In addition, BeverageCo’s new acquisitions could be considered in the clustering analysis if the data is
available. In the Methodology chapter, it was mentioned that some plants did not have information
available in the ERP system. Therefore, they were not considered in the analyses. In case where this
situation changes, the methodology used in this study could be readily performed for these new
acquisitions. Focusing on this, BeverageCo could consider the managerial recommendations described in
this document to these plants.

66
REFERENCES Agarwal, R., & Prasad, J. (1998). A Conceptual and Operational Definition of Personal Innovativeness in
the Domain of Information Technology. Information Systems Research, 9(2), 204–215.
https://doi.org/10.1287/isre.9.2.204
Albukhitan, S. (2020). Developing Digital Transformation Strategy for Manufacturing. Procedia Computer
Science, 170, 664–671. https://doi.org/10.1016/j.procs.2020.03.173
Angeles-Martinez, L., Theodoropoulos, C., Lopez-Quiroga, E., Fryer, P. J., & Bakalis, S. (2018). The
Honeycomb model: A platform for systematic analysis of different manufacturing scenarios for
fast-moving consumer goods. Journal of Cleaner Production, 193, 315–326.
https://doi.org/10.1016/j.jclepro.2018.04.075
Arnold, C., Veile, J. W., & Voigt, K. I. (2018). What drives Industry 4.0 adoption? An examination of
technological, organizational and environmental determinants. International Association for
Management of Technology.
Baker, J. (2012). The Technology–Organization–Environment Framework. In Y. K. Dwivedi, M. R. Wade, &
S. L. Schneberger (Eds.), Information Systems Theory: Explaining and Predicting Our Digital
Society, Vol. 1 (pp. 231–245). Springer. https://doi.org/10.1007/978-1-4419-6108-2_12
Belsey, D., Kuh, E., & Welsch, R. (2005). Regression Diagnostics: Identifying Influencial Data and Sources
of Collinearity. John Wiley & Sons, Ltd.
Büchi, G., Cugno, M., & Castagnoli, R. (2020). Smart factory performance and Industry 4.0. Technological
Forecasting and Social Change, 150, 119790. https://doi.org/10.1016/j.techfore.2019.119790
Cagle, K. (2019). What is Artificial Intelligence. Forbes.
https://www.forbes.com/sites/cognitiveworld/2019/08/20/what-is-artificial-
intelligence/#3e8d399e306f

67
Carolis, A. D., Machi, M., Negri, E., & Terzi, S. (2017). Guiding Manufacturing Companies towards
digitalization. 2017 International Conference on Engineering, Technology and Innovation
(ICE/ITMC) Engineering, Technology and Innovation (ICE/ITMC), 2017 International Conference
on. :487-495 Jun, 2017, 487–495. https://doi.org/10.1109/ICE.2017.8279925
Cimini, C., Pinto, R., & Cavalieri, S. (2017). The business transformation towards smart manufacturing: A
literature overview about reference models and research agenda. IFAC-PapersOnLine, 50(1),
14952–14957. https://doi.org/10.1016/j.ifacol.2017.08.2548
D’Aveni, R. A. (2018). Business models for additive manufacturing. Harvard Business Review.
Davenport, T. H., & Kirby, J. (2015). Beyond Automation. Harvard Business Review.
Davis, F. D., Bagozzi, R. P., & Warshaw, P.R. (1989). User Acceptance of Computer Technology: A
Comparison of Two Theoretical Models. Management Science, 35(8).
Fitzgerald, M., Kruschwitz, N., Bonnet, D., & Welch, M. (2013). Embracing Digital Technology. 16.
Flynn, B. B., Huo, B., & Zhao, X. (2010). The impact of supply chain integration on performance: A
contingency and configuration approach. Journal of Operations Management, 28(1), 58–71.
https://doi.org/10.1016/j.jom.2009.06.001
Frank, A. G., Dalenogare, L. S., & Ayala, N. F. (2019a). Industry 4.0 technologies: Implementation
patterns in manufacturing companies. International Journal of Production Economics, 210, 15–
26. https://doi.org/10.1016/j.ijpe.2019.01.004
Frank, A. G., Dalenogare, L. S., & Ayala, N. F. (2019b). Industry 4.0 technologies: Implementation
patterns in manufacturing companies. International Journal of Production Economics, 210, 15–
26. https://doi.org/10.1016/j.ijpe.2019.01.004
Gangwar, H., Date, H., & Ramaswamy, R. (2015). Understanding determinants of cloud computing
adoption using an integrated TAM-TOE model. Journal of Enterprise Information Management,
28(1), 107–130. https://doi.org/10.1108/JEIM-08-2013-0065

68
Gerbert, P., Rüßmann, M., Lorenz, M., Waldner, M., Justus, J., & Harnisch, M. (2015). Industry 4.0: The
Future of Productivity and Growth in Manufacturing Industries. 14.
Henderson, R. M., & Clark, K. B. (1990). Architectural Innovation: The Reconfiguration of Existing Product
Technologies and the Failure of Established Firms. Administrative Science Quarterly, 35(1), 9.
https://doi.org/10.2307/2393549
Hess, T., Benlian, A., Matt, C., & Wiesbök, F. (2016). Options for Formulating a Digital Transformation
Strategy. MIS Quarterly Executive, 123–139.
Iansiti, M., & Lakhani, K. R. (2017). The Truth about Blockchain. Harvard Business Review.
Ichsan, M., Dachyar, M., & Farizal. (2017). Readiness for Implementing Industry 4.0 in Food and
Beverage Manufacturer in Indonesia—IOPscience. International Journal of Information Systems
and Project Management, Vol 05, 5–21.
Jacobson, S. (2018). Understanding the 5 Stages of Gartner’s Maturity Model for Manufacturing
Operations. 21.
Jia, Q., Guo, Y., & Barnes, S. J. (2017). Enterprise 2.0 post-adoption: Extending the information system
continuance model based on the technology-Organization-environment framework. Computers
in Human Behavior, 67, 95–105. https://doi.org/10.1016/j.chb.2016.10.022
Kane, G. C., Palmer, D., Phillips, A. N., Kiron, D., & Buckley, N. (2015). Strategy, not Technology, Drives
Digital Transformation. 29.
Kiel, D., Arnold, C., & Voigt, K.-I. (2017). The influence of the Industrial Internet of Things on business
models of established manufacturing companies – A business level perspective. Technovation,
68, 4–19. https://doi.org/10.1016/j.technovation.2017.09.003
Kreutzer, R. T., Neugebauer, T., & Pattloch, A. (2018). Digital Business Leadership. Springer Berlin
Heidelberg. https://doi.org/10.1007/978-3-662-56548-3
69
Kuzmina, K., Prendeville, S., Walker, D., & Charnley, F. (2019). Future scenarios for fast-moving
consumer goods in a circular economy. Futures, 107, 74–88.
https://doi.org/10.1016/j.futures.2018.12.001
LaValle, S., Lesser, E., Schockley, R., Hopkins, M. S., & Kruschwitz, N. (2011). Big Data, Analytics and the
Path from Insights to Value. MIT Sloan Management Review.
Lippert, S. K., & Govindarajulu, C. (2006). Technological, Organizational, and Environmental Antecedents
to Web Services Adoption. 6(1), 15.
Lorange, P., & Rembiszewski, J. (2014). From great to gone: Why FMCG companies are losing the race for
customers. Gower.
Marodin, G. A., Frank, A. G., Tortorella, G. L., & Saurin, T. A. (2016). Contextual factors and lean
production implementation in the Brazilian automotive supply chain. Supply Chain
Management: An International Journal, 21(4), 417–432. https://doi.org/10.1108/SCM-05-2015-
0170
Masood, T., & Egger, J. (2019). Augmented reality in support of Industry 4.0—Implementation
challenges and success factors. Robotics and Computer-Integrated Manufacturing, 58, 181–195.
https://doi.org/10.1016/j.rcim.2019.02.003
Matt, C., Hess, T., & Benlian, A. (2015). Digital Transformation Strategies. Business & Information
Systems Engineering, 57(5), 339–343. https://doi.org/10.1007/s12599-015-0401-5
McAfee, A. (2011). What every CEO needs to know about the cloud. Harvard Business Review.
Milligan, G. W., & Cooper, M. C. (1985). An Examination of Procedures for Determining the Number of
Clusters in a Data Set. Psychometriky, 50(2), 159–179.
Mohamed, M. (2018). Challenges and Benefits of Industry 4.0: An overview. International Journal of
Supply and Operations Management, 5(3), 256–265.
Nunnally, J. C., & Bernstein, I. H. (1994). Psychometric theory. Mc Graw-Hill.

70
Osterrieder, P., Budde, L., & Friedli, T. (2019). The smart factory as a key construct of industry 4.0: A
systematic literature review. International Journal of Production Economics,
S0925527319302865. https://doi.org/10.1016/j.ijpe.2019.08.011
Parenty, T. J., & Domet, J. J. (2019). Sizing up your cyberrisks. Harvard Business Review.
Pejic, M., Zoroja, J., & Celjo, A. (2017). An extension of the technology acceptance model for business
intelligence systems: Project management maturity perspective. International Journal of
Information Systems and Project Management, Vol 05, Iss 02, 5–21.
Pereira, A. C., & Romero, F. (2017). A review of the meanings and the implications of the Industry 4.0
concept. Procedia Manufacturing, 13, 1206–1214.
https://doi.org/10.1016/j.promfg.2017.09.032
Poliakine, R. (2019). Council Post: Why Industry 4.0 Is The Next Revolution In Business. Forbes.
https://www.forbes.com/sites/forbesbusinessdevelopmentcouncil/2019/07/22/why-industry-4-
0-is-the-next-revolution-in-business/
Porter, M. E., & Heppelmann, J. E. (2015). How smart, connected products are transforming companies.
Harvard Business Review.
Purdy, M., Eitel-Porter, R., Krüger, R., & Deblare, T. (2020). How Digital Twins are Reinventing
Innovation. Frontiers - MIT Sloan Management Review.
Ragu-Nathan, T. S., Tarafdar, M., Ragu-Nathan, B. S., & Tu, Q. (2008). The Consequences of Technostress
for End Users in Organizations: Conceptual Development and Empirical Validation. Information
Systems Research, 19(4), 417–433. https://doi.org/10.1287/isre.1070.0165
Raj, A., Dwivedi, G., Sharma, A., Lopes de Sousa Jabbour, A. B., & Rajak, S. (2019). Barriers to the
adoption of industry 4.0 technologies in the manufacturing sector: An inter-country comparative
perspective. International Journal of Production Economics, 107546.
https://doi.org/10.1016/j.ijpe.2019.107546

71
Rogers, E. M. (2003). Diffusion of innovations. Free Press.
Ross, J. W., Sebastian, I. M., & Beath, C. M. (2017). How to Develop a Great Digital Strategy. MIT Sloan
Management Review, 58(2), 5.
Savastano, M., Amendola, C., Bellini, F., & D’Ascenzo, F. (2019). Contextual Impacts on Industrial
Processes Brought by the Digital Transformation of Manufacturing: A Systematic Review.
Sustainability, 11(3), 891. https://doi.org/10.3390/su11030891
Tekic, Z., & Koroteev, D. (2019). From disruptively digital to proudly analog: A holistic typology of digital
transformation strategies. Business Horizons, S000768131930093X.
https://doi.org/10.1016/j.bushor.2019.07.002
Tornatzky, L. G., & Fleischer, M. (1990). The Processes of Technological Innovations. Lexington Books.
Ustundag, A., & Cevikcan, E. (2018). Industry 4.0: Managing The Digital Transformation. Springer
International Publishing. https://doi.org/10.1007/978-3-319-57870-5
Venkatesh, V., & Bala, H. (2008). Technology Acceptance Model 3 and a Research Agenda on
Interventions. Decision Sciences, 39(2), 273–315. https://doi.org/10.1111/j.1540-
5915.2008.00192.x
White, L. R., Simon, T. D., & Jackiw, J. (2019). DIGITAL MANUFACTURING AND THE CFO. 9.
Yeh, C.-C., & Chen, Y.-F. (2018). Critical success factors for adoption of 3D printing. Technological
Forecasting and Social Change, 132, 209–216. https://doi.org/10.1016/j.techfore.2018.02.003
Yeow, A., Soh, C., & Hansen, R. (2017). Aligning with new digital strategy: A dynamic capabilities
approach. Journal of Strategic Information Systems.

72
APPENDIX
Appendix A. Semi structured interview BeverageCo executives
Interview goal:
- To understand the Digitalization strategy of the company, specially related to the whole Supply Chain and Manufacturing.
- To define the expectations and scope of the project.
Structure of the interview:
- Strategy of the company o What is the vision of the company? o How do you visualize the company in the next 10 years? o What are the necessary changes and the biggest challenges to achieve the vision in the
future?
- Strategy of the Supply Chain: o How does Supply Chain contribute to the strategy of the company? o Why did you decide to digitalize Supply Chain / Manufacturing? o Is there a roadmap for the digitalization of the Supply Chain / Manufacturing?
- Current status of the Supply Chain:
o Is the Supply Chain standardized along the different countries where the company operates?
o What is the role of the Supply Chain Center of Excellence?
- Experience with Digitalization in the Supply Chain/ Manufacturing: o Did the company implement some digitalization technologies? o How was the experience with these implementations? o How would be the ideal digitalized organization looks like? o What do you expect from the implementation of Manufacturing Digital technologies?
- Current Performance Indicators in Manufacturing
o How do you measure the performance of the different processes? o What are the KPIs in daily/ weekly/ monthly basis?
- Expectations of the projects
o What are your expectations for this project? o What is the scope of the project? Manufacturing? Supplier integration?

73
Appendix B. Survey for employees in BeverageCo

74

75

76