486 IARC MONOGRAPHS VOLUME 96
57
have found no association (Mabuchi et al., 1985a; Casagrande et al., 1988; Hsing et al., 1998b; Rosenblatt et al., 1999; Petridou et al., 2000; Johnson et al., 2002). 2.7 Cancer of the stomach A possible relationship between alcoholic beverage consumption and risk for stom- ach cancer has long been hypothesized, but epidemiological evidence has been consid- ered uncertain (IARC, 1988). This section evaluates the human evidence related to the risk for stomach cancer based on relevant publications from cohort and case–control studies published since 1988. Because a large proportion of cases of stomach cancer occur in China (accounting for 38% throughout the world), papers published in the Chinese literature are also included in this review. The effects of total alcoholic beverage consumption on the risk for stomach cancer are summarized in Table 2.36 (cohort studies), Table 2.37 (cohort studies in the Chinese literature), Table 2.38 (case–control studies) and Table 2.39 (case–control studies in the Chinese literature). The effects of alcoholic beverage consumption and risk for stom- ach cancer by anatomic subtypes (cardia and distal cancer) are shown in Table 2.40, the effects of alcoholic beverage types are presented in Table 2.41 and the effects of alcoholic beverage consumption and the risk for stomach cancer stratified by gender are given in Table 2.42. 2.7.1 Cohort studies (a) special populations (Table 236) In the Danish cohort study of 18 368 alcohol abusers conducted in Copenhagen in 1954–87, 64 cases of stomach cancers occurred during follow-up (Tønnesen et al., 1994). The SIR for stomach cancer was slightly increased and marginally significant (SIR, 1.3; 95% CI, 1.0–1.7). In the Swedish cohort of alcoholics (Adami et al., 1992a), a total of 25 cases resulted in a null association and an SIR of 0.9 (95% CI, 0.6–1.4) for men and 0.7 (95% CI, 0.0–4.0) for women. (b) general population (Tables 236 and 237) A total of 12 cohort studies of the general population that were conducted in Japan, the USA, Sweden, China, Denmark and the United Kingdom have examined the asso- ciation between alcoholic beverage consumption and stomach cancer; three studies reported a significant association. Two cohort studies reported a statistically significant association between alcoholic beverage consumption and the risk for stomach cancer (Kato et al., 1992b; Fan et al., 1996) and one study with a large sample size reported an inverse relationship (Tran et al., 2005). Nine studies reported either a non-statistically significant association or no association. 486 IARC MONOGRAPHS VOLUME 96
Transcript of 486 IARC MONOGRAPHS VOLUME 96

have found no association (Mabuchi et.al., 1985a; Casagrande et.al., 1988; Hsing et.al., 1998b; Rosenblatt et.al., 1999; Petridou et.al., 2000; Johnson et.al., 2002).
2.7 Cancer of the stomach
A possible relationship between alcoholic beverage consumption and risk for stom-ach cancer has long been hypothesized, but epidemiological evidence has been consid-ered uncertain (IARC, 1988). This section evaluates the human evidence related to the risk for stomach cancer based on relevant publications from cohort and case–control studies published since 1988. Because a large proportion of cases of stomach cancer occur in China (accounting for 38% throughout the world), papers published in the Chinese literature are also included in this review.
The effects of total alcoholic beverage consumption on the risk for stomach cancer are summarized in Table 2.36 (cohort studies), Table 2.37 (cohort studies in the Chinese literature), Table 2.38 (case–control studies) and Table 2.39 (case–control studies in the Chinese literature). The effects of alcoholic beverage consumption and risk for stom-ach cancer by anatomic subtypes (cardia and distal cancer) are shown in Table 2.40, the effects of alcoholic beverage types are presented in Table 2.41 and the effects of alcoholic beverage consumption and the risk for stomach cancer stratified by gender are given in Table 2.42.
2.7.1. Cohort.studies
(a). special.populations.(Table.2 .36)In the Danish cohort study of 18 368 alcohol abusers conducted in Copenhagen
in 1954–87, 64 cases of stomach cancers occurred during follow-up (Tønnesen et.al., 1994). The SIR for stomach cancer was slightly increased and marginally significant (SIR, 1.3; 95% CI, 1.0–1.7). In the Swedish cohort of alcoholics (Adami et.al., 1992a), a total of 25 cases resulted in a null association and an SIR of 0.9 (95% CI, 0.6–1.4) for men and 0.7 (95% CI, 0.0–4.0) for women.
(b). general.population.(Tables.2 .36.and.2 .37)A total of 12 cohort studies of the general population that were conducted in Japan,
the USA, Sweden, China, Denmark and the United Kingdom have examined the asso-ciation between alcoholic beverage consumption and stomach cancer; three studies reported a significant association. Two cohort studies reported a statistically significant association between alcoholic beverage consumption and the risk for stomach cancer (Kato et.al., 1992b; Fan et.al., 1996) and one study with a large sample size reported an inverse relationship (Tran et.al., 2005). Nine studies reported either a non-statistically significant association or no association.
486 IARC MONOGRAPHS VOLUME 96
kajo
Rectangle

487A
LCO
HO
L CO
NSU
MPTIO
Ntable 2.36 Cohort studies of stomach cancer and alcoholic beverage consumption
Reference, location, name of study
Cohort description
exposure assessment
Organ site (ICD code)
exposure categories
No. of cases/ deaths
Relative risk (95% CI)
Adjustment factors
Comments
special.populationsKono et.al . (1987), Japan, Japanese Physicians’ Study
5130 male Japanese physicians, aged 27–89 years; followed up for 19 years; 1965–
Self-administered questionnaire
ICD-8 (155) Primary liver cancer ICD-8 (151)
Never Occasional Daily (<2 g/day) Daily (≥2 g/day)
Total: 116 deaths
1.00 1.11 (0.69–1.79) 1.30 (0.79–2.12) 1.17 (0.66–2.07)
Age, smoking Daily consumption of alcohol (1’go’ sake) 1’go’ =180 mL; 1’go’ sake ≈ 27 mL alcohol
Adami et.al . (1992a), Sweden, Uppsala Alcoholics Study
9353 (8340 men, 1013 women) selected from the Uppsala Inpatients Register with a discharge diagnosis containing a diagnostic code for alcoholism during 1965–83; follow-up, 19 years (mean, 7.7)
Follow–up was by record linkage to the nationwide Cause of Death Registry and the Swedish Cancer registry.
ICD-7 (155.0) Liver cancer; ICD-7 (307,322) ICD-8 (291,303)
Total, 24 cases 23 men 1 woman
SIR 0.9 (0.6–1.4) 0.7 (0.0–4.0)
- Expected numbers of cancers computed from cancer incidence in the study population (Uppsala health care region) to compare with the observed

488IA
RC M
ON
OG
RA
PHS V
OLU
ME 96
Reference, location, name of study
Cohort description
exposure assessment
Organ site (ICD code)
exposure categories
No. of cases/ deaths
Relative risk (95% CI)
Adjustment factors
Comments
Tønnesen et.al. (1994), Denmark, Alcohol Abusers Study
18 368 alcoholics from Copenhagen who entered a public outpatient clinic for free treatment in 1954–87; 15 214 men observed for 12.9 years on average and 3093 women observed for an average of 9.4 years
Records of cohort members linked to the Danish Cancer Registry to obtain cancer morbidity information
Alcohol abuse (male, female alcoholics)
64 cases 60 men 4 women
SIR1.3 (1.0–1.6) p≤0.051.8 (0.5–4.6) p≤0.05
Age, sex Observed cancer incidence compared with that expected in the Danish population
table 2.36 (continued)

489A
LCO
HO
L CO
NSU
MPTIO
N
Reference, location, name of study
Cohort description
exposure assessment
Organ site (ICD code)
exposure categories
No. of cases/ deaths
Relative risk (95% CI)
Adjustment factors
Comments
Nomura et.al . (1995), Hawaii, USA, American Men of Japanese Ancestry Study
8006 men born in 1900–19, and residing on the Hawaiian island of Oahu; followed up for 25 years examined between 1965–1968 at all hospitals on Oahu and the Hawaian Tumor Registry
Interviewed; surveillance to identify incident cases
Non–drinker <5 oz/month 5–14 oz/month 15–39 oz/month ≥40 oz/month
86 cases 43 41 39 36
1.0 0.9 (0.6–1.3) 1.1 (0.8–1.6) 1.0 (0.7–1.5) 1.2 (0.8–1.8) p=0.20
Age, smoking history
table 2.36 (continued)

490IA
RC M
ON
OG
RA
PHS V
OLU
ME 96
Reference, location, name of study
Cohort description
exposure assessment
Organ site (ICD code)
exposure categories
No. of cases/ deaths
Relative risk (95% CI)
Adjustment factors
Comments
general.populationKneller et.al. (1991), USA
17 633 white American men insurance policy holders, largely of Scandinavian and German descent, aged ≥35 years; follow-up, 1966–86
Mailed questionnaire
Alcoholic beverage consumption (data not presented)
75 deaths No association - Data regarding alcohol use and risk for stomach cancer not presented
Kato et.al. (1992a), Japan
3914 subjects who underwent gastroscopic examination; 4.4 years of follow-up on average (1985–89)
Self-recorded questionnaire, cancer registry and death certificate
Organ site (ICD code)
None Past Occasional Daily
12 cases 6 11 16 Total: 45 (35 men, 10 women)
1.00 2.19 (0.78–6.19) 1.10 (0.47–2.60) 1.51 (0.65–3.54)
Sex , age, residence
Non-significant increase in risk for stomach cancer among past and daily drinkers
table 2.36 (continued)

491A
LCO
HO
L CO
NSU
MPTIO
N
Reference, location, name of study
Cohort description
exposure assessment
Organ site (ICD code)
exposure categories
No. of cases/ deaths
Relative risk (95% CI)
Adjustment factors
Comments
Kato et.al. (1992b), Japan
9753 Japanese men and women, aged ≥40 and ≥30 years, respectively; follow-up, 1986–91; response rate, 85.9%
Baseline survey using a mailed questionnaire; death certificate
None Occasional Daily <50 mL Daily ≥50 mL
26 cases 12 7 12 Total: 57 (33 men, 22 women)
1.0 1.75 (0.84–3.61) 1.20 (0.48–3.00) 3.05 (1.35–6.91)
Sex, age Association between alcohol intake and stomach cancer slightly weakened when smoking status, diet and family history of stomach cancer were included in the multivariate analysis.
table 2.36 (continued)
492IA
RC M
ON
OG
RA
PHS V
OLU
ME 96
Reference, location, name of study
Cohort description
exposure assessment
Organ site (ICD code)
exposure categories
No. of cases/ deaths
Relative risk (95% CI)
Adjustment factors
Comments
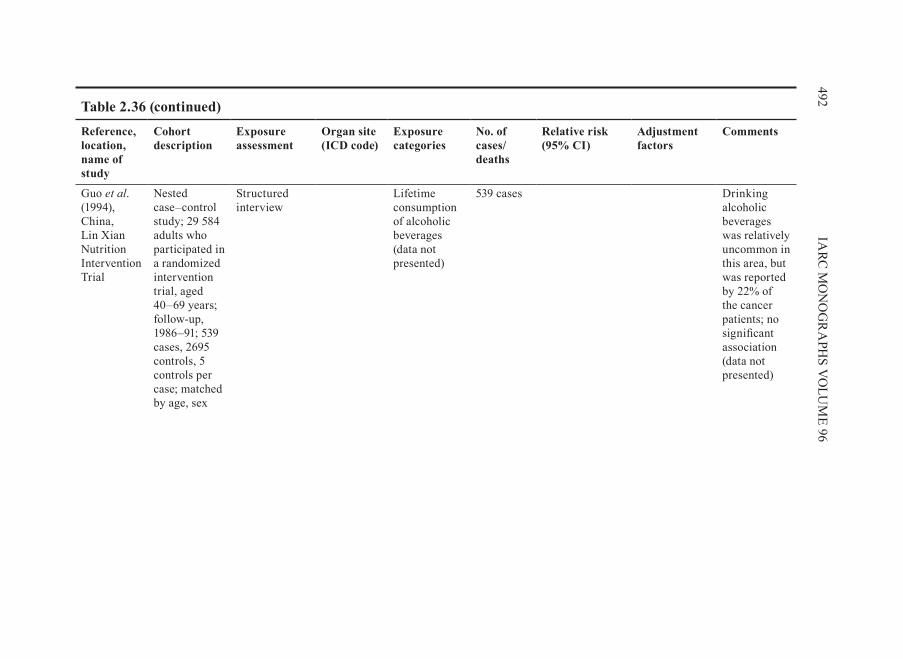
Guo et.al. (1994), China, Lin xian Nutrition Intervention Trial
Nested case–control study; 29 584 adults who participated in a randomized intervention trial, aged 40–69 years; follow-up, 1986–91; 539 cases, 2695 controls, 5 controls per case; matched by age, sex
Structured interview
Lifetime consumption of alcoholic beverages (data not presented)
539 cases Drinking alcoholic beverages was relatively uncommon in this area, but was reported by 22% of the cancer patients; no significant association (data not presented)
table 2.36 (continued)
493A
LCO
HO
L CO
NSU
MPTIO
N
Reference, location, name of study
Cohort description
exposure assessment
Organ site (ICD code)
exposure categories
No. of cases/ deaths
Relative risk (95% CI)
Adjustment factors
Comments
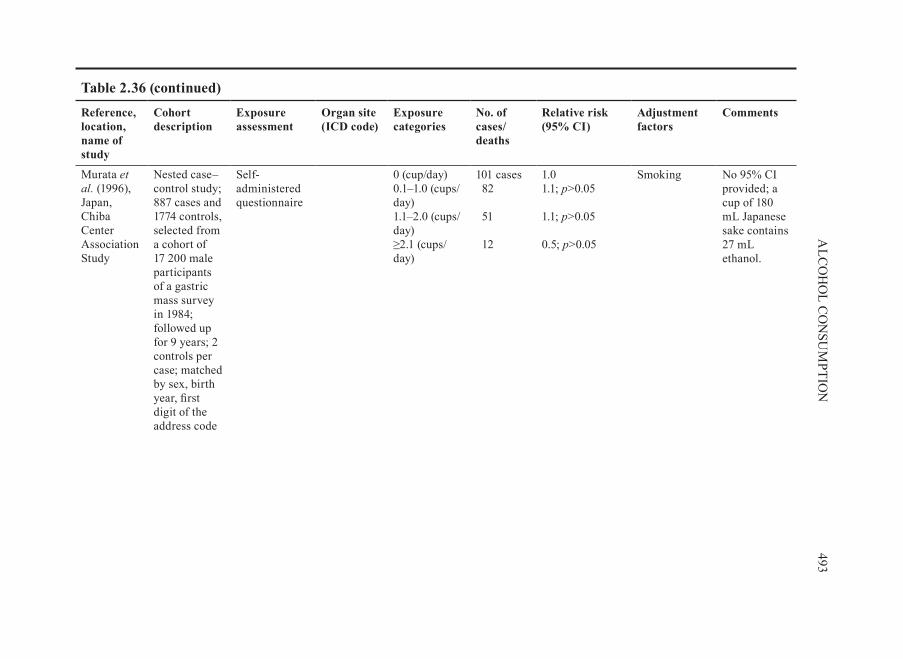
Murata et.al . (1996), Japan, Chiba Center Association Study
Nested case–control study; 887 cases and 1774 controls, selected from a cohort of 17 200 male participants of a gastric mass survey in 1984; followed up for 9 years; 2 controls per case; matched by sex, birth year, first digit of the address code
Self-administered questionnaire
0 (cup/day) 0.1–1.0 (cups/day) 1.1–2.0 (cups/day) ≥2.1 (cups/day)
101 cases 82 51 12
1.0 1.1; p>0.05 1.1; p>0.05 0.5; p>0.05
Smoking No 95% CI provided; a cup of 180 mL Japanese sake contains 27 mL ethanol.
table 2.36 (continued)

494IA
RC M
ON
OG
RA
PHS V
OLU
ME 96
Reference, location, name of study
Cohort description
exposure assessment
Organ site (ICD code)
exposure categories
No. of cases/ deaths
Relative risk (95% CI)
Adjustment factors
Comments
Yuan et.al . (1997),China, Shanghai Men’s Study
18 244 male residents of Shanghai, enrolled between 1986 and 1989 (80% of eligible subjects); only 50 subjects lost to follow-up until 1993
Structured interviewed; cancer incidence ascertained through the population-based Shanghai Cancer Registry and vital status ascertained by inspection of the Shanghai death certificate records
Non-drinkers 1–28 drinks/week ≥29 drinks/week
48 deaths 33 10
1.0 0.98 1.37
Age, education, smoking
95% CI not given; non-significant 30–40% increase in risks of death from cancers of the stomach observed in heavy drinkers.
table 2.36 (continued)

495A
LCO
HO
L CO
NSU
MPTIO
N
Reference, location, name of study
Cohort description
exposure assessment
Organ site (ICD code)
exposure categories
No. of cases/ deaths
Relative risk (95% CI)
Adjustment factors
Comments
Terry et.al . (1998), Sweden, Swedish Twin Registry Study
11 546 individuals born in 1886–1925 in the Swedish Twin Registry, and both still living in Sweden in 1961; followed up, 1967–92; 98% follow-up
Mailed questionnaire, record linkage to the National Cancer and Death Registers.
Organ site (ICD code)
None Light Moderate
116 cases 1.00 1.51 (0.89–2.55) 1.36 (0.83–2.24)
Fruit and vegetable intake, age, gender, body mass index, socioeconomic status, smoking
Alcoholic beverage consumption was assessed as number of drinks per week (data not presented); no. of cases per drinking category not given.
Sasazuki et.al . (2002), Japan, The Japan Public Health Center Study Cohort I
19 657 men, born in 1930–49, aged 40–59 years at baseline; followed up, 1990–99; response rate: men, 76%; women, 82%
Self-administered questionnaire, death certificates, cancer registry
ICD-9 (151) 0–3 days/month 0–161.0 g/week 162.0–322.0 g/week 322.5 g/week
68 deaths 54 77 74
1.0 0.8 (0.6–1.2) 1.1 (0.8–1.5) 1.1 (0.8–1.6)
Age, area, smoking habit, consumption of fruit, green or yellow vegetables, salted cod roe or fish gut, body mass index
Reference group (0–3 days/month) included drinkers; data for women collected but not presented
table 2.36 (continued)

496IA
RC M
ON
OG
RA
PHS V
OLU
ME 96
Reference, location, name of study
Cohort description
exposure assessment
Organ site (ICD code)
exposure categories
No. of cases/ deaths
Relative risk (95% CI)
Adjustment factors
Comments
Tran et.al . (2005), China, Linxian General Population Trial
29 584 adults who participated in the Linxian General Population Trial, 40–69 years of age at baseline; follow-up, 15 years (1984–98)
Structured interview; case ascertainment considered complete and loss to follow–up minimal (176 or 1%)
Alcoholic beverage consumption (data not presented)
1089
363
Gastric cardia cancer 0.84 (0.72–0.97); Gastric non-cardia cancer 0.79 (0.61–1.02)
Age, sex Alcoholic beverage drinking defined as any in previous 12 months
CI, confidence interval; ICD, International Classification of Diseases; SIR, standardized incidence ratio
table 2.36 (continued)

497A
LCO
HO
L CO
NSU
MPTIO
Ntable 2.37 Cohort studies of stomach cancer and alcoholic beverage consumption published in the Chinese literaturea
Reference, study location, period
Characteristics of cases
Characteristics of cohort
exposure assessment
exposure categories
Relative risk (95% CI)
Adjustment factors
Comments
Fan et.al . (1996), Sifang County, Shichiuan, 1985–90
128 digestive tract cancers identified from the Disease Surveillance Spot, including stomach, liver, colorectal and oesophageal cancer; 97% diagnosed by county level hospitals
29 929 farmers, aged >35 years; age and sex distribution not provided; loss to follow-up not described
Interviewer- administered questionnaire (once a year)
Cumulative.alcoholconsumption.(kg)Non-drinkers Men1–125 125–500 ≥500 Women1–125 125–500 ≥500
(Stomach cancer only) 1.0 2.53 (0.74–8.70) 3.89 (1.55–9.74) 6.28 (1.11–12.97) 0.69 (0.17–2.73) 1.67 (0.34–8.20) 1.81 (0.70–4.68)
Not mentioned
Relative risk for death from stomach cancer
Wang et.al . (2005a), Shanghai, 1986–2002
18 244 cancer-free men followed from 1986 to 2002
Interview alcoholic.beverages(g/day)0 <30 30–70 >70
1.00 1.00 1.16 1.42 (p-value>0.05)
Age, smoking, education
CI, confidence interval

There was evidence of an association between alcohol consumption and an increased risk stomach cancer in the two cohort studies conducted in Japan (57 cases; Kato et.al., 1992b) and China (128 cases; Fan et.al., 1996). The relative risks for stom-ach cancer were 3.05 (95% CI, 1.35–6.91) for 50 mL or more alcohol per day (three or more drinks per day) when adjusted for age and gender (Kato et.al., 1992b) and 6.28 (95% CI, 1.11–12.97) for men who had a cumulative alcoholic beverage consumption of 500 kg or more (Fan et.al., 1996). One cohort study in China with a large sample size (1089 cardia cancer and 363 non-cardia cancer) reported inverse associations with alcoholic beverage consumption, with relative risks of 0.84 (95% CI, 0.72–0.97) for cardia cancer and 0.79 (95% CI, 0.61–1.02) for non-cardia cancer (Tran et.al., 2005). The two studies that reported a positive association (Kato et.al., 1992b; Fan et.al., 1996) adjusted for age and gender, but it is not clear what confounding factors were adjusted for in the study by .Tran et.al.,(2005).
A positive, but not statistically significant, association was observed in five studies (Kono et.al., 1987; Kato et.al., 1992a; Yuan et.al., 1997 Terry et.al., 1998; Wang et.al., 2005a) and null results were reported in three studies with relatively large sample sizes ranging from 75 to 493 cases (Kneller et.al., 1991; Nomura et.al., 1995; Murata et.al., 1996; Sasazuki et.al., 2002).
2.7.2. Case–control.studies.(Tables.2 .38.and.2 .39)
Several case–control studies have reported results on the influence of alcoholic beverage consumption on the risk for stomach cancer. More than 50% of the studies reported a positive association between alcoholic beverage consumption and stomach cancer: 60% of the studies that adjusted for confounding factors and 52% of the studies that did not also report a positive association. The proportion of positive associations was 71% in the Chinese literature and 44% in the English literature.
In more than half of the studies, the odds ratios were adjusted for variables such as sex, age, residence, education, diet, socioeconomic status and cigarette smoking. Odds ratios were adjusted for helicobacter.pylori status in one study (Kikuchi et.al., 2002). In 25 case–control studies, of which 11 were published in English (Lee et.al., 1990; Boeing et.al., 1991; Jedrychowski et.al., 1993; Falcao et.al., 1994; Inoue et.al., 1994; Ji et.al., 1996; De Stefani et.al., 1998a; Zaridze et.al., 2000; Muñoz et.al., 2001; Kikuchi et.al., 2002; Shen et.al., 2004), an association was found between stomach cancer and alcoholic beverage consumption. The point estimates of adjusted odds ratios for an association between alcoholic beverage consumption and the risk for stomach cancer were between 2.4 and 2.8 for 2–3 drinks per day.
2.7.3. anatomic.subsite.and.histological.type.(Table.2 .40)
Among 12 case–control studies of both cardia cancer and distal stomach cancer, eight demonstrated a stronger association for cardia cancer than for distal stomach
498 IARC MONOGRAPHS VOLUME 96

499A
LCO
HO
L CO
NSU
MPTIO
Ntable 2.38 Case–control studies of stomach cancer and alcoholic beverage consumption
Reference, study location, period
Characteristics of cases
Characteristics of controls
exposure assessment
Organ site (ICD code)
exposure categories
No. of exposed cases
Relative risk (95% CI)
Adjustment factors
Comments
Lee et.al. (1990), Taiwan, China, 1954–88
210 (123 men, 87 women); histologically confirmed; adenocarcinoma, 97.7%; other type of carcinoma, 2.3%; participation rate, 90%; death certificate from Taiwan Provincial Department of Health
810 (478 men, 332 women) from ophthalmic service in four major hospitals in Taibei; matched with cases on hospital, age, sex; participation rate, 96%
Interviewer-administered structured questionnaire
Days/weekNone 1–3 ≥4
150 21 39
1.0 0.93 1.51; p<0.05
Smoking; green tea drinking, salted meat consumption, fried food consumption, fermented bean consumption, milk consumption
Frequency and duration of alcoholic beverage drinking both associated with stomach cancer; dose–response relationship
Boeing et.al. (1991), Germany, 1985–88
143 incident, almost equal number of men and women, aged 32–80 years; histologically confirmed; patients from 5 hospitals in Germany
579 hospital patients and visitors; matched by 2:1 match by age (±3 years), sex
Interviewer-administered standardized questionnaire
BeerNone <100 g/day 100–500 g/day >500 g/day WineNone <20 g/day >20 g/day LiquorNone <2 g/day >2 g/day
37
24 50 32
69 53 21
107 22 14
1.0 1.12 (0.62–2.01) 2.22 (1.30–3.77) 1.82 (0.95–3.50) p<0.05 1.0 0.94 (0.61–1.45) 0.52 (0.30–0.93) p<0.05 1.0 0.75 (0.43–1.29) 0.52 (0.27–1.00) p<0.05
Age, sex, hospital
Beer is the dominant alcoholic beverage in the study area.

500IA
RC M
ON
OG
RA
PHS V
OLU
ME 96
Reference, study location, period
Characteristics of cases
Characteristics of controls
exposure assessment
Organ site (ICD code)
exposure categories
No. of exposed cases
Relative risk (95% CI)
Adjustment factors
Comments
Hoshiyama & Sasaba (1992a,b), Saitama, Japan, 1984–90
216 single and 35 multiple, newly diagnosed stomach adenocarcinomas (men); participation rate, 73%
483 randomly selected from electoral roll; stratification by sex, age; participation rate, 28%
Interviewer-administered standardized questionnaire
Single stomachcancerNever Past Occasional Daily Total.alcoholconsumption(mL/lifetime)Non-drinker <500 000 ≥500 000 Multiple stomachcancerNever Past Occasional Daily Total.alcoholconsumption(mL/lifetime)Non-drinker <500 000 ≥500 000
33 11 48 124
1.0 1.0 (0.4–2.2) 1.0 (0.6–1.7) 1.0 (0.6–1.6) p=0.56 1.0 0.9 (0.6–1.6) 1.1 (0.7–1.9) 1.0 4.7 (1.0–21.6) 2.6 (0.7–9.6) 1.4 (0.4–5.2) 1.0 1.7 (0.4–6.4) 2.5 (0.7–9.3)
Age, smoking status
No association between single and multiple stomach cancer risk and alcoholic beverage consumption
table 2.38 (continued)

501A
LCO
HO
L CO
NSU
MPTIO
N
Reference, study location, period
Characteristics of cases
Characteristics of controls
exposure assessment
Organ site (ICD code)
exposure categories
No. of exposed cases
Relative risk (95% CI)
Adjustment factors
Comments
Jedrychowski et.al. (1993), Poland, 1986–90
520 men, aged <75 years; histologically confirmed, classified according to the Lauren criteria; 137 cardia (58% intestinal, 20% diffuse type), 383 non-cardia (51.2% intestinal, 36% diffuse type); participation rate, 100%
520 men from nine university hospitals in Poland admitted mostly for accidents, orthopaedic problems or general surgery; matched by age (±5 years); disease of gastrointestinal tract and other cancers excluded; participation rate, 100%
Interviewer-administered standardized questionnaire
average.quantity.ofvodka.per.occasionNon-drinker 100 g 250 g >250 g Frequency.of.vodkadrinkingNon-drinker Very rare (<1/month) 1–3/month ≥1/week Vodka.drinking.on.anempty.stomachNon-drinker Not drinking before breakfast Drinking before breakfast
68 85
208 159
68 132
205 115
68 401
51
1.0 1.99 (1.23–3.23) 2.01 (1.33–3.05) 2.43 (1.57–3.75) p<0.001 1.0 1.83 (1.18–2.83) 2.09 (1.38–3.16) 3.06 (1.90–4.95) p<0.001 1.0 2.09 (1.42–3.08) 2.98 (1.60–5.53) p<0.001
Hospital, age, sex, occupation, education, sausage consumption, fruit/vegetable consumption, smoking
Non-drinkers: abstainers or who reported drinking vodka occasionally but less than 100 g at a time; those who drank vodka before breakfast had a nearly threefold elevated risk; findings on alcoholic beverages other than vodka not reported.
table 2.38 (continued)
502IA
RC M
ON
OG
RA
PHS V
OLU
ME 96
Reference, study location, period
Characteristics of cases
Characteristics of controls
exposure assessment
Organ site (ICD code)
exposure categories
No. of exposed cases
Relative risk (95% CI)
Adjustment factors
Comments
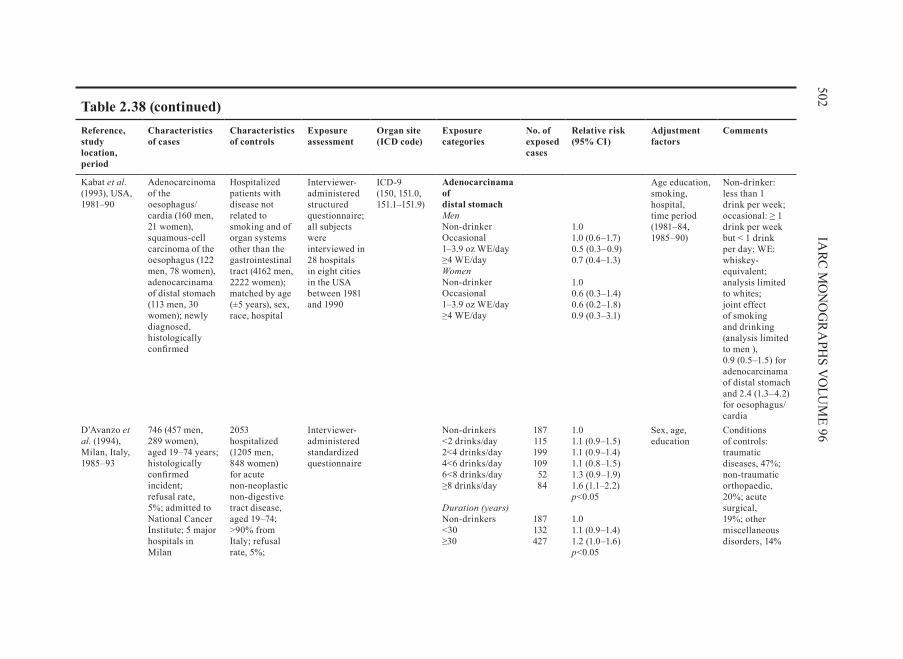
Kabat et.al. (1993), USA, 1981–90
Adenocarcinoma of the oesophagus/ cardia (160 men, 21 women), squamous-cell carcinoma of the oesophagus (122 men, 78 women), adenocarcinama of distal stomach (113 men, 30 women); newly diagnosed, histologically confirmed
Hospitalized patients with disease not related to smoking and of organ systems other than the gastrointestinal tract (4162 men, 2222 women); matched by age (±5 years), sex, race, hospital
Interviewer-administered structured questionnaire; all subjects were interviewed in 28 hospitals in eight cities in the USA between 1981 and 1990
ICD-9 (150, 151.0, 151.1–151.9)
Adenocarcinama ofdistal stomachMenNon-drinker Occasional 1–3.9 oz WE/day ≥4 WE/day WomenNon-drinker Occasional 1–3.9 oz WE/day ≥4 WE/day
1.0 1.0 (0.6–1.7) 0.5 (0.3–0.9) 0.7 (0.4–1.3) 1.0 0.6 (0.3–1.4) 0.6 (0.2–1.8) 0.9 (0.3–3.1)
Age education, smoking, hospital, time period (1981–84, 1985–90)
Non-drinker: less than 1 drink per week; occasional: ≥ 1 drink per week but < 1 drink per day; WE: whiskey-equivalent; analysis limited to whites; joint effect of smoking and drinking (analysis limited to men ), 0.9 (0.5–1.5) for adenocarcinama of distal stomach and 2.4 (1.3–4.2) for oesophagus/cardia
D’Avanzo et.al. (1994), Milan, Italy, 1985–93
746 (457 men, 289 women), aged 19–74 years; histologically confirmed incident; refusal rate, 5%; admitted to National Cancer Institute; 5 major hospitals in Milan
2053 hospitalized (1205 men, 848 women) for acute non-neoplastic non-digestive tract disease, aged 19–74; >90% from Italy; refusal rate, 5%;
Interviewer-administered standardized questionnaire
Non-drinkers <2 drinks/day 2<4 drinks/day 4<6 drinks/day 6<8 drinks/day ≥8 drinks/day Duration.(years)Non-drinkers <30 ≥30
187 115 199 109 52 84
187 132 427
1.0 1.1 (0.9–1.5) 1.1 (0.9–1.4) 1.1 (0.8–1.5) 1.3 (0.9–1.9) 1.6 (1.1–2.2) p<0.05 1.0 1.1 (0.9–1.4) 1.2 (1.0–1.6) p<0.05
Sex, age, education
Conditions of controls: traumatic diseases, 47%; non-traumatic orthopaedic, 20%; acute surgical, 19%; other miscellaneous disorders, 14%
table 2.38 (continued)

503A
LCO
HO
L CO
NSU
MPTIO
N
Reference, study location, period
Characteristics of cases
Characteristics of controls
exposure assessment
Organ site (ICD code)
exposure categories
No. of exposed cases
Relative risk (95% CI)
Adjustment factors
Comments
Falcao et.al. (1994), Portugal
74 selected from patients undergoing gastroscopy; histologically confirmed
193 patients undergoing gastroscopy or colonoscopy or other recto-sigmoidal procedure; patients accompanying patients; matched for age (± 5 years), sex
Interviewer-administered structured questionnaire
red.wine.consumedper.week (g.of.alcohol)<187 187–372 373–559 ≥560
1.0 1.36 (0.64–2.93) 1.77 (0.63–4.98) 3.67 (1.42–9.49)
Hansson et.al. (1994), central and northern Sweden, 1989–92
338 (218 men, 120 women), aged 40–79 years; histologically confirmed; 74.1% of original sample
679 randomly selected from population registers; mean age, 67 years; 1:2 frequency-matched by age strata, sex; participation rate, 77.3%
Interviewer-administered structured questionnaire
Total.alcoholconsumption.(mL100%.alcohol/month)Non-drinkers 1–35 36–160 >160
83 95 87 73
1.0 1.17 (0.81–1.70) 1.11 (0.75–1.64) 0.92 (0.60–1.42) p=0.64
Age, gender, socioeconomic status
High alcohol intake tended to increase the risk associated with tobacco use; among non-drinkers, odds ratio for tobacco use was 0.53 (0.25–1.12) and, among drinkers, was 1.77 (1.22–2.57) (p=0.0073)
table 2.38 (continued)

504IA
RC M
ON
OG
RA
PHS V
OLU
ME 96
Reference, study location, period
Characteristics of cases
Characteristics of controls
exposure assessment
Organ site (ICD code)
exposure categories
No. of exposed cases
Relative risk (95% CI)
Adjustment factors
Comments
Inoue et.al. (1994), Nagoya, Japan, 1988–91
668 (420 men , 248 women); histologically confirmed; 123 cardia, 218 middle (body), 256 antrum, 71 unclassified
668 (420 men , 248 women) with no history of cancer or any other specific disease, randomly selected from outpatients at same hospital; matched by sex, age (± 2 years), time of hospital visit
Common self-administered questionnaire
ICD-9 (151.0–151.9)
Drinker (versus non- drinker) Current drinker Former drinker <1 year after quitting ≥1 year after quitting
1.23 (0.92–1.65) 1.16 (0.86–1.56) 1.87 (1.11–3.15) p<0.052.60 (1.09–6.19) p<0.05 1.60 (0.87–2.94)
Sex Joint effect of smoking and drinking: 1.97 (1.14–3.42); especially in the development of cardia cancer, 4.70 (1.10–20.2) ; drinkers included ‘ex-drinkers’; only data for men were presented.
table 2.38 (continued)

505A
LCO
HO
L CO
NSU
MPTIO
N
Reference, study location, period
Characteristics of cases
Characteristics of controls
exposure assessment
Organ site (ICD code)
exposure categories
No. of exposed cases
Relative risk (95% CI)
Adjustment factors
Comments
Gajalakshmi & Shanta (1996), India,1988–90
388 incident (287 men, 101 women); 75% confirmed histologically, 25% by barium meal, exploratory surgery or endoscopy
287 men and 101 women cancer patients from Cancer Institute, diagnosed in 1988–90; site of cancer: penis, 23.5%; bone and connective tissue, 15.2%; skin, 13.1%; cervix, 11.9%; leukaemia, 6.2%; prostate, 6.2%; breast, 5.2%; other sites, 18.7%; 1:1 matched by age (± 5 years), sex, religion, mother tongue; cancers of gastrointestinal tract, bladder and pancreas and smoking-related cancers excluded
Interviewer-administered standardized questionnaire
Non–drinkers Former drinkers Current drinkers Former and current
285 37 66 103
1.0 1.4 (0.54–3.40) 0.8 (0.41–1.77) 1.1 (0.58–1.95)
Chewing habit, income group, education, residence (multivariate model)
Controls were cancer patients.
table 2.38 (continued)

506IA
RC M
ON
OG
RA
PHS V
OLU
ME 96
Reference, study location, period
Characteristics of cases
Characteristics of controls
exposure assessment
Organ site (ICD code)
exposure categories
No. of exposed cases
Relative risk (95% CI)
Adjustment factors
Comments
Ji et.al. (1996), Shanghai, China, 1988–89
1124 (770 men, 354 women), aged 20–69 years; 52.1% confirmed histologically, 48% by surgery, endoscopy, x–rays or ultrasound as cancer of cardia (16%), distal stomach (70%) or unclassified (14%); participation rate, 65.5%
1451 (819 men, 632 women) randomly selected permanent residents in Shanghai; frequency-matched for age, sex; participation rate, 85.8%
Interviewer-administered structured questionnaire
ICD-9 (151.0, 151.1–151.8, 151.9)
Ethanol.intake(g/week)<175 175–349 350–524 ≥525 Non-drinker Former drinker Current drinker Duration.(years)<15 15–< 34 ≥35 Lifetime.ethanolintake.(g/week.×years)<2450 2450–7462 7463–15 399 ≥15 400
75 80 79 79
483 27
307
100 113 121
76 79 79 78
Men1.02 (0.71–1.49) 1.00 (0.70–1.43) 1.08 (0.75–1.53) 1.19 (0.84–1.68) p=0.361.0 1.91 (1.16–3.15) 1.04 (0.84–1.30) 0.80 (0.57–1.13) 1.21 (0.90–1.63) 1.30 (0.96–1.75) p=0.06 0.68 (0.46–1.02) 1.37 (0.98–1.93) 0.87 (0.60–1.25) 1.39 (0.99–1.95) p=0.12
Age, income, education, smoking
Risk for distal cancer among men increased more than twofold (odds ratio, 2.21; 95% CI, 1.28–3.82) for users of both tobacco and alcohol relative to non-users but no statistically significant interaction between lifetime amounts of smoking and alcoholic beverage drinking; data for women not presented.
table 2.38 (continued)

507A
LCO
HO
L CO
NSU
MPTIO
N
Reference, study location, period
Characteristics of cases
Characteristics of controls
exposure assessment
Organ site (ICD code)
exposure categories
No. of exposed cases
Relative risk (95% CI)
Adjustment factors
Comments
Zhang et.al. (1996), USA, 1992–94
95 (79 men, 16 women) incident with pathological diagnosis of adenocarcinomas of oesophagus and gastric cardia, 67 (43 men, 24 women) with adenocarcinoma of the distal stomach; participation rate, 81%
132 (62 men, 70 women) consecutive patients scheduled to have an upper gastrointestinal endoscopy in the cancer centre and later classified as cancer-free; participation rate, 81%
Self-administered modified National Cancer Institute Health Habits History Questionnaire
ICD-0 (150.0–150.9; 151.0, 151.1–151.9)
aCDs No ≤1/week >1/week aCogCNo ≤1/week >1/week
20
20 27
14 26 55
1.00 1.60 (0.65–3.93) 0.98 (0.43–2.27) p=0.93 1.0 3.02 (1.14–8.02) 2.02 (0.85–4.82) p=0.19
Age, sex, race, education, pack–years of smoking, body mass index, total dietary intake of calories
Frequency of self-reported alcohol use multiplied by 0.5 if patient’s portion size was small; by 1 if the portion size was medium; and by 1.5 if the portion size was large.
Gammon et.al. (1997), Connecticut, USA, 1993–95
Gastric cardia adenocarcinomas (223 men, 38 women), other gastric adenocarcinomas (254 men, 114 women); aged 30–79 years; histologically confirmed, newly diagnosed; all identified by use of established rapid-reporting systems
695 (555 men, 140 women) identified by Waksberg’s random-digit dialling, aged 30–64 years; frequency-matched by age, sex; overall response rate, 70.2%
Structured questionnaire administered by trained interviewers
any.intake Never Ever <5 drinks/week 5–11 drinks/week 12–30 drinks/week >30 drinks/week
125 238 74 68 55
41
gastric.adenocarcinoma1.0 0.8 (0.6–1.1) 0.7 (0.5–1.1) 0.9 (0.6–1.3) 0.7 (0.4–1.0) 0.6 (0.4–1.0)
Age, sex, geographical centre, race, body mass index, income, cigarette smoking, all other types of alcohol use
Interviews administered directly to the study subject, rather than to the closest next of kin (usually the spouse) for more than 67% of cases and 96% of controls
table 2.38 (continued)

508IA
RC M
ON
OG
RA
PHS V
OLU
ME 96
Reference, study location, period
Characteristics of cases
Characteristics of controls
exposure assessment
Organ site (ICD code)
exposure categories
No. of exposed cases
Relative risk (95% CI)
Adjustment factors
Comments
Muñoz et.al. (1997), northern Italy, 1985–92
88, aged <75 years (median age, 62 years) reported a family history of stomach cancer in first degree relatives; refusal rate <3%
103 hospital controls (median age, 57 years) reported a family history of stomach cancer in first degree relatives; 80% of cases and controls resided in the same region and >90% in northern Italy.
Structured interview
<1 day/week 1–3 days/week ≥4 days/week
26 31 31
1.0 0.61 (0.34–1.42) 0.73 (0.27–1.98)
Sex, age, residence, education
88 cases and 103 controls reported a family history of stomach cancer in first degree relatives.
DeStefani et.al. (1998a), Montevideo, Uruguay, 1992–96
331 men, aged 25–84 years; admitted to any of four major hospitals in Montevideo; 311 microscopically confirmed adenocarcinoma of stomach; 77.2% located in the antrum and pylorus; response rate, 92.8%
622 hospitalized men; frequency-matched by age, residence; response rate, 92.6%
Interviewer-administered standardized questionnaire
Total.alcoholconsumptionNon–drinkers 1–60 g 61–120 g >120
64 70 65 112
1.0 1.0 (0.7–1.5) 1.5 (0.9–2.3) 2.4 (1.6–3.7) p<0.001
Age, residence, smoking, vegetable intake
Pure alcohol content was calculated according to concentrations specific to Uruguay: 6% for beer; 12% for wine and 46% for spirits.
table 2.38 (continued)

509A
LCO
HO
L CO
NSU
MPTIO
N
Reference, study location, period
Characteristics of cases
Characteristics of controls
exposure assessment
Organ site (ICD code)
exposure categories
No. of exposed cases
Relative risk (95% CI)
Adjustment factors
Comments
López-Carrillo et.al. (1998), Mexico (no study dates given)
220 (44.5% women 55.4% men), aged 24–88 years; histologically confirmed adenocarcinoma of the stomach from 15 large hospitals
752 (60.6% women, 39.4% men) population-based, aged 20–98 years; surrogate responders, 7%
Structured interview
Ethanol.(g/day)Abstainers <1.5 1.5–4.9 ≥5.0
91
23 59 47
1.0 1.01 (0.52–1.96) 1.27 ( 0.76–2.11) 1.93 (1.00–3.71) p=0.068
Age, sex, total calorie intake, chili pepper, history of peptic ulcer, socioeconomic status, cigarette smoking, fruit, vegetables, salt, processed meats
One drink (1 oz or 30 mL) of tequila = 14.03 g ethanol; one drink (200 mL can/bottle) of beer = 12.96 g; one drink (60 mL) of wine = 9.58 g; and one drink of rum or brandy (30 mL) = 14.03 g ethanol; cases represented 80% of stomach cancer cases reported to the Mexican National Cancer Registry
table 2.38 (continued)

510IA
RC M
ON
OG
RA
PHS V
OLU
ME 96
Reference, study location, period
Characteristics of cases
Characteristics of controls
exposure assessment
Organ site (ICD code)
exposure categories
No. of exposed cases
Relative risk (95% CI)
Adjustment factors
Comments
Chow et.al. (1999), Warsaw, Poland, 1994–97
464 (302 men, 162 women) from 22 hospitals in Warsaw, aged 21–79 years; confirmed histologically mainly as intestinal (67%) or diffuse (14%); participation rate, 90%
480 (314 men, 166 women) Warsaw residents randomly selected from a computerized registry of all legal residents in Poland; frequency-matched by age, sex; participation rate, 82%
Interviewer-administered standardized questionnaire; a 30-mL blood sample collected
(ICD-0; 151 ICD-0-2 C16)
Current non–drinker <1 drink/week 1–<3 drinks/week 3–<7 drinks/week ≥7 drinks/week age.started.(years)<20 20–24 ≥25 Drink–years<10 10–19 20–29 30–39 40–79 ≥80
170
41 42 32 79
81 66 44
72 29 20 12 32 27
1.0 0.7 ( 0.4–1.2) 0.5 ( 0.3–0.9) 0.4 (0.2–0.7) 1.2 ( 0.7–2.0) 0.5 (0.3–0.8) 0.5 ( 0.3–0.9) 1.0 (0.6–1.7) 0.6 (0.4–0.9) 0.5 ( 0.3–0.9) 0.6 (0.3–1.3) 0.5 (0.2–1.3) 1.3 ( 0.6–2.6) 1.0 (0.5–2.0)
Age, education, years lived on a farm, pack–years of cigarette smoking, history of cancer
Current drinking of beer, wine or liquor was inversely related to risk for stomach cancer among men but not women.
Ye et.al. (1999), northern and central Sweden, 1989–95
90 (71 men, 19 women) gastric cardia cancer, 260 (190 men, 70 women) and 164 (87 men, 77 women) distal gastric cancer of intestinal and diffuse types, aged 40–79 years; histologically confirmed; participation rate, 62%
1164 (779 men, 385 women) randomly selected from population registers, aged 40–79 years; frequency-matched by age, sex; participation rate, 76%
Interviewer-administered structured questionnaire
Total.alcoholconsumption.(mL100%.alcohol/month)Non-drinkers 1–35 36–160 >160 Non-drinkers 1–35 36–160 >160
52 64 73 66
36 50 42 34
Intestinal type1.0 1.2 (0.8–1.9) 1.2 (0.8–1.9) 1.2 (0.7–1.9) p=0.56Diffuse type1.0 1.3 (0.8–2.1) 1.0 (0.6–1.7) 1.0 (0.5–1.8) p=0.73
Age, gender, residence area, body mass index, socioeconomic status, smoking, use of smokeless tobacco, use of different kinds of alcoholic beverages
Interviewed about lifetime smoking, use of smokeless tobacco and use of alcohol 20 years ago
table 2.38 (continued)
511A
LCO
HO
L CO
NSU
MPTIO
N
Reference, study location, period
Characteristics of cases
Characteristics of controls
exposure assessment
Organ site (ICD code)
exposure categories
No. of exposed cases
Relative risk (95% CI)
Adjustment factors
Comments
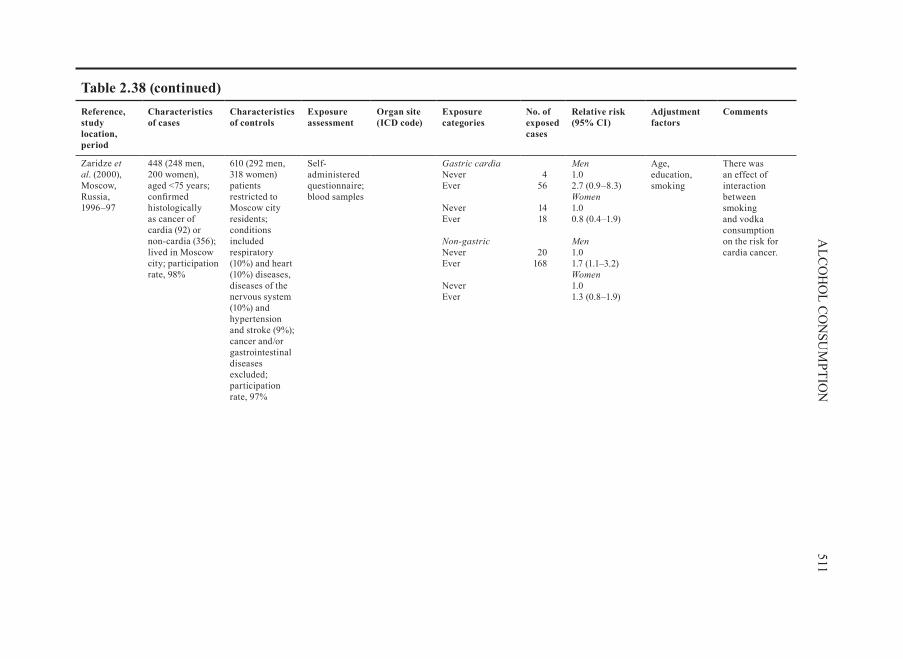
Zaridze et.al. (2000), Moscow, Russia, 1996–97
448 (248 men, 200 women), aged <75 years; confirmed histologically as cancer of cardia (92) or non-cardia (356); lived in Moscow city; participation rate, 98%
610 (292 men, 318 women) patients restricted to Moscow city residents; conditions included respiratory (10%) and heart (10%) diseases, diseases of the nervous system (10%) and hypertension and stroke (9%); cancer and/or gastrointestinal diseases excluded; participation rate, 97%
Self-administered questionnaire; blood samples
gastric.cardiaNever Ever Never Ever non-gastricNever Ever Never Ever
4
56
14 18
20 168
Men1.0 2.7 (0.9–8.3) Women1.0 0.8 (0.4–1.9) Men1.0 1.7 (1.1–3.2) Women1.0 1.3 (0.8–1.9)
Age, education, smoking
There was an effect of interaction between smoking and vodka consumption on the risk for cardia cancer.
table 2.38 (continued)

512IA
RC M
ON
OG
RA
PHS V
OLU
ME 96
Reference, study location, period
Characteristics of cases
Characteristics of controls
exposure assessment
Organ site (ICD code)
exposure categories
No. of exposed cases
Relative risk (95% CI)
Adjustment factors
Comments
Muñoz et.al. (2001), Venezuela, 1991–97
292, aged >35 years; histologically confirmed; non-epithelial tumours of the stomach excluded
485 (119 hospital, 366 neighbourhood); 1:2 matched by age (±5 years), sex
Structured interview
Never/occasional Current Former
89 76 42
Men1.0 2.9 (1.9–4.3) 3.5 (2.0–6.0)
Age, socioeconomic status
Only 1/143 female controls reported being an ever drinker; analysis of alcoholic beverage consumption therefore confined to men; most common forms of alcohol consumed were beer and aguardiente (sugar cane spirit): 69% of men who were current or former drinkers drank beer, 52% drank aguardiente and 28% drank other alcoholic drinks.
table 2.38 (continued)

513A
LCO
HO
L CO
NSU
MPTIO
N
Reference, study location, period
Characteristics of cases
Characteristics of controls
exposure assessment
Organ site (ICD code)
exposure categories
No. of exposed cases
Relative risk (95% CI)
Adjustment factors
Comments
Wu et.al. (2001), Los Angeles, USA, 1992–97
277 cancer of cardia (231 men, 46 women), 443 distal stomach (261 men, 182 women), aged 30–74 years; histologically confirmed; participation rate, 56%
1356 whites, latinos, African-Americans and Asian Americans (999 men, 357 women); matched by sex, race, date of birth, ethnicity; neighbourhood control subject was sought by use of a systematic algorithm based on the address of the case patient; diagnosis of stomach or oesophageal cancer excluded
Interviewer-administered structured questionnaire, completed by 55% of those identified and 77% of those approached
gastric.cardia Never Former Current Distal Never Former Current
48
118 109
148 150 194
1.0 0.91 (0.6–1.4) 0.98 (0.7–1.5) 1.0 0.85 (0.6–1.2) 0.96 (0.7–1.3)
Age, sex, smoking, race, birth place, education
Race: whites, African-Americans, latinos and Asian Americans
table 2.38 (continued)

514IA
RC M
ON
OG
RA
PHS V
OLU
ME 96
Reference, study location, period
Characteristics of cases
Characteristics of controls
exposure assessment
Organ site (ICD code)
exposure categories
No. of exposed cases
Relative risk (95% CI)
Adjustment factors
Comments
Hamada et.al. (2002), Sao Paulo, Brazil, Japanese ancestry, 1991–94
96 (60 men, 36 women) of Japanese ancestry; aged 38–89 years; histologically confirmed; among 87 cases with known location, 80 tumours (92%) were in the lower portion ( body or antrum); no patients refused the interview
192 (120 men, 72 women) patients; 80 of 192 patients recruited voluntarily from the Japanese community in Sao Paulo; matched by age (± 5 years), sex
Interviewer-administered standardized questionnaire; 15-mL blood sample
Consumptionfrequency<1/month 1 day/month– 4 days/week Daily Lifetime.alcoholconsumption<1000 g 1000–2000 g >2000 g
68 17
11
84 2 8
1.0 1.7 (0.8–3.9) 1.8 (0.7–4.7) p = 0.16 1.0 0.5 (0.1–2.7) 2.0 (0.6–2.5) p = 0.38
Country of birth
Alcohol consumption not associated with risk for stomach cancer
Kikuchi et.al. (2002), Tokyo, Japan, 1993–95
718 (494 men, 224 women), aged <70 years; histologically confirmed; classified by type (intestinal or diffuse), stage (early or advanced) and subsite of the lesions (proximal, middle or distal)
883 (448 men, 435 women) recruited from several health check programmes in a hospital in the same area between June 1993 and November 1994
Self-administered questionnaire; sera provided
alcohol–yearsa
0 (never drinker) Occasional (1–134.9) 135–1349.9 ≥1350 0 (never drinker) Occasional (0.1– 134.9) ≥135.0
34 31
90 138
57 29
15
Men1.89 (0.97– 3.69) 1.0 2.82 (1.63– 4.86) 2.84 (1.97–4.83) Women 1.54 (0.90–2.63) 1.0 1.39 (0.66–2.93)
Age, smoking, helicobacter.pylori status
Alcohol–years (mL intake of pure alcohol per day multiplied by years of drinking); a J- or U-shaped effect on risk for stomach cancer; models designated ‘occasional’ drinker as reference or ‘never’ drinker as reference
table 2.38 (continued)

515A
LCO
HO
L CO
NSU
MPTIO
N
Reference, study location, period
Characteristics of cases
Characteristics of controls
exposure assessment
Organ site (ICD code)
exposure categories
No. of exposed cases
Relative risk (95% CI)
Adjustment factors
Comments
Nishimoto et.al. (2002), Sao Paulo, non-Japanese Brazilians, 1991–94
236 (170 men, 66 women) with no Asian background, aged 40–79 years; 78% white; no refusal to be interviewed
236 (170 men, 66 women) hospital-based; matched by age (±5 years), sex; 86.4% white; refusal rate, 8.4%
Interviewer-administered standardized questionnaire; 15-mL blood sample
Consumptionfrequency<1/month 1 day/month– 4 days/week Daily Lifetime.alcoholconsumption<1000 g 1000–2000 g >2000 g
158 29
49
173 10 41
1.0 0.4 (0.2–0.8) 1.1 (0.7–1.9) p=0.93 1.0 1.9 (0.6–5.9) 1.0 (0.6–1.6) p=0.88
Race (white or non-white), education, fruit and vegetable intake
Alcohol consumption not associated with risk for stomach cancer; the association did not change when analysis restricted to men.
Shen et.al. (2004), China, 1997–98
165 (110 men, 55 women), aged 34–81 years; 108 intestinal-type gastric cancer, 57 gastric cardia cancer; identified by endoscopic and pathological diagnosis
295 (190 men, 105 women) healthy cancer-free subjects living in the same community, either siblings of cases or non-blood relatives (spouses and spouses’ siblings of same gender as cases), aged 30–78 years
Interviewer-administered structured questionnaire; blood sample
Never Current Past
97 18 50
1.00 0.18 (0.10–0.35) 1.80 (1.06–3.08) p<0.01
Age, gender Possible recruitment bias in the selection of controls including cases’ siblings
ACDS, adenocarcinoma of distal stomach; ACOGC, adenocarcinoma of oesophagus and gastric cardia; CI, confidence intreval; ICD, International Clasification of Diseases Odds ratio when risk of the second category is defined as 1.0
table 2.38 (continued)

516IA
RC M
ON
OG
RA
PHS V
OLU
ME 96
table 2.39 Case–control studies of stomach cancer and alcoholic beverage consumption in China (published in the Chinese literature)
Reference, study location, period
Characteristics of cases
Characteristics of controls
exposure assessment
exposure categories
Relative risk (95% CI)
Adjustment factors
Comments
Hu et.al . (1989), Heilungjiang, Harbin, 1985–86
241; age and sex distribution not given; 100% histologically confirmed; response rate not given
Hospital patients from surgery department (non-cancer); matched to cases on age, sex, residence; response rate not given
Interviewer- administered questionnaire
Salty food intake + alcoholic beverage drinking Alcoholic beverage drinking + years of having chronic gastritis
odds.ratios1.80 5.53
Hardness of food, average vegetable intake, smoking index, salty food intake, years of having chronic gastritis
95% CI not provided [p-value <0.05]
Wu & Yao (1994), Shanshi, 1990
200 incident (178 men, 22 women), aged 30–79 years; 100% histologically confirmed; response rate not given
200 population; matched to cases on residence, sex, race, occupation, age
Interviewer- administered questionnaire
Intake>1 time/week
odds.ratio2.87
Logistic models
517A
LCO
HO
L CO
NSU
MPTIO
N
Reference, study location, period
Characteristics of cases
Characteristics of controls
exposure assessment
exposure categories
Relative risk (95% CI)
Adjustment factors
Comments
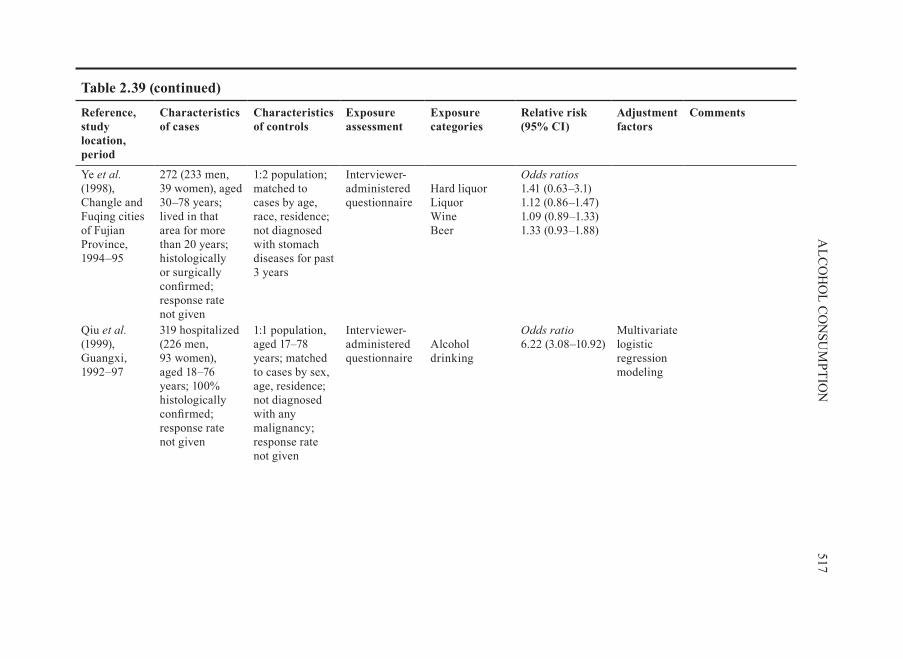
Ye et.al . (1998), Changle and Fuqing cities of Fujian Province, 1994–95
272 (233 men, 39 women), aged 30–78 years; lived in that area for more than 20 years; histologically or surgically confirmed; response rate not given
1:2 population; matched to cases by age, race, residence; not diagnosed with stomach diseases for past 3 years
Interviewer- administered questionnaire
Hard liquor Liquor Wine Beer
odds.ratios1.41 (0.63–3.1) 1.12 (0.86–1.47) 1.09 (0.89–1.33) 1.33 (0.93–1.88)
Qiu et.al . (1999), Guangxi, 1992–97
319 hospitalized (226 men, 93 women), aged 18–76 years; 100% histologically confirmed; response rate not given
1:1 population, aged 17–78 years; matched to cases by sex, age, residence; not diagnosed with any malignancy; response rate not given
Interviewer- administered questionnaire
Alcohol drinking
odds.ratio6.22 (3.08–10.92)
Multivariate logistic regression modeling
table 2.39 (continued)
518IA
RC M
ON
OG
RA
PHS V
OLU
ME 96
Reference, study location, period
Characteristics of cases
Characteristics of controls
exposure assessment
exposure categories
Relative risk (95% CI)
Adjustment factors
Comments
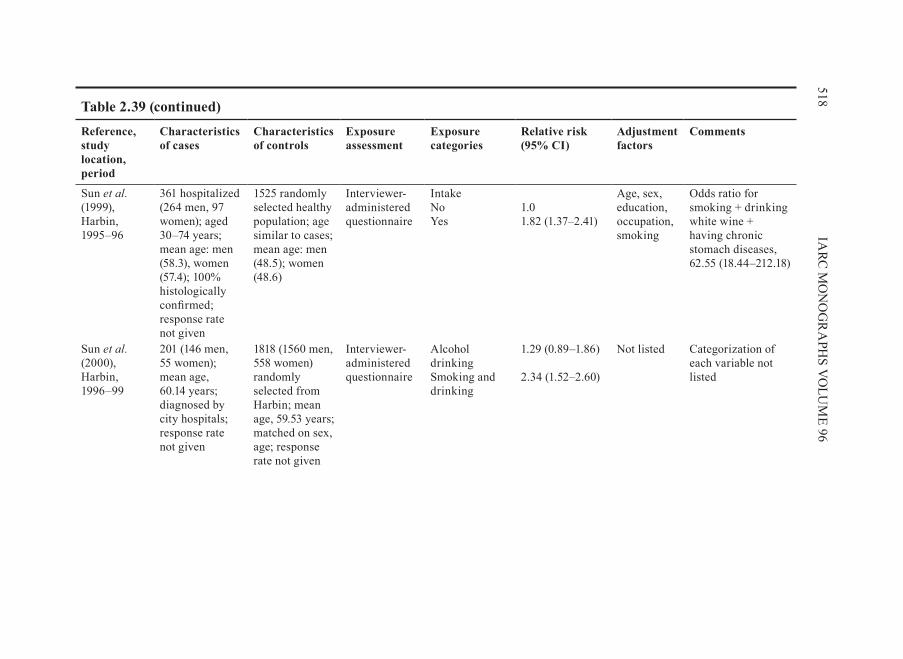
Sun et.al . (1999), Harbin, 1995–96
361 hospitalized (264 men, 97 women); aged 30–74 years; mean age: men (58.3), women (57.4); 100% histologically confirmed; response rate not given
1525 randomly selected healthy population; age similar to cases; mean age: men (48.5); women (48.6)
Interviewer- administered questionnaire
Intake No Yes
1.0 1.82 (1.37–2.41)
Age, sex, education, occupation, smoking
Odds ratio for smoking + drinking white wine + having chronic stomach diseases, 62.55 (18.44–212.18)
Sun et.al . (2000), Harbin, 1996–99
201 (146 men, 55 women); mean age, 60.14 years; diagnosed by city hospitals; response rate not given
1818 (1560 men, 558 women) randomly selected from Harbin; mean age, 59.53 years; matched on sex, age; response rate not given
Interviewer- administered questionnaire
Alcohol drinking Smoking and drinking
1.29 (0.89–1.86) 2.34 (1.52–2.60)
Not listed Categorization of each variable not listed
table 2.39 (continued)

519A
LCO
HO
L CO
NSU
MPTIO
N
Reference, study location, period
Characteristics of cases
Characteristics of controls
exposure assessment
exposure categories
Relative risk (95% CI)
Adjustment factors
Comments
Ding et.al . (2001a,b) Taixing, Jiungsu, 1998–99
591 oesophageal cancer, 360 liver cancer, 430 stomach cancer (921 men, 460 women), aged 21–89 years; not histologically confirmed; response rate not given
1:1 population; matched on age, sex, residential area; response rate not given
Interviewer- administered questionnaire
Drinking white wine
odds.ratio2.76
Results from multivariate logistic regression models
95% CIs not provided; categorization of variable not clear
Shen et.al . (2001), Yangzhong, Jiangsu, 1997–98
265 with endoscopy and pathology diagnosis (117 from higher incidence area; 148 from lower incidence area); sex and age distribution not described, but percentage of men and mean age significantly higher in cases than in controls
2066 (850 from higher incidence area; 1216 from lower incidence area) selected from the spouse and siblings of cases or the sibling-in-law
Interviewer- administered questionnaire
Men ever drinking alcohol in higher incidence area Men ever drinking alcohol in lower incidence area
odds.ratio3.6 3.7 (1.3–10.8)
Results from multivariate logistic regression model
CI not clear
table 2.39 (continued)

520IA
RC M
ON
OG
RA
PHS V
OLU
ME 96
Reference, study location, period
Characteristics of cases
Characteristics of controls
exposure assessment
exposure categories
Relative risk (95% CI)
Adjustment factors
Comments
Tong et.al . (2001), Tongliao, Inner Mongolia, 1999
76 oesophageal cancer (71 men, 5 women), aged 39–80 years; mean age, 58.5 years; 44 stomach cancer (35 men, 9 women), aged 35–78 years; mean age, 58.6 years; 100% histologically confirmed; response rate not given
1:3 hospital patients, aged 33–82 years; mean age, 58.2 years; matched on age, sex, residence area, time of diagnosis; response rate not given
Interviewer- administered questionnaire
Oesophagus and stomach combined Alcohol drinking (Yes/No)
odds.ratio4.15 (1.71–15.92)
Results from multiple logistic regression model
table 2.39 (continued)

521A
LCO
HO
L CO
NSU
MPTIO
N
Reference, study location, period
Characteristics of cases
Characteristics of controls
exposure assessment
exposure categories
Relative risk (95% CI)
Adjustment factors
Comments
Zheng et.al . (2001), Fujian, 2000
251 (93 cardia, 85 non-cardia gastric cancer, 73 non-digestive tract cancer), aged 30–79 years; sex ratio (men/women), 6; lived in Fujian for more than 20 years; answered questions clearly; diagnosis confirmed by pathology, surgery, or endoscopy; response rate, 98.1%
97 hospital patients selected from orthopaedics and urinary departments, aged 30–79 years; lived in Fujian for more than 20 years; answered questions clearly; response rate, 98.1%
Interviewer- administered questionnaire
Hard liquor (Yes/No)
Cardia 3.25 (0.90–8.41) Non-cardia 2.08 (0.88–4.96)
Chen et.al . (2002b), Changle, Fujian, 1999
310, mean age, 60.8 years; sex ratio (male/female), 5; 95% histologically confirmed
1:1 selected from neighbours or colleagues of cases; matched to cases by age
Interviewer- administered questionnaire
No significant association between alcohol drinking and the use of refrigerator and the risk for stomach cancer.
table 2.39 (continued)

522IA
RC M
ON
OG
RA
PHS V
OLU
ME 96
Reference, study location, period
Characteristics of cases
Characteristics of controls
exposure assessment
exposure categories
Relative risk (95% CI)
Adjustment factors
Comments
Gao et.al . (2002a,b), Huaian, Jiangsu, 1997–2000
153 stomach cancer (118 men, 35 women); mean age, 61.1 years for men, 59.8 years for women; 141 oesophageal cancer (78 men, 63 women); mean age, 60.9 years for men, 60.7 years for women; 100% histologically confirmed; response rate not given
223 randomly selected population (149 men, 74 women); mean age, 58.9 years for men, 57.6 years for women; matched to cases on age; response rate not given
Questionnaire; blood samples
Alcohol drinking (frequently versus not)
1.76 (1.01–3.07) Sex, age, vegetable intake, fruit intake, pickled vegetables, meat intake, soya product intake
Alcohol drinking increased the risk for stomach cancer among GSTM1 non-null people.
table 2.39 (continued)
523A
LCO
HO
L CO
NSU
MPTIO
N
Reference, study location, period
Characteristics of cases
Characteristics of controls
exposure assessment
exposure categories
Relative risk (95% CI)
Adjustment factors
Comments
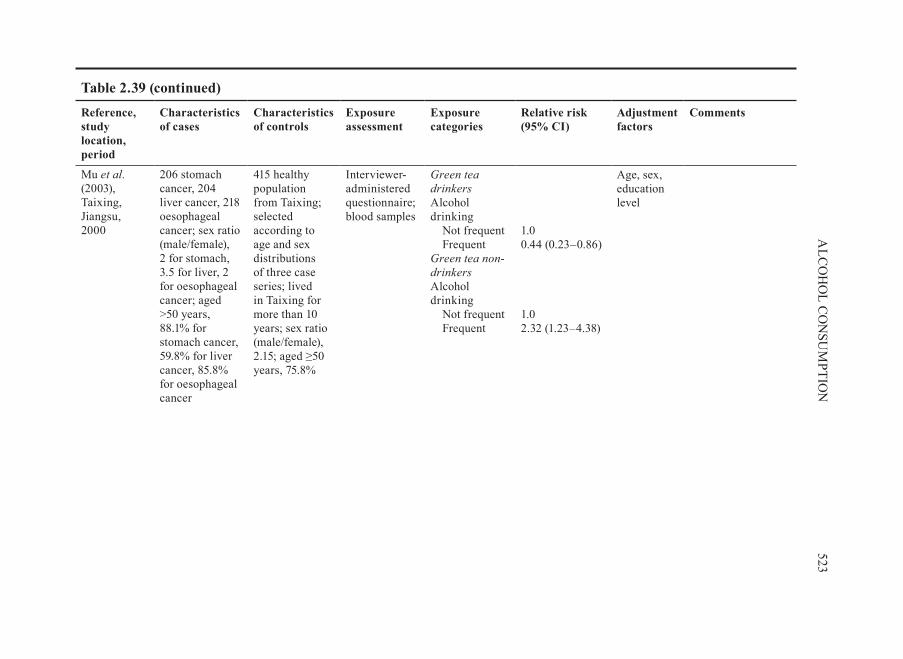
Mu et.al . (2003), Taixing, Jiangsu, 2000
206 stomach cancer, 204 liver cancer, 218 oesophageal cancer; sex ratio (male/female), 2 for stomach, 3.5 for liver, 2 for oesophageal cancer; aged >50 years, 88.1% for stomach cancer, 59.8% for liver cancer, 85.8% for oesophageal cancer
415 healthy population from Taixing; selected according to age and sex distributions of three case series; lived in Taixing for more than 10 years; sex ratio (male/female), 2.15; aged ≥50 years, 75.8%
Interviewer- administered questionnaire; blood samples
green.tea.drinkersAlcohol drinking Not frequent Frequent green.tea.non-drinkersAlcohol drinking Not frequent Frequent
1.0 0.44 (0.23–0.86) 1.0 2.32 (1.23–4.38)
Age, sex, education level
table 2.39 (continued)

524IA
RC M
ON
OG
RA
PHS V
OLU
ME 96
Reference, study location, period
Characteristics of cases
Characteristics of controls
exposure assessment
exposure categories
Relative risk (95% CI)
Adjustment factors
Comments
Fei & xiao (2004), Shanghai
189 hospitalized, aged 29–91 years; mean age, 63.6 years; sex ratio (male/female), 1.4; 100% histologically confirmed; response rate not given
567 selected from the same hospital (medical check-up patients, non-digestive tract disease, non-cancer patients) as cases or from neighbours of cases; no difference between case and control groups on age, sex, ethnic group, residential area; response rate not given
Interviewer- administered questionnaire
Alcohol drinking (yes vs no)
odds.ratio2.38 (1.48–3.82)
Univariate logistic regression analysis
table 2.39 (continued)

525A
LCO
HO
L CO
NSU
MPTIO
N
Reference, study location, period
Characteristics of cases
Characteristics of controls
exposure assessment
exposure categories
Relative risk (95% CI)
Adjustment factors
Comments
Yang et.al . (2004), Jintan, Huaian, Jiangsu, 1998–2003
285 (212 men, 73 women), aged 31–84 years; mean age, 61.4 years; % of histologically confirmed not given; response rate not given
265 (191 men, 74 women) aged 30–87 years; mean age, 61.5 years; selected and matched 1:1 to cases on residency, ethnic group, sex, age; residents with cancer and digestive tract diseases and those who did not answer questions clearly excluded; response rate not given
Questionnaire; blood sample
Alcohol drinking (yes/no)
p-value, 0.84 Crude analysis
table 2.39 (continued)

526IA
RC M
ON
OG
RA
PHS V
OLU
ME 96
Reference, study location, period
Characteristics of cases
Characteristics of controls
exposure assessment
exposure categories
Relative risk (95% CI)
Adjustment factors
Comments
Luo (2005), Luoyang, Henan, 2003–2004
153 (117 men, 36 women), aged 38–74 years; lived in Luoyang for at least 15 years
153 healthy selected randomly from Luoyang; matched to cases on age, sex, ethnicity; lived in Luoyang for more than 15 years
Interviewer- administered questionnaire
Alcohol drinking (yes versus no)
2.14 (1.42–3.21) Not described
Variables not well defined
CI, confidence interval; GSTM1, gluthathione s-transferase M1
table 2.39 (continued)

527A
LCO
HO
L CO
NSU
MPTIO
Ntable 2.40 Selected cohort and case–control studies of cancer in subsites of the stomach and intake of alcoholic beverage
Reference, study location, period
Alcoholic beverage consumption
No. of cases
Relative risk (95% CI)
No. of cases Relative risk (95% CI)
No. of cases
Relative risk (95% CI)
No. of cases
Relative risk (95% CI)
Cohort studies Sasazuki et.al. (2002), Japan, Japan Public Health Cohort Study
Cardia and upper third gastric
Distal gastric cancer
all.histological.types Differentiated.type Undifferentiated.type 0–3 times/month 0–161.0 g/week 162.0–322.0 g/week ≥322.5 g/week
3
8
13
11
1.0 2.5 (0.7–9.5) 3.3 (0.9–11.6) 3.0 (0.8–11.1) p=0.66
32
27
38
27
1.0 0.9 (0.5–1.5) 1.1 (0.7–1.8) 0.9 (0.5–1.5) p=1.00
17
11
15
20
1.0 0.7 (0.3–1.4) 0.9 (0.5–1.9) 1.3 (0.7–2.6) p=0.07
Lindblad et.al (2005), United Kingdom, General Practitioner Research Database (nested case–control study)
gastric.cardia non–cardia.gastric Unknown.subsite.of.gastric.adenocarcinoma
Odds ratio Odds ratio Units/day 0–2 3–15 16–34 >34 Unknown use
55 33 14 4 89
1.00 1.08 (0.70–1.69) 1.22 (0.67–2.24) 1.04 (0.37–2.93) 1.38 (0.84–2.26)
124 61 19 2 121
1.00 0.99 (0.72–1.36) 0.91 (0.55–1.51) 0.29 (0.07–1.18) 0.57 (0.38–0.87)
172 72 25 10
222
1.00 0.82 (0.61–1.09) 0.79 (0.51–1.22) 0.96 (0.49–1.87) 1.20 (0.89–1.62)

528IA
RC M
ON
OG
RA
PHS V
OLU
ME 96
Reference, study location, period
Alcoholic beverage consumption
No. of cases
Relative risk (95% CI)
No. of cases Relative risk (95% CI)
No. of cases
Relative risk (95% CI)
No. of cases
Relative risk (95% CI)
Case–control studies Jedrychowski et.al. (1993), Poland, 1986–90
Average vodka per occasion
Cardia Non-cardia
Intestinalis Diffusum Intestinalis DiffusumNon-drinker 100 g 250 g >250 g
6 13 36 24
1.0 2.12 (0.69–6.50) 2.28 (0.83–6.31) 3.04 (1.11–8.28) p=0.03
6 5 9 8
1.0 1.22 (0.28–5.35) 1.16 (0.31–4.40) 1.64 (0.46–5.83) p=0.47
26 38 77 58
1.0 2.48 (1.28–4.82) 2.06 (1.14–3.71) 2.47 (1.35–4.51)
20 17 57 44
1.0 1.10 (0.48–2.50) 1.70 (0.87–3.34) 1.81 (0.91–3.58)
Kabat et.al. (1993), USA, 1981–90
. Distal.oesophagus/cardia.adenocarcinoma
Distal.stomach.adenocarcinoma
MenNon-drinker Occasional 1–3.9 oz WE/day ≥4 oz WE/day WomenNon-drinker Occasional 1–3.9 oz WE/day ≥4 oz WE/day
NR NR
1.0 2.0 (1.1–3.5) 2.1 (1.2–3.6) 2.3 (1.3–4.3) 1.0 0.6 (0.2–1.9) 0.9 (0.2–3.5) 3.8 (0.9–16.6)
1.0 1.0 (0.6–1.7) 0.5 (0.3–0.9) 0.7 (0.4–1.3) 1.0 0.6 (0.3–1.4) 0.6 (0.2–1.8) 0.9 (0.3–3.1)
table 2.40 (continued)

529A
LCO
HO
L CO
NSU
MPTIO
N
Reference, study location, period
Alcoholic beverage consumption
No. of cases
Relative risk (95% CI)
No. of cases Relative risk (95% CI)
No. of cases
Relative risk (95% CI)
No. of cases
Relative risk (95% CI)
Inoue et.al. (1994), Nagoya, Japan, 1988–91
Cardia Middle antrum Drinker (versus non-drinker) Current drinker Former drinker <1 year after quitting ≥1 year after quitting
NR 1.60 (0.92–2.78) 1.45 (0.82–2.57 2.81 (1.21–6.54) 3.71 (1.02–13.5) 2.47 (0.93–6.59
NR 1.47 (0.94–2.28) 1.38 (0.88–2.16) 2.29 (1.12–4.68) 3.63 (1.23–10.7) 1.78 (0.75-4.23)
NR 1.00 (0.69–1.46) 0.96 (0.65–1.41) 1.36 (0.69–2.70) 2.16 (0.75–6.25) 1.06 (0.46–2.45)
Ji et.al. (1996), Shanghai, China, 1988–89
MenEthanol.(g/week)
Cardia Distal
<175 175–349 350–524 ≥525 Non-drinker Former drinker Current drinker
8 14 23 16
80 6
57
0.55 (0.25–1.21) 0.75 (0.40–1.43) 1.37 (0.78–2.41) 0.81 (0.44–1.50) p=0.931.0 1.03 (0.40–2.67) 0.86 (0.58–1.28)
51 54 57 80
272 43
218
1.14 (0.76–1.71) 1.08 (0.73–1.61) 1.07 (0.72–1.58) 1.36 (0.93–1.97) p=0.171.0 2.16 (1.27–3.69) 1.11 (0.87–1.38)
table 2.40 (continued)

530IA
RC M
ON
OG
RA
PHS V
OLU
ME 96
Reference, study location, period
Alcoholic beverage consumption
No. of cases
Relative risk (95% CI)
No. of cases Relative risk (95% CI)
No. of cases
Relative risk (95% CI)
No. of cases
Relative risk (95% CI)
Ji et.al. (1996), (contd)
Duration.(years) <15 15–<24 ≥35
10 27 26
0.52 (0.26–1.06 1.19 (0.72–1.98) 0.88 (0.52–1.48) p=0.88
54 89 115
0.92 (0.63–1.34) 1.23 (0.88–1.72) 1.40 (1.01–1.94) p=0.03
Lifetime.ethanol (g/week.×.years) <2450
2450–7462 7463–15 399 ≥15 400
6 20 18 17
0.37 (0.15–0.88) 1.27 (0.71–2.26) 1.01 (0.55–1.83) 0.84 (0.45–1.56) p=0.91
37 71 46 88
0.83 (0.54–1.28) 1.45 (1.00–2.11) 0.83 (0.55–1.26) 1.55 (1.07–2.26) p=0.06
Zhang et.al. (1996), USA, 1992–94
oesophagus.and.gastric.cardia.adenocarcinoma
Distal.stomach.adenocarcinoma
No ≤1/week >1/week
14 26 55
1.00 3.02 (1.14–8.02) 2.02 (0.85–4.82) p=0.19
20 20 27
1.00 1.60 (0.65–3.93) 0.98 (0.43–2.27) p=0.93
table 2.40 (continued)

531A
LCO
HO
L CO
NSU
MPTIO
N
Reference, study location, period
Alcoholic beverage consumption
No. of cases
Relative risk (95% CI)
No. of cases Relative risk (95% CI)
No. of cases
Relative risk (95% CI)
No. of cases
Relative risk (95% CI)
Gammon et.al. (1997), USA, 1993–95
any gastric.cardia.adenocarcinoma
other.gastric.adenocarcinomna
Never Ever <5 drinks/week 5–11 drinks/week 12–30 drinks/week >30 drinks/week
63 196 46
59
52
39
1.0 0.7 (0.5–1.1) 0.6 (0.4–1.0) 0.8 (0.5–1.3) 0.7 (0.4–1.1) 0.7 (0.4–1.2)
125 238 74
68
55
41
1.0 0.8 (0.6–1.1) 0.7 (0.5–1.1) 0.9 (0.6–1.3) 0.7 (0.4–1.0) 0.6 (0.4–1.0)
DeStefani et.al. (1998a), Montevideo, Uruguay, 1992–96
Total Cardia Fundus antrum 1–60 g 61–120 g >120 g
8 6
10
1.0 0.6 (0.2–1.9) 1.0 (0.4–2.7) p=0.93
7 7
11
1.0 1.1 (0.4–3.2) 1.8 (0.6–5.1) p=0.25
49 78 113
1.0 1.5 (1.0–2.3) 2.6 (1.7–3.9) p<0.001
Ye et.al. (1999), Sweden, 1989–95
Total.(mL.100%.alcohol/month)
Cardia cancerall.histological.types
Distal stomach cancerIntestinal.type
Diffuse.type
Non-drinker 1–35 36–160 >160
18 20 27 22
1.0 0.9 (0.4–1.9) 0.8 (0.4–1.7) 0.7 (0.3–1.5) p=0.30
52 64 73 66
1.0 1.2 (0.8–1.9) 1.2 (0.8–1.9) 1.2 (0.7–1.9) p=0.56
36 50 42 34
1.0 1.3 (0.8–2.1) 1.0 (0.6–1.7) 1.0 (0.5–1.8) p=0.73
table 2.40 (continued)

532IA
RC M
ON
OG
RA
PHS V
OLU
ME 96
Reference, study location, period
Alcoholic beverage consumption
No. of cases
Relative risk (95% CI)
No. of cases Relative risk (95% CI)
No. of cases
Relative risk (95% CI)
No. of cases
Relative risk (95% CI)
Lagergren et.al. (2000), Sweden
any
gastric.cardia.adenocarcinoma
Never Ever Ethanol.(g)/week1–15 16–70 >70
34 228
73 79 76
1.0 0.8 (0.5–1.2) 0.9 (0.5–1.5) 0.6 (0.4–1.1) 0.9 (0.5–1.5)
Zaridze et.al. (2000), Moscow, Russia, 1996–97
Vodka.(L/year)
Cardia.(men) other.subsites.(men)
Never Low <2.6 Medium 2.6–10.4 High >10.4
4 16 19
21
1.0 2.8 (0.9–9.2) 3.6 (1.1–11.8) 3.9 (1.2–12.3) p=0.03
24 62 62
40
1.0 2.0 (1.0–3.8) 2.2 ( 1.1–4.1) 1.3 (0.7–2.5) p=0.77
Wu et.al. (2001), Los Angeles, USA, 1992–97
gastric.cardia.adenocarcinoma
Distal.gastric.adenocarcinoma
1–7 drinks/week 8–21 drinks/week 22–35 drinks/week ≥36 drinks/week
1.00 (0.7–1.5) 0.70 (0.4–1.1) 1.09 (0.7–1.8) 1.35 (0.8–2.3) p=0.42
0.83 (0.6–1.2) 0.68 (0.5–1.0) 1.10 (0.7–1.7) 1.35 (0.8–2.2) p=0.29
table 2.40 (continued)

533A
LCO
HO
L CO
NSU
MPTIO
N
Reference, study location, period
Alcoholic beverage consumption
No. of cases
Relative risk (95% CI)
No. of cases Relative risk (95% CI)
No. of cases
Relative risk (95% CI)
No. of cases
Relative risk (95% CI)
Kikuchi et.al. (2002), Tokyo, Japan, 1993–95
alcohol–years
proximal Distal
Men0 0.1–134.9 135–1349.9 ≥1350 Women0 (never drinker) 0.1–134.9 ≥135.0
NR NR
2.72 (1.13–6.53) 1.0 2.24 (1.01–4.96) 2.46 (1.17–5.17) p=0.06 1.50 (0.70–3.21) 1.0 0.43 (0.10–2.05) p=0.21
1.28 (0.60–2.76) 1.0 1.85 (1.00–3.41) 1.56 (0.86–2.84) p=0.25 1.69 (0.85–3.35) 1.0 1.78 (0.67–4.71) p=0.28
CI, confidence interval; NR, not reported
table 2.40 (continued)

cancer. In two studies of histological types, the intestinal type seemed to be more strongly associated with alcoholic beverage consumption (Jedrychowski et.al., 1993).
(a). gastric.cardia.cancerProspective cohort studies have reported an association between alcoholic bev-
erage consumption and the risk for adenocarcinoma of the gastric cardia and distal stomach (Sasazuki et.al., 2002; Lindblad et.al., 2005; Tran et.al., 2005). Sasazuki et.al. (2002) reported an elevated risk for cardia cancer of all histological types with alco-holic beverage consumption, although the relationship failed to reach significance. Tran et.al. (2005) reported inverse associations for cardia and non-cardia cancer with alcoholic beverage consumption. The relative risks were 0.84 (95% CI, 0.72–0.97) for cardia cancer and 0.79 (95% CI, 0.61–1.02) for non-cardia cancer.
Among 12 case–control studies that reported an association between alcoholic bev-erage consumption and cardia cancer, five studies reported a statistically significant association (Jedrychowski et.al., 1993; Kabat et.al., 1993; Inoue et.al., 1994; Zaridze et.al., 2000; Kikuchi et.al., 2002). The adjusted odds ratios were between 2.3 and 3.9 for heavy drinkers and a strong dose–response relationship was demonstrated in four of the five studies.
Zaridze et.al. (2000) reported that the effect of hard liquor (vodka) consumption was stronger for cancer of the cardia in men. Compared with non-drinkers, the adjusted odds ratios in men were 2.8 (95% CI, 0.9–9.2) for light drinkers, 3.6 (95% CI, 1.1–11.8) for medium drinkers and 3.9 (95% CI, 1.2–10.2) for heavy drinkers.
An elevated risk for cardia cancer was observed among heavy drinkers in two case–control studies, but the results were not statistically significant (Zhang et. al., 1996; Wu et.al., 2001). Five studies observed no association between alcoholic bever-age consumption and cardia cancer (Ji et.al., 1996; Gammon et.al., 1997; De Stefani et.al., 1998a; Ye et.al., 1999; Lagergren et.al., 2000). In a population-based case–con-trol study of 90 cases of gastric cardia cancer, 260 and 164 cases of intestinal and dif-fuse types of distal gastric cancer, respectively, results from Ye et.al., (1999) showed that intake of alcoholic beverages was not associated with an increased risk for any type of cardia or gastric cancer. In a case–control study in Shanghai, China, Ji et.al. (1996) examined the role of alcoholic beverage drinking as a risk factor for carcinoma by anatomic subsite of the stomach. Alcoholic beverage consumption was associated with a moderately excess risk for distal stomach cancer (odds ratio, 1.55; 95% CI, 1.07–2.26), but was not related to the risk for cardia cancer.
(b). Distal.stomach.cancerAmong 11 studies of distal stomach cancer, six observed a positive association
(Jedrychowski et.al., 1993; Inoue et.al., 1994; Ji et.al., 1996; De Stefani et.al., 1998a; Zaridze et.al., 2000; Kikuchi et.al., 2002). The relationship was not as strong as that for cardia cancer, but the dose–response relationship was just as clear.
534 IARC MONOGRAPHS VOLUME 96

2.7.4. Type.of.alcoholic.beverage.(Table.2 .41)
Some investigators considered the role of different types of alcoholic beverage and reported that the consumption of beer, spirits or wine did not affect the incidence of stomach cancer (Hansson et.al., 1994; Zhang et.al., 1996; Ye et.al., 1999; Wu et.al., 2001). In northern Italy, where wine was the most frequently consumed alcoholic bev-erage and accounted for approximately 90% of all alcoholic beverage consumption in the population, D’Avanzo et.al. (1994) reported that the risk estimates adjusted for age and sex were 1.1 for light-to-moderate wine drinkers, 1.3 for intermediate drinkers, 1.6 for heavy drinkers and 1.4 for very heavy drinkers (≥8 drinks per day). López-Carrillo et.al. (1998) reported an assessment of alcoholic beverage consumption in Mexico, including the popular Mexican liquor tequila, in relation to the incidence of stomach cancer. After adjustment for known risk factors, wine consumption was posi-tively associated with the risk for developing stomach cancer (odds ratio, 2.93; 95% CI, 1.27–6.75) in the highest category of wine consumption, which corresponded to at least 10 glasses of wine per month, with a significant trend (p=0.005).
In a multicentric hospital-based case–control study carried out in Poland, the rela-tive risk for stomach cancer increased as the frequency and amount of vodka drunk increased. People who drank vodka at least once a week had an threefold higher risk compared with non-drinkers (relative risk, 3.06; 95% CI, 1.90–4.95) (Jedrychowski et.al., 1993). Alcoholic beverage consumption, particularly that of vodka, was found to increase the risk for gastric cancer in a Russian study (Zaridze et. al., 2000). A case–control study that included 331 cases and 622 controls conducted in Montevideo, Uruguay, found that alcoholic beverage consumption (particularly that of hard liq-uor and beer) was associated with an odds ratio of 2.4 (95% CI, 1.5–3.9), after con-trolling for the effect of tobacco, vegetables and other types of beverage (De Stefani et.al., 1998a). In another multicentric, hospital-based case–control study conducted in Germany, increased consumption of beer showed a positive association with risk whereas increased consumption of wine and liquor showed a significantly negative association (Boeing et.al., 1991).
2.7.5. Effect.modification.(Table.2 .42)
Several studies reported on the joint effects of alcoholic beverage consumption and tobacco smoking (Kabat et.al., 1993; Hansson et.al., 1994; Inoue et.al., 1994; Ji et.al., 1996; De Stefani et.al., 1998a; Zaridze et.al., 2000). The results of a case–control study in Nagoya, Japan, showed that the joint effect of drinking and smoking may play an important role in the development of stomach cancer, especially that of cardia cancer (odds ratio, 4.7; 95% CI, 1.1–20.2) (Inoue et.al., 1994). However, most studies did not evaluate potential effect modification between alcoholic beverage consumption and tobacco smoking.
535ALCOHOL CONSUMPTION

536IA
RC M
ON
OG
RA
PHS V
OLU
ME 96
table 2.41 Selected cohort and case–control studies of stomach cancer and different types of alcoholic beverage
Reference, location, period
Cohort/cases and controls
Beer Wine Hard liquor
exposure Cases Relative risk (95% CI)
exposure Cases Relative risk (95% CI)
exposure Cases Relative risk (95% CI)
Cohort study Nomura et.al . (1990), USA, Hawaii, American Men of Japanese Ancestry Study
7990 American men of Japanese ancestry, born 1990–19, residing on the Hawaiian island of Oahu; follow-up, 19 years
Non-drinker <10 oz/month 10–99 oz/month 100–499 oz/month ≥500 oz/month
64
10
17
28
28
1.0 0.7 (0.4–1.4) 1.2 (0.7–2.1) 1.1 (0.7–1.8) 1.1 (0.7–1.7)
Non-drinker 1 oz/month ≥2 oz/month
124
13
11
1.0 1.1 (0.6–1.9) 0.7 (0.4–1.3)
Non-drinker <5 oz/month 5–49 oz/month ≥50 oz/month
86
29
26
8
1.0 0.9 (0.6–1.4) 1.5 (1.0–2.2) 1.0 (0.5–2.1)
Case–control studies D’Avanzo et.al. (1994), Milan, Italy, 1985–93
746 cases of histologically confirmed stomach cancer; 2053 hospital controls
Non-drinker < 1 drink/day 1–2 drinks/day ≥ 2 drinks/day
672
35
15
24
1.0 0.9 (0.6–1.4) 1.6 (0.9–3.1) 1.1 (0.7–1.9)
Non-drinker <2 drinks/day 2–<4 drinks/day 4–6 drinks/day 6–<8 drinks/day ≥8 drinks/day
197
108
201
121
56
63
1.0 1.1 (0.8–1.4) 1.1 (0.9–1.4) 1.3 (1.0–1.7) 1.6 (1.1–2.4) 1.4 (1.0–2.0)
Non-drinker <1 drink/day 1–<2 drinks/day ≥2 drinks/day
650
45
31
20
1.0 0.7 (0.5–0.9) 1.0 (0.7–1.6) 0.9 (0.5–1.5)
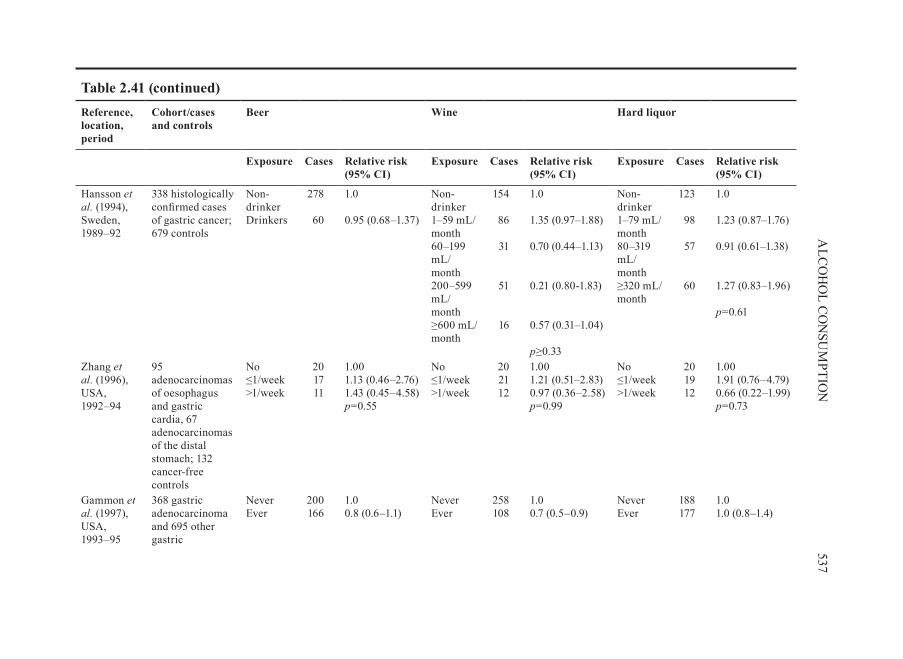
537A
LCO
HO
L CO
NSU
MPTIO
N
Reference, location, period
Cohort/cases and controls
Beer Wine Hard liquor
exposure Cases Relative risk (95% CI)
exposure Cases Relative risk (95% CI)
exposure Cases Relative risk (95% CI)
Hansson et.al . (1994), Sweden, 1989–92
338 histologically confirmed cases of gastric cancer; 679 controls
Non-drinker Drinkers
278
60
1.0 0.95 (0.68–1.37)
Non-drinker 1–59 mL/month 60–199 mL/month 200–599 mL/month ≥600 mL/month
154
86
31
51
16
1.0 1.35 (0.97–1.88) 0.70 (0.44–1.13) 0.21 (0.80-1.83) 0.57 (0.31–1.04) p≥0.33
Non-drinker 1–79 mL/month 80–319 mL/month ≥320 mL/month
123
98
57
60
1.0 1.23 (0.87–1.76) 0.91 (0.61–1.38) 1.27 (0.83–1.96) p=0.61
Zhang et.al . (1996), USA, 1992–94
95 adenocarcinomas of oesophagus and gastric cardia, 67 adenocarcinomas of the distal stomach; 132 cancer-free controls
No ≤1/week >1/week
20 17 11
1.00 1.13 (0.46–2.76) 1.43 (0.45–4.58) p=0.55
No ≤1/week >1/week
20 21 12
1.00 1.21 (0.51–2.83) 0.97 (0.36–2.58) p=0.99
No ≤1/week >1/week
20 19 12
1.00 1.91 (0.76–4.79) 0.66 (0.22–1.99) p=0.73
Gammon et.al . (1997), USA, 1993–95
368 gastric adenocarcinoma and 695 other gastric
Never Ever
200 166
1.0 0.8 (0.6–1.1)
Never Ever
258 108
1.0 0.7 (0.5–0.9)
Never Ever
188 177
1.0 1.0 (0.8–1.4)
table 2.41 (continued)

538IA
RC M
ON
OG
RA
PHS V
OLU
ME 96
Reference, location, period
Cohort/cases and controls
Beer Wine Hard liquor
exposure Cases Relative risk (95% CI)
exposure Cases Relative risk (95% CI)
exposure Cases Relative risk (95% CI)
DeStefani et al. (1998a), Montevideo, Uruguay, 1992–96
331 cases; 622 controls (men only)
Non-drinker 1–60 g/day 61–120 g/day >120 g/day
265
18 20
0
1.0 1.1 (0.6–2.1) 1.9 (0.9–3.7) – p=0.06
Non-drinker 1–60 g/day 61–120 g/day >120 g/day
97
106
72
36
1.0 1.1 (0.7–1.5) 1.4 (0.9–2.2) 0.9 (0.4–1.8) p=0.47
Non-drinker 1–60 g/day 61–120 g/day >120 g/day
166
62
30
53
1.0 1.0 (0.7–1.5) 1.7 (0.9–2.9) 2.1 (1.1–3.9) p=0.01
López-Carrillo et.al . (1998), Mexico
220 newly diagnosed adenocarcinoma of the stomach; 757 population- based controls
Non-beer consumer <1 drink/day ≥1 drink/day
105
60
54
1.0 1.06 (0.64–1.73) 1.04 (0.55–1.94) p=0.115
Non-wine consumer <1 drink ≥1 drink
133
54 32
1.0 2.08 (1.26–3.44) 2.93 (1.27–6.75) p=0.005
Non-liquor consumer <1 drink/day ≥1 drink/day
114
17
89
1.0 0.78 (0.38–1.61) 1.83 (1.07–3.10) p=0.175
Ye et.al . (1999), Sweden, 1989–95
90 gastric cardia, 260 and 164 distal gastric cancer of intestinal and diffuse types; 1164 frequency-matched controls
Light beer <400 mL/month 400–2399 mL/ month ≥2400 mL/month
118
24
22
1.0 0.9 (0.5–1.4) 0.9 (0.5–1.5) p=0.60
Non-drinker 1–59 mL/month 60–199 mL/month 200–599 mL/month ≥600 mL/month
65
43
15
25
15
1.0 1.6 (1.0–2.6) 0.6 (0.3–1.2) 1.3 (0.7–2.4) 1.1 (0.6–2.3) p=0.90
Non-drinker 1–79 mL/month 80–319 mL/month ≥320 mL/month
58
41
32
32
1.0 0.9 (0.5–1.5) 0.8 (0.5–1.5) 1.4 (0.7–2.8) p=0.42
table 2.41 (continued)
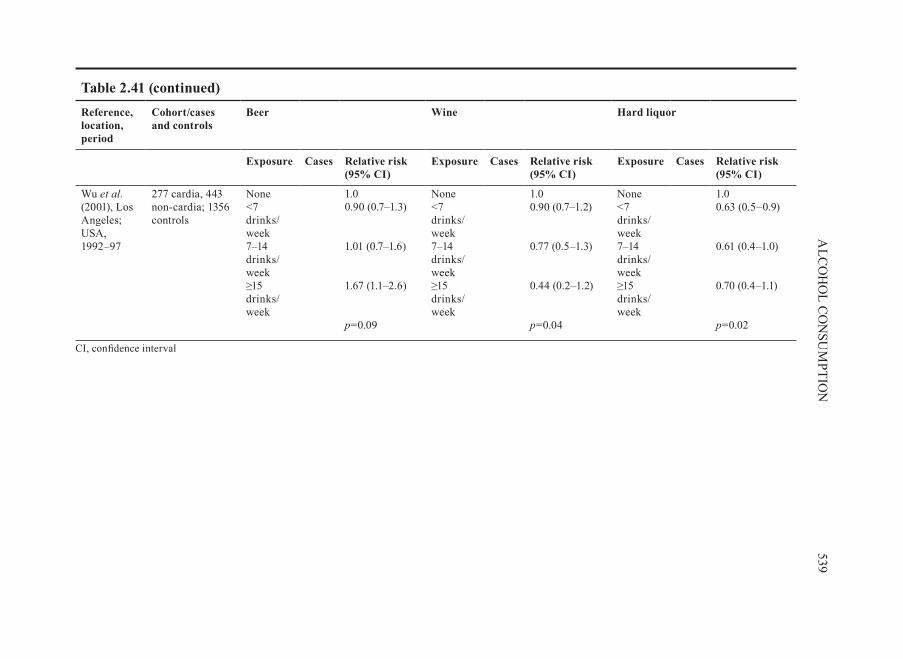
539A
LCO
HO
L CO
NSU
MPTIO
N
Reference, location, period
Cohort/cases and controls
Beer Wine Hard liquor
exposure Cases Relative risk (95% CI)
exposure Cases Relative risk (95% CI)
exposure Cases Relative risk (95% CI)
Wu et.al . (2001), Los Angeles; USA, 1992–97
277 cardia, 443 non-cardia; 1356 controls
None <7 drinks/week 7–14 drinks/week ≥15 drinks/week
1.0 0.90 (0.7–1.3) 1.01 (0.7–1.6) 1.67 (1.1–2.6) p=0.09
None <7 drinks/week 7–14 drinks/week ≥15 drinks/week
1.0 0.90 (0.7–1.2) 0.77 (0.5–1.3) 0.44 (0.2–1.2) p=0.04
None <7 drinks/week 7–14 drinks/week ≥15 drinks/week
1.0 0.63 (0.5–0.9) 0.61 (0.4–1.0) 0.70 (0.4–1.1) p=0.02
CI, confidence interval
table 2.41 (continued)

540IA
RC M
ON
OG
RA
PHS V
OLU
ME 96
table 2.42 Cohort and case–control studies of stomach cancer and alcoholic beverage consumption in men and women
Study reference
Description Drinking level
Men Women
No. of cases Relative risk (95% CI)
No. of cases Relative risk (95% CI)
Cohort study Kato et.al. (1992a), Japan
9753 Japanese men and women; age: men, ≥ 40 years; women, ≥ 30 years; response rate, 85.9%; follow–up 1986–91
None Occasional Daily <50mL Daily ≥50 mL
8 9 6 12
1.00 2.31 (0.88–6.07) 1.31 (0.45–3.81) 3.63 (1.44–9.11)
18 3 1
1.00 1.12 (0.32–3.90) 1.29 (0.17–9.69)
Case–control studies Kabat et.al. (1993), USA, 1981–90
152 (122 men, 31 women) cases; 4162 men, 2222 women controls; matched by age, sex, race, hospital
Non-drinker Occasional 1–3.9 oz/day ≥4 oz/day
1.0 1.0 (0.6–1.7) 0.5 (0.3–0.9) 0.7 (0.4–1.3)
1.0 0.6 (0.3–1.4) 0.6 (0.2–1.8) 0.9 (0.3–3.1)

541A
LCO
HO
L CO
NSU
MPTIO
N
Study reference
Description Drinking level
Men Women
No. of cases Relative risk (95% CI)
No. of cases Relative risk (95% CI)
Zaridze et.al. (2000), Moscow, Russia, 1996–97
489 (248 men, 200 women), histologically confirmed; 610 (292 men, 318 women) hospital-based controls
Vodka.(L/year)Never Low <2.6 Medium 2.6–10.4 High >10.4
28 78 81 61
1.0 2.0 (1.1–3.7) 2.3 (1.3–4.2) 1.7 (0.9–3.1) p=0.20
95 62
45
1.0 1.5 (1.0–2.4) 1.3 (0.8–2.2) p=0.17
CI, confidence interval
table 2.42 (continued)
When stratified by gender, the results for men were statistically significant while those for women showed similar point estimates but insignificant trends. Kato et.al. (1992a) examined the risk for men and women separately in a clinical epidemiological study and observed an increased risk for stomach cancer in daily consumers of alco-holic beverages compared with non-drinkers, but this association was not statistically significant. In a case–control study conducted in Japan, light drinkers showed the lowest risk among both men and women, and heavy drinkers showed the highest risk among men. In other words, the association was J-shaped among men and U-shaped among women (Kikuchi et.al., 2002).
2.8 Cancers of the colon and/or rectum
Most of the studies of alcoholic beverage consumption and colorectal cancer included in the previous Monograph (IARC, 1988) were based on information about heavy alcoholic beverage drinkers or alcoholics and persons employed in the brewery industry, or were case–control studies; only five cohort studies were reviewed. Since that time, several additional cohort studies, case–control studies, as well as meta-anal-yses and a pooling project, representing research from Asia, Australia, Europe, North and South America, have been published. In total, these provide important information on associations of alcoholic beverage consumption and the risk for colorectal cancer overall, risk for specific anatomical sites within the large bowel and relationships with specific alcoholic beverages. In addition, several studies carefully considered poten-tial confounding factors such as sex, age, level of obesity and smoking status, and oth-ers also included diet and physical activity. Finally, this large body of evidence allows for international comparisons of the strength and consistency of associations between alcoholic beverage intake and risk for colorectal cancer.
2.8.1. Cohort.studies
(a). special.populations.(Table.2 .43)Nine studies examined the risk for colon cancer and eight studies examined the
risk for rectal cancer among heavy alcoholic beverage drinkers, alcoholics or brew-ery workers (Sundby, 1967; Hakulinen et.al., 1974; Monson & Lyon, 1975; Adelstein & White, 1976; Dean et.al., 1979; Jensen, 1979; Robinette et.al., 1979; Schmidt & Popham, 1981; Carstensen et.al., 1990).
Among the nine studies on colon cancer, the number of observed deaths or incident cases ranged from three to 82. Six studies showed no evidence of an association. In two studies, there were non-statistically significant elevated risks (relative risk, 1.2–1.3) among brewery workers (Dean et.al., 1979, Carstensen et.al., 1990).
Among the eight studies of rectal cancer, the number of observed deaths or incident cases ranged from none to 85. While five reported no excess risk for rectal cancer, two
542 IARC MONOGRAPHS VOLUME 96
kajo
Rectangle