45th Annual Taxation Conference - Business Valuation Firm · 45th Annual Taxation ... Derivation of...
47
Long-Term Growth Rate in the Income Approach Aaron M. Rotkowski, CFA, ASA, CBA Willamette Management Associates Michael Mangan, JD Garvey Schubert Barer 45th Annual Taxation Conference Appraisal for Ad Valorem Taxation of Communications, Energy and Transportation Properties July 26 – 30, 2015
Transcript of 45th Annual Taxation Conference - Business Valuation Firm · 45th Annual Taxation ... Derivation of...

Long-Term Growth Rate in the Income Approach
Aaron M. Rotkowski, CFA, ASA, CBAWillamette Management AssociatesMichael Mangan, JDGarvey Schubert Barer
45th Annual Taxation Conference
Appraisal for Ad Valorem Taxation of Communications, Energy and Transportation Properties
July 26 – 30, 2015
Disclaimers
• Opinions are our own, and do not necessarily represent the opinions of our respective firms
• All specific examples were selected because the companies are publicly traded and have abundant data available
• For some topics, we have purposely endeavored to use examples from companies or court cases that are not represented at this conference
1

Income Approach
• The value of an asset or business is the present value of the prospective economic income associated with the ownership of that asset or business
• Yield capitalization method formula:
Value PVofDiscretePeriodIncome PVofTerminalValue
• Direct capitalization formula:
ValueNextYear sIncome e. g. , NOIorCashFlow
OverallCapitalizationRate
• Terminal Period is a stable growth period 2
Derivation of Overall Capitalization Rates
• Capitalization Rates in Real Estate– Comparable Sales
– Band of Investment Method
– Debt Coverage Analysis
– Analysis of Yield Capitalization
– Surveys
• Capitalization Rates in Unit Valuation– Extracted from Market Data
– Yield Cap − Long Term Growth Rate formula
3
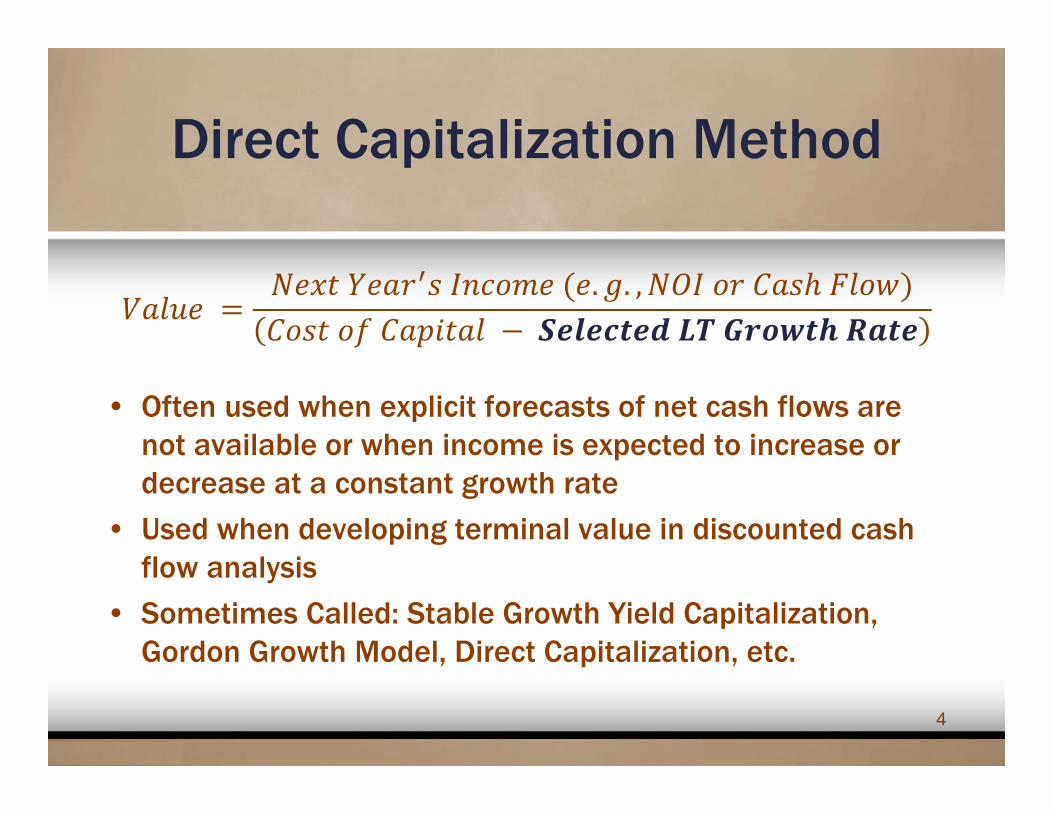
Direct Capitalization Method
. . ,
• Often used when explicit forecasts of net cash flows are not available or when income is expected to increase or decrease at a constant growth rate
• Used when developing terminal value in discounted cash flow analysis
• Sometimes Called: Stable Growth Yield Capitalization, Gordon Growth Model, Direct Capitalization, etc.
4

Direct Capitalization Example
2014 2013 2012
Net Operating Income 20,000 18,000 17,000
Weighting 50% 35% 15%
Weighted NOI 10,000 6,300 2,550
Weighted Average NOI 18,851
Direct Capitalization Rate 8%
Indicated Value, Rounded 235,600
5
Hypothetical assessment as of January 1, 2015:

Who This Topic Is Important To
• This topic is relevant for all unit valuations
• This is also important outside of the property tax arena: gift and estate tax, family law, dissenting shareholder rights cases, transactions, etc.
• Significant body of relevant research exists outside of the property tax arena: court decisions, journal articles, academic studies– We may present information and examples from all disciplines to
highlight the importance of this topic and present the most current and relevant opinions on the topic
6
Why This Topic Is Important
• The concluded value in the income approach is sensitive to the long-term growth rate
• Analysts often spend a disproportionately low amount of time considering this valuation variable relative to other valuation variables in the income approach
• In a dispute, the LTG rate often receives a substantial amount of attention relative to other valuation variables
7

Topics Covered (1 – 5)
1. Selected growth rate for a business versus a unit of taxable assets
2. Direct cap method is a perpetuity/constant growth model
3. Growth relates to the (normalized) income that is capitalized (e.g., NOI or net cash flow) in a direct cap method
4. Real versus nominal growth
5. Real estate growth rates
8
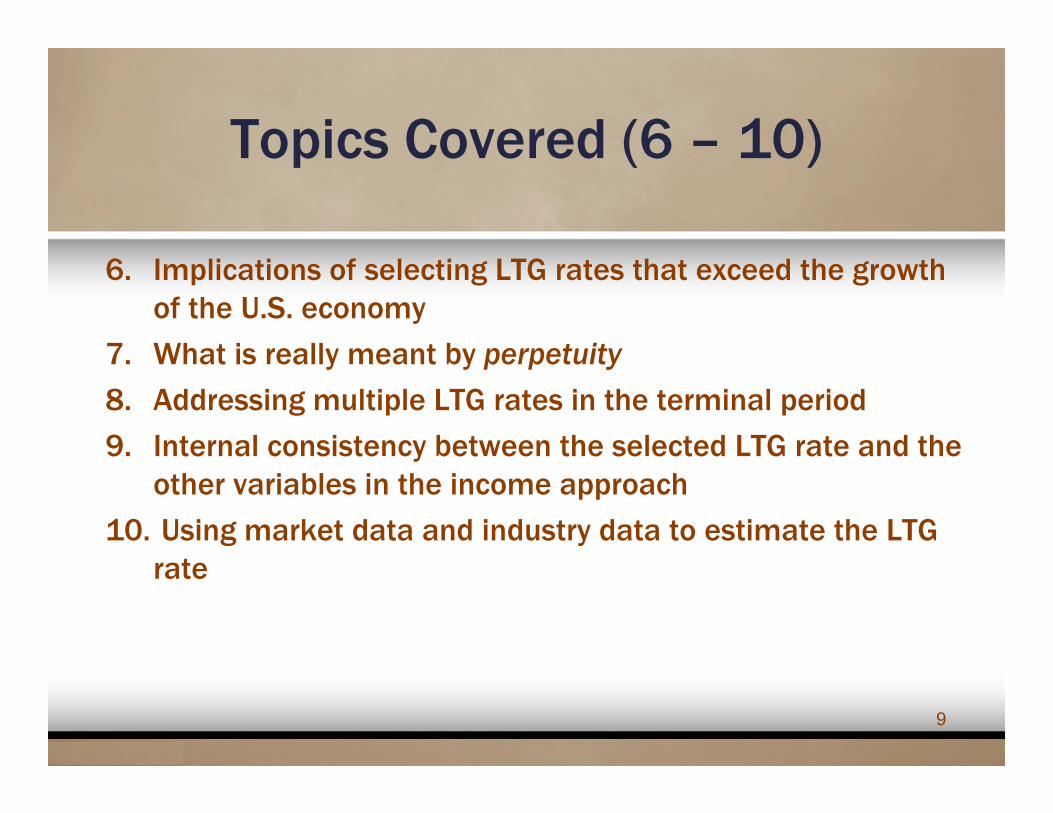
Topics Covered (6 – 10)
6. Implications of selecting LTG rates that exceed the growth of the U.S. economy
7. What is really meant by perpetuity8. Addressing multiple LTG rates in the terminal period
9. Internal consistency between the selected LTG rate and the other variables in the income approach
10. Using market data and industry data to estimate the LTGrate
9
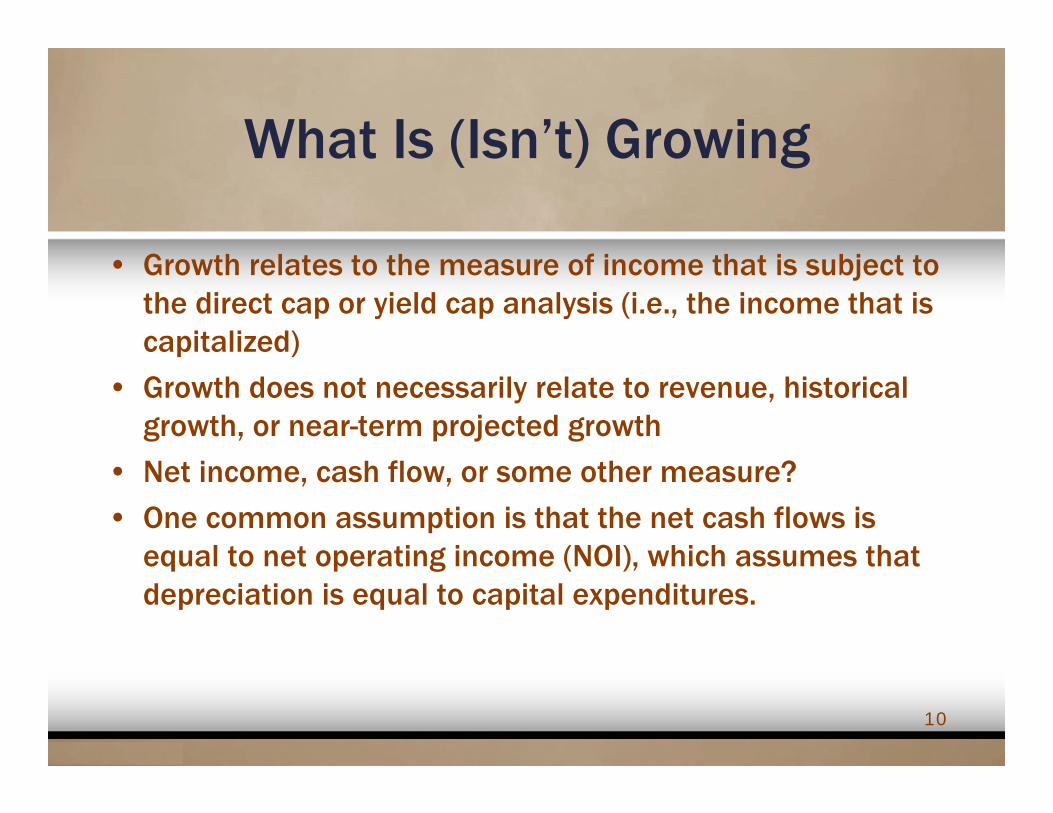
What Is (Isn’t) Growing
• Growth relates to the measure of income that is subject to the direct cap or yield cap analysis (i.e., the income that is capitalized)
• Growth does not necessarily relate to revenue, historical growth, or near-term projected growth
• Net income, cash flow, or some other measure?
• One common assumption is that the net cash flows is equal to net operating income (NOI), which assumes that depreciation is equal to capital expenditures.
10

Valuation Subject
• The income approach may be used to estimate the value of a total unit, business enterprise, equity interest, intangible asset, real estate, etc.
• Value is related to the income that is discounted or capitalized
• The direct capitalization method is often based on net operating income (NOI), and NOI is often assumed to relate to taxable assets only
• The direct capitalization method is often used to estimate the market value of the unit of taxpayer assets
11

Presentation Objectives
• Understand the importance of the selected long-term growth rate in an income approach valuation analysis
• Understand both the qualitative and quantitative factors that should (and should not) be considered when selecting the long-term growth rate
• Learn how to select and support a long-term growth rate
• Learn how to match other income approach projection variables to the selected long-term growth rate
12
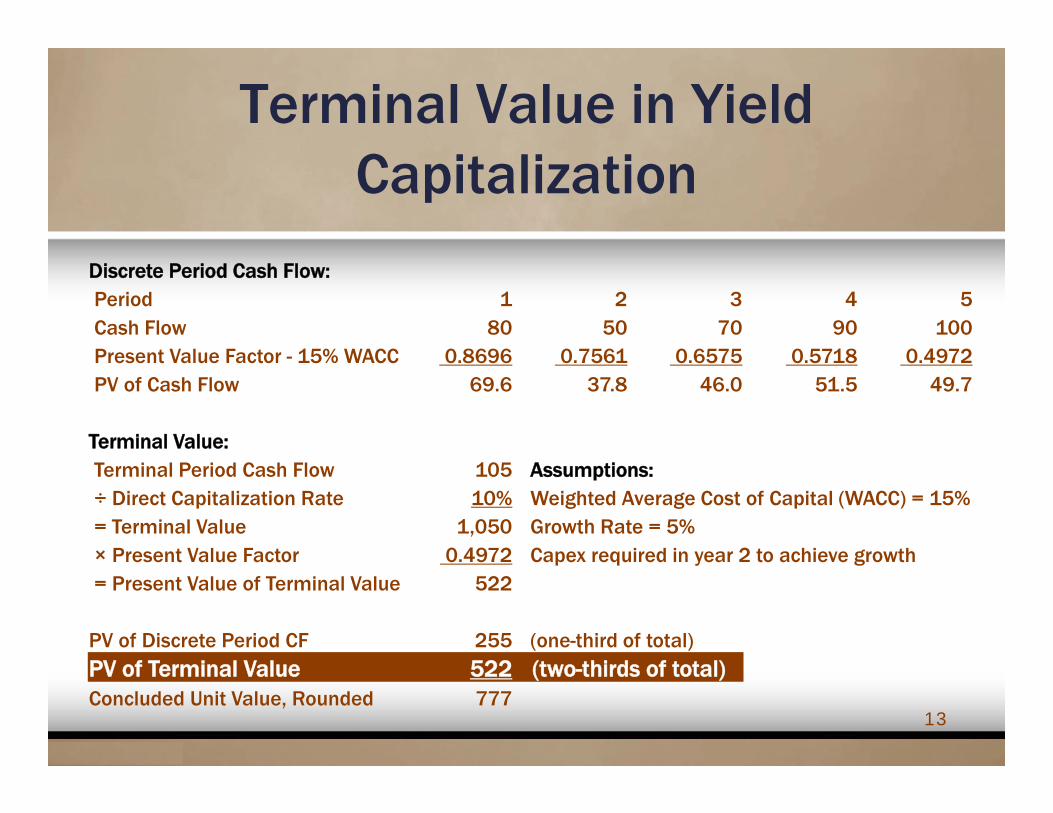
Terminal Value in Yield Capitalization
13
Discrete Period Cash Flow:Period 1 2 3 4 5Cash Flow 80 50 70 90 100Present Value Factor - 15% WACC 0.8696 0.7561 0.6575 0.5718 0.4972 PV of Cash Flow 69.6 37.8 46.0 51.5 49.7
Terminal Value:Terminal Period Cash Flow 105 Assumptions:÷ Direct Capitalization Rate 10% Weighted Average Cost of Capital (WACC) = 15%= Terminal Value 1,050 Growth Rate = 5%× Present Value Factor 0.4972 Capex required in year 2 to achieve growth= Present Value of Terminal Value 522
PV of Discrete Period CF 255 (one-third of total)PV of Terminal Value 522 (two-thirds of total)Concluded Unit Value, Rounded 777

Income Approach Sensitivity to Variables
• Unit value in prior example was $777
• Unit value if discrete period cash flow is reduced by 25%: $713 (8% decrease)
• Unit value if LTG rate is 7%: $907 (17% increase)
• Unit value if LTG rate is 3%: $690 (11% decrease)
• Component changes in WACC
– e.g., selected beta, risk-free rate, equity risk premium
– 1% increased/decreased in the WACC results in only a 2% to 3% change in the present value of discrete period cash flow
14
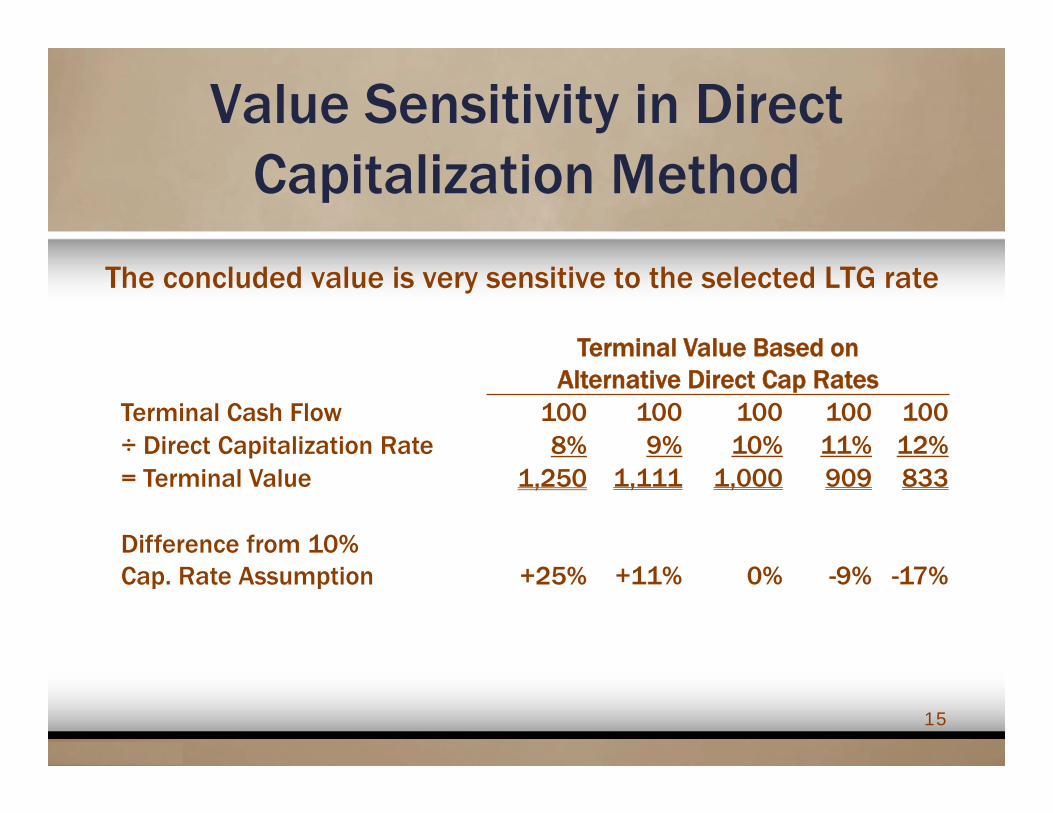
Value Sensitivity in Direct Capitalization Method
The concluded value is very sensitive to the selected LTG rate
15
Terminal Value Based on Alternative Direct Cap Rates
Terminal Cash Flow 100 100 100 100 100÷ Direct Capitalization Rate 8% 9% 10% 11% 12%= Terminal Value 1,250 1,111 1,000 909 833
Difference from 10% Cap. Rate Assumption +25% +11% 0% -9% -17%
Capitalized Income Should Be Normalized
• May be based on 5-year average, 3-year average, LTM, projected next year, historical weighted average, or some other measure
• Exclude income that is not expected to recur
– Net operating loss carryforward
– Line of business that no longer exists
– Income from the gain on sales of assets
• Exclude expenses that are not expected to recur
– Litigation expenses
– Restructuring expenses
16

Growth by Asset Class
• Not all assets increase or decrease at the same rate
• Financial assets (low growth rate)
• Tangible assets (low to moderate growth rate)
• Intangible assets (negative to high growth rate)
• According to the Intangible Asset Handbook, “Many companies have anywhere from half to ninety percent or more of their value and capital structure represented by intangible assets.”
17
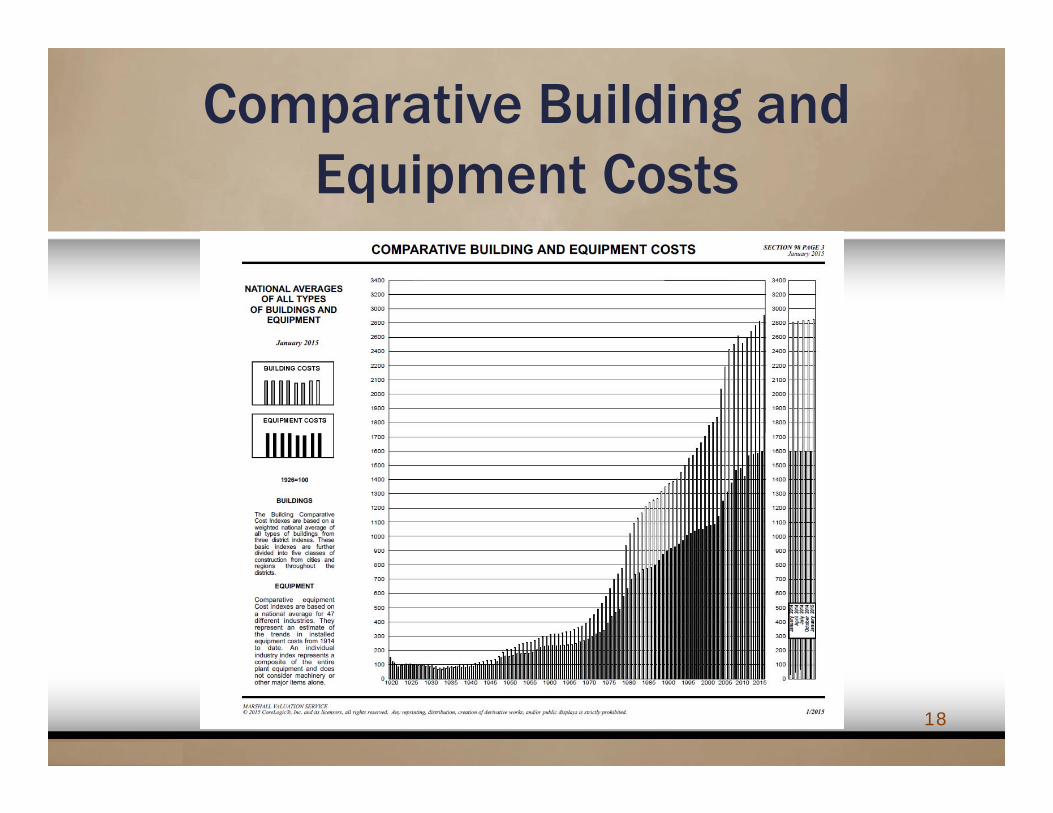
Comparative Building and Equipment Costs
18

Typical Real Property Example
• Estimates are typically based on existing lease provisions and expected forecasts regarding lease renewals and growth rates applied to other income and operating expenses in the market– The focus is often on the anticipated performance of the subject
property
– Market rents typically expected to increase by CPI, as many leases have such provisions
– Operating expenses are often forecasted to increase 3% annually with some exceptions, unless historic data suggests otherwise
19

Enterprise Value and Unit Value
• Enterprise value ≠ total unit value ≠ value of taxable assets
• Cash flow may be derived from tangible and intangible assets
• Growth may include assets that don’t exist on assessment date
20
Centrally Assessed Taxpayer
12/31/09 12/31/14 CAGR
Total Enterprise Value $5.0 billion $14.1 billion 23%
Unlevered Free Cash Flow $125 million $300 million 19%
Total Assets $5.2 billion $6.6 billion 5%
Gross Fixed Assets $6.0 billion $7.3 billion 4%
CAGR = Compound annual growth rate
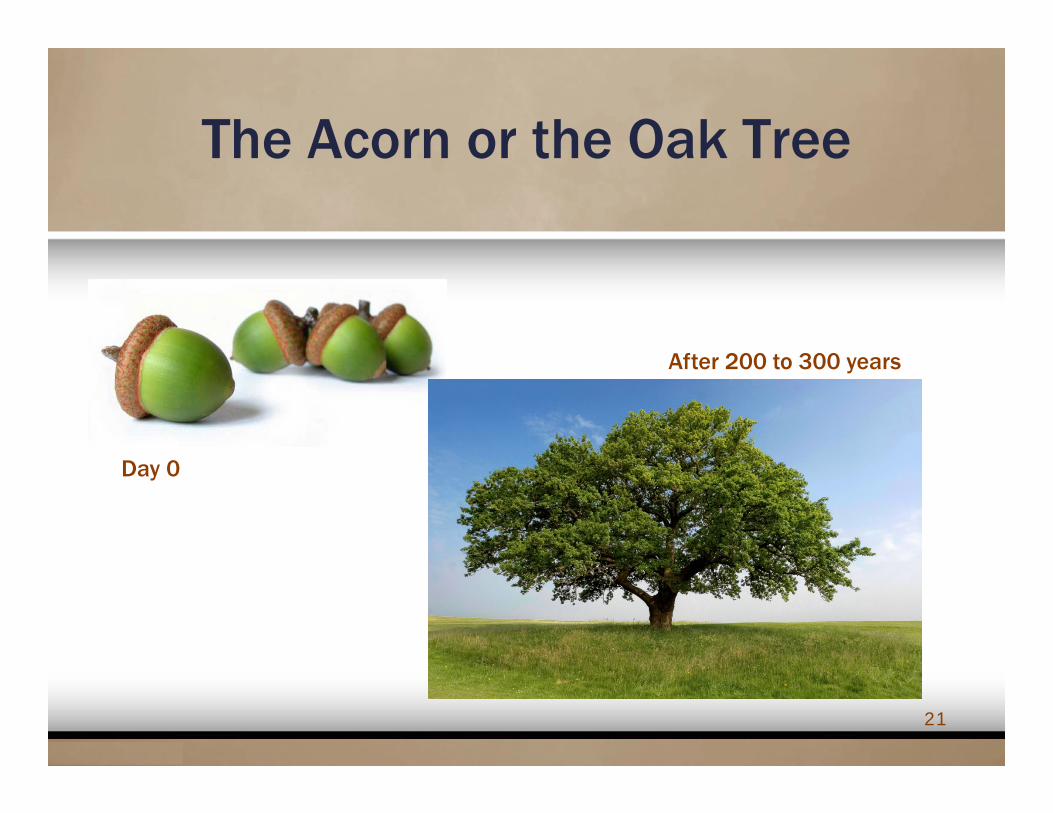
The Acorn or the Oak Tree
21
Day 0
After 200 to 300 years
Exit Multiples in Income Approach
• Use of exit multiples results in a market approach (or at best a hybrid income/market approach)
• Analysts cannot avoid estimating growth by using exit multiples in the terminal value
• A capitalization rate is an inverse of a pricing multiple– i.e., a 20x P/E multiple = 5% direct capitalization rate
• Pricing multiples are based on the same factors that are considered in the direct cap rate, including risk & growth
• These same issues affect the pricing multiple selection in the market approach
22
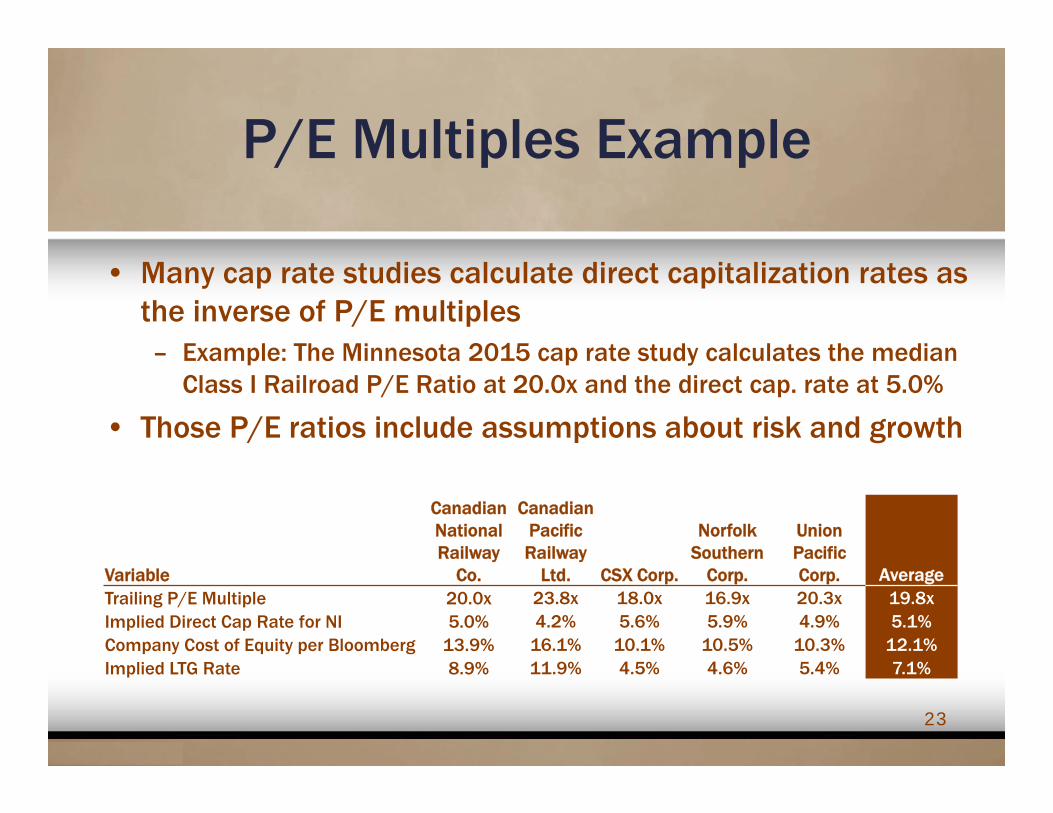
P/E Multiples Example
Variable
Canadian National Railway
Co.
Canadian Pacific Railway
Ltd. CSX Corp.
Norfolk Southern
Corp.
Union Pacific Corp. Average
Trailing P/E Multiple 20.0x 23.8x 18.0x 16.9x 20.3x 19.8xImplied Direct Cap Rate for NI 5.0% 4.2% 5.6% 5.9% 4.9% 5.1%Company Cost of Equity per Bloomberg 13.9% 16.1% 10.1% 10.5% 10.3% 12.1%Implied LTG Rate 8.9% 11.9% 4.5% 4.6% 5.4% 7.1%
23
• Many cap rate studies calculate direct capitalization rates as the inverse of P/E multiples– Example: The Minnesota 2015 cap rate study calculates the median
Class I Railroad P/E Ratio at 20.0x and the direct cap. rate at 5.0%
• Those P/E ratios include assumptions about risk and growth

Security Analysts’ Growth Rates
• Represents net income growth over the next 3 to 5 years
• Projections include growth from intangible assets and assets not in existence as of the valuation date
24
Analysts No. ofClass I Railroads in MN Cap Rate Study LTG EstimatesCanadian National Railway Company 10.6% 1Canadian Pacific Railway Limited 16.3% 1CSX Corp. 7.8% 3Norfolk Southern Corporation 8.9% 2Union Pacific Corporation 10.8% 3Average 10.9%
• For railroads, real growth may come from new locomotives, freight cars, and containers; increased mainline capacity; construction of new facilities; and other similar factors
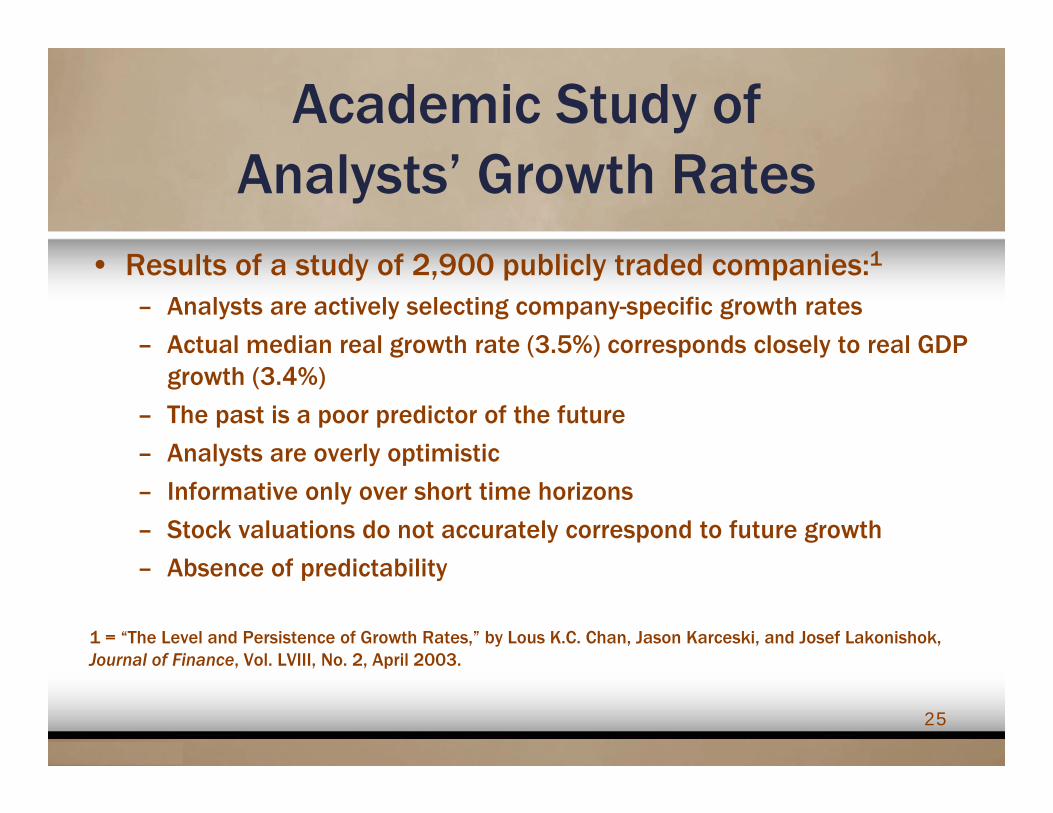
Academic Study of Analysts’ Growth Rates
• Results of a study of 2,900 publicly traded companies:1
– Analysts are actively selecting company-specific growth rates
– Actual median real growth rate (3.5%) corresponds closely to real GDP growth (3.4%)
– The past is a poor predictor of the future
– Analysts are overly optimistic
– Informative only over short time horizons
– Stock valuations do not accurately correspond to future growth
– Absence of predictability
1 = “The Level and Persistence of Growth Rates,” by Lous K.C. Chan, Jason Karceski, and Josef Lakonishok, Journal of Finance, Vol. LVIII, No. 2, April 2003.
25
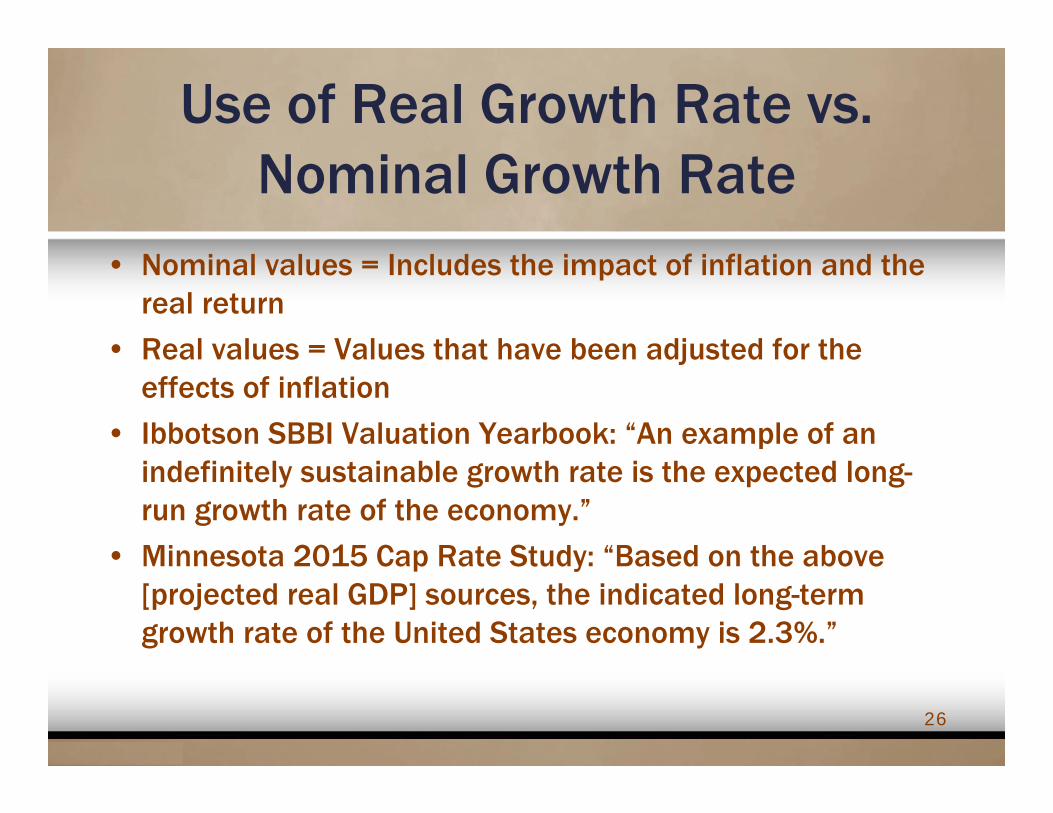
Use of Real Growth Rate vs. Nominal Growth Rate
• Nominal values = Includes the impact of inflation and the real return
• Real values = Values that have been adjusted for the effects of inflation
• Ibbotson SBBI Valuation Yearbook: “An example of an indefinitely sustainable growth rate is the expected long-run growth rate of the economy.”
• Minnesota 2015 Cap Rate Study: “Based on the above [projected real GDP] sources, the indicated long-term growth rate of the United States economy is 2.3%.”
26

Quotes from Court Cases
• “Generally, once an industry has matured, a company will grow at a steady rate that is roughly equal to the rate of nominal GDP growth.” Global GT v. Golden Telecom
• “The rate of inflation is the floor for a terminal value estimate for a solidly profitable company that does not have an identifiable risk of insolvency.” Global GT v. Golden Telecom
• “There also is considerable precedent in Delaware for adopting a terminal growth rate that is a premium, such as 100 basis points, over inflation.” Nathan Owen v. Energy Services, Inc.
27
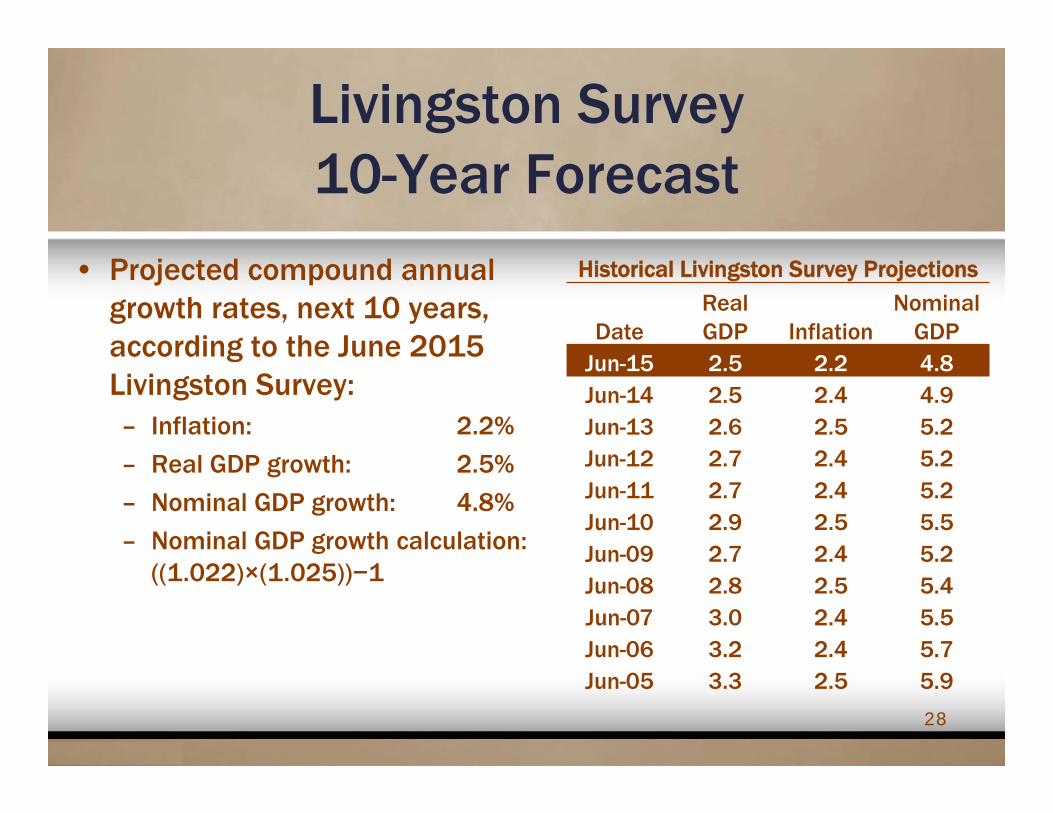
Livingston Survey 10-Year Forecast
Historical Livingston Survey Projections
DateReal GDP Inflation
Nominal GDP
Jun-15 2.5 2.2 4.8Jun-14 2.5 2.4 4.9Jun-13 2.6 2.5 5.2Jun-12 2.7 2.4 5.2Jun-11 2.7 2.4 5.2Jun-10 2.9 2.5 5.5Jun-09 2.7 2.4 5.2Jun-08 2.8 2.5 5.4Jun-07 3.0 2.4 5.5Jun-06 3.2 2.4 5.7Jun-05 3.3 2.5 5.9
28
• Projected compound annual growth rates, next 10 years, according to the June 2015 Livingston Survey:– Inflation: 2.2%
– Real GDP growth: 2.5%
– Nominal GDP growth: 4.8%
– Nominal GDP growth calculation: ((1.022)×(1.025))−1

Historical Economic Growth
-4.0%
-2.0%
0.0%
2.0%
4.0%
6.0%
8.0%
10.0%
12.0%
14.0%
19
58
19
60
19
62
19
64
19
66
19
68
19
70
19
72
19
74
19
76
19
78
19
80
19
82
19
84
19
86
19
88
19
90
19
92
19
94
19
96
19
98
20
00
20
02
20
04
20
06
20
08
20
10
20
12
20
14
Nominal Annual GDP Growth and 10-Year Nominal GDP Compound Annual Growth Rate
Nominal GDP Growth 10-Year Nominal GDP CAGR
Min: -2.0%Average: 6.6%Max: 15.7%2014: 3.9%
29

PV of Cash Flow in Terminal Years 1 through 20
$87
$60
$15
9%
37%
84%
0%
10%
20%
30%
40%
50%
60%
70%
80%
90%
100%
$0
$10
$20
$30
$40
$50
$60
$70
$80
$90
$100
1 2 3 4 5 6 7 8 9 10 11 12 13 14 15 16 17 18 19 20
Cum
ulat
ive
% o
f Ter
min
al V
alue
Pre
sent
Val
ue o
f Cas
h Fl
ow
Period
Present Value of Cash Flow Cumulative % of Terminal Value
Assumptions:WACC= 15%Long-term Growth Rate = 5%Terminal Free Cash Flow = $100
30

Company Growth Exceeding the Growth of the U.S. Economy
• NYU Finance Professor Aswath Damodaran writes:“Since no firm can grow forever at a rate greater than economy in which it operates, the constant growth rate cannot be greater than the overall growth rate of the economy.”
• In Merion Capital v. 3M Cogent, the Court said:But, a terminal growth rate should not be greater than the nominal growth rate for the United States economy, because “[i]f a company is assumed to grow at a higher rate indefinitely, its cash flow would eventually exceed America's [gross national product].”
31

Fast Growth Example
32
• Even after 100 years of growth (8.0%) that exceeds the U.S. economy (6.6%), a $100 million dollar company is still insignificant relative to the U.S. Gross National Product
• U.S. GNP will equal $10.6 quadrillion after 100 years of 6.6% annual growth
Value Growth Value after X Number of Years($Billions) Rate 5 25 50 100
Company A 0.100 8% 0.147 0.685 4.7 220 Company A 0.100 20% 0.249 9.540 910.0 8,281,797
U.S. GNP 17,848 6.6% 24,568 88,210 435,963 10,649,029
Two-Stage Growth Model
• H-Model is a two-stage growth model where the growth rate in the initial “extraordinary growth” phase declines linearly until the second “stable growth” phase is reached
• There is also a three-stage model
• Multi-stage models require several more assumptions than a single period model and they assume a linear transition and constant reinvestment/payout ratio
• Not commonly used, but acceptable
33

H-Model Formula
Stable Growth Value + Extraordinary Growth Value
+
Where:0
CashFlow InitialCashFlow DiscountRate
Midpointofhighgrowth transitionperiod 2Growthrateinthe"initialhighgrowthperiod"
Growthrateinthe"stableperiod“
34
Terminal Value in Direct Capitalization Method, Revised
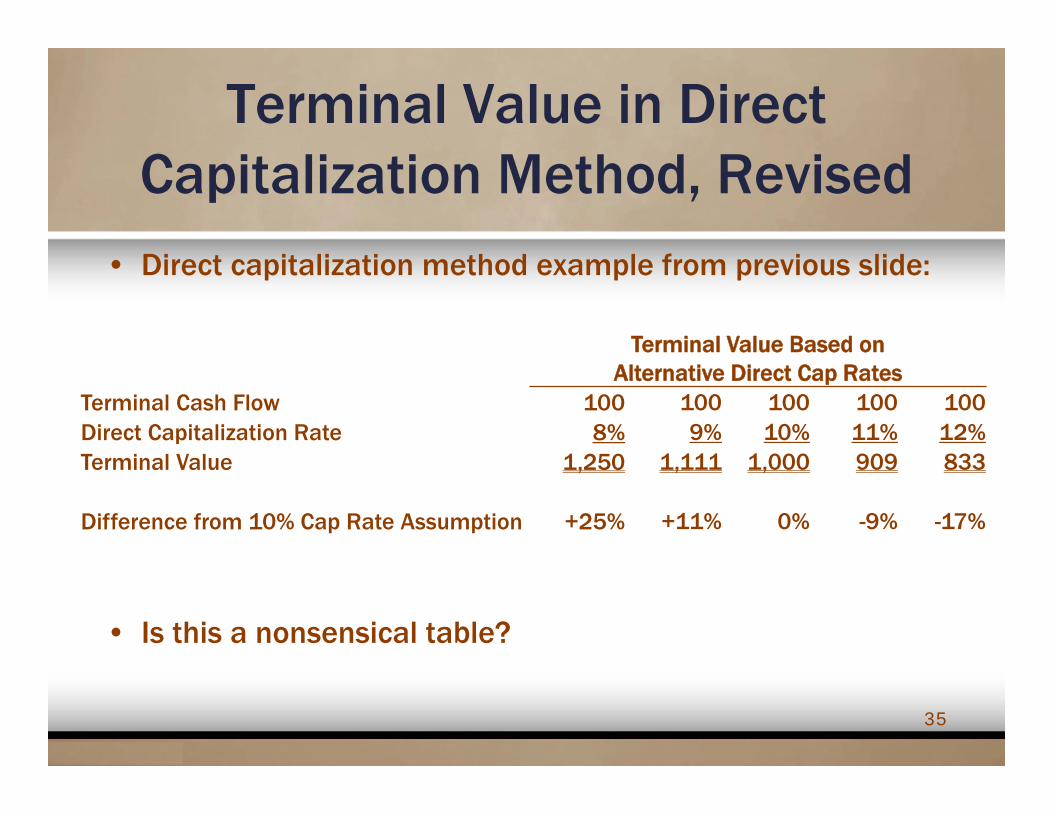
• Direct capitalization method example from previous slide:
• Is this a nonsensical table?
35
Terminal Value Based on Alternative Direct Cap Rates
Terminal Cash Flow 100 100 100 100 100Direct Capitalization Rate 8% 9% 10% 11% 12%Terminal Value 1,250 1,111 1,000 909 833
Difference from 10% Cap Rate Assumption +25% +11% 0% -9% -17%
Consideration of Reinvestment
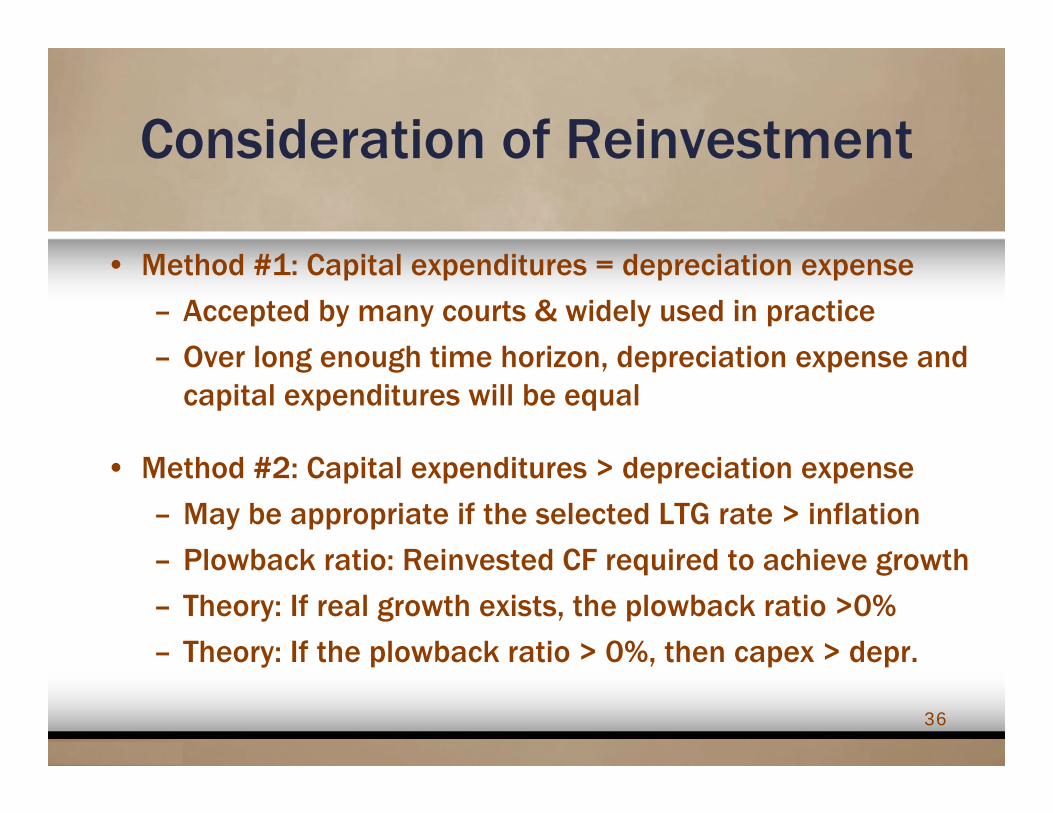
• Method #1: Capital expenditures = depreciation expense
– Accepted by many courts & widely used in practice
– Over long enough time horizon, depreciation expense and capital expenditures will be equal
• Method #2: Capital expenditures > depreciation expense
– May be appropriate if the selected LTG rate > inflation
– Plowback ratio: Reinvested CF required to achieve growth
– Theory: If real growth exists, the plowback ratio >0%
– Theory: If the plowback ratio > 0%, then capex > depr.
36

Assuming Capex Exceeds Depreciation in Terminal Period
• Formulas: g = k * r and k = g ÷ r
g = real growth rate in net cash flow
k = plowback ratio
r = return on investment– May be 4% to 5% greater than required return (Damodaran)
– In one 2015 court case, both experts incorporated reinvestment in their terminal value (i.e., capex > depreciation), and the premium to the WACC was around 10% for each expert
37
Revised Terminal Value Example
38
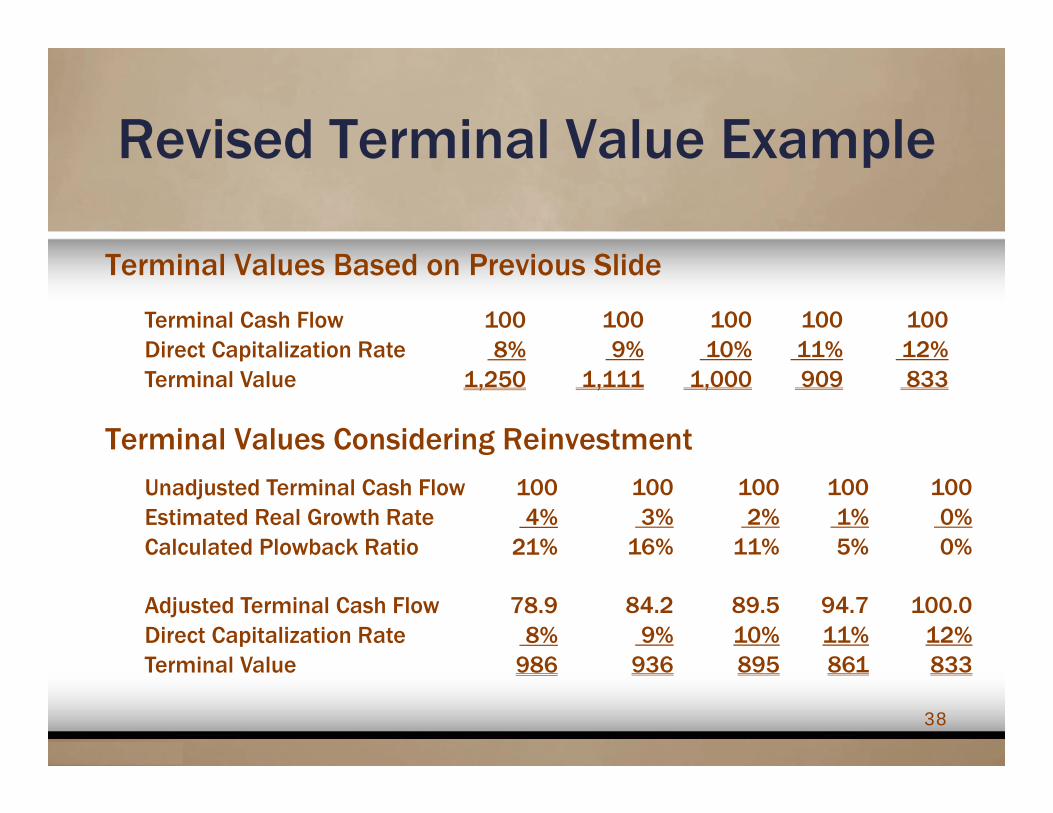
Terminal Values Based on Previous Slide
Terminal Values Considering Reinvestment
Terminal Cash Flow 100 100 100 100 100Direct Capitalization Rate 8% 9% 10% 11% 12%Terminal Value 1,250 1,111 1,000 909 833
Unadjusted Terminal Cash Flow 100 100 100 100 100Estimated Real Growth Rate 4% 3% 2% 1% 0%Calculated Plowback Ratio 21% 16% 11% 5% 0%
Adjusted Terminal Cash Flow 78.9 84.2 89.5 94.7 100.0Direct Capitalization Rate 8% 9% 10% 11% 12%Terminal Value 986 936 895 861 833
Specific Source of Growth
• Industry Growth
• Economy Growth
• Company-Specific Factors– Increasing Prices
– New Products
– Acquisitions & Joint Ventures
39
Growth from Industry Factors
• An industry analysis is important for selecting the LTG rate
• Industry-specific trade organizations often publish data
• Independent 3rd parties publish industry growth rates—e.g., IBISWorld, First Research, and S&P Capital IQ publish periodic industry profiles for a variety of sectors.
40
Industry Analysis Example
41
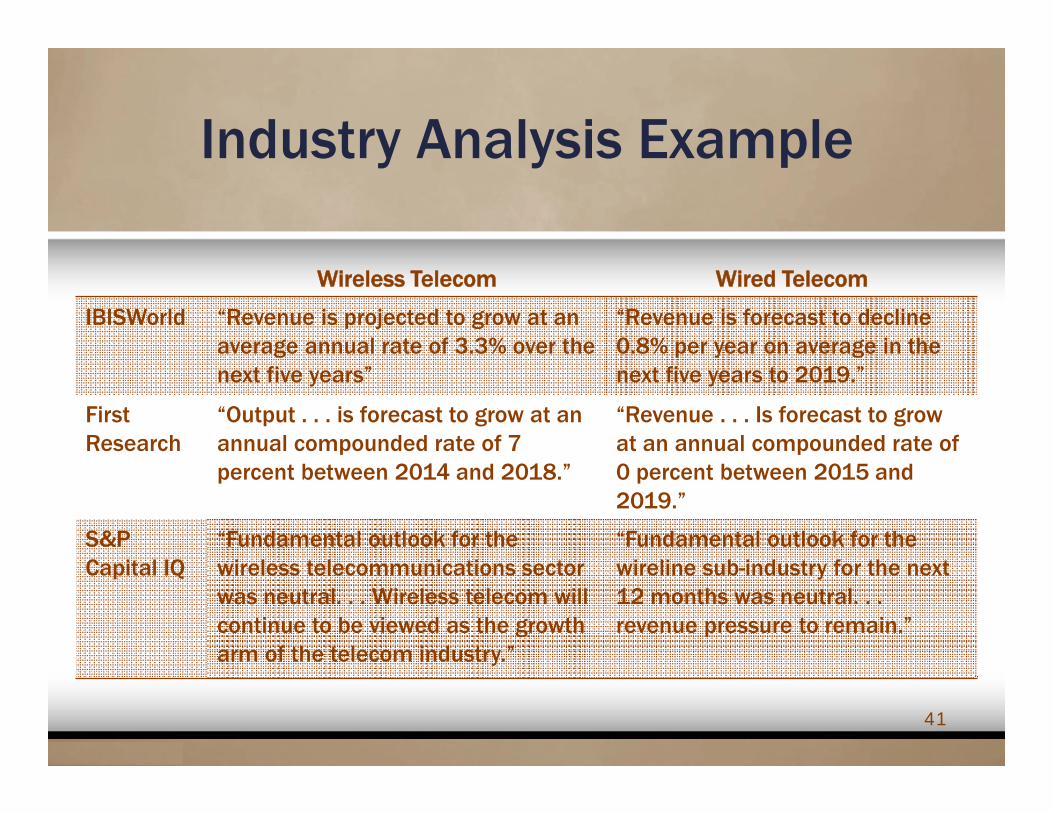
Wireless Telecom Wired Telecom
IBISWorld “Revenue is projected to grow at an average annual rate of 3.3% over the next five years”
“Revenue is forecast to decline 0.8% per year on average in the next five years to 2019.”
FirstResearch
“Output . . . is forecast to grow at an annual compounded rate of 7 percent between 2014 and 2018.”
“Revenue . . . Is forecast to grow at an annual compounded rate of 0 percent between 2015 and 2019.”
S&P Capital IQ
“Fundamental outlook for the wireless telecommunications sector was neutral. . . Wireless telecom will continue to be viewed as the growth arm of the telecom industry.”
“Fundamental outlook for the wireline sub-industry for the next 12 months was neutral. . . revenue pressure to remain.”
Global GT v. Golden Telecom
• The Court considered:– Russia projected inflation
– Russia projected real GDP growth
– Historical U.S. growth of telecom industry relative to U.S. economy
– Stage of telecom industry in Russia
• The Point: The court considered growth in the overall economy and projected industry growth
42
Growth from Economic Factors
• Consider both real and nominal economic growth and if the subject company is expected to grow faster, slower, or similar to the growth of the U.S. economy
• Understand which economic factors affect the company outlook, and find projections for those factors – Airlines are affected by consumer confidence; consumers are more
likely to travel by air for vacation when consumer confidence is high. The Consumer Confidence Index equaled 92.6 in December. A figure between 80.0 and 100.0 suggests slow growth (Consumer Confidence Index figures can range from 0 to 160)
43
Company-Specific Factors
• Understand the story
• It may not be appropriate to use the same LTG rate for all companies in an industry
• Growth can come from– existing assets, both tangible & intangible
– new products or services
– acquisitions & JVs
44
Key Points
• You don’t have to adopt any of this
• However, you should think about these factors and understand if/how they affect the unit valuation
45

The End
Questions and
Discussion
46