45632721 Mechanical Alloying and Milling
492
-
Upload
mythos1976 -
Category
Documents
-
view
271 -
download
18
Transcript of 45632721 Mechanical Alloying and Milling


Mechanical Alloyingand Milling
DK1314half-series-title.qxd 8/16/04 9:44 AM Page A

MATERIALS ENGINEERING
1. Modern Ceramic Engineering: Properties, Processing, and Use in Design. Second Edition,Revised and Expanded, David W. Richerson
2. Introduction to Engineering Materials: Behavior, Properties, and Selection,G. T. Murray
3. Rapidly Solidified Alloys: Processes • Structures • Applications, edited by Howard H. Liebermann
4. Fiber and Whisker Reinforced Ceramics for Structural Applications, David Belitskus
5. Thermal Analysis of Ceramics, Robert F. Speyer
6. Friction and Wear of Ceramics, edited by Said Jahanmir
7. Mechanical Properties of Metallic Composites, edited by Shojiro Ochiai
8. Chemical Processing of Ceramics, edited by Burtrand I. Lee and Edward J. A. Pope
9. Handbook of Advanced Materials Testing, edited by Nicholas P. Cheremisinoff and Paul N. Cheremisinoff
10. Ceramic Processing and Sintering, M. N. Rahaman
11. Composites Engineering Handbook, edited by P. K. Mallick
12. Porosity of Ceramics, Roy W. Rice
13. Intermetallic and Ceramic Coatings, edited by Narendra B. Dahotre and T. S. Sudarshan
14. Adhesion Promotion Techniques: Technological Applications, edited by K. L. Mittal and A. Pizzi
15. Impurities in Engineering Materials: Impact, Reliability, and Control, edited by Clyde L. Briant
16. Ferroelectric Devices, Kenji Uchino
17. Mechanical Properties of Ceramics and Composites: Grain and Particle Effects, Roy W. Rice
18. Solid Lubrication Fundamentals and Applications, Kazuhisa Miyoshi
19. Modeling for Casting and Solidification Processing, edited by Kuang-O (Oscar) Yu
20. Ceramic Fabrication Technology, Roy W. Rice
21. Coatings of Polymers and Plastics, edited by Rose A. Ryntz and Philip V. Yaneff
22. Mechanical Alloying and Milling, C. Suryanarayana
Additional Volumes in Preparation
Micromechatronics, Kenji Uchino and Jayne Giniewicz
Ceramic Processing and Sintering: Second Edition, Mohamed N. Rahaman
DK1314half-series-title.qxd 8/16/04 9:44 AM Page B

Marcel Dekker New York
C. Suryanarayana
MechanicalAlloying
andMilling
DK1314half-series-title.qxd 8/16/04 9:44 AM Page i

Although great care has been taken to provide accurate and current information, neither the author(s) nor
the publisher, nor anyone else associated with this publication, shall be liable for any loss, damage, or
liability directly or indirectly caused or alleged to be caused by this book. the material contained herein
is not intended to provide specific advice or recommendations for any specific situation.
Trademark notice: Product or corporate names may be trademarks or registered trademarks and are used
only for identification and explanation without intent to infringe.
Library of Congress Cataloging-in-Publication Data
A catalog record for this book is available from the Library of Congress.
ISBN: 0-8247-4103-X
This book is printed on acid-free paper.
Headquarters
Marcel Dekker, 270 Madison Avenue, New York, NY 10016, U.S.A.
tel: 212-696-9000; fax: 212-685-4540
Distribution and Customer Service
Marcel Dekker, Cimarron Road, Monticello, New York 12701, U.S.A.
tel: 800-228-1160; fax: 845-796-1772
World Wide Web
http://www.dekker.com
Copyright nnnnnn 2004 by Marcel Dekker. All Rights Reserved.
Neither this book nor any part may be reproduced or transmitted in any form or by any means, electronic
or mechanical, including photocopying, microfilming, and recording, or by any information storage and
retrieval system, without permission in writing from the publisher.
Current printing (last digit):
10 9 8 7 6 5 4 3 2 1
PRINTED IN THE UNITED STATES OF AMERICA
MD: SURYANARAYANA, JOB: 03320, PAGE: ii
4103-X_Suryanarayana_Prelims_R1_071504

Foreword
Chemists sometimes talk of ‘brute force methods’ and of ‘soft chemistry’, with aclear preference for the latter. At first sight, hurling small samples of metallicpowder violently between hard grinding balls would seem the apotheosis of brute-force methods, and yet that process (called ‘mechanical alloying’ or ‘mechanicalmilling’, according to the nature of the powder) has attracted ever-growing numbersof metallurgical researchers in the past two decades. Several kinds of metastablestructures, crystalline or amorphous, can be prepared in a wide range of composi-tions, and the literature has burgeoned.
Professor Suryanarayana, known to all his many friends and admirers as Suryafor short, has been involved with this type of research since the beginning, and has anunequalled familiarity with the entire literature. In this book, he has exploited thisexpertise to present the most thorough treatment of the field to see the light of day.I commend it cordially to the metallurgical profession.
Robert W. Cahn, FRS(University of Cambridge)
4103-X_Suryanarayana_Foreword_R1_071504
MD: SURYANARAYANA, JOB: 03320, PAGE: iii
iii

4103-X_Suryanarayana_Foreword_R1_071504
MD: SURYANARAYANA, JOB: 03320, PAGE: iv
Preface
Mechanical alloying and milling continues to be a fascinating field of investigationfor nearly four decades. Originally developed in the late 1960’s for the productionof oxide dispersion strengthened (ODS) nickel-base superalloys, the technique ofmechanical alloying has now branched out to the synthesis of a variety ofequilibrium and non-equilibrium alloy phases, including solid solutions, intermetal-lics, quasicrystals, amorphous alloys, and bulk metallic glasses. Nanostructured ma-terials, hydrogen storage materials, and even exotic materials are being synthesizedusing this simple, inexpensive, and scaleable technique. It is a continually growingfield with over 500 research papers being published annually. It is also an acceptedindustrial processing method with varied applications for these materials.
Several dedicated conferences have been held on this topic and their Proceed-ings have been published. A few monographs have also been published on this topic.But, in majority of these, the treatment has been rather cursory, with focus onselected topics and not all the topics have been covered. The purpose of this presentbook is to serve as a resource for both students and researchers who require a timelyand comprehensive treatment of the subject.
The present book surveys the vast field of Mechanical Alloying (MA) (and therelated techniques) from a scientific and technological point of view. The organizationof the book progresses logically from the historical perspective of the technique,through a description of the process, different metastable effects produced, mecha-nisms of phase formation, to applications of mechanically alloyed products. The bookcomprises 19 chapters. Chapter 1 presents an overview of the different non-equilibriumprocessing techniques presently available to synthesize advanced materials and sets thetone for the rest of the book. A brief historical introduction of the development of thetechnique of MA is presented in Chapter 2 followed by introduction of the differentvariants of MA in Chapter 3. A detailed description of the mills and the effect ofprocess variables on phase constitution are discussed in Chapters 4 and 5, respectively.Chapter 6 describes the mechanism of alloying in different types of powder combina-tions. A detailed description of the techniques to measure particle size, lattice strain,phase constitution, and microstructure of the as-milled powder and consolidatedproducts is presented in Chapter 7. The temperature rise during milling is discussed in
4103-X_Suryanarayana_Preface_R2_080304
MD: SURYANARAYANA, JOB: 03320, PAGE: v
v

Chapter 8. The next four Chapters deal with the metastable constitutional effectsachieved in the milled powders of different alloy systems. These include Solid Solutions(Chapter 9), Intermetallics (including Quasicrystals) (Chapter 10), Disordering ofIntermetallics (Chapter 11), and Amorphous Alloys (Chapter 12). Formation ofnanostructures and nanocomposites, their properties, and potential applications aredescribed in Chapter 13. Synthesis of alloy phases, purification of metals by exchangereactions, preparation of refractory compounds, etc. by mechanochemical methods isdiscussed in Chapter 14. The ubiquitous problem of powder contamination and waysof avoiding/minimizing it are presented in Chapter 15. Chapter 16 briefly explains thedifferent modeling attempts that have been undertaken to-date and their currentlimitations. The existing and potential applications of the mechanically alloyedproducts are described in Chapter 17. Safety hazards associated with powder handlingare outlined in Chapter 18 and the last Chapter makes some concluding remarks onthe present status of mechanical alloying and milling.
This book is primarily intended for use by graduate students and researchpersonnel involved with this technique of powder processing. Industry personnelconnected with the production and characterization of mechanically alloyed prod-ucts, and wishing to exploit these materials for potential applications will also findthis book very useful in understanding the basic scientific features. Scientists begin-ning their research work in this area can also find this book helpful from the clearintroduction to the several different topics (the mills, process variables, methods ofcharacterization of mechanically alloyed powders, types of phases that could beproduced, etc.) and also the detailed explanations of the various aspects associatedwith this technique. Persons involved in the non-equilibrium processing of materialsin general will also benefit from a comparison of this technique with other tech-niques. Because of these attractive features, this book could also be of use for agraduate level course in processing of materials.
I have strived to make the discussion of topics as comprehensive and self-contained as possible. For this reason, I have included unusually extensive (and mostcomprehensive at the time of writing) listing of the results of different metastableeffects obtained in various alloy systems. Extensive lists of references have also beenprovided at the end of each Chapter. These are important features of this book. Be-cause of this, the book could be an excellent source of references for the literature onMA.
The treatment of the subject matter has been simple and has been presented inan easy to understand manner. However, the scientific accuracy has not been com-promised. The most recent literature has also been cited, including several paperspublished in 2003! The ISMANAM conference proceedings have been very goodsources of the most recent literature, in addition to the archival journals in whichresearch papers have been published.
The field of Mechanical Alloying has become quite diversified with activecontributions from materials scientists, chemists, physicists, and engineers. There-fore, in surveying such a diverse field, it is possible that some errors have crept in.I would be most pleased if the discerning readers, who spot any mistakes, bring themto my notice at [email protected].
C. SuryanarayanaOrlando, October 2003
MD: SURYANARAYANA, JOB: 03320, PAGE: vi
4103-X_Suryanarayana_Preface_R2_080304
Prefacevi

Acknowledgements
In writing any book it is unlikely that the author has worked entirely in isolation andwithout assistance from colleagues and friends. I am certainly not an exception and itis with great pleasure that I acknowledge those people that have contributed, invarious ways, to the successful completion of this book.
In my long journey in the field of non-equilibrium processing, I had the goodfortune to interact with a great number of colleagues, from all of whom I havelearned immensely and benefited greatly in understanding the complexities of meta-stable phases. In alphabetical order, they are T.R. Anantharaman, R.W. Cahn,A. Inoue, E. Ivanov, C.C. Koch, E.J. Lavernia, T. Masumoto, J.J. Moore, P.Ramachandrarao, S. Ranganathan, and R. Sundaresan. I am particularly thankfulto Professors T.R. Anantharaman, R.W. Cahn, T. Masumoto, and J.J. Moore fortheir guidance and advice at different stages in my professional career. I am gratefulto them for sharing with me the excitement of working in the general field of non-equilibrium processing of materials. Particular mention may be made of E. Ivanov,C.C. Koch, E.J. Lavernia, and R. Sundaresan for collaborating with me at variousstages in working in the field of mechanical alloying and sharing their expertise withme. I was also fortunate to work with many talented undergraduate and graduatestudents and I am thankful to them for their dedicated efforts in joining me inpushing the frontiers of mechanical alloying farther. I hope that they have learnedfrom me at least a fraction of what I have learnt from them.
A large number of friends have helped me by supplying figures that have beenincluded in different Chapters of the book. I am thankful to them. Additionally,many students have helped in the arduous task of drawing some of the figures. Theyare Chandrasen Rathod, Bhaskar Srivastava, Ms. Honey Dandwani, Soon-JikHong, and K.V. Krishna Murthy. I am particularly indebted to them for their help.The aesthetics of the figures are mostly due to their efforts.
Parts of the book were written while the author was a Guest Scientist at theGKSS Research Center in Geesthacht, Germany, during the summers of 2002 and2003. I am deeply obliged to Thomas Klassen and Rudiger Bormann for providingkind hospitality and for the several useful discussions during the post-lunch walks inthe woods. Thomas Klassen has also read some Chapters and made constructive
4103-X_Suryanarayana_Acknowledgements_R2_071504
MD: SURYANARAYANA, JOB: 03320, PAGE: vii
vii

comments to improve the readability and clarity of the book. I am thankful to himfor this.
I would like to thank David Nicholson and Ranganathan Kumar, successiveChairmen of the Department of Mechanical, Materials, and Aerospace Engineeringat the University of Central Florida for providing a conducive environment tocomplete the draft of the Book.
I wish to thank the staff of the publisher, Marcel Dekker, Inc., for their highlevel of co-operation and interest in successfully producing a high quality and aes-thetically pleasing book. I am particularly grateful to B.J. Clark for his patience inwaiting for the delivery of the manuscript.
Last, but by no means least, I owe a huge debt of gratitude to my wife, Meena,who encouraged me and supported me with love, understanding, and patiencethroughout this endeavor.
Finally, I dedicate this book to my spiritual mother, Karunamayi, Sri Sri SriVijayeswari Devi, for Her invisible and ever-inspiring encouragement and blessings.
C. SuryanarayanaOrlando, FL; October 2003
MD: SURYANARAYANA, JOB: 03320, PAGE: viii
4103-X_Suryanarayana_Acknowledgements_R2_071504
Acknowledgementsviii

Table of Contents
Foreword iiiPreface vAcknowledgements vii
1. INTRODUCTION 1
1.1. Motivation 11.2. Advanced Materials 21.3. Thermodynamic Stability 21.4. Basis of Nonequilibrium Processing 51.5. Some Nonequilibrium Processing Methods 7
1.5.1. Rapid Solidification Processing 71.5.2. Mechanical Alloying 71.5.3. Plasma Processing 81.5.4. Vapor Deposition 81.5.5. Spray Forming 8
1.6. Outline of the Book 8References 9
2. HISTORICAL PERSPECTIVE 11
2.1. Introduction 112.2. Historical Background 112.3. Development of High-Energy Ball Milling 122.4. Potential of Mechanical Alloying 142.5. Potential Resources of Mechanical Alloying Literature 14
References 17
MD: SURYANARAYANA, JOB: 03320, PAGE: ix
ix
4103-X_Suryanarayana_Contents_R2_080904

3. NOMENCLATURE 21
3.1. Introduction 213.2. Mechanical Alloying 213.3. Mechanical Milling/Disordering 223.4. Reaction Milling 223.5. Cryomilling 233.6. Rod Milling 233.7. Mechanically Activated Annealing 243.8. Double Mechanical Alloying 243.9. Mechanically Activated Self-propagating High-temperature
Synthesis 243.10. Oxidation–Attrition Milling–Reduction 253.11. Mechanochemical Processing 263.12. Other Methods 26
3.12.1. Repeated Cold Rolling 273.12.2. Multilayer Amorphization 283.12.3. Severe Plastic Deformation 293.12.4. Accumulative Roll Bonding 30
3.13. Acronyms Used in the Literature 32References 33
4. EQUIPMENT FOR MECHANICAL ALLOYING 35
4.1. Introduction 354.2. Raw Materials 364.3. Types of Mills 37
4.3.1. Spex Shaker Mills 374.3.2. Planetary Ball Mills 394.3.3. Attritor Mills 414.3.4. Commercial Mills 444.3.5. New Designs 47
4.4. Selection of Grinding Medium 55References 57
5. PROCESS VARIABLES IN MILLING 59
5.1. Introduction 595.2. Type of Mill 605.3. Milling Container 605.4. Milling Energy/Speed 615.5. Milling Time 645.6. Grinding Medium 645.7. Ball-to-Powder Weight Ratio 665.8. Extent of Filling the Vial 685.9. Milling Atmosphere 69
5.10. Process Control Agents 705.10.1. Nature of PCAs 705.10.2. Quantity of PCA 72
MD: SURYANARAYANA, JOB: 03320, PAGE: x
Contentsx
4103-X_Suryanarayana_Contents_R2_080904

5.10.3. Constitution of the Milled Powder 745.10.4. Choice of PCA 75
5.11. Temperature of Milling 76References 78
6. MECHANISM OF ALLOYING 83
6.1. Introduction 836.2. Ball-Powder-Ball Collisions 836.3. Different Stages of Processing 84
6.3.1. Early Stage of Processing 856.3.2. Intermediate Stage of Processing 856.3.3. Final Stage of Processing 87
6.4. Evolution of Particle Size 876.5. Ductile-Ductile Components 896.6. Ductile-Brittle Components 916.7. Brittle-Brittle Components 92
References 94
7. CHARACTERIZATION OF POWDERS 95
7.1. Introduction 957.2. Size and Shape 967.3. Surface Area 997.4. Phase Constitution 102
7.4.1. Crystalline Phases 1027.4.2. Quasi-crystalline Phases 1047.4.3. Amorphous Phases 105
7.5. Microstructural Features 1077.6. Crystallite Size and Lattice Strain 1107.7. Transformation Behavior 1137.8. Grain Growth Studies 117
References 118
8. TEMPERATURE RISE DURING MILLING 121
8.1. Introduction 1218.2. Types of Temperature Effects 1228.3. Methods to Evaluate Temperature Rise 123
8.3.1. Methodology Behind the Theoretical Models 1238.3.2. Theoretical Models 1248.3.3. Observations Based on Microstructural/Phase
Transformations 1278.3.4. Experimental Observations 128
8.4. Temperature of the Balls 1338.5. Methods to Minimize Temperature Rise 135
References 136
MD: SURYANARAYANA, JOB: 03320, PAGE: xi
Contents xi
4103-X_Suryanarayana_Contents_R2_080904

9. SOLID SOLUBILITY EXTENSIONS 139
9.1. Introduction 1399.2. Hume-Rothery Rules for Solid Solution Formation 1399.3. Formation of Supersaturated Solid Solutions 1409.4. Measurement of Solid Solubility Limits 1429.5. Difficulties in Solid Solubility Determination 1459.6. Effect of Process Variables 156
9.6.1. Milling Temperature 1569.6.2. Process Control Agent 1589.6.3. Starting Composition of the Powder Blend 159
9.7. Mechanisms of Solid Solubility Extension 1609.8. Solid Solubility Plots 1649.9. Comparison between Mechanical Alloying and Rapid
Solidification Processing 169References 173
10. SYNTHESIS OF INTERMETALLICS 183
10.1. Introduction 18310.2. Quasi-crystalline Phases 185
10.2.1. General Features 18710.2.2. Effect of Process Variables 189
10.3. Crystalline Intermediate Phases 19010.3.1. Metastable Crystalline Intermediate Phases 19110.3.2. High-Pressure Phases 19310.3.3. Equilibrium Crystalline Phases 203
10.4. Role of Hydrogen as a Temporary Alloying Element 20710.5. Combustion Reactions during MA 20910.6. Cyclic Phase Transformations 21210.7. Formation of Ordered Intermetallics 21610.8. Transformation Behavior of Metastable Intermetallic Phases 21710.9. Refractory Compounds 220
References 227
11. DISORDERING OF INTERMETALLICS 243
11.1. Introduction 24311.2. Methodology 24411.3. Types of Defects Generated during Disordering and
Thermodynamic Stability 24511.3.1. Antisite Disorder 24611.3.2. Triple-Defect Disorder 24711.3.3. Quadruple-Defect Disorder 24811.3.4. Redistribution of Interstitials 249
11.4. Theoretical Background 25111.5. Phase Selection 259
MD: SURYANARAYANA, JOB: 03320, PAGE: xii
Contentsxii
4103-X_Suryanarayana_Contents_R2_080904

11.6. Reordering Kinetics 263References 264
12. SOLID-STATE AMORPHIZATION 269
12.1. Introduction 26912.2. Amorphous Phases by MA/MM 27012.3. Difference between Amorphous Phase Formation by MA
and MM 27112.4. Effect of Process Variables 291
12.4.1. Milling Energy 29212.4.2. Milling Temperature 29312.4.3. Powder Contamination 294
12.5. Thermodynamics and Kinetics of Amorphous PhaseFormation 295
12.6. Mechanisms and Models for Amorphization 29812.7. Crystallization Behavior of Amorphous Alloys 30412.8. Mechanical Crystallization 30612.9. Bulk Amorphous Alloys 307
12.10. Theoretical Predictions of Amorphous-Phase-FormingRange 312
12.11. Comparison between MA and RSP 315References 320
13. NANOSTRUCTURED MATERIALS 333
13.1. Introduction 33313.2. Classification and Characteristics of Nanostructured
Materials 33313.3. Synthesis of Nanostructured Materials 33513.4. Mechanism of Formation of Nanostructures 33713.5. Minimal Grain Size 338
13.5.1. Correlation with Material Properties 34013.5.2. Process Variables 34213.5.3. Theoretical Estimates 346
13.6. Nanocomposites 34613.7. Properties of Nanocrystalline Materials 349
13.7.1. Hardness and Strength 34913.7.2. Ductility 35213.7.3. Enhanced Sinterability 35313.7.4. Thermal Stability 353References 354
14. MECHANOCHEMICAL PROCESSING 359
14.1. Introduction 35914.2. Thermodynamic Aspects 360
MD: SURYANARAYANA, JOB: 03320, PAGE: xiii
Contents xiii
4103-X_Suryanarayana_Contents_R2_080904
14.3. Process Parameters 36914.3.1. Milling Temperature 36914.3.2. Ball-to-Powder Weight Ratio 37014.3.3. Process Control Agent 37114.3.4. Relative Proportion of the Reactants 37114.3.5. Grinding Ball Diameter 372
14.4. Phase Formation 37214.5. Combustion Reaction 37414.6. Reaction Mechanisms 375
14.6.1. Thermal Theories 37514.6.2. Reactions Induced by Shear 37614.6.3. Theory of Surface Active States 376
14.7. Mechanosynthesis of Ceramics and Nanocomposites 377References 379
15. POWDER CONTAMINATION 385
15.1. Introduction 38515.2. Sources of Contamination 386
15.2.1. Starting Powders 38715.2.2. Milling Atmosphere 39215.2.3. Milling Equipment 393
15.3. Elimination/Minimization of Contamination 39515.3.1. Milling Equipment 39615.3.2. Milling Atmosphere 39815.3.3. Process Control Agent 400References 402
16. MODELING STUDIES AND MILLING MAPS 405
16.1. Introduction 40516.2. Process Variables 40516.3. Early Modeling Attempts 40616.4. Types of Modeling 407
16.4.1. Local Modeling 40716.4.2. Global Modeling 411
16.5. Milling Maps 413References 416
17. APPLICATIONS 419
17.1. Introduction 41917.2. Oxide Dispersion Strengthened Materials 420
17.2.1. ODS Nickel-Based Alloys 42117.2.2. ODS Iron-Based Alloys 42417.2.3. ODS Aluminum-Based Alloys 425
MD: SURYANARAYANA, JOB: 03320, PAGE: xiv
Contentsxiv
4103-X_Suryanarayana_Contents_R2_080904

17.3. Magnesium-Based Alloys 42917.3.1. Supercorroding Alloys 42917.3.2. Hydrogen Storage Materials 429
17.4. Other Applications 43417.4.1. Spray Coatings 43417.4.2. Thermoelectric Power Generator Materials 43517.4.3. Waste Utilization 43617.4.4. Metal Extraction 43817.4.5. Processing of Polymers 43917.4.6. Room Temperature Solders 44117.4.7. Biomaterials 44117.4.8. Bearings 44217.4.9. Miscellaneous Applications 443
17.5. Concluding Remarks 443References 444
18. SAFETY HAZARDS 447
18.1. Introduction 44718.2. Hazards Related to Mechanical Alloying Processes 448
18.2.1. Heat Evolution 44818.2.2. Gas Evolution 44918.2.3. Explosions 449
18.3. Handling of Mechanically Alloyed Powders 44918.4. Accident Avoidance 450
References 451
19. CONCLUDING REMARKS 453
Index 457
MD: SURYANARAYANA, JOB: 03320, PAGE: xv
Contents xv
4103-X_Suryanarayana_Contents_R2_080904

4103-X_Suryanarayana_Contents_R2_080904
MD: SURYANARAYANA, JOB: 03320, PAGE: xvi

1
Introduction
1.1 MOTIVATION
The search for new and advanced materials has been the major preoccupation ofmetallurgists, ceramicists, and materials scientists for the past several centuries.Scientific investigations during the past few decades have been continuously directedto improving the properties and performance of materials. Significant improvementsin mechanical, chemical, and physical properties have been achieved by alloying andthrough chemical modifications and by subjecting the materials to conventionalthermal, mechanical, and thermomechanical processing methods. Several exoticmaterials, such as metallic glasses, quasi-crystals, nanocrystalline materials, andhigh-temperature superconductors, have been synthesized. An important offshootof these materials syntheses is the development of advanced characterization tech-niques to observe themicrostructures, determine the crystal structures, and analyze forthe composition of phases of ever-decreasing dimensions and with higher and higherresolutions. However, the rapid progress of technology has been constantly puttingforward ever-increasing demands for materials that have higher strength or improvedstiffness, and those that could be used at much higher temperatures and in moreaggressive environments than is possible with the traditional and commerciallyavailable materials. This has led to the design and development of advanced materialsthat are ‘‘stronger, stiffer, hotter, and lighter’’ than the existing materials. Synthesisand development of such materials has been facilitated by exploring the interrelation-ship among processing, structure, properties, and performance of materials—theunderpinning theme of materials science and engineering. The high-technologyindustries have certainly provided an added stimulus to accelerate these efforts.
4103-X_Suryanarayana_Ch01_R2_071504
MD: SURYANARAYANA, JOB: 03320, PAGE: 1
1

1.2 ADVANCED MATERIALS
Advancedmaterials have been defined as those where first consideration is given to thesystematic synthesis and control of crystal structure andmicrostructure ofmaterials inorder to provide a precisely tailored set of properties for demanding applications [1].The attraction of advanced materials is that they could be synthesized with improvedproperties and performance. Thus, as indicated in Figure 1.1, the materials behaviortrend band of ‘‘basic’’ materials could be raised to higher levels of strength, stiffness,and high-temperature capability, with concomitant improvement of ‘‘forgiveness’’and reduction in cost. This is made possible by ‘‘tailoring’’ or ‘‘engineering’’ theproperties of advanced materials through innovative chemistries, processes, andmicrostructures [2].
It is well recognized that the structure and constitution of advanced materialscan be better controlled by processing them under nonequilibrium (or far fromequilibrium) conditions [3]. This realization has led to the development of severalnonequilibrium processing techniques during the second half of the twentieth century.Among these, special mention may be made of rapid solidification processing [3–6],mechanical alloying [7,8], plasma processing [3,9], vapor deposition [3,10], and sprayforming [3,11]. Significant research effort is being spent on each and every one of thesetechnologies as evidenced by the increasing number of publications every year and thenumber of conferences devoted to these topics.
1.3 THERMODYNAMIC STABILITY
Let us briefly examine the factors determining whether a phase will be stable ormetastable under the given conditions of temperature, pressure, and composition. Thestability of a system at constant temperature and pressure is determined by its Gibbsfree energy, G, defined as:
G ¼ H� TS ð1:1Þwhere H is enthalpy, T absolute temperature, and S entropy. Thermodynamically, asystem will be in stable equilibrium, i.e., it will not transform to any other phase(s)
MD: SURYANARAYANA, JOB: 03320, PAGE: 2
4103-X_Suryanarayana_Ch01_R2_071504
Figure 1.1 Trend band exhibited by basic materials and the enhanced trend band
characteristic of advanced materials. Note that advanced materials exhibit improved andmore desirable properties than basic materials.
Chapter 12

under the given conditions of temperature and pressure, if it has the lowest possiblevalue of the Gibbs free energy. The above equation predicts that a system at anytemperature can be most stable either by increasing the entropy or decreasing theenthalpy or both. Consequently, solids are the most stable phases at low temperaturessince they have the strongest atomic bonding and therefore the lowestH. On the otherhand, the �TS term dominates at high temperatures; therefore, phases with morefreedom of atomicmovement, i.e., liquids and gases, becomemost stable. Thus, duringsolid-state transformations, a close packed structure is more stable at low temper-atures, while a less close packed structure is most stable at higher temperatures. Forexample, titanium with the hcp structure is the stable phase at low temperatureswhereas the bcc structure is the stablemodification at temperatures higher than 882jC.A phase can transform into another phase ifDG, the change in free energy, is negative,i.e., if the product phase has a lower free energy than the parent phase.
Let us consider the phase stability in a puremetal. At a constant pressure, the freeenergy, G, decreases with increasing temperature because of the larger contribution ofthe entropy term S at high temperatures. But the rate at which G decreases withtemperature is different for the solid and liquid phases due to the difference in thespecific heat and entropy. Thus, as indicated in Figure 1.2, the solid phase will be morestable up toTm, themelting point of the system (since the solid phase has a lowerGibbsfree energy than the liquid phase) and above this temperature the liquid phase will bemore stable. At still higher temperatures (not shown in Figure 1.2), the Gibbs freeenergy of the vapor phase (at atmospheric pressure) may be lower than that of theliquid or solid phase, and consequently the vapor phase will be the most stable.
MD: SURYANARAYANA, JOB: 03320, PAGE: 3
4103-X_Suryanarayana_Ch01_R2_071504
Figure 1.2 Variation of free energy of solid and liquid phases as a function of temperature.Note that the free energies of the two competing phases are equal at the melting point. Underequilibrium conditions, the solid phase is more stable than the liquid phase below the melting
temperature, Tm, and the liquid phase is more stable above Tm.
Introduction 3

If we consider a binary alloy systemA-B with limited solid solubility of B in A (aphase) and of A in B (h phase) at room temperature, e.g., as in a eutectic system(Fig. 1.3a), then variation of free energy, at room temperature, of the a and h phaseswith composition will be as shown in Figure 1.3b. It may be noted that the free energyof thea phasewill continue to decreasewith increasing B content until the compositionCa is reached, which represents the minimum in the Ga vs. composition curve.Similarly, the free energy of the h phase will continue to decrease with increasing Acontent until the composition Ch is reached, which represents the minimum in the Gh
vs. composition curve. In an ideal situation, when the minima in the Ga and Gh curvesare equal to each other, the compositionsCa andCh represent the phase boundaries inthe system. In other words, any alloy with a B content less than Ca will exist as the aphase, and any alloy with a B content greater than Ch will exist as the h phase. Atintermediate B contents, the alloy will exist as a mixture of the a and h phases. On theother hand, when the minima in the Ga and Gh curves are not equal to each other, thephase stability is determined by drawing a common tangent to the free energy curves ofthe a and h phases. In such a case, the a phase will be stable up to the composition
MD: SURYANARAYANA, JOB: 03320, PAGE: 4
4103-X_Suryanarayana_Ch01_R2_071504
Figure 1.3 (a) A typical eutectic phase diagram showing limited solid solubility of B in A (a
phase) and of A in B (h phase). (b) Variation of free energy of the a and h phases as a functionof composition. At compositions below Ca the a phase exists homogeneously and above Ch
the h phase exists homogeneously. In between these two compositions, a mixture of the a andh phases is the most stable constitution.
Chapter 14

representing the point of intersection of the common tangent and theGa curve and theh phase will be stable beyond the composition (B content) representing the point ofintersection of the common tangent and theGh curve. Amixture of the a and h phaseswill be stable in between these two composition extremes. A full description of thethermodynamic stability of alloy phases may be found in standard textbooks onthermodynamics (see, for example, Ref. 12).
A phase is considered nonequilibrium or metastable if it has a higher Gibbs freeenergy than in the equilibrium state for the given composition. If the Gibbs free energyof this phase is lower than that of other competing phases (or mixtures thereof), then itcan exist in a metastable equilibrium. Consequently, nonequilibrium phases can besynthesized and retained at room temperature and pressure when the free energy of thestable phases is raised to a higher level than under equilibrium conditions but ismaintained at a value below those of other competing phases. It may also be noted inthis context that kinetics plays an important role. If the kinetics during synthesis is notfast enough to allow the formation of equilibrium phase(s), i.e., the equilibriumphase(s) are suppressed by suitable processing conditions, then metastable phasescould form.
1.4 BASIS OF NONEQUILIBRIUM PROCESSING
The central underlying theme to synthesize materials in a nonequilibrium state is to‘‘energize and quench,’’ as proposed by Turnbull [13]. Processes such as solid-statequenching, rapid solidification from the melt, irradiation, and condensation fromvapor were considered by Turnbull to evaluate the departure from equilibrium.However, there are several other methods of nonequilibrium processing that do notinvolve quenching. These include, among others, static undercooling of liquiddroplets, electrodeposition of alloys, mechanical alloying, and application of highpressures. Therefore, instead of calculating the quench rate, it may be desirable toevaluate the maximal departure from equilibrium in each processing method. Asdepicted in Figure 1.4, the process of energization involves bringing the equilibriumcrystalline material, with a free energy G0, into a highly nonequilibrium (metastable)state, with a free energy G2. This could be achieved by some external dynamic forcing,e.g., through increase of temperature T (melting or evaporation), irradiation, appli-cation of pressure P, or storing of mechanical energy E by plastic deformation [3,8].Such energized materials were referred to as ‘‘driven materials’’ byMartin and Bellon[14]. The energization also usually involves a possible change of state from solid toliquid (melting) or gas (evaporation). For example, during rapid solidificationprocessing the starting solid material is melted and during vapor deposition thematerial is vaporized. The energized material is then ‘‘quenched’’ into a configura-tionally frozen state by methods such as rapid solidification processing or mechanicalalloying, such that the resulting phase is in a highly metastable condition, having a freeenergyG1. This phase could then be used as a precursor to obtain the desired chemicalconstitution (other less metastable phases) and/or microstructure (e.g., nanocrystal-line material) by subsequent heat treatment/processing. It has been shown thatmaterials processed in this way possess improved physical and mechanical character-istics in comparison to conventional ingot (solidification) processed materials. Thesemetastable phases can also be subsequently transformed to the equilibrium crystallinephase(s) by long-term annealing.
MD: SURYANARAYANA, JOB: 03320, PAGE: 5
4103-X_Suryanarayana_Ch01_R2_071504
Introduction 5

The ability of the different processing techniques to synthesize nonequilibriumstructures may be conveniently evaluated by measuring or estimating the achieveddeparture from equilibrium, i.e., the maximal energy that can be stored in excess ofthat of the equilibrium/stable structure. This has been done by different groups fordifferent nonequilibrium processing techniques [13,15–18]. While the excess energy isexpressed in kJ/mol in Refs. 15–17, Turnbull [13] expressed this as an ‘‘effectivequenching rate.’’ The way the departure is calculated is different in these differentapproaches (the reader is encouraged to consult the original papers for details ofcalculations) and therefore the results do not correspond exactly in all the cases.Table 1.1 summarizes the departures calculated for the different nonequilibriumprocessing techniques. It is clear from the table that vapor deposition and ionimplantation techniques have very large departures from equilibrium (or effectivequench rates). It is also clear that mechanical alloying is a technique that allows thematerial to be processed much farther from equilibrium than, for example, rapidsolidification processing, which has been shown to have a tremendous potential in
MD: SURYANARAYANA, JOB: 03320, PAGE: 6
4103-X_Suryanarayana_Ch01_R2_071504
Figure 1.4 The basic concept of ‘‘energize and quench’’ to synthesize nonequilibrium
materials.
Table 1.1 Departure from Equilibrium Achieved in Different NonequilibriumProcessing Techniques
Maximal departure fromequilibrium (kJ/mol)
TechniqueEffective quenchrate (K/s) Ref. 13 Ref. 15 Refs. 16, 17
Solid state quench 103 — 16Rapid solidification processing 105–108 2–3 24Mechanical alloying — 30 30Mechanical cold work — — 1
Irradiation/ion implantation 1012 — 30Condensation from vapor 1012 — 160
Chapter 16

developing industrially useful nonequilibrium materials, e.g., amorphous transformercore laminations [3–5].
1.5 SOME NONEQUILIBRIUM PROCESSING METHODS
As mentioned earlier, a number of nonequilibrium processing methods have beendeveloped during the past few decades to synthesize novel and advancedmaterials.Wewill now briefly describe some of the different nonequilibrium processing techniquesthat have become popular in recent years. The reader is advised to consult thereferences listed for each technique to get a full and better appreciation of the potentialand limitations of these techniques.
1.5.1 Rapid Solidification Processing
Rapid solidification processing (RSP) is the method developed by Pol Duwez atCalTech in 1960 [19]. In this method, a molten metal or alloy is cooled very rapidly atrates of about 106 K/s, but at least about 104 K/s. This has been traditionally done by(1) allowing molten droplets to solidify either in the form of splats (on good thermallyconducting substrate, e.g., as in ‘‘gun’’ quenching) or by impinging a cold stream of airor an inert gas against the molten droplets (as, e.g., in atomization), or (2) stabilizing aflowing melt stream so that it freezes as a continuous filament, ribbon, or sheet incontact with a moving chill surface (melt spinning and its variants), or (3) surfacemelting technologies involving rapid melting at a surface followed by rapid coolingsustained by rapid heat extraction into the unmelted block (laser surface treatments).A number of techniques based on these three categories have been developed over theyears, and these have been summarized in some reviews [20,21].
The technique RSP has revolutionized many traditional concepts of metallurgyand materials science. For example, it has been shown that metallic materials can bemade to exist in either a glassy (noncrystalline) state [4,5] or in a quasi-crystalline state(in which the traditionally forbidden crystal symmetries could be observed) [6], inaddition to their normal crystalline state. Furthermore, it is possible to produce avariety of other metastable phases, such as supersaturated solid solutions andnonequilibrium intermediate phases. Rapidly solidified materials have been findinga multitude of applications, including a range of soft (for transformer core lamina-tions) and hard magnetic materials, wear-resistant light alloys, materials with en-hanced catalytic performance and for fuel cell applications, powder metallurgy toolsteels and superalloys, and new alloys for medical implants and dental amalgams [22].
1.5.2 Mechanical Alloying
Mechanical alloying, the subject matter of this book, is a powder processing techniquethat was developed in the mid-1960s by John Benjamin [7] to produce nickel-basedoxide dispersion strengthened (ODS) superalloys for gas turbine applications [8].Subsequently, it was realized that mechanical alloying can also be used to synthesize avariety of both equilibrium and nonequilibrium materials at room temperature andstarting from blended elemental powders. This technique has attracted the attention ofa large number of researchers during the past 15–20 years or so. The processinginvolves repeated cold welding, fracturing, and rewelding of powder particles in ahigh-energy ball mill resulting in the formation of alloy phases. This technique is also
MD: SURYANARAYANA, JOB: 03320, PAGE: 7
4103-X_Suryanarayana_Ch01_R2_071504
Introduction 7

capable of synthesizing a variety of equilibrium and nonequilibrium alloy phasesstarting from prealloyed powders. In fact, all the nonequilibrium effects achieved byRSP of metallic melts have also been observed in mechanically alloyed powders.Consequently, interest in this technique has been constantly growing [23]. Mechanicalalloying is presently one of the most popular nonequilibrium processing techniques.
1.5.3 Plasma Processing
The high temperature, high enthalpy, and fast quench rates associated with plasmaprocessing offer unlimited potential in synthesizing novel and advancedmaterials withimproved properties. The quench rates associated with this technique are typically inthe range of 105–107 K/s. Plasma processes are usually one-step processes with thecapability of handling large throughputs in small reactor volumes in relatively shortprocessing times. This technique has been used to synthesize a variety of alloys,intermetallics, and refractory compounds [24].
1.5.4 Vapor Deposition
Vapor deposition methods have been used for many decades to produce nonequilib-rium phases, including amorphous phases. The rate at which the vapor transforms intoa solid is very high and can reach values of about 1012 K/s. Under these conditions,many different types of nonequilibrium phases have been produced. Variations of thistechnique, including physical vapor deposition (PVD) and chemical vapor deposition(CVD), are being regularly exploited to study the formation and characteristics ofboth stable and metastable phases, in addition to producing coatings for decorativepurposes and also to enhance wear and oxidation resistance [25,26].
1.5.5 Spray Forming
In spray forming, highly energetic gas jets impinge on a stream of molten metallicmaterial and disintegrate the melt into small, irregular ligaments. These almostimmediately transform into spherical droplets, which are then cooled by the atom-ization gas, which facilitates momentum transfer and causes the droplets to cool downand solidify during their flight toward the substrate. Deposition of one layer of metalover the other results in the formation of a layered ‘‘splat’’ structure, similar to thatobtained in the ‘‘gun’’ technique of rapid solidification of metallic melts. In thisrespect, the types of microstructure and nature of phases produced by spray formingare somewhat similar to those obtained at the lower end of the cooling rate of RSP [11].
There are several other nonequilibrium processing techniques such as laserprocessing [3,27], ion mixing [3,28], combustion synthesis [3,29], and application ofhigh pressures [30]. But due to limitations of space, wewill not discuss thesemethods ofproducing nonequilibrium effects.
1.6 OUTLINE OF THE BOOK
The outline of the book is as follows. In Chapter 2, we briefly discuss the historicalbackground that has led to the development of the technique. This is followed by thenomenclature of the differentmechanical alloyingmethods explored so far (Chapter 3).Chapter 4 describes the different types of equipment available for mechanical alloying.
MD: SURYANARAYANA, JOB: 03320, PAGE: 8
4103-X_Suryanarayana_Ch01_R2_071504
Chapter 18

The mechanical alloying process and the effect of process variables in achievingdifferent types of materials is described in Chapter 5. The mechanism of mechanicalalloying is discussed in Chapter 6, and Chapter 7 briefly describes the differentmethods of characterizing the mechanically alloyed powders. The temperature riseobserved during milling of powders is discussed in Chapter 8. The synthesis of stableand metastable phases (supersaturated solid solutions and intermediate phases) isdiscussed in Chapters 9 and 10, respectively. Disordering of ordered intermetallics isdiscussed in Chapter 11, whereas the synthesis of amorphous alloys by solid-stateamorphization techniques is described in Chapter 12. Formation of nanostructuredmaterials is considered in Chapter 13, and reduction of oxides, chlorides, and the liketo pure metals and synthesis of nanocomposites by mechanochemical synthesis isdiscussed in Chapter 14. The ubiquitous problem of powder contamination isdiscussed in Chapter 15. Recent developments in understanding the process ofmechanical alloying through modeling and milling maps is described in Chapter 16.Applications of mechanically alloyed products are described in Chapter 17, and theproblem of safety hazards in handling fine powders, such as those produced bymechanical alloying, are discussed in Chapter 18. The last chapter presents concludingremarks and future prospects for this area.
REFERENCES
1. Bloor, D., Brook, R. J., Flemings, M. C., Mahajan, S., eds. (1994). The Encyclopedia of
Advanced Materials. Oxford, UK: Pergamon.2. Froes, F. H., deBarbadillo, J. J., Suryanarayana, C. (1990). In: Froes, F. H.,
deBarbadillo, J. J., eds. Structural Applications of Mechanical Alloying. Materials Park,OH: ASM International, pp. 1–14.
3. Suryanarayana, C. ed. (1999). Nonequilibrium Processing of Materials. Oxford, UK:Pergamon.
4. Liebermann, H. H. ed. (1993) Rapidly Solidified Alloys: Processes, Structures, Properties,
Applications. New York: Marcel Dekker.5. Anantharaman, T. R., Suryanarayana, C. (1987). Rapidly Solidified Metals: A Tech-
nological Overview. Aedermannsdorf, Switzerland: Trans Tech.
6. Suryanarayana, C., Jones, H. (1988). Int. J. Rapid. Solidif. 3:253–293.7. Benjamin, J. S. (1970). Metall. Trans. 1:2943–2951.8. Suryanarayana, C. (2001). Prog. Mater. Sci. 46:1–184.
9. Upadhya, K. ed. (1993) Plasma Synthesis and Processing of Materials. Warrendale, PA:TMS.
10. Bickerdike, R. L., Clark, D., Easterbrook, J. N., Hughes, G., Mair, W. N., Partridge,P. G., Ranson, H. C. (1984–85). Int. J. Rapid. Solidif. 1:305–325.
11. Lavernia, E. J., Wu, Y. (1996). Spray Atomization and Deposition. Chichester, UK:Wiley.
12. Gaskell, D. R. (1995). Introduction to the Thermodynamics of Materials. 3rd ed.
Washington, DC: Taylor & Francis.13. Turnbull, D. (1981). Metall. Trans. 12A:695–708.14. Martin, G., Bellon, P. (1997). Solid State Phys. 50:189–331.
15. Shingu, P. H. In: Henein, H., Oki, T., eds. Processing Materials for Properties.Warrendale, PA: TMS, pp. 1275–1280.
16. Froes, F. H., Suryanarayana, C., Russell, K., Ward-Close, C. M. In: Singh, J., Copley, S.M., eds. Novel Techniques in Synthesis and Processing of Advanced Materials.
Warrendale, PA: TMS, pp. 1–21.
MD: SURYANARAYANA, JOB: 03320, PAGE: 9
4103-X_Suryanarayana_Ch01_R2_071504
Introduction 9

17. Froes, F. H., Suryanarayana, C., Russell, K., Li, C-G. (1995). Mater. Sci. Eng. A 192/193:612–623.
18. Klassen, T., Oehring, M., Bormann, R. (1997). Acta Mater. 45:3935–3948.
19. Duwez, P. (1967). Trans. ASM Q. 60:607–633.20. Suryanarayana, C. (1991). In: Cahn, R. W., ed. Processing of Metals and Alloys.
Materials Science and Technology: A Comprehensive Treatment. Vol. 15. Weinheim,
Germany: VCH, pp. 57–110.21. Jones, H. (2001). Mater. Sci. Eng. A 304/306:11–19.22. Suryanarayana, C. (2002). In: Buschow, K. H. J., et al. eds., Encyclopedia of Materials:
Science and Technology—Updates. Oxford, UK: Pergamon.23. Suryanarayana, C. (1995). Bibliography on Mechanical Alloying and Milling. Cambridge,
UK: Cambridge International Science Publishing.
24. Ananthapadmanabhan, P. V., Ramani, N. (1999). In: Suryanarayana, C., ed. Nonequi-librium Processing of Materials. Oxford, UK: Pergamon, pp. 121–150.
25. Colligon, J. S. (1999). In: Suryanarayana, C., ed., Nonequilibrium Processing ofMaterials. Oxford, UK: Pergamon, pp. 225–253.
26. Teyssandier, F., Dollet, A. (1999). In: Suryanarayana, C., ed. Nonequilibrium Processingof Materials. Oxford, UK: Pergamon, pp. 257–285.
27. Singh, J. (1994). J. Mater. Sci. 29:5232–5258.
28. Liu, B. X. (1997). Phys. Stat. Sol. (a) 161:3–33.29. Moore, J. J., Feng, H. J. (1995). Prog. Mater. Sci. 39:243–316.30. Sharma, S. M., Sikka, S. K. (1996). Prog. Mater. Sci. 40:1–77.
MD: SURYANARAYANA, JOB: 03320, PAGE: 10
4103-X_Suryanarayana_Ch01_R2_071504
Chapter 110

2
Historical Perspective
2.1 INTRODUCTION
Mechanical alloying (MA) is a powder processing technique that allows production ofhomogeneous materials starting from blended elemental powder mixtures. John S.Benjamin and his colleagues at the Paul D. Merica Research Laboratory of theInternational Nickel Company (INCO) developed the process around 1966. Thetechnique was the result of a long search to produce a nickel-based superalloy for gasturbine applications that combined the high-temperature strength of oxide dispersionand the intermediate-temperature strength of gV precipitate. The required corrosionand oxidation resistance were also included in the alloy by suitable alloying additions.Benjamin [1–3] has summarized the historical background of the process and thebackground work that led to the development of the present process.
2.2 HISTORICAL BACKGROUND
Both precipitation hardening and oxide dispersion strengthening in alloy systems wereknown by the 1960s. Precipitation hardening in nickel was first reported by Chevenardin 1929 [4]. Rapid development of the gV age-hardened alloys took place in the 1940s asan enabling materials technology for the aircraft gas turbine [5]. Multicomponentalloys, containing 10 ormore elements, and simultaneously containingmore than 50%of the gV strengthening phase, were in common use by 1966.
It was also known that the strength of metals at high temperatures could beincreased by the deliberate addition of a fine dispersion of insoluble refractory oxides[6,7]. The origin could be traced back to the early work of Coolidge on thoria-dispersed tungsten [8]. The principle was also applied to aluminum by Irmann in 1949
4103-X_Suryanarayana_Ch02_R2_071504
MD: SURYANARAYANA, JOB: 03320, PAGE: 11
11

[9] and to nickel by Alexander et al. in 1961 [10]. Although many methods could beused to produce such dispersions in simple metal systems, these techniques were notapplicable to the production of more highly alloyed materials such as those requiredfor gas turbine engines. For example, conventional powder metallurgy techniques,either did not produce an adequate dispersion or did not permit the use of reactivealloying elements such as chromium and aluminum, which confer the neededproperty characteristics including corrosion resistance and intermediate-temperaturestrength.
In the early 1960s, INCO developed a process for manufacturing graphiticaluminum alloys by injecting nickel-coated graphite particles into a molten aluminumbath by argon sparging. A modification of the same technique was tried to inoculatenickel-based alloys with a dispersion of nickel-coated, fine refractory oxide particles.The purpose of nickel coating was to render the normally unwetted oxide particleswettable by a nickel-chromium alloy. Early experiments used metal-coated zirconiumoxide, which did not yield the desired result. A thorough analysis revealed that theexperiment failed because the vendor had supplied powder that was zirconia-coatednickel rather than nickel-coated zirconia! Since the reaction of aluminumwith nickel isstrongly exothermic, the heat generated cleansed the surface of the graphite andlowered the surface energy. On this basis it was assumed that coating of the refractoryoxide with aluminumwould be ideal to produce the exothermic reaction. This also didnot prove successful. When some other attempts also failed to yield the desired result,out of desperation, researchers turned their attention to the ball milling process.
2.3 DEVELOPMENT OF HIGH-ENERGY BALL MILLING
Ball milling has been applied to the coating of tungsten carbide with cobalt for a longtime [11]. Thus, it was known that ball milling could be used to coat hard phases suchas tungsten carbide with a soft phase such as cobalt or nickel. It was also known thatmetal powder particles could be fractured when subjected to heavy plastic deforma-tion. However, if ductile metal powder particles are used, cold welding among themwould prevent fragmentation of the particles. Hence, at some stage cold welding couldbe as rapid as fracturing. This cold welding could be avoided or minimized byemploying special chemicals that act as surfactants, such as stearic acid. Consequently,cold welding could be minimized, allowing fracturing to take place more easily andeffectively to produce finer particles. Another problemwith very fine-powder particles,especially those containing reactive elements such as chromium or aluminum, was thatthey are pyrophoric at worst or pick up large amounts of oxygen at best. The reactivityof the element also had to be considered; aluminum in a dilute nickel-aluminumalloy isorders of magnitude less reactive than pure aluminum. Taking all these factors intoconsideration, Benjamin decided to produce composite powder particles by:
Using a high-energy ball mill to favor plastic deformation required for coldwelding and reduce the process times
Using a mixture of elemental and master alloy powders (the latter to reduce theactivity of the element, since it is known that the activity in an alloy or acompound could be much less than in a pure metal)
Eliminating the use of surface-active agents that would produce fine pyro-phoric powder as well as contaminate the powder, and
MD: SURYANARAYANA, JOB: 03320, PAGE: 12
4103-X_Suryanarayana_Ch02_R2_071504
Chapter 212

Relying on the constant interplay between welding and fracturing to yield apowder with a refined internal structure, but having an overall particle size,which was relatively coarse and therefore stable. Refinement of micro-structure is a common feature of the powders produced by MA
This method of making the composite powders reproduced the properties ofthoria-dispersed nickel synthesized by a completely different process. Encouraged bythis success, Benjamin and coworkers conducted experiments to produce a nickel-chromium-aluminum-titanium alloy containing thoria as the dispersoid. This was alsosuccessfully produced, first in a small high-speed shaker mill and later in a 1-gallonstirred ballmill. This heralded the birth ofMAas amethod to produce oxide dispersionstrengthened (ODS) alloys on an industrial scale.
Figure 2.1 presents a chronology of the development of mechanical alloyingtechnology. In passing, it may be mentioned that this process, as developed byBenjamin and coworkers, was referred to as ‘‘milling/mixing,’’ but Ewan C. Mac-Queen, a patent attorney for INCO, coined the term mechanical alloying to describethe process in the first patent application, and this term has remained in the literature.
For successful production of ODS gV-hardened superalloys, synthesis of thepowder alloy with a fine oxide dispersion is only the first step. Commercial use of thealloy requires that this powder be consolidated to full density, proper microstructurebe developed, and the desired properties be obtained. These are not trivial problemsfor these multicomponent alloys with fine microstructural features. Thus, the addi-tional problems to be solved include the following:
Choice of the method to consolidate the powders—cold pressing and sintering,or hot isostatic pressing, or vacuum hot pressing, or hot extrusion,
Whether precompaction of the powders is requiredProper choice of the can material during extrusion to match the plasticdeformation characteristics of the alloy
MD: SURYANARAYANA, JOB: 03320, PAGE: 13
4103-X_Suryanarayana_Ch02_R2_071504
Figure 2.1 Chronology of development of mechanical alloying.
Historical Perspective 13

Whether evacuation of the powder is required before consolidation and, if so,whether the powder should be degassed prior to canning, evacuated withinthe can, or heated during evacuation
Proper selection of hot extrusion conditions—temperature, pressure, extrusionratio, and so forth
Whether any postextrusion working was required to develop optimal high-temperature properties
2.4 POTENTIAL OF MECHANICAL ALLOYING
Mechanical alloying is normally a dry, high-energy ball milling technique that hasbeen employed in the production of a variety of commercially useful and scientificallyinteresting materials. The formation of an amorphous phase by mechanical grindingof a Y-Co intermetallic compound in 1981 [12] and in theNi-Nb system by ball millingof blended elemental powder mixtures in 1983 [13] brought about the recognition ofMA as a potential nonequilibrium processing technique. Beginning from the mid-1980s, several investigations have been carried out to synthesize a variety of stable andmetastable phases, including supersaturated solid solutions, crystalline and quasicrys-talline intermediate phases, and amorphous alloys [14–18]. In addition, it has beenrecognized that powder mixtures can be mechanically activated to induce chemicalreactions, i.e., mechanochemical reactions, at room temperature or at least at muchlower temperatures than normally required to produce pure metals, nanocomposites,and a variety of commercially useful materials [19,20]. Efforts have also been underway since the early 1990s to understand the process fundamentals of MA throughmodeling studies [21]. Because of all these special attributes, this simple but effectiveprocessing technique has been applied to metals, ceramics, polymers, and compositematerials. The attributes of mechanical alloying are listed in Table 2.1, and someimportant milestones in the development of the field are presented in Table 2.2.
2.5 POTENTIAL RESOURCES OF MECHANICAL ALLOYINGLITERATURE
The results of application ofMA to different materials have been published in archivaljournals and also in different conference proceedings. A number of stand-alone con-ferences have been organized on this topic [22–31]. MA has now become an integral
MD: SURYANARAYANA, JOB: 03320, PAGE: 14
4103-X_Suryanarayana_Ch02_R2_071504
Table 2.1 Attributes of Mechanical Alloying
1. Production of fine dispersion of second-phase (usually oxide) particles2. Extension of solid solubility limits3. Refinement of grain sizes down to nanometer range4. Synthesis of novel crystalline and quasi-crystalline phases
5. Development of amorphous (glassy) phases6. Disordering of ordered intermetallics7. Possibility of alloying of difficult to alloy elements/metals
8. Inducement of chemical (displacement) reactions at low temperatures9. Scalable process
Chapter 214

part of the triennial international conferences on rapidly quenched (RQ) metals sinceRQ VI held in Montreal, Canada in 1987 [32–36]. These conferences are nowredesignated as rapidly quenched and metastable materials (RQMM) since RQ-10in Bangalore, India, and their proceedings are contained in the international journalMaterials Science and Engineering A published by Elsevier. In addition, proceedingsof the International Symposia on Metastable, Mechanically Alloyed and Nano-crystalline Materials (ISMANAM) contain many papers on mechanical alloying, andthese are regularly published inMaterials Science Forum (and also as special volume(s)of the Journal of Metastable and Nanocrystalline Materials) by Trans TechPublications [37–45]. A few books have been recently published on MA and also onmechanochemical processing [17,19,46–51]. The literature onMA up to 1994 has beencollected together in an annotated bibliography published in 1995 [15]. The journalInternational Journal of Mechanochemistry and Mechanical Alloying was started in1994 but was short lived. Several reviews have also appeared during the past 10 years
MD: SURYANARAYANA, JOB: 03320, PAGE: 15
4103-X_Suryanarayana_Ch02_R2_071504
Table 2.2 Important Milestones in the Development of Mechanical
Alloying
1966 Development of ODS nickel-based alloys1981 Amorphization of intermetallics1982 Disordering of ordered compounds
1983 Amorphization of blended elemental powder mixtures1987/88 Synthesis of nanocrystalline phases1989 Occurrence of displacement reactions
1989 Synthesis of quasi-crystalline phases
Figure 2.2 Growth of annual number of publications in the field of mechanical alloying.
Historical Perspective 15

with emphasis on a particular topic [14,16,18,52–63]. However, the present book is anattempt to present all aspects of MA in a comprehensive and critical manner in oneplace, as well as to present the potential and limitations of this technique as a non-equilibrium processing tool and its current and future applications.
Figure 2.2 presents the growth of annual publications in the field of MA, andFigure 2.3 shows the cumulative list of publications in the field ofMA. It may be notedthat, as in every field of endeavor, the activity in this area was at a very low level for the
MD: SURYANARAYANA, JOB: 03320, PAGE: 16
4103-X_Suryanarayana_Ch02_R2_071504
Figure 2.3 Growth of cumulative number of publications in the field of mechanical alloying.
Figure 2.4 Comparison of the growth of publications in the fields of mechanical alloyingand rapid solidification processing, two popular nonequilibrium processing techniques.
Chapter 216

first few years and picked up a rapid pace from 1988 onward. Whereas only sevenpapers were published during the calendar year in 1970, the number increased to 61 in1981, 214 in 1988, and 522 in 1993. The number of papers published is increasing everyyear, and this trend is continuing today. It is estimated that more than 7000 papershave been published in this area until now and that the annual rate of publicationsnowadays exceeds 500 papers. It is also of interest to note that the growth of pub-lications in the field of RSP, another nonequilibrium processing technique, introducedin 1960, shows a similar trend. A comparison between the growth of publications inthese two areas (Fig. 2.4) suggests that the take-off point in the rapid growth of pub-lications in the field of MA is offset by about 15 years from that of RSP. Accordingly,the sudden spurt in the rate of publications started in the 1970s for RSP and around1988 for MA.
Majority of the publications in the area of MA are generally found in the pro-ceedings of the specific conferences devoted to this topic, especially the ISMANAMseries. A good number of research and scientific/technical papers may also be found inseveral archival journals. The two journals—Materials Science and Engineering A andJournal of Alloys and Compounds—appear to be publishing a majority of the papersin the field of MA. Some of the other journals where papers on MA are frequentlypublished are Metallurgical and Materials Transactions A, Journal of MaterialsResearch, Journal of Materials Science, Journal of Materials Science Letters, Journalof Materials Synthesis and Processing (discontinued in 2003), Scripta Materialia, andActa Materialia.
REFERENCES
1. Benjamin, J. S. (1976). Sci. Am. 234(5):40–48.2. Benjamin, J. S. (1990). Metal Powder Rep. 45:122–127.3. Benjamin,J. S. (1992). In:Capus,J.M.,German,R.M.,eds.Advances inPowderMetallurgy
and ParticulateMaterials.Vol. 7 (Novel Powder Processing). Princeton,NJ:Metal PowderIndustries Federation, pp. 155–168.
4. Chevenard, P. (1929). Compte. Rendu. 189:846.
5. Betteridge, W. (1959). In: The Nimonic Alloys. London, UK: Edward Arnold, p. 5.6. Ansell, G. S. (1968). In: Oxide Dispersion Strengthening. New York: Gordon and Breach,
p. 61.
7. Wilcox, B. A., Clauer, A. H. (1972). In: Sims, C. T., Hagel, W. C., eds. The Superalloys.New York: Wiley, p. 197.
8. Coolidge, W. D. (1910). Proc. Am. Inst. Elect. Eng. 961.
9. Irmann, R. (1949). Techn. Rundschau. 41(36):19.10. Alexander, G. B., Iler, R. K., West, S. F. US Patent 2,972,529, February 21, 1961.11. Hoyt, S. L. (1930). Trans. AIME 89:9–30.12. Eermakov, A. E., Yurchikov, E. E., Barinov, V. A. (1981). Phys. Met. Metallogr. 52(6):
50–58.13. Koch, C. C., Cavin, O. B., McKamey, C. G., Scarbrough, J. O. (1983). Appl. Phys. Lett.
43:1017–1019.
14. Koch, C. C. (1991). In: Cahn, R. W., ed. Processing of Metals and Alloys, MaterialsScience and Technology—A Comprehensive Treatment. Vol. 15. Weinheim, Germany:VCH, pp. 193–245.
15. Suryanarayana, C. (1995). Bibliography on Mechanical Alloying and Milling. Cambridge,UK: Cambridge International Science Publishing.
MD: SURYANARAYANA, JOB: 03320, PAGE: 17
4103-X_Suryanarayana_Ch02_R2_071504
Historical Perspective 17

16. Suryanarayana, C. (1996). Metals Mater. 2:195–209.17. Lu, L., Lai, M. O. (1998). Mechanical Alloying. Boston, MA: Kluwer.18. Murty, B. S., Ranganathan, S. (1998). Int. Mater. Rev. 43:101–141.
19. Heinicke, G. (1984). Tribochemistry. Berlin: Akademie Verlag.20. McCormick, P. G. (1995). Mater. Trans. Jpn. Inst. Metals 36:161–169.21. Maurice, D. R., Courtney, T. H. (1990). Metall. Trans. A21:289–303.
22. Benjamin, J. S., ed. (1981). Frontiers of High-Temperature Materials. New York: INCOAlloys International.
23. Benjamin, J. S., Benn, R. C., eds. (1983). Frontiers of High-Temperature Materials II. New
York: INCO Alloys International.24. Arzt, E., Schultz, L., eds. (1989). New Materials by Mechanical Alloying Techniques.
Oberursel, Germany: DGM Informationgesellschaft.
25. Clauer, A. H., deBarbadillo, J. J., eds. (1990). Solid State Powder Processing. Warrendale,PA: TMS.
26. Froes, F. H., deBarbadillo, J. J., eds. (1990). Structural Applications of MechanicalAlloying. Materials Park, OH: ASM International.
27. Yavari, A. R., Desre, P. J., eds. (1990). Proceedings of the Conference on MultilayerAmorphisation by Solid-State Reaction and Mechanical Alloying. J Physique Colloq C4Suppl 14, 51:C4-1–C4-310.
28. Shingu, P. H., ed. (1992). Mechanical Alloying. Mater. Sci. For. Aedermannsdorf,Switzerland: Trans. Tech. Publications, vol. 88–90.
29. deBarbadillo, J. J., Froes, F. H., Schwarz, R., eds. (1993). Mechanical Alloying for
Structural Applications. Materials Park, OH: ASM International.30. Balaz, P., Plesingerova, B., Sepelk, V., Stevulova, N., eds. (1994). Proceedings of the
First International Conference on Mechanochemistry. Cambridge, UK: Cambridge
International Science Publishing.31. Soni, P. R., Rajan, T. V., eds. (2002). Trends in Mechanical Alloying. Ensield, NH:
Science Publishers.32. Cochrane, R. W., Srom-Olsen, J. O., eds. (1988). Proceedings Sixth of the International
Conference on Rapidly Quenched Metals. Mater. Sci. Eng. vol. 97–99.33. Frederiksson, H., Savage, S. J., eds. (1991). Proceedings of the Seventh International
Conference on Rapidly Quenched Metals. Mater. Sci. Eng. vol. A133–134.
34. Masumoto, T., Hashimoto, K., eds. (1994). Proceedings of the Eighth InternationalConference on Rapidly Quenched Metals. Mater. Sci. Eng. vol. A179–182.
35. Duhaj, P., Mrafko, P., Svec, P., eds. (1997). Proceedings of the Ninth International
Conference on Rapidly Quenched Metals. Mater. Sci. Eng. vol. A226–228.36. Chattopadhyay, K., Ranganathan, S., eds. (2001). Proceedings of the Tenth Interna-
tional Conference on Rapidly Quenched and Metastable Materials. Mater. Sci. Eng.vol. A304–306.
37. Yavari, A. R., ed. (1995). Proceedings of the International Symposium on Metastable,Mechanically Alloyed and Nanocrystalline Materials (ISMANAM – 94). Mater. Sci.For. Zurich: Trans Tech Publications, vol. 179–181.
38. Schulz, R., ed. (1996). Proceedings of the International Symposium on Metastable,Mechanically Alloyed and Nanocrystalline Materials (ISMANAM – 95). Mater. Sci.For. Zurich: Trans Tech Publications, vol. 225–227.
39. Fiorani, D., Magini, M., eds. Proceedings of the International Symposium onMetastable,Mechanically Alloyed and Nanocrystalline Materials (ISMANAM – 96).Mater. Sci. For.Zurich: Trans Tech Publications, vol. 235–238.
40. Baro, M. D., Surinach, S., eds. (1998). Proceedings of the International Symposium onMetastable, Mechanically Alloyed and Nanocrystalline Materials (ISMANAM – 97).Mater. Sci. For. Zurich: Trans Tech Publications, vol. 269–272.
41. Calka, A., Wexler, D., eds. (1999). Proceedings of the International Symposium on
MD: SURYANARAYANA, JOB: 03320, PAGE: 18
4103-X_Suryanarayana_Ch02_R2_071504
Chapter 218

Metastable, Mechanically Alloyed and Nanocrystalline Materials (ISMANAM – 98).Mater. Sci. For. Zurich: Trans Tech Publications, vol. 312–314 (and also in J. MetastableNanocryst. Mater. 2–6, 1999).
42. Eckert, J., Schlorb, H., Schultz, L., eds. (2000). Proceedings of the InternationalSymposium on Metastable, Mechanically Alloyed and Nanocrystalline Materials(ISMANAM – 99). Mater. Sci. For. Zurich: Trans Tech Publications, vol. 343–346.
(and also in J. Metastable Nanocryst. Mater. 8, 2000).43. Schumacher, P., Warren, P., Cantor, B., eds. (2001). Proceedings of the International
Symposium on Metastable, Mechanically Alloyed and Nanocrystalline Materials
(ISMANAM – 2000). Mater. Sci. For. Zurich: Trans Tech Publications, vol. 360–362.(and also in J. Metastable Nanocryst. Mater. 10, 2001).
44. Ma, E., Atzmon, M., Koch, C. C., eds. (2002). Proceedings of the International
Symposium on Metastable, Mechanically Alloyed and Nanocrystalline Materials(ISMANAM – 01). Mater. Sci. Forum. Zurich: Trans Tech Publications, vol. 386–388(and also in J. Metastable Nanocryst. Mater. 13, 2002).
45. Ahn, J. -H., Hahn, Y. -D., eds. (2003). Proceedings of the International Symposium on
Metastable, Mechanically Alloyed and Nanocrystalline Materials (ISMANAM–02). J.Metastable Nanocryst. Mater, vol. 15–16.
46. Avvakumov, E. G. (1986). Mechanical Methods of the Activation of Chemical Processes.
Novosibirsk, Russia: Nauka (in Russian).47. Avvakumov, E. G., Senna, M., Kosova, N. V. (1998). Soft Mechanical Synthesis: A Basis
for New Chemical Technologies. Boston, MA: Kluwer.
48. Soni, P. R. (2000).Mechanical Alloying: Fundamentals and Applications. Cambridge, UK:Cambridge International Science Publishing.
49. Besterci, M. (1998). Dispersion-Strengthened Aluminum Prepared by Mechanical Alloying.
Cambridge, UK: Cambridge International Science Publishing.50. Gutman, E. M. (1998). Mechanochemistry of Materials. Cambridge, UK: Cambridge
International Science Publishing. (See also the Special Issues of J. Mater. Synth. Proc.2000; 8(Issues 3–6)).
51. Sherif El-Eskanadarany, M. (2001). Mechanical Alloying for Fabrication of AdvancedEngineering Materials. New York: William Andrew.
52. Gilman, P. S., Benjamin, J. S. (1983). Annu. Rev. Mater. Sci. 13:279–300.
53. Singer, R. F., Gessinger, G. H. (1984). In: Gessinger, G. H., ed. Powder Metallurgy ofSuperalloys. London: Butterworths, pp. 213–292.
54. Sundaresan, R., Froes, F. H. (1987). J. Metals 39(8):22–27.
55. Weeber, A. W., Bakker, H. (1988). Physica. B153:93–135.56. Koch, C. C. (1989). Annu. Rev. Mater. Sci. 19:121–143.57. Schaffer, G. B., McCormick, P. G. (1992). Mater. For. 16:91–97.58. Bakker, H., Zhou, G. F., Yang, H. (1995). Prog. Mater. Sci. 39:159–241.
59. Shingu, P. H., ed. (1995). Special Issue on Mechanical Alloying. Mater. Trans. Jpn. Inst.Metals, 36:83–388.
60. Schwarz, R. B., ed. (1996). Viewpoint set on mechanical alloying. Scripta Mater. 34:1–73.
61. Ivanov, E., Suryanarayana, C. (2000). J. Mater. Synth. Proc. 8:235–244.62. Suryanarayana, C. (2001). Prog. Mater. Sci. 46:1–184.63. Takacs, L. (2002). Prog. Mater. Sci. 47:355–414.
MD: SURYANARAYANA, JOB: 03320, PAGE: 19
4103-X_Suryanarayana_Ch02_R2_071504
Historical Perspective 19

4103-X_Suryanarayana_Ch02_R2_071504
MD: SURYANARAYANA, JOB: 03320, PAGE: 20
3
Nomenclature
3.1 INTRODUCTION
The synthesis and development of novel alloy phases by mechanical means [throughmechanical alloying (MA) methods] has been in existence for more than four decades.During this period, several new versions of the original process of mechanical alloyingdeveloped by Benjamin [1,2] have come up. Consequently, the different processes havebeen designated differently, and it would be useful to have a clear knowledge andunderstanding of the different terms and acronyms used in the literature. This will helpin clearly identifying the actual process used in synthesizing the material.
3.2 MECHANICAL ALLOYING
Mechanical alloying is the generic term for processing ofmetal powders in high-energyball mills. However, depending on the state of the starting powder mix and theprocessing steps involved, different terms have been used in the powder metallurgyliterature. Two different terms are most commonly used to describe the processing ofpowder particles in high-energy ball mills. Mechanical alloying describes the processwhen mixtures of powders (of different metals or alloys/compounds) are milledtogether. Thus, if powders of pure metals A and B are milled together to produce asolid solution (either equilibrium or supersaturated), intermetallic, or amorphousphase, the process is referred to as MA. Material transfer is involved in this process toobtain a homogeneous alloy.
4103-X_Suryanarayana_Ch03_R2_071504
MD: SURYANARAYANA, JOB: 03320, PAGE: 21
21

3.3 MECHANICAL MILLING/DISORDERING
When powders of uniform (often stoichiometric) composition, such as pure metals,intermetallics, or prealloyed powders, are milled in a high-energy ball mill, andmaterial transfer is not required for homogenization, the process has been termedmechanical milling (MM). It may be noted that when amixture of two intermetallics isprocessed, and then alloying occurs, this will be referred to as MA because materialtransfer is involved. However, if a pure metal or an intermetallic is processed only toreduce particle (or grain) size and increase the surface area, then this will be referred toas MM because material transfer is not involved. The destruction of long-range orderin intermetallics to produce a disordered intermetallic (solid solution) or an amor-phous phase has been referred to as mechanical disordering (MD) [3]. The advantageof MM/MD over MA is that since the powders are already alloyed and only areduction in particle size and/or other transformations have to be induced mechan-ically, the time required for processing is short. For example, MM requires half thetime required forMA to achieve the same effect [4]. In fact, the time required to achievethe same constitution could be reduced by a factor of 10 when prealloyed Al75Ti25powder was used rather than the blended elemental Al-Ti powder mix [5]. Whereas asolid solution formed in about 5 h when one started with prealloyed powders, it tookmore than 50 h for the same phase to be formed onMA of blended elemental powders[6]. The milling conditions were identical in both cases. An additional advantage ofMM over MA of powders is that MM reduces oxidation of the constituent powders,related to the shortened time of processing [4]. Some investigators have referred toMM as mechanical grinding (MG) [7]. Since ‘‘grinding’’ is normally thought of as anabrasive machining process that involves mainly shear forces and chip formation, theterm ‘‘milling’’ is preferred to include the more complex triaxial, perhaps partlyhydrostatic, stress states that can occur during ball milling of powders [8]. It should berealized thatMA is a generic term, and some investigators use this term to include bothMA and MM/MD/MG. However, for the sake of clarity, it is better to distinguishamong these terms by using MA or MM depending on whether material transfer isinvolved or not during the processing.
Some other terms are also used in the literature on MA. These include reaction(or reactive ball) milling, cryomilling, rod milling, mechanically activated annealing(M2A), double mechanical alloying (dMA), and mechanically activated self-propa-gating high-temperature synthesis (MASHS).
3.4 REACTION MILLING
Reaction milling (RM), pioneered by Jangg et al. [9], is the MA process accompaniedby a solid-state reaction. In this process the powder is milled without the aid of anyprocess control agent (see Chapter 5 for its function during milling) to produce finedispersions of oxides and carbides in aluminum [10]. The dispersion of carbides isachieved by adding lamp black or graphite during milling of aluminum. Adjusting theoxygen content via close control of the milling atmosphere (oxygen, argon, nitrogen,air, etc.) results in production of the oxides. Thus, the final product of milling containsa dispersion of Al4C3 and Al2O3 in an aluminummatrix, and these alloys are given thetrade name DISPAL. Milling of metal powders in the presence of reactive solids/liquids/gases (enabling a chemical reaction to take place) is now regularly done to
MD: SURYANARAYANA, JOB: 03320, PAGE: 22
4103-X_Suryanarayana_Ch03_R2_071504
Chapter 322

synthesize metal oxides, nitrides, and carbides [11,12]. Thus, milling of titanium in anitrogen atmosphere has resulted in production of titanium nitride [13,14]. Severalother compounds have also been produced in a similar way. Milling of tungsten withcarbon (graphite) has resulted in production of tungsten carbide [15]. Milling of metalpowders with boron has resulted in production of borides, e.g., TiB2 [16]. These oxides,carbides, borides, or nitrides could then be incorporated into the alloy matrixproviding additional strength and high-temperature stability.
3.5 CRYOMILLING
Another variation of milling that is being increasingly used nowadays is cryomilling[17] whereby the milling operation is carried out at cryogenic (very low) temperaturesand/or milling of materials is done in a cryogenic medium such as liquid nitrogen. Inthis process, the vessel is cooled by a continuous flow of liquid nitrogen through the‘‘water cooling’’ jacket of the mill. In addition, or alternatively, liquid nitrogen couldbe introduced into the milling chamber itself throughout the run. After completion ofthe milling run, the powder is removed from the mill in the form of a slurry andtransferred to a glove box containing dry argon.When the liquid nitrogen is allowed toevaporate, a residue of the milled powder is left behind.
The original intention of cryomilling was to alloy Al2O3 into the aluminummatrix. Mechanical property measurements of hot-pressed and swaged materialsindicated that the strength of the composite was independent of the Al2O3 content.However, the strengthwas related to a fine dispersion of aluminumoxynitride particles.These particles were found to form in situ during themilling process by coadsorption ofnitrogen and oxygen onto clean aluminum surfaces. During subsequent annealing, themechanically trapped nitrogen and oxygen interacted with aluminum to form Al(O,N)particles, which are typically 2–10 nm in diameter. These particles have been reported tobe very effective in inhibiting grain growth in the aluminummatrix, with the result thatcryomilled alloys have a typical grain size of 50–300 nm, and the grains continue to bestable even on prolonged annealing at high temperatures.
It was noted that the powder quality was poor and the yield low whencryomilling was conducted in a standard Szegvari-type attritor. In addition, formationof dead zones in the tank, excessive powder loss due to liquid nitrogen evaporation andflow control, excessive seal wear, jamming of the stir arms, and freezing of theapparatus were some of the problems encountered. Aikin and Juhas [18] modifiedthe attritor to minimize the above problems and reduce the oxygen pickup. Thesemodifications improved the properties of the cryomilled product, including thehomogeneity of the powder. They showed that by a proper choice of the processparameters it is possible tomakematerials with the desiredAlN content in the powder.
3.6 ROD MILLING
Rod milling is a technique that was developed in Japan [19] essentially to reducepowder contamination during the processing stage. In this process, the grindingmedium is in the form of rods rather than spherical balls. In a conventional ball mill,impact forces scratch the surfaces of the milling media and the debris from the millingmedia contaminates the powder being milled. On the other hand, if shear forcespredominate, they are more effective in kneading the powder mixtures and the
MD: SURYANARAYANA, JOB: 03320, PAGE: 23
4103-X_Suryanarayana_Ch03_R2_071504
Nomenclature 23

MD: SURYANARAYANA, JOB: 03320, PAGE: 24
4103-X_Suryanarayana_Ch03_R2_071504
resulting powder is much less contaminated. To achieve this minimized contamina-tion, the balls were replaced by long rods in the rodmill because long rods rotating in acylindrical vial predominantly exert shear forces on the material. Yet anotheradvantage reported for the rod-milled powders is that the level of contaminationfrom the milling medium is much less than that obtained for the powder milled in aconventional ball mill with spherical balls. For example, it was reported that the ironcontamination for the Al30Ta70 powder mechanically alloyed for 400 h was 16 at% inthe ball mill, compared to only about 5 at% in the rod mill [19].
It has also been reported [3] that the degree of agglomeration of the powderparticles is less in rod milling, resulting in smaller average diameters. Furthermore,subsequent disintegration into fine powders during later stages of milling proceeds at amuch faster rate leading to the formation of fine powders with a narrow sizedistribution.
3.7 MECHANICALLY ACTIVATED ANNEALING
Mechanically activated annealing (M2A) is a process that combines short MAduration with a low-temperature isothermal annealing. The combination of thesetwo steps has been found to be effective in producing different refractory materialssuch as silicides based on niobium, molybdenum, etc. [20,21]. For example, MA ofmolybdenum and silicon powders for 1–2 h in a planetary ball mill followed by a 2- to24-h annealing at 800jCproduced theMoSi2 phase [21]. A consequence of thismethodis that optimization of the M2A process could lead to a situation in which isothermalannealing can be carried out inside the milling container to avoid air contamination ofthe end product.
3.8 DOUBLE MECHANICAL ALLOYING
Double mechanical alloying (dMA) involves two stages of milling. In the first stage,the constituent elemental powder sizes are refined and uniformly distributed as anintimate mixture. This mixture is then subjected to a heat treatment at high temper-atures during which intermetallic phases are formed. The size of the intermetallicsformed ranges from less than 1 Am to a few micrometers. During the second stage, theheat-treated powder is milled again to refine the powder size of the intermetallic phasesand reduce the grain size of the matrix. After degassing, the powders are consolidatedto a bulk shape [22,23]. Figure 3.1 shows the flow sheet of the dMA process and thetype of microstructures developed in an Al-5 wt%Fe-4 wt%Mn powder mixture [22].This appears to be a useful process to produce fine intermetallics in alloy systems thatcannot be directly produced by milling.
3.9 MECHANICALLY ACTIVATED SELF-PROPAGATINGHIGH-TEMPERATURE SYNTHESIS
Yet another term recently coined is mechanically activated self-propagating high-temperature synthesis (MASHS), which is based on a combination of MA and self-propagating high-temperature synthesis (SHS) processes. SHS is a well-knownmethod to produce advanced materials as a practical alternative to the conventionalmethods. SHS offers advantages with respect to process economics and processsimplicity. In the typical SHS reaction, the mixed reactant powders are pressed into
Chapter 324

MD: SURYANARAYANA, JOB: 03320, PAGE: 25
4103-X_Suryanarayana_Ch03_R2_071504
a pellet of certain green density and subsequently ignited to the ignition temperature.Due to the highly exothermic nature of the reaction, the heat generated allows thereaction to become self-sustained [24]. In the MASHS process the powder mixture ismechanically alloyed to produce a nanocrystalline structure and then the SHS reactionis initiated by pressing the powder into a pellet and igniting it in a furnace. Theprevious MA step decreases the ignition temperature by as much as 100jC. Severaliron aluminide and niobium aluminide intermetallics were synthesized in this way[25,26]. It is possible that an SHS reaction can sometimes take place during the millingoperation, and this aspect is discussed in Chapter 14.
3.10 OXIDATION–ATTRITION MILLING–REDUCTION
Oxidation–attrition milling–reduction (OMR) is another term that has been usedrecently in the literature [27]. In this method, the commercially available powders (ofmicrometer size) are oxidized at appropriate temperatures to produce brittle oxide
Figure 3.1 Process flow sheet and the microstructures developed during double mechanicalalloying (dMA) of an Al-5 wt%Fe-4 wt% Mn powder mixture.
Nomenclature 25

powders. These powders are subjected to attrition milling to obtain nanoscale oxidepowders, which are subsequently reduced to metallic powders with nanometer grainsizes. Thismethod should be particularly useful to produce nanocrystalline powders ofductile metals and materials. It is necessary to ensure that the oxides of such materialsare brittle and that they can also be easily reduced to pure metals.
3.11 MECHANOCHEMICAL PROCESSING
Mechanochemical processing (MCP) or mechanochemical synthesis is the termapplied to powder processing in which chemical reactions and phase transformationstake place during milling due to the application of mechanical energy [11,28–30]. Animportant feature of the process is that plastic deformation and chemical processesoccur almost simultaneously. This process has a long history with the first publicationdating back to 1892 [31]. The mechanochemical reactions could result in the synthesisof novel materials, reduction/oxidation processes, exchange reactions, decompositionof compounds, and phase transformations in both organic and inorganic solids. Thematerials produced in this way have already found applications in areas such ashydrogen storagematerials, gas absorbers, fertilizers, and catalysts, and this techniquehas become a large effort in the general field ofmechanical alloying andmilling. In fact,a series of conferences are being regularly held on this aspect, and the fourth in thisseries was held on September 7–11, 2003 in Braunschweig, Germany.
A recent development in this broad area of MCP of materials is the synthesis ofinorganic compounds based on the use of solid acids, bases, hydrated compounds,crystalline hydrates, and base and acid salts as the raw materials [32]. This process hasbeen termed soft mechanochemical synthesis [32,33]. In contrast, the process will bereferred to as hard mechanochemical synthesis if anhydrous oxides are used as thestarting materials. The soft mechanochemical synthesis technique has been used tosynthesize a variety of nanocrystalline oxides such as ZrTiO4, Al2TiO5, and ZrSiO4[34]. The size of the particles obtained by this method is in the range of a fewnanometers and is close to that obtained by the sol-gel method. For example, theparticle size of ZrTiO4 obtained by soft mechanochemical synthesis is 12 nm, whilethat obtained by the sol-gel process is 14 nm [34].
3.12 OTHER METHODS
Several new methods have been developed in recent years to produce materials in anonequilibrium condition. The majority of these methods produce effects very similarto those obtained in mechanically alloyed powders. The major difference is that whileMA produces the material in the powder form, most of these new methods deal withbulk materials. Yet another difference is that these new methods focus on producingnanocrystalline and amorphous materials in view of their novelty and potentialapplications. A common theme among all of these methods is that heavy plasticdeformation is involved except in the case of multilayer amorphization. Even so, thismethod is included here because it is so similar to MA in producing amorphous alloysand other nonequilibrium phases. Rapid solidification processing (RSP) is anothermethod for producing nonequilibrium alloys, and comparisons of the results obtainedby RSP and MA are given in subsequent chapters. Some of these new methods (otherthan RSP) will be briefly described below.
MD: SURYANARAYANA, JOB: 03320, PAGE: 26
4103-X_Suryanarayana_Ch03_R2_071504
Chapter 326

3.12.1 Repeated Cold Rolling
Repeated cold rolling produces effects very similar to those of MA. As will be shownlater, MA results in repeated rolling and folding over of the individual ductile metalpowder particles. Thus, if we consider two metals A and B, and if a stack of these twometals (bimetal layer) is assumed to have a thickness of do, then rolling of this stack inone pass reduces the thickness to do� (1/a), where a is the reciprocal of the reduction inthickness in one pass. Subsequent rolling passes reduce the thickness further. After npasses, the thickness of the bimetal layer is reduced to do � (1/a)n. This is shownschematically in Figure 3.2 [35]. The actual process involves stuffing a mixture of theelemental powders into a stainless steel tube of 20 mm outside diameter and 18 mminside diameter. The tube containing the powder is then pressed to a thickness of 8 mmby a hydraulic press and then cold rolled to a thickness of 0.5 mm. The thickness of thesample after removal of the stainless sheath is about 0.2 mm. The rolled sample ispacked again into the stainless steel tube of the same size, pressed, and rolled in asimilar way. The process is repeated up to 30 times. Figure 3.3 shows a schematic of theprocess. It was shown that supersaturated solid solutions could be obtained in Ag-70at% Cu samples both by MA and by repeated cold rolling methods, suggesting thatboth methods yield similar types of metastable phases [36].
Since plenty of disorder (chaos) occurs as a result of the repetition of a simpledeterministic process, theMAprocess can also be described in terms of the philosophygoverning the occurrence of chaos in the area-preserving mapping. The occurrence ofrefinedmicrostructures duringMA can then be easily explained using this approach. Aslight deviation from the exact linear mapping was found to produce apparently morerealistic MA structures [37].
Instead of stuffing the powders into a stainless steel tube, one could also take thinfoils of the constituent metals, stack them alternately, and press them repeatedly.Alternatively, one could also take powdermixtures, press them repeatedly, break theminto smaller pieces, and repeat the process. Metastable structures similar to thoseobtained by conventional MA have been achieved in these cases also [38]. Figure 3.4shows schematic views of the repeated pressing of layered thin foils and of powders.
MD: SURYANARAYANA, JOB: 03320, PAGE: 27
4103-X_Suryanarayana_Ch03_R2_071504
Figure 3.2 Thickness reduction by repeated rolling and folding operations. When thereduction in thickness during one rolling pass is 1/a and the number of passes is n, then the
total reduction in thickness is do � (1/a)n, where do is the original thickness.
Nomenclature 27

3.12.2 Multilayer Amorphization
Amorphous phases could be synthesized by solid-state reaction between pure poly-crystalline metal thin films [39]. This phenomenon is again somewhat similar to therepeated cold rolling process described above (where solid solution formation wasreported) and also to that of MA, except that the departure from equilibrium is quiteextensive. Two conditions must be satisfied for the formation of the amorphous phasein thismethod. One is that one of the speciesmust be a fast diffuser in the other, and thesecond is that the alloys must exhibit a large negative heat of mixing providing the
MD: SURYANARAYANA, JOB: 03320, PAGE: 28
4103-X_Suryanarayana_Ch03_R2_071504
Figure 3.3 Schematic diagram showing the experimental procedure for repeated coldrolling.
Figure 3.4 Schematic views of the repeated pressing procedure. (a) Repeated pressing of
layered thin foils and (b) repeated pressing of powders.
Chapter 328

required driving force for the formation of the amorphous phase. The process consistsof putting alternating layers of the constituent metals in a stack (with close contactwith each other) and annealing them at a relatively low temperature. The aboveauthors had demonstrated that Au1�xLax alloys in the composition range of 0.3V xV0.5 could be amorphized by solid-state interdiffusion of pure crystalline Au and Lathin films by annealing them at temperatures of 50–80jC. Similar results have beenreported later in several other alloy systems [40].
3.12.3 Severe Plastic Deformation
It has been well known that heavy deformations, e.g., by cold rolling or drawing ormultiple forging, result in significant refinement of microstructures at low temper-atures. However, the microstructures formed are usually substructures of a cellulartype having low-angle grain boundaries. However, the grain boundaries in nano-crystalline materials are of the high-angle type, and significant improvement in theproperties of materials can be achieved only in these cases. The majority ofmethods available for the synthesis of nanostructures produce them in the formof powder, often requiring consolidation of the powder to handle and characterizethe properties.
Severe plastic deformation (SPD) has been developed to produce ultrafine-grained materials in the submicrometer range, with a typical minimal grain size ofabout 200–300 nm. In these methods, very large deformations (with true strainsz10)are provided at relatively low temperatures, mostly by two processes: torsion strainingunder high pressure and equal channel angular pressing. Figure 3.5 shows a schematicof these two types of processes.Many other variations of these two basic methods havebeen subsequently developed, but equal channel angular pressing (ECAP) hasattracted the most attention.
MD: SURYANARAYANA, JOB: 03320, PAGE: 29
4103-X_Suryanarayana_Ch03_R2_071504
Figure 3.5 Principles of severe plastic deformation by (a) torsion under high pressure and
(b) equal channel angular pressing.
Nomenclature 29

The method of SPD has some advantages over other methods in synthesizingultrafine-grained materials. First, ultrafine-grained materials with high-angle grainboundaries could be synthesized. Second, the samples are dense, and there is noporosity in them since they have not been produced by consolidation of powders.Third, the grain size is fairly uniform throughout the structure. Last, the techniquemay be directly applied to commercial cast metals. However, the limitations of thistechnique are that the minimal grain size is not very small and that amorphous phasesor other metastable phases have not been synthesized. Nevertheless, these methods arevery useful for producing bulk ultrafine-grained materials.
The principle of ECAPwas initially developed by Segal and coworkers [41] in theformer Soviet Union. The process is based on the observation that metal working bysimple shear provides close to an ideal method for the formation ofmicrostructure andtexture [42]. Figure 3.6a schematically illustrates the principle of ECAP. A solid diecontains a channel that is bent into an L-shaped configuration. A sample that just fitsinto the channel is pressed through the die using a plunger. Thus the sample undergoesshear deformation but comes out without a change in the cross-sectional dimensions,suggesting that repetitive pressings can be conducted to obtain very high total strains.The strain introduced into the sample is primarily dependent on the angle subtendedby the two parts of the channel.
Four different processing routes have been commonly used during ECAP. Theseare illustrated in Figure 3.6b. In route A, the sample is pressed repetitively without anyrotation. In route B, the sample is rotated by 90j between each pass. Depending on thedirection in which the rotations are made, one can visualize two alternatives for this. Ifthe rotation is made in alternate directions through 0j-90j-0j-90j, this processingroute is referred to as BA. On the other hand, if the rotation is made in the samedirection through 0j-90j-180j-270j, then this is known as BC process. In route C, thesample is rotated by 180j between each pass.
The reader is advised to refer to a recent review [43] for the details aboutprocessing, properties, and applications of materials obtained by SPD. The keynotereviews presented at the Second International Conference on ‘‘Nanomaterials bySevere Plastic Deformation: Fundamentals—Processing—Applications’’ have beenpublished in theMay 2003 issue ofAdvanced Engineering Materials [44]. It is estimatedthat about 200 research papers have been published annually in the field of SPDduringthe past couple of years.
3.12.4 Accumulative Roll Bonding
The methods of SPD described above have two drawbacks. First, productionmachines with large load capacities and expensive dies is required. Second, theproductivity is relatively low. To overcome these two limitations, Saito et al. [45,46]developed the accumulative roll bonding process. In this process, shown schematicallyin Figure 3.7, stacking ofmaterials and conventional roll bonding are repeated. First, astrip is neatly placed on the top of another strip. The surfaces of the strips are treated, ifnecessary, to enhance the bond strength. The two layers of the material are joinedtogether by rolling as in a conventional roll bonding process. Then the length of therolled material is sectioned into two halves. The sectioned strips are again surfacetreated, stacked to the initial dimensions, and roll bonded. The whole process isrepeated several times.
MD: SURYANARAYANA, JOB: 03320, PAGE: 30
4103-X_Suryanarayana_Ch03_R2_071504
Chapter 330

The accumulative roll bonding process is conducted at elevated temperatures,but below the recrystallization temperature, since recrystallization cancels out theaccumulated strain. Very low temperatures would result in insufficient ductility andbond strength. It has been shown that if the homologous temperature of the rollbonding is less than 0.5, sound joining can be achieved for reductions greater than50%. Very-high-strength materials were obtained by this process in 1100 aluminum,5083 Al-Mg alloys, and interstitial-free steels. The accumulative roll-bondedmaterialsalso showed large elongations of up to 220% and large strain–rate sensitivity (m)values of more than 0.3 even at 200jC for the 5083 Al-Mg alloy, suggesting that low-temperature superplasticity could be achieved due to the formation of ultrafine grains.Tsuji et al. [47] recently presented a brief review of the developments in this process.
MD: SURYANARAYANA, JOB: 03320, PAGE: 31
4103-X_Suryanarayana_Ch03_R2_071504
Figure 3.6 (a) Principle of equal channel angular pressing (ECAP) method. (b) The four
different processing routes for ECAP.
Nomenclature 31
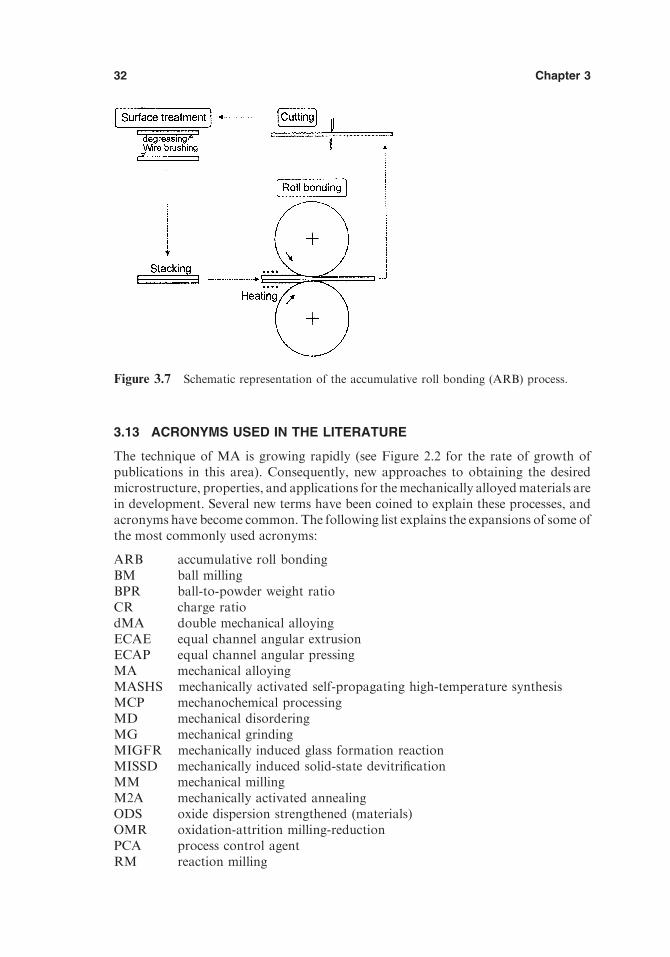
3.13 ACRONYMS USED IN THE LITERATURE
The technique of MA is growing rapidly (see Figure 2.2 for the rate of growth ofpublications in this area). Consequently, new approaches to obtaining the desiredmicrostructure, properties, and applications for themechanically alloyedmaterials arein development. Several new terms have been coined to explain these processes, andacronyms have become common. The following list explains the expansions of some ofthe most commonly used acronyms:
ARB accumulative roll bondingBM ball millingBPR ball-to-powder weight ratioCR charge ratiodMA double mechanical alloyingECAE equal channel angular extrusionECAP equal channel angular pressingMA mechanical alloyingMASHS mechanically activated self-propagating high-temperature synthesisMCP mechanochemical processingMD mechanical disorderingMG mechanical grindingMIGFR mechanically induced glass formation reactionMISSD mechanically induced solid-state devitrificationMM mechanical millingM2A mechanically activated annealingODS oxide dispersion strengthened (materials)OMR oxidation-attrition milling-reductionPCA process control agentRM reaction milling
MD: SURYANARAYANA, JOB: 03320, PAGE: 32
4103-X_Suryanarayana_Ch03_R2_071504
Figure 3.7 Schematic representation of the accumulative roll bonding (ARB) process.
Chapter 332

SPD severe plastic deformationSSAR solid-state amorphization reactionTEGFR thermally enhanced glass formation reaction
REFERENCES
1. Benjamin, J. S. (1976). Sci. Am. 234(5):40–48.2. Benjamin, J. S. (1970). Metall. Trans. 1:2943–2951.3. Sherif El-Eskandarany, M., Aoki, K., Suzuki, K. (1991). J. Alloys Compounds 177:229–
244.
4. Weeber, A. W., Bakker, H., deBoer, F. R. (1986). Europhys. Lett. 2:445–448.5. Klassen, T., Oehring, M., Bormann, R. (1997). Acta Mater. 45:3935–3948.6. Klassen, T., Oehring, M., Bormann, R. (1994). J. Mater. Res. 9:47–52.
7. Ermakov, A. E., Yurchikov, E. E., Barinov, V. A. (1981). Phys. Met. Metallogr.52(6):50–58.
8. Koch, C. C. (1991). In: Cahn, R. W., ed. Processing of Metals and Alloys, Materials
Science and Technology—A Comprehensive Treatment. Vol. 15. Weinheim, Germany:VCH, pp. 193–245.
9. Jangg, G., Kuttner, F., Korb, G. (1975). Aluminium 51:641–645.
10. Jangg, G. (1989). In: Arzt, E., Schultz, L., eds. New Materials by Mechanical AlloyingTechniques. Oberursel, Germany: DGM Informationgesellschaft, pp. 39–52.
11. Avvakumov, E. G. (1986). Mechanical Methods of Activation of Chemical Processes.Novosibirsk, Russia: Nauka.
12. Calka, A., Nikolov, J. J., Williams, J. S. (1996). Mater. Sci. For. 225–227:527–532.13. Calka, A. (1991). Appl. Phys. Lett. 59:1568–1569.14. Suryanarayana, C. (1995). Intermetallics 3:153–160.
15. Radlinski, A. P., Calka, A. (1991). Mater. Sci. Eng. A134:1376–1379.16. Calka, A., Radlinski, A. P. (1990). J. Less Common Metals 161:L23–L26.17. Luton, M. J., Jayanth, C. S., Disko, M. M., Matras, M. M., Vallone, J. (1989). In:
McCandlsih, L. E., Polk, D. E., Siegel, R. W., Kear, B. H., eds.Multicomponent UltrafineMicrostructures. Vol. 132. Pittsburgh, PA: Mater Res Soc, pp. 79–86.
18. Aikin, B. J. M., Juhas, J. J. (1997). In: Froes, F. H., Hebeisen, J. C., eds., AdvancedParticulate Materials and Processes–1997. Princeton, NJ: Metal Powder Industries
Federation, pp. 287–294.19. El-Eskandarany, M. S., Aoki, K., Suzuki, K. (1990). J. Less Common Metals 167:113–
118.
20. Gaffet, E., Malhouroux, N., Abdellaoui, M. (1993). J. Alloys Compounds 194:339–360.21. Gaffet, E., Malhouroux-Gaffet, N. (1994). J. Alloys Compounds 205:27–34.22. Froyen, L., Delaey, L., Niu, X. -P., LeBrun, P., Peytour, C. (1995). JOM 47(3):16–19.
23. LeBrun, P., Froyen, L., Delaey, L. (1992). Mater. Sci. Eng. A157:79–88.24. Moore, J. J., Feng, H. J. (1995). Prog. Mater. Sci. 39:243–316.25. Charlot, F., Gaffet, E., Zeghmati, B., Bernanrd, F., Niepce, J. C. (1999).Mater. Sci. Eng.
A262:279–288.26. Gauthier, V., Josse, C., Bernard, F., Gaffet, E., Larpin, J. P. (1999). Mater. Sci. Eng.
A265:117–128.27. Gutmanas, E. Y., Trudler, A., Gotman, I. (2002). Mater. Sci. For. 386–388:329–334.
28. McCormick, P. G. (1995). Mater. Trans. Jpn. Inst. Metals 36:161–169.29. Gutman, E. M. (1998). Mechanochemistry of Materials. Cambridge, UK: Cambridge
International Science Publishing.
30. Takacs, L. (2002). Prog. Mater. Sci. 47:355–414.31. Carey-Lea, M. (1892). Phil. Mag. 34:465.
MD: SURYANARAYANA, JOB: 03320, PAGE: 33
4103-X_Suryanarayana_Ch03_R2_071504
Nomenclature 33

32. Avvakumov, E. G., Senna, M., Kosova, N. V. (2001). Soft Mechanochemical Synthesis:A Basis for New Chemical Technologies. Boston, MA: Kluwer.
33. Senna, M. (1993). Solid State Ionics 63–65, 3.
34. Avvakumov, E. G., Karakchiev, L. G., Gusev, A. A., Vinokurova, O. B. (2002). Mater.Sci. For. 386–388:245–250.
35. Shingu, P. H., Ishihara, K. N., Kuyama, J. (1991). Proc 34th Japan Congress on
Materials Research. Soc Mater Sci, Japan, Kyoto, pp. 19–28.36. Shingu, P. H., Ishihara, K. N., Uenishi, K., Kuyama, J., Huang, B., Nasu, S. (1990). In:
Clauer, A. H., deBarbadillo, J. J., eds. Solid State Powder Processing. Warrendale, PA:
TMS, pp. 21–34.37. Shingu, P. H., Ishihara, K. N., Otsuki, A. (1995). Mater. Sci. For. 179–181:5–10.38. Shingu, P. H., Ishihara, K. N., Kondo, A. (1993). In: deBarbadillo, J. J., et al., eds.
Mechanical Alloying for Structural Applications. Materials Park, OH: ASM Interna-tional, pp. 41–44.
39. Schwarz, R. B., Johnson, W. L. (1983). Phys. Rev. Lett. 51:415–418.40. Yavari, A. R., Desre, P. eds. (1990) Multilayer Amorphisation by Solid-State Reaction
and Mechanical Alloying. Les Ulis Cedex, France: Les editions de Physique. (Colloquede Physique, 51, Colloque C4, Supplement # 14, 1990).
41. Segal, V. M., Reznikov, V. I., Drobyshevskiy, A. E., Kopylov, V. I. (1981). Russian
Metallurgy (Metally) 1:99–105.42. Segal, V. M. (1995). Mater. Sci. Eng. A197:157–164.43. Valiev, R. Z., Islamgaliev, R. K., Alexandrov, I. V. (2000). Prog. Mater. Sci. 45:103–189.
44. Zehetbauer, M. J., ed. (2003). Adv. Eng. Mater. 5:277–378.45. Saito, Y., Tsuji, N., Utsunomiya, H., Sakai, T., Hong, R. G. (1998). Scripta Mater. 47:
1221–1227, 1998.
46. Saito, Y., Utsunomiya, H., Tsuji, N., Sakai, T. (1999). Acta Mater. 47:579–583.47. Tsuji, N., Saito, Y., Lee, S. -H., Minamino, Y. (2003). Adv. Eng. Mater. 5:338–344.
MD: SURYANARAYANA, JOB: 03320, PAGE: 34
4103-X_Suryanarayana_Ch03_R2_071504
Chapter 334

4
Equipment for Mechanical Alloying
4.1 INTRODUCTION
The process of mechanical alloying (MA) starts with mixing of the powders in thedesired proportion and loading of the powdermix into themill along with the grindingmedium (generally steel balls). Sometimes a process control agent (PCA) is added toprevent orminimize excessive cold welding of powder particles among themselves and/or to the milling container and the grinding medium. This mix (with or without thePCA) is then milled for the required length of time until a steady state is reached. Atthis stage alloying occurs and the composition of every powder particle is the same asthe proportion of the elements in the starting powder mix. However, alloying is notrequired to occur during mechanical milling (MM) (since one starts with prealloyedpowders or materials with uniform composition throughout), but only particle/grainrefinement and/or some phase transformations should take place. The milled powderis then consolidated into a bulk shape and subsequently heat treated to obtain thedesired microstructure and properties. Figure 4.1 shows a schematic of the differentsteps involved in preparing a component starting from the constituent powders by theprocess of MA. Thus, the important components of the MA process are the rawmaterials, the mill, and the process variables. We next discuss the different parametersinvolved in the proper selection of raw materials and describe the different types ofmills available for conducting MA/MM investigations. A brief description of theselection process of the grinding media is also presented. The role of process variablesduring MA in achieving the desired constitution in the final product is discussedseparately in Chapter 5.
4103-X_Suryanarayana_Ch04_R2_071504
MD: SURYANARAYANA, JOB: 03320, PAGE: 35
35

4.2 RAW MATERIALS
The raw materials used for MA are the widely available commercially pure powdersthat have particle sizes in the range of 1–200 Am. However, the powder particle size isnot very critical, except that it should be smaller than the grinding ball size. This isbecause the powder particle size decreases exponentially with milling time and reachesa small value of a fewmicrometers only after a short period (typically a fewminutes) ofmilling.
The raw powders fall into the broad categories of pure metals, master alloys,prealloyed powders, and refractory compounds. The oxygen content of the commer-cially pure metal powders ranges from 0.05 to 2 wt% Therefore, if one is interested instudying phase transformations in the milled powders, it is necessary to choosereasonably high-purity powders for the investigations. This is important becausemost commonly the nature and amount of impurities in the system decides the type ofthe final phase formed, chemical constitution of the alloy, and the kinetics of trans-formations. Raw material powders of different purity and sizes can be obtained fromstandard suppliers like Goodfellow Metals, Alfa Aesar, and so forth.
Dispersion-strengthened materials usually contain additions of oxides, carbides,and nitrides. Oxides are the most common and these alloys are known as oxidedispersion strengthened (ODS) materials. In the early days of MA (the 1970s), thepowder charge for MA consisted of at least 15 vol% of a ductile, compressiblydeformable metal powder to act as a host or a binder. However, in recent years,mixtures of fully brittle materials have been milled successfully resulting in alloyformation [1]. Thus, the earlier requirement of having a ductile metal powder duringmilling is no longer necessary. Consequently, ductile-ductile, ductile-brittle, andbrittle-brittle powder mixtures have been milled to produce novel alloys. Recently,mixtures of solid powder particles and liquids have also been milled [2,3]. In thesecases, the liquid phase participates in alloying with the powder particles. For example,copper (solid) and mercury (liquid) have been milled together at room temperature toproduce Cu-Hg solid solutions [2]. This process should be distinguished fromcryomilling [4] (see Sec. 3.5 in Chapter 3), where a cryogenic medium like liquidnitrogen is used to reduce the temperature of milling.
Occasionally, metal powder mixtures are milled with a liquid medium (here theliquid only facilitates milling but does not take part in alloying with the powder), and
MD: SURYANARAYANA, JOB: 03320, PAGE: 36
4103-X_Suryanarayana_Ch04_R2_071504
Figure 4.1 Schematic of the different steps involved in producing a product from powdersby the mechanical alloying route.
Chapter 436

this is referred to as wet grinding [5–7]; if no liquid is involved the process is called drygrinding. Cryomilling also is wet grinding except that the liquid used is maintained atcryogenic temperatures and usually interacts with the powder beingmilled. It has beenreported that wet grinding is a more suitable method than dry grinding to obtain morefinely ground products because the solvent molecules are adsorbed on the newlyformed surfaces of the particles and lower their surface energy. The less agglomeratedcondition of the powder particles in the wet condition is also a useful factor. It has beenreported that the rate of amorphization is faster during wet grinding than during drygrinding [8]. However, a disadvantage of wet grinding is increased contamination ofthe milled powder. Thus, most of the MA/MM operations have been carried out dry.In addition, dry grinding is more efficient than wet grinding in some cases, e.g., duringthe decomposition of Cu(OH)2 to Cu under mechanical activation [9].
We next discuss the different types of mills available for powder processing.
4.3 TYPES OF MILLS
Different types of high-energy milling equipment are used to produce mechanicallyalloyed/milled powders. They differ in their design, capacity, efficiency of milling, andadditional arrangements for cooling, heating, and so forth. A brief description of thedifferent mills available for MA may be found in Refs. 10 and 11. While several high-energy mills are commercially available and can be readily purchased for standardmilling operations, researchers have also designed special mills for specific purposes.The following sections describe some of the more common mills currently in use forMA/MM, which are also readily available in the market.
4.3.1 Spex Shaker Mills
Shaker mills, such as SPEX mills (Figure 4.2), which mill about 10–20 g of the powderat a time, are most commonly used for laboratory investigations and for alloyscreening purposes. These mills are manufactured by SPEX CertPrep (203 NorcrossAvenue, Metuchen, NJ 08840, Tel: 1-800-522-7739 or 732-549-7144; www.spexcsp.com). The common version of the mill has one vial, containing the powder sample andgrinding balls, secured in the clamp and swung energetically back and forth severalthousand times aminute. The back-and-forth shakingmotion is combined with lateralmovements of the ends of the vial, so that the vial appears to be describing a figure of8 or infinity symbol as it moves.With each swing of the vial the balls impact against thesample and the end of the vial, both milling and mixing the sample. Because of theamplitude (about 5 cm) and speed (about 1200 rpm) of the clamp motion, the ballvelocities are high (on the order of 5 m/s) and consequently the force of the ball’s im-pact is unusually great. Therefore, thesemills can be considered as high-energy variety.
The most recent design of the SPEX mills has provision for simultaneouslymilling the powder in two vials to increase the throughput. This machine incorporatesforced cooling to permit extended milling times. A variety of vial materials is availablefor the SPEX mills; these include hardened steel, alumina, tungsten carbide, zirconia,stainless steel, silicon nitride, agate, plastic, and methacrylate. A typical example of atungsten carbide vial, gasket, and grinding balls for the SPEX mill is shown in Figure4.3. SPEX mills are the most commonly used, and most of the research on thefundamental aspects of MA has been carried out using some version of these mills.
MD: SURYANARAYANA, JOB: 03320, PAGE: 37
4103-X_Suryanarayana_Ch04_R2_071504
Equipment for Mechanical Alloying 37

SPEX mills have certain disadvantages. First, the balls may roll around the endof the vial rather than hitting it; this decreases the intensity of milling. Second, thepowder may collect in the eyes of the ‘‘8’’ and remain unprocessed [12]. Last, theround-ended vial is rather heavy; the flat-ended vial is 30% lighter, and impacts atthe ends of the vial dominate the milling action. However, some powder may collect atthe edges and remain unprocessed.
MD: SURYANARAYANA, JOB: 03320, PAGE: 38
4103-X_Suryanarayana_Ch04_R2_071504
Figure 4.2 SPEX 8000 mixer/mill in the assembled condition. (Courtesy of SPEX CertiPrep,
Metuchen, NJ.)
Figure 4.3 Tungsten carbide vial set consisting of the vial, lid, gasket, and balls. (Courtesy
of SPEX CertiPrep, Metuchen, NJ.)
Chapter 438

4.3.2 Planetary Ball Mills
Another popular mill for conducting MA experiments is the planetary ball mill(referred to as Pulverisette) in which a few hundred grams of the powder can be milledat the same time (Fig. 4.4). These aremanufactured by FritschGmbH (Industriestrahe8, D-55743 Idar-Oberstein, Germany; +49-6784-70 146;www.FRITSCH.de) andmarketed by Gilson Co. in the United States and Canada (P.O. Box 200, Lewis Cen-ter, OH 43085-0677, USA, Tel: 1-800-444-1508 or 740-548-7298;www.globalgilson.com). The planetary ball mill owes its name to the planet-like movement of its vials.These are arranged on a rotating support disk, and a special drive mechanism causesthem to rotate around their own axes. The centrifugal force produced by the vialsrotating around their own axes and that produced by the rotating support disk bothact on the vial contents, consisting of the material to be ground and the grinding balls.Since the vials and the supporting disk rotate in opposite directions, the centrifugalforces alternately act in like and opposite directions. This causes the grinding balls torun down the inside wall of the vial—the friction effect, followed by the material beingground and the grinding balls lifting off and traveling freely through the inner chamberof the vial and colliding with the opposing inside wall—the impact effect (Fig.4.5). Thegrinding balls impacting with each other intensify the impact effect considerably.
The grinding balls in the planetarymills acquire much higher impact energy thanis possible with simple pure gravity or centrifugal mills. The impact energy acquireddepends on the speed of the planetary mill and can reach about 20 times the earth’sacceleration. As the speed is reduced, the grinding balls lose the impact energy, andwhen the energy is sufficiently low there is no grinding involved; only mixing occurs inthe sample.
MD: SURYANARAYANA, JOB: 03320, PAGE: 39
4103-X_Suryanarayana_Ch04_R2_071504
Figure 4.4 Fritsch Pulverisette P-5 four-station planetary ball mill. (Courtesy of Gilson
Company, Worthington, OH.)
Equipment for Mechanical Alloying 39
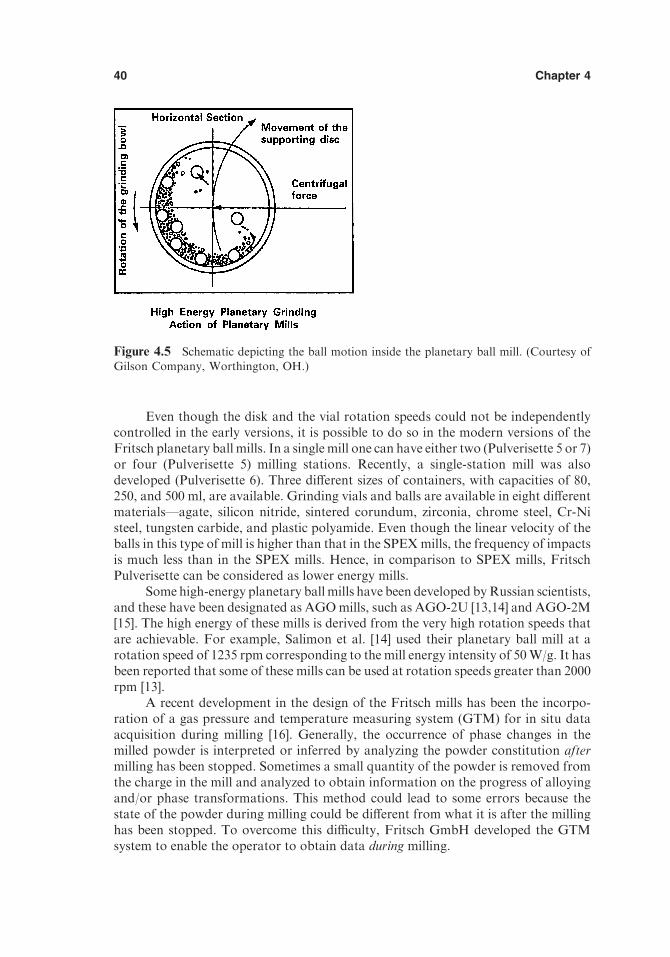
Even though the disk and the vial rotation speeds could not be independentlycontrolled in the early versions, it is possible to do so in the modern versions of theFritsch planetary ball mills. In a singlemill one can have either two (Pulverisette 5 or 7)or four (Pulverisette 5) milling stations. Recently, a single-station mill was alsodeveloped (Pulverisette 6). Three different sizes of containers, with capacities of 80,250, and 500 ml, are available. Grinding vials and balls are available in eight differentmaterials—agate, silicon nitride, sintered corundum, zirconia, chrome steel, Cr-Nisteel, tungsten carbide, and plastic polyamide. Even though the linear velocity of theballs in this type of mill is higher than that in the SPEXmills, the frequency of impactsis much less than in the SPEX mills. Hence, in comparison to SPEX mills, FritschPulverisette can be considered as lower energy mills.
Some high-energy planetary ballmills have been developed byRussian scientists,and these have been designated as AGOmills, such as AGO-2U [13,14] and AGO-2M[15]. The high energy of these mills is derived from the very high rotation speeds thatare achievable. For example, Salimon et al. [14] used their planetary ball mill at arotation speed of 1235 rpm corresponding to the mill energy intensity of 50W/g. It hasbeen reported that some of these mills can be used at rotation speeds greater than 2000rpm [13].
A recent development in the design of the Fritsch mills has been the incorpo-ration of a gas pressure and temperature measuring system (GTM) for in situ dataacquisition during milling [16]. Generally, the occurrence of phase changes in themilled powder is interpreted or inferred by analyzing the powder constitution aftermilling has been stopped. Sometimes a small quantity of the powder is removed fromthe charge in the mill and analyzed to obtain information on the progress of alloyingand/or phase transformations. This method could lead to some errors because thestate of the powder during milling could be different from what it is after the millinghas been stopped. To overcome this difficulty, Fritsch GmbH developed the GTMsystem to enable the operator to obtain data during milling.
MD: SURYANARAYANA, JOB: 03320, PAGE: 40
4103-X_Suryanarayana_Ch04_R2_071504
Figure 4.5 Schematic depicting the ball motion inside the planetary ball mill. (Courtesy ofGilson Company, Worthington, OH.)
Chapter 440

The basic idea of this measuring system is the quick and continuous determina-tion of temperature and pressure during the milling process. The temperaturemeasured corresponds to the total temperature rise in the system due to thecombination of grinding, impact, and phase transformation processes. Since the heatcapacity of the container and the grindingmedium is much higher than the mass of thepowder, it is necessary to have a sensitive temperature measurement in order to derivemeaningful information. Accordingly, a continuous and sensitive measurement of gaspressure inside the milling container is carried out to measure very quickly and detectsmall temperature changes. The measured gas pressure includes not only informationabout the temperature increase due to friction, impact forces, and phase trans-formations, but also the interaction of gases with the fresh surfaces formed duringthe milling operation (adsorption and desorption of gases). The continual and highlysensitive measurement of the gas pressure within the milling container facilitatesdetection of abrupt and minute changes in the reactions occurring inside the vial. Thepressure could be measured in the range of 0–700 kPa, with a resolution of 0.175 kPa,which translates to a temperature resolution of 0.025 K.
4.3.3 Attritor Mills
A conventional ball mill consists of a rotating horizontal drum half-filled with smallsteel balls. As the drum rotates the balls drop on the metal powder that is beingground; the rate of grinding increases with the speed of rotation. At high speeds,however, the centrifugal force acting on the steel balls exceeds the force of gravity, andthe balls are pinned to the wall of the drum. At this point the grinding action stops. Anattritor (a ball mill capable of generating higher energies) consists of a vertical drumcontaining a series of impellers. A powerful motor rotates the impellers, which in turnagitate the steel balls in the drum. Set progressively at right angles to each other, theimpellers energize the ball charge. The dry particles are subjected to various forcessuch as impact, rotation, tumbling, and shear. This causes powder size reductionbecause of collisions between balls, between balls and container wall, and betweenballs, agitator shaft, and impellers. Therefore, micrometer-range fine powders can beeasily produced. Some size reduction, though small in proportion, appears to takeplace by interparticle collisions and by ball sliding. In addition, combination of theseforces creates a more spherical particle than other impact-type milling equipment.
Attritors, also known as stirred ball mills, are the mills in which large quantitiesof powder (from a few pounds to about 100 lb) can be milled at a time (Fig. 4.6).Commercial attritors are available fromUnion Process (1925 Akron-Peninsula Road,Akron, OH 44313, Tel: 330-929-3333;www.unionprocess.com; and Zoz GmbH, D-57482 Wenden, Germany, Tel: +49-2762-97560; office in Newark, DE, Tel: 302-369-6761; www.zoz.de). The velocity of the grinding medium in the attritors is much lower(about 0.5 m/s) than in the planetary or SPEX mills, and consequently the energy ofmilling in the attritors is low. Attritors of different sizes and capacities are available.The grinding tanks or containers are available either in stainless steel or stainless steelcoated inside with alumina, silicon carbide, silicon nitride, zirconia, rubber, andpolyurethane. A variety of grindingmedia also is available—glass, flint stones, steatiteceramic, mullite, silicon carbide, silicon nitride, sialon, alumina, zirconium silicate,zirconia, stainless steel, carbon steel, chrome steel, and tungsten carbide.
MD: SURYANARAYANA, JOB: 03320, PAGE: 41
4103-X_Suryanarayana_Ch04_R2_071504
Equipment for Mechanical Alloying 41

The operation of an attritor is simple. All the elemental powders and oxides to bemilled are placed in a stationary tankwith the grindingmedia. No premixing is needed.The maximal feed material size can be up to 10 mm, provided the material is relativelybrittle. Otherwise, only material smaller than 2 mm can be processed. This mixture isthen agitated by a shaft with arms, rotating at a high speed of about 250 rpm (Fig. 4.7).This causes the media to exert both shearing and impact forces on the material. Thelaboratory attritor works up to 10 times faster than conventional ball mills.
While the attritors are generally batch type, they can be made to work in acontinuous mode. Since the attritors are open at the top, the material is charged at thetop by a preset rate feeder, ground, and removed from the lower side of the grindingtank. By constantly taking out the fine product and reloading the oversize particles,one can achieve very efficient narrow size distribution of particles. This process is bestsuited for the continuous production of large quantities of material. However, a well-premixed slurry is needed for this type of process and consequently cannot be used fordry grinding purposes.
MD: SURYANARAYANA, JOB: 03320, PAGE: 42
4103-X_Suryanarayana_Ch04_R2_071504
Figure 4.6 Model 01-HD attritor. (Courtesy of Union Process, Akron, OH.)
Chapter 442

Conventional ball mills use large media, normally 12 in. or larger, and run at a low
speed (10–50 rpm). Attritors, on the other hand, use grinding medium of about 1/8 to3/8 in. size and run typically at moderate speeds of about 60 rpm in the largestproduction size units, but at about 250 rpm for the laboratory size units. The mostimportant concept in the attritor is that the power input is used directly for agitatingthe media to achieve grinding and is not used for rotating or vibrating a large, heavytank in addition to themedia. Figure 4.8 shows a comparison of the effectiveness of thevarious grinding devices in ultrafine grinding of chalcopyrite concentrate. It may benoted that the attritor is much more effective than a conventional ball mill or avibratory ball mill. For the specific energy input of around 100 kWh/ton, the medianparticle size achieved through the attritor is nearly half smaller than that obtainedfrom conventional ball mills, and is about one-third smaller than that obtained fromvibratory mills. Furthermore, for specific energy input exceeding 200 kWh/ton,attritors continue to grind into the submicrometer range, while other grindingmachines can no longer effectively produce any smaller particles.
While the Union Process attritors are vertical in configuration, the Zoz attritorsare horizontal (Fig. 4.9). The main features of the Zoz attritor are as follows:
1. It supplies three times higher relative velocity of the grinding media thanconventional devices.
2. It can be operated and also charged and discharged under vacuum or inertatmosphere.
MD: SURYANARAYANA, JOB: 03320, PAGE: 43
4103-X_Suryanarayana_Ch04_R2_071504
Figure 4.7 Arrangement of rotating arms on a shaft in the attrition ball mill. (Courtesy ofUnion Process, Akron, OH.)
Equipment for Mechanical Alloying 43

3. It allows processing without dead zones and negative gravity influence.4. It can be operated at high temperatures due to separated cooling/heating
systems.5. It is usually software operated, and allows parameter measurement,
control, and history.6. It is scalable from 0.5 to 900 liters processing chamber capacity.7. It can be operated in batch, semicontinuous, and auto-batch mode.8. It is available with tools of stainless steel/satellite, WC-Co, and Si3N4.
Figure 4.10 shows the principle of powder flow during processing in a Zoz horizontalattritor.
Themain problem of the horizontal attritors is that very fine powder prepared inthe attritor is not forced by gravity to places away from the rotary seals. This technicalproblemwas solved bymeans of an adjustable preseal unit, an extension chamber, andfinally a redesign of the rotary seal itself. Thus, advantages of the horizontal attritorare as follows:
No dead zones due to gravityPossibility of extremely high-energy impactCharging and discharging under controlled atmosphere
4.3.4 Commercial Mills
Commercial mills for MA are much larger in size than the mills described above andcan process several hundred pounds of powder at a time. MA for commercialproduction is carried out in ball mills of up to about 3000 lb (1250 kg) capacity(Fig. 4.11).
MD: SURYANARAYANA, JOB: 03320, PAGE: 44
4103-X_Suryanarayana_Ch04_R2_071504
Figure 4.8 Comparison of the effectiveness of various grinding devices for ultrafine grindingof chalcopyrite concentrate.
Chapter 444

The milling time decreases with an increase in the energy of the mill. It has beenreported that 20 min of milling in a SPEXmill is equivalent to 20 h of milling in a low-energy mill of the Invicta BX 920/2 type [17]. As a rule of thumb, it can be estimatedthat a process that takes only a few minutes in the SPEX mill may take hours in anattritor and a few days in a commercial mill, even though the details can differdepending on the efficiency of the different mills. Figure 4.12 shows the times required
MD: SURYANARAYANA, JOB: 03320, PAGE: 45
4103-X_Suryanarayana_Ch04_R2_071504
Figure 4.9 (a) Horizontal rotary ball mill (Simoloyer CM100-S2), production unit for
nanocrystalline metal hydrides. (b) Horizontal rotary ball mill (Simoloyer CM01-2l) with airlock for loading, operation, and unloading under vacuum and/or inert gas. (Courtesy of ZozGmbH, Wenden, Germany.)
Equipment for Mechanical Alloying 45

MD: SURYANARAYANA, JOB: 03320, PAGE: 46
4103-X_Suryanarayana_Ch04_R2_071504
Figure 4.10 Detail of the rotor in operation showing the principle of powder flow duringprocessing in a Zoz horizontal attritor.
Figure 4.11 Commercial production size ball mills used for mechanical alloying. (Courtesy
of Inco Alloys International.)
Chapter 446

to reach a specific particle size during milling in a planetary ball mill and an attritor. Itmay be noted that the times are an order of magnitude shorter in the attritor [18].Similarly, by comparing the powder yield it becomes clear that the yield is much higherand that alloying is complete sooner in the Zoz Simoloyer than in the Fritsch P5planetary ball mill (Fig. 4.13).
4.3.5 New Designs
Several new designs of mills have been developed in recent years for specializedpurposes. These include the rod mills, vibrating frame mills, and the equipmentavailable from Dymatron (Cincinnati, OH), Nisshin Giken (Tokyo, Japan), Austra-lian Scientific Instruments (Canberra, Australia), and M.B.N. srl (Rome, Italy).
The rod mills are very similar to the ball mills except that they use steel rodsinstead of balls as grinding medium [19,20]. It has been claimed that the powder
MD: SURYANARAYANA, JOB: 03320, PAGE: 47
4103-X_Suryanarayana_Ch04_R2_071504
Figure 4.12 Times required to reach similar particle sizes during milling of TiB2 powder in(a) planetary ball mill and (b) attritor.
Equipment for Mechanical Alloying 47

MD: SURYANARAYANA, JOB: 03320, PAGE: 48
4103-X_Suryanarayana_Ch04_R2_071504
contamination during rod milling is much lower than during ball milling. This hasbeen explained to be due to the increased proportion of shear forces over the impactforces during rod milling.
The Megapact and Megamill-5 units supplied by Dymatron are high-energyvibrationmills. TheMegapact mill (Fig. 4.14a) could be obtained with either two large(1400 cm3) or two small (280 cm3) stainless steel chambers. The cradles support up tofour short chambers, two on each cradle. The milling chambers permit milling undercontrolled conditions and/or atmospheres. The Megamill-5 (Fig. 4.14b) is equippedwith two steel or stainless steel chambers, each with an internal volume of 5 liters. Thechambers are secured to each cradle of the mill by a roller chain and clamp, therebyfacilitating quick loading and unloading of the chambers. The leak-proof cover sealsprovided with the milling chambers permit operation in vacuum, inert, or controlledatmospheres under ambient, heated, or cryogenic conditions. Reactive gas or fluidatmospheres could also be used, but provision must be made to release high internalchamber pressures.
The Super Misuni NEV-MA-8 from Nisshin Giken (Fig. 4.15) has been apopular milling unit with several Japanese researchers. This machine has some specialfeatures such as variety of selections for milling energy (up to a speed of 1600 rpm),variety of selections for atmospheres (vacuum or any flowing gas), ability to controlthe temperature of milling from very low temperatures of –190jC (obtained byspraying liquid nitrogen) up to a high temperature of 300jC (achieved by electricalheating), and in situ observation of the grinding medium during milling.
The Uni-Ball mill from Australian Scientific Instruments (Canberra, Australia)is another type of mill wherein it is possible to control the nature and magnitude ofimpact of the balls by controlling the field strengthwith the help of adjustablemagnets.The incorporation of permanent magnets generates a magnetic field, which acts on theferromagnetic balls used for milling. By adjusting the distance between the balls andthe magnet, the impact energy can be varied. Thus, one can choose the desired impactenergy depending on the requirement and the materials to be milled. By properadjustment of the magnetic field, the effective mass of the grinding ball can beincreased by a factor of 80. Furthermore, changing the positions of the magnets canalter the type of energy transferred to the powder and one can obtain impact or shearmodes or a combination of both.
Figure 4.13 Powder yield as a function of milling time for the Zoz Simoloyer and Fritsch P5planetary ball mill.
Chapter 448

MD: SURYANARAYANA, JOB: 03320, PAGE: 49
4103-X_Suryanarayana_Ch04_R2_071504
The Uni-Ball mill has the following special features:
Multiple mill chambers allowing large amount of powder to be processed at atime.
Precision control of milling energy by properly adjusting the position, quantity,and proximity of the magnets around each mill chamber. This allows theuser to select the impact energy, shear force and the proportion of these.
Figure 4.14 Mechanical alloying equipment manufactured by Dymatron. (a) Megapact milland (b) Megamill-5. (Courtesy of Dymatron, Cincinnati, OH.)
Equipment for Mechanical Alloying 49

Variable milling speed.Fully controlled atmosphere (argon, nitrogen, helium, ammonia, hydrogen,
etc.).Fully controlled temperature (from low to high temperatures of about 200jC).
Figure 4.16a shows the Uni-Ball mill with the provision of a spatially adjustablehigh-strength magnet (on the left side) and Figure 4.16b shows the mill chambercomponents. Calka and Wexler [21] recently modified the Uni-Ball mill 5 to achievemilling modes involving impact or shearing of hardened curved surfaces on particlesunder a controlled electric discharge within a controlled atmosphere. The effects oflow-frequency and high-voltage electrical impulses during milling were shown to bevery efficient in synthesizing intermetallics, promoting reduction reactions, andforming nitride phases of several different metals not possible by conventional millingunder regular impact mode.
The HE (high-energy) mill fromM.B.N. srl (Fig. 4.17) has high impact velocitiesof up to 4m/s, high impact frequency of the balls with the vial walls of 20 Hz, and largemill capacities of up to 10-kg ball charge. The HE mill can operate with one large vialor with two smaller vials in which independent (materials/atmosphere/ball-to-powderweight ratios) milling can be performed. The vial motion has a fixed amplitude of 30mm, but its frequency can be continuously varied and the work cycle can be
MD: SURYANARAYANA, JOB: 03320, PAGE: 50
4103-X_Suryanarayana_Ch04_R2_071504
Figure 4.15 Super Misuni NEV mill.
Chapter 450

programmed with on/off periods having a resolution of 1 min and total milling time ofup to 4 days. The vial could be filled with different types of gases and the internalpressure could be measured with a transducer.
The operating details and special features of the commercially available mills canbe found in the respective brochures of the manufacturers.
Some special equipment is also designed for specific laboratory applications.Bakker and colleagues [22] used a mill in which a single hardened steel ball with adiameter of 6 cm is kept inmotion by a vibrating frame onwhich the vial is mounted. Asimilar, but instrumented, variety of the mill has been used by Pochet et al. [23] (Fig.4.18). The vial is made of stainless steel with a hardened steel bottom, the central partof which consists of a tungsten carbide disk of 2 cm diameter. This mill has a lowefficiency since the ball is moving from one side to another (and the gap between the
MD: SURYANARAYANA, JOB: 03320, PAGE: 51
4103-X_Suryanarayana_Ch04_R2_071504
Figure 4.16 (a) Uni-Ball mill with the provision of a spatially adjustable high-strengthmagnet. (b) Chamber components. (Courtesy of Australian Scientific Instruments, Fyshwick,
Australia.)
Equipment for Mechanical Alloying 51

MD: SURYANARAYANA, JOB: 03320, PAGE: 52
4103-X_Suryanarayana_Ch04_R2_071504
Figure 4.17 Schematic of the HE (high energy) mill manufactured by MBN srl., Rome,Italy. A, Motor; B, springs; C, grinding medium; D, vial lids; and E, lever.
Figure 4.18 Instrumented vertical vibrating frame.
Chapter 452

vial walls and the ball is very small), has a long repetition time, and the specimen getsmilled only during the collisions. On the other hand, the shaker mills, e.g., SPEXmills,have a much higher efficiency. However, even in the SPEX mills, several non-head-oncollisions occur, and these reduce the maximal possible efficiency. Furthermore,because of friction, the surface of the grinding medium gets eroded and this debriscontaminates the sample.
To overcome some of the above-mentioned problems, Szymanski et al. [24]designed a friction-free mechanical grinder (Fig. 4.19). This grinder consists of sevensteel rods (10 mm in diameter and 100 mm in height) arranged in a hexagonal motifwith one rod in the center. These rods stand in a vertical position between a pair ofparallel horizontal steel anvils separated by a distance of 116 mm. The device movesup and down with an amplitude of 3.5 mm and a frequency of 25 Hz. Powders milledin this device have a low contamination level.
Taking into consideration the fact that a high-energy ball mill should have highimpact velocities and high impact frequencies of the grinding media, one can designnewmills for specific applications. For example, Basset et al. [25] andKimura et al. [26]
MD: SURYANARAYANA, JOB: 03320, PAGE: 53
4103-X_Suryanarayana_Ch04_R2_071504
Figure 4.19 Schematic of the friction-free grinding mill.
Equipment for Mechanical Alloying 53

designed special high-energy ball mills to produce nanocrystalline materials andamorphous alloys, respectively. One could also design mills of higher capacity toproduce large quantities of themechanically alloyed powder at a time or to increase theproductivity by increasing the MA speed (or reducing the MA times) [27].
Aizawa et al. [28,29] reported development of a high-speed MA route tosynthesize large amounts of powder. The salient features of this process are as follows:
Cyclic and continuous application of mechanical power and energy with theprescribed amount per cycle or period.
Combination of hydrostatic pressing mode with high shear deformation modeinto the specified pass schedule per cycle. Two pressing modes and one severeshear deformation mode are included in one cycle.
Ability to change the above loading sequences.
Conducting the operation for a number of cycles results in true alloying. This has beendemonstrated for Cu-Ag, Cu-Co, Ni-Al, Mo-Si, and several other systems [28,29]. Ithas been claimed that the processing times could be significantly reduced using thisequipment.
One of the difficulties encountered during milling of powders, mostly in theattritors and sometimes in other mills, is the development of dead zones. These arethe areas where the powder gets accumulated without getting milled. This is becausethe attritor arms do not reach those places (or the grinding medium does not exert anyforce on the powder); this can be attributed mainly to a decrease in the radial velocityof the grinding medium just near the edges of the attritor arms [30]. Similarly, a deadzone exists at the bottom of the attritor also due to the inaccessibility of the powder atthe bottom of the attritor chamber to the rotating arms. It is desirable to avoid theoccurrence of dead zones and facilitate powder circulation to shorten the milling timesand also to achieve homogeneity in the powder. The following three methods areeffective in avoiding dead zones in an attritor [30]:
1. If the grinding balls are of the same size, they form a close-packed array,resulting in the predominance of rolling of one ball over the others. Thisleads to reduced impact events and so effectively reduces deformation andmissing of the powder particles. This can be overcome by using more thanone size of the grinding medium. In fact, it has been shown throughcinematographic studies that a ball array does not form when a mix of thedifferent grinding ball sizes is used and that milling takes place moreefficiently [31].
2. The bottom of the attritor chamber could be contoured in such a way so asto steer the balls and the powder up into the more active mill region.
MD: SURYANARAYANA, JOB: 03320, PAGE: 54
4103-X_Suryanarayana_Ch04_R2_071504
Table 4.1 Typical Capacities of Different Types of Mills
Type of mill Media size (in.) Rotation speed (rpm) Sample weight
Mixer .1/8 to 1/2 .1200 .Up to 2 � 20 gPlanetary .3/16 or larger .100–2500 .Up to 4 � 250 g
Attritor .1/8 to 3/8 .60–300 .0.5 to 100 kgUni-Ball .1/4 or larger .Variable .Up to 4 � 2000 g
Chapter 454

3. Another alternative is to place an additional arm at the bottom of theattritor chamber. This arm could be machined into a wedge shape asopposed to the round shape of the other arms. This design would force theballs and the powder (like a scoop action) into the more active regions ofthe attritor.
Table 4.1 summarizes the capacities of the different mills for MA/MM that arecommercially available [32]. Figure 4.20 compares the different devices (Simoloyer,planetary ball mill, attritor, and a conventional ball mill) regarding their sizes andcapacities.
The main goal of the design of any MA/MM device is to produce homogeneouspowder of the desired stoichiometry in an economical way andwith the required purity(minimal or no contamination). It would also be useful to increase the productivitywithout increasing the milling time, and it is most desirable for the powder to beproduced continuously.
4.4 SELECTION OF GRINDING MEDIUM
Proper selection of the nature, size, and size distribution of the grinding medium is animportant step in achieving efficient milling of powder particles. The selection dependson several factors, some of which are interrelated.
Specific Gravity
In general, high-density media give better results. This is because the kinetic energy ofthe balls is higher and consequently higher amounts of energy are transferred to themilled powder. The media should be denser than the powder being ground. Also,highly viscous materials require media with a higher density to prevent floating.
Initial Feed Size
Since smaller media cannot break up large particles, the grinding medium should belarger than the powder particle size. It will also be shown in Chapter 16 that it is
MD: SURYANARAYANA, JOB: 03320, PAGE: 55
4103-X_Suryanarayana_Ch04_R2_071504
Figure 4.20 Comparison of the different devices used for ball milling of powders.
Equipment for Mechanical Alloying 55

desirable to use a mixture of different sizes of the balls rather than one size. A mixtureof different sizes of the grinding balls helps to improve the efficiency of the attritor.
Final Particle Size
The grinding medium should be smaller when very fine particles are desired; thesmaller the grinding medium, the smaller is the final particle size.
Hardness
The harder the media the lesser is the powder contamination, and consequently themedium lasts longer. However, if the medium is brittle, then edges of the medium maybe chipped off and get incorporated into the milled powder and contaminate it.However, if the media is magnetic in nature and the powder is not, then the materialresulting from the wear of the grinding medium may be separated by magnetic means.
pH Value
Some strong acid or basic slurries may react with certain metallic media.
Discoloration
Certain media result in color development and are, therefore, not suitable in theproduction of some materials such as white coatings.
MD: SURYANARAYANA, JOB: 03320, PAGE: 56
4103-X_Suryanarayana_Ch04_R2_071504
Table 4.2 Properties of the Different Grinding Media Available for Mechanical
Alloying/Mechanical Milling
MaterialDensity(g/cm3)
Abrasionresistance Material to be ground
Agate (99.9% SiO2) 2.65 Good .Soft to medium hardsamples
PTFE with steel core 3.0 Adequate .Soft, brittle samples andfor homogenization
Silicon nitride
(90% Si3N4)
3.1 Extremely
good
.Abrasive sample,
iron-free grindingSintered corundum
(99.7% Al2O3)>3.8 Fairly good .Medium-hard as well as
fibrous samples
Sintered corundum-2(85–90% Al2O3)
>3.8 Fairly good .Medium-hard as well asfibrous samples
Stainless steel (12.5 to
14.5% Cr + 1% Ni)
7.8 Fairly good .Medium hard as well as
brittle samplesTempered steel
(1.0 to 1.65% Cr)7.9 Good .Hard, brittle samples
Tungsten carbide
(93.2% WC +6% Co)
14.7 Very good .Hard, abrasive samples
Zirconium oxide
(94.8% ZrO2)
5.7 Very good .Fibrous as well as
abrasive samples
Chapter 456

Contamination
This could be a serious consideration since material resulting from the wear of themedia affects the product and may contaminate it. Therefore, it should be removed bya magnetic separator, chemicals, or sintering.
Cost
Media that are two to three times more expensive may last considerably longer. Thesemay be well worth the extra cost over the long run.
Table 4.2 presents the different types of grinding media available for MA/MMpurposes and their properties.
REFERENCES
1. Davis, R. M., McDermott, B., Koch, C. C. (1988). Metall. Trans. 19A:2867–2874.
2. Ivanov, E. (1992). Mater. Sci. For. 88–90:475–480.3. Yamazaki, T., Terayama, K., Shimazaki, T., Sugimoto, K. (1997). J. Mater. Sci. Lett.
16:1357–1359.4. Luton, M. J., Jayanth, C. S., Disko, M. M., Matras, M. M., Vallone, J. (1989). In:
McCandlsih, L. E., Polk, D. E. Siegel, R. W., Kear, B. H., eds.Multicomponent UltrafineMicrostructures. Pittsburgh, PA: Mater. Res. Soc. 132:79–86.
5. Okada, K., Kikuchi, S., Ban, T., Otsuka, N. (1992). J. Mater. Sci. Lett. 11:862–864.
6. Nicoara, G., Fratiloiu, D., Nogues, M., Dormann, J. L., Vasiliu, F. (1997). Mater. Sci.For. 235–238:145–150.
7. Bellosi, A., Montverde, F., Botti, S., Martelli, S. (1997). Mater. Sci. For. 235–238:255–
260.8. Dolgin, B. P., Vanek, M. A., McGory, T., Ham, D. J. (1986). J. Non-Cryst. Solids
87:281–289.
9. Blaskov, V., Radev, D. D., Klissurski, D., Yordanov, N. D. (1994). J. Alloys Compounds206:267–270.
10. Suryanarayana, C. (1998). In: Powder Metal Technologies and Applications. ASMHandbook, Vol. 7. Materials Park, OH: ASM International, pp. 80–90.
11. Suryanarayana, C. (2001). Prog. Mater. Sci. 46:1–184.12. Takacs, L. (1996). In: Suryanarayana, C., et al., eds. Processing and Properties of
Nanocrystalline Materials. Warrendale, PA: TMS, pp. 453–464.
13. Uchrin, J., Uchrin, R., Avvakumov, E. G. (1995). Mater. Sci. For. 179–181:425–430.14. Salimon, A. I., Korsunsky, A. M., Kaloshkin, S. D., Tcherdyntsev, V. V., Shelekhov, E.
V., Sviridova, T. A. (2001). Mater. Sci. For. 360–362:137–142.
15. Kwon, Y.-S., Gerasimov, K. B., Lomovsky, O. I., Pavlov, S. V. (2003). J. AlloysCompounds 353:194–199.
16. Scholl, R., Wegerle, R., Mutter, W. (2000). Mater. Sci. For. 343-346:964–972.17. Yamada, K., Koch, C. C. (1993). J. Mater. Res. 8:1317–1326.
18. Thummler, F., Oberacker, R. (1993). In: Introduction to Powder Metallurgy. London,UK: Institute of Materials, p. 12.
19. Shoji, K., Austin, L. G. (1974). Powder Technol. 10:29–35.
20. Sherif El-Eskandarany, M., Aoki, K., Suzuki, K. (1990). J. Less Common Metals167:113–118.
21. Calka, A., Wexler, D. (2002). Mater. Sci. For. 386–388:125–134.
22. Bakker, H., Zhou, G. F., Yang, H. (1995). Prog. Mater. Sci. 39:159–241.23. Pochet, P., Tominez, E., Chaffron, L., Martin, G. (1995). Phys. Rev. B52:4006–4016.
MD: SURYANARAYANA, JOB: 03320, PAGE: 57
4103-X_Suryanarayana_Ch04_R2_071504
Equipment for Mechanical Alloying 57

24. Szymanski, K., Zaleski, P., Recko, K., Waliszewski, J. (1997). Mater. Sci. For. 235–238:223–228.
25. Basset, D., Matteazzi, P., Miani, F. (1993). Mater. Sci. Eng. A168:149–152.
26. Kimura, H., Kimura, M., Takada, F. (1988). J. Less Common Metals 140:113–118.27. Kobayashi, O., Aizawa, T., Kihara, J. (1996). Mater. Trans. Jpn. Inst. Metals 37:1497–
1504.
28. Aizawa, T., Tatsuzawa, K., Kihara, J. (1993). Metal Powder Rep. 48:30–33.29. Aizawa, T., Kihara, J., Benson, D. (1995). Mater. Trans. Jpn. Inst. Metals 36:138–149.30. Rydin, R. W., Maurice, D., Courtney, T. H. (1993). Metall. Trans. 24A:175–185.
31. Cook, T. M., Courtney, T. H. (1995). Metall. Mater. Trans. 26A:2389–2397.32. Kerr, I. (1993). Metal Powder Rep. 48:36–38.
MD: SURYANARAYANA, JOB: 03320, PAGE: 58
4103-X_Suryanarayana_Ch04_R2_071504
Chapter 458

5
Process Variables in Milling
5.1 INTRODUCTION
Mechanical alloying (MA) is a complex process involving optimization of a number ofprocess variables to achieve the desired product phase, microstructure, and/orproperties. However, we will not consider the nature and composition of the powdermix as a variable here. These will decide the nature of the phase formed (solid solution,intermetallic, or amorphous phase, etc.) in the milled powder, and discussion aboutthese is presented in subsequent chapters. For a given composition of the powder,some of the important variables that have an important effect on the final constitutionof the milled powder are as follows:
Type of millMilling containerMilling energy/speedMilling timeType, size, and size distribution of grinding mediumBall-to-powder weight ratioExtent of vial fillingMilling atmosphereProcess control agentTemperature of milling
These process variables are not completely independent. For example, theoptimal milling time depends on the type of mill, size of the grinding medium,temperature of milling, ball-to-powder ratio (BPR), etc. Further, more energy couldbe imparted to the milled powder by increasing the BPR or bymilling the powder for a
4103-X_Suryanarayana_Ch05_R2_071504
MD: SURYANARAYANA, JOB: 03320, PAGE: 59
59

longer time. Similarly, it could be shown that some of the other parameters are alsointerdependent. Even so, we will discuss in the following paragraphs the effect of thesevariables on the final product obtained after MA assuming mostly that the othervariables have no significant effect on the specific variable being discussed.
5.2 TYPE OF MILL
As discussed earlier (Chapter 4), a number of different types of mills are available forMA/MM. These mills differ in their capacity, speed of operation, and capacity tocontrol the operation by varying the temperature of milling and the extent ofminimizing contamination of the milled powders. Depending on the type of powder,the quantity of powder to be milled, and the final constitution required, a suitable millcan be chosen. Most commonly, however, the SPEX shaker mills are used forexploratory and alloy screening purposes. The Fritsch Pulverisette planetary ballmills or attritors are used to produce larger quantities of the milled powder. Speciallydesigned mills are used for specific applications.
It has been recently shown [1] that the degree of contamination, amount of theamorphous phase formed, crystallization temperature, and the activation energy forcrystallization of the amorphous phase depend on the type of mill used. For example,the investigators conducted MA experiments on a Mo-47 at% Ni powder mix in aSPEX 8000D mill and the Zoz Simoloyer mill. They noted that the oxygen level in thepowder milled in the Simoloyer was much less than in the SPEX mill. This resulted inchanges in the nature of the amorphous phase formed. For example, for powdersprocessed in the SPEX mill, the crystallization temperature decreased with increasingmilling time and the activation energy for crystallization was lower than for thepowder milled in the Zoz Simoloyer mill. Both of these effects were explained on thebasis of increased contamination levels of oxygen at longer milling times.
5.3 MILLING CONTAINER
The material used for the milling container (grinding vessel, vial, jar, and bowl aresome of the other terms used) is important because due to impact of the grindingmedium on the inner walls of the container some material will be dislodged and beincorporated into the powder. This can contaminate the powder and/or alter thechemistry of the milled powder. If the material of the grinding vessel is different fromthat of the powder being milled, then the powder may be contaminated with thematerial of the grinding vessel. On the other hand, if the materials of the container andthe powder being milled are the same, then the chemistry of the final powder may bealtered. For example, during milling of Cu-In-Ga-Se powder mixtures in a coppercontainer, it was noted that the copper content in the milled powder was higher thanthe copper content in the initial powder mix. This was due to the incorporation ofcopper into the powder from the container and the grinding balls [2]. Even though thisis not ‘‘contamination,’’ the chemistry of the milled powder is different from thedesired composition. This problem could be solved by taking a lower copper contentin the initial powder mix, noting that the copper uptake in the milled powder dependson the processing conditions.
Hardened steel, tool steel, hardened chromium steel, tempered steel, stainlesssteel, WC-Co, WC-lined steel [3], and bearing steel are the most common types of
MD: SURYANARAYANA, JOB: 03320, PAGE: 60
4103-X_Suryanarayana_Ch05_R2_071504
Chapter 560

materials used for the grinding vessels. Some specific materials are used for specializedpurposes; these include copper [2], titanium [4], sintered corundum, yttria-stabilizedzirconia (YSZ) [5], partially stabilized zirconia+ yttria [6,7], sapphire [8,9], agate [10–12], hard porcelain, Si3N4 [13], and Cu-Be [14–18].
The shape of the container also seems to be important, especially the internaldesign of the container. Both flat-ended and round-ended SPEX mill containers havebeen used. Alloying was found to occur at significantly higher rates in the flat-endedvial than in the round-ended container [19]. The time required to reach a constantintensity and shape of the (111) peak in the X-ray diffraction (XRD) pattern of the Si-Ge mixture was 9 h for the flat-ended vial and 15 h for the round-ended vial. However,a problem with the round-ended vial is that the balls may roll around the end of thevial rather than hitting it, thereby decreasing the milling intensity. The balls may evenroll around the inside surface of the vial repeatedly tracing out a bent-8 shape. Powdermay collect in the eyes of the ‘‘8’’ and remain unprocessed [20]. Proper design of themilling container is important in avoiding the formation of dead zones, areas wherethe powder does not get milled because the grinding medium cannot reach there.
5.4 MILLING ENERGY/SPEED
It is easy to realize that the faster the mill rotates the higher will be the energy inputinto the powder. This is because the kinetic energy of the grinding medium (E= 1/2mv2, where m is the mass and v is the relative velocity of the grinding medium) isimparted to the powder being milled. Therefore, the kinetic energy supplied to thepowder is higher at higher relative velocities of the grinding medium. However,depending on the design of the mill there are certain limitations to the maximal speedthat could be employed. For example, in a conventional ball mill increasing the speedof rotation will increase the speed with which the balls move. Above a critical speed,the balls are pinned to the inner walls of the vial and do not fall down to exert anyimpact force. Therefore, the maximal speed should be just below this critical value sothat the balls fall down from the maximal height to produce the maximal collisionenergy.
Another limitation to the maximal speed is that at high speeds (or intensity ofmilling) the temperature of the vial may reach a high value. This may be advantageousin some cases where diffusion is required to promote homogenization and/or alloyingin the powders. However, in some cases this increase in temperature may be a dis-advantage because the increased temperature accelerates the transformation processesand results in the decomposition of supersaturated solid solutions or other metastablephases formed during milling [21]. In addition, the high temperatures generated mayalso contaminate the powders. It has been reported that during nanocrystal forma-tion, the average crystal size increased and the internal strain decreased at highermilling intensities due to the enhanced thermal effects and consequent dynamicrecrystallization [22]. The maximal temperature reached is different in different typesof mills and the values vary widely. (This aspect is discussed in detail in Chapter 8.)
Yet another disadvantage of increased milling speed is the excessive wear of themilling tools (grinding medium and container), which could also lead to increasedpowder contamination. The powder yield could also be lower if the powder gets stuckto the inner walls of the milling container due to increase in cold welding caused by thehigher degree of plastic deformation.
MD: SURYANARAYANA, JOB: 03320, PAGE: 61
4103-X_Suryanarayana_Ch05_R2_071504
Process Variables in Milling 61

It is important to realize that it may not be possible to change themilling speed inall types of mills. For example, while SPEX mills usually run at a constant speed, thespeed of rotation of the rotating disk and the containers could be changed in theFritsch Pulverisette. Similarly, by changing the position and intensity of the magnets,the milling intensity as well as the nature of the forces (shear, impact, or a combinationof these) could be altered in the Uni-Ball mill.
As was mentioned in Chapter 4, the disk and the vials can rotate either in thesame direction (normal direction) or in the opposite direction (counter direction).Depending on the direction in which they move, the impact energy acquired by theballs is going to vary.Mio et al. [23] investigated the effect of rotation speed of the diskand the ratio of the speeds of the vial and the disk on the specific impact energy of theballs and the efficiency of milling talc in a planetary ball mill. They noted that thespecific impact energy increased with increasing speed of the disk (in the investigatedrange of 300–600 rpm). But the highest value obtained was about 15 kJ/s.kg when therotating direction was normal and as high as 80 kJ/s.kg when the disk was rotating inthe counter direction. Because of this, they concluded that rotation of the vial in thecounter direction to the revolution of the disk was more effective in fine grinding ofmaterials as well as its mechanochemical activation. As an example, they showed thattalc amorphized in 2 min when milling was done in the counter direction, and it tookmore than 8 min when milling was done in the normal direction. It was also reportedthat the specific impact energy of the balls increase rapidly with the ratio of therotation (of the vial) and revolution (of the disk) speeds when milled in the counterdirection, whereas for the normal direction there was only a gradual (and slow)increase. At a critical speed ratio the specific energy of the balls reached the highestvalue; therefore, it is desirable to mill the powder at that ratio. This ratio is dependenton the radius of the revolving disk but is about 2 in majority of the cases.
Some investigators prefer to use the term milling intensity rather than millingspeed ormilling energy to describe the phase changes that take place on alloying. Chenet al. [24] defined the intensity of milling as a function of BPR (=Mb/Mp), and velocityand frequency of the balls as:
I ¼ MbVmax f
Mpð5:1Þ
where Mb is the mass of the ball, Vmax is the maximum velocity of the ball, f is theimpact frequency, andMp is mass of the powder in the vial. Thus, the milling intensityincreases rapidly with the impact frequency, velocity, and mass of the balls. Using thisas a parameter, Pochet et al. [25] established the dependence of the induced order–disorder transformation on milling intensity and milling temperature. Gonzalez et al.[26] modified the SPEX mill to vary the frequency of vibration in the range of 1000–3500 Hz. They noted that at high impact frequencies (3000 rpm), a solid solutionformed in an Fe-15 wt% Al powder mix after 1 h of milling, whereas at the lowerfrequencies (1800 rpm), alloy formation was not complete even after 5 h of milling.Thus, for the same mill and balls, alloy formation could be achieved in shorter millingperiods at higher frequencies.
Calka et al. [27] reported that when vanadium and carbon powders were milledtogether at different energy levels (by adjusting the positions of themagnets in theUni-Ball mill), the final constitution of the powder was different. For example, at very low
MD: SURYANARAYANA, JOB: 03320, PAGE: 62
4103-X_Suryanarayana_Ch05_R2_071504
Chapter 562

milling energy (or speed), the powder consisted of nanometer-sized grains of vanadiumand amorphous carbon, which on annealing formed either V2C or a mixture of V +VC. At an intermediate energy level, the as-milled powder contained a nanostructure,which on annealing transformed to VC. At the highest energy level, the carbide phase,VC formed directly on milling. Similarly, a fully amorphous phase formed in a Ni-Zrpowdermixture at highmilling energywhereas amixture of crystalline and amorphousphases formed at low and intermediate milling energies [28].
El-Eskandarany et al. [29] studied the effect of milling speed in a FritschPulverisette 5 mill. They reported that the time required for the formation of anamorphous phase in the Co-Ti system decreased with an increase in the rotation speed.For example, while it took 200 h for the formation of the amorphous phase at a speedof 65 rpm, it took only 100 h at 125 rpm and 24 h at 200 rpm. They had observed acyclic crystalline-amorphous-crystalline transformation on continued milling.
The effect of milling speed during milling of an Fe-7 wt% C-6 wt%Mn powderblend in a planetary ball mill was investigated at three different speeds of 80, 100, and120 rpm by Rochman et al. [30]. They noted that the solid solubility of carbon in ironincreased with increasing speed of operation of the mill for the same milling time. Forexample, they reported that on 100 h of milling, the solid solubility of C in a-Fe was0.2 at% at 80 rpm, 0.5 at% at 100 rpm, and 1.3 at% at 120 rpm. (The highest solidsolubility of C in a-Fe was mentioned as 1.3 wt% (not at%) in an earlier reference[31].)
Eckert et al. [32] reported that the nature of the phase formed in the mechan-ically alloyed Al-Cu-Mn powder blend was different depending on the intensity ofmilling in the Fritsch Pulverisette 5. They reported that an amorphous phase formedwhen the blended elemental powder mix was milled at an intensity of 5, and anequilibrium intermetallic phase formed at an intensity of 9. A quasi-crystalline phaseformed at intermediate intensities. These results were explained on the basis of theincreased temperature experienced by the powder at higher milling intensities. Detailsof these investigations on the effect of process variables will also be discussed in theindividual sections on the phases formed during milling.
Riffel and Schilz [33] investigated the alloying behavior of Mg and Si powders ina planetary ball mill and examined the optimal conditions for synthesizing the Mg2Siintermetallic. They noted that an improvement in the mill setting could be obtained bychanging the ratio of the angular velocity of the planetary wheel, N, to the systemwheel angular velocity,V. A ratio N/V of at least 3 was found to be necessary to offsetthe effects of slip.
Bab et al. [34] investigated the absorption of nitrogen in Hf during MA in aRetsch MM2 horizontal oscillatory ball mill and noted that the amount of nitrogenabsorbed at a frequency of 21Hzwas several times smaller than for higher frequencies,suggesting that nitrogen diffusion into the metal lattice was limited by the productionrate of fresh surfaces and lattice defects during milling. Delogu et al. [35] noted thatvariation inmilling intensity only affected the rate at which the reaction took place andnot the basic features of the transformation process. A similar result was also reportedfor a ternary Cu-Fe-Co powder blend by Galdeano et al. [36], who noted that therewas no significant effect of milling intensity on the as-milled nanostructure.
Gerasimov et al. [37] conducted MA of Zr-Co alloys in a planetary ball mill ataccelerations of 300, 600, and 900 m/s2 and also using steel balls of 5, 7, and 10 mmdiameter. They observed that increased kinetic energy of the balls due to an increase in
MD: SURYANARAYANA, JOB: 03320, PAGE: 63
4103-X_Suryanarayana_Ch05_R2_071504
Process Variables in Milling 63

their diameter and/or rotating speed of the vials led to a rise in the degree ofcrystallinity of the milled samples. Accordingly, the blended elemental powder mixof Zr-33 at% Co became completely amorphous only under the ‘‘softest’’ millingconditions—a centrifugal acceleration of 300m/s2 and a ball diameter of 5 mm.Underall other milling conditions, amorphization was either incomplete or a mixture ofequilibrium crystalline phases was obtained [37].
Mechanical alloying and milling (MA/MM) are important processing tech-niques to synthesize metastable phases, including amorphous phases, supersaturatedsolid solutions, and others. However, it has been shown repeatedly that only ‘‘soft’’milling conditions (i.e., low milling energy, lower BPR values, smaller size, and lightergrinding media) produce metastable phases in general, and less metastable (includingequilibrium) phases are produced when ‘‘hard’’ milling conditions are employed[2,37–41]. For example, a metastable high-pressure cubic phase formed on milling aCu-In-Ga-Se powder mixture at 150 rpm in a Fritsch Pulverisette 5, while theequilibrium tetragonal phase had formed on milling the powder mix at 300 rpm [2].
5.5 MILLING TIME
The time of milling is one of the most important parameters in milling of powders.Normally the time is chosen to achieve a steady state between fracturing and coldwelding of powder particles to facilitate alloying. The times required vary dependingon the type of mill used, mill settings, intensity of milling, BPR, and temperature ofmilling. The necessary times have to be decided for each combination of the aboveparameters and for the particular powder system under consideration. However, itshould be realized that the level of contamination increases and some undesirablephases form if the powder is milled for much longer than required, especially inreactive metals like titanium and zirconium [42]. Therefore, it is desirable that thepowder bemilled just for the required duration and no longer. As a general rule, it maybe appreciated that the times taken to achieve the steady-state conditions are short forhigh-energymills and longer for low-energymills. Again, the times are shorter for highBPR values and longer for low BPR values.
5.6 GRINDING MEDIUM
In this section we discuss details about the efficiency of alloying based on the nature ofthe grinding medium as well as its size and size distribution. Hardened steel, tool steel,hardened chromium steel, tempered steel, stainless steel,WC-Co, and bearing steel arethe most common types of materials used for the grindingmedium. (See Table 12.1 fordetails of the grinding media used in different investigations during amorphous phaseformation.) The density of the grinding medium should be high enough that the ballscreate enough impact force on the powder to affect alloying. However, as in the case ofthe grinding vessel, some special materials are used for the grinding medium; theseinclude copper [2], titanium [4], niobium [43], zirconia (ZrO2) [44,45], agate [11,12],YSZ [5], partially stabilized zirconia + yttria [6,7], sapphire [9], silicon nitride (Si3N4)[13], and Cu-Be [18]. It is desirable, when possible, to have the grinding vessel and thegrinding medium made of the same material as the powder being milled to avoid crosscontamination of the milled powder (see also Chapter 15).
MD: SURYANARAYANA, JOB: 03320, PAGE: 64
4103-X_Suryanarayana_Ch05_R2_071504
Chapter 564

The material of the grinding medium is an important variable. The higher thedensity of the grinding medium, the more kinetic energy it acquires during milling andthis can be transferred to the powder. Thus, WC balls are frequently used, instead ofsteel, to generate higher impact energy. Gonzalez et al. [46] compared the millingefficiencies of steel and WC grinding media during milling of Fe-50 at% Co powdersand noted that a solid solution of Co in Fe formed after 5 h of milling in both cases.However, they noted differences in the microstructural features of the final powders.They reported that when steel grinding medium was used, a kneading process wasobserved; small powder particles of q-Fe (a high-pressure form of iron) wereembedded into larger agglomerates, i.e., a heterogeneous structure was obtained.On the other hand, when WC grinding medium was used, stronger attrition effect wasnoted; the powder particles were more fragmented and isolated. They also observedthat small oxide particles were observed in the powders milled with WC tools, whichshowed a superparamagnetic effect not observed with steel balls. This is an expectedresult. But, the same authors also noted in another investigation [47] that milling ofFe-27 at% Al powders with a BPR of 8:1 resulted in alloying after 3 h with steel balls,whereas it required 5 h with the WC balls. Generally, it is expected that the heaviergrinding medium (WC in this case) imparts more kinetic energy to the powder and soalloying should have occurred faster. This is a surprising result, but the authors ascribeit to possible differences in the input energies of the two different grinding media.
The size of the grinding medium also has an influence on the milling efficiency.Generally speaking, a larger size (and higher density) of the grinding medium is usefulsince the larger weight of the balls transfers more impact energy to the powderparticles. It has also been reported that the final constitution of the powder isdependent on the size of the grinding medium used for milling. For example, whenballs of 15 mm diameter were used to mill the blended elemental Ti-Al powdermixture, a solid solution of aluminum in titanium was formed. On the other hand, useof 20- and 25-mm-diameter balls resulted in a mixture of only the titanium andaluminum phases (and no alloying occurred), even after a long milling duration [48].In another set of investigations [49,50] it was reported that an amorphous phase couldbe produced faster in Ti-Al alloys by using steel balls of 3/16 in. diameter than by usingballs of 3/4 in. diameter. In fact, in some cases an amorphous phase was not producedand only the stable crystalline compound formed when milling was done with largesteel balls [49]. In yet another investigation it was reported that an amorphous phaseformed only when the Ti-Al powder mixture was milled using either 5- or 8-mm-diameter balls; an amorphous phase did not form when 12-mm-diameter balls wereused for milling [39,50]. A similar situation was also reported in the Pd-Si systemwhere it was reported that a smaller ball size favored amorphous phase formation [38].It was suggested that the smaller balls produced intense frictional action, whichpromoted the amorphous phase formation.
It was also reported [51] that use of smaller balls (4.8 mm diameter) resulted inthe formation of larger amounts of Cr-based solid solution than with larger balls (8.8mm diameter). It was suggested that the larger balls produced a higher temperature,which resulted in decomposition of the metastable solid solution. They also reportedthat the grain size of the solid solution was finer when smaller balls were used. Fasterkinetics also is expected when larger balls are used because the impact energy ishigher [26].
MD: SURYANARAYANA, JOB: 03320, PAGE: 65
4103-X_Suryanarayana_Ch05_R2_071504
Process Variables in Milling 65

In fact, as mentioned earlier, it appears that soft milling conditions (smaller ballsizes, lower energies, and lower BPR) favor formation of metastable phases (amor-phous or metastable crystalline phases), while the hard milling conditions allow theformation of less metastable or even the equilibrium phases [2,37–39,52].
Even though most of the investigators generally use only one size of the grindingmedium, there have been instances when different sized balls have been used in thesame experiment [53]. It has been predicted that the highest collision energy can beobtained if balls with different diameters are used [54], most likely due to theinterference between balls of different diameters. In the initial stages of milling thepowder being milled gets coated onto the surface of the grinding medium and also getscold welded. This is advantageous because it prevents excessive wear of the grindingmedium and prevents contamination of the powder due to the wear of the grindingmedium. However, the thickness of this layer must be kept to a minimum to avoidformation of a heterogeneous final product [55]. The disadvantage of this powdercoating is that it is difficult to detach this and so the powder yield is low. It has alsobeen reported that a combination of large and small balls during milling minimizes theamount of cold welding and the amount of powder coated onto the surface of the balls[56]. Although no specific explanation has been given for the improved yield underthese conditions, it is possible that the different sized balls produce shearing forces thatmay help in detaching the powder from the surface of the balls.
A different effect is also reported on the use of a mixture of different sizes of thegrinding balls [33]. By investigating the synthesis of Mg2Si from an elemental mixtureofMg and Si under different experimental conditions, it was noted that the best resultswere obtained on milling with 10-mm-diameter hardened steel balls. Use of largerdiameter balls led to a significant increase in iron contamination, whereas milling withsmaller diameter balls did not produce enough kinetic energy to achieve alloying.More specifically, they observed that a mixture of different sizes of the balls did notimprove the milling process, noting that if there were large differences in the sizes ofthe balls, the smaller balls could even be destroyed by the larger ones.
Use of grinding balls of the same size in either a round- or a flat-bottomed vialhas been shown to produce tracks. Consequently, the balls roll along a well-definedtrajectory instead of hitting the end surfaces randomly. Therefore it is necessary to useseveral balls, generally a combination of smaller and larger balls, to ‘‘randomize’’ themotion of the balls [20].
5.7 BALL-TO-POWDER WEIGHT RATIO
The ratio of the weight of the balls to the powder (BPR), sometimes referred to ascharge ratio (CR), is an important variable in the milling process. This has been variedby different investigators from a value as low as 1:1 [57] to one as high as 1000:1 [58].Very high values of BPR are uncommon, and values such as 1000:1 or 220:1 [59] areused only in special cases to achieve certain desired features or to achieve the effectsfaster. Even though a ratio of 10:1 is most commonly used while milling the powder ina small capacity, high-energymill such as a SPEXmill, BPR values ranging from 4:1 to30:1 have been generally used.However, whenmilling is conducted in a large-capacity,low-energy mill, like an attritor, a higher BPR of up to 50:1 or occasionally even 100:1is used to achieve the desired alloying in a reasonable time. Increased BPR values canbe obtained either by increasing the number (weight) of balls or decreasing the powder
MD: SURYANARAYANA, JOB: 03320, PAGE: 66
4103-X_Suryanarayana_Ch05_R2_071504
Chapter 566

weight. Higher BPR can also be obtained (for the same number of balls) either byincreasing the diameter of the balls or by using higher density materials such as WCrather than steel.
The BPR has a significant effect on the time required to achieve a particularphase in the powder being milled. The higher the BPR, the shorter is the time required,and this has been repeatedly shown to be true in a number of instances. For example,formation of an amorphous phase was achieved in a Ti-33 at% Al powder mixturemilled in a SPEX mill in 7 h at a BPR of 10:1, in 2 h at a BPR of 50:1, and in 1 h at aBPR of 100:1 [60]. Similarly, it has been shown [61] that milling of an Al50Si30Fe15Ni5powder mix for 40 h at a BPR of 15:1 produced similar results to milling for 95 h at aBPR of 10:1. It was also reported [47] that no alloying occurred in an Fe-Al powdermixture at a BPR of 1:1 when either steel or WC grinding medium was used; alloyingoccurred at a BPR of 8:1 in 3 h for steel and 5 h for WC medium. At a high BPR,because of an increase in the weight proportion of the balls, the mean free path of thegrinding balls decreases and the number of collisions per unit time increases.Consequently, more energy is transferred to the powder particles resulting in fasteralloying. Several other investigators also have reported similar results [46]. It is alsopossible that due to the higher energy more heat is generated and this could raise thepowder temperature resulting in faster kinetics of alloying. Alternatively, the highertemperature could change the constitution of the powder. In an extreme situation, theamorphous phase formed may even crystallize if the temperature rise is substantial, orthe supersaturated solid solution formed could decompose to precipitate eithertransition or equilibrium phases or even achieve complete equilibration.
It will be shown later that the crystallite size duringmilling decreases withmillingtime. It has been frequently reported that the BPR has a significant influence on therate of decrease of the crystallite size. Figure 5.1a shows that the crystallite sizedecreases with milling time and that the rate of decrease is higher for higher BPRvalues [62]. The shape of the grinding medium does not seem to have any effect on therate of decrease of crystallite size. It may be noted from Figure 5.1b that whether ballsor rods are used, the rate of crystallite size reduction simply increases with increasingBPR.
It may be appreciated that use of higher BPR results in a faster refinement of thecrystallite size, but the amount of powder synthesized is low. On the other hand, use ofa lower BPR increases the amount of powder produced, but the time required to reachthe same crystallite size is longer. Thus, optimization of BPR and milling time shouldbe done to achieve a particular crystallite size in a reasonable time.
A detailed study of the effect of BPR on the powder hardness and mean particlesize was conducted by Niu [63]. It was observed that the microhardness of the powderincreased with increasing BPR due to an enhanced and accelerated plastic deforma-tion of the powder particles. However, the rate of increase in the microhardness waslower at higher BPR values. The mean particle size, on the other hand, was found todecrease initially when the BPR was increased from 2:1 to 5:1, and then it started toincrease to its maximal value when the BPR was increased to 11:1; a steady decreasewas observed with further increase in the BPR. The powder morphology was alsodifferent at these different BPR values—flaky at 3:1, equiaxed at 10:1 or higher, andflaky plus equiaxed at intermediate values.
As mentioned earlier, soft conditions (e.g., low BPR values, low speeds ofrotation, etc.) during MA produce metastable phases, whereas hard conditions
MD: SURYANARAYANA, JOB: 03320, PAGE: 67
4103-X_Suryanarayana_Ch05_R2_071504
Process Variables in Milling 67

produce the equilibrium or near-equilibrium phases. In a similar manner, it was alsoreported that the BPR value has a significant effect on the occurrence of the SHS (self-propagating high-temperature synthesis) reactions. Lower BPR values and shortertimes induced the SHS reaction in an Al-Zr powder blend, whereas higher BPR didnot induce the SHS reaction [64].
Proper selection of the BPR is important. In general, the higher the BPR, thefaster is the MA process. However, this faster processing also can introduce highcontamination levels into the powder, and this should be avoided or at leastminimized.
5.8 EXTENT OF FILLING THE VIAL
Since alloying among the powder particles occurs mainly due to impact forces exertedon them, it is necessary that there be enough space for the balls and the powderparticles to move around freely in the milling container. Therefore, the extent of filling
MD: SURYANARAYANA, JOB: 03320, PAGE: 68
4103-X_Suryanarayana_Ch05_R2_071504
Figure 5.1 (a) Variation of crystallite size with milling time and ball-to-powder weight ratio(BPR). Note that the crystallite size decreases with increasing milling time and that the rate of
decrease is higher at higher BPR values [62]. (b) The shape of the grinding medium does notappear to affect the rate of decrease of crystallite size. Note that the rate of decrease followsthe same trend whether balls or rods are used [62].
Chapter 568

the vial with the powder and the balls is important. If the quantity of the balls and thepowder is very small, then the production rate is very low. On the other hand, if thequantity is large, then there is not enough space for the balls to move around and sothe energy of the impact is less. Consequently, alloying may not occur, and even if itoccurs, it may take a very long time. Thus, care must be taken not to overfill the vial;generally about 50% or a little more of the vial space is left empty.
5.9 MILLING ATMOSPHERE
The MA process is normally conducted under vacuum or in an inert atmosphere toprevent/minimize oxidation and/or contamination of the milled powder. The majoreffect of the milling atmosphere is on the nature and extent of contamination of thepowder. Therefore, powders are milled generally in containers that have been evac-uated or filled with an inert gas such as argon or helium. (Nitrogen has been found toreact with metal powders to produce nitride phases and consequently cannot be usedto prevent contamination during milling, unless one is interested in producingnitrides.)
Normally, loading and unloading of the powders into the vial is carried outinside evacuated or atmosphere-controlled glove boxes. These glove boxes are usuallyrepeatedly evacuated and refilled with an inert gas such as argon. Some investigatorshave even conducted the milling operation in mills that have been placed insideevacuated glove boxes [65]. This would prevent the atmosphere from contaminatingthe powder in the container during milling. An alternative method is to load thepowder into the container in air but to evacuate the container before starting to millthe powder [66]; this is much less convenient than the other methods and may notalways be possible.
High-purity argon is the most common ambient used to prevent oxidation and/or contamination of the powder. It has also been noted that oxidation can be generallyprevented or minimized in the presence of nitrogen ambient. But this does not appearto be true when reactive powders such as titanium or its alloys are milled. It has beenreported that Ti-48Al-2W (at%) powders milled in an oxygen atmosphere picked up1.5 wt% oxygen after 20 h of milling. The same powder milled for the same length oftime, but in a nitrogen atmosphere, picked up 4.7 wt% oxygen [67]—a difficult toexplain observation.
Different atmospheres have been used during milling for specific purposes.Nitrogen or ammonia atmosphere has been used to produce nitrides [68,69]. Hydro-gen atmosphere was used to produce hydrides [70]. The presence of air in the vial hasbeen shown to produce oxides and nitrides in the powder, especially if the powders arereactive in nature. Thus, care must be taken to use an inert atmosphere during milling.
In addition to contaminating the powder, the milling atmosphere influences thekinetics of alloying, transformation behavior, and the nature of the product phase. Itwas reported that the crystallization temperature of the Ni60Nb40 amorphous alloyprepared in air was lower than that prepared in a helium atmosphere, a directconsequence of the increased oxygen content [71]. A similar observation was madein theMo-Ni system [1]. The transformation paths were found to be different when theNi60Ti40 alloy powder mix was processed in different types of atmospheres—argon,air, or nitrogen [72–75]. It has been reported that an amorphous phase could beobtained by directly milling the Ni-40 at% Ti powder mix in an argon atmosphere.
MD: SURYANARAYANA, JOB: 03320, PAGE: 69
4103-X_Suryanarayana_Ch05_R2_071504
Process Variables in Milling 69

Nitrogen was shown to have only a slight effect. But oxygen, even though present insmall quantities, had a significant effect and no amorphous phase was formed; insteadNi-Ti crystalline intermetallic phases and oxide phases were formed.
The type of atmosphere also seems to affect the nature of the final phase. Forexample, it was shown that when Cr-Fe powder mixtures were milled in different typesof atmosphere, the constitution of the final powder was different [76]. When thepowder wasmilled in an argon atmosphere, no amorphous phase formed andCr peakscontinued to be present in the XRDpatterns. On the other hand, when the powder wasmilled in either air containing argon or a nitrogen atmosphere, the powder becamecompletely amorphous. Similarly, oxygen was shown to enhance the kinetics ofamorphization in theNi-Nb system [77]. It was also reported [78] that alloying betweenNi andNb did not take place whenmilling was done in water, alcohol, or acetone. TheNbmetal formed a bcc phase, identified as an interstitial phase of oxygen in a niobiummatrix. On the other hand, when argon was used, the authors noted formation of asupersaturated solid solution of Nb in Ni up to 15 at% Nb.
5.10 PROCESS CONTROL AGENTS
The powder particles get cold welded to each other, if they are ductile and sometimesexcessively, due to the heavy plastic deformation they undergo during milling. How-ever, true alloying among powder particles can occur only when a balance is main-tained between cold welding and fracturing of powder particles. A process controlagent (PCA) (also referred to as lubricant or surfactant) is added to the powdermixture during milling to reduce the effect of excessive cold welding. PCAs can besolid, liquid, or gaseous. They are mostly, but not necessarily, organic compounds,which act as surface-active agents. They adsorb on the surface of the powder particlesand minimize cold welding among powder particles, thereby inhibiting agglomera-tion. The surface-active agents adsorbed on particle surfaces interfere with coldwelding and lower the surface tension of the solid material. The energy required forthe physical process of size reduction, E, is given by
E ¼ g: DS ð5:2Þ
where g is the specific surface energy and DS is the increase in surface area. Thus, areduction in the surface energy results in the use of shorter milling times to obtain aparticular particle size. Alternatively, finer powder particles will be generated for thegiven milling duration.
5.10.1 Nature of PCAs
Awide range of PCAs has been used in practice at a level of about 1–5 wt%of the totalpowder charge. Themost important PCAs include stearic acid, hexane, methanol, andethanol. A partial listing of the PCAs used in different investigations and theirquantities is presented in Table 5.1. In addition, other exotic PCAs such as sodium-1,2-bis(dodecylcarbonyl)ethane-1-sulfonate, lithium-1,2-bisdodecyloxycarbonylsul-fasuccinate, didodecyldimethylammonium acetate (DDAA), didodecyldimethylammonium bromide (DDAB), trichlorotrifluoroethane, and others such as polyeth-ylene glycol, dodecane, ethyl acetate, oxalic acid, boric acid, borax, alumina, andaluminum nitrate have also been used. Most of these compounds have low melting
MD: SURYANARAYANA, JOB: 03320, PAGE: 70
4103-X_Suryanarayana_Ch05_R2_071504
Chapter 570

and boiling points (Table 5.2) [124], and consequently they either melt or evaporateduring milling owing to the temperature increase. Furthermore, they decomposeduring milling, interact with the powder and form interstitial compounds, and theseget incorporated in the form of inclusions and/or dispersoids into the powder particlesduring milling. Thus, hydrocarbons containing hydrogen and carbon, and carbohy-drates containing hydrogen, carbon, and oxygen are likely to introduce carbon and/oroxygen into the powder particles, resulting in the formation of carbides and oxides,
MD: SURYANARAYANA, JOB: 03320, PAGE: 71
4103-X_Suryanarayana_Ch05_R2_071504
Table 5.1 Process Control Agents and the Quantities Used in Different SelectedInvestigations
Process control agent Chemical formula Quantity Selected ref.
Alcohol — — 79
Benzene C6H6 — 80, 81C wax H35C17CONHC2H4NHC
OC17H35
1.5 wt% 82
Cyclohexane — — 83
Didodecyl dimethylammonium acetate
C28H59NO2 — 84
Dihexadecyl dimethyl
ammonium acetate
C36H75NO2 — 84
Dodecane CH3(CH2)10CH3 — 85Ethanol C2H5OH 4 wt% 86
Ethyl acetate CH3CO2C2H5 — 87, 88EthylenebisdistearamideNopcowax–22 DSP
C2H2-2(C18H36ON) 2 wt% 89
Graphite C 0.5 wt% 87, 90Heptane CH3(CH2)5CH3 0.5 wt% 91, 92Hexane CH3(CH2)4CH3 — 80, 84, 93–95
5 wt% 96, 97
Lithium-1,2 bisdodecyloxy-carbonyl sulfasuccinate
— — 84
Methanol CH3OH — 98–103
1 wt% 1043 wt% 1054 wt% 106
Octane CH3(CH2)6CH3 1 wt% 107Paraffin — — 108Petrol 3 drops 111Polyethylene glycol HO(CH2CH2)nOH 0.5–2 wt% 109, 110
Silicon grease — — 108Sodium chloride NaCl 2 wt% 112Sodium-1,2 bis(dodecyl
carbonyl) ethane-1-sulfonate
— — 84
Stearic acid CH3(CH2)16COOH 1 wt% 113–1164 wt% 117
0.5–3 wt% 110Tetrahydrofuran — — 80Toluene C6H5CH3 5 ml 118–122
Vacuum grease — — 123
Process Variables in Milling 71

which are uniformly dispersed in the matrix. These are not necessarily harmful to thealloy system since they can contribute to dispersion strengthening of the materialresulting in increased strength and higher hardness [125]. The hydrogen subsequentlyescapes as a gas or is absorbed into the metal lattice on heating or sintering. Eventhough hydrogen gas primarily serves as a surfactant and does not usually participatein the alloying process [126], some reports indicate that hydrogen acts as a catalyst foramorphous phase formation in titanium-rich alloys [127,128]. In some other cases,hydrogen assists in embrittling the powders and consequently finer particles could beproduced. It has also been reported that PCAs affect the final phase formation,changing the solid solubility levels [129], modifying the glass-forming range [102,129,130], and altering the contamination levels.
The presence of air in the milling container or milling of powders at very lowtemperatures (cryomilling) also has been shown to minimize welding, most probablydue to the increased brittleness of the powder particles at such low temperatures[131,132]. Metal powders (with an fcc structure) milled in a hydrogen atmospherebecome brittle and do not stick to themselves or the container, probably due to theformation of a hydride phase [133].
5.10.2 Quantity of PCA
The quantity of PCA used and the type of powder milled determine the final size,shape, and purity of the powder particles. Zhang et al. [110] used two different PCAs—stearic acid and polyethylene glycol—in the range 0.5–4.0 wt% of the powder weightto investigate their effect on the size of the powder particles of aluminum andmagnesium mechanically milled in a planetary ball mill. It was noted that the amountof the powder recovered increased with increasing amount of PCA and that longermilling times led to an increase in the amount of the powder recovered. This wasattributed to the decreased proportion of cold welding due to the use of the PCA andconsequent increase in the fracturing of powder particles. The authors have also notedthat the efficiency of reducing the particle size was better with stearic acid than withpolyethylene glycol. Stated differently, the amount of polyethylene glycol required toachieve a particular particle size is higher than the amount of stearic acid.
The quantity of PCA used is another important variable. It was reported [110]that the particle size increased for small quantities of PCA. However, with the use of
MD: SURYANARAYANA, JOB: 03320, PAGE: 72
4103-X_Suryanarayana_Ch05_R2_071504
Table 5.2 Melting and Boiling Points of the Different Process Control Agents Used in
Mechanical Alloying
PCA Melting point (jC) Boiling point (jC)
Dodecane �12 + 216.2Ethyl acetate �84 + 76.5–77.5Ethyl alcohol �130 + 78
Ethylenebisdistearamide 141 + 259Heptane �91 + 98Hexane �95 + 68–69
Methyl alcohol �98 + 64.6Polyethylene glycol 59 + 205Stearic acid 67–69 + 183–184
Chapter 572
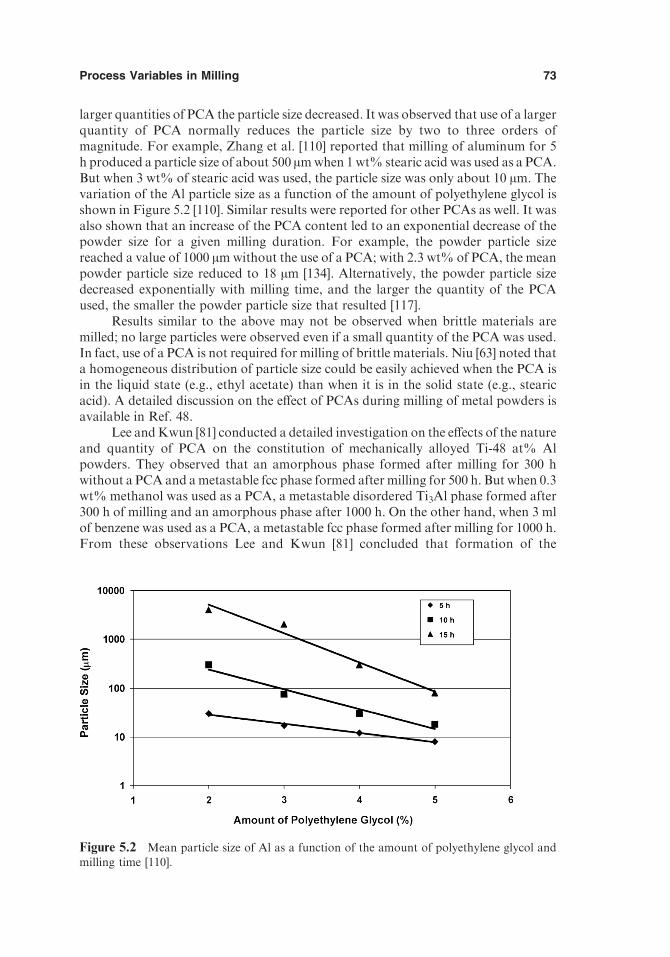
larger quantities of PCA the particle size decreased. It was observed that use of a largerquantity of PCA normally reduces the particle size by two to three orders ofmagnitude. For example, Zhang et al. [110] reported that milling of aluminum for 5h produced a particle size of about 500 Amwhen 1 wt% stearic acid was used as a PCA.But when 3 wt% of stearic acid was used, the particle size was only about 10 Am. Thevariation of the Al particle size as a function of the amount of polyethylene glycol isshown in Figure 5.2 [110]. Similar results were reported for other PCAs as well. It wasalso shown that an increase of the PCA content led to an exponential decrease of thepowder size for a given milling duration. For example, the powder particle sizereached a value of 1000 Amwithout the use of a PCA; with 2.3 wt% of PCA, the meanpowder particle size reduced to 18 Am [134]. Alternatively, the powder particle sizedecreased exponentially with milling time, and the larger the quantity of the PCAused, the smaller the powder particle size that resulted [117].
Results similar to the above may not be observed when brittle materials aremilled; no large particles were observed even if a small quantity of the PCA was used.In fact, use of a PCA is not required for milling of brittle materials. Niu [63] noted thata homogeneous distribution of particle size could be easily achieved when the PCA isin the liquid state (e.g., ethyl acetate) than when it is in the solid state (e.g., stearicacid). A detailed discussion on the effect of PCAs during milling of metal powders isavailable in Ref. 48.
Lee andKwun [81] conducted a detailed investigation on the effects of the natureand quantity of PCA on the constitution of mechanically alloyed Ti-48 at% Alpowders. They observed that an amorphous phase formed after milling for 300 hwithout a PCA and ametastable fcc phase formed after milling for 500 h. But when 0.3wt% methanol was used as a PCA, a metastable disordered Ti3Al phase formed after300 h of milling and an amorphous phase after 1000 h. On the other hand, when 3 mlof benzene was used as a PCA, a metastable fcc phase formed after milling for 1000 h.From these observations Lee and Kwun [81] concluded that formation of the
MD: SURYANARAYANA, JOB: 03320, PAGE: 73
4103-X_Suryanarayana_Ch05_R2_071504
Figure 5.2 Mean particle size of Al as a function of the amount of polyethylene glycol and
milling time [110].
Process Variables in Milling 73

metastable fcc phase was caused by atomic penetration of carbon and/or hydrogenatoms into the interstitial sites of the lattice. They also noted that the activation energyfor crystallization of the amorphous phase increased (from 281 kJ/mol without a PCAto 411 kJ/mol when 3 wt% methanol was used) as the number of impurity atoms,especially oxygen, in the PCA increased.
5.10.3 Constitution of the Milled Powder
The use of a PCA can also alter the constitution of the final milled powder. It wasreported that milling of gas-atomized Fe82Nb6B12 powder for 220 h, using cyclohex-ane as a PCA, resulted in the formation of an amorphous phase [83]. However, theauthors noted that the carbon content in the milled amorphous powder was as high as11 wt%. Consequently, when milling was done without cyclohexane (to avoid carboncontamination), only the iron solid solution was obtained, with no detectable amor-phous phase in the material.
The results reported on the effect of the amount of PCA used on the kinetics ofalloying are not consistent. Some investigators reported that alloying takes place morequickly whereas others reported that the kinetics is slowed down. When only a smallquantity of the PCA is used, the surface area of the powder particles covered by it islimited. Therefore, excessive cold welding still takes place and alloying does not occur.On the other hand, when sufficient PCA is available to cover the whole surface area ofthe powder particles, then excessive cold welding does not take place, a balance isachieved between cold welding and fracturing, and alloying occurs rapidly.
It is also possible in some cases that when a small amount of PCA is used itcannot cover the whole surface area of the powder particles, so that alloying takesplace more quickly due to direct contact between the reactant particles. That is, thekinetics of alloying is faster. A large amount of PCA may cover the surfaces of all theparticles preventing direct contact between the components and possibly preventingrapid alloying. To prove this point it was shown that the fraction of the Al3Mg2 phaseformed during milling of Al-Mg powders in a planetary ball mill was 0.3 when 1 wt%PCAwas used, 0.28 with 2 wt%, PCA, and only 0.07 with 4 wt% PCA [117]. Thus, thequantity of the PCA is an important variable.
The powder particles produced are large when very small quantities of PCA areused. It was reported that when only 0.5 wt% PCA (stearic acid) is used, the particlesize of Al was reported to be as large as 3–6 mm after 10 h of MA [117]. A minimalconcentration of PCA is required during alloying. Below this value the particle sizeproduced is large, and above this the particle size is small.
Shaw et al. [135] have conducted a detailed study of the effects of stearic acid andmethanol on the MA of nanostructured Al-3Fe-2Ti-2Cr (at%) alloy powders. Theyinvestigated the effect of the nature and amount of the PCA on powder particle sizes,grain sizes, atomic level strain, lattice parameter, formation of solid solutions, andmicrostructural evolution. They have reported that 2 wt% of stearic acid couldcompletely prevent excessive cold welding even at the early stage of milling and thatthe more the PCA in the powder the smaller was the crystallite size. For example,Figure 5.3 shows the variation of the crystallite size of fcc-Al as a function of millingtime and the amount of stearic acid. It may be noted that the crystallite size decreaseswith increasing milling time at all concentrations of the PCA, but the actual crystallitesize increases as the amount of PCA increases. Between stearic acid and methanol as
MD: SURYANARAYANA, JOB: 03320, PAGE: 74
4103-X_Suryanarayana_Ch05_R2_071504
Chapter 574

PCAs, Shaw et al. [135] reported that stearic acid is more effective in reducing thecrystallite size. This was explained on the basis that a smaller quantity ofmethanol wasmore effective than stearic acid in preventing excessive cold welding of the powderparticles. This difference was related to the structure of the two molecules. For thesame weight of the PCA, methanol provides more molecular layers than stearic aciddue to its smaller molecular size, and so methanol is more effective in preventingexcessive cold welding among the powder particles. One of the important conclusionsthe authors have arrived at was that use of a PCA can prevent excessive cold welding,but at the expense of reduction in grain size, kinetics of formation of solid solutions,and rate of microstructural refinement, all of which are desired in MA processing.
On the basis of experimental observations of processing of Al and Mg powderswith stearic acid and polyethylene glycol as PCAs, Zhang et al. [110] tried to predictthe minimum amount of PCA required using the back-propagation neural networkarchitectures. The results showed a fairly good agreement between the back-propa-gation-network predictions and the experimental data.
5.10.4 Choice of PCA
The choice of a PCA for milling depends on the nature of the powder being milled andthe purity of the final product desired. The nature and amount of PCA used duringmilling would determine the final powder particle size and powder yield. In fact, oneway of determining the effectiveness of the PCA is to determine the powder yield afterMA. If the powder yield is high, the PCA is effective. If the powder yield is not high,then either the amount of PCA used is not sufficient or, more likely, it is not the rightPCA. It has been reported [48] that after milling for 15 h, only 50% of the powder wasrecovered if 2 wt% of polyethylene glycol was used, whereas almost 100% of thepowder was recovered if stearic acid was used.
MD: SURYANARAYANA, JOB: 03320, PAGE: 75
4103-X_Suryanarayana_Ch05_R2_071504
Figure 5.3 Calculated crystallite size of fcc-Al in the Al-3Fe-2Ti-2Cr (at%) powder mix with
and without stearic acid as a function of milling time [135].
Process Variables in Milling 75

It should be realized that there is no universal PCA. The amount of PCA isdependent on the (1) cold welding characteristics of the powder particles, (2) chemicaland thermal stability of the PCA, and (3) amount of the powder and grinding mediumused. The powder particle size tends to increase if the weight proportion of the PCA tothe powder is below a critical value, whereas above this value the particle size tends todecrease. One has to decide on a PCA by looking at the possible interactions betweenthe metal and the components in the PCA. A critical discussion of the role of PCAs inthe milling of Al-Cu powder mixtures is presented in Ref. 136.
5.11 TEMPERATURE OF MILLING
The temperature of milling is another important variable in deciding the constitutionof the milled powder. Since diffusion processes are involved in the formation of alloyphases, irrespective of whether the final product phase is a solid solution, intermetallic,nanostructure, or an amorphous phase, it is expected that the temperature of millingwill have a significant effect in any alloy system. For example, it was noted that theXRD pattern of Si milled in anhydrous ammonia for 48 h at 100jCwas similar to thatmilled for 168 h at room temperature [137].
There have been only a few investigations reported where the temperature ofmilling has been intentionally varied. This was done by dripping either liquid nitrogenor a nitrogen-alcohol mixture on the milling container to lower the temperature orelectrically heating the milling vial with a tape to increase the temperature of milling.These investigations were undertaken either to ascertain the effect of milling temper-ature on the variation in solid solubility levels, or to determine whether an amorphousphase or a nanocrystalline structure forms at different temperatures. During theformation of nanocrystals, it was reported that the root mean square (rms) strain inthe material was lower and the grain size larger for materials milled at highertemperatures [138]. The extent of solid solubility was reported to decrease at highermilling temperatures. For example, during planetary ball milling of a Cu-37 at% Agpowder mixture, it was noted that a mixture of an amorphous and crystalline(supersaturated solid solution) phases was obtained on milling at room temperature;instead, only a Cu-8 at% Ag solid solution was obtained on milling the powder at200jC [139]. Similar results were also reported by others in Cu-Ag [140], Zr-Al [141],and Ni-Ag [142] alloy systems and explained on the basis of increased diffusivity andequilibration effects at higher temperatures of milling.
Results different from the above were reported by Rochman et al. [31]. Theyreported that during milling of Fe-6 wt% C powder mixture at 253, 293, and 323 K,the solid solubility of C in a-Fe increased with increasing temperature, reaching amaximum value of 1.3 wt% at 323 K. They also noted that the time required to startforming a solid solution at 253 K was longer than that at 293 K, but the time to reachthe nonequilibrium solid solubility was shorter than at 293 K. Thus, the kineticsappears to be faster at 253 K than at 293 K.
There have been conflicting reports on the formation of an amorphous phase asa function of the milling temperature. As explained later, amorphization during MAinvolves formation of microdiffusion couples of the constituent powders followed by asolid-state amorphization reaction. Thus, higher milling temperatures should enhanceamorphization kinetics. This has been observed in the Ni-Ti [143] and Ni-Zr [144]systems. During the milling of a Ni-50 at% Zr powder mixture in a vibrating mill,
MD: SURYANARAYANA, JOB: 03320, PAGE: 76
4103-X_Suryanarayana_Ch05_R2_071504
Chapter 576

MD: SURYANARAYANA, JOB: 03320, PAGE: 77
4103-X_Suryanarayana_Ch05_R2_071504
Figure 5.4 (a) Grain size vs. milling time for CoZr milled at different temperatures in a SPEXmill. The shaded area represents the grain size below which the alloy becomes amorphous [148].
(b) Milling time for amorphization vs. normalized milling temperature for CoZr, NiTi, andNiZr2 intermetallics. A direct relationship exists between these two parameters.
Process Variables in Milling 77

amorphous phase formation was not observed when the powder was milled at liquidnitrogen temperature for 15 h. On the other hand, milling for the same period of timeproduced a fully amorphous phase at 200jC; a partially amorphous phase wasproduced on milling at room temperature.
Formation of an amorphous phase by MM occurs by a different mechanismthan during MA. The increase in free energy of the crystalline phase by the intro-duction of defects such as antisite chemical disorder or increased grain boundary areathrough formation of a nanocrystalline structure is considered responsible foramorphization during MM. Thus, lower milling temperatures are expected to favoramorphization. However, both increased and decreased kinetics have been reported.Shorter milling times for amorphization were reported for NiTi at 170jC than at 60jC[143]. Enhanced amorphization kinetics was also observed for NiZr2 intermetallic[16,144]. In contrast to these observations, others have reported reduced amorphiza-tion kinetics for the Ni10Zr7 and Ni11Zr9 intermetallics [145,146]. Koch et al. [147,148]also reported reduced amorphization kinetics with temperature during milling of theNiTi intermetallic. They reported that whereas it took 2 h for amorphization at liquidnitrogen temperature, it required 18 h of milling at 220jC. Similar results werereported for the CoZr and NiZr2 intermetallics. These results were rationalized on thebasis that amorphization occurred in this system due to increased grain boundaryenergy through formation of a nanocrystalline structure and that the nanocrystallinestructure formed more rapidly at lower milling temperatures. Figure 5.4a shows thevariation of grain size with milling time for CoZr milled for different times in theSPEX mill [148]. It can be easily seen that reduction in grain size occurs much morerapidly at liquid nitrogen temperature than at higher temperatures. The band repre-senting the critical grain size, below which amorphization occurs, is also included.Figure 5.4b shows a plot of the milling time for amorphization against the normalizedmilling temperature (Tmilling/Tmelting). It may be noted that the milling time foramorphization increases with increased normalized milling temperature for the NiTi,NiZr2, and CoZr intermetallics [149].
REFERENCES
1. Martinez-Sanchez, R., Estrada-Guel, I., Jaramillo-Vigueras, D., De la Torre, S. D.,Gaona-Tiburcio, C., Guerrero-Paz, J. (2002).Mater. Sci. For. 386–388:135–140.
2. Suryanarayana, C., Ivanov, E., Noufi, R., Contreras, M. A., Moore, J. J. (1999). J.
Mater. Res. 14:377–383.3. Di, L. M., Bakker, H. (1991). J. Phys. C: Condens. Matter. 3:3427–3432.4. Chu, B.-L., Chen, C.-C., Perng, T. -P. (1992).Metall. Trans. 23A:2105–2110.
5. Tokumitsu, K. (1997).Mater. Sci. For. 235–238:127–132.6. Yen, B. K., Aizawa, T., Kihara, J. (1996).Mater. Sci. Eng. A220:8–14.7. Yen, B. K., Aizawa, T., Kihara, J. (1997).Mater. Sci. For. 235–238:157–162.
8. Sherif El-Eskandarany, M. (1994). J. Alloys Compounds 203:117–126.9. Sherif El-Eskandarany, M., Sumiyama, K., Aoki, K., Masumoto, T., Suzuki, K. (1994).
J. Mater. Res. 9:2891–2898.10. Tonejc, A., Duzevic, D., Tonejc, A. M. (1991).Mater. Sci. Eng. A134:1372–1375.
11. Ohtani, T., Maruyama, K., Ohshima, K. (1997).Mater. Res. Bull. 32:343–350.12. Sherif El-Eskandarany, M. (1996).Metall. Mater. Trans. 27A:2374–2382.13. Abe, O., Suzuki, Y. (1996).Mater. Sci. For. 225–227:563–568.
MD: SURYANARAYANA, JOB: 03320, PAGE: 78
4103-X_Suryanarayana_Ch05_R2_071504
Chapter 578

14. Fukunaga, T., Nakamura, K., Suzuki, K.,Mizutani, U. (1990). J. Non-Cryst. Solids 117–118:700–703.
15. Fukunaga, T., Mori, M., Inou, K., Mizutani, U. (1991). Mater. Sci. Eng. A134:863–
866.16. Lee, C.H., Fukunaga, T., Mizutani, U. (1991).Mater. Sci. Eng. A134:1334–1337.17. Lee, C. H., Mori, M., Fukunaga, T., Sakurai, K., Mizutani, U. (1992).Mater. Sci. For.
88–90:399–406.18. Sakurai, K., Lee, C. H., Kuroda, N., Fukunaga, T., Mizutani, U. (1994). J. Appl. Phys.
75:7752–7755.
19. Harringa, J. L., Cook, B. A., Beaudry, B. J. (1992). J. Mater. Sci. 27:801–804.20. Takacs, L. (1996). In: Suryanarayana, C., et al., eds. Processing and Properties of
Nanocrystalline Materials. Warrendale, PA: TMS, pp. 453–464.
21. Kaloshkin, S. D., Tomlin, I. A., Andrianov, G. A., Baldokhin, U. V., Shelekhov, E. V.(1997).Mater. Sci. For. 235–238:565–570.
22. Kuhrt, C., Schropf, H., Schultz, L., Arzt, E. (1993). In: deBarbadillo, J. J., et al., eds.Mechanical Alloying for Structural Applications. Materials Park, OH: ASM. Interna-
tional, pp. 269–273.23. Mio, H., Kano, J., Saito, F., Kaneko, K. (2002).Mater. Sci. Eng. A332:75–80.24. Chen, Y., Bibole, M., Le Hazif, R., Martin, G. (1993). Phys. Rev. B48:14–21.
25. Pochet, P., Tominez, E., Chaffron, L., Martin, G. (1995). Phys. Rev. B52:4006–4016.26. Gonzalez, G., D’Angelo, L., Ochoa, J., Lara, B., Rodriguez, E. (2002).Mater. Sci. For.
386–388:159–164.
27. Calka, A., Nikolov, J. I., Ninham, B. W. (1993). In: deBarbadillo, J. J., et al., eds.Mechanical Alloying for Structural Applications. Materials Park, OH: ASM Interna-tional, pp. 189–195.
28. Calka, A., Radlinski, A. P. (1991).Mater. Sci. Eng. A134:1350–1353.29. Sherif El-Eskandarany, M., Aoki, K., Sumiyama, K., Suzuki, K. (2002). Acta Mater.
50:1113–1123.30. Rochman, N. T., Kuramoto, S., Fujimoto, R., Sueyoshi, H. (2003). J. Mater. Proc.
Technol. 138:41–46.31. Rochman, N. T., Kawamoto, K., Sueyoshi, H., Nakamura, Y., Nishida, T. (1999). J.
Mater. Proc. Technol. 89–90:367–372.
32. Eckert, J., Schultz, L., Urban, K. (1990). Z. Metallkde. 81:862–868.33. Riffel, M., Schilz, J. (1998). J. Mater. Sci. 33:3427–3431.34. Bab, M. A., Mendoza-Zelis, L., Damonte, L. C. (2001). Acta Mater. 49:4205–4213.
35. Delogu, F., Schiffini, L., Cocco, G. (2001).Mater. Sci. For. 360–362:337–342.36. Galdeano, S., Chaffron, L., Mathon, M. -H., Vincent, E., De Novion, C. -H. (2001).
Mater. Sci. For. 360–362:367–372.37. Gerasimov, K. B., Gusev, A. A., Ivanov, E. Y., Boldyrev, V. V. (1991). J. Mater. Sci.
26:2495–2500.38. Padella, F., Paradiso, E., Burgio, N., Magini, M., Martelli, S., Guo, W., Iasonna,
A. (1991). J. Less Common Metals 175:79–90.
39. Guo,W., Iasonna,A.,Magini,M.,Martelli, S., Padella, F. (1994). J.Mater. Sci. 29:2436–2444.
40. Ahn, J. H., Zhu, M. (1998).Mater. Sci. For. 269–272:201–206.
41. Kaloshkin, S. D. (2000).Mater. Sci. For. 342–346:591–596.42. Suryanarayana, C. (1995). Intermetallics 3:153–160.43. Larson, J. M., Luhman, T. S., Merrick, H. F. (1977). In: Meyerhoff, R. W., ed.
Manufacture of SuperconductingMaterials. Materials Park, OH: ASM International, pp.155–163.
44. Biswas, A., Dey, G. K., Haq, A. J., Bose, D. K., Banerjee, S. (1996). J. Mater. Res. 11:599–607.
MD: SURYANARAYANA, JOB: 03320, PAGE: 79
4103-X_Suryanarayana_Ch05_R2_071504
Process Variables in Milling 79

45. Katamura, J., Yamamoto, T., Qin, X., Sakuma, T. (1996). J. Mater. Sci. Lett. 15:36–37.46. Gonzalez, G., Sagarzazu, A., Villalba, R., Ochoa, J., D’Onofrio, L. (2001).Mater. Sci.
For. 360–362:355–360.
47. Gonzalez, G., D’Angelo, L., Ochoa, J., D’Onofrio, L. (2001). Mater. Sci. For. 360–362:349–354.
48. Lu, L., Lai, M.O. (1998).Mechanical Alloying. Boston, MA: Kluwer.
49. Watanabe, R., Hashimoto, H., Park, Y. -H. (1991). In: Pease, L. F., Sansoucy, R. J. III,eds.Advances in PowderMetallurgy 1991. Vol. 6. Princeton, NJ:Metal Powder IndustriesFederation, pp. 119–130.
50. Park, Y.-H., Hashimoto, H., Watanabe, R. (1992).Mater. Sci. For. 88–90:59–66.51. Tcherdyntsev, V. V., Kaloshkin, S. D., Tomilin, I. A., Shelekhov, E. V., Serdyukov, V. N.
(2001).Mater. Sci. For. 360–362:361–366.
52. Liu, L., Casadio, S., Magini, M., Nannetti, C. A., Qin, Y., Zheng, K. (1997).Mater. Sci.For. 235–238:163–168.
53. Atzmon, M. (1990). Phys. Rev. Lett. 64:487–490.54. Gavrilov, D., Vinogradov, O., Shaw,W. J. D. (1995). Poursartip, A.Street, K., eds.,Proc.
Int. Conf. on Composite Materials, ICCM-10. Vol. 3. Cambridge, UK: Woodhead, p. 11.55. Gilman, P. S., Benjamin, J. S. (1983). Annu. Rev. Mater. Sci. 13:279–300.56. Takacs, L., Pardavi-Horvath, M. (1994). J. Appl. Phys. 75:5864–5866.
57. Chin, Z. H., Perng, T. P. (1997).Mater. Sci. For. 235–238:121–126.58. Umemoto, M., Liu, Z. G., Masuyama, K., Tsuchiya, K. (1999). Mater. Sci. For. 312–
314:93–102.
59. Kis-Varga, M., Beke, D. L. (1996).Mater. Sci. For. 225–227:465–470.60. Suryanarayana, C., Chen, G. H., Froes, F. H. (1992). Scripta Metall. Mater. 26:1727–
1732.
61. Sa Lisboa, R. D., Perdgao, M. N. R. V., Kiminami, C. S., Botta F, W. J. (2002).Mater.Sci. For. 386–388:59–64.
62. Eigen, N. (2003). GKSS Research Center, Geesthacht, Germany, private communica-tion.
63. Niu, X. P. (1991). PhD Thesis, Katholieke Universiteit Leuven, Belgium.64. Pallone, E.M. J. A.,Hanai,D. E., Tomasi, R., Botta F,W. J. (1998).Mater. Sci. For. 269–
272:289–294.
65. Klassen, T., Oehring, M., Bormann, R. (1997). Acta Mater. 45:3935–3948.66. Zhou, G. F., Bakker, H. (1995).Mater. Sci. For. 179–181:79–84.67. Goodwin, P. S.,Mukhopadhyay, D. K., Suryanarayana, C., Froes, F. H.,WardClose, C.
M. (1996). In: Blenkinsop, P., et al., ed. Titanium ’95. Vol. 3. London, UK: Institute ofMaterials, pp. 2626–2633.
68. Miki, M., Yamasaki, T., Ogino, Y. (1992).Mater. Trans. Jpn. Inst. Metals 33:839–844.69. Calka, A., Williams, J. S. (1992).Mater. Sci. For. 88–90:787–794.
70. Chen, Y., Williams, J. S. (1996).Mater. Sci. For. 225–227:881–888.71. Koch, C. C., Cavin, O. B., McKamey, C. G., Scarbrough, J. O. (1983). Appl. Phys. Lett.
43:1017–1019.
72. Wang,K.Y., Shen,T.D.,Quan,M.X.,Wang, J.T. (1992).J.Mater. Sci.Lett.11:129–131.73. Wang, K. Y., Shen, T. D., Quan, M. X., Wang, J. T. (1992). Scripta Metall. Mater.
26:933–937.
74. Wang, K. Y., Shen, T. D., Quan, M. X., Wang, J. T. (1992). J. Mater. Sci. Lett. 11:1170–1172.
75. Wang, K. Y., Shen, T. D., Quan, M. X., Wang, J. T. (1992). J. Non-Cryst. Solids 150:
456–459.76. Ogino, Y., Yamasaki, T., Maruyama, S., Sakai, R. (1990). J. Non-Cryst. Solids 117–118:
737–740.77. Lee, P. Y., Koch, C. C. (1987). J. Non-Cryst. Solids 94:88–100.
MD: SURYANARAYANA, JOB: 03320, PAGE: 80
4103-X_Suryanarayana_Ch05_R2_071504
Chapter 580

78. Portnoy, V.K., Fadeeva, V. I., Zaviyalova, I. N. (1995). J. Alloys Compounds 224:159–161.79. Schneider, M., Pischang, K., Worch, H., Fritsche, G., Klimanek, P. (2000).Mater. Sci.
For. 343–346:873–879.
80. Imamura, H., Sakasai, N., Kajii, Y. (1996). J. Alloys Compounds 232:218–223.81. Lee, W., Kwun, S. I. (1996). J. Alloys Compounds 240:193–199.82. Rodriguez, J. A., Gallardo, J. M., Herrera, E. J. (1997). J. Mater. Sci. 32:3535–3539.
83. Caamano, Z., Perez, G., Zamora, L. E., Surinach, S., Munoz, J. S., Baro,M. D. (2001). J.Non-Cryst. Solids 287:15–19.
84. Millet, P., Calka, A., Ninham, B. W. (1994). J. Mater. Sci. Lett. 13:1428–1429.
85. Harris, A. M., Schaffer, G. B., Page, N. W. (1993). In: deBarbadillo, J. J., et al., ed.Mechanical Alloying for Structural Applications.Materials Park,OH:ASMInternational,pp. 15–19.
86. Huang, B., Ishihara, K. N., Shingu, P. H. (1997).Mater. Sci. Eng. A231:72–79.87. Froyen, L., Delaey, L., Niu, X. P., LeBrun, P., Peytour, C. (1995). JOM 47(3):16–19.88. Lu, L., Lai, M. O., Wu, C. F., Breach, C. (1999).Mater. Sci. For. 312–314:357–362.89. Ovec�oglu, M. L., Nix, W. D. (1986). Internat. J. Powder Metall. 22:17–30.
90. Morris, D.G., Morris, M.A. (1990).Mater. Sci. Eng. A125:97–106.91. Ameyama, K., Okada, O., Hirai, K., Nakabo, N. (1995).Mater. Trans. Jpn Inst. Metals
36:269–275.
92. Suzuki, T. S., Nagumo, M. (1995).Mater. Sci. For. 179–181:189–194.93. Srinivasan, S., Desch, P. B., Schwarz, R. B. (1991). Scripta Metall. Mater. 25:2513–2516.94. Tracy, M. J., Groza, J. R. (1992). Nanostructured Mater. 1:369–378.
95. Fan, G. J., Gao, W. N., Quan, M. X., Hu, Z. Q. (1995).Mater. Lett. 23:33–37.96. Keskinen, J., Pogany, A., Rubin, J., Ruuskanen, P. (1995). Mater. Sci. Eng. A196:
205–211.
97. Revesz, A., Lendvai, J., Ungar, T. (2000).Mater. Sci. For. 343–346:326–331.98. Zdujic, M., Kobayashi, K. F., Shingu, P. H. (1990). Z. Metallkde. 81:380–385.99. Cabanas-Moreno, J. G., Dorantes, H., Lopez-Hirata, V. M., Calderon, H. A., Hallen-
Lopez, J. M. (1995).Mater. Sci. For. 179–181:243–248.
100. Lopez-Hirata, V. M., Juarez-Martinez, U., Cabanas-Moreno, J. G. (1995). Mater. Sci.For. 179–181:261–266.
101. Saji, S., Neishi, Y., Araki, H., Minamino, Y., Yamane, T. (1995).Metall. Mater. Trans.
26A:1305–1307.102. Enayati, M. H., Chang, I. T. H., Schumacher, P., Cantor, B. (1997).Mater. Sci. For. 235–
238:85–90.
103. Lopez-Hirata, V. M., Zhu, Y. H., Daucedo-Munoz, M. L., Hernandez Santiago, F.(1998). Z. Metallkde. 89:230–232.
104. Arce Estrada, E. M., Dıaz De la Torre, S., Lopez Hirata, V. M., Cabanas-Moreno, J. G.(1996).Mater. Sci. For. 225–227:807–812.
105. Li, F., Ishihara, K. N., Shingu, P. H. (1991).Metall. Trans. 22A:2849–2854.106. Kobayashi, K. F., Tachibana, N., Shingu, P. H. (1990). J. Mater. Sci. 25:801–804.107. Fair, G. H., Wood, J. V. (1993). Powder Metall. 36:123–128.
108. Kobayashi, O., Aizawa, T., Kihara, J. (1996).Mater. Trans. Jpn. Inst. Metals 37:1497–1504.
109. Lu, L., Lai, M. O., Zhang, S. (1995). Key Eng. Mater. 104–107:111.
110. Zhang, Y. F., Lu, L., Yap, S. M. (1999). J. Mater. Proc. Technol. 89–90:260–265.111. Salimon, A. I., Korsunsky, A. M., Kaloshkin, S. D., Tcherdyntsev, V. V., Shelekhov, E.
V., Sviridova, T. A. (2001).Mater. Sci. For. 360–362:137–142.
112. Hida, M., Asai, K., Takemoto, Y., Sakakibara, A. (1997). Mater. Sci. For. 235–238:187–192.
113. Wang, J. S. C., Donnelly, S. G., Godavarti, P., Koch, C. C. (1988). Int. J. PowderMetall.24:315–325.
MD: SURYANARAYANA, JOB: 03320, PAGE: 81
4103-X_Suryanarayana_Ch05_R2_071504
Process Variables in Milling 81

114. Suryanarayana, C., Froes, F. H. (1990). J. Mater. Res. 5:1880–1886.115. Wolski, K., Le Caer, G., Delcroix, P., Fillit, R., Thevenot, F., Le Coze, J. (1996).Mater.
Sci. Eng. A207:97–104.
116. Liang, G., Li, Z., Wang, E. (1996). J. Mater. Sci. 31:901–904.117. Lu, L., Zhang, Y. F. (1999). J. Alloys Compounds 290:279–283.118. McCormick, P. G. (1995).Mater. Trans. Jpn. Inst. Metals 36:161–169.
119. Pabi, S. K., Murty, B. S. (1996).Mater. Sci. Eng. A214:146–152.120. Chitralekha, J., Raviprasad, K., Gopal, E. S. R., Chattopadhyay, K. (1995). J. Mater.
Res. 10:1897–1904.
121. Murty, B. S., Joardar, J., Pabi, S. K. (1996). Nanostructured Mater. 7:691–697.122. Chattopadhyay, P. P., Pabi, S. K., Manna, I. (2001). Mater. Sci. Eng. A304–306:424–
428.
123. Hwang, S., Nishimura, C., McCormick, P. G. (2001).Mater. Sci. Eng. A318:22–33.124. Lu, Lai, M. O. (1998).Mechanical Alloying. Boston, MA: Kluwer, p. 29.125. Frazier, W. E., Koczak, M. J. (1987). Scripta Metall. 21:129–134.126. Chen, G., Wang, K., Wang, J., Jiang, H., Quan, M. (1993). In: deBarbadillo, J. J., et al.,
eds. Mechanical Alloying for Structural Applications. Materials Park, OH: ASM.International, pp. 183–187.
127. Ivison, P. K., Cowlam, N., Soletta, I., Cocco, G., Enzo, S., Battezzati, L. (1991).Mater.
Sci. Eng. A134:859–862.128. Ivison, P. K., Soletta, I., Cowlam, N., Cocco, G., Enzo, S., Battezzati, L. (1992). J. Phys.
C: Condens. Matter. 4:1635–1645.
129. Gaffet, E., Harmelin, M., Faudot, F. (1993). J. Alloys Compounds 194:23–30.130. Ivison, P. K., Soletta, I., Cowlam, N., Cocco, G., Enzo, S., Battezzati, L. (1992). J. Phys.
C: Condens. Matter. 4:5239–5248.
131. Hwang, S. J., Nash, P., Dollar, M., Dymek, S. (1992).Mater. Sci. For. 88–90:611–618.132. Huang, B. L., Perez, R. J., Crawford, P. J., Nutt, S. R., Lavernia, E. J. (1996). Na-
nostructured Mater. 7:57–65.133. Eckert, J., Holzer, J. C., Krill, C. E. III, Johnson, W. L. (1992). Mater. Sci. For. 88–
90:505–512.134. LeBrun, P., Froyen, L., Munar, B., Delaey, L. (1990). Scand. J. Metall. 19:19–22.135. Shaw, L., Zawrah, M., Villegas, J., Luo, H., Miracle, D. (2003). Metall. Mater. Trans.
34A:159–170.136. Weber, J. H. (1990). In: Clauer, A. H., deBarbadillo, J. J., eds., Solid State Powder
Processing. Warrendale, PA: TMS, pp. 227–239.
137. Li, Z. L., Williams, J. S., Calka, A. (1998).Mater. Sci. For. 269–272:271–276.138. Hong, L. B., Bansal, C., Fultz, B. (1994). Nanostructured Mater. 4:949–956.139. Qin, Y., Chen, L., Shen, H. (1997). J. Alloys Compounds 256:230–233.140. Klassen, T., Herr, U., Averback, R. S. (1997). Acta Mater. 45:2921–2930.
141. Fu, Z., Johnson, W. L. (1993). Nanostructured Mater. 3:175–180.142. Mishurda, J. C. (1993). University of Idaho, Moscow, ID, Unpublished results.143. Kimura, H., Kimura, M. (1990). In: Clauer, A. H., deBarbadillo, J. J., eds., Solid State
Powder Processing. Warrendale, PA: TMS, pp. 365–377.144. Lee, C. H.,Mori,M., Fukunaga, T.,Mizutani, U. (1990). Jpn. J. Appl. Phys. 29: 540–544.145. Chen, Y., Le Hazif, R., Martin, G. (1992).Mater. Sci. For. 88–90:35–41.
146. Gaffet, E., Yousfi, L. (1992).Mater. Sci. For. 88–90:51–58.147. Yamada, K., Koch, C. C. (1993). J. Mater. Res. 8:1317–1326.148. Koch, C. C., Pathak, D., Yamada, K. (1993). In: deBarbadillo, J. J., et al., eds. Me-
chanical Alloying for Structural Applications. Materials Park, OH: ASM International,pp. 205–212.
149. Koch, C. C. (1995).Mater. Trans. Jpn. Inst. Metals 36:85–95.
MD: SURYANARAYANA, JOB: 03320, PAGE: 82
4103-X_Suryanarayana_Ch05_R2_071504
Chapter 582

6
Mechanism of Alloying
6.1 INTRODUCTION
A variety of alloys with different constitutions have been synthesized by mechanicalalloying. These alloy phases include solid solutions (both equilibrium and metasta-ble), intermediate phases (quasi-crystalline and equilibrium or metastable crystallinephases), and amorphous alloys. The types of materials investigated include metallic,ceramic, polymeric, and composites. Even though the number of phases reported toform in different alloy systems is unusually large [1], and property evaluations havebeen done in only some cases, and applications have been explored (see Chapters 9,10, 12, and 17 for details), the number of investigations devoted to an understandingof the mechanism through which the alloy phases form is very limited. This chaptersummarizes the information available in this area.
6.2 BALL-POWDER-BALL COLLISIONS
Mechanical alloying (MA) and mechanical milling (MM) involve loading theblended elemental or prealloyed powder particles along with the grinding mediumin a vial and subjecting them to heavy deformation. During this process the powderparticles are repeatedly flattened, cold welded, fractured, and rewelded. The pro-cesses of cold welding and fracturing, as well as their kinetics and predominance atany stage, depend mostly on the deformation characteristics of the starting powders.
The effects of a single collision on each type of constituent powder particle areshown in Figure 6.1. The initial impact of the grinding ball causes the ductile metalpowders to flatten and work harden. The severe plastic deformation increases the
4103-X_Suryanarayana_Ch06_R2_071504
MD: SURYANARAYANA, JOB: 03320, PAGE: 83
83

surface-to-volume ratio of the particles and ruptures the surface films of adsorbedcontaminants. The brittle intermetallic powder particles get fractured and are refinedin size. The oxide dispersoid particles are comminuted more severely.
6.3 DIFFERENT STAGES OF PROCESSING
Whenever two grinding balls collide, a small amount of powder is trapped inbetween them. Typically, around 1000 particles with an aggregate weight of about0.2 mg are trapped during each collision (Fig. 6.2). During this process, the powdermorphology can be modified in two different ways. If the starting powders are softmetal particles, the flattened layers overlap and form cold welds. This leads toformation of layered composite powder particles consisting of various combinationsof the starting ingredients. The more brittle constituents tend to become occluded bythe ductile constituents and trapped in the composite. The work-hardened elementalor composite powder particles may fracture at the same time. These competingevents of cold welding (with plastic deformation and agglomeration) and fracturing(size reduction) continue repeatedly throughout the milling period. Eventually, arefined and homogenized microstructure is obtained, and the composition of thepowder particles is the same as the proportion of the starting constituent powders.
Along with the cold welding event described above, some powder may alsocoat the grinding medium and/or the inner walls of the container. A thin layer of the
MD: SURYANARAYANA, JOB: 03320, PAGE: 84
4103-X_Suryanarayana_Ch06_R2_071504
Figure 6.1 Deformation characteristics of representative constituents of starting powders inmechanical alloying. Note that the ductile metal powders (metals A and B) get flattened,
whereas the brittle intermetallic and dispersoid particles get fragmented into smaller particles.
Chapter 684

coating is beneficial in preventing wear-and-tear of the grinding medium and also inpreventing contamination of the milled powder with the debris. However, too thick alayer results in compositional inhomogeneity of the powder and should be avoided.
Let us now look at the different stages of processing an oxide dispersionstrengthened material. The starting powders to fabricate this material will consist oftwo or more metal powders and an oxide dispersoid.
6.3.1 Early Stage of Processing
In the early stages of processing each of the soft metal powder particles is flattened.The different flattened particles form layered composites of the starting elements(Fig. 6.3a); this is referred to as lamellar structure in the MA literature. The size ofthese composite particles varies significantly from a few micrometers to a fewhundred micrometers. The lamellar spacing is also large.
Since it is only the beginning of processing, not all of the individual powderparticles get flattened and form composites. Consequently, some unwelded, originalstarting metal powder particles may also exist. The dispersoids are now closelyspaced along the lamellar boundaries. Further, the chemical composition of thedifferent composite particles varies significantly from particle to particle and withinthe particles.
6.3.2 Intermediate Stage of Processing
With continued milling, the cold welding and fracturing events continue to takeplace leading to microstructural refinement. At this stage, the particles consist ofconvoluted lamellae (Fig. 6.3b). Due to the increased amount of cold working, the
MD: SURYANARAYANA, JOB: 03320, PAGE: 85
4103-X_Suryanarayana_Ch06_R2_071504
Figure 6.2 Ball–powder–ball collision of powder mixture during mechanical alloying.
Mechanism of Alloying 85

number of crystal defects introduced—dislocations, vacancies, grain boundaries,etc.—increases with time and these provide short-circuit diffusion paths. The impactof the ball-ball, ball-powder, and ball-wall collisions also causes a rise in the powdertemperature and this further facilitates diffusion. Alloy formation (either stable ormetastable phases) occurs due to the combined effect of all these factors. Micro-structural refinement continues to take place at this stage, and the oxide dispersionbecomes more uniform.
MD: SURYANARAYANA, JOB: 03320, PAGE: 86
4103-X_Suryanarayana_Ch06_R2_071504
Figure 6.3 (a) Early stage of processing: The individual powder particles are layeredcomposites of the starting elements. (b) Intermediate stage of processing: Individual powderparticles consist of convoluted lamellae. A small quantity of new-phase formation may also
occur due to some short-range interdiffusion of the constituents. (c) Final stage of processing:All the powder particles and each powder particle approach the composition of the startingpowder blend, and the lamellar spacing approaches the dispersoid spacing [5].
Chapter 686

6.3.3 Final Stage of Processing
At this stage, the lamellae become finer and more convoluted (Fig. 6.3c), and thecomposition of the individual powder particles approaches that of the overallcomposition of the starting blend. The lamellar spacing and dispersoid spacing isless than 1 Am, and the microhardness of the particles attains a saturation level, dueto accumulation of strain energy.
At the completion of the process, the lamellae are no longer resolvable underthe optical microscope. Further processing will not improve the distribution of thedispersoid, and the compositions of the individual powders are now equivalent to thestarting powder blend. This is called the steady state.
6.4 EVOLUTION OF PARTICLE SIZE
As mentioned above, the powder particles are plastically deformed and get coldwelded if they are soft. Furthermore, work hardening takes place due to the forceof impact of the grinding medium and eventually the work-hardened powder parti-cles fracture. The fresh and atomically clean surfaces created during fracture allowthe particles to weld together in the cold condition, and this leads to an increase inparticle size. Since in the early stages of milling the particles are soft (if we are usingeither ductile-ductile or ductile-brittle material combination), their tendency to weldtogether and form large particles is high. A broad range of particle sizes develops, withsome as large as three times bigger than the starting particles (Fig. 6.4). The compositeparticles at this stage have a characteristic layered structure consisting of variouscombinations of the starting constituents. Even if one is using a single component orprealloyed powder (such as during MM), the particle size increases due to the coldwelding of the smaller particles. With continued deformation, the particles get workhardened and fracture by a fatigue failure mechanism and/or by fragmentation of thefragile flakes. Fragments generated by this mechanism may continue to reduce in size
MD: SURYANARAYANA, JOB: 03320, PAGE: 87
4103-X_Suryanarayana_Ch06_R2_071504
Figure 6.3 Continued.
Mechanism of Alloying 87

in the absence of strong agglomerating forces. At this stage, the tendency to fracturepredominates over cold welding. Due to the continued impact of grinding balls, thestructure of the particles is steadily refined, but the particle size continues to be thesame. Consequently, the interlayer spacing decreases and the number of layers in aparticle increases.
However, it should be remembered that the efficiency of particle size reductionis very low (about 0.1% in a conventional ball mill). The efficiency may be somewhathigher in high-energy ball milling processes but is still less than 1%. The remainingenergy is lost mostly in the form of heat, but a small amount is also utilized in theelastic and plastic deformation of the powder particles.
After milling for a certain length of time, steady-state equilibrium is attainedwhen a balance is achieved between the rate of welding, which tends to increase theaverage particle size, and the rate of fracturing, which tends to decrease the averagecomposite particle size. Smaller particles can withstand deformation without frac-turing and tend to be welded into larger pieces, with an overall tendency to driveboth very fine and very large particles toward an intermediate size [2]. The particlesize distribution at this stage is narrow because particles larger than average arereduced in size at the same rate that fragments smaller than average grow throughagglomeration of smaller particles (Fig. 6.5) [3].
From the foregoing it is clear that during MA, heavy deformation is intro-duced into the particles. This is manifested by the presence of a variety of crystaldefects such as dislocations, vacancies, stacking faults, and increased number ofgrain boundaries. The presence of this defect structure enhances the diffusivity ofsolute elements into the matrix. Furthermore, the refined microstructural featuresdecrease the diffusion distances. In addition, the slight rise in temperature duringmilling further aids the diffusion behavior; consequently, true alloying takes placeamong the constituent elements. While this alloying generally takes place nominally
MD: SURYANARAYANA, JOB: 03320, PAGE: 88
4103-X_Suryanarayana_Ch06_R2_071504
Figure 6.4 Broad distribution of particle sizes in an A1-30 at% Mg powder sample
mechanically alloyed for 2 h.
Chapter 688

at room temperature, sometimes it may be necessary to anneal the mechanicallyalloyed powder at a slightly elevated temperature for alloying to take place. This isparticularly true when formation of intermetallics is desired.
The specific times required to develop a given structure in any system would bea function of the initial particle size and mechanical characteristics of the ingredientsas well as the specific equipment used for conducting the MA operation and theoperating parameters of the equipment. However, in most cases, the rate ofrefinement of the internal structure (particle size, crystallite size, lamellar spacing,etc.) is roughly logarithmic with processing time and therefore the size of the startingparticles is relatively unimportant. In a few minutes to an hour, the lamellar spacingusually becomes small and the crystallite (or grain) size is refined to nanometer (1 nm= 10�9 m or 10 A) dimensions (Fig. 6.6). The ease with which nanostructuredmaterials can be synthesized is one reason why MA has been extensively employed toproduce nanocrystalline materials (see Chapter 13).
As mentioned above, it is possible to conduct MA of three different combina-tions of metals and alloys: (1) ductile-ductile, (2) ductile-brittle, and (3) brittle-brittle.Therefore, it is convenient to discuss the mechanism of MA in terms of these categories.
6.5 DUCTILE-DUCTILE COMPONENTS
Ductile-ductile is the ideal combination of materials for MA. Benjamin [2] suggestedthat it was necessary to have at least 15% of a ductile component to achieve alloying.This was because true alloying results from the repeated action of cold welding and
MD: SURYANARAYANA, JOB: 03320, PAGE: 89
4103-X_Suryanarayana_Ch06_R2_071504
Figure 6.5 Narrow particle size distribution caused by tendency of small particles to weldtogether and large particles to fractue under steady-state conditions.
Mechanism of Alloying 89

fracturing of powder particles; cold welding cannot occur if the particles are notductile. However, we will see later that this factor is really not critical since alloyingoccurs even in completely brittle materials.
Benjamin and Volin [4] first described the mechanism of alloying in a systeminvolving two different ductile components. It was suggested that in the early stagesof MA the ductile components get flattened to platelet/pancake shapes by a micro-forging process. A small quantity of the powder, usually one or two particlethicknesses, also gets welded onto the ball surfaces. This coating of the powder onthe grinding medium is advantageous because it prevents excessive wear of thegrinding medium. However, the thickness of the powder layer on the grindingmedium must be kept to a minimum to avoid formation of a heterogeneous product[5]. In the next stage, these flattened particles get cold welded together and form acomposite lamellar structure of the constituent metals. An increase in particle size isalso observed at this stage. With increasing MA time, the composite powder particlesget work hardened, the hardness and consequently the brittleness increases, and theparticles get fragmented resulting in particles with more equiaxed dimensions. Withfurther milling, the elemental lamellae of the welded layer and both the coarse andfine powders become convoluted rather than being linear (Fig. 6.7). This is due to therandom welding together of equiaxed powder particles without any particularpreference to the orientation with which they weld. Alloying begins to occur at thisstage due to the combination of decreased diffusion distances (interlamellar spacing),increased lattice defect density, and any heating that may have occurred during themilling operation. The hardness and particle size tend to reach a saturation value atthis stage, called the steady-state processing stage. With further milling, true alloyingoccurs at the atomic level resulting in the formation of solid solutions, intermetallics,or even amorphous phases. The layer spacing becomes so fine at this stage that it isno longer visible under an optical or scanning electron microscope.
An indication of the completion of the MA process and of the attainment of ahomogeneous structure in the powder is the ease with which the powder could be
MD: SURYANARAYANA, JOB: 03320, PAGE: 90
4103-X_Suryanarayana_Ch06_R2_071504
Figure 6.6 Refinement of particle/grain/crystallite size with milling time. The rate of
refinement increases with increasing milling energy, ball-to-powder weight ratio, and lowertemperatures.
Chapter 690
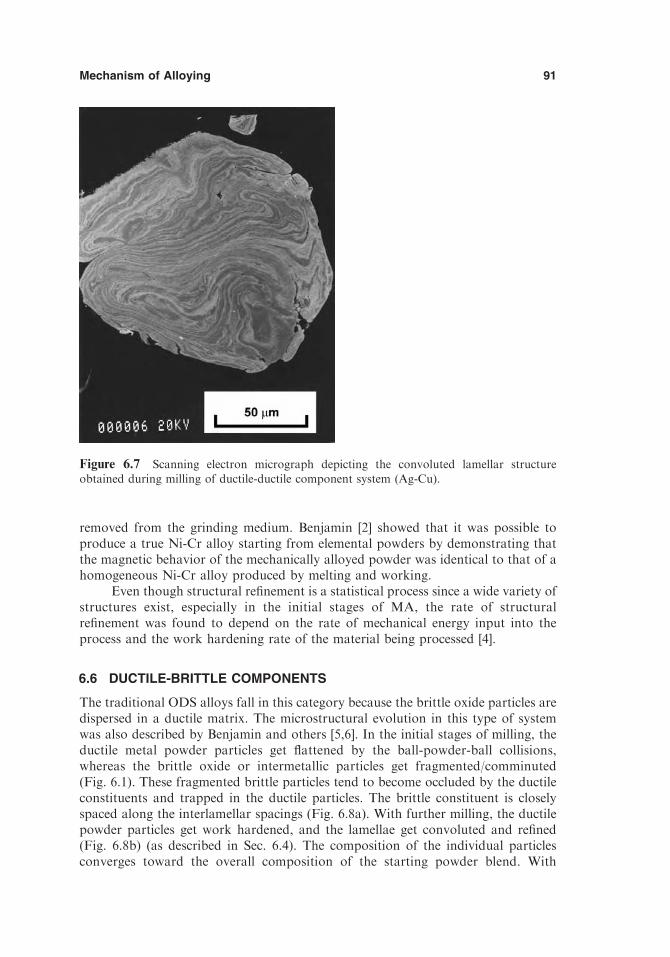
removed from the grinding medium. Benjamin [2] showed that it was possible toproduce a true Ni-Cr alloy starting from elemental powders by demonstrating thatthe magnetic behavior of the mechanically alloyed powder was identical to that of ahomogeneous Ni-Cr alloy produced by melting and working.
Even though structural refinement is a statistical process since a wide variety ofstructures exist, especially in the initial stages of MA, the rate of structuralrefinement was found to depend on the rate of mechanical energy input into theprocess and the work hardening rate of the material being processed [4].
6.6 DUCTILE-BRITTLE COMPONENTS
The traditional ODS alloys fall in this category because the brittle oxide particles aredispersed in a ductile matrix. The microstructural evolution in this type of systemwas also described by Benjamin and others [5,6]. In the initial stages of milling, theductile metal powder particles get flattened by the ball-powder-ball collisions,whereas the brittle oxide or intermetallic particles get fragmented/comminuted(Fig. 6.1). These fragmented brittle particles tend to become occluded by the ductileconstituents and trapped in the ductile particles. The brittle constituent is closelyspaced along the interlamellar spacings (Fig. 6.8a). With further milling, the ductilepowder particles get work hardened, and the lamellae get convoluted and refined(Fig. 6.8b) (as described in Sec. 6.4). The composition of the individual particlesconverges toward the overall composition of the starting powder blend. With
MD: SURYANARAYANA, JOB: 03320, PAGE: 91
4103-X_Suryanarayana_Ch06_R2_071504
Figure 6.7 Scanning electron micrograph depicting the convoluted lamellar structureobtained during milling of ductile-ductile component system (Ag-Cu).
Mechanism of Alloying 91

MD: SURYANARAYANA, JOB: 03320, PAGE: 92
4103-X_Suryanarayana_Ch06_R2_071504
continued milling, the lamellae get further refined, the interlamellar spacingdecreases, and the brittle particles get uniformly dispersed, if they are insoluble, inthe ductile matrix, e.g., as in an ODS alloy (Fig. 6.8c). A typical transmissionelectron micrograph showing the dispersion of Er2O3 in a mechanically milled a2-titanium aluminide matrix is shown in Figure 6.9. On the other hand, if the brittlephase is soluble, alloying occurs between the ductile and brittle components also andchemical homogeneity is achieved. Formation of an amorphous phase on milling amixture of pure Zr (ductile) and NiZr2 intermetallic (brittle) powder particles is atypical example of this type of system [7]. Whether or not alloying occurs in a ductile-brittle system also depends on the solid solubility of the brittle component in theductile matrix. If a component has a negligible solid solubility then alloying isunlikely to occur, e.g., boron in iron. Thus, alloying of ductile-brittle componentsduring MA requires not only fragmentation of brittle particles to facilitate short-range diffusion, but also reasonable solid solubility in the ductile matrix component.
6.7 BRITTLE-BRITTLE COMPONENTS
It was mentioned earlier that intimate mixing of the component powder particlesoccurs due to interplay between the cold welding and fracturing events. Therefore,from an intuitive stand point it would appear unlikely that alloying occurs in a sys-tem consisting of two or more brittle components and with no ductile componentpresent. This is because the absence of a ductile component prevents any weldingfrom occurring, and in its absence alloying is not expected to occur. However, alloy-ing has occurred in brittle-brittle component systems such as Si-Ge and Mn-Bi [8,9].Milling of mixtures of brittle intermetallics [10] also produced amorphous phases.
As mentioned above, the brittle components get fragmented during milling andtheir particle size gets reduced continuously. However, at very small particle sizes the
Figure 6.8 Schematics of microstructural evolution during milling of a ductile-brittle
combination of powders. This is typical of an oxide dispersion–strengthened case. (a) Theoxide particles become trapped in the welds of the composite particles. The weld spacing islarge and the concentration of the oxide particles fairly high. (b) The weld spacing decreases
and the oxide particle spacing has increased. (c) The oxide is evenly distributed along the weldswhich have a small spacing.
Chapter 692

MD: SURYANARAYANA, JOB: 03320, PAGE: 93
4103-X_Suryanarayana_Ch06_R2_071504
powder particles behave in a ductile fashion, and further reduction in size is notpossible; this is termed the limit of comminution [11].
During milling of brittle-brittle component systems, it has been observed thatthe harder (more brittle) component gets fragmented and gets embedded in the softer(less brittle) component. Thus, the harder Si particles are embedded in the softer Gematrix (Fig. 6.10). Once an intimate mixture of the two components is achieved, then
Figure 6.9 Transmission electron micrograph showing a uniform dispersion of Er2O3particles in a mechanically alloyed a2-titanium aluminide alloy matrix.
Figure 6.10 Scanning electron micrograph showing that the harder Si particles areincorporated in a softer Ge matrix after mechanical alloying of the Si-Ge powder mix for 12 h.
Mechanism of Alloying 93

alloying occurs by diffusional processes. Thus, it was reported that alloying did notoccur in the brittle-brittle systems (Si-Ge) at very low temperatures, e.g., liquidnitrogen temperatures, whereas alloying did occur at subambient temperatures in theductile-ductile and ductile-brittle systems. This may be due to the longer diffusiondistances required in the brittle-brittle granular vs. ductile-ductile lamellar geometry,and/or the enhanced diffusion paths provided by dislocations, grain boundaries, andother defects introduced via severe plastic deformation in the ductile-ductile systems.
Possible mechanisms that may contribute to material transfer during millingof brittle components may include plastic deformation, which is made possible by(1) local temperature rise, (2) microdeformation in defect-free volumes, (3) surfacedeformation, and/or (4) hydrostatic stress state in the powders during milling [9].
REFERENCES
1. Suryanarayana, C. (2001). Prog. Mater. Sci. 46:1–184.
2. Benjamin, J. S. (1976). Sci. Am. 234(5):40–48.3. Lee, P. Y., Yang, J. L., Lin, H. M. (1998). J. Mater. Sci. 33:235–239.4. Benjamin, J. S., Volin, T. E. (1974). Metall. Trans. 5:1929–1934.
5. Gilman, P. S., Benjamin, J. S. (1983). Annu. Rev. Mater. Sci. 13:279–300.6. Benjamin, J. S. (1990). Metal Powder Rep. 45:122–127.7. Lee, P. Y., Koch, C. C. (1988). J. Mater. Sci. 23:2837–2845.
8. Davis, R. M., Koch, C. C. (1987). Scripta Metall. 21:305–310.9. Davis, R. M., McDermott, B., Koch, C. C. (1988). Metall. Trans. A19:2867–2874.10. Lee, P. Y., Koch, C. C. (1987). Appl. Phys. Lett. 50:1578–1580.11. Harris, C. C. (1967). Trans. Soc. Min. Engrs. 238:17.
MD: SURYANARAYANA, JOB: 03320, PAGE: 94
4103-X_Suryanarayana_Ch06_R2_071504
Chapter 694

7
Characterization of Powders
7.1 INTRODUCTION
The product of mechanical alloying (MA) or mechanical milling (MM) is in powderform. Successful application of these materials, either in the as-synthesized powdercondition or after consolidation to bulk shape, requires that the powders and/or theproducts of consolidation be fully characterized. Consolidation of the mechanicallyalloyed/milled powders requires their exposure to high temperatures and/or pres-sures. This can be done by a number of techniques such as hot pressing, hot isostaticpressing, hot extrusion, plasma-activated sintering, or shock consolidation. Consol-idation of the ‘‘nonequilibrium’’ powders synthesized by MA/MM techniques(containing supersaturated solid solutions; metastable intermediate phases; quasi-crystalline, amorphous, or nanocrystalline phases) to full density is a nontrivialproblem. Achievement of full density requires that the powders be exposed to hightemperatures and/or high pressures for extended periods. This could result in thecrystallization of amorphous phases, formation of equilibrium phases from themetastable phases produced, and coarsening of nanometer-sized grains. However, ifone consolidates the powders at low temperatures and/or pressures to retain‘‘nonequilibrium’’ features, sufficient bonding between particles may not exist;consequently, the material will be porous and not fully dense. Therefore, innovativemethods must be adopted to achieve full densification while retaining the ‘‘nonequi-librium’’ effects in these mechanically alloyed/milled powders. Sufficient literature isavailable on this aspect, and the reader is referred to a recent review for additionaldetails [1].
The powders obtained after MA/MM are characterized for their size andshape, surface area, phase constitution, and microstructural features. Measurement
4103-X_Suryanarayana_Ch07_R2_071504
MD: SURYANARAYANA, JOB: 03320, PAGE: 95
95

of the crystallite size and lattice strain in the mechanically alloyed powders is alsovery important since the phase constitution and transformation characteristicsappear to be critically dependent on both of them, but more significantly on thecrystallite size. The nature and density of the chemical defects in the powders alsoplay a significant role. In addition, one could characterize the transformationbehavior of the mechanically alloyed/milled powders on annealing or after consol-idation to full density, or after other treatments. However, it should be realized thatnot all investigators characterize their powders/products for all of the above features.The extent of characterization appears to be limited depending on the final require-ments and applications of the product. In principle, most of the general techniquesused to characterize powders synthesized by conventional methods can also be usedto characterize the mechanically alloyed/milled powders. These techniques have beendescribed in detail in standard textbooks and/or reference books on powdermetallurgy, so that only a brief description will be given here (see, for example,Refs. 2 and 3 for full details).
7.2 SIZE AND SHAPE
The size and shape of the powder particles may be determined accurately using directmethods of either scanning electron microscopy (SEM) for relatively coarse powdersor transmission electron microscopy (TEM) for finer powders.
The powder particles synthesized by MA are expected to have a uniform sizeand narrow particle size distribution, once steady-state conditions of processing havebeen reached. Furthermore, since a number of different types of mill are available formilling powders, one may suspect that the particle size and size distribution will besignificantly different in powders processed in different mills. However, it has beenrecently shown that by milling Al2O3 powder in three different types of mill (avibrational mill containing only one large ball, a Fritsch planetary ball mill, and ahorizontal Uni-Ball mill equipped with magnets to achieve strong impact, shearing,or chaotic ball movement) and controlling the milling conditions, it was possible tosynthesize spherical powders. Furthermore, it was shown that the powder sizedistributions are similar and that the particle size tended to be bimodal, with thesame size distribution, for the case of extended milling times [4]. It has also beenpossible to produce hollow spherical powders in some cases [4,5]. Figure 7.1 showstypical SEM images of mechanically alloyed Al-20 at% Mg powder milled for 24h and pure Ni powder milled for 12 h in a SPEX 8000 mixer mill. It may be notedthat the powder particles have a range of sizes and that most of the particles have anirregular morphology.
If the powders are spherical, their size is defined by the particle diameter.However, very rarely the mechanically alloyed powder particles have a perfectspherical shape. In the early stages of milling (and also in the late stages in somecases) the powder is flaky and has an irregular shape [6]. In such cases, the equivalentspherical diameter can be determined from the volume, surface area, or projectedarea, or settling rate measurements. For example, if the measured volume is V, thenthe equivalent spherical diameter Dv is given as:
Dv ¼ ð6V=kÞ1=3 ð7:1Þ
MD: SURYANARAYANA, JOB: 03320, PAGE: 96
4103-X_Suryanarayana_Ch07_R2_071504
Chapter 796

Alternatively, for a measured surface area S, the equivalent spherical surfacediameter Ds is simply
Ds ¼ ðS=kÞ1=2 ð7:2ÞIf the particles are not spherical, the equivalent spherical projected diameter DA iscalculated by setting the projected area equal to the equivalent area of a circle A.Then
DA ¼ ð4A=kÞ1=2 ð7:3ÞThe particle size distribution can be conveniently obtained by the technique ofscreening (or sieving). Screening is a mechanical method of separating the differentsize fractions of a metal powder. The screen surface allows particles smaller than thesurface opening to pass through while the larger particles remain on the top of thescreening surface. Thus, to determine the size and size distribution of the particles,the powder mix is screened through successively finer sieves of known screen opening
MD: SURYANARAYANA, JOB: 03320, PAGE: 97
4103-X_Suryanarayana_Ch07_R2_071504
Figure 7.1 Scanning electron micrographs of (a) Al-20 at% Mg powder mechanically
alloyed for 24 h and (b) pure Ni powder milled for 12 h in a SPEX mill. Note that the powdershave an irregular morphology and different size ranges.
Characterization of Powders 97

size. The screen is often specified by its mesh size, which is the number of wires perinch. The opening size varies inversely with the mesh size; large mesh numbers implysmall opening sizes and vice versa. For example, if the powders pass through a 325mesh, then they are referred to as having a �325-mesh size; in this case, the particlesize is less than 44 Am. Table 7.1 lists the typical mesh numbers and the relatedparticle sizes.
It is shown in Figure 7.1 that the as-milled powder contains particles ofdifferent sizes. However, by sieving through different mesh sizes, it will be possible toobtain particles of specific size distributions. Figure 7.2a–c shows scanning electronmicrographs of mechanically alloyed blended elemental powder mixtures of Al-20at% Mg powder particles, separated as described above, showing particle size rangesof 88–105, 44–53, and 20–25 Am, respectively. Figure 7.3 shows a histogram of thedistribution of weight fraction of the particles classified according to the particle size.It may be noted that the distribution is essentially bimodal with majority of theparticles belonging to the very small (<20 Am) or very large (>105 Am) size range.Particles classified as above will be useful for applications requiring a specific size,e.g., to study the effect of particle size on the combustion behavior.
By measuring the particle size and calculating the weight fraction of eachparticle size range (percentage of particles having that specific size, also known asfrequency) a histogram relating the weight fraction and particle size can beconstructed. It is of interest to note that the particle size distribution of mechanicallyalloyed/milled powders is generally Gaussian (log normal), i.e., a bell-shaped curve isobtained when the frequency is plotted on a linear scale against the logarithm of theparticle size.
MD: SURYANARAYANA, JOB: 03320, PAGE: 98
4103-X_Suryanarayana_Ch07_R2_071504
Table 7.1 Relationship among Typical Mesh Numbers, Screen Sizes, andRelated Particle Sizes
Mesh no. U.S. standard sieve opening, mm (in.) Particle size (Am)
4 4.750 (0.1870) 4750
10 2.000 (0.0787) 200018 1.000 (0.0394) 100035 0.500 (0.0197) 500
50 0.300 (0.0118) 30060 0.250 (0.0098) 25080 0.177 (0.0070) 177100 0.149 (0.0059) 149
120 0.125 (0.0049) 125140 0.105 (0.0041) 105170 0.088 (0.0035) 88
200 0.074 (0.0029) 74230 0.063 (0.0024) 63270 0.053 (0.0021) 53
325 0.044 (0.0017) 44400 0.037 (0.0015) 37500 0.025 (0.00098) 25600 0.020 (0.00079) 20
Chapter 798

It is important to realize that the powder particles are usually agglomeratedand therefore care must be exercised in determining the correct particle size. Thus, acommonly observed powder particle may consist of several individual smallerparticles. Furthermore, an individual powder particle may contain a number ofgrains or crystallites defined as coherently diffracting domains. Microscopic exam-ination normally provides information on the particle size (or even the grain size, ifsufficient resolution is available), whereas diffraction techniques (e.g., X-ray) givemeasures of the crystallite size.
7.3 SURFACE AREA
Knowledge about the surface area of powder particles is useful in understanding thesintering behavior because reduction of surface area is the main driving force for the
MD: SURYANARAYANA, JOB: 03320, PAGE: 99
4103-X_Suryanarayana_Ch07_R2_071504
Figure 7.2 Scanning electron micrographs of an Al-20 at% Mg powder mechanicallyalloyed for 15 h in a SPEX mill and sieved to different sizes. Note the almost spherical shape ofthe particles present. (a) 88–105 Am, (b) 44–53 Am, and (c) 20–25 Am.
Characterization of Powders 99

sintering process. Information about the surface area of the powders is alsoimportant in evaluating the catalysis aspects. Measurement of surface area ofpowders relies on calculating the amount of gas absorbed on the sample surface atlow temperatures and then estimating the monolayer capacity using the ‘‘known’’size of the adsorbed molecules. Nitrogen, at liquid nitrogen temperature, is the mostcommon gas used, whereas krypton, at liquid nitrogen temperature, is used forsamples with an area less than 1 m2/g [7].
The Brunauer-Emmett-Teller (BET) method [8] of measuring the specificsurface area is based on the above principle. The specific surface area (m2/g)determined by this method includes both the external and internal (pores) surfacearea. The surface area of closed pores cannot be determined because the adsorbinggas molecules have no physical path to the surface. Usually, the quantity of gasadsorbed (cm3) per gram of adsorbent is measured at constant temperature as afunction of pressure, p. The BET equation can then be written as
p
vðp� poÞ¼ 1
vmcþ c� 1
vmc
� �p
p0ð7:4Þ
where v is the volume of the gas adsorbed in cm3 at standard temperature andpressure (STP) conditions per gram of solid at a pressure p, vm is the monolayervolume, and po is the vapor pressure. The constant c is related to the heat ofadsorption. By plotting p/[v( p�po)] against p/po, one obtains a straight line, with theslope (1/vm) and the intercept 1/vmc, from which both c and vm can be calculated. The
MD: SURYANARAYANA, JOB: 03320, PAGE: 100
4103-X_Suryanarayana_Ch07_R2_071504
Figure 7.3 Histogram plot of the particle size distribution of the powder (after sieving thepowder shown in Fig. 7.2) showing the weight percent of the powder particles as a function ofparticle size range.
Chapter 7100

MD: SURYANARAYANA, JOB: 03320, PAGE: 101
4103-X_Suryanarayana_Ch07_R2_071504
Figure
7.4
Schem
erepresentingthepossibleconstitutionofmechanicallyalloyed/m
illedpowders.
Characterization of Powders 101

specific surface area S (m2/g) is then obtained from the relation S = 0.269 jvm,where j is the molecular area of nitrogen (0.162 nm2) and vm has the units of cm3/g.The numerical factor of 0.269 comes from Loschmidt’s number (molecules per cm3
at STP). It has been mentioned in the literature that when the pressures are measurednear the boiling point of the adsorbed gas (77 K for nitrogen), the range of validityof the BET equation is in the relative pressure ( p/po) range of 0.05 and 0.35 and thatat least four points should be measured in this region. Details of calculations and theprecautions to be taken to obtain accurate results may be found in Ref. 7.
7.4 PHASE CONSTITUTION
The powder synthesized by MA/MM techniques may be crystalline, quasi-crystal-line, or amorphous in nature. Different possibilities exist in each of these broadcategories (Fig. 7.4). If the powder is crystalline, then it may contain one or morephases. Furthermore, if the sample contains a quasi-crystalline phase, then it may beeither an icosahedral or a decagonal phase. If the sample contains an amorphousphase, usually it is homogeneous, even though the sample may, in principle, containmore than one amorphous phase (e.g., during decomposition of an amorphous phasetwo amorphous phases may coexist, i.e., phase separation could occur). However,this has not been actually observed so far in mechanically alloyed/milled materials.Evaluation of the nature and amount of the phase(s) is important in correlating thestructure, properties, and transformation behavior of the powders.
7.4.1 Crystalline Phases
Crystalline phases produce well-defined peaks in their diffraction patterns, notingthat the width and the maximal intensity of the peaks depend on lattice strain,crystallite size, and other imperfections such as stacking faults in the powders. Figure7.5 shows typical X-ray and electron diffraction patterns and an electron micrographfrom a crystalline phase produced by the MA technique.
X-ray diffraction (XRD) is perhaps the most convenient and common tech-nique used to determine the number and type of crystalline phases. The angularpositions of the peaks in the XRD patterns can be used to determine the interplanarspacings using the Bragg equation:
k ¼ 2dhkl sin u ð7:5Þwhere k is the wavelength of the X-ray beam, dhkl is the interplanar spacing for theplane with the Miller indices hkl, and u is the diffraction angle. XRD patterns couldbe indexed and the phases present identified by comparing the observed angularpositions (or the interplanar spacings) and intensities of the peaks with those ofstandard patterns available in the Powder Diffraction Files [9]. If all the peakspresent and their intensities in the observed diffraction pattern could be matched
MD: SURYANARAYANA, JOB: 03320, PAGE: 102
4103-X_Suryanarayana_Ch07_R2_071504
Figure 7.5 Typical X-ray and electron diffraction patterns and an electron micrograph froma crystalline phase obtained by MA. (a) Typical X-ray diffraction pattern from a crystalline
material. (b) Electron micrograph. (inset) Ring diffraction pattern obtained from a fine-grained (nanocrystalline) material. (c) Single-crystal electron diffraction pattern.
Chapter 7102

MD: SURYANARAYANA, JOB: 03320, PAGE: 103
4103-X_Suryanarayana_Ch07_R2_071504
Characterization of Powders 103

with those of the standard pattern in the Powder Diffraction Files, then theidentification is accurate. It can then be assumed that a single phase was obtainedin the mechanically alloyed/milled powder. If this is not the case, then it can be safelyinferred that the mechanically alloyed/milled powder contains more than one phase.The XRD pattern could then be indexed, according to the standard procedures,assuming it contains more than one phase [10].
Since formation of metastable phases has been reported to be of commonoccurrence in mechanically alloyed/milled materials [11], it is possible that the XRDpattern corresponds to the presence of one or more metastable phase(s) in the milledpowder. In such a case, there are again two possibilities—the phase (or a similarphase in a homologous alloy system) may have been identified earlier or it may be anentirely new and unidentified phase. If a similar phase has been identified earlier andits structural details have been listed in the Powder Diffraction Files [9] or in theliterature, then the structural details (crystal structure and lattice parameters) of thephase obtained in the mechanically alloyed/milled powders could be determined bycomparing its diffraction pattern with the available standard patterns, ensuring thatthe interplanar spacings and the intensities of all the diffraction peaks match perfectly.
In case a metastable phase with an unknown structure has formed, then itsstructure has to be determined by following standard procedures for identifyingcrystal structures from first principles. So far this has not been necessary formechanically alloyed/milled powders. Full details of the procedures to identifycrystal structures of both known and unknown phases could be found in standardX-ray diffraction textbooks (see, for example, Refs. 10 and 12). It has beenfrequently reported that some stable or metastable transition phases form duringMA of blended elemental powders. If the stability of such phases is reasonably high,then conventional XRD methods, as mentioned above, could be used to identifytheir crystal structures. However, these methods will be ineffective if the phase underquestion has a low stability. To overcome this difficulty, time-resolved X-raydiffraction (TRXRD) techniques have been utilized to record XRD patterns witha temporal resolution of about 50 ms [13,14]. The TRXRD method, coupled withinfrared thermography, provides information on the structural phase transforma-tions and direct observations of the heat release. This combination has been found tobe very effective in detecting the formation of transitional phases of short ‘‘lifetime,’’e.g., in Fe-Al alloys, and in investigating the mechanically activated self-propagatinghigh-temperature synthesis (MASHS) reactions [13].
7.4.2 Quasi-crystalline Phases
It will be shown in Chapter 10 that MA can also synthesize quasi-crystalline phasesfrom blended elemental powders. Even though both XRD and electron diffractiontechniques have been employed earlier to identify and index these phases in rapidlysolidified alloys, electron diffraction methods should be preferred. This is especiallytrue for the mechanically alloyed materials. Since the mechanically alloyed powdercontains very small particles and a significant amount of lattice strain, the X-raypeaks are broadened. The peak positions are very close to each other, especially atlower angles, in most of the quasi-crystalline materials. The combined effect of theclose spacing and peak broadening makes an unambiguous identification of thequasi-crystalline phase difficult by XRD methods. Since electron diffraction patterns
MD: SURYANARAYANA, JOB: 03320, PAGE: 104
4103-X_Suryanarayana_Ch07_R2_071504
Chapter 7104

can be obtained from very small areas, and also because the aperiodic spacing of thediffraction spots is very easy to identify, electron diffraction is the preferred methodto identify the formation of quasi-crystalline phases in mechanically alloyed materi-als. Quasi-crystalline phases may be either the icosahedral (with fivefold rotationsymmetry) or the decagonal (with tenfold rotation symmetry) type (among otherpossibilities). So far only the icosahedral-type phases have been reported inmechanically alloyed powders.
7.4.3 Amorphous Phases
It will be shown in Chapter 12 that MA and MM techniques have producedamorphous phases in a number of alloy systems [11]. Amorphous phases give riseto diffuse halos in their diffraction patterns. It is desirable to confirm the formationof the amorphous phase using direct transmission electron microscopic techniques.Transmission electron micrographs from amorphous phases do not show anydiffraction contrast and their electron diffraction patterns show broad and diffusehalos. Figure 7.6 shows typical X-ray and electron diffraction patterns from anamorphous phase in mechanically alloyed powders. Differentiation between a‘‘truly’’ amorphous (i.e., without translational symmetry as in a liquid) and micro-or nanocrystalline structure (i.e., an assembly of randomly oriented fragments of abulk crystalline phase) has not been easy on the basis of diffraction studies alone;considerable confusion exists in the literature. In the diffraction experiment of an‘‘amorphous’’ structure, the intensity but not the phase of the scattered radiation ismeasured. Fourier inversion of these data yields only the radial distribution functionof the structure, which cannot uniquely specify the atomic positions. To determinethe structure, the experimentally determined radial distribution function must becompared with the radial distribution functions calculated from the structuralmodels being considered [15,16].
The occurrence of an amorphous phase is generally inferred by observing thepresence of broad and diffuse peaks in the XRD patterns. It should be noted,however, that XRD patterns present only an average picture. Thus, by observing thebroad X-ray peaks alone, it is not possible to distinguish among materials that are(1) truly amorphous, (2) extremely fine grained, or (3) a material in which a verysmall volume fraction of crystals is embedded in an amorphous matrix. Hence, inrecent years, it has been the practice to designate these identifications as ‘‘X-rayamorphous,’’ indicating that the conclusions were reached only on the basis ofobservation of a broad peak (or a few diffuse peaks) in the XRD pattern. There havebeen several examples of reports of a phase reported as amorphous on the basis ofXRD studies alone. But, based on supplementary investigations by neutron diffrac-tion and/or TEM techniques, which have specific advantages and/or a higherresolution capability than the XRD technique, it could be unambiguously confirmedthat the phase produced was not truly amorphous [17,18].
Neutron diffraction techniques have the advantage of detecting lighter atoms inthe presence of heavy atoms, whereas the scattering intensity of the lighter atomsmay be completely masked by that of the heavy atoms in techniques such as XRD orelectron diffraction. In addition, the technique of neutron diffraction has the abilityto distinguish between neighboring elements in the periodic table [19]. XRDtechniques are unsuitable for this because neighboring elements have their atomic
MD: SURYANARAYANA, JOB: 03320, PAGE: 105
4103-X_Suryanarayana_Ch07_R2_071504
Characterization of Powders 105

MD: SURYANARAYANA, JOB: 03320, PAGE: 106
4103-X_Suryanarayana_Ch07_R2_071504
scattering factors very close to each other. Consequently, the difference in theirscattering factors and hence the diffracted intensity will be very small to be detected.Thus, it is desirable that XRD observations are confirmed by other techniques aswell. For example, TEM studies can confirm the lack of contrast in the micrographsfor a truly amorphous phase.
The appearance of a glass transition temperature during differential thermalanalysis (DTA) or differential scanning calorimetry (DSC) studies is a clear andunambiguous indication of the presence of an amorphous (glassy) phase in thematerial studied. However, a glass transition may be obscured in many traditionalmetallic glass systems by the onset of crystallization and hence may not be observedin all cases. This is because the glass transition temperature and crystallizationtemperature are very close to each other. But, in the case of bulk metallic glasses, theglass transition and the crystallization temperatures could be separated by as muchas 135 K [20,21]. DTA/DSC studies can show the presence of an exothermic peak on
Figure 7.6 Typical (a) X-ray and (b) electron diffraction patterns from an amorphous phaseobtained by MA.
Chapter 7106

MD: SURYANARAYANA, JOB: 03320, PAGE: 107
4103-X_Suryanarayana_Ch07_R2_071504
heating the sample indicating that crystallization of the amorphous phase hasoccurred. If the material is extremely fine grained (nanocrystalline, not amorphous),then only grain growth, driven by the decrease in grain boundary free energy, canoccur in these alloys upon heating to high temperatures. Thus, in general, anexothermic peak in a constant heating–rate DSC plot may be due to (1) growth ofa phase that nucleated at a lower temperature, or (2) nucleation and growth of a newphase. It is possible to separate these effects by monitoring the heat flow for a sampleheld at a constant temperature just below the onset of the exothermic peak. Theshape of the heat flow signal indicates the nature of the transformation: nucleationand growth of a new phase gives a bell-shaped exothermic signal, while simplegrowth of a preexisting phase yields an exponentially decreasing exothermal signal.Other indications of grain growth are scanning peaks that are low and wide with along high-temperature tail. Furthermore, these peaks shift to higher temperaturesafter preannealing [22,23]. Thus, one should be able to differentiate betweenamorphous and micro- or nanocrystalline (fine-grained) samples processed by MAtechniques by using a combination of techniques such as microscopy, diffraction,and DTA/DSC methods.
7.5 MICROSTRUCTURAL FEATURES
The microstructural features of interest in both the as-synthesized powders and theconsolidated condition are the sizes (of grains and second phase particles), shapes ofthese features, number and distribution of these phases, and their chemical compo-sitions. Since the grain sizes of most mechanically alloyed/milled powders andconsolidated products are small (often in the nanometer range), TEM is the mostuseful technique for observing microstructural features of mechanically alloyedpowders. An added advantage of the TEM technique is that one could alsosimultaneously determine the crystal structure and chemical composition of thesenanometer-sized individual phases. Furthermore, the volume fraction of the differentphases can be determined using quantitative microscopy techniques. Details ofinterpretation of microstructural features that can be observed in TEM image maybe found in standard textbooks (see, for example, Ref. 24).
Preparation of thin foil specimens for observing structural details in the TEMimage is an involved and tedious process. Standard procedures are available toprepare electron-transparent thin-foil specimens from bulk samples, as obtained in aconsolidated material [24,25]. However, special methods have been developed toprepare electron-transparent specimens from mechanically alloyed/milled powdersto observe their microstructural features in the TEM image [26–29]. Since particulatematerials are often too small to be prepared as a self-supporting specimen, theirpreparation incorporates the use of some form of embedding media to support theparticles prior to the use of conventional thinning techniques. Typically, the as-milled powders are embedded in an epoxy, mechanically polished down to athickness of about 20 Am, and then ion milled. Sometimes the milled powder canbe dispersed in methanol using an ultrasonic bath; and then a drop of the particlesuspension can be dried on a copper grid coated with holey carbon film. Someparticles may be thin enough at the edges that one could observe the microstructuralfeatures without further preparation. Recently, focused ion beam milling has becomea popular method to prepare thin-foil specimens from powders and other difficult-to-prepare specimens for electron microscopic observation [30,31]. In this method, a
Characterization of Powders 107

liquid metal (usually gallium) ion gun is used to cut trenches as small as 5 � 20 Am,and this small specimen is then milled to electron-transparent thickness and liftedout. This technique has come to be known as focused ion beam lift-out method. Thegreatest advantage of this technique is that electron-transparent specimens can beprepared from extremely small samples, including powders. Full details of thistechnique are given in Refs. 30 and 31.
Figure 7.7 shows a TEM micrograph of the Ti-45Al-2.4Si (at%) alloy powderobtained by hot isostatically pressing at a temperature of 875jC and a pressure of200 MPa for 2 h. The MA powder was synthesized from a mixture of prealloyed Ti-48 at% Al and Ti5Si3 powders. The microstructure in the HIP compact shows abimodal distribution of grain sizes—about 200-nm grains of g-TiAl and about 100-nm particles of Ti5Si3, located mostly at the triple junctions of the g-TiAl grains. Thegrain size was measured by the linear intercept method [32]. By measuring the meangrain size and the sizes of the individual phases, and also their frequency, theirdistributions have been plotted as shown in Figure 7.8. It may be noted that theoverall and phase-specific grain size distributions show a nearly log-normal distri-bution [33].
The crystal structures and chemical compositions of the individual microcrys-talline phases can also be determined using TEM techniques. Sometimes it isnecessary to determine the chemistry of very thin surface layers (about 1–2 nmthick) of the powders or consolidated products, and for this techniques such asAuger electron spectroscopy (AES) and X-ray photoelectron spectroscopy (XPS) areextremely useful. Atom probe–field ion microscopy (AP-FIM) and three-dimen-sional atom probe (3D-AP) techniques have also been found to be very helpful indetermining the homogeneity of the phases and their chemical compositions in verysmall areas [34]. As an example, from the contrast in the field ion micrographsrecorded from a mechanically alloyed Cu-20 at% Co alloy, it could be concluded
MD: SURYANARAYANA, JOB: 03320, PAGE: 108
4103-X_Suryanarayana_Ch07_R2_071504
Figure 7.7 Transmission electron micrograph of MA Ti-45Al-2.4Si (at%) after hot isostaticpressing at 875jC.
Chapter 7108

that the as-synthesized powder showed an inhomogeneous distribution of Co atomsin the solid solution [35]. Mossbauer spectroscopy is another common technique thathas been extensively employed to determine the chemical and structural environmentof iron atoms on a nearest-neighbor length scale, site occupancies of atoms, andmagnetic characteristics of the phases in iron-based materials [36,37].
Experimental details and methods of interpreting the results obtained using theabove-mentioned and other techniques may be found in standard handbooks andreference books [38,39]. Enzo [40] recently reviewed the existing issues concerning
MD: SURYANARAYANA, JOB: 03320, PAGE: 109
4103-X_Suryanarayana_Ch07_R2_071504
Figure 7.8 Grain size distribution in MA Ti-45Al-2.4Si (at%) after hot isostatic pressing at875jC. (a) Overall distribution, showing log-normal distribution. (b) Phase-specific grain sizedistributions.
Characterization of Powders 109
MD: SURYANARAYANA, JOB: 03320, PAGE: 110
4103-X_Suryanarayana_Ch07_R2_071504
structural characterization of mechanically alloyed powders with special reference toamorphous and nanocrystalline alloys.
7.6 CRYSTALLITE SIZE AND LATTICE STRAIN
The crystallite size (size of the coherently diffracting domains, often equated with thegrain size in mechanically alloyed/milled powders) and lattice strain are perhaps themost important parameters in mechanically alloyed/milled powders. The ‘‘grain’’size, as obtained by XRD methods, is an average length of columns of the unit cellsnormal to the reflecting planes, and is also referred to as the column length.However, in subsequent discussions we will use the term grain size to denote thecrystallite size/column length determined by the XRD methods.
The grain size of materials can also be determined by direct TEM methods. Butthe time-consuming sample preparation, the very small area investigated (and thedoubt about whether it is representative of the whole sample studied), and theinvolved interpretation of the results can all be daunting and impractical if a largenumber of measurements must be made. On the other hand, sample preparation forXRD is simple and the information obtained is an average of a large number ofgrains. Therefore, XRD methods have been more commonly used to determine thegrain size. Furthermore, it is possible to easily obtain the lattice strain data from thesame analysis but it is more difficult by TEM methods. On the other hand,characterization of the defect structure, e.g., density and distribution of dislocations,presence of twins, stacking faults, antiphase boundaries, and so forth, can be donemore conveniently and accurately by TEM methods. The grain size and lattice strainin mechanically alloyed/milled powders can be determined by measuring the width(breadth) of the XRD peaks and using standard procedures. This has been done indetail in a few cases [41,42]. However, the more common approach has been tocalculate the grain size using the Scherrer formula, which does not take into accountthe lattice strain present in the powder. Consequently, this simple analysis under-estimates the actual grain size.
XRD peaks are broadened due to (1) instrumental effects, (2) small particlesize, and (3) lattice strain in the material. The presence of stacking faults also affectsthe positions and shapes of the peaks [10]. With increasing milling time, the particlesize decreases and reaches a saturation value. Simultaneously, the lattice strainincreases due to the generation of dislocations and other crystal defects. Both ofthese effects are shown in Figure 7.9 [43]. Consequently, the amount of peakbroadening increases with milling time. However, beyond the time when the particlesize reaches a saturation value, continued milling will not produce more dislocations(due to the difficulty of generating dislocations at very small grain sizes), but theexisting dislocations will be rearranged and some will be annihilated. Therefore, thelattice strain shows a decrease in value.
Before analyzing the XRD patterns to estimate the grain size and lattice strain, itis necessary to first separate the a1 and a2 components in the peak, and then con-centrate only on the a1 component. The next step is to subtract the effect ofinstrumental broadening from the experimental pattern before the individual contri-butions of grain size and lattice strain could be separated. Since instrumentalbroadening is independent of the powder under consideration, its contribution isevaluated by recording a diffraction pattern from a well-annealed pure sample such assilicon or LaB6, which will have a large grain size and no lattice strain. Subtraction of
Chapter 7110

MD: SURYANARAYANA, JOB: 03320, PAGE: 111
4103-X_Suryanarayana_Ch07_R2_071504
this instrumental broadening from the experimental profile is dependent on theassumption of the intrinsic peak profile (Cauchy, Gaussian, or combined), and theequations needed for this procedure can be found in the literature (see, for example,Ref. 42).
The individual contributions of grain size and lattice strain to total broadeningcan be separated using standard techniques such as the Williamson-Hall [44] orWarren-Averbach [45] approaches. These techniques have been subsequently mod-ified to obtain grain size distributions [46,47]. Since details of the calculations can befound in some of the standard textbooks on XRD [10,12] and/or research papers[41,42,48–51], only a brief description is provided here. The suggested references canbe consulted for full details and limitations of the techniques. Ungar [52] recentlyreviewed the meaning of size obtained from peak broadening in XRD patterns andcompared the size values obtained by XRD methods with those obtained by directmicrostructural studies, e.g., TEM.
The grain size of mechanically alloyed/milled powders decreases exponentiallywith time and reaches a saturation value when steady-state conditions have beenachieved. As shown in Figure 7.9, the crystallite/grain size decreases rapidly in theearly stages of milling and then more slowly reaching a few nanometers in a shortmilling time. The grain size then reaches a steady-state value and does not changeeven if the powder is milled for longer times. We shall later discuss the reasons forobtaining the small grain size and the minimal achievable grain size.
Most commonly the grain size is determined by measuring the full width at halfmaximal (FWHM) intensity of the Bragg diffraction peak and using the Scherrerformula:
Bt ¼0:9kt cos u
ð7:6Þ
Figure 7.9 Typical plot of crystallite size and lattice strain vs. milling time during MA/MM.Note that the crystallite size decreases and lattice strain increases rapidly in the early stages of
milling and then reaches a saturation value [43].
Characterization of Powders 111

where t is the crystallite size, k is the wavelength of the X-radiation used, Bt is thepeak width (in radians) due to particle size effect, and u is the Bragg angle. Thisequation can give reasonably correct values only if appropriate corrections forinstrumental and strain broadening have been made. However, if one is onlyinterested in following the trend of change of grain size with milling conditions,this simple technique may be acceptable, even without the above-mentioned correc-tions. In other words, one assumes that the contribution of strain to peakbroadening remains constant at all milling times, even though this is not true. Theinstrumental broadening is the same for all milling times and does not change.
While X-ray peak broadening due to small crystallite size is inversely propor-tional to cos u, that due to lattice strain is proportional to tan u. Thus, by combiningthese two equations one gets an equation for the total broadening (after subtractingthe instrumental broadening) as:
B ¼ 0:9kt cos h
þ g tan h ð7:7Þ
where D is the strain. Note that B in the above equation is the peak width (in radians)after subtracting the peak width due to instrumental broadening from the experi-mentally recorded profile. On rearrangement, the above equation can be presentedas:
B cos h ¼ 0:9kt
þ g sin h ð7:8Þ
Thus, when B cos u is plotted against sin u, a straight line is obtained with the slopeas D and the intercept as 0.9k/t (Fig. 7.10). From these values, one could calculate thegrain size t and the lattice strain D. It may be noted that the grain size is smaller thelarger the intercept and that the strain is higher the larger the slope. A worked outexample on how to determine the grain size and lattice strain in mechanically alloyedpowders may be found in Ref. 53.
The grain sizes obtained by the indirect X-ray peak broadening studies, afterincorporating the appropriate corrections, and the direct TEM techniques areexpected to be the same, and this has been found to be true in some cases [54–58].
MD: SURYANARAYANA, JOB: 03320, PAGE: 112
4103-X_Suryanarayana_Ch07_R2_071504
Figure 7.10 Plot of B cos u vs. sin u to determine the grain size and strain in mechanicallyalloyed powders. The intercept on the Y axis provides information on the grain size and theslope of the straight line gives the strain value.
Chapter 7112

But sometimes they do not match exactly. This is because sometimes researchers usethe Scherrer equation without making the appropriate corrections. Furthermore, theScherrer equation provides a volume-weighted average of the grain size and under-estimates the grain size by 11–38% by neglecting strain broadening. The error in theScherrer equation depends on the reflection used for the analysis, the amount ofstrain broadening, and the probability of stacking faults [45]. For example, thepresence of stacking faults and twin boundaries are known to reduce the apparentgrain sizes [59]. Nonlinearity of the B cos u vs. sin u is clear evidence of the presenceof a large number of stacking faults in the crystalline phase. Stacking faults havebeen frequently observed in the mechanically alloyed/milled materials with face-centered cubic and hexagonal close-packed structures (see, for example, Refs. 60–62). It has been reported that the true grain sizes are an order of magnitude largerthan the corresponding apparent values, calculated ignoring the presence of stackingfaults [62]. Furthermore, stacking faults induce a decrease of the FWHM value for(111) reflections and an increase for (200) reflections. Therefore, the real grain sizelies between these two calculated values [59]. It has been reported that the grain sizesdetermined by TEM methods are sometimes an order of magnitude larger than thosedetermined by XRD methods. This difference could be due to the fact that TEMmethods determine the true grain sizes (with high-angle grain boundaries) while theXRD methods determine the crystallite size; noting that the crystallite size is usuallysmaller than the grain size and that in extreme cases of very fine grain sizes, bothcould be the same size.
Comparing the grain size determinations by X-ray and TEM methods, Ungar[52] pointed out that the two measurements can be (1) identical to each other, (2) ingood qualitative correlation, or (3) totally different. It was pointed out that the twomeasurements are in perfect agreement with each other when one is dealing withloose powder particles of submicrometer grain size or nanocrystalline bulk materials,i.e., when the particle size is within the sensitivity range of XRD peak broadening.On the other hand, the X-ray methods can give the average size of subgrains ordislocation cells when one deals with bulk materials containing strain or dislocations.TEM measurements give much larger values of the grain size when one is dealingwith relatively larger grain sizes, beyond the general sensitivity of X-ray peak-broadening methods. It is useful to remember that whereas TEM techniques couldbe used to determine almost any crystallite/grain size, X-ray peak-broadeningmethods are most appropriate for grain sizes in the range 10–100 nm. For verylarge grain sizes, the intercept on the y axis becomes smaller and smaller, andtherefore the magnitude of error increases. The general conclusion is that the grainsize value calculated from the X-ray peak-broadening method is not much mean-ingful without knowing the microstructure of the sample and that these measure-ments should be supplemented with other techniques, such as TEM.
7.7 TRANSFORMATION BEHAVIOR
The mechanically alloyed/milled powders usually have very small grain sizes (reach-ing nanometer levels), and contain significant amount of lattice strain; in addition,the material is usually under far-from-equilibrium conditions containing metastablecrystalline, quasi-crystalline, or amorphous phases. All of these effects, either alone
MD: SURYANARAYANA, JOB: 03320, PAGE: 113
4103-X_Suryanarayana_Ch07_R2_071504
Characterization of Powders 113
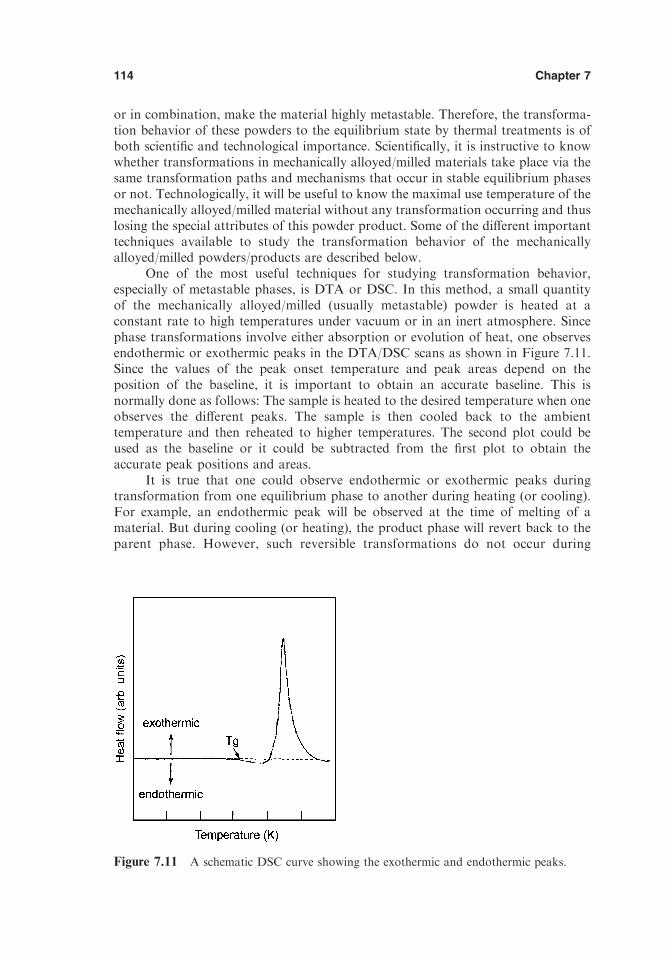
or in combination, make the material highly metastable. Therefore, the transforma-tion behavior of these powders to the equilibrium state by thermal treatments is ofboth scientific and technological importance. Scientifically, it is instructive to knowwhether transformations in mechanically alloyed/milled materials take place via thesame transformation paths and mechanisms that occur in stable equilibrium phasesor not. Technologically, it will be useful to know the maximal use temperature of themechanically alloyed/milled material without any transformation occurring and thuslosing the special attributes of this powder product. Some of the different importanttechniques available to study the transformation behavior of the mechanicallyalloyed/milled powders/products are described below.
One of the most useful techniques for studying transformation behavior,especially of metastable phases, is DTA or DSC. In this method, a small quantityof the mechanically alloyed/milled (usually metastable) powder is heated at aconstant rate to high temperatures under vacuum or in an inert atmosphere. Sincephase transformations involve either absorption or evolution of heat, one observesendothermic or exothermic peaks in the DTA/DSC scans as shown in Figure 7.11.Since the values of the peak onset temperature and peak areas depend on theposition of the baseline, it is important to obtain an accurate baseline. This isnormally done as follows: The sample is heated to the desired temperature when oneobserves the different peaks. The sample is then cooled back to the ambienttemperature and then reheated to higher temperatures. The second plot could beused as the baseline or it could be subtracted from the first plot to obtain theaccurate peak positions and areas.
It is true that one could observe endothermic or exothermic peaks duringtransformation from one equilibrium phase to another during heating (or cooling).For example, an endothermic peak will be observed at the time of melting of amaterial. But during cooling (or heating), the product phase will revert back to theparent phase. However, such reversible transformations do not occur during
MD: SURYANARAYANA, JOB: 03320, PAGE: 114
4103-X_Suryanarayana_Ch07_R2_071504
Figure 7.11 A schematic DSC curve showing the exothermic and endothermic peaks.
Chapter 7114

transformation of metastable phases such as amorphous phases, i.e., a peak of theopposite sign is not observed; in fact, there will be no peak at all. Furthermore,because metastable phases are always more energetic than the correspondingequilibrium phases, they often exhibit exothermic peaks in the DTA/DSC plots.
From the DTA/DSC scans, one can evaluate the temperatures at which phasetransformations are occurring as well as the magnitudes of heat released orabsorbed. For example, if one heats an amorphous alloy powder to higher andhigher temperatures, one expects to observe a glass transition temperature Tg and acrystallization temperature Tx at a still higher temperature. A very broad andshallow peak is observed at relatively low temperatures if structural relaxation ofthe amorphous phase occurs. It is also possible that complete crystallization takesplace in different stages; therefore, more than one exothermic peak is present in theDTA/DSC plot, each peak corresponding to a crystallization event. Figure 7.12schematically represents these events of crystallization in an amorphous alloy. Byquenching the sample from a temperature just above the DTA/DSC peak temper-ature, and recording the XRD patterns, one can investigate the structural changesthat took place in the sample. TEM investigations can also be conducted to uncoverthe microstructural and crystal structure changes on a finer scale; in addition,compositional changes can be detected. Details of the crystallization behavior ofmetallic glasses produced by rapid solidification processing techniques have beenreviewed [63–65]. Similar techniques and procedures could be used to study thecrystallization behavior of amorphous alloys processed by MA/MM techniques. Itmay be pointed out, however, that there have not been many detailed crystallizationstudies of amorphous alloys synthesized by the MA/MM techniques [66].
The crystallization temperature is measured either as the temperature atwhich the exothermic peak starts or the temperature corresponding to theexothermic peak. Whatever is the value chosen, the crystallization temperaturechanges with the heating rate, and it increases with increasing heating rate. By
MD: SURYANARAYANA, JOB: 03320, PAGE: 115
4103-X_Suryanarayana_Ch07_R2_071504
Figure 7.12 A schematic DSC curve depicting the different stages during crystallization ofan amorphous phase.
Characterization of Powders 115

MD: SURYANARAYANA, JOB: 03320, PAGE: 116
4103-X_Suryanarayana_Ch07_R2_071504
measuring the peak temperatures Tp at different heating rates h, the activationenergy for crystallization Q can be evaluated using the Kissinger equation:
lnbT2p
!¼ � Q
RTp
� �þ A ð7:9Þ
where A is a constant and R is the universal gas constant. Thus, by plotting (h/Tp2
against 1/Tp one obtains a straight line whose slope is �Q/R, from which theactivation energy Q can be calculated [67]. It is also possible to evaluate theindividual activation energies for the nucleation and growth stages of the trans-formation, from which information about the mechanism of transformation couldbe ascertained. Thus, with the combination of DTA/DSC and XRD/TEMtechniques, it would be possible to obtain full information about the transforma-tion temperatures, the number of stages in which the transformation is occurring,details about the product(s) of each individual transformation (crystal structure,microstructure, and chemical composition), and the activation energy (and also theatomic mechanism) for the transformation. The greatest advantage of the Kissingermethod is that one could get the required data during continuous heating in aDSC, which is far more convenient to employ than the time-consuming isothermalanalyses studies.
The Kissinger method may not be useful in all studies of decomposition. Forexample, metallic glasses may decompose by nucleation, growth, or a combination ofboth processes. In such a case, the decomposition is seldom described by first-orderreaction kinetics, when the Kissinger method may not be applicable [68,69].
By recording the isothermal DSC scans at different temperatures, it is possibleto study the kinetics of transformation by conducting the Johnson-Mehl-Avramianalysis. For example, during crystallization of an amorphous phase, this is done bycalculating the volume fraction of the crystalline phase formed, x(t), at time t andusing the equation:
xðtÞ ¼ 1� expð�ktnÞ ð7:10Þ
where k is a temperature-sensitive factor [= ko exp(�Q/RT ), where Q is the ap-parent activation energy and ko a constant) and n is an exponent that reflects thenucleation rate and/or the growth mechanism. x(t) is obtained by measuring the areaunder the peak of the isothermal DSC trace at different times and dividing that withthe total area. Equation 7.10 can also be written as:
ln �ln 1� xðtÞf g½ ¼ ln kþ n lnðtÞ ð7:11Þ
Thus, by plotting ln[�ln(1 � x)] against ln(t), one obtains a straight line with theslope n. Such analyses have been done in some cases [70,71]. In such cases, when thefirst-order reaction kinetics are not obeyed, the analysis of the data according to theJohnson-Mehl-Avramai-Kolmogorov method will more accurately provide infor-mation about the nature of the transformation. Such an analysis was conducted byHe and Courtney [72] for studying the decomposition behavior of mechanicallyalloyed W-Ni-Fe noncrystalline materials. However, if the reaction can be describedas first order, the difference in the values of the activation energy may be small(typically about 10%).
Chapter 7116
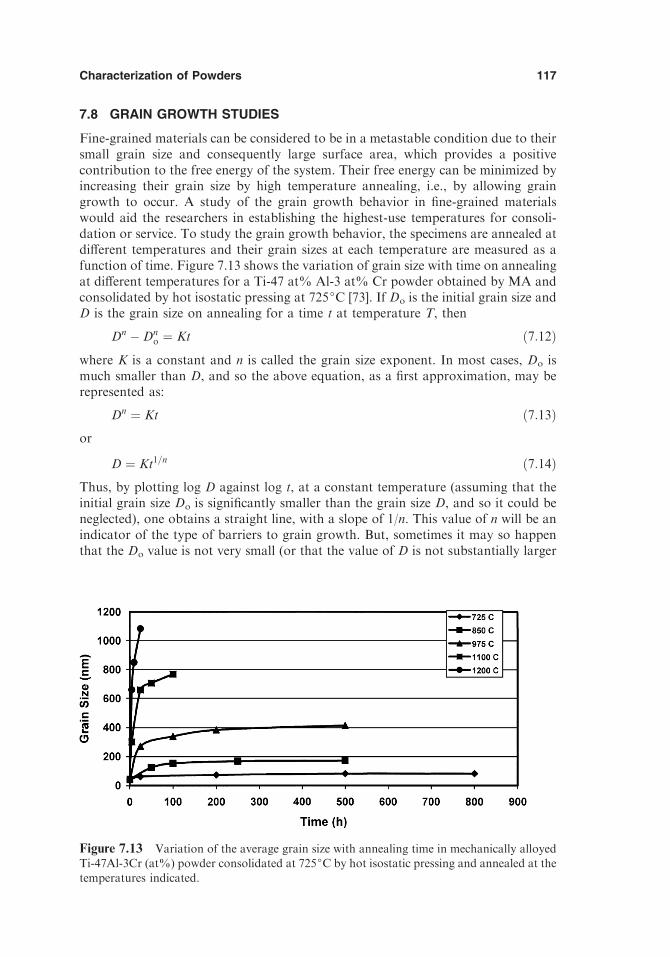
7.8 GRAIN GROWTH STUDIES
Fine-grained materials can be considered to be in a metastable condition due to theirsmall grain size and consequently large surface area, which provides a positivecontribution to the free energy of the system. Their free energy can be minimized byincreasing their grain size by high temperature annealing, i.e., by allowing graingrowth to occur. A study of the grain growth behavior in fine-grained materialswould aid the researchers in establishing the highest-use temperatures for consoli-dation or service. To study the grain growth behavior, the specimens are annealed atdifferent temperatures and their grain sizes at each temperature are measured as afunction of time. Figure 7.13 shows the variation of grain size with time on annealingat different temperatures for a Ti-47 at% Al-3 at% Cr powder obtained by MA andconsolidated by hot isostatic pressing at 725jC [73]. If Do is the initial grain size andD is the grain size on annealing for a time t at temperature T, then
Dn �Dno ¼ Kt ð7:12Þ
where K is a constant and n is called the grain size exponent. In most cases, Do ismuch smaller than D, and so the above equation, as a first approximation, may berepresented as:
Dn ¼ Kt ð7:13Þor
D ¼ Kt1=n ð7:14ÞThus, by plotting log D against log t, at a constant temperature (assuming that theinitial grain size Do is significantly smaller than the grain size D, and so it could beneglected), one obtains a straight line, with a slope of 1/n. This value of n will be anindicator of the type of barriers to grain growth. But, sometimes it may so happenthat the Do value is not very small (or that the value of D is not substantially larger
MD: SURYANARAYANA, JOB: 03320, PAGE: 117
4103-X_Suryanarayana_Ch07_R2_071504
Figure 7.13 Variation of the average grain size with annealing time in mechanically alloyedTi-47Al-3Cr (at%) powder consolidated at 725jC by hot isostatic pressing and annealed at the
temperatures indicated.
Characterization of Powders 117

MD: SURYANARAYANA, JOB: 03320, PAGE: 118
4103-X_Suryanarayana_Ch07_R2_071504
than D0 so that Do could not be neglected). In such a case, the value of n could becalculated from the following Eq. (7.15), obtained by differentiating Eq. (7.12) withrespect to time, t, and then taking logarithms on both sides:
logdDðtÞdt
¼ �ðn� 1Þlog DðtÞ þ log K� log n ð7:15Þ
According to theoretical estimates, n is expected to be equal to 2, i.e., a plot of D2
against t should be a straight line [74]. Most reported experimental work does notfollow this trend, even though this is observed to be true in some cases whenmaterials were annealed at very high homologous temperatures to study graingrowth behavior or in extremely high-purity metals [75]. In reality, the grain sizeexponent has been found to vary from low values of 2 to as high as 10 [73], eventhough in some cases it has been reported to be unrealistically large, e.g., between 8.9and 16.6, during annealing of mechanically alloyed g-TiAl alloys [76]. The n valueswere even higher (between 12.1 and 44.3) when g-TiAl alloys containing 10 vol%TiB2 were investigated [76].
The value of K, as the intercept on the y axis, when log D is plotted against logt, measured at different temperatures, obeys the equation:
K ¼ K0 exp ð�Q=RTÞ ð7:16Þ
where K0 is another constant and R is the universal gas constant. By plotting ln Kagainst 1/T, one obtains a straight line, the slope of which corresponds to Q/R, fromwhich Q, the activation energy for grain growth, can be calculated. Grain growthstudies have been conducted using TEM, SEM, AP-FIM, XRD, electrical resistivity,and so forth. In fact, any property or technique that is sensitive to changes in grainsize could be used to monitor the grain growth behavior.
In addition to the techniques mentioned above, some researchers have alsoused some specialized and advanced techniques to characterize the microstructure,crystal structure, and surface state/composition of the powders using AES, XPS, andother techniques. Details of most of the characterization techniques mentionedabove may be found in standard reference books (see, for example, Refs. 38 and 39).
From the above description it is clear that a number of techniques are availableto characterize the mechanically alloyed/milled materials to obtain informationabout the crystal structure and lattice parameters of the phase(s) produced, calculatethe grain size and strain present, evaluate the microstructural features and compo-sitions of the phases, and study the transformation behavior of the non-equilibriumphases. However, it is always beneficial and conclusive to confirm the resultsobtained by one technique with the aid of another.
REFERENCES
1. Groza, J. R. (1999). In: Suryanarayana, C., ed. Non-equilibrium Processing of Materials.
Oxford, UK: Pergamon Press, pp. 345–372.2. German, R. M. (1994). Powder Metallurgy Science. 2nd ed. Princeton, NJ: Metal Powder
Industries Federation, pp. 28–78.
3. ASM Handbook. Vol. 7. (1998). Powder Metal Technologies and Applications. MaterialsPark, OH: ASM International, 1998.
4. Calka, A., Wexler, D. (2001). Mater. Sci. For. 360–362:301–310.
Chapter 7118

MD: SURYANARAYANA, JOB: 03320, PAGE: 119
4103-X_Suryanarayana_Ch07_R2_071504
5. Harris, A. M., Schaffer, G. B., Page, N. W. (1996). Scripta Metall. Mater. 34:67–73.6. Zoz, H., Ren, H., Reichardt, R., Benz, H. U. (1999). P/M Sci. Tech. Briefs 1:15–19.7. Giesche, H. (1998). ASM Handbook. Powder Metal Technologies and Applications. Vol.
7. Materials Park, OH: ASM International, pp. 274–277.8. Brunauer, S., Emmett, P. H., Teller, E. (1938). J. Am. Chem. Soc. 6:309.9. Powder Diffraction File. Inorganic Phases Search Manual. Swarthmore, PA: Interna-
tional Center for Diffraction Data.10. Suryanarayana, C., Norton, M. G. (1998). X-Ray Diffraction: A Practical Approach. New
York: Plenum, pp. 237–249.
11. Suryanarayana, C. (2001). Prog. Mater. Sci. 46:1–184.12. Cullity, B. D., Stock, S. R. (2001). Elements of X-Ray Diffraction. 3rd ed. Englewood
Cliffs, NJ: Prentice Hall.
13. Charlot, F., Bernard, F., Gaffet, E., Klein, D., Niepce, J. C. (1999). Acta Mater. 47:619–629.
14. Gras, C., Bernsten, N., Bernard, F., Gaffet, E. (2002). Intermetallics 10:271–282.15. Cargill, G. S. III (1975). Solid State Phys. 30:227–320.
16. Waseda, Y. (1980). The Structure of Non-Crystalline Materials. New York: McGraw-Hill.
17. Cocco, G. (1992). Mater. Sci. For. 88–90:703–710.
18. Hunt, J. A., Soletta, I., Battezzati, L., Cowlam, N., Cocco, G. (1993). J. AlloysCompounds 194:311–317.
19. Hunt, J. A., Rose, P., Li, M., Soletta, I., Cowlam, N., Cocco, G., Enzo, S., Battezzati, L.
(1993). Key Eng. Mater. 81–83:115–120.20. Inoue, A. (2000). Acta Mater. 48:279–306.21. Hays, C., Kim, C. P., Johnson, W. L. (1999). Appl. Phys. Lett. 75:1089–1091.
22. Chen, L. C., Spaepen, F. (1988). Nature 336:366–367.23. Chen, L. C., Spaepen, F. (1991). J. Appl. Phys. 69:679–688.24. Williams, D. B., Carter, C. B. (1996). Transmission Electron Microscopy. New York:
Plenum.
25. Thompson-Russell, K. C., Edington, J. W. (1977). Electron Microscope Specimen Pre-paration Techniques in Materials Science. Eindhoven, The Netherlands: NV Philips’Gloeilampenfabrieken.
26. Yang, S. Y., Nash, P., Bradley, S. (1987). J. Mater. Sci. Lett. 6:982–984.27. Harris, A. M., Schaffer, G. B., Page, N. W. (1993). J. Mater. Sci. Lett. 12:160–161.28. Huang, J. Y., He, A. Q., Wu, Y. K., Ye, H. Q. (1994). J. Mater. Sci. Lett. 13:1201–1203.
29. Zghal, S., Bhattacharya, P., Twesten, R., Wu, F., Bellon, P. (2002).Mater. Sci. For. 386–388, 165–174.
30. Prenitzer, B. I., Giannuzzi, L. A., Newman, K., Brown, S. R., Irwin, R. B., Shofner, T.L., Stevie, F. A. (1998). Metall. Mater. Trans. 29A:2399–2406.
31. Lomness, J. K., Giannuzzi, L. A., Hampton, M. D. (2001). Microsc. Microanal. 7:418–423.
32. Kurzydlowski, K. J., Ralph, B. (1995). The Quantitative Description of the Microstructure
of Materials. Boca Raton, FL: CRC.33. Bohn, R., Fanta, G., Klassen, T., Bormann, R. (2001). J. Mater. Res. 16:1850–1861.34. Ivchenko, V. A., Wanderka, N., Czubayko, U., Naundorf, V., Yermakov, A.Ye, Uimin,
M. A., Wollenberger, H. (2000). Mater. Sci. For. 343–346:709–714.35. Ivchenko, V. A., Uimin, M. A., Yermakov, A. Ye, Korobeinikov, A. Yu. (1999). Surf.
Sci. 440:420–428.
36. Le Caer, G., Delcroix, P., Foct, J. (1998). Mater. Sci. For. 269–272:409–418.37. Yelsukov, E. P., Formin, V. M., Nemtsova, O. M., Shklyaev, D. A. (2002). Mater. Sci.
For. 386–388:181–186.38. Lifshin, E., ed. (1994). Materials Science and Technology–A Comprehensive Treatment.
Vols. 2A and 2B. Weinheim, Germany: VCH.
Characterization of Powders 119

MD: SURYANARAYANA, JOB: 03320, PAGE: 120
4103-X_Suryanarayana_Ch07_R2_071504
39. Brundle, C. R., Evans, C. A. Jr., Wilson, S., Fitzpatrick, L. E., eds. (1992). Encyclopediaof Materials Characterization. Boston, MA: Butterworth-Heinemann.
40. Enzo, S. (1998). Mater. Sci. For. 269–272:363–372.
41. Pradhan, S. K., Chakraborty, T., Sen Gupta, S. P., Suryanarayana, C., Frefer, A., Froes,F. H. (1995). Nanostructured Mater. 5:53–61.
42. Tian, H. H., Atzmon, M. (1999). Phil. Mag. A79:1769–1786.
43. Lucks, I., Lamaparter, P., Mittemeijer, E. J. (2001). Acta Mater. 49:2419–2428.44. Williamson, G. K., Hall, W. H. (1953). Acta Met. 1:22–31.45. Warren, B. E., Averbach, B. L. (1950). J. Appl. Phys. 21:595.
46. Weismuller, J. (1996). In: Bourell, D. L., ed. Synthesis and Processing of NanocrystallinePowder. Warrendale, PA: TMS, pp. 3–19.
47. Krill, C. E., Birringer, R. (1998). Phil. Mag. A77:621–640.
48. McCandlish, L. E., Seegopaul, P., Wu, L. (1997). In: Kneringer, G., Rodhammer, P.,Wilhartitz, P., eds., Proc. 14th International Plansee Seminar. Vol. 4. Reutte, Tyrol,Austria: Plansee AG, pp. 363–375.
49. Lonnberg, B. (1994). J. Mater. Sci. 29:3224–3230.
50. Aymard, L., Dehahaye-Vidal, A., Portemer, F., Disma, F. (1996). J. Alloys Compounds238:116–127.
51. Salimon, A. I., Korsunsky, A. M., Ivanov, A. N. (1999).Mater. Sci. Eng. A271:196–205.
52. Ungar, T. (2003). Adv. Eng. Mater. 5:323–329.53. Suryanarayana, C., Norton, M. G. (1998). X-Ray Diffraction: A Practical Approach.
New York: Plenum, pp. 207–221.
54. Malow, T. R., Koch, C. C. (1997). Acta Mater. 45:2177–2186.55. Tsuzuki, T., McCormick, P. G. (2000). Mater. Sci. For. 343–346:383–388.56. Liu, K. W., Mucklich, F., Pitschke, W., Birringer, R., Wetzig, K. (2001). Z. Metallkde.
92:924–930.57. Ahn, J. H., Wang, G. X., Liu, H. K., Dou, S. X. (2001).Mater. Sci. For. 360–362:595–602.58. Gonzalez, G., D’Angelo, L., Ochoa, J., D’Onofrio, J. (2001). Mater. Sci. For. 360–
362:349–354.
59. Warren, B. E. (1990). X-Ray Diffraction. New York: Dover, p. 251.60. Gayle, F. W., Biancaniello, F. S. (1995). Nanostructured Mater. 6:429–432.61. Gialanella, S., Lutterotti, L. (1995). Mater. Sci. For. 179–181:59–64.
62. Tcherdyntsev, V. V., Kaloshkin, S. D., Tomilin, I. A., Shelekhov, E. V., Baldokhin, Y. V.(1999). Z. Metallkde. 90:747–752.
63. Scott, M. G. (1983). In: Luborsky, F. E., ed. Amorphous Metallic Alloys. London, UK:
Butterworths, pp. 144–168.64. Koster, U., Herold, U. (1981). In: Guntherodt, H. J., Beck, H. eds. Glassy Metals I.
Berlin, Germany: Springer-Verlag, pp. 225–259.65. Ranganathan, S., Suryanarayana, C. (1985). Mater. Sci. For. 3:173–185.
66. Sherif El-Eskandarany, M., Saida, J., Inoue, A. (2002). Acta Mater. 50:2725–2736.67. Kissinger, H. E. (1957). Anal. Chem. 29:1702–1706.68. Greer, A. L. (1982). Acta Metall. 30:171–192.
69. Henderson, D. W. (1979). J. Non-Cryst. Solids 30:301–315.70. Baro, M. D., Surinach, S., Malagaleda, J. (1993). In: deBarbadillo, J. J., et al. eds.
Mechanical Alloying for Structural Applications. Materials Park, OH: ASM Interna-
tional, pp. 343–348.71. Zhou, C. R., Lu, K., Xu, J. (2000). Mater. Sci. For. 343–346:116–122.72. He, Z., Courtney, T. H. (2003). Mater. Sci. Eng. A346:141–148.
73. Senkov, O. N., Srisukhumbowornchai, N., Ovec�oglu, M. L., Froes, F. H. (1998). J.Mater. Res. 13:3399–3410.
74. Atkinson, H. V. (1988). Acta Metall. 36:469–491.75. Hu, H., Rath, B. B. (1970). Metall. Trans. 1:3181–3184.
76. Kambara, M., Uenishi, K., Kobayashi, K. F. (2000). J. Mater. Sci. 35:2897–2905.
Chapter 7120

8
Temperature Rise During Milling
8.1 INTRODUCTION
The intense mechanical deformation experienced by powder particles duringmechanical alloying (MA) results in the generation of a variety of crystal defects(dislocations, grain boundaries, stacking faults, antiphase boundaries, vacancies, andso forth). As mentioned earlier, the balance between cold welding and fracturingamong the powder particles is responsible for structural changes and the alloyingthat occurs in them. However, crystal defects also play a major role in the alloyingbehavior, due to enhanced diffusivity of solute atoms in the presence of increaseddefect density. Furthermore, as mentioned in Chapter 5, a number of processvariables during milling also affect the final constitution of the milled powder.Among these, the temperature experienced by the powder particles during milling isvery important in determining the nature of the final powder product. This is againrelated to the increased diffusivity of solute atoms for alloying to occur.
It has been reported that more than 90% (different values have been quoted bydifferent investigators) of the mechanical energy imparted to the powders duringmilling is transformed into heat [1] and this raises the temperature of the powder.Assuming that, under the given conditions of milling, an amorphous phase or acrystalline phase could form in the milled powder, the temperature experienced bythe powder would determine the nature of the phase. If the temperature experiencedby the powder is high, the associated higher diffusivity (higher atomic mobility) leadsto processes resulting in recovery (and recrystallization). In such a case, a stablecrystalline phase would form. This crystalline phase could be an intermetallic or asolid solution. On the other hand, if the temperature experienced by the powder islow, then defect recovery would be lower and an amorphous (or a nanocrystalline)
4103-X_Suryanarayana_Ch08_R2_071504
MD: SURYANARAYANA, JOB: 03320, PAGE: 121
121
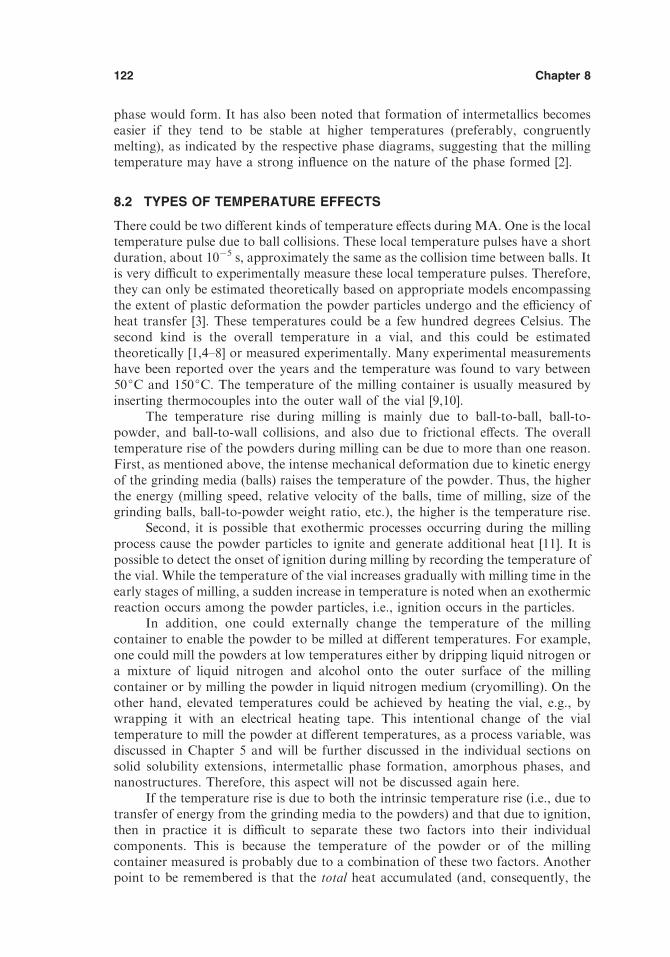
MD: SURYANARAYANA, JOB: 03320, PAGE: 122
4103-X_Suryanarayana_Ch08_R2_071504
phase would form. It has also been noted that formation of intermetallics becomeseasier if they tend to be stable at higher temperatures (preferably, congruentlymelting), as indicated by the respective phase diagrams, suggesting that the millingtemperature may have a strong influence on the nature of the phase formed [2].
8.2 TYPES OF TEMPERATURE EFFECTS
There could be two different kinds of temperature effects during MA. One is the localtemperature pulse due to ball collisions. These local temperature pulses have a shortduration, about 10�5 s, approximately the same as the collision time between balls. Itis very difficult to experimentally measure these local temperature pulses. Therefore,they can only be estimated theoretically based on appropriate models encompassingthe extent of plastic deformation the powder particles undergo and the efficiency ofheat transfer [3]. These temperatures could be a few hundred degrees Celsius. Thesecond kind is the overall temperature in a vial, and this could be estimatedtheoretically [1,4–8] or measured experimentally. Many experimental measurementshave been reported over the years and the temperature was found to vary between50jC and 150jC. The temperature of the milling container is usually measured byinserting thermocouples into the outer wall of the vial [9,10].
The temperature rise during milling is mainly due to ball-to-ball, ball-to-powder, and ball-to-wall collisions, and also due to frictional effects. The overalltemperature rise of the powders during milling can be due to more than one reason.First, as mentioned above, the intense mechanical deformation due to kinetic energyof the grinding media (balls) raises the temperature of the powder. Thus, the higherthe energy (milling speed, relative velocity of the balls, time of milling, size of thegrinding balls, ball-to-powder weight ratio, etc.), the higher is the temperature rise.
Second, it is possible that exothermic processes occurring during the millingprocess cause the powder particles to ignite and generate additional heat [11]. It ispossible to detect the onset of ignition during milling by recording the temperature ofthe vial. While the temperature of the vial increases gradually with milling time in theearly stages of milling, a sudden increase in temperature is noted when an exothermicreaction occurs among the powder particles, i.e., ignition occurs in the particles.
In addition, one could externally change the temperature of the millingcontainer to enable the powder to be milled at different temperatures. For example,one could mill the powders at low temperatures either by dripping liquid nitrogen ora mixture of liquid nitrogen and alcohol onto the outer surface of the millingcontainer or by milling the powder in liquid nitrogen medium (cryomilling). On theother hand, elevated temperatures could be achieved by heating the vial, e.g., bywrapping it with an electrical heating tape. This intentional change of the vialtemperature to mill the powder at different temperatures, as a process variable, wasdiscussed in Chapter 5 and will be further discussed in the individual sections onsolid solubility extensions, intermetallic phase formation, amorphous phases, andnanostructures. Therefore, this aspect will not be discussed again here.
If the temperature rise is due to both the intrinsic temperature rise (i.e., due totransfer of energy from the grinding media to the powders) and that due to ignition,then in practice it is difficult to separate these two factors into their individualcomponents. This is because the temperature of the powder or of the millingcontainer measured is probably due to a combination of these two factors. Anotherpoint to be remembered is that the total heat accumulated (and, consequently, the
Chapter 8122

MD: SURYANARAYANA, JOB: 03320, PAGE: 123
4103-X_Suryanarayana_Ch08_R2_071504
temperature experienced) by the vial, the powder, and the balls, due to intrinsic orexternal effects, remains constant during milling for a given set of milling conditions.This is due to the balance achieved between the temperature rise due to mechanicalforces and/or exothermic reactions and the heat loss to the surroundings byconduction, radiation, and so forth. Therefore, when the mill is turned off, redis-tribution of the heat occurs between the balls and the vial. Experimentally, it hasbeen observed that the temperature of the vial increases above the ambient after themill is turned off, for a short duration of time, suggesting that heat transfer occursfrom the powder and balls, which are at a higher temperature, to the vial which is ata lower temperature. Depending on the thermal conductivity of the vial material,attainment of thermal equilibrium may take a few minutes.
8.3 METHODS TO EVALUATE TEMPERATURE RISE
The temperature rise in powders during MA was evaluated in three different ways.One was to calculate the temperature rise based on some theoretical models bymaking some valid assumptions. The second method was to look at the micro-structural changes and/or phase transformations that occur in the powders andestimate the approximate temperature the powder might have experienced. The mostdirect way is to measure the actual temperature rise experimentally, using thermo-couples or other instruments. Results are available on all three methods ofascertaining the temperature increase. Koch published a comprehensive review onthe temperature effects during mechanical alloying and milling [12].
Let us look at the different ways in which the temperature rise during MA hasbeen estimated either theoretically or through microstructural means, as well asbased on experimental measurements.
8.3.1 Methodology Behind the Theoretical Models
Several attempts have been made to estimate either the instantaneous temperaturerise at the time of collision between two grinding media or the overall temperaturerise during the milling operation. In brief, the investigators calculate the kineticenergy of the grinding medium and assume that a part of this kinetic energy isutilized in plastically deforming the powder particles. This fraction of the energy istransformed into heat, and so the temperature increase is calculated based on thethermal properties of the powder and the balls. The different models differ in the waythe powder particles are assumed to become deformed (the nature of forces—impact,shear, or a combination of both), fraction of the energy utilized in plasticallydeforming the powder particles, and heat transfer conditions and efficiency of heattransfer.
Depending on the model used, the estimated temperature rises are different.For example, when Nb powder was impacted by an 8-mm steel ball at 6 m/s, the bulktemperature rise was estimated to be 48 K [4] or 130 K [13], depending on theassumptions made in the model. But much higher temperature rises have beenpredicted at the contact surface [3]. On the basis of the assumption that shearing ofpowder particles trapped between colliding grinding media increases the bulktemperature of the powder, Eckert et al. [14] estimated that the peak temperaturefor Ni70Zr30 particles could reach values between 130jC and 407jC, depending onthe milling intensity. Based on a similar approach, and assuming that the temper-
Temperature Rise During Milling 123

MD: SURYANARAYANA, JOB: 03320, PAGE: 124
4103-X_Suryanarayana_Ch08_R2_071504
ature rise could be due to sliding friction, the effective temperature rise was estimatedto be only between 10jC and 40jC for Ge-Si and Ni-Ti powders [4,5]. A temperatureof 180jC was estimated at the collision site for a Ni-Zr alloy [15], whereas temper-atures as high as 668jC for a ball velocity of 6 m/s and 1187jC for a ball velocity of8 m/s have been reported [3]. Let us now look at the details of the different modelsused to estimate the temperature rise during the milling operation.
8.3.2 Theoretical Models
One of the early models to calculate the temperature rise during milling of powderswas due to Schwarz and Koch [4]. They assumed that the powder particles trappedbetween two colliding grinding media deform by localized shear and estimated thepeak temperature attained by the powder particles during MA. Calculating theenergy flux dissipated on the powder surface as J = jnvr, where jn is the normalcompressive stress developed by head-on collision of two balls (grinding media) andvr is the relative velocity of the grinding balls before impact (assumed as 2 m/s), theyestimated the maximum temperature rise, DT, as:
DT ¼ JDt
knUc
� �12
ð8:1Þ
where Dt is the time duration for which the normal stress lasts, n is the thermalconductivity, U the density, and c the specific heat of the powder particles. Using theappropriate material constants for Ni32Ti68 and Ni45Nb55 alloys, the maximaltemperature rise was calculated as 38 K for both the alloys [4]. However, applicationof this analysis to a Si-Ge powder mixture yielded a DT value of only 10 K for Geand 7 K for Si [5]. A similar small temperature increase (4 K) was also estimated byassuming that the particles make contact with one another over a limited surfacearea and that sliding friction is the responsible feature for increase in temperature [5].These models are very simplified approximations to the complex mechanics/physicsoccurring during milling of powder particles but yield results somewhat similar tothose of the other more realistic models.
Davis et al. [7] tried to develop a mathematical model for the kinetics of millingin a SPEX shaker mill by recording the movement of grinding media in a transparentvial on videotape and inferring the ball movements based on classical mechanics andanalytical geometry. They noted that the vast majority of ball impacts lead to energydissipation of 10�3–10�2 J during the collision events. This energy range correspondsto ball velocities of approximately 6 m/s (for 10�3 J) and 19 m/s (for 10�2 J), fromwhich the normal energies due to head-on collisions and consequently the maximaltemperature increase could be calculated. Equation (8.1) suggests that these ballvelocities produce a temperature rise of 112 K and 350 K, respectively. Based on thestatistical distribution of the number of impacts and their energies, the authors [7]concluded that after 15 min of milling only about 1% of the total impacts result inthe expected temperature rise between 112 and 350 K.
Assuming that plastic deformation work during MA is entirely converted to anadiabatic temperature rise DT in the impacted powder volume, one can write:
Vc
Ðjdq ¼ Vcc DT ð8:2Þ
where Vc is the powder volume impacted, j the flow stress, q the strain, and c thespecific heat. Using a low-temperature constitutive plasticity equation, j=jo +Kqn,
Chapter 8124
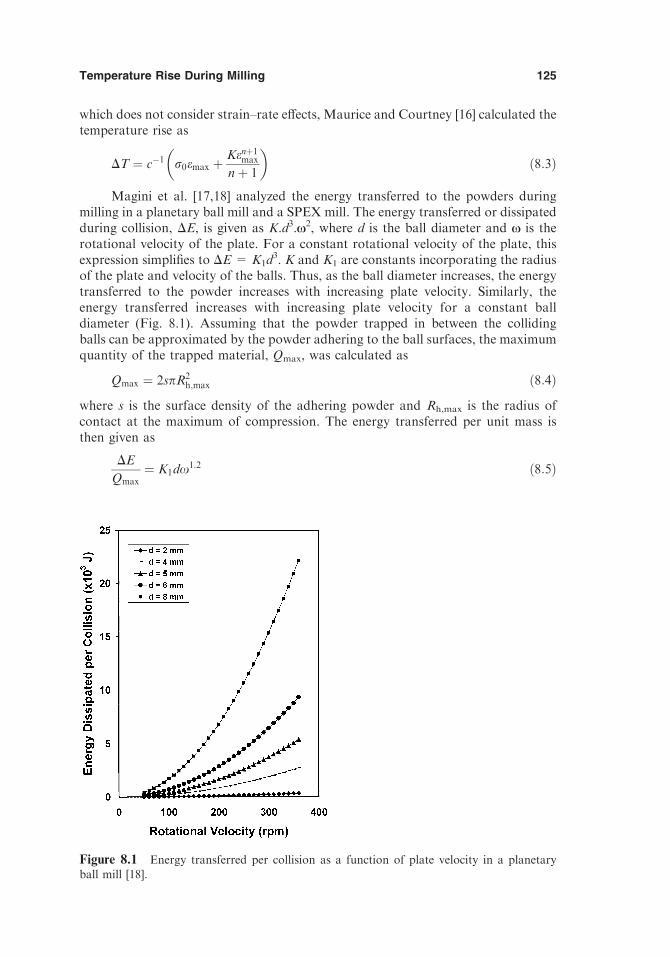
which does not consider strain–rate effects, Maurice and Courtney [16] calculated thetemperature rise as
DT ¼ c�1 r0emax þKenþ1
max
nþ 1
� �ð8:3Þ
Magini et al. [17,18] analyzed the energy transferred to the powders duringmilling in a planetary ball mill and a SPEX mill. The energy transferred or dissipatedduring collision, DE, is given as K.d3.N2, where d is the ball diameter and N is therotational velocity of the plate. For a constant rotational velocity of the plate, thisexpression simplifies to DE = K1d
3. K and K1 are constants incorporating the radiusof the plate and velocity of the balls. Thus, as the ball diameter increases, the energytransferred to the powder increases with increasing plate velocity. Similarly, theenergy transferred increases with increasing plate velocity for a constant balldiameter (Fig. 8.1). Assuming that the powder trapped in between the collidingballs can be approximated by the powder adhering to the ball surfaces, the maximumquantity of the trapped material, Qmax, was calculated as
Qmax ¼ 2spR2h;max ð8:4Þ
where s is the surface density of the adhering powder and Rh,max is the radius ofcontact at the maximum of compression. The energy transferred per unit mass isthen given as
DE
Qmax¼ K1dx
1:2 ð8:5Þ
MD: SURYANARAYANA, JOB: 03320, PAGE: 125
4103-X_Suryanarayana_Ch08_R2_071504
Figure 8.1 Energy transferred per collision as a function of plate velocity in a planetaryball mill [18].
Temperature Rise During Milling 125

Assuming that this energy results in an adiabatic temperature rise, DT can be given as
DT ¼ DE
Qmaxcð8:6Þ
where c is the specific heat of the powder material.The models so far described estimate the bulk temperature of the powder.
However, there have been some attempts [19] to explain that the local temperaturesat the point of contact could be high enough to melt the powder particles.Furthermore, the local surface temperatures could be important in adhesion eventsamong powder particles. Therefore, it would be instructive to calculate the maximaltemperature rise at the time of contact between two grinding media.
Bhattacharya and Arzt [3] calculated the contact temperature of the powdercompact’s surfaces, considering that head-on collisions occur during collision betweentwo grinding media. Therefore, the calculated value will be the upper bound of thetemperature rise. In arriving at these values, the authors have assumed that (1) the timeof impact,Ds, could be approximated using Hertz’s theory of elastic impact, and (2) theenergy flux at the compact surface is uniform over the entire contact area and isconstant for times less thanDs. They have also assumed in their calculations that only asmall fraction, h, of the kinetic energy E = 1⁄2mv2, where m is the mass and v is therelative velocity of the balls, is utilized in plastically deforming the powder, i.e., theexpended plastic energy, Up = hE. By taking the appropriate heat transfer conditionsinto consideration, they calculated the temperature rise, DT, as
DT ¼ 2q2 DsUct0
þ q2t02j
1
3� 2
p2
Xln¼1
ð�1Þn
n2exp � 4n2p2a Ds
t20
� �cosðnpÞ
" #ð8:7Þ
where
q2 ¼ dQ
pr20Ds
ð8:8Þ
and Q represents the average quantity of heat arising from the total deformationprocess over a time interval Ds, y is the fraction of heat flowing into the powdercompact, n is the thermal conductivity of the powder, t0 is the thickness of thepowder cylinder, r0 is the radius of the powder compact, and a is the thermaldiffusivity (Fig. 8.2). As mentioned earlier, this DT is the maximal temperatureattained at the contact surface. Assuming that niobium powder is milled usingstainless steel balls and that the powder compact has a thickness of t0 = 100 Am andradius r0 = 263 Am, the authors calculated the maximal temperature reached at thetime of contact. These values are listed in Table 8.1. Even though the contact
MD: SURYANARAYANA, JOB: 03320, PAGE: 126
4103-X_Suryanarayana_Ch08_R2_071504
Figure 8.2 Geometrical parameters involving an impact between two grinding balls and thepowder compact [3].
Chapter 8126

MD: SURYANARAYANA, JOB: 03320, PAGE: 127
4103-X_Suryanarayana_Ch08_R2_071504
temperatures calculated are quite high, they are surface temperatures and decay veryfast with distance into the center of the compact. It was shown that the powderreaches room temperature at half the thickness of the compact, i.e., the middle of thecompact is at room temperature. Furthermore, since the time scales for which thesetemperatures are maintained are short, the overall temperature experienced by themilled powder is low.
8.3.3 Observations Based on Microstructural/Phase Transformations
It has been noted above that there are many uncertainties in the measurement ofeither the bulk or instantaneous contact temperatures. These uncertainties includevolume of the powder impacted during one collision, thickness and radius of thepowder compact trapped between the balls, fraction of the kinetic energy of thegrinding medium utilized in plastically deforming the powder, efficiency of heattransfer, and so forth. Because of these, the estimated powder temperatures could besubstantially different from the actual values.
It is well known that blended elemental powders subjected to MA result in theformation of stable or metastable phases including solid solutions, quasi-crystalline,amorphous, and nanocrystalline phases. The phases formed may also be metastablein the sense that a new phase, which is stable only at higher temperatures and/orpressures, may appear at room temperature and atmospheric pressure. Furthermore,some type of microstructural and/or polymorphic changes may take place in thepowder giving indication of the possible temperature the powder might havereached. Such microstructural features will be of use in evaluating the maximaltemperatures reached during milling. Since phase transformations or microstructuralchanges are expected to occur at a critical temperature (depending on the kinetics, ofcourse), observation of these changes indicates that the temperature attained by thepowder is at least the critical temperature. It should be realized that these estimatesare only indirect in nature. One must also exercise caution in interpreting thesemicrostructural and/or phase changes since the intense plastic deformation can leadto a situation equivalent to high pressures and so the stability of phases under theseconditions could be quite different from that under atmospheric pressure.
Table 8.1 Computed Values of the ContactTemperatures When Niobium Powder IsMilled Using Stainless Steel Ballsa
Tc – T0 (jC)
h v = 6 m/s v = 8 m/s
0.03 223 3960.09 668 1187
h, fraction of the available energy utilized in plastically
deforming the powder;Tc, contact (surface) temperature
of the powder compact; T0, ambient temperature;
v, relative velocity of the grinding medium.a Powder compact has a thickness of 100 Am and a
radius of 263 Am [3].
Temperature Rise During Milling 127

It has been known for some time that mechanically alloyed ductile materialcomponents exhibit features typical of cold working—deformation bands, slip lines[20], and high dislocation densities [21]. The presence of these features in themicrostructure suggests that the milled material is still in the cold-worked conditionand that recrystallization has not taken place. Unless the metal under considerationhas a very low melting point, e.g., lead, tin, cadmium, indium, etc., the recrystalliza-tion temperature is much above room temperature. Therefore, it is possible toconclude that the temperature increase in the powder is not very much above roomtemperature but well below the recrystallization temperature.
The tempering response of a quenched Fe-1.2 wt% C steel during MA wasstudied by Davis et al. [7] to estimate the maximal temperature reached during MA.A steel sample quenched from the austenitic state to room temperature producestetragonal martensite. On tempering the quenched steel, martensite decomposes toproduce q-carbide in the first stage of decomposition and cementite (Fe3C) startsforming at higher temperatures. DSC studies indicated that e-carbide starts formingat 418 K and cementite at 575 K [7]. By conducting separate annealing experimentsat different temperatures, one could calculate the fraction of cementite formed as aresult of decomposition of martensite. This helps in establishing a calibration curverelating the amount of cementite to the annealing temperature, which could be usedas a baseline. Milling experiments were conducted on quenched steel (that containsonly martensite) for different times, and the proportions of martensite and cementitein the milled powder were calculated using standard XRD procedures. The maximaltemperature reached by the milled powder was then estimated from the abovecalibration curve. From such plots, it was estimated that the maximal temperaturerise during milling was about 275jC [7]. It is, however, possible that introduction ofpoint defects, dislocations, and other defects during milling could enhance carbondiffusivity, create heterogeneous nucleation sites, and allow precipitation of cement-ite to take place at lower temperatures. Thus, the above temperature may be assumedto be the upper limit of the temperature reached by the powder during milling.
Formation of an oxide phase or phase transformations occurring in materialsduring milling has also been utilized to indirectly estimate the temperature reachedby the powder. During milling of Sb or Ga-Sb alloys it was noted that the antimonymetal got oxidized and formed the high-temperature orthorhombic Sb2O3 phase.Since the Sb2O3 phase is stable only above 570jC, it was inferred that the local rise intemperature was at least 570jC [22,23]. Similarly, by observing the transformation ofboehmite or gibbsite into a-alumina during milling, the temperature rise wasestimated to be at least 1000jC [24,25]. Other estimated temperatures varied between180jC for a Ni-Zr powder [15] and 590jC for an Al-Cu-Mn powder milled in aFritsch Pulverisette 5 mill at an intensity of 9 [26]. The values of the estimatedtemperature rise (difference between the measured temperature and the ambient) aresummarized in Table 8.2.
8.3.4 Experimental Observations
The temperature rises calculated and estimated above using theoretical models ormicrostructural changes are not accurate or reliable due to the assumptions made,some of which may not be valid. A major problem with these estimates is that one isnot certain of the volume of the powder into which the heat is dissipated. Thus, the
MD: SURYANARAYANA, JOB: 03320, PAGE: 128
4103-X_Suryanarayana_Ch08_R2_071504
Chapter 8128

same amount of energy dissipated in a sufficiently small volume may produce a hightemperature rise. Therefore, only experimental investigations may give reasonableand accurate values for the rise in temperature. In fact, only experimental observa-tions will prove or disprove the different proposals for the formation of metastablephases in mechanically alloyed materials. For example, Ermakov et al. [19] proposedthat the powder particles may melt during MA and that subsequent rapid solid-ification due to the cold powder surrounding it could result in the formation ofamorphous phases. Furthermore, the actual temperature reached by the powder mayalso influence the nature of the phase formed and its kinetics of formation. It shouldbe realized, though, that experimental measurements are not easy and that theymeasure only the bulk temperature of the vial, not the instantaneous temperature atthe time of impact. Table 8.3 lists the experimentally measured temperature rises indifferent alloy systems. Here again, the temperature rise means the differencebetween the temperature measured and the ambient temperature. A number of
MD: SURYANARAYANA, JOB: 03320, PAGE: 129
4103-X_Suryanarayana_Ch08_R2_071504
Table 8.3 Experimentally Measured Temperature Rise During MechanicalAlloying/Milling
Alloy system Type of mill Temp. rise (jC) Ref.
— SPEX 8000 50 12Al-Cr Conventional ball mill 90 28
Al-Mg SPEX 8000 120 29Al-Mg Attritor 125 30Co-Fe-Si-B Vibrational ball mill 100 31
Cr-Cu Vibrational ball mill 100 32Fe-Al Fritsch Pulverisette 5 80 33La2/3Ca1/3MnO3 Planetary ball mill 140 34Mg-Ni SPEX 8000 60 35
Nb-Si SPEX 8000 <80 36Ni-base superalloy Attritor <100–215 37Ni-Ti High-speed ball mill 172 38
Ta-Si SPEX 8000 <80 36Ti-C Fritsch 70 39V-Si SPEX 8000 <80 36
Zr70Pd20Ni10 Planetary ball mill <100 40
Table 8.2 Temperature Rise Estimated from Microstructural and/or PhaseTransformations During Mechanical Alloying/Milling
Alloy system Type of mill Temp. rise (jC) Ref.
Al-Cu-Mn Fritsch Pulverisette 5 590 26
Fe-1.2 wt% C SPEX 8000 275 7Ni-Al Planetary ball mill 220 27Ni-Zr SPEX 8000 180 15Sb or Sb-Ge Centrifugal ball mill >570 22,23
g-AlOOH or Al(OH)3 Fritsch Pulverisette 7 >1000 24,25
Temperature Rise During Milling 129

investigators have measured the temperature of the vial during milling, but only afew typical results have been listed here.
The macroscopic temperature of the vial (or powder) has been measured byattaching thermocouples to the vial surfaces in some cases. A maximal temperatureof 40–42jC was recorded [12,39] when the experiments were conducted with nogrinding balls in the container; even with 13 balls in the SPEX mill, the temperaturerise was noted to be only about 50jC [12]. On the other hand, when both the powderand the balls were loaded into the container and milling was done, the temperatureof the container rose to about 70jC after approximately 6 h of milling [39]. Hence, itwas concluded that most of the temperature rise comes from the motor and bearings.
Figure 8.3 shows the dependence of the vial temperature on milling time andvial contents during MA in a vibratory ball mill [1]. An approximately linear increasein temperature with milling time is noted up to 30 s of milling time, and a steady-state value is obtained after milling for about 20 min. This indicates that internalheating and external cooling are balanced out. Furthermore, as the ball-to-powderratio increases, i.e., vial occupancy is higher, the temperature increases. This can beunderstood as due to the increased kinetic energy of the grinding medium and theconsequent transfer of higher energy to the system.
The influence of ball diameter on the increase in temperature is shown inFigure 8.4 [41]. It may be noted that the temperature of the balls increases with theball diameter. As the ball diameter increases, the weight of the ball increases;therefore, the kinetic energy (E = 1⁄2mv2) acquired by it is also higher. Consequently,the temperature attained is higher. However, when the ball diameter is very large, therelative velocity of the balls decreases, due to a decrease in the effective vial diameter,
MD: SURYANARAYANA, JOB: 03320, PAGE: 130
4103-X_Suryanarayana_Ch08_R2_071504
Figure 8.3 Measured external vial wall temperature as a function of milling time in a
vibratory ball mill during mechanical alloying of Fe-Mn powders. The numbers on each curvecorrespond to the extent of filling in the vial, also indicated by the schematic figure adjacent tothe curve. The occupancies of the vial are (1) 20%, (2) 45% with fan cooling of vial surface, (3)
45%, and (4) 70% [1].
Chapter 8130

i.e., the difference between the vial diameter and the ball diameter. This results in adecreased amount of kinetic energy and consequently the temperature attained islower.
Shelekhov et al. [42] calculated the temperature rise during milling in aplanetary ball mill (making assumptions similar to those in the earlier studies) andinvestigated the effect of occupancy of the vial as well as the size of the grindingmedium. They noted that the experimentally measured values [43] are in goodagreement with the values estimated from the model only for large balls. Table 8.4compares the measured and estimated values for the different ball sizes. It was notedthat the theoretical estimations of the milling temperatures were about 100jC higherthan the experimental values.
MD: SURYANARAYANA, JOB: 03320, PAGE: 131
4103-X_Suryanarayana_Ch08_R2_071504
Figure 8.4 Measured temperature as a function of milling time for different sizes of thegrinding balls in the absence of powder in an AGO-2 planetary ball mill. The mill conditionswere: ball charge 200 g per vial, 1090 rpm for the planet carrier, 2220 rpm for the vials, and
ball speed 8.24 ms�1 [41].
Table 8.4 Comparison of the Measured and Calculated TemperatureValues for Different Sizes of the Balls and a Vial Occupancy of10–15% [42]
Size of the grinding
ball (mm) Calculated temp. (jC) Measured temp. (jC)
3 400 1605 480 4559 610 520
Temperature Rise During Milling 131

Pustov et al. [1] measured the temperature of the external wall of the millingcontainer for different occupancies of the container by the powder and the balls.They noted that a steady-state condition was achieved when the internal heating andexternal cooling were equal. It was also noted that presence of the milled powderaffected the rate of temperature rise and that the steady-state temperature was lower.This was explained as due to the higher thermal conductivity of the powder inrelation to that of the normal vial atmosphere. A change in the ball-to-powder
MD: SURYANARAYANA, JOB: 03320, PAGE: 132
4103-X_Suryanarayana_Ch08_R2_071504
Figure 8.5 Experimental and calculated values of temperatures in a planetary ball mill for
different sizes of the balls and rotation speeds. The calculated temperatures are the upperlimits [1].
Figure 8.6 Measured milling temperatures in a vibrational ball mill under different cooling
conditions [1].
Chapter 8132

weight ratio (BPR) did not cause any significant change either in the rate oftemperature rise or in the final temperature attained. However, differences werenoted between the estimated and measured temperatures for different ball sizes andalso mill rotation speeds (Fig. 8.5). They had also measured the milling temperatureunder different types of external cooling conditions and noted that fan coolingproduces the best results (Fig. 8.6).
8.4 TEMPERATURE OF THE BALLS
As mentioned earlier, the temperature of the powder (and the vial) increases due tothe ball-to-ball, ball-to-powder, and ball-to-wall collisions. Since these collisionsincrease with milling time as well as with the size of the balls and the extent of vialfilling, among other parameters, it is noted that the measured temperature increaseswith milling time and the extent of filling (Fig. 8.3). Since the balls make only pointcontacts with the vial, it is clear that the difference in the temperature between theballs and the vial could be significant.
A recent publication describes the measurement of the temperature of the ballsduring milling in a planetary ball mill and its influence on the milling behavior ofMg-Ni and Ni-Al alloys [41]. To allow accurate measurement of the temperature,cold water from a thermostat was circulated to cool the vial. Since the temperature ofthe vial remains reasonably constant for a short time after turning off the mill (say,up to about 30 s), the vial was transferred to a calorimeter within 30 s to measure itstotal heat content (Ht). By measuring the temperature change of the cooling water tocalculate the dissipated energy and knowing the heat conductivity of the vialmaterial, the temperature of the inner side of the vial walls, the average temperatureof the vial, and the heat content during milling were calculated (Hv). The balltemperature was then calculated from the difference between Ht and Hv. Thesecalculations were made for an AGO-2 planetary ball mill for four different sizes ofhardened steel balls (3, 5, 7, and 9 mm in diameter), three different mill settings, andtwo different types of atmosphere. From Figure 8.4 it is clear that the ball temper-ature increases with milling time and reaches a steady-state value in about 20 min.But, the important point is that about 80% of the energy generated in the mill isconsumed to heat the balls. Table 8.5 lists the milling conditions used and the steady-state temperatures recorded. From this it is clear that the temperature of the ballsincreases with the ball diameter and also with increasing milling time. The maximaltemperature of the balls recorded is as high as 613jC under the most intense con-ditions of milling.
The above temperatures are for bare balls only, i.e., the vial did not containany powder. When Mg and Ni powders corresponding to the composition Mg-33at% Ni were milled with 7-mm-diameter balls for 10 min, the temperature wasmeasured to be 360jC, as against 607jC, measured without the powder. The steady-state temperature was found to be different if a different powder was milled. It wasfound to be only 190jC, if Al2O3 powder was milled under similar conditions (Fig.8.7). These results suggest that the ball temperature is lower in the presence ofpowder than only when bare balls are milled. It is possible that the powder formscoatings on the balls and the vial, or it could form large pellet-like agglomerates witha lamellar structure. It was noted that the ball temperature was lower when thepowder formed agglomerates than when it formed coatings. The temperature was
MD: SURYANARAYANA, JOB: 03320, PAGE: 133
4103-X_Suryanarayana_Ch08_R2_071504
Temperature Rise During Milling 133

even lower when the powder was dispersed as small particles. This is because of thedifferences in the heat transfer efficiency in these three cases.
The nature of the gas and its pressure during milling also appear to play animportant role. As shown in Figure 8.8, the steady-state ball temperature decreaseswith increasing gas pressure. It can also be noted that the temperature is much lowerwhen helium is used instead of argon, and this effect is related to the thermaldiffusivities of the two gases involved.
However, some investigators have reported very large temperature rises. Thedata available on the measured temperatures are summarized in Table 8.3. It may be
MD: SURYANARAYANA, JOB: 03320, PAGE: 134
4103-X_Suryanarayana_Ch08_R2_071504
Table 8.5 Mill Settings (for the AGO-2 Planetary Ball Mill) and the Ball TemperaturesUnder Steady-State Conditions (after 20 min of milling operation) [41]
Rotationfrequency, rpm
Temp. (jC)
(angular frequency, s�1)Ball
Ball diameter (mm)
Step no. Plate Vials speed (ms�1) 3 5 7 9
I 630 (66.0) 1290 (135.1) 4.79 130 261 304 308II 890 (93.2) 1820 (190.6) 6.76 189 352 424 430
III 1090 (114.1) 2220 (232.5) 8.24 240 494 607 613
Figure 8.7 Steady-state ball temperature as function of the weight of Al2O3 powder in thevial during milling in an AGO-2 planetary ball mill. The milling conditions were: 7-mm-diameter balls, ball charge 200 g per vial, 1090 rpm for the planet carrier, 2220 rpm for the
vials, and ball speed 8.24 ms–1 [41].
Chapter 8134

noted from the table that the maximal measured temperature is about 215jC, andmore commonly it is about 100–120jC. It should be realized that this is themacroscopic temperature rise, even though it is recognized that local (microscopic)temperatures can be very high, often exceeding the melting points of some compo-nent metals.
8.5 METHODS TO MINIMIZE TEMPERATURE RISE
The above discussion clearly brings out the fact that there is always an increase in thetemperature during milling of powders. The temperature reached depends on thenature of the mill, milling conditions, type of powder being milled, and heat transferconditions. The temperature of the powder or the balls may be different, and thetemperature could also differ from the theoretically calculated/estimated values.These higher temperatures normally enhance diffusion and thus accelerate thealloying process (see, for example, Ref. 1). However, in some cases this increasedtemperature may be a disadvantage by causing oxidation of the powder, crystal-lization of the amorphous phases produced, and so on. Therefore, one should beaware of the different ways in which the temperature rise could be minimized. Themost normal practice is to use fan cooling, which has proved effective in minimizingthe temperature increase. Another common practice is to mill the powder for apredetermined time, interrupt milling until the vial cools down to some reasonabletemperature, and then resume milling. While using a SPEX mill, for example, onenormally mills the powder for 30 min, waits for 15–30 min for the mill to cool downto close to room temperature, and repeats the sequence. However, if efficient fan or
MD: SURYANARAYANA, JOB: 03320, PAGE: 135
4103-X_Suryanarayana_Ch08_R2_071504
Figure 8.8 Steady-state ball temperatures as a function of the nature of the gas used and itspressure in the milling vial [41].
Temperature Rise During Milling 135

other means of cooling is provided, then one could mill the powder continuously,making sure that the container does not get too hot.
REFERENCES
1. Pustov, L. Yu., Kaloshkin, S. D., Tcherdyntsev, V. V., Tomilin, I. A., Shelekhov, E. V.,Salimon, I. A. (2001). Mater. Sci. For. 360–362:373–378.
2. Kwon, Y.-S., Gerasimov, K. B., Lomovsky, O. I., Pavlov, S. V. (2003). J. Alloys
Compounds 353:194–199.3. Bhattacharya, A. K., Arzt, E. (1992). Scripta Metall. 27:749–754.4. Schwarz, R. B., Koch, C. C. (1986). Appl. Phys. Lett. 49:146–148.
5. Davis, R. M., Koch, C. C. (1987). Scripta Metall. 21:305–310.6. Courtney, T. H. (1995). Mater. Trans. Jpn. Inst. Metals. 36:110–122.7. Davis, R. M., McDermott, B., Koch, C. C. (1988). Metall. Trans. 19A:2867–2874.
8. Courtney, T. H. (1994). Rev. Part. Mater. 2:63–116.9. Koch, C. C., Pathak, D., Yamada, K. (1993). In: deBarbadillo, J. J, et al., eds. Me-
chanical Alloying for Structural Applications. Materials Park, OH: ASM International,pp. 205–212.
10. Klassen, T., Herr, U., Averback, R. S. (1997). Acta Mater. 45:2921–2930.11. Takacs, L. (2002). Prog. Mater. Sci. 47:355–414.12. Koch, C. C. (1994). Int. J. Mechanochem. Mech. Alloy 1:56–67.
13. Aikin, B. J. M., Courtney, T. H. (1993). Metall. Trans. 24A:647–657.14. Eckert, J., Schultz, L., Hellstern, E., Urban, K. (1988). J. Appl. Phys. 64:3224–3228.15. Schulz, R., Trudeau, M., Huot, J. Y., Van Neste, A. (1989). Phys. Rev. Lett. 62:2849–
2852.16. Maurice, D. R., Courtney, T. H. (1990). Metall. Trans. 21A:289–303.17. Magini, M., Burgio, N., Iasonna, A., Martelli, S., Padella, F., Paradiso, E. (1993). J.
Mater. Synth. Proc. 1:135–144.18. Magini, M., Colella, C., Guo, W., Iasonna, A., Martelli, S., Padella, F. (1994). Int. J.
Mechanochem. Mech. Alloy 1:14–25.19. Ermakov, A. E., Yurchikov, E. E., Barinov, V. A. (1981). Phys. Metals Metallogr.
52(6):50–58.20. Benjamin, J. S. (1976). Sci. Am. 234(5):40–48.21. Schlump, W., Grewe, H. (1989). In: Arzt, E., Schultz, L., eds. New Materials by Mech-
anical Alloying Techniques. Oberursel, Germany: Deutsche Gesellschaft fur Metallkunde,pp. 307–318.
22. Tonejc, A., Duzevic, D., Tonejc, A. M. (1991). Mater. Sci. Eng. A134:1372–1375.
23. Tonejc, A., Tonejc, A. M., Duzevic, D. (1991). Scripta Metall. Mater. 25:1111–1113.24. Tonejc, A., Stubicar, M., Tonejc, A. M., Kosanovic, K., Subotic, B., Smit, I. (1994). J.
Mater. Sci. Lett. 13:519–520.
25. Tonejc, A., Tonejc, A. M., Bagovic, D., Kosanovic, C. (1994). Mater. Sci. Eng. A181/182:1227–1231.
26. Eckert, J., Schultz, L., Urban, K. (1990). Z. Metallkde. 81:862–868.27. Mikhailenko, S. D., Kalinina, O. T., Dyunusov, A. K., Fasman, A. B., Ivanov, E.,
Golubkova, G. B. (1991). Siberian J. Chem. 5:93–104.28. Kobayashi, K. F., Tachibana, N., Shingu, P. H. (1990). J. Mater. Sci. 25:3149–3154.29. Zhang, D. L., Massalski, T. B., Paruchuri, M. R. (1994). Metall. Mater. Trans. 25A:73–
79.30. Cho, J. S., Kwun, S. I. (1993). In: Kim, N. J., ed. Light Metals for Transportation
Systems, Center for Advanced Aerospace Materials. Pohang, South Korea: Pohang Univ
of Sci & Tech, pp. 423–433.
MD: SURYANARAYANA, JOB: 03320, PAGE: 136
4103-X_Suryanarayana_Ch08_R2_071504
Chapter 8136

31. Matyja, H., Oleszak, D., Latuch, J. (1992). Mater. Sci. For. 88–90:297–303.32. Ogino, Y., Maruyama, S., Yamasaki, T. (1991). J. Less Common Metals 168:221–235.33. Kuhrt, C., Schropf, H., Schultz, L., Arzt, E. (1993). In: deBarbadillo, J. J. et al., eds.
Mechanical Alloying for Structural Applications. Materials Park, OH: ASM Interna-tional, pp. 269–273.
34. Goya, G. F., Rechenberg, H. R., Ibarra, M. R. (2002). Mater. Sci. For. 386–388:433–
438.35. Ruggeri, S., Lenain, C., Roue, L., Liang, G., Huot, J., Schulz, R. (2002). J. Alloys
Compounds 339:195–201.
36. Viswanadham, R. K., Mannan, S. K., Kumar, K. S. (1988). Scripta Metall 22:1011–1014.
37. Borzov, A. B., Kaputkin, Ya. E. (1993). In: deBarbadillo, J. J. et al., eds. Mechanical
Alloying for Structural Applications. Materials Park, OH: ASM International, pp. S1–S4.38. Qin, Y., Chen, L., Shen, H. (1997). J. Alloys Compounds 256:230–233.39. Sherif El-Eskandarany, M. (1996). Metall. Mater. Trans. 27A:2374–2382.40. Sherif El-Eskandarany, M., Saida, J., Inoue, A. (2003). Metall. Mater. Trans. 34A:893–
898.41. Kwon, Y.-S., Gerasimov, K. B., Yoon, S. K. (2002). J Alloys Compounds 346:276–281.42. Shelekhov, E. V., Tcherdyntsev, V. V., Pustov, Yu. L., Kaloshkin, S. D., Tomilin, I. A.
(2000). Mater. Sci. For. 343–346:603–608.43. Gerasimov, K. B., Gusev, A. A., Kolpakov, V. V., Ivanov, E. (1991). Siber. J. Chem.
3:140–145.
MD: SURYANARAYANA, JOB: 03320, PAGE: 137
4103-X_Suryanarayana_Ch08_R2_071504
Temperature Rise During Milling 137

4103-X_Suryanarayana_Ch08_R2_071504
MD: SURYANARAYANA, JOB: 03320, PAGE: 138
9
Solid Solubility Extensions
9.1 INTRODUCTION
Solid solution alloys show many desirable properties such as increase in strength andelastic modulus, changes in density, and elimination of undesirable coarse secondphases. Uniform precipitation of fine second-phase particles in a metallic matrix hasbeen known for long to increase the strength and hardness of precipitation-hardeningalloys [1]. The magnitude of improvement in the mechanical properties depends oninterparticle spacing, and size and volume fraction of the precipitate or dispersoid.Since large-volume fractions of second-phase particles can be obtained duringannealing/decomposition of highly supersaturated solid solutions, it is highly benefi-cial to synthesize supersaturated solid solutions, i.e., increase the solid solubility limitsin alloy systems beyond the equilibrium limits. This leads to the synthesis of alloys withhigh strength and high strength-to-weight ratios.
9.2 HUME-ROTHERY RULES FOR SOLID SOLUTION FORMATION
Based on their pioneering work on alloying behavior of noble metal (Cu, Ag, and Au)alloy systems, Hume-Rothery and coworkers (see, for example, Ref. 2) have providedsome empirical rules for the formation of primary substitutional solid solutions. It wasshown that continuous series of substitutional solid solutions (complete solid solubil-ity of one element in the other) may be obtained in binary alloy systems if the twocomponent elements satisfy the following four empirical conditions.
1. Atomic size factor. If the atomic size of the solute atom does not differ bymore than 14–15% from that of the solvent atom, then the size factor(defined as the ratio of the percentage difference in atomic sizes between the
4103-X_Suryanarayana_Ch09_R2_080304
MD: SURYANARAYANA, JOB: 03320, PAGE: 139
139

MD: SURYANARAYANA, JOB: 03320, PAGE: 140
4103-X_Suryanarayana_Ch09_R2_080304
solvent and solute atoms to the size of the solvent atom) is said to be fa-vorable. In such a situation, the extent of primary solid solution may beunlimited. If the size factor differs by more than 15%, it is said to be un-favorable, and then the solid solubility is limited. Here the atomic sizes of thecomponent elements are calculated based on the coordination number of 12.
2. Electrochemical effect. If the difference in the electronegativities (qualita-tively, electronegativity is the power of an atom in a compound or solidsolution to attract electrons to itself) of the solvent and solute atoms is large(i.e., one component is highly electropositive and the other highly electro-negative), then stable intermetallic compounds form and consequently theextent of primary solid solubility is small. Therefore, for the formation ofcontinuous series of solid solutions, the difference in electronegativitybetween the solvent and solute atoms should be small.
3. Relative valency effect. A metal of higher valency is more likely to dissolve ina metal of lower valency to a much larger extent than vice versa. Therefore,for complete solid solubility of one element in the other, the two elementsshould have the same valency.
4. Crystal structure. Formation of continuous series of solid solutions ispossible only when the two components involved have the same crystalstructure.
As examples, binary alloys of silver and gold, or copper and nickel, amongothers, satisfy the above four empirical rules and so form a continuous series of solidsolutions. The equilibrium diagram is then said to be isomorphous. Even thoughcopper and silver also satisfy the above rules, they do not form a continuous series ofsolid solutions; instead they form a eutectic system with limited primary solidsolubilities. Therefore, it may be stated that the above Hume-Rothery rules arenecessary but not sufficient to form extensive solid solutions in alloy systems.Consequently, the Hume-Rothery rules are sometimes referred to as negative rules.That is, if even one of the above rules is not satisfied, continuous series of solidsolutions will not form. On the other hand, continuous series of solid solutions maynot form even if all of the above rules are satisfied. There has been some discussion inrecent years on the number and scientific basis of these ‘‘rules.’’ It is now accepted thatthe relative valency effect rule does not work (about half the systems obey this rule andthe other half do not), and therefore this rule has been abandoned [3].
9.3 FORMATION OF SUPERSATURATED SOLID SOLUTIONS
Solid solubility extensions, beyond the equilibrium values, have been achieved inmanyalloy systems by just quenching the alloys in the solid state from high temperatures.However, the extent of supersaturation is generally limited in such cases. Nevertheless,significant supersaturation of solute atoms has been achieved by nonequilibriumprocessingmethods such as rapid solidification processing from the liquid state (RSP),vapor deposition, laser processing, sputtering, etc. [4]. However, the solid solubilityextensions achieved by RSP methods have been most spectacular. Complete solidsolubility of one element in the other has been reported to occur in systems such as Cu-Ag [5], Ni-Rh [6], GaSb-Ge [7], and other alloy systems [8], which, under equilibriumconditions, show only limited solid solubility of one component in the other. Note thatthe equilibrium solid solubility of Ag in Cu at the eutectic temperature of 779jC is 4.9
Chapter 9140

at% and that of Cu in Ag is 14.1 at%; these values are almost zero at roomtemperature. Supersaturated solid solutions in the entire composition range of theCu-Ag binary system were obtained by rapidly solidifying the alloy melts at solidifi-cation rates of about 106 K/s. Even though complete solid solution formation may notbe achieved in all rapidly solidified alloys, significant extensions of solid solubilitylimits have been reported in several alloy systems [8,9]. For example, the solidsolubility of Fe in Al has been reported to increase by RSP up to 6 at% from theroom temperature equilibrium value of only 0.025 at%.
Solid solubility extensions in rapidly solidified alloys have been rationalized usingthe concept of T0, the temperature at which, for an alloy of a given composition, thefree energies of the solid and liquid phases are equal [10–12]. In alloy systems such asAg-Cu, where the twometals have the same crystal structure [face-centered cubic (fcc)]the T0 vs. composition curve is continuous (Fig. 9.1). Accordingly, it is possible toobtain supersaturated solid solutions, either by quenching or other methods, if thealloymelt could be undercooled to belowT0 without the formation of any other phase.For a hypereutectic alloy this involves suppression of the formation of primaryequilibrium h phase, of primary or secondary (intercellular or interdendritic) a-heutectic, and of any alternatives involving nonequilibrium crystalline or amorphousphases. If the T0 vs. composition curve is not continuous in some alloy systems, thenundercooling the alloy melt to below T0 is a minimal thermodynamic requirement.
Extensions of equilibrium solid solubility limits have also been achieved inmechanically alloyed powders. In fact, the technique of mechanical alloying (MA) hasbeen shown to be capable of synthesizing both stable (equilibrium) solid solutions and
MD: SURYANARAYANA, JOB: 03320, PAGE: 141
4103-X_Suryanarayana_Ch09_R2_080304
Figure 9.1 Variation of T0 (denoted by the dotted line) with composition in the Cu-Agsystem. The T0 curve is continuous since both copper and silver have the same crystal struc-ture (fcc).
Solid Solubility Extensions 141

metastable (nonequilibrium) supersaturated solid solutions starting from blendedelemental powders in several binary and higher order systems. In the early years ofMAresearch, observation of solid solubility extensions was not the primary objective;instead, formation of solid solutions was noted as a secondary result during amor-phization of metal powder mixtures. Consequently, systematic studies were notconducted on the variation of solid solubility limits with the different processparameters. Results of such systematic investigations are being reported only in recentyears.
9.4 MEASUREMENT OF SOLID SOLUBILITY LIMITS
Since the lattice parameter(s) of a solid solution phase is very sensitive to the solutecontent in the solid solution, measurement of lattice parameter(s) has been the mostcommon method to evaluate solid solubility limits. Data regarding variation of latticeparameter(s) with solute content are available for many equilibrium solid solutions instandard reference books (see, for example, Ref. 13). Thus, if equilibrium solidsolutions are formed, then the solute content in the solid solution can be estimatedby calculating the lattice parameter of the solid solution fromX-ray diffraction (XRD)patterns and estimating the solubility from a plot of lattice parameter vs. solutecontent, obtained from the literature.
The nature of the variation and the magnitude of change of lattice parameter ofthe solvent lattice with solute content is dependent on the relative atomic diameters ofthe solvent and solute atoms. The solvent lattice parameter increases with solutecontent if the solute atom has a larger atomic diameter than the solvent atom;otherwise it decreases. For small differences in atomic diameters, the change in thelattice parameter is also small.
XRD methods have been most commonly employed to determine latticeparameters of solid solutions. Solid solubility limits are then determined from thevariation of lattice parameter(s) with solute content. Methods detailing the estimationof solubility levels may be found in standard textbooks on XRD [14,15]. In brief, thelattice parameter of the solid solution alloys with different compositions is calculatedfrom XRD patterns and these values are plotted against solute content as shown inFigure 9.2. It may be noted that the lattice parameter increases (assuming that theatomic diameter of the solute is larger than that of the solvent) with solute content upto a certain composition, beyond which it remains constant. This composition limit,beyondwhich the lattice parameter remains constant, is the solid solubility limit at thattemperature.
On mechanically alloying a blended elemental powder mixture of a knowncomposition, let us say of solute content C1, interdiffusion between the componentstakes place and alloying occurs. Assuming that right conditions exist and that a solidsolution forms between the two elements, the lattice parameter of the solvent metalchanges due to solute dissolution. The solute content in the solid solution is expectedto increase with milling time as diffusion progresses. On continued milling, asaturation level is reached (when steady-state conditions ofmilling have been reached),beyond which no further extension of solid solubility occurs. A plot of latticeparameter vs. milling time indicates that the lattice parameter increases (assumingagain that the solute atom has a larger atomic diameter than the solvent atom) withmilling time until the maximal allowable solute is consumed to form the solid solution.
MD: SURYANARAYANA, JOB: 03320, PAGE: 142
4103-X_Suryanarayana_Ch09_R2_080304
Chapter 9142

Beyond this time, the lattice parameter remains constant at a1 (since the compositionof the solid solution remains constant at C1), as shown schematically in Figure 9.3.Repeating experiments like this with increasing solute content in the initial blendedelementalpowdermixture (e.g.,withsolutecontentsofC2,C3, . . .,whereC3 > C2>C1)results in latticeparameter saturationsata2,a3, . . .,as shownschematically inFigure9.4.Note that a3>a2>a1. From these plots, the saturation lattice parameter values of thedifferent blended elemental powder mixtures are plotted as lattice parameter vs. solutecontent as shown in Figure 9.5. In this plot, the lattice parameter increases with in-creasing solute content and reaches a saturation value beyond which the lattice pa-rameter remains constant. This saturation value has been listed as the solid solubilitylevel achievedbyMA.Forexample, the solid solubility level isC4 in thepresentexample.
Note that Figure 9.5 is somewhat similar in trend to Figure 9.3. Whereas Figure9.5 shows the variation of lattice parameter with solute content, Figure 9.3 shows thevariation of lattice parameter with milling time for an alloy of a specific composition.
MD: SURYANARAYANA, JOB: 03320, PAGE: 143
4103-X_Suryanarayana_Ch09_R2_080304
Figure 9.2 Variation of lattice parameter with solute content in a hypothetical alloy systemwhere the solute has a larger atomic size than the solvent.
Figure 9.3 Increase in lattice parameter of the solid solution with mechanical alloying time.
Solid Solubility Extensions 143

If the two elements under consideration form continuous series of solidsolutions, i.e., when the two component metals form an isomorphous system, thelattice parameter of one of the metals decreases and that of the other increases withmilling time. Once steady-state conditions are established, the two lattice parametersmerge and a homogeneous solid solution with the expected lattice parameter isformed. Figure 9.6 shows schematically the variation of the lattice parameter withmilling time. Table 9.1 lists the solid solubility values obtained by mechanical alloyingin several powder mixtures. Both room temperature and maximal equilibrium solidsolubility values are also listed in the table to indicate the magnitude of increase ofsolubility achieved by MA. These equilibrium values have been taken from standardreference books (e.g., Ref. 292).
MD: SURYANARAYANA, JOB: 03320, PAGE: 144
4103-X_Suryanarayana_Ch09_R2_080304
Figure 9.4 Variation of lattice parameter vs. mechanical alloying time for different powderblends with different initial solute contents.
Figure 9.5 Variation of lattice parameter of the solid solution with solute content. The solidsolubility limit can be determined by measuring the lattice parameter from X-ray diffraction
patterns and using this master plot.
Chapter 9144

9.5 DIFFICULTIES IN SOLID SOLUBILITY DETERMINATION
As mentioned above, solid solubility limits have been generally determined fromchanges in lattice parameter values calculated from shifts in peak positions in theXRDpatterns. Very frequently, absence of second-phase reflections in theXRDpatterns hasbeen inferred to indicate the absence of a second phase; therefore it was concluded thata homogeneous solid solution had formed. Both of these conclusions are fraught withproblems; therefore, the values reported may not be always accurate and reliable.Hence, caution must be exercised in attaching too much importance to the solidsolubility values reported in the literature. The difficulties associated with the limits ofsolid solubility determined this way in mechanically alloyed powders are discussedbelow.
1. The absence of diffraction peaks from the solute phase in XRD patterns isusually taken as proof of complete dissolution of the solute element in the solventmatrix; this has been interpreted as evidence for enhanced solid solubility values. It hasbeen recently shown that solid solubility limits cannot be accurately determined onlyby noting the absence of solute peaks in XRD patterns. Kim et al. [293] reported thatTi reflections were absent in the XRD pattern recorded from an Al-20 wt%Ti powdermixture mechanically alloyed for 15 h, indicating that all the Ti atoms had dissolved inthe aluminum matrix. But, transmission electron microscopy investigations on thesame powder clearly showed the presence of nanometer-sized Ti particles dispersed inthe aluminum matrix, suggesting that absence of XRD peaks from the solute phasemay not be sufficient evidence for concluding that complete solid solubility has beenachieved. Thus, it is desirable to use more than one technique to unambiguouslydetermine the true solid solubility limits.
In some cases, the second component may become amorphous onmilling, and inthis case a very broad peak of low intensity will be present. For example, carbon, alongwith other components, was found to become amorphous on milling. If a number ofpeaks from the crystalline phase are also present, then the presence of the amorphouspeakmay not be noticed. In such a case, ‘‘disappearance’’ of the second-phase peaks inthe XRD pattern may not be sufficient evidence to suggest achievement of completesolid solubility.
MD: SURYANARAYANA, JOB: 03320, PAGE: 145
4103-X_Suryanarayana_Ch09_R2_080304
Figure 9.6 Schematic variation of the lattice parameter (solid solubility) of the individual
component phases with mechanical alloying time in a binary alloy system that is expected toshow complete solid solubility of one element in the other.
Solid Solubility Extensions 145

MD: SURYANARAYANA, JOB: 03320, PAGE: 146
4103-X_Suryanarayana_Ch09_R2_080304
Table 9.1 Solid Solubility Limits (at%) Achieved by MA of Blended Elemental Powdersa
Solvent Solute
Equilibrium value
By MA Ref.At RT Max.
Ag Al 9.6 20.4 20 16Cu 0.0 14.1 100 17–19
Gd 0.0 0.95 5 20Ni 0.0 0.0 4.3 (at RT) 36 to 44 at
�195jC21
Pd 100 100 85b 22Ag-15Sm Fe Fe:Sm 2:1 23Al Cr 0.0 0.37 5 24
Cu 0.0 2.48 2.7 25
0.2 (in Al-10Cu) 265.6 (in Al-15Cu) 26, 27
Cu-Fe — — 20Fe, 20Cu 28
5Cu-5Zr Partial, unspecified 29Fe 0.0 0.025 1.0 30
2.0 31
2.5 324.5 334–5 34
Fe-V 45Fe, 5V 3525Fe, 25V 35
Ge 0.0 2.0 14.1 27Mg 1.2 18.6 3.7 (in Al-10Mg) 26
10.0 (in Al-20Mg) 2614.1 (in Al-30Mg) 26, 2713 (in Al-30Mg) 36
18 (in Al-30Mg) 3724 (in Al-50Mg) 3140 (in Al-50Mg) 37
23 38Mn 0.4 0.62 18.5 39Mn-Ti-Nb 8Mn, 24Ti, 1Nb 40Mo 0.0 0.06 0.4 (in Al-3Mo) 41
1.3 (in Al-10Mo) 412.4 (in Al-17Mo) 41
Nb 0.0 0.065 Unspecified 42
15 4325 44
Ni 0.0 0.11 10 45
Ni-Co — — 8Ni, 4Co 46Ru 0.0 0.008 14 47Si 0.0 1.5 0.7 (in Al-5Si) 26
1.3 (in Al-10Si) 264.5 26, 27
AlSb InSb — — 100 48Al Ti 0.0 0.75 3.0 49
4 (in Al–25Ti) 5010.4 51
Chapter 9146

MD: SURYANARAYANA, JOB: 03320, PAGE: 147
4103-X_Suryanarayana_Ch09_R2_080304
Solvent Solute
Equilibrium value
By MA Ref.At RT Max.
Al 12 5215–36 5320 5425 55–57
35 5836 5950 60
Ti-Cr — — 12Ti and 5–8Cr 61Ti-Fe — — Unspecified 62
12Ti and 3–5Fe 61
Ti-Mn-Nb — — 23Ti, 8Mn, 2Nb 63Al2O3 Fe2O3 25 mol % 64Au2Nb (PA) 9.0 57 33b 65Bi Sb 100 100 10b 66
Bi2O3 Nb2O5 — — 100 67Y2O3 — — 100 67
Cd Zn 3.1 4.35 50 68
Co C 0.0 4.1 6 69Cr 4.0 43.0 40b 70Cu 0.0 19.7 100 71–74
Fe 100 100 10b 75Li2O3 — — Unspecified 76Mn 43.5 59.0 40b 70
Ni 100 100 70b 77V 1.6 35.0 33b 70Zr 0.0 <1.0 5 70
Cr Co 4.9 53.0 40b 70
Cu 0.0 0.2 20 78Cu Ag 0.0 4.9 100 18
Ag-Fe — — 10Ag, 20Fe 79
Al 18.6 19.7 14b 8018b 25
C 0.003 0.04 at
1373 K
25 81
28.5 82Cu Co 0.0 8.0 50 83
100 71–74, 84,
85Co-Fe 14Co, 6Fe 86Cr 0.0 0.9 50 87
Fe 0.3 11.0 20 8830 17, 89, 9040 91
50 9255 93, 9460 95–97
65 (w/o ethanol) 98
Table 9.1 Continued
Solid Solubility Extensions 147

MD: SURYANARAYANA, JOB: 03320, PAGE: 148
4103-X_Suryanarayana_Ch09_R2_080304
Solvent Solute
Equilibrium value
By MA Ref.At RT Max.
Cu 68 (w/ethanol) 9865 99, 100
Hg 0.0 5.0 17 101Mn 100 100 35b 84
Nb 0.1 0.1 3 102Ni 100 100 13b 103
100 104
Sb 1.1 5.8 3.7b 105Sn 0.0 9.1 Unspecified 106, 107
9.8 108, 109
Ti 0.9 8.0 0.6 (in Cu-10Ti) 1102.8 (in Cu-20Ti) 1103.7 (in Cu-30Ti) 1109.4 (in Cu-40Ti) 110
V 0.0 0.1 Unspecified 84W 0.0 0.97 Unspecified 111Zn 32.0 38.3 44 112
Cu-29.7Zn (PA) C 38.5 113Fe Ag 0.0 0.0 10 114
Unspecified 115
Ag-Cu — — 10Ag, 10Cu 79Al 20.8 45.0 7.9b 116
26.7b 117
20b 11825b 119–12125b 12227b 123
40b 124, 12550 30, 126–12850 129
50 35, 130Al-Ti 25Al, 5–15Ti 122
33.3Al, 33.3Ti 131
Al-Ti-C 25Al, 25Ti, 25C 132B 0.0 0.0 4.0 133B-Cu — — 13B, 1Cu 134B-Si — — 5Si, 4B 135
C 0.01 0.11 4 136, 1375, but mentioned as1.3 in Ref. 139
138
33 (hcp,corresponding tohigh-pressure
form)
140
Co 100 100 20b 75Cr 100 100 46.5b 141
50b 142
Table 9.1 Continued
Chapter 9148
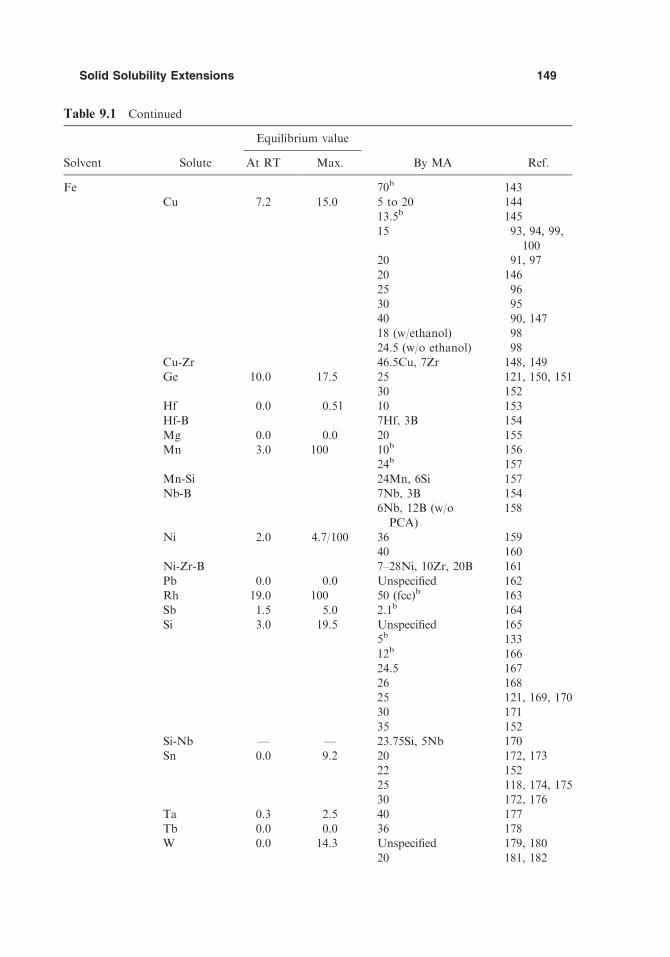
MD: SURYANARAYANA, JOB: 03320, PAGE: 149
4103-X_Suryanarayana_Ch09_R2_080304
Solvent Solute
Equilibrium value
By MA Ref.At RT Max.
Fe 70b 143Cu 7.2 15.0 5 to 20 144
13.5b 14515 93, 94, 99,
10020 91, 9720 146
25 9630 9540 90, 147
18 (w/ethanol) 9824.5 (w/o ethanol) 98
Cu-Zr 46.5Cu, 7Zr 148, 149Ge 10.0 17.5 25 121, 150, 151
30 152Hf 0.0 0.51 10 153Hf-B 7Hf, 3B 154
Mg 0.0 0.0 20 155Mn 3.0 100 10b 156
24b 157
Mn-Si 24Mn, 6Si 157Nb-B 7Nb, 3B 154
6Nb, 12B (w/o
PCA)
158
Ni 2.0 4.7/100 36 15940 160
Ni-Zr-B 7–28Ni, 10Zr, 20B 161
Pb 0.0 0.0 Unspecified 162Rh 19.0 100 50 (fcc)b 163Sb 1.5 5.0 2.1b 164
Si 3.0 19.5 Unspecified 1655b 13312b 166
24.5 16726 16825 121, 169, 17030 171
35 152Si-Nb — — 23.75Si, 5Nb 170Sn 0.0 9.2 20 172, 173
22 15225 118, 174, 17530 172, 176
Ta 0.3 2.5 40 177Tb 0.0 0.0 36 178W 0.0 14.3 Unspecified 179, 180
20 181, 182
Table 9.1 Continued
Solid Solubility Extensions 149

MD: SURYANARAYANA, JOB: 03320, PAGE: 150
4103-X_Suryanarayana_Ch09_R2_080304
Solvent Solute
Equilibrium value
By MA Ref.At RT Max.
Fe 30 183Zn 0.0 42.0 25b 121, 174Zr 0.0 6.5 5b 184–187
10 153
14 134Zr-B 7Zr, 3B 154Zr-B — — 7Zr, 7B 134
Zr-B-Cu — — 7Zr, 6B, 1Cu 134Zr-Cu — — 7Zr, 7Cu 134
13Zr, 1Cu 134
11Zr, 3Cu 134Fe0.5Cu0.5 (PA) Zr 11 188Fe60Mn10Al30-xBx (PA)
Up to x = 6 189
Fe2O3 Cr2O3 100 190a-Fe2O3 SnO2 10 F 3 mol %
(in 15 mol %
SnO2)
191
20 F 4 mol %(in 29 mol %
SnO2)
191
FeS (PA) Al — — 7Al in Fe 192Mn — — Unspecified Mn 192
Ge Si 100 100 89b 193Sn 0.48 1.1 24 194
Mg Al 0.9 11.0 2.2 (in Mg-10Al) 263.7 (in Mg-15Al) 26, 27
Fe 5 155Ti 0.0 0.0 6 195, 196
a-Mn Co 4.0 38.0 50 70
Fe 30.0 35.0 5–7b 19728b 198
Mo Al 0.0 20.5 Unspecified 41
Nb Al 5.9 21.5 15.4b 19925 200–20233.3 20360 43, 44
Nb3Al (PA) — — — 25 204Nb3Au (PA) — 19.0 54.0 25b 65, 205Nb Be 9.1 16.0 Unspecified 206
Cu 20 78Ge 2.8 9.2 8.6b 207Ni 1.2 5.0 10 208
Si 0.0 3.5 Unspecified 209Ni Ag 0.0 3.0 5 210
6.6 21
Al 7.5 21.2 0.5b 135
Table 9.1 Continued
Chapter 9150

MD: SURYANARAYANA, JOB: 03320, PAGE: 151
4103-X_Suryanarayana_Ch09_R2_080304
Solvent Solute
Equilibrium value
By MA Ref.At RT Max.
Ni 25 34, 150,211–214
27 21535 216
Al-Nb 28–40Al, 10Nb 217Al-Ti-C 40–45Al, 5Ti, 5C 218
Ni3Al (PA) — 7.5 21.2 25 219
NiAl (PA) 39 to 55Al
33–62 Al 220
40–65 Al 215
Ni Al-Nb-C 18–23Al, 5Nb, 5C 221C 0.0 7.4 9.0 (in Ni–10 C) 69
12.0 (in Ni–15 C) 69Co 100 100 60b 104
70b 77Cr 22.6 50.0 50 34Fe 3.8 100 40b 179
Ga 10.8 24.3 50 222Ge 9.6 12.0 25 150In 0.0 14.5 13b 222
Mg 0.0 0.0 10 223Mo 17.0 28.0 21b 224
23b 225
Nb 3.2 14.0 10b 20815 226
Ru 4.6 34.5 31b 227Si 10.0 15.8 24 228
25 150Ni3Si (PA) 25 229Ni Sn 0.0 10.6 17.5 222
Ta 3.0 17.2 30 230Ni Ti 6.0 13.9 6b 231
28 232
8.9 (in Ni-10Ti) 11013.8 (in Ni-20Ti) 11018.3 (in Ni-25Ti) 110
Ni3V (PA) — 15.0 43.0 25b 233
Ni2V (PA) — 33b 233Ni W 12.5 17.5 14b 34
23 234
28 235Pd Ag 100 100 95b 22
Y 7.6 13.0 12b 236
Pd3Zr (PA) — 12.0 16.2 25 237PTFE PE — — Unspecified 238Ru Al 0.6 4.0 14 47
Unspecified 239, 240
Table 9.1 Continued
Solid Solubility Extensions 151

MD: SURYANARAYANA, JOB: 03320, PAGE: 152
4103-X_Suryanarayana_Ch09_R2_080304
Solvent Solute
Equilibrium value
By MA Ref.At RT Max.
Ru Ni 6.4 50.0 53 227Si Ge 100 100 28b 241
50b 242Sn 0.0 0.0 Unspecified 243
Ta Al 0.0 4.0 33 24450 245
Cu 0.0 0.0 30 246
Zr-Al-Ni-Cu 10Zr-10Al-10Ni-15Cu
247
Ti Al 11.0 47.5 10b 248
16b 249, 25025b 55, 58, 204,
251–25328b 62
z30b 24933b 25450 58, 255
60 55, 56Ti-49Al (PA) — — — 49 55, 56Ti Al-Nb — — Unspecified 256, 257
24Al, 11Nb (hcp) 202Al-Nb — — 22Al, 23 Nb (bcc) 258, 259Al-Ni — — 6 Al, 6 Ni 260
Cu 0.0 1.6 (a),13.5 (h)
8 78
10 261Fe 0.0 0.04 (a),
22 (h)Unspecified 262
Mg 0.0 0.0 3.6 2636 264–266
16.3 26724 26830 195, 196
38 26950 196
Ni 0.0 0.2 (a),10.0 (h)
2b 270
Si 0.0 0.5 (a),3.5 (h)
8 271
37.5 203
TiH2 Fe Unspecified 262V Co 7.3 22.0 Unspecified 84
40 70
V3Ga (PA) — 9.2 41.0 25 272V3Ni (PA) — 2.0 24.0 25 233W Al 2.0 2.0 86 273
Fe 2.0 2.6 3 182
Table 9.1 Continued
Chapter 9152
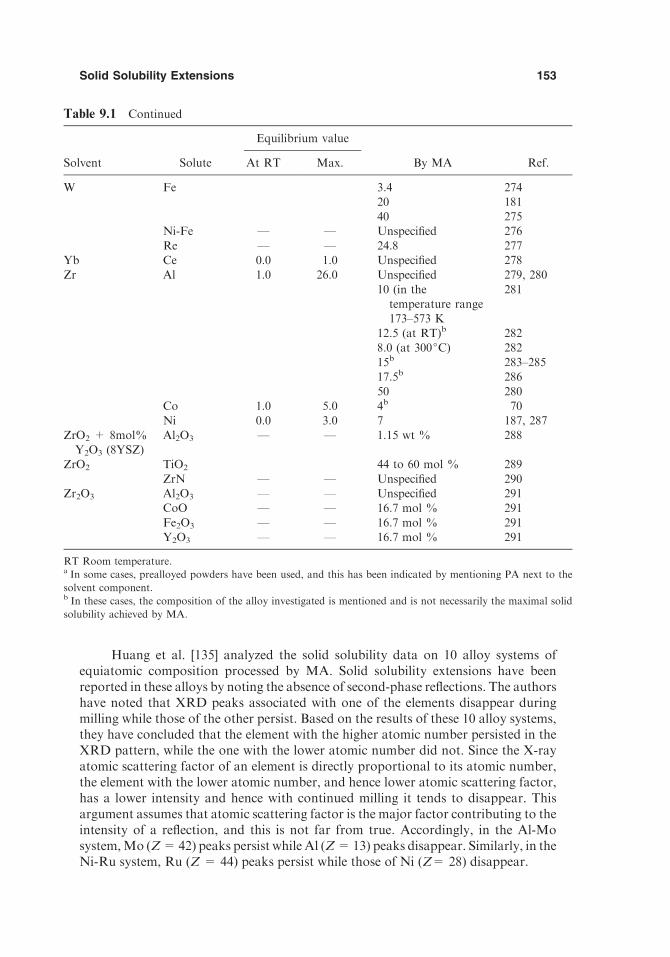
Huang et al. [135] analyzed the solid solubility data on 10 alloy systems ofequiatomic composition processed by MA. Solid solubility extensions have beenreported in these alloys by noting the absence of second-phase reflections. The authorshave noted that XRD peaks associated with one of the elements disappear duringmilling while those of the other persist. Based on the results of these 10 alloy systems,they have concluded that the element with the higher atomic number persisted in theXRD pattern, while the one with the lower atomic number did not. Since the X-rayatomic scattering factor of an element is directly proportional to its atomic number,the element with the lower atomic number, and hence lower atomic scattering factor,has a lower intensity and hence with continued milling it tends to disappear. Thisargument assumes that atomic scattering factor is the major factor contributing to theintensity of a reflection, and this is not far from true. Accordingly, in the Al-Mosystem,Mo (Z=42) peaks persist while Al (Z=13) peaks disappear. Similarly, in theNi-Ru system, Ru (Z= 44) peaks persist while those of Ni (Z= 28) disappear.
MD: SURYANARAYANA, JOB: 03320, PAGE: 153
4103-X_Suryanarayana_Ch09_R2_080304
Solvent Solute
Equilibrium value
By MA Ref.At RT Max.
W Fe 3.4 27420 18140 275
Ni-Fe — — Unspecified 276
Re — — 24.8 277Yb Ce 0.0 1.0 Unspecified 278Zr Al 1.0 26.0 Unspecified 279, 280
10 (in thetemperature range173–573 K
281
12.5 (at RT)b 2828.0 (at 300jC) 28215b 283–28517.5b 286
50 280Co 1.0 5.0 4b 70Ni 0.0 3.0 7 187, 287
ZrO2 + 8mol%Y2O3 (8YSZ)
Al2O3 — — 1.15 wt % 288
ZrO2 TiO2 44 to 60 mol % 289
ZrN — — Unspecified 290Zr2O3 Al2O3 — — Unspecified 291
CoO — — 16.7 mol % 291
Fe2O3 — — 16.7 mol % 291Y2O3 — — 16.7 mol % 291
RT Room temperature.a In some cases, prealloyed powders have been used, and this has been indicated by mentioning PA next to the
solvent component.b In these cases, the composition of the alloy investigated is mentioned and is not necessarily the maximal solid
solubility achieved by MA.
Table 9.1 Continued
Solid Solubility Extensions 153

MD: SURYANARAYANA, JOB: 03320, PAGE: 154
4103-X_Suryanarayana_Ch09_R2_080304
2. Due to themechanical deformation introduced into the powder, particle andcrystallite size refinement occurs and lattice strain increases. These two effects causebroadening of XRD peaks and a consequent decrease in peak heights. In fact,formation of nanocrystalline solid solutions can significantly broaden the XRDpeaks.Furthermore, if the weight fraction of the second component is small, thecorresponding peaks may even be ‘‘absent.’’ Thus, the disappearance of Al reflectionsin the XRD pattern of a mechanically alloyed Ni-Al powder mixture has beenattributed to crystallite refinement to the level of about 5 nm, even though a solidsolution has not actually formed.
Even if a reflection is present in the diffraction pattern, its broadening makes thelocation of the peak position difficult and consequently the calculated lattice param-eters may not be accurate.
3. Another difficulty associated with small particle sizes is the level of detect-ability by the XRD technique. It has been shown that while 2 wt% of Ti can be easilydetected if the particle size is in the range of 26–38 Am, one requires about 25 wt%Ti ifthe particle size is in the range of 0.05–1.0 Am. Thus, a much larger amount of materialis required when the particle size is in the submicrometer range [293]. Mechanicallyalloyed materials often have particle sizes in the latter range of less than 1 Am, andconsequently the presence of small amounts of second phases cannot be easily detectedby XRD techniques.
4. There is also an inherent difficulty in determining solid solubility levels usingthe technique of XRD. It is very difficult to differentiate between XRD patterns fromspecimens containing a perfectly homogeneous solid solution and a finely decomposedmixture of two phases, e.g., formed during spinodal decomposition. This is because inboth the situations, a single-phase XRD pattern and a Vegard law dependence of thelattice parameters is expected to occur. It was shown [294] that single-phase fcc struc-tures were observed in the XRD patterns from codeposited Cu-Co thin films up to 65at%Co content, suggesting that the solid solubility of Co in Cu was increased up to 65at%. However, magnetoresistance measurements on these films pointed to the exis-tence of superparamagnetic Co-rich clusters when the Co content was higher than 12at%. Thus, conventional XRD techniques may not reveal information about thehomogeneity of a solid solution; complementary techniques should be utilized to con-firm these observations. However, complete solid solubility of Co in Cu was achievedby MA [71], as confirmed by both XRD and differential scanning calorimetrytechniques.
5. Very often, solid solubility levels are determined by extrapolating the data oflattice parameter vs. solute content obtained either for equilibrium solid solutions orfor metastable supersaturated solid solutions obtained by other nonequilibriumprocessing techniques. If such data were not available, then it could be assumed thatVegard’s law [linear variation of lattice parameter (or atomic diameter or atomicvolume) with solute content] is valid and that the lattice parameter varies linearly fromone pure component to the other. Extrapolations can be erroneous, especially if thesolid solubility is small under equilibrium or metastable conditions. Furthermore,assumption of the applicability of Vegard’s lawmay not always be valid. The extent ofdeviation from linearity of lattice parameter(s) with solute content may be significantwhen one is dealing with pairs of metals that have different crystal structures. Thisproblem is evenmore seriouswhen the components involved have noncubic structures.
6. Heavy deformation (cold working) introduces stacking faults on the {111}planes in fcc metals and alloys. Stacking faults can also be introduced in the basal
Chapter 9154

MD: SURYANARAYANA, JOB: 03320, PAGE: 155
4103-X_Suryanarayana_Ch09_R2_080304
{0001} or prismatic {1010} planes of alloys with hexagonal close-packed structures.These faults can cause anomalous hkl-dependent peak broadening in the XRDpatterns [255,295]. The effective crystallite size (Deff) measured from a reflection isdue to the combined effects of true average crystallite size (Dtrue) and the ‘‘effectivestacking fault diameter’’ (DSF) according to the relation:
1
Deff¼ 1
Dtrueþ 1
DSFð9:1Þ
The presence of stacking faults thus leads to a refined ‘‘effective’’ crystallite size.The density of stacking faults is dependent on alloy composition and it has been shownthat it varied from one in 133 atomic planes for a mechanically alloyed Cu-5 at% Copowder to one in every 23 planes for a Cu-90 at%Co alloy powder. In other words, thecalculated crystallite size, ignoring the contribution of stacking faults and assumingthat peak broadening is only due to the small crystallite size, grossly underestimatesthe true crystallite size. The true crystallite size was reported to be 3–10 times theapparent crystallite size in mechanically alloyed Cu-Co alloys [295]. The contributionof stacking faults to broadening and/or shift of peak positions is very important inalloys with low to moderate stacking fault energy, where a high density of stackingfaults can be expected.
The peak shift caused by the presence of stacking faults can further complicatethe situation in that the effects of solid solubility and stacking faults can cause the peakshifts to occur in opposite ways.
7. The technique of MA is often known to introduce impurities (substitutionalimpurities like iron, chromium, and nickel from the steel milling container as well asthe grindingmedium and interstitial impurities like nitrogen, oxygen, and carbon fromthe steel vial, milling atmosphere, and/or process control agent) and their amountsincrease with milling time (see Chapter 15 for further details about levels of con-tamination in mechanically alloyed powders). The interstitial impurities dilate thelattice and substitutional impurities can dilate or contract the lattice depending on therelative atomic sizes of these elements with respect to the solvent atom. The possiblepresence of impurities and their influence on lattice parameter(s) of the solvent latticemust be taken into account when determining the real solid solubility values. Anaccurate chemical analysis for the impurity content and the effect of these impuritieson the magnitude of peak shift should be evaluated before solid solubility extensionscan be accurately reported.
8. It has also been noted in several instances that solid solubility levels increasewith increasing initial solute content in the powder mix (see Table 9.1). This has beenreported in alloy systems such as Al-Cu [26,27], Al-Mg [26,37], Al-Mo [41], Al-Si [26],Cu-Ti [110], Mg-Al [26,27], Ni-C [69], and Ni-Ti [110], among others. This was a trueobservation since milling was carried out to the steady-state condition for each alloycomposition and this result was reported as reproducible by several investigators. Ithas also been reported that different solid solubility levels could be achieved bymillingthe powder at different temperatures. The solid solubility extensions appear to behigher when the powders were milled at lower temperatures [21,282]. Thus, it isdifficult to list one specific solid solubility value for a given alloy system, at least in somecases, under the metastable conditions obtained during MA. These observations canbe further complicated by variations in the nature of the mill, intensity of milling,milling atmosphere, and so forth.
Solid Solubility Extensions 155
Even though all the above-listed factors have not been taken into account in allof the cases, solid solubility extensions, beyond the equilibrium values have beenreported in a number of alloy systems (Table 9.1).
In some cases equilibrium solid solutions were synthesized starting from blendedelemental powders. In those alloy systems, which exhibit complete solid solubilityunder equilibrium conditions (isomorphous systems), the lower values indicated inTable 9.1 represent the composition of the alloy investigated and not the true maximalsolid solubility level that can be achieved byMA.A similar commentmay also bemadewith respect to other solid solutions that dissolve a large amount of the solute, but notin the whole composition range, under equilibrium conditions. One of the interestingobservations made is that supersaturated solid solutions could be synthesized by MAeven in immiscible systems that show a positive heat of mixing and hence do not haveany solid solubility under equilibrium conditions.
The formation of solid solutions (both equilibrium and metastable) during MAmay be attributed to the effects of severe plastic deformation. As mentioned earlier,plastic deformation refines the particle sizes and reduces the crystallite sizes of both theelemental powders. This process produces additional interfaces between the twoelemental powders and increases the grain boundary area. The decreased particle sizeand consequent increase in the density of interfaces reduces the diffusion distancesbetween particles and facilitates faster diffusion between the two elements. Since heavyplastic deformation introduces a variety of crystal defects and their density increaseswith the extent of deformation, more diffusion occurs along short circuit paths such asdislocations and grain boundaries. Diffusion is further aided by a local rise intemperature (see Chapter 8 for further details). The combined effect of all these effectspermits sufficient diffusion to occur in the interfacial regions of the ultrafine grains toform a random solid solution in which the component elements are alloyed on anatomic level.
9.6 EFFECT OF PROCESS VARIABLES
Mechanical alloying is a process in which a number of process parameters can bevaried. The solid solubility levels attained will be different when these variables arealtered, thus affording a means of achieving the desired solute content in the solidsolution and hence the properties. Since alloying is expected to occur due to particle/crystallite size reduction and increased defect density (grain boundaries, vacancies,etc.) and these effects become more significant with the intensity of deformation, thedifferent process parameters should be taken into consideration while determining thesolid solubility levels. Furthermore, the nature of the mill and milling conditionsshould to be accurately specified during reporting of solid solubility values.
The effect of different process variables on the extent of solid solution formationhas been investigated. The important variables investigated include temperature ofmilling, nature and amount of process control agent (PCA), and initial composition ofthe powder blend, among others.
9.6.1 Milling Temperature
The effect of milling temperature seems to be an important factor in determining theextent of solid solution formation. Blended elemental powder mixtures were milled at
MD: SURYANARAYANA, JOB: 03320, PAGE: 156
4103-X_Suryanarayana_Ch09_R2_080304
Chapter 9156

different temperatures ranging form liquid nitrogen temperature up to very hightemperatures of a few hundred degrees Celsius. While low temperatures were achievedby dripping liquid nitrogen or liquid nitrogen and alcohol mixture on the millingcontainer, high temperatures were obtained by heating the milling container with anelectrical heating tape. Even though cryomilling has recently become popular toachieve certain desirable properties in mechanically alloyed powder products, thereare no reports on solid solubility investigations on cryomilled alloys.
It has been shown that a steady-state condition is achieved and optimal solidsolubility of one element in the other is obtained when a balance occurs betweenmixing and decomposition reactions [296–298]. During milling, continuous shearingacross the interfaces of the two component metals A and B results in an increase of theA/B interfacial area and this results in intermixing of the two components. Thismay beconsidered as ‘‘forced’’ or ballistic mixing under nonequilibrium conditions, and thediffusion flux for this case can be designated as JB. On the other hand, thermallyactivated jumps of vacancies (due to temperature rise in the powder) increase thermaldiffusion and favor decomposition of the supersaturated solid solution into theequilibrium phase mixture. The diffusional flux in this case may be designated asJth. Under conditions of MA, a balance between these two atomic fluxes must beconsidered to decide the effectiveness in forming a solid solution. Thus, a forcingparameter, g, has been introduced [299] as the ratio between the forced and thermallyactivated jump frequencies:
g ¼ Gb=Gth ð9:2Þ
where Gb is the atomic jump frequency caused by external forcing, which helps in theintimate intermixing of the components, and Gth is the atomic jump frequency due tothermal diffusion, that aids in the equilibration of the system (favors phase decom-position and ordering). A dynamic equilibrium is maintained between these twocompeting processes. For zero or low values of g, thermally activated diffusion willdrive the system to its equilibrium state. On the other hand, for infinitely large valuesof g, the microstructure is continuously refined until a random solid solution isobtained. Usually the value of g is neither of these two extremes but intermediate.Ma et al. [298] estimated the value of g to be about 3 for a Cu-50 at% Fe alloy.
Klassen et al. [300,301] ball milled an Ag-50 at% Cu powder mixture to varioussteady-state conditions at different temperatures ranging from 85 to 473 K and notedthat a homogeneous fcc solid solution was obtained after milling at subambienttemperatures. On the other hand, a fully decomposed two-phasemixture was obtainedafter milling at 473 K. Coexistence of an equiatomic solid solution phase anddecomposed terminal solid solutions was reported at intermediate temperatures ofmilling. Klassen et al. also reported that decomposition of the supersaturated solidsolution was only mildly temperature dependent and that excess vacancies induced byshear were responsible for the decomposition of the supersaturated solid solution. Inthe Ni-Ag system an increased solid solubility level was also achieved when thepowders weremilled at low temperatures. The solid solubility of Ni in Ag was reportedto be 4.3 at%when the powders were milled at room temperature, while it increased to36–44 at% on milling the powders at –195jC [21]. But, in the Zr-Al system, themaximal solid solubility achievedwas 12.5 at%Al in Zrwhenmillingwas conducted atroom temperature, whereas it was only 8.0 at% Al at 300jC [282].
MD: SURYANARAYANA, JOB: 03320, PAGE: 157
4103-X_Suryanarayana_Ch09_R2_080304
Solid Solubility Extensions 157

However, Sheng et al. [281], reported that the solid solubility of Al in Zrcontinued to be constant at 10 at% at all the milling temperatures investigated(173–573 K). This is the only report where milling temperature did not alter the solidsolubility level.
Differences in alloying behavior were observed on mechanically alloying differ-ent alloy systems that are characterized by a large positive heat of mixing (DHm), i.e.,they do not alloy under equilibrium conditions. Cu-Fe and Ag-Fe are two suchimmiscible systems. While extensive increase in solid solubility levels was reported inthe Cu-Fe system under the metastable conditions of MA, solid solution formationwas not reported in the Ag-Fe system. Atomic level mixing and formation of solidsolutions in the Cu-Fe system, and phase separation in the Ag-Fe system (on millingboth at room temperature or liquid nitrogen temperature), were explained byMa et al.[298] on the basis of forced mixing and the g parameter referred to above. Theyconsidered an effective temperature T V defined as T V = T (1 + g), where T is thetemperature at whichmilling is conducted and g is the forcing parameter defined in Eq.(9.2). Since milling introduces a variety of crystal defects such as dislocations, grainboundaries, point defects, interphase interfaces, and so forth, the enthalpy associatedwith these milling-induced defects can be considered as DHb. This is expected todecrease the value of DHm, the enthalpy of mixing of the solution with respect toelemental states. Thus, the effective enthalpy of mixing,
DH ¼ DHm � DHb ð9:3Þ
has the same effect as increasing the value of T V. That means the system behaves as if itwere in a high-temperature high-entropy state, i.e., in a metastable state. The DHm forCu-50 at% Fe was measured as 11 kJ/mol and DHb was estimated as about 6 kJ/mol.Thus, the value of T V was calculated as 2400 K, i.e., the state of the milled Cu-Femixture is equivalent to that at about 2400K. SinceCu andFe aremiscible in the liquidstate at this elevated temperature, alloying is expected to occur under the nonequilib-rium conditions as obtained during MA.
In contrast, Ag-Fe alloys have a large positive heat of mixing (>25.5 kJ/mol).Accordingly Ag-Fe alloys continue to be immiscible even in the liquid state at thesevery high temperatures. Consequently, the decreased DH value and increasedT V cannot cause alloying in this system.
9.6.2 Process Control Agent
The use of a PCA also appears to affect the maximal achieved solid solubility limit,although the results reported are not consistent. For example, Gaffet et al. [98]reported that the solid solubility of Fe in copper was increased to 68 at% Fe whenethanol was used as a PCA, while it was only 65 at% Fe without the use of ethanol.Contrary to this, they reported that the solubility decreased with the use of ethanol as aPCA on the Fe-rich side of the Cu-Fe phase diagram. Accordingly, the solid solubilitywas 18 at% Cu in Fe when ethanol was used and it was 24.5 at% Cu in Fe withoutethanol [98]. These two effects appear to be contradictory, but no explanation for thishas been offered.
Kaloshkin et al. [302] reported that the solid solubility levels achieved werehigher when the Fe-Cu alloy powders were milled in an atmosphere containingoxygen. Yavari and Desre [303] suspected that the solid solubilities were higher in
MD: SURYANARAYANA, JOB: 03320, PAGE: 158
4103-X_Suryanarayana_Ch09_R2_080304
Chapter 9158

oxygen-containing alloys because the presence of oxygen results in a negative heat ofmixing of the multicomponent mixture. Another possible reason for this could be thatoxygen will act like a PCA and promotes fracturing of the particles and helps in theformation of very fine-grained (nanostructured) material. This greatly helps in betteralloying and achieving higher solid solubility levels. In principle, it may be expectedthat the oxygen present in the PCAs may also have a similar effect. However, theamount of oxygen released by the decomposition of the PCA during milling isrelatively small and so may not have a significant effect. In fact, it is surprising thatthe solid solubility levels achieved were lower in some cases when the powders weremilled with a PCA.
9.6.3 Starting Composition of the Powder Blend
An interesting observation that has beenmade inmechanically alloyed powders is thatthe solid solubility limit achieved increased with increasing solute content in thestarting blended elemental powder mixture. This has been observed in severalaluminum-, copper-, and nickel-based alloys, among others (see Table 9.1). Such asituation may possibly arise during rapid solidification of metallic melts when thesolute concentration at the dendrite tip can be quite high and is determined by theoperative solute partition ratio. But since there is no melting and consequently nodendrite formation involved in the MA process, such a mechanism may not beapplicable here. Another possibility is that the local overheating may change the solidsolubility limit achieved; higher temperatures lead to lower limits of solid solubility.However, it is most unlikely that the temperature rise is substantially different in alloypowder mixes with different initial solute contents; therefore, this explanation also isnot satisfactory. Furthermore, increased temperatures normally decrease the solidsolubility levels due to the enhanced equilibration effects.
The increased solid solubility level with increasing initial solute content may betentatively explained on the basis that concentration gradients between differentregions in the powder sample are steeper at higher initial solute contents and thatthese are expected to result in increased diffusion and consequently in higher solidsolubility levels. This variation may arise possibly due to kinetic considerations onlysince thermodynamically the maximal solubility that can be achieved is fixed, underthe given conditions of mixing, for a given alloy system. Calka et al.[37] noted thatthe solid solubility of Mg in Al was 40 at% in the Al-50 at% Mg powder blend andonly 18 at% Mg in the Al-30 at% Mg powder blend. They had explained that thismay be due to the higher driving force for solid-state reaction caused by an increasedvalue of the negative heat of mixing for the Al-50 at% Mg powder blend.
The influence of other process parameters also was investigated in some cases. Ithas been reported that milling of blended elemental Cu-Cr powders in an air-freeargon atmosphere resulted in the formation of a bcc solid solution [304]. However,when the powder was milled in an air-containing argon atmosphere, the solid solutionwas not formed; instead, an amorphous phase formed. A similar result was reportedfor the powders milled in a nitrogen atmosphere. The difference was explained on thebasis that the presence of air (or nitrogen) enables refinement of the grain structure tonanometer levels, which then further facilitates formation of the amorphous phase.
Gonzalez et al. [117] reported that the kinetics of alloying (time required for theformation of solid solutions) in the Fe-Al system was dependent on the intensity of
MD: SURYANARAYANA, JOB: 03320, PAGE: 159
4103-X_Suryanarayana_Ch09_R2_080304
Solid Solubility Extensions 159

milling. They noted that the Fe-Al solid solution formed in 1 h at high millingintensities, whereas alloying was not complete even after 5 h at lower millingintensities.
9.7 MECHANISMS OF SOLID SOLUBILITY EXTENSION
During the early stages of milling the powder particles undergo severe plasticdeformation resulting in repeated cold welding, shearing and fracturing (due to theincreased hardness of the powder particles), and rewelding. In the case of ductilematerials, this process leads to the formation of lamellar structures of alternate layersof the constituent metals. Interdiffusion then takes place across the interfaces due tothe reduced diffusion distances and increased diffusivity aided by creation of latticedefects and increase in temperature. However, the individual lamellae will be hetero-geneous, i.e., they have varying levels of the individual components. With continuedmilling the interlamellar spacing decreases, compositional inhomogeneity is reduced,and the interlamellar spacing decreases to such a fine level that one would not be ableto observe the lamellar structure under an optical microscope. At this stage, thecomposition is homogeneous on an atomic scale, all the powder particles have thesame composition, and true alloying occurs.
Neither the actual mechanism(s) for the formation nor the limits for solidsolubility extensions in alloy systems obtained by MA have been well investigated.The general concept has been to explain the achieved solid solubility limit based on thecommon tangent approach mentioned in Chapter 1. Accordingly, the ‘‘metastable’’equilibrium between the terminal solid solution and the amorphous or a metastableintermediate phase determines the extent of supersaturation that can be obtained.Schwarz et al. [232] suggested that the increased solid solubility of Ti in Ni inmechanically alloyed Ni-Ti powder mixtures was due to the metastable equilibriumbetween the a-Ni solid solution and the Ni-Ti amorphous phase as opposed to thestable equilibrium between the a-Ni and Ni3Ti phases. Grigorieva et al. [222]suggested that the solid solubility can be extended up to the position of theintermetallic compound in the phase diagram if the base metal and the intermetallichave similar crystal structures. Figure 9.7a shows that the maximal solid solubilityachieved under equilibrium conditions is obtained by drawing the common tangentbetween the free energy minima for the a-solid solution and the equilibrium Ni3Tiintermetallic phase. But under conditions of MA, since an amorphous phase hasformed in this system, the common tangent between the extended solid solution andthe amorphous phase determines the solid solubility level (Fig. 9.7b). That is, theextent of supersaturation is limited to the composition where the amorphous (or theintermediate) phase has the lowest free energy. A similar conclusion was drawn byother investigators [110]. However, it has been noted in recent years that significantsolid solubility extensions can be achieved in some alloy systems (e.g., Ti-Mg) evenwhen an amorphous phase did not form in those alloy systems [263]. Thus, alternativeexplanations are needed to explain the formation of solid solutions and their limits ofsolid solubility.
Suryanarayana and Froes [264] suggested that formation of supersaturated solidsolutions is closely related to the formation of fine-grained structures, reaching downto nanometer levels, during MA. The heavy mechanical deformation introduces avariety of structural defects into the powder particles, and these produce local stresses
MD: SURYANARAYANA, JOB: 03320, PAGE: 160
4103-X_Suryanarayana_Ch09_R2_080304
Chapter 9160

around the grain boundaries. This causes the nanocrystals to be in a higher energystate compared with the powder mixture of blended elemental powders. Added to this,a large volume fraction of atoms resides in grain boundaries in nanocrystallinematerials. Both of these factors are expected to enhance diffusion and consequentlythe solid solubility levels are higher in systems that contain crystallites/grains withnanocrystalline dimensions. In support of this argument it was shown that the solidsolubility of Mg in Ti is nearly zero when the grain size of the titanium phase is on theorder of micrometers, whereas significant solubility extension (about 3 at%) wasobserved when the titanium grain size was on the order of nanometers. Similar resultshave also been reported by a number of other investigators [72,172,305]. For example,Huang et al. [72] investigated the effect of particle/crystallite size on solid solubilitylevels obtained in mechanically alloyed Co-Cu powders. The particle/grain sizes weremeasured using transmission electron microscopy techniques and the chemicalcomposition of the particles was obtained by energy-dispersive X-ray analysis of thepowders. They reported that the solute content was higher the smaller the particle/
MD: SURYANARAYANA, JOB: 03320, PAGE: 161
4103-X_Suryanarayana_Ch09_R2_080304
Figure 9.7 (a) Common tangent approach to establish the maximal solid solubility of Ti inNi. The point of contact of the common tangent with the free energy curve of the a-Ni(Ti)solid solution phase drawn between the free energy curves of the a-Ni(Ti) and Ni3Ti
intermetallic determines the maximal equilibrium solid solubility of Ti in Ni. (b) Undernonequilibrium conditions the maximal solid solubility of Ti in Ni is obtained by drawing acommon tangent between the free energy curves of the a-Ni(Ti) solid solution and the
amorphous phases.
Solid Solubility Extensions 161

crystallite size in their mechanically alloyed Co-Cu powders. The cobalt content wason an average 6 at%when the crystallite size was 25–30 nm, and it increased to 20 at%for a crystallite size of 12–15 nm, and to 24 at% for a crystallite size of 5–8 nm.Similarly, Yelsukov et al. [172] noted that to achieve a solid solubility of 30 at% Sn inFe, reduction of grain size to nanometer levels was important and that the role of grainboundaries was critical in this process.
In comparison to a coarse-grained material, the volume fraction of grainboundaries in a nanocrystalline structure is much higher [306]. Furthermore, diffu-sivity of the component atoms is increased due to the large amount of structuraldefects (such as dislocations and grain boundaries) and the local stresses in such amaterial [306]. Under these conditions, solute atoms substitute the solvent atoms in thegrain boundaries and vice versa. Rapid diffusion of atoms from one grain into theother leads to quick homogenization and results in the formation of solid solutions.Veltl et al. [307] suggested that the energy stored in the grain boundaries of nano-crystalline materials serves as a driving force for the formation of a solid solution. Itwas shown earlier [308] that a substantial amount of enthalpy can be stored innanocrystalline materials due to the large grain boundary area. It was also suggestedthat the enhanced solid solubility might be due to the high dislocation densityproduced during milling [93,309].
Yavari et al. [310–312] proposed another mechanism based on the assumptionthat upon deformation elemental fragments with small tip radii are formed and a smallfraction of thematerial is expected to be as crystallites 2 nmor less in diameter. In thesecases the capillary pressure forces atoms at the tips of the fragments to dissolve. Thisprocess continues to full dissolution with increased milling time, due to generation ofsuch small particles by necking at the tips of larger ones [310]. A similar mechanismwas also suggested by Gente et al. [71]. They suggested that the chemical enthalpyassociated with the interface between the elemental components can enhance thefree energy of a composite above that of the related solid solution, thus providing adriving force for alloying in systems with a positive free energy of mixing. The maindifference between the models proposed by Yavari et al. [310–312] andGente et al. [71]is that the former assumes incoherent interfaces between elemental componentswhereas the latter suggests formation of composites with coherent elemental domainsbefore alloying occurs. The experimental information presently available is notsufficient to indicate one model over the other.
Based on their experimental results, Yelsukov et al. [172,173] suggested that inalloy systems that have limited solid solubility of one element in the other, formationof supersaturated solid solutions is likely to be preceded by intermetallic formation.Taking the Fe-Sn system as an example, they showed that amixture of a-Fe and FeSn2intermetallic had formed in the early stages (1–2 h) of milling the blended elementalpowders. The proportion of the intermetallic formed peaked at about 40% withmilling time noting that the proportion of the intermetallic was higher the higher theSn content in the starting powder mixture. All of the powder mixture transformed intoa supersaturated solid solution at later stages of milling (at about 5 h) according to thereaction:
a-Feþ FeSn2 ! a-FeðSnÞ ð9:4Þ
Assuming that segregation of Sn to grain boundaries is the mechanism by which solidsolubility increases, the authors showed that the grain size of the solid solution phase
MD: SURYANARAYANA, JOB: 03320, PAGE: 162
4103-X_Suryanarayana_Ch09_R2_080304
Chapter 9162

plays an important role in determining the solid solubility level. Accordingly, it wasconcluded that reduction of the grain size to nanometer level is critical to achievementof high solubility levels.
Formation of (supersaturated) solid solutions by MA is more noteworthy inliquid- and solid-immiscible systems than in solid-miscible systems. Gente et al. [71],Huang et al. [72,85], and Jiang et al. [313] reported formation of extensive solidsolutions in the Cu-Co and Fe-Cu systems.
Themechanism responsible for enhanced solid solubility in systems with positiveheat of mixing is not clear. Bellon and Averback [296] suggested that alloying in suchsystems may be a result of the g factor effect. That is, the frequency of continuousshearing of atomic planes during milling (Gb) may be dominant over the thermalequilibration effects (Gth). It has also been suggested that interdiffusion betweenadjacent elemental domains, when their dimensions are reduced to a few nanometers,may be responsible for alloying to occur [71,312]. Under these conditions, it wassuggested that sufficient thermodynamic driving force (interfacial energy) for disso-lution is generated and the nanomixture may then behave as a system with a negativeheat of mixing. Ma et al. [298] comment that neither of these two approaches aloneappears adequate to explain solid solution formation observed in these systems. Thethermodynamic argument alone is sufficient only when the domain sizes are reduced to1 nm or less. However, high-resolution transmission electron microscopy investiga-tions have shown that only about 1% or so of the crystallites have such smalldimensions. Furthermore, it has also been shown that complete solid solution couldform even when the domain sizes are as large as 8 nm [72]. On the other hand, thelimited probability of the kinetic shearing-mixing process alone may also not achievethe desired solid solution formation. In fact, efficient shearing of atomic planes maybecome difficult when the crystallite is very small because such small crystallites maynot support any dislocations. The shearing deformation is controlled by grainboundary mechanisms. Thus, the achievement of solid solubility in alloy systems withpositive heat of mixing may not be due to just one single mechanism but rather to acombination of mechanisms.
Schwarz [314] proposed another model based on dislocation kinetics and solute-dislocation interactions. Atomically clean interfaces are produced during MA by thefracture of powder particles. The solute-dislocation interaction in an edge dislocationoccurs through elastic locking, and the interaction energy for this locking is propor-tional to the misfit parameter, d.
d ¼ 1
a
da
dc
� �ð9:5Þ
where a is the lattice parameter of the solvent and da/dc is the rate of change in thelattice parameter with the solute concentration c. Thus, the interaction is strongestwhen themisfit parameter is large, i.e., the atomic volumes of the solvent and solute aresubstantially different. Because of this interaction, solute atoms larger (smaller) thanthe solvent are attracted to the expanded (contracted) lattice regions near the cores ofthe edge dislocations. Thus, the solute atoms penetrate into the cores of edgedislocations in the solvent lattice. Since the solute atoms have an attractive interactionwith the dislocations, the solute concentration in the core of the dislocations attainsvalues largely in excess of the equilibrium solubilities. The next time the particle is
MD: SURYANARAYANA, JOB: 03320, PAGE: 163
4103-X_Suryanarayana_Ch09_R2_080304
Solid Solubility Extensions 163

trapped between the grinding media, it experiences an applied stress much higher thanthe flow stress of either of the two constituents. As a result, the dislocations startmoving out through glide and reach another point in the powder. However, the soluteatoms cannot diffuse along with the fast-moving dislocations and consequently are leftbehind, in a state of supersaturtion.
9.8 SOLID SOLUBILITY PLOTS
Asmentioned at the beginning of this chapter, Hume-Rothery rules [2] suggest that themetallic radii of the solvent and solute should not differ by more than 15% to achievegood solid solubility of one element in the other. This was observed to be true inmechanically alloyed Co–transition metal alloys [70]. To further confirm whether asimilar situation could be obtained in other alloy systems processed by MA, Bansal etal. [121] studied the alloying behavior of powder blends of Fe with 25 at%Al, As, Ge,In, Sb, Si, Sn, and Zn. They concluded that significant solid solubility (5 at%) could beachieved by MA even when the difference in the atomic radii between the constituentelements was about 30%. Stated differently, if the atomic radius difference was lessthan 15%, solubilities of up to 25 at% could be achieved; at larger differences in theatomic radii, the solid solubility was lower.
Figures 9.8–9.10 compare the equilibrium room temperature solid solubilities ofdifferent solute elements in aluminum, copper, and iron as the solvents with theextended solubilities obtained by MA. The data are taken from Table 9.1. It may benoted that the room temperature solid solubility in most of these systems is virtuallyzero and that MA has yielded significant increases in the solid solubility limits of mostof the elements. To rationalize the solid solubility increases in mechanically alloyedpowders in terms of the Hume-Rothery rules (small difference in atomic size; similarelectronegativities, valencies, and crystal structures of the two components involved),the extended solid solubility values of different solute elements in copper are plottedagainst atomic radius in Figure 9.11. TheF15% limits of the atomic radius of copper
MD: SURYANARAYANA, JOB: 03320, PAGE: 164
4103-X_Suryanarayana_Ch09_R2_080304
Figure 9.8 Comparison of equilibrium and extended solid solubility limits of different soluteelements in aluminum achieved by MA.
Chapter 9164

are also indicated in Figure 9.11. It is interesting that in all cases in which the solidsolubility limit has been considerably increased byMA, the atomic radius of the soluteis well within the 15% limit suggested by Hume-Rothery. In some cases, significantincreases in solid solubility limits have been observed even when the atomic sizedifference is on the border line (e.g., Cu-Hg). Figure 9.11 also makes it clear that thesolid solubility increase is very small when the difference in the atomic sizes between
MD: SURYANARAYANA, JOB: 03320, PAGE: 165
4103-X_Suryanarayana_Ch09_R2_080304
Figure 9.9 Comparison of equilibrium and extended solid solubility limits of different solute
elements in copper achieved by MA.
Figure 9.10 Comparison of equilibrium and extended solid solubility limits of differentsolute elements in iron achieved by MA.
Solid Solubility Extensions 165

the solvent and the solute is very large (e.g., Cu-Nb andCu-Sb). However, it should, benoted that the equilibrium solid solubility of niobium in copper is only 0.1 at%, andMA increased it to about 3 at%. Thus, if the ratio of the extended solid solubilityachieved by MA and the equilibrium solid solubility is plotted, then the result is evenmore striking. Since it is not possible to easily plot the infinite value of the ratio ofextended to equilibrium solid solubility limits, the reciprocal of this value is plotted inFigure 9.12. In this graph, it may be noted that the ratios are always less than 1; i.e., thesolid solubilities are always extended by MA. If complete solid solubility of oneelement in the other has been achieved under both equilibrium and mechanicallyalloyed conditions, then the ratio is 1. (Even if complete solid solubility is not achieved,but the same values are obtained in both the conditions, then also the ratio will be 1.However, such situations have not been reported in mechanically alloyed powders). Avalue of zero here corresponds to a situation whereby the equilibrium solid solubility iszero and extension has been achieved by MA. Irrespective of the extension achieved,the ratio is always zero. Thus, one notes from Figure 9.12 that substantial increases insolid solubility have been obtained for Ag, C, Co, Cr, Hg, Sn, V, and W. The actualextended solid solubility values may be obtained from Table 9.1.
This analysis confirms that the rules applicable for solid solution formationunder equilibrium conditions are also valid under nonequilibrium conditions. It maybe further noted that the maximal expected solubility limits, not observed underequilibrium conditions when the Hume-Rothery rules are satisfied, have been realizedunder nonequilibrium conditions. The best example for this is the Cu-Ag system,where the Hume-Rothery rules predict complete mutual solid solubility of Cu and Agwhereas only a limited solid solubility is observed under equilibrium conditions.
MD: SURYANARAYANA, JOB: 03320, PAGE: 166
4103-X_Suryanarayana_Ch09_R2_080304
Figure 9.11 Extended solid solubility limits of different solute elements in copper achieved
by MA of blended elemental powder mixtures plotted against atomic radius of the soluteelement.
Chapter 9166
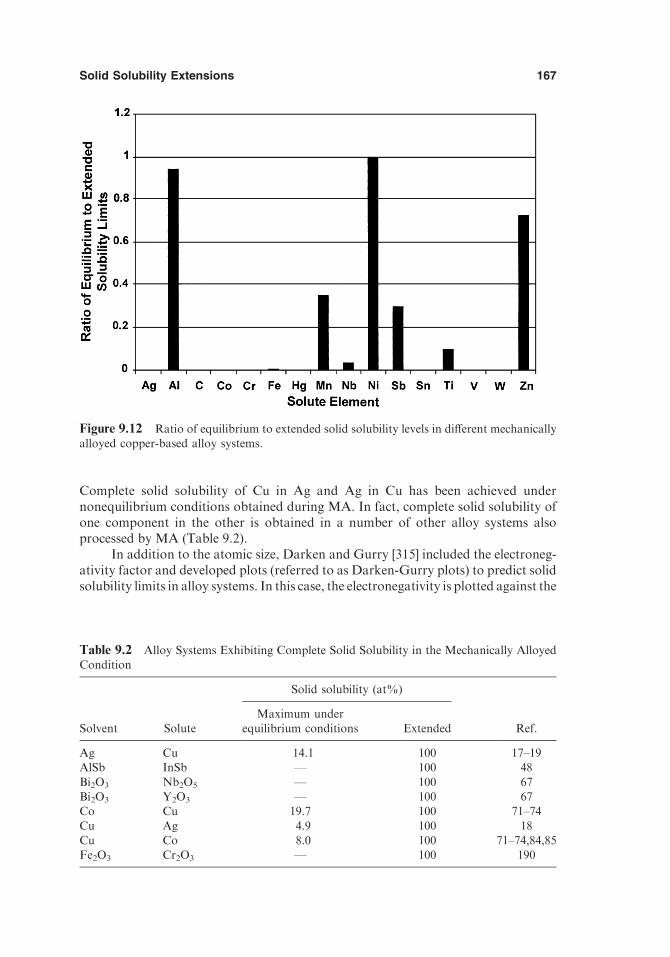
Complete solid solubility of Cu in Ag and Ag in Cu has been achieved undernonequilibrium conditions obtained during MA. In fact, complete solid solubility ofone component in the other is obtained in a number of other alloy systems alsoprocessed by MA (Table 9.2).
In addition to the atomic size, Darken and Gurry [315] included the electroneg-ativity factor and developed plots (referred to as Darken-Gurry plots) to predict solidsolubility limits in alloy systems. In this case, the electronegativity is plotted against the
MD: SURYANARAYANA, JOB: 03320, PAGE: 167
4103-X_Suryanarayana_Ch09_R2_080304
Figure 9.12 Ratio of equilibrium to extended solid solubility levels in different mechanicallyalloyed copper-based alloy systems.
Table 9.2 Alloy Systems Exhibiting Complete Solid Solubility in the Mechanically AlloyedCondition
Solvent Solute
Solid solubility (at%)
Maximum underequilibrium conditions Extended Ref.
Ag Cu 14.1 100 17–19AlSb InSb — 100 48
Bi2O3 Nb2O5 — 100 67Bi2O3 Y2O3 — 100 67Co Cu 19.7 100 71–74
Cu Ag 4.9 100 18Cu Co 8.0 100 71–74,84,85Fe2O3 Cr2O3 — 100 190
Solid Solubility Extensions 167

metallic radius corresponding to a coordination number of 12, and an ellipse isinscribed with an atomic size difference ofF15%and an electronegativity difference ofF0.3. Elements lying within the ellipse are expected to show high solid solubilities, andthose outside the ellipse are expected to show limited solid solubilities.
Figure 9.13 shows the traditional Darken-Gurry plot, and it can be clearly seenthat all the elements lying within the ellipse have a very high solid solubility in copper.Among the elements outside the ellipse, Ag is soluble up to 100% in copper under thenonequilibrium conditions ofMA. Hg also has a reasonably high solubility of 17 at%,and Al 18 at%. The other elements (Nb, Sb, Sn, and Ti) have solubility of less than 10at%.
Girgis suggested [316] that to determine the solid solubility of one element in theother, one could construct
1. A small ellipse, with the element in the center, with F0.2 electronegativitydifference on the y axis and F8% atomic radius difference on the x axis,
2. A bigger ellipse, with F0.4 electronegativity difference on the y axis andF15% atomic radius difference on the x axis.
The solid solution alloys can then be divided into three groups: (1) those for whichthe second element has high solubility (more than 15%) lie inside the small ellipse;(2) those for which the second element has low solubility lie between the two ellipses;and (3) those in which the second element tends to be almost insoluble are outsideboth the ellipses. Figure 9.14 shows the modified Darken-Gurry plot for mechan-ically alloyed copper-based powder mixtures. Here it may be noted that solidsolubility extensions are high (>50 at%), when the elements are lying within the
MD: SURYANARAYANA, JOB: 03320, PAGE: 168
4103-X_Suryanarayana_Ch09_R2_080304
Figure 9.13 Darken-Gurry (electronegativity vs. atomic size) plot for mechanically alloyed
copper-based powder mixtures. Elements lying inside the ellipse drawn withF15% atomic sizeand F0.3 unit of electronegativity are expected to show high solid solubilities.
Chapter 9168

smaller ellipse and reasonably extensive (35–50 at%) when they are lying in-betweenthe two ellipses. However, the complete solubility of Ag in Cu and the reasonablylarge solubilities of Hg (17 at%) and Al (18 at%) are not predicted by this plot sincethese two elements lie outside the larger ellipse. From these plots it appears thatneither the traditional nor modified Darken-Gurry plots account for the extendedsolubilities in alloy systems achieved by MA.
9.9 COMPARISON BETWEEN MECHANICAL ALLOYING AND RAPIDSOLIDIFICATION PROCESSING
The absolute limits of solid solubility extension in alloys processed by rapid solidifi-cation processing (RSP) have been determined from thermodynamic considerationsusing the concept of T0 temperature at which, for a given composition, the solid andliquid phases have the same free energy. Supersaturated solid solutions could beobtained only when the liquid was undercooled to a temperature below T0 [11]. Eventhough MA also is a nonequilibrium processing technique, there have been noattempts so far to rationalize the available experimental data of solid solubilityextensions. Further, the maximal possible limits of solid solubility extensions havenot been defined theoretically. However, since no liquid phase is involved duringMA,it is doubtful if the same criterion (ofT0) as in the RSP case could be used to rationalizesolid solubility extensions achieved during MA.
MD: SURYANARAYANA, JOB: 03320, PAGE: 169
4103-X_Suryanarayana_Ch09_R2_080304
Figure 9.14 Modified Darken-Gurry plot for mechanically alloyed copper-based powder
mixtures. Two ellipses are drawn to determine high solid solubilities. The inner ellipse is drawnwith F8% atomic size and F0.2 unit of electronegativity of copper, while the outer ellipse isdrawn with F15% atomic size and F0.4 unit of electronegativity. Elements lying inside theinner ellipse are expected to show very high solid solubilities and those outside the outer ellipseare least soluble.
Solid Solubility Extensions 169

MD: SURYANARAYANA, JOB: 03320, PAGE: 170
4103-X_Suryanarayana_Ch09_R2_080304
Table 9.3 Comparison of Solid Solubility Limits (at%) Achieved by Rapid SolidificationProcessing (RSP) and Mechanical Alloying (MA)
Solvent Solute
Equilibrium value Extended value
At RT Max. By MA By RSP
Ag Cu 0.0 14.0 100 100
Gd 0.0 0.95 5.0 5.0–6.0Al Cr 0.0 0.37 5 6
Cu 0.0 2.48 5.6 18
Fe 0.0 0.025 4.5 6.0Ge 0.0 2.0 14.1 40Mg 1.2 18.6 40 40Mn 0.4 0.62 18.5 9
Mo 0.0 0.06 2.4 2.4Nb 0.0 0.065 25 2.4Ni 0.0 0.11 10 7.7
Ru 0.0 0.008 14 4.5Si 0.0 1.5 4.5 16Ti 0.0 0.75 50 2.0
AlSb InSb — — 100 —Cd Zn 3.1 4.35 50 35Co Cu 0.0 19.7 100 25
Zr 0.0 <1.0 5 1.5Cu Ag 0.0 4.9 100 100
Co 100Cr 0.0 0.0 50 4.5
Fe 0.3 11.0 68 20V 0.0 0.1 Unspecified 1.0
Fe B 0.0 0.0 4.0 4.3
Cu 7.2 15.0 40 15Ge 10.0 17.5 25 25Sn 0.0 9.2 25 20.0
W 0.0 14.3 Unspecified 20.8Mg Al 0.9 11.0 3.7 21.6Nb Al 5.9 21.5 60 25Ni C 0.0 7.4 12 8.2
Ge 9.6 12.0 25 22Nb 3.2 14.0 15 15.1Si 10.0 15.8 24 20
Sn 0.0 10.6 17.5 17.0Ta 3.0 17.2 30 16.6V 15.0 43.0 25 51.0
Ti Si 0.0 3.5 37.5 6.0
Chapter 9170

The mechanisms by which supersaturated solid solutions form byMA and RSPtechniques are different; even then comparisons have been frequently made, with nospecific conclusions. Table 9.3 compares the available data. For example, solidsolutions have been formed in the whole composition range in the Cu-Ag system byboth the techniques. Rapid solidification processing produced continuous series ofsolid solutions in many other alloy systems [8], but MA did not obtain similar results.Solid solutions have been obtained in the full composition range in the AlSb-InSb andCu-Co systems by MA but not by RSP. Very few examples are reported in theliterature where complete solid solubility has been achieved in the same alloy systembyboth the MA and RSP techniques. Cu-Ag is the only such system. It will be useful toconduct investigations on other alloy systems to find out whether similar results areobtained by both techniques. The levels of solid solubility achieved are also different indifferent systems by these two techniques.
It was frequently observed that the extent of supersaturation in rapidly solidifiedalloys increased with increasing rate of solidification [4,8–10,317]. Thus, the solubilityextension is higher in an alloy system when the liquid was melt spun at about 105–106
K/s than when the melt was atomized at 102–103 K/s. But a similar situation has notbeen reported in mechanically alloyed powders. For example, one could investigatethe solid solubility extensions as a function of milling intensity, energy input, ball-to-powder weight ratio, or other parameters. In fact, taking all these variables intoconsideration one could define an effective ‘‘quench’’ rate or milling efficiency. Itwould be then worthwhile to investigate if the solid solubility extensions are higher athigher milling efficiencies in the MA case also.
The limits of solid solubility extensions achieved by MA have also beencomparedwith the values obtained by othermethods. Figure 9.15 shows schematically
MD: SURYANARAYANA, JOB: 03320, PAGE: 171
4103-X_Suryanarayana_Ch09_R2_080304
Figure 9.15 Solid solubility limits of Fe in Cu obtained by different nonequilibrium pro-
cessing techniques.
Solid Solubility Extensions 171

MD: SURYANARAYANA, JOB: 03320, PAGE: 172
4103-X_Suryanarayana_Ch09_R2_080304
Figure
9.16
ComparisonofroomtemperatureequilibriumsolidsolubilityofsoluteelementsinAlandthose
obtainedbymechanicalalloying(MA)andrapidsolidificationprocessing(RSP)techniques.
Chapter 9172

the room temperature solid solubility of Fe inCu obtained by different nonequilibriumprocessing methods. It may be noted that the highest solid solubility extension wasachieved in the mechanically alloyed powders.
It was shown in Chapter 1 that the maximal departure from equilibriumobtainable by MA is higher than that by RSP. Therefore, one expects larger solidsolubility extensions during MA than during RSP. But the available results do notalways confirm this. As can be noted from Table 9.3 and Figure 9.16, one can make ageneral observation that the maximal solid solubility extension achieved by MA isgenerally higher than that by RSP except in the cases of Cu, Ge, and Si as soluteelements. This appears to be even more impressive when the room temperatureequilibrium solid solubility is very small or almost zero. This is understandablebecause MA is a near–room temperature process and therefore the room temperaturesolid solubility is more important than the maximal solid solubility at the highertemperatures; the latter could be important in RSP studies.
REFERENCES
1. Wilm, A. (1911). Metallurgie 8:225; Kelly, A., Nicholson, R. B. (1963). Prog. Mater.Sci. 10:149–391.
2. Hume-Rothery, W., Smallman, R. E., Haworth, C. W. (1969). The Structure of Metals
and Alloys. London, UK: Institute of Metals.3. Massalski, T. B. (2000). In: Turchi, P. E. A., Shull, R. D., Gonis, A., eds. The Science ofAlloys for the 21st Century. Warrendale, PA: TMS, pp. 55–70.
4. Suryanarayana, C., ed. Non-Equilibrium Processing of Materials. Oxford, UK:
Pergamon.5. Duwez, P., Willens, R. H., Klement, W. Jr. (1960). J. Appl. Phys. 31:1136–1137.6. Luo, H. L., Duwez, P. (1964). J. Less Common Metals 6:248–249.
7. Duwez, P., Willens, R. H., Klement, W. Jr. (1960). J. Appl. Phys. 31:1500.8. Anantharaman, T. R., Suryanarayana, C. (1971). J. Mater. Sci. 6:1111–1135.9. Anantharaman, T. R., Ramachandrarao, P., Suryanarayana, C., Lele, S., Chattopad-
hyay, K. (1977). Trans. Indian Inst. Metals 30:423–448.10. Jones, H. (1982). Rapid Solidification of Metals and Alloys. Monograph No. 8. London,
UK: Institution of Metallurgists.
11. Boettinger, W. J., Perepezko, J. H. (1993). In: Liebermann, H. H., ed. Rapidly SolidifiedAlloys: Processes, Structures, Properties, Applications. New York: Marcel Dekker,pp. 17–78.
12. Suryanarayana, C. (2002). In: Buschow, K. H. J., Cahn, R. W., Flemings, M. C.,
Kramer, E. J. Mahajan, S., eds. Encyclopedia of Materials: Science and Technology—Updates. Oxford, UK: Pergamon.
13. Pearson, W. B. (1967). A Handbook of Lattice Spacings and Structures of Metals and
Alloys. Oxford, UK: Pergamon.14. Suryanarayana, C., Norton, M. G. (1998). X-Ray Diffraction: A Practical Approach.
New York: Plenum.
15. Cullity, B. D., Stock, S. R. (2001). Elements of X-Ray Diffraction. 3rd ed. EnglewoodCliffs, NJ: Prentice Hall.
16. Paruchuri, M. R., Zhang, D. L., Massalski, T. B. (1994). Mater. Sci. Eng. A174:119–125.
17. Shingu, P. H., Ishihara, K. N., Uenishi, K., Kuyama, J., Huang, B., Nasu, S. (1990).In: Clauer, A. H., deBarbadillo, J. J., eds. Solid State Powder Processing. Warrendale,PA: TMS, pp. 21–34.
MD: SURYANARAYANA, JOB: 03320, PAGE: 173
4103-X_Suryanarayana_Ch09_R2_080304
Solid Solubility Extensions 173

18. Uenishi, K., Kobayashi, K. F., Ishihara, K. N., Shingu, P. H. (1991). Mater. Sci. Eng.A134:1342–1345.
19. Najafabadi, R., Srolovitz, D. J.,Ma, E., Atzmon,M. (1993). J. Appl. Phys. 74:3144–3149.
20. Tang, J. (1996). Mater. Sci. For. 225–227:477–482.21. Xu, J., Herr, U., Klassen, T., Averback, R. S. (1996). J. Appl. Phys. 79:3935–3945.22. Aymard, L., Dehahaye-Vidal, A., Portemer, F., Disma, F. (1996). J. Alloys Compounds
238:116–127.23. Jianu, A., Kuncser, V., Nicula, R., Rohlsberger, R., Stir, M., Burkel, E. (2001).Mater.
Sci. For. 360–362:589–594.
24. Kobayashi, K. F., Tachibana, N., Shingu, P. H. (1990). J. Mater. Sci. 25:3149–3154.25. Li, F., Ishihara, K. N., Shingu, P. H. (1991). Metall. Trans. 22A:2849–2854.26. Clark, C. R., Suryanarayana, C., Froes, F. H. (1995). In: Phillips, M., Porter, J.,
compilers. Advances in Powder Metallurgy and Particulate Materials—1995. Part I.Princeton, NJ: Metal Powder Industries Federation, pp. 135–143.
27. Clark, C. R., Suryanarayana, C., Froes, F. H. (1995). In: Froes, F. H., Suryanarayana,C., Ward-Close, C. M., eds. Synthesis and Processing of Lightweight Metallic Materials.
Warrendale, PA: TMS, pp. 175–182.28. Kim, H. G., Myung, W-N., Sumiyama, K., Suzuki, K. (2001). J. Alloys Compounds
322:214–219.
29. Garcıa Escorial, A., Torralba, M., Caruana, G., Cardoso, K. R., Lieblich, M. (1998).Mater. Sci. For. 269–272:169–174.
30. Huang, B., Ishihara, K. N., Shingu, P. H. (1997). Mater. Sci. Eng. A231:72–79.
31. Fadeeva, V. I., Leonov, A. V. (1992). Mater. Sci. For. 88–90:481–488.32. Zhou, F., Luck, R., Lu, K., Ruhle, M. (2001). Z. Metallkde. 92:675–681.33. Mukhopadhyay, D. K., Suryanarayana, C., Froes, F. H. (1995). Metall. Mater. Trans.
26A:1939–1946.34. Polkin, I. S., Kaputkin, E. Ya, Borzov, A. B. (1990). In: Froes, F. H., deBarbadillo, J.
J., eds. Structural Applications of Mechanical Alloying. Materials Park, OH: ASMInternational, pp. 251–256.
35. Fadeeva, V. I., Portnoy, V. K., Baldokhin, Yu V., Kotchetov, G. A., Matyja, H. (1998).Nanostructured Mater. 12:625–628.
36. Radlinski, A. P., Calka, A., Ninham, B. W., Kaczmarek, W. A. (1991).Mater. Sci. Eng.
A134:1346–1349.37. Calka, A., Kaczmarek, W., Williams, J. S. (1993). J. Mater. Sci. 28:15–18.38. Zhang, D. L., Massalski, T. B., Paruchuri, M. R. (1994).Metall. Mater. Trans. 25A:73–
79.39. Suryanarayana, C., Sundaresan, R. (1991). Mater. Sci. Eng. A131:237–242.40. Sun, J., Zhang, J. X., Fu, Y. Y., Hu, G. X. (2002). Mater. Sci. Eng. A329–331:
703–707.
41. Zdujic, M. V., Kobayashi, K. F., Shingu, P. H. (1991). J. Mater. Sci. 26:5502–5508.42. Peng, Z., Suryanarayana, C., Froes, F. H. (1992). Scripta Metall. Mater. 27:475–480.43. Peng, Z., Suryanarayana, C., Froes, F. H. (1996). Metall. Mater. Trans. 27A:41–48.
44. Peng, Z., Suryanarayana, C., Froes, F. H. (1993). In: deBarbadillo, J. J., et al., eds.Mechanical Alloying for Structural Applications. Materials Park, OH: ASM Interna-tional, pp. 335–341.
45. Shingu, P. H. (1991). In: Hirano, K., et al., eds. Science and Engineering of Light Metals.Tokyo: Japan Inst. Light Metals, pp. 677–684.
46. Benameur, T., Inoue, A., Masumoto, T. (1994). Nanostructured Mater. 4:303–322.
47. Xu, Y., Makhlouf, S. A., Ivanov, E., Wakoh, K., Sumiyama, K., Suzuki, K. (1994).Nanostructured Mater. 4:437–444.
48. Uenishi, K., Kobayashi, K. F., Ishihara, K. N., Shingu, P. H. (1992). Mater. Sci. For.88–90:453–458.
MD: SURYANARAYANA, JOB: 03320, PAGE: 174
4103-X_Suryanarayana_Ch09_R2_080304
Chapter 9174

49. Cocco, G., Soletta, I., Battezzati, L., Baricco, M., Enzo, S. (1990). Phil. Mag. B61:473–486.
50. Murty, B. S., Naik, M. D., Mohan Rao, M., Ranganathan, S. (1992). Mater. For.
16:19–26.51. Abe, S., Saji, S., Hori, S. (1990). J. Jpn. Inst. Metals 54:895–902.52. Saji, S., Neishi, Y., Araki, H., Minamino, Y., Yamane, T. (1995).Metall. Mater. Trans.
26A:1305–1307.53. Fan, G. J., Gao, W. N., Quan, M. X., Hu, Z. Q. (1995). Mater. Lett. 23:33–37.54. Miki, M., Yamasaki, T., Ogino, Y. (1993).Mater. Trans. Jpn. Inst. Metals 34:952–959.
55. Oehring, M., Yan, Z. H., Klassen, T., Bormann, R. (1992). Phys. Stat. Sol. (a)131:671–689.
56. Oehring, M., Klassen, T., Bormann, R. (1993). J. Mater. Res. 8:2819–2829.
57. Fan, G. J., Quan, M. X., Hu, Z. Q. (1995). Scripta Metall. Mater. 33:377–381.58. Leonov, A. V., Szewczak, E., Gladilina, O. E., Matyja, H., Fadeeva, V. I. (1997).
Mater. Sci. For. 235–238:67–72.59. Fan, G. J., Quan, M. X., Hu, Z. Q. (1995). Scripta Metall. Mater. 32:247–252.
60. Fadeeva, V. I., Leonov, A. V., Szewczak, E., Matyja, H. (1998). Mater. Sci. Eng.A242:230–234.
61. Saji, S., Araki, H., Hashimoto, K., Murata, E. (1996). Mater. Trans. Jpn. Inst. Metals
37:1061–1066.62. Fan, G. J., Quan, M. X., Hu, Z. Q. (1995). J. Mater. Sci. 30:4847–4851.63. Che, X., Wang, Q., Hu, G. (1995). Scripta Metall. Mater. 33:2019–2023.
64. Jiang, J. Z., Mørup, S., Linderoth, S. (1996). Mater. Sci. For. 225–227:489–496.65. Di, L. M., Bakker, H., Barczy, P., Gacsi, Z. (1993). Acta Metall. Mater. 41:2923–2932.66. Martin-Lopez, R., Zandona, M., Scherrer, H. (1996). J. Mater. Sci. Lett. 15:16–18.
67. Esaka, T., Takai, S., Nishimura, N. (1989). Denki Kagaku 64:1012.68. Mukhopadhyay, D. K., Suryanarayana, C., Froes, F. H. (1994). Scripta Metall. Mater.
30:133–137.69. Tanaka, T., Ishihara, K. N., Shingu, P. H. (1992). Metall. Trans. 23A:2431–2435.
70. Eckert, J., Schultz, L., Urban, K. (1990). J. Less Common Metals 166:293–302.71. Gente, C., Oehring, M., Bormann, R. (1993). Phys. Rev. B48:13244–13252.72. Huang, J. Y., Wu, Y. K., He, A. Q., Ye, H. Q. (1994). Nanostructured Mater. 4:293–302.
73. Cabanas-Moreno, J. G., Dorantes, H., Lopez-Hirata, V. M., Calderon, H. A., Hallen-Lopez, J. M. (1995). Mater. Sci. For. 179–181:243–248.
74. Arce Estrada, E. M., Dıaz De la Torre, S., Lopez Hirata, V. M., Cabanas Moreno, J. G.
(1996). Mater. Sci. For. 225–227:807–812.75. Kuhrt, Ch, Schultz, L. (1992). J. Appl. Phys 71:1896–1900.76. Antolini, E., Daturi, M., Ferretti, M. (1996). J. Mater. Sci. Lett 15:416–418.77. Aymard, L., Dumont, B., Viau, G. (1996). J. Alloys Compounds 242:108–113.
78. Shen, T. D., Koch, C. C. (1996). Acta Mater. 44:753–761.79. Uenishi, K., Kobayashi, K. F., Ishihara, K. N., Shingu, P. H. (1992). Mater. Sci. For.
88–90:459–466.
80. Ying, D. Y., Zhang, D. L. (2000). Mater. Sci. Eng. A286:152–156.81. Yamane, T., Okubo, H., Hisayuki, K., Oki, N., Konishi, M., Komatsu, M., Minamino,
Y., Koizumi, Y., Kiritani, M., Kim, S. J. (2001). J. Mater. Sci. Lett. 20:259–260.
82. Saji, S., Kadokura, T., Anada, H., Notoya, K. (1998). Mater. Trans. Jpn. Inst. Metals39:778–781.
83. Diaz-Barriga-Arceo, L., Orozco, E., Tsuchiya, K., Umemoto, M., Lopez-Hirata, V. M.
(2002). Mater. Sci. For. 386–388:147–152.84. Baricco, M., Battezzati, L., Enzo, S., Soletta, I., Cocco, G. (1993). Spectrochim. Acta
A49:1331–1344.85. Huang, J.Y.,Yu,Y.D.,Wu,Y.K., Li,D.X., Ye,H.Q. (1997). J.Mater. Res. 12:936–946.
MD: SURYANARAYANA, JOB: 03320, PAGE: 175
4103-X_Suryanarayana_Ch09_R2_080304
Solid Solubility Extensions 175

86. Galdeano, S., Chaffron, L., Mathon, M. H., Vincent, E., De Novion, C. H. (2001).Mater. Sci. For. 360–362:367–372.
87. Ogino, Y., Murayama, S., Yamasaki, T. (1991). J. Less Common Metals 168:221–
235.88. Barro, M. J., Navarro, E., Agudo, P., Hernando, A., Crespo, P., Garcia Escorial, A.
(1997). Mater. Sci. For. 235–238:553–558.
89. Enzo, S.,Mulas, G., Frattini, R., Principi, G.,Gupta, R., Cooper, R., Cowlam,N. (1997).Mater. Sci. For. 235–238:529–534.
90. Ueda, Y., Ikeda, S., Mori, Y., Zaman, H. (1996). Mater. Sci. Eng. A217–218:371–375.
91. Eckert, J., Holzer, J. C., Krill, C. E. III, Johnson, W. L. (1992). J. Mater. Res. 7:1980–1983.
92. Macri, P. P., Rose, P., Frattini, R., Enzo, S., Principi, G., Hu,W. X., Cowlam, N. (1994).
J. Appl. Phys. 76:4061–4067.93. Eckert, J., Holzer, J. C., Johnson, W. L. (1993). J. Appl. Phys. 73:131–141.94. Eckert, J., Holzer, J. C., Krill, C. E. III, Johnson, W. L. (1993). J. Appl. Phys. 73:2794–
2802.
95. Uenishi, K., Kobayashi, K. F., Nasu, S., Hatano, H., Ishihara, K. N., Shingu, P. H.(1992). Z. Metallkde. 83:132–135.
96. Ma, E., Atzmon, M., Pinkerton, F. E. (1993). J. Appl. Phys. 74:955–962.
97. Qi, M., Zhu, M., Yang, D. Z. (1994). J. Mater. Sci. Lett. 13:966–968.98. Gaffet, E., Harmelin, M., Faudot, F. (1993). J. Alloys Compounds 194:23–30.99. Huang, J. Y., Wu, Y. K., Hu, K. Y., Meng, X. M. (1993). Acta Metall. Sinica B29:60–
63.100. Huang, J. Y., He, A. Q., Wu, Y. K. (1994). Nanostructured Mater. 4:1–10.101. Ivanov, E. (1992). Mater. Sci. For. 88–90:475–480.
102. Benghalem, A., Morris, D. G. (1992). Scripta Metall. Mater. 27:739–744.103. Kim, K. J., Sumiyama, K., Suzuki, K. (1994). J. Non-Cryst Solids 168:232–240.104. Shen, T. D., Koch, C. C. (1995). Mater. Sci. For. 179–181:17–24.105. Kis-Varga, M., Beke, D. L. (1996). Mater. Sci. For. 225–227:465–470.
106. Ivanov, E. (1993). In: deBarbadillo, J. J., et al., eds. Mechanical Alloying for StructuralApplications. Materials Park, OH: ASM International, pp. 171–176.
107. Yazenko, S. P., Hayak, V. G., Filipov, V. A., Ivanov, E., Grigorieva, T. F. USSR
Patent 4725973, March 22, 1990.108. Ivanov, E., Patton, V., Grigorieva, T. F. (1996). Mater. Sci. For. 225–227:575–580.109. Ivanov, E. Y., Grigorieva, T. F. (1997). Solid State Ionics 101–103:235–241.
110. Murty, B. S., Mohan Rao, M., Ranganathan, S. (1993). Nanostructured Mater. 3:459–467.
111. Gaffet, E., Louison, C., Harmelin, M., Faudot, F. (1991).Mater. Sci. Eng. A134:1380–1384.
112. Pabi, S. K., Joardar, J., Murty, B. S. (1996). J. Mater. Sci. 31:3207–3211.113. Yamane, T., Okubo, H., Hisayuki, K., Oki, N., Konishi, M., Minamino, Y., Koizumi,
Y., Kiritani, M., Komatsu, M., Kim, S. J. (2001). Metall. Mater. Trans. 32A:1861–
1862.114. Kuyama, J., Ishihara, K. N., Shingu, P. H. (1992). Mater. Sci. For. 88–90:521–528.115. Yoshioka, T., Yasuda, M., Miyamura, H., Kikuchi, S., Tokumitsu, K. (2002). Mater.
Sci. For. 386–388:503–508.116. Jiang, H. G., Perez, R. J., Lau, M. L., Lavernia, E. J. (1997). J. Mater. Res. 12:1429–
1432.
117. Gonzalez, G., D’Angelo, L., Ochoa, J., Lara, B., Rodriguez, E. (2002).Mater. Sci. For.386–388:159–164.
118. Nasu, S., Imaoka, S., Morimoto, S., Tanimoto, H., Huang, B., Tanaka, T., Kuyama, J.,Ishihara, K. N., Shingu, P. H. (1992). Mater. Sci. For. 88–90:569–576.
MD: SURYANARAYANA, JOB: 03320, PAGE: 176
4103-X_Suryanarayana_Ch09_R2_080304
Chapter 9176

119. Bonetti, E., Scipione, G., Valdre, G., Cocco, G., Frattini, R., Macri, P. P. (1993). J.Appl. Phys. 74:2053–2057.
120. Bonetti, E., Valdre, G., Enzo, S., Cocco, G., Soletta, I. (1993). Nanostructured Mater.
2:369–375.121. Bansal, C., Gao, Z. Q., Hong, L. B., Fultz, B. (1994). J. Appl. Phys. 76:5961–5966.122. Zhu, S. M., Iwasaki, K. (1999). Mater. Sci. Eng. A270:170–177.
123. Gonzalez, G., D’Angelo, L., Ochoa, J., Bonyuet, D. (2002). Mater. Sci. For. 386–388:153–158.
124. Wolski, K., Le Caer, G., Delcroix, P., Fillit, R., Thevenot, F., Le Coze, J. (1996).
Mater. Sci. Eng. A207:97–104.125. Gialanella, S. (1995). Intermetallics 3:73–76.126. Kuhrt, C., Schropf, H., Schultz, L., Arzt, E. (1993). In: deBarbadillo, J. J., et al., eds.
Mechanical Alloying for Structural Applications. Materials Park, OH: ASM Interna-tional, pp. 269–273.
127. Liu, Z. G., Guo, J. T., He, L. L., Hu, Z. Q. (1994). Nanostructured Mater. 4:787–794.128. Schropf, H., Kuhrt, C., Arzt, E., Schultz, L. (1994). ScriptaMetall. Mater. 30:1569–1574.
129. Oleszak, D., Pe?kalJa, M., Jartych, E., Zurawicz, J. K. (1998). Mater. Sci. For. 269–272:643–648.
130. Portnoy, V. K., Leonov, A. V., Fadeeva, V. I., Matyja, H. (1998).Mater. Sci. For. 269–
272:69–74.131. Krasnowski, M., Matyja, H. (2001). Mater. Sci. For. 360–362:433–438.132. Krasnowski, M., Matyja, H. (2000). Mater. Sci. For. 343–346:302–307.
133. Perez, R. J., Huang, B. L., Crawford, P. J., Sharif, A. A., Lavernia, E. J. (1996).Nanostructured Mater. 7:47–56.
134. Stiller, C., Eckert, J., Roth, S., Schafer, R., Klement, U., Schultz, L. (1996).Mater. Sci.
For. 225–227:695–700.135. Huang, B. L., Perez, R. J., Lavernia, E. J., Luton, M. J. (1996). Nanostructured Mater.
7:67–79.136. Umemoto, M., Liu, Z. G., Hao, X. J., Masuyama, K., Tsuchiya, K. (2001).Mater. Sci.
For. 360–362:167–174.137. Djahanbakhsh, M., Lojkowski, W., Burkle, G., Baumann, G., Ivanisenko, Yu V.,
Valiev, R. Z., Fecht, H. J. (2001). Mater. Sci. For. 360–362:175–182.
138. Rochman, N. T., Kawamoto, K., Sueyoshi, H., Nakamura, Y., Nishida, T. (1999). J.Mater. Proc. Technol. 89–90:367–372.
139. Rochman, N. T., Kuramoto, S., Fujimoto, R., Sueyoshi, H. (2003). J. Mater. Proc.
Technol. 138:41–46.140. Tokumitsu, K., Umemoto, M. (2002). Mater. Sci. For. 386–388:479–484.141. Yang, H., Di, L. M., Bakker, H. (1993). Intermetallics 1:29–33.142. Koyano, T., Mizutani, U., Okamoto, H. (1995). J. Mater. Sci. Lett. 14:1237–1240.
143. Koyano, T., Takizawa, T., Fukunaga, T., Mizutani, U., Kamizuru, S., Kita, E., Tasaki,A. (1993). J. Appl. Phys. 73:429–433.
144. Tokumitsu, K. (1999). Mater. Sci. For. 312–314:557–562.
145. Tcherdyntsev, V. V., Kaloshkin, S. D., Tomilin, I. A., Shelekhov, E. V., Serdyukov, V.N. (2001). Mater. Sci. For. 360–362:361–366.
146. Tokumitsu, K. (1998). Mater. Sci. For. 269–272:467–472.
147. He, L., Allard, L. F., Breder, K., Ma, E. (2000). J. Mater. Res. 15:904.148. Crespo, P., Hernando, A., Garcıa-Escorial, A., Castano, F. J., Multinger, M. (2000).
Mater. Sci. For. 343–346:793–799.
149. Multinger, M., Hernando, A., Crespo, P., Rivero, G., Garcıa-Escorial, A., Stiller, C.,Schultz, L., Eckert, J. (2000). Mater. Sci. For. 343–346:800–805.
150. Wang, X. M., Aoki, K., Masumoto, T. (1996). Mater. Sci. For. 225–227:423–428.151. Fultz, B., Gao, Z. Q., Hamdeh, H. H., Oliver, S. A. (1994). Phys. Rev. B49:6312–6315.
MD: SURYANARAYANA, JOB: 03320, PAGE: 177
4103-X_Suryanarayana_Ch09_R2_080304
Solid Solubility Extensions 177

152. Cabrera, A. F., Sanchez, F.H.,MendozaZelis, L. (1999).Mater. Sci. For. 312–314:85–90.153. Kataoka, N., Suzuki, K., Inoue, A., Masumoto, T. (1991). J. Mater. Sci. 26:4621–4625.154. Chiriac, H., Moga, A., Urse, M., Hison, C. (2000). Mater. Sci. For. 343–346:806–811.
155. Hightower, A., Fultz, B., Bowman, R. C. Jr. (1997). J. Alloys Compounds 252:238–244.156. Tcherdyntsev, V. V., Kaloshkin, S. D., Tomilin, I. A., Shelekhov, E. V., Baldokhin, Yu
V. (1999). Z. Metallkde. 90:747–752.
157. Liu, T., Zhao, Z. T.,Ma, R. Z., Hu, T. D., Xie, Y. N. (1999).Mater. Sci. Eng.A271: 8–13.158. Caamano, Z., Perez, G., Zamora, L. E., Surinach, S., Munoz, J. S., Baro, M. D. (2001).
J. Non-Cryst. Solids 287:15–19.
159. Hays, V., Marchand, R., Saindrenan, G., Gaffet, E. (1996). Nanostructured Mater.7:411–420.
160. Xia, S. K., Scorzelli, R. B., Souza Azevedo, I., Baggio-Saitovich, E., Takeuchi, Y.
(1996). Mater. Sci. For. 225–227:453–458.161. Liu, Y. J., Chang, I. T. H. (2002). Acta Mater. 50:2747–2760.162. Nunes, E., Passamani, E. C., Larica, C., Freitas, J. C. C., Takeuchi, A. Y. (2002). J.
Alloys Compounds 345:116–122.
163. Navarro, E., Fiorani, D., Yavari, A. R., Rosenberg, M., Multinger, M., Hernando, A.,Caciuffo, R., Rinaldi, D., Gialanella, S. (1998). Mater. Sci. For. 269–272:133–138.
164. Kis-Varga, M., Beke, D. L., Meszaros, S., Vad, K., Kerekes, Gy, Daroczi, L. (1998).
Mater. Sci. For. 269–272:961–966.165. Garcia-Escoral, A., Adeva, P., Cristina, M. C., Martin, A., Carmona, F., Cebollada, F.,
Martin, V. E., Leonato, M., Gonzalez, J. M. (1991).Mater. Sci. Eng. A134:1394–1397.
166. Kohmoto, O., Yamaguchi, N., Mori, T. (1994). J. Mater. Sci. 29:3221–3223.167. Yelsukov, E. P., Fomin, V. M., Nemtsova, O. M., Shklyaev, D. A. (2002). Mater. Sci.
For. 386–388:181–186.
168. Abdellaoui, M., Barradi, T., Gaffet, E. (1992). J. Physique IV 2:C3-73–C3-78.169. Gao, Z., Fultz, B. (1993). Nanostructured Mater. 2:231–240.170. Zhou, T., Zhong, J., Xu, J., Yu, Z., Gu, G., Wang, D., Huang, H., Du, Y., Wang, J.,
Jiang, Y. (1996). J. Mag. Mag. Mater. 164:219–224.
171. Gupta, A., Dhuri, P. (2001). Mater. Sci. Eng. A 304–306:394–398.172. Yelsukov, E. P., Dorofeev, G. A., Barinov, V. A., Grigorieva, T. F., Boldyrev, V. V.
(1998). Mater. Sci. For. 269–272:151–156.
173. Dorofeev, G. A., Yelsukov, E. P., Ulyanov, A. L., Konygin, G. N. (2000). Mater. Sci.For. 343–346:585–590.
174. Hong, L. B., Bansal, C., Fultz, B. (1994). Nanostructured Mater. 4:949–956.
175. Nasu, S., Shingu, P. H., Ishihara, K. N., Fujita, F. E. (1990). Hyperfine Interactions55:1043–1050.
176. Cabrera, A. F., Sanchez, F. H., Mendoza-Zelis, L. (1995). Mater. Sci. For. 179–181:231–236.
177. Schlump, W., Grewe, H. (1989). In: Arzt, E., Schultz, L., eds. New Materials byMechanical Alloying Techniques. Oberursel, Germany: Deutsche Gesellschaft furMetallkunde, pp. 307–318.
178. Ruuskanen, P. (1998). Mater. Sci. For. 269–272:139–144.179. Oleszak, D., Jachimowicz, M., Matyja, H. (1995). Mater. Sci. For. 179–181:215–218.180. El-Eskandarany, M. S., Sumiyama, K., Suzuki, K. (1997). Acta Mater. 45:1175–1187.
181. Bai, H. Y., Michaelsen, C., Sinkler, W., Bormann, R. (1997). Mater. Sci. For. 235–238:361–366.
182. Pe?kalJa, K., Oleszak, D., Jartych, E., Z:urawicz, J. K. (2000). Mater. Sci. For. 343–
346:825–829.183. Herr, U., Samwer, K. (1992). Nanostructured Mater. 1:515–521.184. Hellstern, E., Schultz, L. (1986). Appl. Phys. Lett. 49:1163–1165.185. Michaelsen, C., Hellstern, E. (1987). J. Appl. Phys. 62:117–119.
MD: SURYANARAYANA, JOB: 03320, PAGE: 178
4103-X_Suryanarayana_Ch09_R2_080304
Chapter 9178
186. Hellstern, E., Schultz, L. (1988). Mater. Sci. Eng. 97:39–42.187. Schultz, L. (1988). Mater. Sci. Eng. 97:15–23.188. Crespo, P., Marin, P., Agudo, P., Alocen, M. C., Hernando, A., Garcia-Escorial, A.,
Eckert, J., Roth, S., Schultz, L. (2002). Mater. Sci. For. 386–388:175–180.189. Rico, M. M., Sort, J., Surinach, S., Munoz, J. S., Greneche, J. M., Perez Alcazar, G. A.,
Baro, M. D. (2002). Mater. Sci. For. 386–388:497–502.
190. Michel, D., Mazerolles, L., Chichery, E. (1998). Mater. Sci. For. 269–272:99–104.191. Jiang, J. Z., Lin, R., Mørup, S. (1998). Mater. Sci. For. 269–272:449–454.192. Matteazzi, P., Le Caer, G. (1992). Mater. Sci. Eng. A156:229–237.
193. Gaffet, E., Faudot, F., Harmelin, M. (1991). Mater. Sci. Eng. A149:85–94.194. Boolchand, P., Koch, C. C. (1992). J. Mater. Res. 7:2876–2883.195. Hida, M., Asai, K., Takemoto, Y., Sakakibara, A. (1996). Mater. Trans. Jpn. Inst.
Metals 37:1679–1683.196. Hida, M., Asai, K., Takemoto, Y., Sakakibara, A. (1997). Mater. Sci. For. 235–
238:187–192.197. Zhukov, A. P., Ivanov, S. A., Nudelman, M. A., Ponomarev, B. K., Kaloshkin, S. D.,
Shatov, A. A. (1993). J. Appl. Phys. 73:6414.198. Ziller, T., Le Caer, G., Delcroix, P. (1999). Mater. Sci. For. 312–314:33–42.199. Tracy, M. J., Groza, J. R. (1992). Nanostructured Mater. 1:369–378.
200. Hellstern, E., Schultz, L., Bormann, R., Lee, D. (1988). Appl. Phys. Lett. 53:1399–1401.201. Groza, J. R., Tracy, M. J. H. (1993). In: deBarbadillo, J. J., et al., eds. Mechanical Al-
loying for Structural Applications. Materials Park, OH: ASM International, pp. 327–
334.202. Goodwin, P. S., Ward-Close, C. M. (1995). In: Froes, F. H., ed. P/M in Aerospace,
Defense, and Demanding Applications. Princeton, NJ: Metal Powder Industries
Federation, pp. 89–95.203. Oleszak, D., Burzynska-Szyszko, M., Matyja, H. (1993). J. Mater. Sci. Lett. 12:3–5.204. Oehring, M., Bormann, R. (1990). J. Physique 51:C4-169–C4-174.205. Di, L. M., Bakker, H. (1991). J. Phys. C Condens. Matter 3:9319–9326.
206. Chou, T. C., Nieh, T. G., Wadsworth, J. (1992). Scripta Metall. Mater. 27:881–886.207. Kenik, E. A., Bayuzick, R. J., Kim, M. S., Koch, C. C. (1987). Scripta Metall. 21:1137–
1142.
208. Lee, P. Y., Koch, C. C. (1987). J. Non-Cryst. Solids 94:88–100.209. Lou, T., Fan, G., Ding, B., Hu, Z. (1997). J. Mater. Res. 12:1172–1175.210. Zghal, S., Bhattacharya, P., Twesten, R., Wu, F., Bellon, P. (2002). Mater. Sci. For.
386–388:165–174.211. Itsukaichi, T., Shiga, S., Masuyama, K., Umemoto, M., Okane, I. (1992). Mater. Sci.
For. 88–90:631–638.212. Cardellini, F., Cleri, F., Mazzone, G., Montone, A., Rosato, V. (1993). J. Mater. Res.
8:2504–2509.213. Lu, L., Lai, M. O., Zhang, S. (1994). Mater. Design 15:79–86.214. Guerero-Paz, J., Robles-Hernandez, F. C., Martınez-Sanchez, R., Hernandez-Silvam,
D., Jaramillo-Vigueras, D. (2001). Mater. Sci. For. 360–362:317–322.215. Ivanov, E., Grigorieva, T. F., Golubkova, G. V., Boldyrev, V. V., Fasman, A. B.,
Mikhailenko, S. D., Kalinina, O. T. (1988). Mater. Lett. 7:51–54.
216. Portnoy, V. K., Blinov, A. M., Tomilin, I. A., Kuznetsov, V. N., Kulik, T. (2002). J.Alloys Compounds 336:196–201.
217. Krivoroutchko, K., Kulik, T., Fadeeva, V. I., Portnoy, V. K. (2002). J. Alloys
Compounds 333:225–230.218. Krivoroutchko, K., Portnoy, V. K., Matyja, H., Fadeeva, V. I. (2000).Mater. Sci. For.
343–346:308–313.219. Gialanella, S., Delorenzo, R., Marino, F., Guella, M. (1995). Intermetallics 3:1–8.
MD: SURYANARAYANA, JOB: 03320, PAGE: 179
4103-X_Suryanarayana_Ch09_R2_080304
Solid Solubility Extensions 179

220. Boldyrev, V. V., Golubkova, G. V., Grigorieva, T. F., Ivanov, E., Kalinina, O. T.,Mihailenko, S. D., Fasman, A. B. (1987). Doklady Akad. Nauk SSSR 297:1181–1184.
221. Krivoroutchko, K., Kulik, T., Matyja, H., Fadeeva, V. I., Portnoy, V. K. (2001).
Mater. Sci. For. 360–362:385–390.222. Grigorieva, T. F., Barinova, A. P., Boldyrev, V. V., Ivanov, E. Y. (1996). Mater. Sci.
For. 225–227:417–422.
223. Yang, Q. M., Lei, Y. Q., Wu, J., Qang, Q. D., Lu, G. L., Chen, L. S. (1993). Key Eng.Mater. 81–83:169–173.
224. Oleszak, D., Portnoy, V. K., Matyja, H. (1999). Mater. Sci. For. 312–314:345–350.
225. Huot, J. Y., Trudeau, M. L., Schulz, R. (1991). J. Electrochem. Soc. 138:1316–1321.226. Portnoy, V. K., Fadeeva, V. I., Zaviyalova, I. N. (1995). J. Alloys Compounds 224:159–
161.
227. Van Neste, A., Lamarre, A., Trudeau, M. L., Schulz, R. (1992). J. Mater. Res. 7:2412–2417.
228. Jang, J. S. C., Tsau, C. H., Chen, W. D., Lee, P. Y. (1998). J. Mater. Sci. 33:265–270.229. Cho, Y. S., Koch, C. C. (1993). J. Alloys Compounds 194:287–294.
230. Lee, P. Y., Chen, T. R. (1994). J. Mater. Sci. Lett. 13:888–890.231. Battezzati, L., Cocco, G., Schiffini, L., Enzo, S. (1988). Mater. Sci. Eng. 97:121–124.232. Schwarz, R. B., Petrich, R. R., Saw, C. K. (1985). J. Non-Cryst. Solids 76:281–302.
233. Yang, H., Bakker, H. (1993). In: deBarbadillo, J. J., et al., eds.Mechanical Alloying forStructural Applications. Materials Park, OH: ASM International, pp. 401–408.
234. Mi, S., Courtney, T. H. (1998). Scripta Mater. 38:637–644.
235. Zbiral, J., Jangg, G., Korb, G. (1992). Mater. Sci. For. 88–90:19–26.236. Bryden, K. J., Ying, J. Y. (1996). Mater. Sci. For. 225–227:895–900.237. Katona, G. L., Kis-Varga, M., Beke, D. L. (2002). Mater. Sci. For. 386–388:193–198.
238. Ishida, T. (1994). J. Mater. Sci. Lett. 13:623–628.239. Liu, K. W., Mucklich, F., Birringer, R. (2001). Intermetallics 9:81–88.240. Liu, K. W., Mucklich, F. (2002). Mater. Sci. Eng. A329–331:112–117.241. Davis, R. M., McDermott, B., Koch, C. C. (1988). Metall. Trans. A19:2867–2874.
242. Davis, R. M., Koch, C. C. (1987). Scripta Metall. 21:305–310.243. Gaffet, E., Harmelin, M. (1990). In: Froes, F. H., deBarbadillo, J. J., eds. Structural
Applications of Mechanical Alloying. Materials Park, OH: ASM International, pp. 257–
264.244. Sherif El-Eskandarany, M. (1996). Metall. Mater. Trans. 27A:3267–3278.245. El-Eskandarany, M. S. (1994). J. Alloys Compounds 203:117–126.
246. Liu, L., Chu, Z. Q., Dong, Y. D. (1992). J. Alloys Compounds 186:217–221.247. Sherif El-Eskandarany, M., Zhang, W., Inoue, A. (2003). J. Alloys Compounds 350:222–
231.248. Suryanarayana, C., Chen, G. H., Frefer, A., Froes, F. H. (1992). Mater. Sci. Eng.
A158:93–101.249. Burgio, N., Guo, W., Martelli, S., Magini, M., Padella, F., Soletta, I. (1990). In: Froes,
F. H., deBarbadillo, J. J., eds. Structural Applications of Mechanical Alloying. Materials
Park, OH: ASM International, pp. 175–183.250. Guo,W.,Martelli, S., Burgio, N.,Magini,M., Padella, F., Paradiso, E., Soletta, I. (1991).
J. Mater. Sci. 26:6190–6196.
251. Bonetti, E., Cocco, G., Enzo, S., Valdre, G. (1990). Mater. Sci. Tech. 6:1258–1262.252. Bonetti, E., Valdre, G., Enzo, S., Cocco, G. (1993). J. Alloys Compounds 194:331–
338.
253. Szewczak, E., Paszula, J., Leonov, A. V., Matyja, H. (1997). Mater. Sci. Eng. A 226–228:115–118.
254. Suryanarayana, C., Chen, G. H., Froes, F. H. (1992). Scripta Metall. Mater. 26:1727–1732.
MD: SURYANARAYANA, JOB: 03320, PAGE: 180
4103-X_Suryanarayana_Ch09_R2_080304
Chapter 9180

255. Fadeeva, V. I., Leonov, A. V., Szewczak, E., Matyja, H. (1998). Mater. Sci. Eng.A242:230–234.
256. Chen, G. H., Suryanarayana, C., Froes, F. H. (1991). Scripta Metall. Mater. 25:2537–
2540.257. Suryanarayana, C., Chen, G. H., Froes, F. H. (1992). In: Froes, F. H., et al., eds.
Advancements in Synthesis and Processing. Covina, CA: SAMPE, pp. M671–M683.
258. Bououdina, M., Guo, Z. X. (2002). Mater. Sci. Eng. A322:210–222.259. Bououdina, M., Luklinska, Z., Guo, Z. X. (2001). Mater. Sci. For. 360–362:421–426.260. Itsukaichi, T., Norimatsu, T., Umemoto, M., Okane, I., Wu, B-Y. (1992). In: Tamura, I.,
ed. Heat and Surface ‘92. Tokyo, Japan: Japan Tech. Info. Center, pp. 305–308.261. Abe, Y. R., Johnson, W. L. (1992). Mater. Sci. For. 88–90:513–520.262. Novakova, A. A., Agladze, O. V., Tarasov, B. P., Sidorova, G. V., Andrievsky, R. A.
(1998). Mater. Sci. For. 269–272:127–132.263. Zhou, E., Suryanarayana, C., Froes, F. H. (1995). Mater. Lett. 23:27–31.264. Suryanarayana, C., Froes, F. H. (1990). J. Mater. Res. 5:1880–1886.265. Sundaresan, R., Froes, F. H. (1989). Key Eng. Mater. 29–31:199–206.
266. Sundaresan, R., Froes, F. H. (1989). In: Arzt, E., Schultz, L., eds. New Materials byMechanical Alloying Techniques. Oberursel, Germany: Deutsche Gesellschaft furMetallkunde, pp. 243–262.
267. Wilkes, D. M. J., Goodwin, P. S., Ward-Close, C. M., Bagnall, K., Steeds, J. W. (1996).Mater. Lett. 27:47–52.
268. Sun, F., Froes, F. H. (2002). J. Alloys Compounds 340:220–225.
269. Wilkes, D. M. J., Goodwin, P. S., Ward-Close, C. M., Bagnall, K., Steeds, J. (1996). In:Bormann, R., et al., eds. Metastable Phases and Microstructures. Vol. 400. Pittsburgh,PA: Mater. Res. Soc. , 267–274.
270. Skakov, Yu. A., Edneral, N. V., Frolov, E. V., Povolovzki, J. A. (1995). Mater. Sci.For. 179–181:33–38.
271. Yan, Z. H., Oehring, M., Bormann, R. (1992). J. Appl. Phys. 72:2478–2487.272. Di, L. M., Bakker, H. (1991). J. Phys. C: Condens. Matter 3:3427–3432.
273. Tang, H. G., Ma, X. F., Zhao, W., Yan, X. W., Hong, R. J. (2002). J. Alloys Com-pounds 347:228–230.
274. Shen, T. D., Wang, K. Y., Quan, M. X., Wang, J. T. (1992). Mater. Sci. For. 88–
90:391–397.275. Herr, U., Samwer, K. (1992). Nanostructured Mater. 1:515–521.276. Ovec�oglu, M. L., Ozkal, B., Suryanarayana, C. (1996). J. Mater. Res. 11:673–682.277. Ivanov, E., Suryanarayana, C., Bryskin, B. D. (1998). Mater. Sci. Eng. A251:255–
261.278. Ivanov, E., Sumiyama, K., Yamauchi, H., Suzuki, K. (1993). In: deBarbadillo, J. J., et
al., eds. Mechanical Alloying for Structural Applications. Materials Park, OH: ASM
International, pp. 409–413.279. Biswas, A., Dey, G. K., Haq, A. J., Bose, D. K., Banerjee, S. (1996). J. Mater. Res.
11:599–607.
280. Chen, G. H., Suryanarayana, C., Froes, F. H. (1993). In: deBarbadillo, J. J., et al., eds.Mechanical Alloying for Structural Applications. Materials Park, OH: ASM Interna-tional, OH, pp. 367–375.
281. Sheng, H. W., Lu, K., Ma, E. (1999). J. Appl. Phys. 85:6400–6407.282. Fu, Z., Johnson, W. L. (1993). Nanostructured Mater. 3:175–180.283. Fecht, H. J., Han, G., Fu, Z., Johnson, W. L. (1990). J. Appl. Phys. 67:1744–1748.
284. Ma, E., Atzmon, M. (1991). Phys. Rev. Lett. 67:1126–1129.285. Ma, E., Atzmon, M. (1993). J. Alloys Compounds 194:235–244.286. Ma, E., Atzmon, M. (1992). Mater. Sci. For. 88–90:467–474.287. Schultz, L., Hellstern, E., Thoma, A. (1987). Europhys. Lett. 3:921–926.
MD: SURYANARAYANA, JOB: 03320, PAGE: 181
4103-X_Suryanarayana_Ch09_R2_080304
Solid Solubility Extensions 181

288. Kwon, N. H., Kim, G. H., Song, H. S., Lee, H. L. (2001). Mater. Sci. Eng. A299:185–194.
289. Kong, L. B., Ma, J., Zhu, W., Tan, O. K. (2002). J. Alloys Compounds 335:290–296.
290. Katamura, J., Yamamoto, T., Qin, X., Sakuma, T. (1996). J. Mater. Sci. Lett. 15:36–37.291. Tonejc, A. M., Tonejc, A. (1996). Mater. Sci. For. 225–227:497–502.292. Massalski, T. B., ed. Binary Alloy Phase Diagrams. 2nd ed. Materials Park, OH: ASM
International.293. Kim, H. S., Suhr, D. S., Kim, G. H., Kum, D. W. (1996).Metals and Materials (Korea)
2:15–21.
294. Michaelsen, C. (1995). Phil. Mag. A72:813–828.295. Gayle, F. W., Biancaniello, F. S. (1995). Nanostructured Mater. 6:429–432.296. Bellon, P., Averback, R. S. (1995). Phys. Rev. Lett. 74:1819–1822.
297. Martin, G. (1984). Phys. Rev. B30:1424–1436.298. Ma, E., He, J. H., Schilling, P. J. (1997). Phys. Rev. B55:5542–5545.299. Pochet, P., Tominez, E., Chaffron, L., Martin, G. (1995). Phys. Rev. B52:4006–4016.300. Klassen, T., Herr, U., Averback, R. S. (1997). Acta Mater. 45:2921–2930.
301. Klassen, T., Herr, U., Averback, R. S. (1996). In: Bormann, R., et al., eds. MetastablePhases and Microstructures. Vol. 400. Pittsburgh, Pa: Mater. Res. Soc.: pp. 25–30.
302. Kaloshkin, S. D., Tomlin, I. A., Andrianov, G. A., Baldokhin, U. V., Shelekhov, E. V.
(1997). Mater. Sci. For. 235–238:565–570.303. Yavari, A. R., Desre, P. (1992). Mater. Sci. For. 88–90:43–50.304. Ogino, Y., Yamasaki, T., Murayama, S., Sakai, R. (1990). J. Non-Cryst Solids 117/
118:737–740.305. Sui, H. X., Zhu, M., Qi, M., Li, G. B., Yang, D. Z. (1992). J. Appl. Phys. 71:2945–2949.306. Suryanarayana, C. (1995). Int. Mater. Rev. 40:41–64.
307. Veltl, G., Scholz, B., Kunze, H.-D. (1991). Mater. Sci. Eng. A134:1410–1413.308. Fecht, H. J., Hellstern, E., Fu, Z., Johnson, W. L. (1990). Metall. Trans. 21A:2333–
2337.309. Desre, P. J. (1994). Nanostructured Mater. 4:957–963.
310. Yavari, A. R., Desre, P. J., Benamuer, T. (1992). Phys. Rev. Lett. 68:2235–2238.311. Yavari, A. R. (1994). Mater. Sci. Eng. A179/180:20–26.312. Drbohlav, O., Yavari, A. R. (1995). Acta Mater. 43:1799–1809.
313. Jiang, J. Z., Gente, C., Bormann, R. (1998). Mater. Sci. Eng. A242:268–277.314. Schwarz, R. B. (1998). Mater. Sci. For. 269–272:665–674.315. Darken, L. S., Gurry, R. W. (1953). Physical Chemistry of Metals. New York:
McGraw-Hill.316. Girgis, K. (1983). In: Cahn, R. W., Haasen, P., eds., Physical Metallurgy. 3rd ed.
Amsterdam, The Netherlands: Elsevier, pp. 219–270.317. Liebermann, H. H., ed. (1993). Rapidly Solidified Alloys: Processes, Structures, Prop-
erties, Applications. New York: Marcel Dekker.
MD: SURYANARAYANA, JOB: 03320, PAGE: 182
4103-X_Suryanarayana_Ch09_R2_080304
Chapter 9182

10
Synthesis of Intermetallics
10.1 INTRODUCTION
Intermetallic compounds (or intermediate phases, or intermetallic phases, or inter-metallics for short) consist of metals in approximately stoichiometric ratios. Theyusually crystallize with a structure other than those of its components and possessordered crystal structures. An alloy is considered to be in the ordered state if two ormore sublattices are required to describe its crystal structure. The driving force forordering in a binary alloy is the greater attraction between unlike neighbors, i.e., thestrength of the A-B bonds in an alloy made up of components A and B is greater thanthat of the A-A or B-B bonds that they replace on ordering. Thus, unlike atoms arefavored over like ones as nearest neighbors. If the ordering energy is low, then as thetemperature increases, the entropic tendency for disorder dominates and causes thelattice to disorder, as, for example, in h-CuZn with the B2 structure. Such types ofphases have been designated as reversibly ordered intermetallics [1], i.e., it is possible togo from the disordered to the ordered state and vice versa. For other metalliccombinations, the ordering energy is high enough that the ordered structure is retainedup to the melting temperature. Such materials may be simply referred to as inter-metallics or as irreversibly ordered (or permanently ordered) compounds. A majorityof the intermetallics fall under the permanently ordered category.
The ordered nature of intermetallics leads to an attractive combination ofproperties such as high strength, increased stiffness, creep resistance, low-temperaturedamage tolerance, and excellent environmental resistance. Furthermore, these prop-erties could be retained up to reasonably high temperatures. These attractive elevated-temperature properties are due to the reduced dislocation motion (since pairs ofdislocations—superdislocations—must move together to retain the ordered nature of
4103-X_Suryanarayana_Ch10_R2_080304
MD: SURYANARAYANA, JOB: 03320, PAGE: 183
183

the lattice) and low diffusivities. Hence, many of these intermetallics and intermetallic-based alloys have been identified as useful structural materials. Table 10.1 lists theproperties of some commercially useful intermetallics. The reader is advised to consultsome of the excellent reviews, monographs, and conference proceedings on interme-tallics for a full and detailed description of their structures, properties, and applica-tions [2–9].
In spite of the attractive combination of properties listed above, intermetallicssuffer from low ambient temperature ductility and fracture toughness, which is alsoassociated with the reduced dislocation activity, and this precludes large-scaleindustrial applications of intermetallics. Hence, several attempts have been made inrecent years to alleviate this problem. The common routes adopted to improve theroom temperature ductility of intermetallics include:
1. Reduction in grain size2. Disordering of the lattice, to improve the dislocation motion (super-
dislocations do not exist in disordered lattices and therefore only singledislocations need to move for deformation to occur), and
3. Modifying the crystal structure of the alloy phase into a more symmetrical,e.g., cubic, so that the minimal required number of slip systems for plasticdeformation are available.
Mechanical alloying (MA) can achieve all the above effects simultaneously.Therefore, this processing technique has been extensively employed to synthesizeintermetallics and study their mechanical behavior. The process of MA will also leadto disordering of the intermetallics. However, in this chapter we concentrate on thesynthesis of intermetallics by MA. The aspect of disordering of intermetallics by MA
MD: SURYANARAYANA, JOB: 03320, PAGE: 184
4103-X_Suryanarayana_Ch10_R2_080304
Table 10.1 Crystal Structure, Physical Properties, and Room Temperature Mechanical Propertiesof Some Important Intermetallics
IntermetallicCrystalstructure
Pearsonsymbol
Density(g/cm3)
Melting
temp.(jC)
Fracturemode
DBTT(jC)
Young’s
modulus(GPa)
Ni3Al L12, fcc cP4 7.50 1400 IGa — 200Ni3Si L12, fcc cP4 7.30 1140 IG —
Fe3Al DO3, bcc cF16 6.72 1540 TGb —TiAl L1o,
tetragonaltP4 3.91 1460 TG 800–1000 173
Ti3Al DO19,hexagonal
hP8 4.20 1600 TG — 140
FeAl B2, bcc cP2 5.56 1300 IG+TG — 261NiAl B2, bcc cP2 5.86 1640 IG+TG 150–250 184
MoSi2 C11b,tetragonal
tI6 6.24 2020 IG+TG 1200
Ti5Si3 D8b 4.32 2130 TG 700–900
Al3Ti DO22 tI8 3.20 1350 TG — 216
a Intergranular.b Transgranular.
Chapter 10184

will be covered in Chapter 11, and the synthesis of intermetallics by mechanochemicalprocessing will be discussed in detail in Chapter 14.
The types of intermetallics synthesized byMA include both quasi-crystalline andcrystalline phases. Both equilibrium and metastable phases have been synthesized inthe latter category, and these also include the disordered and ordered phases.
10.2 QUASI-CRYSTALLINE PHASES
Quasi-crystalline phases are metallic phases, which were first reported in a rapidlysolidified Al-Mn alloy in 1984 [10]. These phases possess a unique crystallographicstructure characterized by long-range aperiodic order and crystallographically for-bidden rotational symmetries. Accordingly, they exhibit 5-fold (icosahedral), 7-fold,8-fold, 10-fold (decagonal), 12-fold, 15-fold, etc., rotational symmetries and quasi-periodic translational order. In the crystallographic hierarchy, quasi-crystals occupy aposition intermediate between perfect crystals and amorphous phases.
Electron diffraction patterns from quasi-crystals show sharp diffraction spots;thus, it could be concluded that they exhibit ordering in the lattice and that they are notamorphous. A characteristic feature of diffraction patterns from these phases is thatthe neighboring pairs of spots along any direction perpendicular to the 5-fold and 10-fold rotation axes are aperiodic (Fig. 10.1), i.e., the diffraction spots are separated by adistance corresponding to the golden mean (i.e., (1 +
ffiffiffi5
p)/2 = 1.618). While the
icosahedral quasi-crystals exhibit quasi-periodicity along all three directions, the
MD: SURYANARAYANA, JOB: 03320, PAGE: 185
4103-X_Suryanarayana_Ch10_R2_080304
Figure 10.1 High-resolution electron micrographs and electron diffraction patterns from (a)Al-Mn-Si icosahedral quasi-crystal and (b) Al-Mn decagonal quasi-crystal. The incident beam
is parallel to the fivefold and tenfold symmetry axes in (a) and (b), respectively.
Synthesis of Intermetallics 185

decagonal quasi-crystals show quasi-periodicity only along two directions and exhibitperfect periodicity along the third direction. Accordingly, electron diffraction patternsrecorded from a decagonal phase in a direction perpendicular to the quasi-periodicplanes (i.e., along the 10-fold symmetry axis) show periodicity. Thus, there is nodifference in the diffraction patterns from crystals and decagonal quasi-crystals whenviewed along the 10-fold symmetry axis. This is why the discovery of quasi-crystals wasnarrowly missed by 6 years in 1978 [11].
Even though some thermodynamically stable quasi-crystals (e.g., Al-Cu-Fe, Al-Li-Cu, Al-Cu-Ru, and Zn-Mg-RE where RE = Y, Gd, Tb, Dy, Ho, Er) have beendiscovered [12], a great majority of the quasi-crystalline phases synthesized by non-equilibrium processing methods, such as rapid solidification processing or MA, aremetastable in nature. Quasi-crystals have been shown to have high strength, reducedfriction coefficient, and interesting electrical properties. Some of the potential appli-
MD: SURYANARAYANA, JOB: 03320, PAGE: 186
4103-X_Suryanarayana_Ch10_R2_080304
Figure 10.1 Continued.
Chapter 10186
cations for quasi-crystals are as catalysts, materials for thermopower generation,hydrogen storage, solar light absorption, and as reinforcements in metal-matrix com-posites. An interesting and commercially available application is to reinforce nano-icosahedral particles in a maraging steel used for different parts in electric shavers.Another commercial application of quasi-crystalline materials is as coatings for theproduction of scratch-resistant films (e.g., on frying pans) offering a lowered adhesionto food or to some polymers. The structure, properties, and applications of quasi-crystalline phases have been discussed in several earlier reviews (see, for example, Refs.[13–18]).
10.2.1 General Features
The first report of synthesis of quasi-crystalline phases by MA appeared in 1989[19,20]. Even today only a limited number of reports exist on the synthesis and manyfewer on the transformation behavior of these quasi-crystalline phases. The quasi-crystalline phases synthesized to date have been summarized in Table 10.2 along withthe milling conditions (mostly using a planetary ball mill) employed to synthesizethem. It should be noted that all the quasi-crystalline phases synthesized so far are ofthe icosahedral type (having the 5-fold rotational symmetry) and that there are noreports of synthesis of phases with other symmetries; a number of the latter categoryhave been synthesized by other methods such as rapid solidification from the melt[13,14]. The icosahedral phases synthesized by MA are similar to those produced byrapid solidification processing.
Unambiguous identification of quasi-crystalline phases by X-ray diffraction(XRD) techniques has not been easy. For example, in most quasi-crystalline phases, anumber of closely spaced diffraction peaks occur in the XRD patterns. Furthermore,broadening of the diffraction peaks inmechanically alloyedmaterials due to decreasedparticle/crystallite size and increased lattice strain may hinder a clear identification ofthe phases produced and also a proper distinction between the different types of quasi-crystalline phases (icosahedral, decagonal, etc.). This could be one reason why phasesother than those with the icosahedral symmetry have not been obtained or reportedwith MA. Confirmatory transmission electron microscopy (TEM) studies are neces-sary and useful for the correct identification of these phases. Even while using atransmission electron microscope, it is difficult to orient the small powder particlesalong the 10-fold symmetry axis, even if a decagonal phase was produced.
As noted above, the peaks in the XRD patterns representing the icosahedralphase inmechanically alloyed powders are usually broad. Annealing of the powders torelieve the strain and increasing the crystallite size causes sharpening of the diffractionpeaks and enables a clear identification of the phase [41,43,44]. However, care must betaken to ensure that the annealing temperature is not high enough to transform themetastable quasi-crystalline phase to the equilibrium phase(s).
Quasi-crystalline phases have been synthesized either directly by MA or onsubsequent annealing of the amorphous phase produced byMA. Sometimes annealingthe nanocrystalline phase obtained byMAhas also produced a quasi-crystalline phase[21]. Results are available to support these different routes. At present, quasi-crystalline phases have been synthesized by MA only in those alloy compositionsand systems, at which these phases were produced by other nonequilibrium processingtechniques, most notably rapid solidification processing. But it is not known if MA
MD: SURYANARAYANA, JOB: 03320, PAGE: 187
4103-X_Suryanarayana_Ch10_R2_080304
Synthesis of Intermetallics 187

MD: SURYANARAYANA, JOB: 03320, PAGE: 188
4103-X_Suryanarayana_Ch10_R2_080304
Table 10.2 Quasicrystalline Phases Formed by Mechanical Alloying of Blended ElementalPowders
Alloy/composition Mill
Ball-to-
powderratio
Millingintensity
Millingtime (h) Ref.
Al65Cu20Co15 Fritsch P5 15:1 — 55a 21
Al-Cu-Cr Fritsch P5 15:1 9 — 21Al70Cu20Fe10 Fritsch P5 10:1 — 40 22Al65Cu20Fe15 Fritsch P7/
AGO–2U
planetaryball mill
15:1 7 15b 23–25
Al70-x(Cu,Fe)30+x Fritsch P5 10:1 — 20–30 26
Al65Cu20Mn15 Fritsch P5 15:1 7 90 19, 21, 27Al40Cu10Mn25Ge25 Fritsch 20:1 450–650 rpm 66 28Al65Cu20Ru15 — — — — 29
Al70Cu12Ru18 — — — — 29Al75Cu15V10 Fritsch P5/P7 15:1 9 c 21, 30Al92Mn6Ce2 Fritsch P5 13:1 300 rpm 700 31Al91Mn7Fe2 Fritsch P5 13:1 300 rpm 700 31
Al50Mn20Ge30 Fritsch 20:1 45–650 rpm 47 32Al50Mn20Si20Ge10 Fritsch 20:1 45–650 rpm 80 32Al75Ni10Fe15 — — — d 33
Al70Pd20Mn10 Fritsch P7 15:1 7 30 34Mg32Cu8Al4 Planetary — 900 rpm — 19, 20, 35, 36Mg-Al-Pd Planetary mill 40:1 150G 4 37
Mg32(Al,Zn)49 Planetary mill — — 3 min 20, 35, 36, 38, 39Fritsch — 600 m/s2 10 min 40
Mg3Zn5-xAlx(x = 2–4)
Planetary mill — 900 rpm — 19, 36
Mg44Al15Zn41 Planetaryball mill
— 600 m/s2 30 min 41
Ti56Ni18Fe10Si16 SPEX 8000 6:1 — e 42
Ti45Zr38Ni17 Fritsch P7 8:1 9.5 f 43Ti45Zr38Ni17 AGO-2
planetary
centrifugalmill
20:1 400 m/s2 2 44
a MA for 55 h to a nanocrystalline phase followed by annealing for 1 h at 600jC.b MA + anneal at 550jC.c MA for 20 h to an amorphous phase followed by annealing at 450jC.d MA for 400 h followed by annealing for 20 h at 800jC.e MA for 30 h to an amorphous state followed by annealing for 30 min at 750jC.f MA for 20 h to an amorphous phase followed by heating to 828 K in the differential scanning cobrimeter at 5jC/min.
Chapter 10188

could produce quasi-crystalline phases at other compositions and/or in alloy systemsand if any special conditionsmust be satisfied to form a quasi-crystalline phase byMA.
The mechanism for the formation of quasi-crystalline phases in mechanicallyalloyed powders has not been investigated in detail, but it could be expected that thegeneral features of alloying observed during MA will also be applicable here.Accordingly, the repeated cold welding, fracturing, and rewelding of powder particlesresults in the mutual dispersion of the constituent metal powder particles. The actionof mechanical pulses and local heating raises the temperature of the powder andfacilitates diffusion. During this process it is possible that icosahedral clusters, whichare the basic elements of the icosahedral quasi-crystalline structure, form. Growth ofthese clusters could result in the formation of the icosahedral structure. Konstanchuket al. [44] suggested that the icosahedral clusters could first build the amorphousstructure, which on subsequent milling could transform into the icosahedral phase, asa result of crystallization of the amorphous phase.
Since formation of the quasi-crystalline alloy phase, either directly or as a resultof crystallization of the amorphous phase, requires diffusion, the magnitude of theinterdiffusion coefficient determines the time required for formation of the icosahedralphase. Thus, it was noted that formation of the icosahedral phase in the Mg-Al-Znsystem requires only a few minutes (3–10) [20,38–40] whereas it requires about 2 h inthe Ti-Zr-Ni system [44], related to the lower diffusivities in the higher melting Ti-Zr-Ni system.
10.2.2 Effect of Process Variables
There have been only a few studies investigating the effect of process variables on theformation of quasi-crystalline phases. Eckert et al. [27] studied the effect of millingintensity in the Fritsch Pulverisette 5 mill on the nature of the phase formed in amechanically alloyed Al65Cu20Mn15 powder blend. Four different intensities repre-senting the settings of 3, 5, 7, and 9 corresponding to calculated velocities of the hittingballs of 2.5, 3.6, 4.7, and 5.8 m/s were employed. They reported that the nature of thephase synthesized was different depending on the intensity of milling. It was noted thatan amorphous phase formed when the blended elemental powder was milled at anintensity of 5, and an equilibrium intermetallic phase formed at an intensity of 9. At theintermediate intensity of 7, a quasi-crystalline phase was formed. This was explainedon the basis of the temperature rise during milling. The estimated maximal peaktemperatures were 247jC, 407jC, and 590jC at the milling intensities of 5, 7, and 9,respectively. The temperature reached at the milling intensity of 9 is above the quasi-crystalline-to-crystalline phase transformation temperature of the quasi-crystallinephase produced and therefore an equilibrium intermetallic phase formed under thiscondition of milling. This observation confirms that ‘‘soft’’ milling conditions, i.e.,lower ball-to-powder weight ratios, lower milling intensities, and so forth, favor theformation of metastable phases—both amorphous and quasi-crystalline [45–47]. Yetanother conclusion that can be drawn from the above observation is that an amor-phous phase is farthest from equilibrium whereas the quasi-crystalline phase is in-termediate in departure from equilibrium between an amorphous phase and anequilibrium crystalline phase.
Salimon et al. [25] reported that the presence of nitrogen duringmilling ofAl-Cu-Fe powder mixture produced the equilibrium cubic h phase instead of the quasi-
MD: SURYANARAYANA, JOB: 03320, PAGE: 189
4103-X_Suryanarayana_Ch10_R2_080304
Synthesis of Intermetallics 189

crystalline phase. The quasi-crystalline phase was reported to form in the absence of anitrogen environment. This was rationalized by the fact that the highly reactivealuminum bonded with nitrogen and consequently the sample composition shiftedaway from that required for the formation of a quasi-crystalline phase.
As in the case of amorphization of intermetallics on milling [48,49] (to bediscussed later), amorphization has also been reported to occur onmilling of the quasi-crystalline phases. Accordingly, it has been reported that the Al65Cu20Fe15 quasi-crystalline phase becomes amorphous (as detected by XRDmethods) after milling for300 h in a QM-1SP planetary ball mill at a BPR of 10:1 [50]. Similar results werereported byNasu et al. [23]. However, TEM investigations have shown the presence ofa few quasi-crystalline phase particles with a size of 10–15 nm in the amorphousmatrix. Furthermore, there are also reports of formation of a quasi-crystalline phaseon annealing an amorphous phase [30,42]. This is somewhat similar to the mechanicalcrystallization behavior observed when an amorphous alloy was found to crystallizeon mechanical milling [51]. This aspect also will be discussed in chapter 12.
Apart from an early curiosity about synthesizing quasi-crystalline phases by aroute other than rapid solidification processing and the possibility of producing largeamounts of powders for subsequent consolidation to form bulk alloys, interest in thestudy of quasi-crystalline phases synthesized byMA is now decreasing. The discoveryof stable (equilibrium) quasi-crystals in recent years [12,14,16,17] has further lessenedinterest in the synthesis and characterization of quasi-crystals by MA.
10.3 CRYSTALLINE INTERMEDIATE PHASES
An important group of intermediate phases is the so-called Hume-Rothery phases orelectron compounds. They crystallize with the same structure, if they possess the sameaverage number of valence electrons per atom, or valence electron concentration(VEC). It has been shown that for VEC values of 3/2, 21/13, and 7/4 the crystalstructures adopted are usually body-centered cubic (bcc), complex cubic, and hexag-onal close packed (hcp), respectively. However, under certain circumstances, phaseswith VEC = 3/2 can take up the h-Mn and hcp structures also. Because these threegroups of phases have their prototypes in the Cu-Zn system, they are traditionallyreferred to as h-brass, g-brass, and q-brass structures, respectively.
The equilibrium Hume-Rothery electron compounds—h-brass, g-brass, and q-brass phases—were synthesized by MA starting from blended elemental pure Cu andZn powders mixed in the correct proportions [52–54]. Similarly, a number of otherintermetallic phases have been synthesized starting from blended elemental powdermixtures. Even though the mechanism of formation of intermetallics byMA is not thesame in every case, it seems to occur by a self-propagating high-temperature synthesis(SHS, commonly known as combustion) reaction, at least in some cases. In thiscategory, there are also examples where the combustion took place only after‘‘interrupted milling,’’ i.e., milling of the powders for a given length of time, agingthe powder at room temperature after stopping the milling, and then resuming themilling operation. AnNiAl compound was synthesized in this way [55]. Similar resultswere also reported in other systems [56]; in fact, these results are not significantlydifferent from those obtained in the conventional SHS process [57], except that in thiscase mechanical activation of the solid plays an important role.
MD: SURYANARAYANA, JOB: 03320, PAGE: 190
4103-X_Suryanarayana_Ch10_R2_080304
Chapter 10190

The type of crystalline intermediate phases synthesized byMA includes both themetastable (nonequilibrium) and stable (equilibrium) phases.
10.3.1 Metastable Crystalline Intermediate Phases
The available results show that only a few metastable crystalline intermediate phaseshave been synthesized by MA. This is in stark contrast to the very large number ofmetastable intermediate phases reported to occur in rapidly solidified alloys in theearly years of the development of the technique [58,59]. A metastable deformation-induced martensite phase has been reported to form in mechanically alloyed Cu-Znpowders [52,54]. It is surprising that not many such deformation-induced metastablephases have been reported in mechanically alloyed powder mixtures, since MAinvolves heavy plastic deformation ofmetal powder particles. This observation shouldalso be viewed in the light of the fact that there are several instances in whichmetastable phases are formed by cold working; a good example is the formation ofdeformation-induced metastable q (hcp) martensite in austenitic stainless steels. Thesynthesis of a bct-Fe phase by prolonged processing of iron powder in a nitrogenatmosphere has also been reported [60,61]. Recently, a metastable crystalline phasewith rhombohedral crystal structure was reported to form in mechanically alloyed Al-Ge powders [62,63]. Two metastable phases designated hV (Ni3Sn) and hW (Ni3Sn2)have been detected in mechanically alloyed Ni-Sn alloys at 25 and 40 at% Sncompositions, respectively [64]. The nature of the phases and the conditions underwhich these metastable phases formed in mechanically alloyed powder mixtures aresummarized in Table 10.3. It is interesting that a number of metastable ordered phasesare also formed directly on MA.
If a phase that is stable at high temperatures and/or high pressures is retained byMA at room temperature and atmospheric pressure, then also it is consideredmetastable. However, such phases are listed separately, under the category of poly-morphic phase transformations, in Table 10.4.
As mentioned in Chapter 8, the room temperature formation of phases stable athigh temperatures during milling has been used as an indicator to estimate themaximal temperature reached during milling. Accordingly, formation of the high-temperature orthorhombic Sb2O3 phase during milling of Sb and Sb-Ga alloys atroom temperature was taken to suggest that the maximal temperature reached wasat least 570jC, the temperature above which this phase is stable [145,146]. Thus, thehigh-temperature orthorhombic Sb2O3 phase at room temperature is metastable innature.
The pure metal cobalt is known to undergo amartensitic transformation on coldworking; the room temperature hcp form transforms to the elevated temperature fccform. Both the puremetal Co andCo-based alloys have been subjected toMA, and thereversible hcp X fcc martensitic transformation has been reported to occur in all thecases. However, the end product of mechanical milling has been the fcc form in somecases [99,101,103] and the hcp form in others [100,101]. In some instances, the fccphase has been shown to transform to the hcp form after milling for a short period oftime and then again to the fcc form after prolonged milling. Since the fcc ! hcptransformation and the reverse transformation are known to occur via the formationof stacking faults, the nature and density of stacking faults present in the mechanicallyalloyed powder sample might have been responsible for the specific phase present in
MD: SURYANARAYANA, JOB: 03320, PAGE: 191
4103-X_Suryanarayana_Ch10_R2_080304
Synthesis of Intermetallics 191

MD: SURYANARAYANA, JOB: 03320, PAGE: 192
4103-X_Suryanarayana_Ch10_R2_080304
Table 10.3 Metastable Phases Formed in Mechanically Alloyed Powder Mixtures
Alloy Mill BPR Time (h) Phase Ref.
Al-Cu Ball mill 90:1 400 m-Bcc 65Al-Ge SPEX 8000 — 120 Rhombohedral g1 62
Al-Ge Fritsch P5 10:1 100 Rhombohedral 63Al-Hf SPEX 8000 — 20 L12 Al3Hf 66, 67Al-Hf-Fe SPEX 8000 10:1 8 L12 (Al,Fe)3Hf 68
Al-Hf-Ni SPEX 8000 10:1 10 L12 (Al,Ni)3Hf 68Al-Mn SPEX 8000 10:1 a Fcc 69Al–25Nb Al3Nb + m-Nb2Al 70Al-Ti Fritsch P5 10:1 100 L12 Al3Ti 66, 71
Al-Zr Fritsch P5 10:1 20 L12 Al3Zr 66, 67Al-Zr-Fe SPEX 8000 10:1 20 L12 (Al,Fe)3Zr 72, 73Al-Zr-Ni SPEX 8000 10:1 20 L12 (Al,Ni)3Zr 72, 73
Co-C Ball mill 100:1 500 m-Co3C 74Co-25Ti Fritsch P5 17:1 24 m-Co3Ti 75–77Cu-In-Ga-Se Fritsch P5 10:1 2 Cubic CuIn0.7Ga0.3Se2 45
Cu-Zn SPEX 8000 5:1 0.5 Deformationmartensite
52
Cu-Zn Fritsch P5 10:1 — Martensite 54
Fe-B Fritsch 50:1 3 m-Fe2B 78Mg-Al-Ti-B Fritsch P5 20:1 MA/40 h +
extrusionat 400jC
m-Ti3B4 79
Mg-Sn SPEX 8000 10:1 12 Orthorhombic 80Nb-Ge SPEX 8000 — 5 Fcc 81Ni-Al SPEX 8000 6:1 20 m-Ni3Al 55
Ni-Al m-NiAl 82Ni-C Ball mill 100:1 500 m-Ni3C 74Ni-Sn SPEX 8000 — 1 hV and hW 64
Ni-Sn Fritsch P5 20:1 150 NiSn 83Ni3Sn4 Fritsch P5 20:1 150 NiSn 83Sn-S (1:1.85) URF-AGO2
planetaryball mill
— 1.5 4H-SnS2 84, 85
Te-Ag SPEX 8000 8:1 50 k phase 86Ti Super Misuni
NEV MA-8
6:1 100 m-Ti2N 87
Ti-Al Fritsch P5 10:1 10 Fcc g-TiAl 88, 89Ti-Al Fritsch P5 10:1 25 Fcc g-TiAl 90
TiH2-22Al-23Nb Fritsch P5 10:1 10 Bcc-(Nb,Ti)H2 91Ti-Si Fritsch P5 10:1 — m-TiSi2 (C49) 92, 93Ti-Si Ball mill — 180 Bcc 94
Zr-Al Attritor 10:1 25 m-Zr3Al (DO19) 95
a MA/12 h plus aged for 30 days at room temperature.
Chapter 10192

the sample. Several other high-temperature polymorphs have also been reported toform at room temperature byMA. Some of the available results on these polymorphictransformations are summarized in Table 10.4.
The particle size during powder processing is known to have a significantinfluence on the phase constitution. Pure ZrO2 is known to exhibit the phenomenonof polymorphism. At room temperature it exists in the monoclinic structure and attemperatures greater than 1170jC it transforms to the tetragonal form. The tetragonalform transforms to the cubic form above 2370jC and the cubic form is stable up to themelting point. However, it has been shown that a decrease in crystallite size couldaffect the structural stability, and this has been explained on the basis of knownthermodynamic arguments. Garvie [147] explained the stabilization of tetragonalZrO2 at room temperature due to the change in the surface energy conditions.Assuming that the tetragonal and monoclinic forms of ZrO2 are represented by thesymbols t and m, respectively, the following thermodynamic equations could bewritten for the monoclininc and tetragonal forms of ZrO2:
DGm ¼ DGvðmÞ þ Amgm ð10:1Þ
and
DGt ¼ DGvðtÞ þ Atgt ð10:2Þ
where DG is the free energy, DGv is the volume change in free energy, A is the surfacearea, and g is the surface energy per unit area. The change in free energy duringtransformation from the monoclinic to the tetragonal form of ZrO2 can be written as:
DGm!t ¼ DGt � DGm ¼ DGvðtÞ � DGvðmÞ� �
þ Atgt � Amgmf g ð10:3Þ
Since the monoclinic phase is the stable form at room temperature, DGv(t) � DGv(m) ispositive. But since the tetragonal form has a lower specific surface energy than themonoclinic form, Atgt �Amgm is negative. Furthermore, the surface area increases asthe particle size decreases. Therefore, the Atgt � Amgm term becomes increasinglynegative for the formation of the tetragonal form of ZrO2. Consequently, at somecritical value of the grain (crystallite) size,DGm!t becomes zero. Based on the availablethermodynamic data, this critical grain size has been calculated to be about 30 nm.Thus, below about 30 nm the tetragonal phase gets stabilized even at room temper-ature. Sometimes even the cubic form of ZrO2 has been shown to be stable at roomtemperature due to a reduction in particle size. Several investigators have observedthese changes experimentally [107,135,141–144].
10.3.2 High-Pressure Phases
It has been suggested that very high pressures are generated during milling ofpowders; according to some estimates, the pressures could be of the order of 6 GPa[148,149]. Therefore, the high pressures developed during milling should be sufficientto stabilize the high-pressure polymorphs of phases at atmospheric pressure. The high-pressure polymorphs of Dy2S3 and Y2S3 have been reported to be retained on MA atatmospheric pressure [107]. Similarly, high-pressure phases of other chalcogenides,such as Cu2-xS and CuSe2, were also synthesized byMA at atmospheric pressure [106].A high-pressure cubic polymorph of the equilibrium tetragonal Cu(In0.7Ga0.3)Se2phase was also reported to form in mechanically alloyed Cu-In-Ga-Se powders [45].
MD: SURYANARAYANA, JOB: 03320, PAGE: 193
4103-X_Suryanarayana_Ch10_R2_080304
Synthesis of Intermetallics 193

MD: SURYANARAYANA, JOB: 03320, PAGE: 194
4103-X_Suryanarayana_Ch10_R2_080304
Table 10.4 Polymorphic Phase Transformations in Metals and Alloys by MechanicalAlloying/Mechanical Milling
Starting phase Mill/MA time Final phase Comments Ref.
g-AlOOH (boehmite) Fritsch P7/2.5 h a-Al2O3 (corundum) 96
Al(OH)3 (gibbsite) Fritsch P7/7 h a-Al2O3 (corundum) 96g-Al2O3 56 h a-Al2O3 97g-Al2O3 Fritsch P9/2 h y-Al2O3 98
y-Al2O3 Fritsch P9/2 h u-Al2O3 98Co (fcc + hcp) 20 h Co(hcp) BPR 10:1 99Co (fcc + hcp) 20 h Co(hcp + fcc) BPR 20:1 99
Co (fcc + hcp) 20 h Co(fcc) BPR 30:1 99Co (fcc) Co (hcp) 100Co (fcc) 5 h Co (hcp) 101Co (hcp) 2 h Co (fcc) HT phase 101
15 h Co (fcc) HT phase 10220 h Co (fcc) HT phase 103
Co3Sn2(orderedorthorhombic)
48 h Co3Sn2(disorderedhexagonal)
HT phase 104
Cr2O3 (hexagonal) 18 h Cr2O3 (cubic) 105
Cu(In0.7Ga0.3)Se2 45Cu2-xS 106CuSe2 106Dy2O3 C type
(bixbyte)
— Monoclinic
Dy2O3 B type
107
g-Dy2S3 — 108Er2O3 C-type
(bixbyte)
— Monoclinic
Er2O3 B-type
107
h-FeB (HT form) Fritsch P7/62 h a-FeB (LT form) LT phase 109, 110Fe2B (bct) Fritsch Fe2B
(orthorhombic)
111
gV-Fe4N (fcc) — q-Fe4N(hexagonal)
HT phase 112
a-Fe2O3 SPEX 8000/70 h Fe3O4 113a-Fe2O3 SPEX 8000 Fe3O4 114a-Fe2O3 SPEX 8000 Fe3O4!FeO 115a-Fe2O3 Wet milling
with waterfor 96 h
Fe3O4 (fcc) 116
g-Fe2O3 Oscillating
mill/40 min
a-Fe2O3 117
Fe3O4 SPEX 8000/70 h a-Fe2O3 118FeS Hexagonal 119
a-FeSi2 Shaker mill/50 h h-FeSi2 120GeO2 — Rutile type 107Iron anhydrousammonia
— HT phase 121
a-MgCl2 96 h y-MgCl2 122a-MoSi2
—
h-MoSi2 Due toreduction in
particle size
123
Chapter 10194
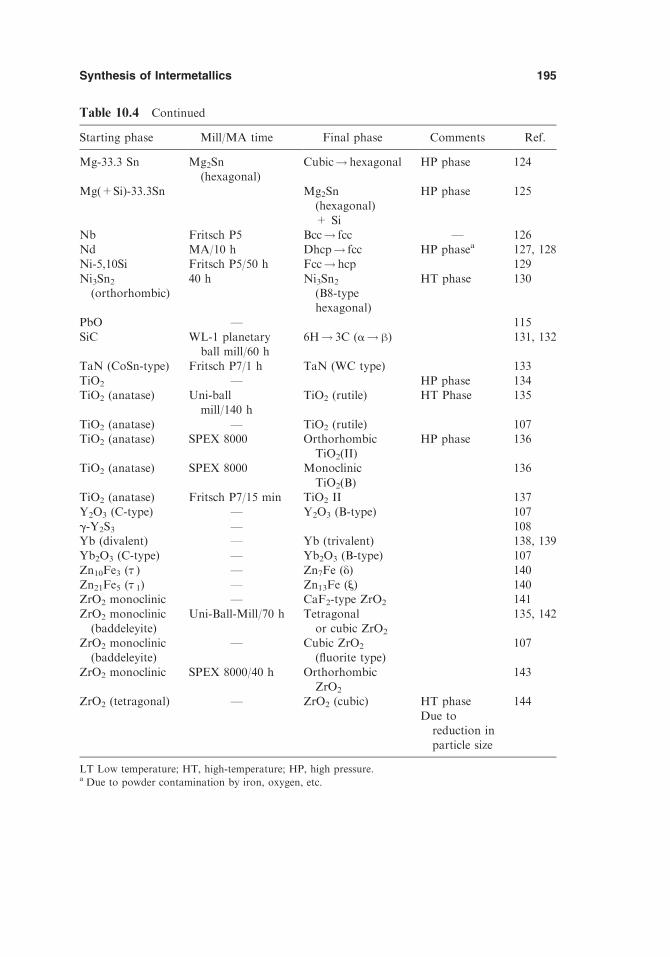
MD: SURYANARAYANA, JOB: 03320, PAGE: 195
4103-X_Suryanarayana_Ch10_R2_080304
Table 10.4 Continued
Starting phase Mill/MA time Final phase Comments Ref.
Mg-33.3 Sn Mg2Sn(hexagonal)
Cubic! hexagonal HP phase 124
Mg(+Si)-33.3Sn Mg2Sn(hexagonal)+ Si
HP phase 125
Nb Fritsch P5 Bcc! fcc — 126Nd MA/10 h Dhcp! fcc HP phasea 127, 128Ni-5,10Si Fritsch P5/50 h Fcc!hcp 129
Ni3Sn2(orthorhombic)
40 h Ni3Sn2(B8-typehexagonal)
HT phase 130
PbO — 115
SiC WL-1 planetaryball mill/60 h
6H! 3C (a!h) 131, 132
TaN (CoSn-type) Fritsch P7/1 h TaN (WC type) 133
TiO2 — HP phase 134TiO2 (anatase) Uni-ball
mill/140 hTiO2 (rutile) HT Phase 135
TiO2 (anatase) — TiO2 (rutile) 107TiO2 (anatase) SPEX 8000 Orthorhombic
TiO2(II)HP phase 136
TiO2 (anatase) SPEX 8000 Monoclinic
TiO2(B)
136
TiO2 (anatase) Fritsch P7/15 min TiO2 II 137Y2O3 (C-type) — Y2O3 (B-type) 107
g-Y2S3 — 108Yb (divalent) — Yb (trivalent) 138, 139Yb2O3 (C-type) — Yb2O3 (B-type) 107
Zn10Fe3 (H ) — Zn7Fe (y) 140Zn21Fe5 (H 1) — Zn13Fe (s) 140ZrO2 monoclinic — CaF2-type ZrO2 141
ZrO2 monoclinic(baddeleyite)
Uni-Ball-Mill/70 h Tetragonalor cubic ZrO2
135, 142
ZrO2 monoclinic(baddeleyite)
— Cubic ZrO2
(fluorite type)107
ZrO2 monoclinic SPEX 8000/40 h OrthorhombicZrO2
143
ZrO2 (tetragonal) — ZrO2 (cubic) HT phase
Due toreduction inparticle size
144
LT Low temperature; HT, high-temperature; HP, high pressure.a Due to powder contamination by iron, oxygen, etc.
Synthesis of Intermetallics 195

MD: SURYANARAYANA, JOB: 03320, PAGE: 196
4103-X_Suryanarayana_Ch10_R2_080304
Table 10.5 Formation of Equilibrium Intermetallic Phases by Mechanical Alloying
System Phase Structure Comments Ref.
Ag-Al s Hcp, A3 (hP2) 152Ag-Al A Complex cubic,
A13 (cP20)152
Ag-33.3Cu-33.3Se AgCuSe 153
Ag-33.3S Ag2S 153Ag-33.3Se Ag2Se 153Ag-34.5Te Ag1.9Te 153
Ag-40Te Ag3Te2 153Al-40 to 50Co AlCo B2 MA/38 h 154Al-40Co AlCo B2 155
Al-31.5Co h�CoAl B2 156Al- 18.2 to 50Co hV-AlCo 101Al-20Cu-15Fe FeAl
(partiallydisordered)
25
Al2Cu C16 25Al-Fe Al6Fe MA + 300jC 157
Al-50 to 60Fe AlFe B2 MA/38 h 154Al-50Fe AlFe A2, a=0.2907 nm 158Al-25,29Fe Al5Fe2 159, 160
Al-20,25Fe Al3Fe 161Al-12.5Fe Al3Fe MA/12 h +
500jC161, 162
Al-27.4Fe-28.7C AlFe B2 MA/24 h +475jC
163
Al-45Fe-5Ni AlFe B2 164
Al-25Fe-25Ni Al(Ni,Fe) B2 164Al-25Fe-25Ti–25C AlFe B2, a = 0.288 nm 165Al-25Fe-25V Al7Cu2Fe Bcc MA + anneal
at 625 K158
Al-45Fe- 5V Al7Cu2Fe Bcc MA + annealat 625 K
158
Al-25Ge-10Fe Al4Ge2Fe Tetragonal,
a = 0.6417,c = 0.9521 nm
166
Al-Mg Al3Mg2 g 167
Al12Mg17 A12 167Al-Mn Al6Mn Orthorhombic MA + extrusion 69, 168Al-3Mo Al12Mo MA + HT 169, 170
Al5Mo 169, 170
Al4Mo 169, 170Al8Mo3 169, 170
Al-Nb Al3Nb 171–176
Al-25Nb Al3Nb +m-Nb2Al
70
Al-Nb-Ti Nb2Al 175
Al-50Ni AlNi B2 MA/38 h 154Al-35 to 50Ni NiAl B2 55, 177,
178
Chapter 10196

MD: SURYANARAYANA, JOB: 03320, PAGE: 197
4103-X_Suryanarayana_Ch10_R2_080304
Table 10.5 Continued
System Phase Structure Comments Ref.
Al-35Ni Al3Ni2 MA/38 h 154Al-25Ni Al3Ni 55Al-8Ni-4Co Al9(Co,Ni)2 179
Al-40 to 49Ni-2to 20Cr
B2 Cubic 180
Al-Ni-Fe B2 181
Al-40 to 49Ni-2to 20Fe
B2 180
Al-39Ni-22Ti Disordered NiAl Cubic 182
Al-40Ru RuAl B2 183Al-Sb AlSb 184Al-30Si-15Fe-5Ni (Al,Si)7Ni3 10 h, partial 185Al-Ti Al3Ti 50 h 186, 187
Al-25TiH1.924 Al3Ti MA/10 h +620jC/7 days
188
Al-Zr AlZr Orthorhombic 189, 190
Al-Zr Al3Zr2 Orthorhombic 189, 190Al2O3–TiO2 h-Al2TiO5 h phase MA/15 min +
1340jC191
BaO-TiO2 BaTiO3 192Be-Nb NbBe12 MA/72 h +
1000jC/4 h193
Be-Nb Nb2Be17 MA/72 h +1000jC/4 h
193
CaO-TiO2 CaTiO3 192Co CoO Milling in
atmospheric air
194
Co Co3O4 Milling inatmospheric air
194
Co-30 to 60Sn Co3Sn2 195CoSnCoSn2
Co-25Ti Co3Ti Bcc Cyclic Am !Cryst ! Am
75
Co-50Ti CoTi Bcc Cyclic Am !Cryst ! Am
196
Cr-33Nb Cr2Nb 197Cu-25In-50S CuInS2 153Cu-25In-50Se CuInSe2 153
Cu-25In-50Te CuInTe2 153Cu-30 to 70Al Cu9Al4 198Cu-11Ni-18P Cu3P, Ni3P 199
Cu-20P Cu3P 200Cu-33S Cu2-xS 149Cu-25 to 75Sb D-Cu2Sb 201
Cu-66.7Se CuSe2 106Cu-Sn Cu6Sn5 202
Cu3SnCu-46.8, 49.3Zn h-CuZn 52
Synthesis of Intermetallics 197
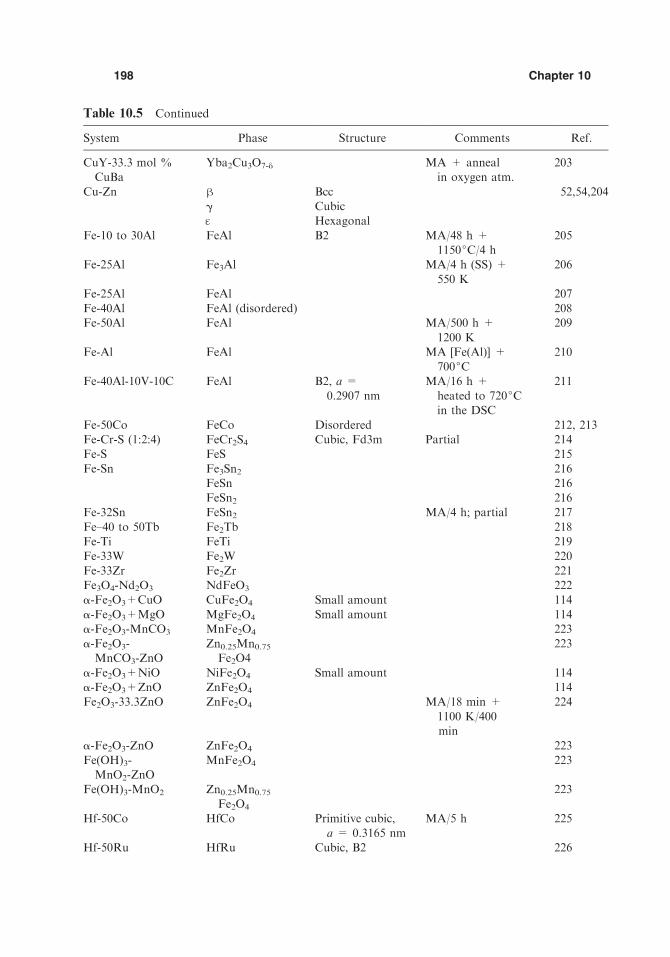
MD: SURYANARAYANA, JOB: 03320, PAGE: 198
4103-X_Suryanarayana_Ch10_R2_080304
Table 10.5 Continued
System Phase Structure Comments Ref.
CuY-33.3 mol %CuBa
Yba2Cu3O7-y MA + annealin oxygen atm.
203
Cu-Zn h Bcc 52,54,204g Cubicq Hexagonal
Fe-10 to 30Al FeAl B2 MA/48 h +1150jC/4 h
205
Fe-25Al Fe3Al MA/4 h (SS) +
550 K
206
Fe-25Al FeAl 207Fe-40Al FeAl (disordered) 208Fe-50Al FeAl MA/500 h +
1200 K
209
Fe-Al FeAl MA [Fe(Al)] +700jC
210
Fe-40Al-10V-10C FeAl B2, a =0.2907 nm
MA/16 h +heated to 720jCin the DSC
211
Fe-50Co FeCo Disordered 212, 213Fe-Cr-S (1:2:4) FeCr2S4 Cubic, Fd3m Partial 214Fe-S FeS 215
Fe-Sn Fe3Sn2 216FeSn 216FeSn2 216
Fe-32Sn FeSn2 MA/4 h; partial 217
Fe–40 to 50Tb Fe2Tb 218Fe-Ti FeTi 219Fe-33W Fe2W 220
Fe-33Zr Fe2Zr 221Fe3O4-Nd2O3 NdFeO3 222a-Fe2O3+CuO CuFe2O4 Small amount 114
a-Fe2O3+MgO MgFe2O4 Small amount 114a-Fe2O3-MnCO3 MnFe2O4 223a-Fe2O3-MnCO3-ZnO
Zn0.25Mn0.75Fe2O4
223
a-Fe2O3+NiO NiFe2O4 Small amount 114a-Fe2O3+ZnO ZnFe2O4 114Fe2O3-33.3ZnO ZnFe2O4 MA/18 min +
1100 K/400min
224
a-Fe2O3-ZnO ZnFe2O4 223
Fe(OH)3-MnO2-ZnO
MnFe2O4 223
Fe(OH)3-MnO2 Zn0.25Mn0.75Fe2O4
223
Hf-50Co HfCo Primitive cubic,a = 0.3165 nm
MA/5 h 225
Hf-50Ru HfRu Cubic, B2 226
Chapter 10198
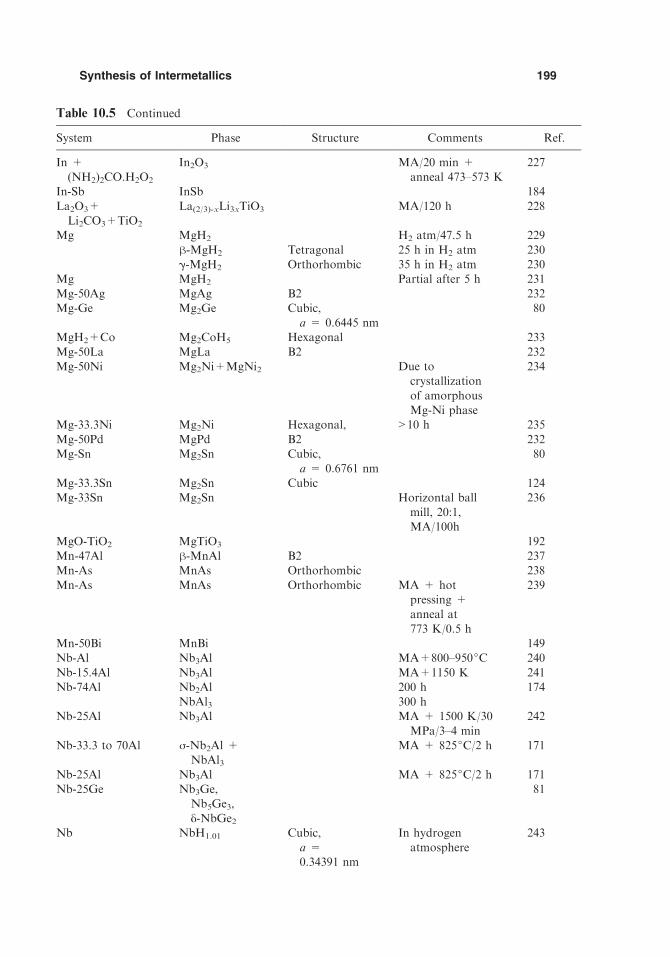
MD: SURYANARAYANA, JOB: 03320, PAGE: 199
4103-X_Suryanarayana_Ch10_R2_080304
Table 10.5 Continued
System Phase Structure Comments Ref.
In +(NH2)2CO.H2O2
In2O3 MA/20 min +anneal 473–573 K
227
In-Sb InSb 184
La2O3+Li2CO3+TiO2
La(2/3)-xLi3xTiO3 MA/120 h 228
Mg MgH2 H2 atm/47.5 h 229
h-MgH2 Tetragonal 25 h in H2 atm 230g-MgH2 Orthorhombic 35 h in H2 atm 230
Mg MgH2 Partial after 5 h 231
Mg-50Ag MgAg B2 232Mg-Ge Mg2Ge Cubic,
a = 0.6445 nm80
MgH2+Co Mg2CoH5 Hexagonal 233
Mg-50La MgLa B2 232Mg-50Ni Mg2Ni+MgNi2 Due to
crystallization
of amorphousMg-Ni phase
234
Mg-33.3Ni Mg2Ni Hexagonal, >10 h 235
Mg-50Pd MgPd B2 232Mg-Sn Mg2Sn Cubic,
a = 0.6761 nm80
Mg-33.3Sn Mg2Sn Cubic 124Mg-33Sn Mg2Sn Horizontal ball
mill, 20:1,MA/100h
236
MgO-TiO2 MgTiO3 192Mn-47Al h-MnAl B2 237Mn-As MnAs Orthorhombic 238
Mn-As MnAs Orthorhombic MA + hotpressing +anneal at
773 K/0.5 h
239
Mn-50Bi MnBi 149Nb-Al Nb3Al MA+800–950jC 240
Nb-15.4Al Nb3Al MA+1150 K 241Nb-74Al Nb2Al 200 h 174
NbAl3 300 hNb-25Al Nb3Al MA + 1500 K/30
MPa/3–4 min
242
Nb-33.3 to 70Al j-Nb2Al +NbAl3
MA + 825jC/2 h 171
Nb-25Al Nb3Al MA + 825jC/2 h 171Nb-25Ge Nb3Ge,
Nb5Ge3,
y-NbGe2
81
Nb NbH1.01 Cubic,a =0.34391 nm
In hydrogenatmosphere
243
Synthesis of Intermetallics 199

MD: SURYANARAYANA, JOB: 03320, PAGE: 200
4103-X_Suryanarayana_Ch10_R2_080304
Table 10.5 Continued
System Phase Structure Comments Ref.
Nb-S Nb1-xS 215Nb-Sn Nb3Sn MA +
750–850jC240
Ni NiO Milling inatmospheric air
194
Ni-Al B2-NiAl 210
Ni-Al Al3Ni (ordered) 244NiAl (ordered)Ni3Al(disordered)
Ni-Al NiAl MA for <1 h 245Ni-15 to 60Al NiAl Between 39
and 60 Al246
Ni-24Al L12-Ni3Al 247, 248
Ni-25Al Disordered Ni3Al 249Ni-25Al Ni3Al 250Ni-49Al NiAl 248
Ni-50Al B2-NiAl 210, 251–254
Ni-60 to 65Al NiAl 177
Ni-63Al NiAl(disordered) 255Ni-65Al Ni2Al3 17 min 255, 256
NiAl 125 min
Ni-70Al Ni2Al3 255Ni-75Al NiAl3, Ni2Al3 256Ni-50Al-25Fe hV-(Fe,Ni)Al 257Ni-7.5Al-17.5Nb Ni3Al+Ni3Nb 248
Ni-38.7Al-19.3Nb NiAl+NiAlNb 248Ni-25 to30Al-20 to 25Ti
hV-Ni(Al,Ti) 181, 258
Ni50-xAl50-xM2x
(M = Cr, Fe)NiAl Partially ordered
up to x = 8and completely
ordered atx = 10
254
Ni-43Mo g fcc, a =
1.1098 nm
MA/63 h +
720jC259
Ni-40S Ni3S2 215, 260Ni-Sn Ni3Sn4 MA/150 h +
anneal
1000jC/2h
83
Ni-40Ti Ni3Ti 261, 262Pb-Te PbTe Cubic,
NaCl type
2 min 263
PbO+MgO+Nb2O5
Pb(Mg1/3Nb2/3)O3 MA/20 h 264, 265
(PbO + MgO +Nb2O5) + 10to 35 mol %TiO2
Perovskitestructure
MA/20 h 265
Chapter 10200

MD: SURYANARAYANA, JOB: 03320, PAGE: 201
4103-X_Suryanarayana_Ch10_R2_080304
Table 10.5 Continued
System Phase Structure Comments Ref.
PbO-TiO2 PbTiO3 266PbO2-TiO PbTiO3 266Pd-50Al PdAl 267
Ru-50Al RuAl B2 MA/25 h orMA/2 h +733jC
268, 269
Ru-50Al-10 to 25Ir (Ru,Ir)Al B2 MA/6 h 270Sb-15Fe Sb2Fe MA/400 h; partial 271Sb-57.1Zn Sb3Zn4 MA/16 h +
anneal at 805 K
272
Sm-Fe SmFe2 MA/7 h +500jC/2 h
273
Sm-Fe Sm2Fe17 MA/7 h +
800jC/2 h
273, 274
Sm-57.2Se Sm3Se4 150Sm-60 Se Sm2Se3 150
Sm-50 Te SmTe 150Sn-66.7S SnS2 215SrO-TiO2 SrTiO3 192
Ti-60Al Fcc g-TiAl 275, 276Ti-50, 55Al g-TiAl Partial,
MA/10 h +
615jC/1 week
277
Ti-50Al Ti3Al 278Ti-50Al Disordered TiAl 279Ti-50Al TiAl MA/650h +
800jC/2h280
Ti-48Al TiAl MA + 1000jC/1hhot press +
1200C/4 h
281
Ti-45Al a2-Ti3Al DO19 MA/200 h + VHP1173 K/1 h
282
Ti-24Al a2-Ti3Al DO19 MA/3 h +630jC/4 weeks
283
Ti-24Al-11Nb B2 Cubic 284
Ti-25Al-25Nb B2 Cubic 285, 286Ti-28.5Al-23.9Nb B2 Cubic 285, 286Ti-37.5Al-12.5Nb B2 Cubic 286Ti-42.4Fe TiFe B2 Annealing of the
amorphous phaseat 750jC/0.5 h
287
Ti-Ni Ti2Ni 1 min 288
TiNi B2 5 min 288Ti-25Ru-25Fe Ti2RuFe 289Ti-50V TiV Bcc 290
TiVH4.7 Fcc 290TiH1.924-50Al TiAl Fct MA/16.5 h +
620jC/7 days188
TiH2 + Al3Ti g-TiAl Partial 291
Synthesis of Intermetallics 201

Sen et al. [136] synthesized the high-pressure orthorhombic form of TiO2(II) atatmospheric pressure by MA at room temperature. Alonso et al. [128] reported thatthey synthesized the high-pressure fcc polymorphs of lanthanide metals Dy, Gd, Nd,and SmbyMAof the powders for about 24 h in a SPEXmill using a hardened steel vialand alloy steel balls. However, they later recognized [150] that the phases producedwere the NaCl-type interstitial phases formed by reaction of these reactive metals withoxygen, nitrogen, and hydrogen during milling in a poorly sealed vial. As an example,the milled Nd powder contained 16.2 at% oxygen, 22.3 at% nitrogen, and 10.3 at%hydrogen. Thus, it is not clear whether the high-pressure phases of pure metals,especially the reactive ones, can be synthesized by MA. But it appears that high-pressure compound phases of oxides, chalcogenides, and so forth can certainly besynthesized byMA, since contamination is not likely to play any role in the formationof these less reactive compounds.
The above observation reminds us that extreme caution should be exercised inidentifying metastable crystalline phases produced by MA. During MA processing,the powder picks up appreciable quantities of interstitial elements like oxygen,nitrogen, hydrogen, and carbon (from the ambient atmosphere and/or the processcontrol agents) as well as iron and chromium (from the grinding media and/or the millwalls). These metallic and nonmetallic impurities can have a very significant effect onthe stability of the phases. In addition, these interstitials can combine with the metallicelements and form interstitial compounds. Thus, it is possible to misinterpret theseinterstitial phases (e.g., carbides, nitrides, hydrides, oxides, oxynitrides) as new
MD: SURYANARAYANA, JOB: 03320, PAGE: 202
4103-X_Suryanarayana_Ch10_R2_080304
Table 10.5 Continued
System Phase Structure Comments Ref.
TiO2-Ba(OH)2.8H2O BaTiO3 292Y2O3-BaCO3-CuO Y2Cu2O5 293Y2O3-CuO Y2Cu2O5 293
Y2O3-BaO2-CuO Y2BaCuO5 293Zn-10 wt%Al-22wt%Cu
D and e phases 294
Zn-15Cu q phase Milling for 1 h 204g phase After long milling 204
Zn-Fe Fe3Zn 295
Zn-50S ZnS 215, 260Zr ZrH1.66 229ZrO2+SiO2, 0.5H2O ZrSiO4 MA/15 min +
1200jC/2 h191
ZrO2.4.3H2O +SiO2 ZrSiO4 MA/15 min +1200jC/2 h
191
ZrO2 +TiO2 ZrTiO4 Partial MA/15 min 191
ZrO2 +TiO2 ZrTiO4 Partial MA/15 min 191ZrO2.nH2O +TiO2.nH2O
ZrTiO4 Mechanical activationto form an
amorphous phaseand subsequentannealing at 600jC
191
Chapter 10202

intermetallic phases. An accurate chemical analysis of the final resultant powder can,in many cases, clear up this confusion [151].
10.3.3 Equilibrium Crystalline Phases
MA has been used for the synthesis of several intermetallic phases in both thedisordered and ordered conditions. In many cases the intermetallics were synthesizeddirectly by MA, but in others an additional heat treatment was required after MA toform the intermetallic. The intermetallics synthesized include aluminides (mostlybased on titanium, nickel, and iron), borides, carbides, nitrides, silicides, composites,and some exotic varieties. Table 10.5 presents a complete listing of the intermetallicsthat have been synthesized byMA.As a typical examplewewill now describe the phaseevolution in mechanically alloyed blended elemental Ti-Al powder mixtures.
The Ti-Al binary phase diagram (Fig. 10.2) [296] features three intermetallics:Ti3Al (a2), TiAl (g), and TiAl3. All these intermetallics are light weight, have highspecific strengths, high elastic moduli, good corrosion resistance, and retain sufficientstrength at elevated temperatures. The two titanium-rich titanium aluminides—a2
(Ti3Al) and g (TiAl)—are attractive candidate materials for potential applications inadvanced aerospace engine and airframe components [296,297]. However, they suf-fer from low room-temperature ductility, thus preventing their easy fabrication andwidespread applications. The technique of MA has been utilized extensively tosynthesize these intermetallics in a nanocrystalline and disordered state with a viewto improving their room temperature ductility. Even though actual improvement inductility is only partially realized in nanostructured intermetallics, whether producedbyMA or other methods such as electrodeposition or severe plastic deformation [298–304], its realization in the mechanically alloyed nanostructured intermetallics, includ-ing the titanium aluminides, is yet to be achieved. However, a vast amount ofinformation has been generated on phase evolution in these alloys.
Figure 10.3 shows a series of XRD patterns indicating the phase evolution as afunction of milling time in a Ti-24 at% Al powder mixture [283]. The as-mixed
MD: SURYANARAYANA, JOB: 03320, PAGE: 203
4103-X_Suryanarayana_Ch10_R2_080304
Figure 10.2 Equilibrium phase diagram of the Ti-Al system [296].
Synthesis of Intermetallics 203
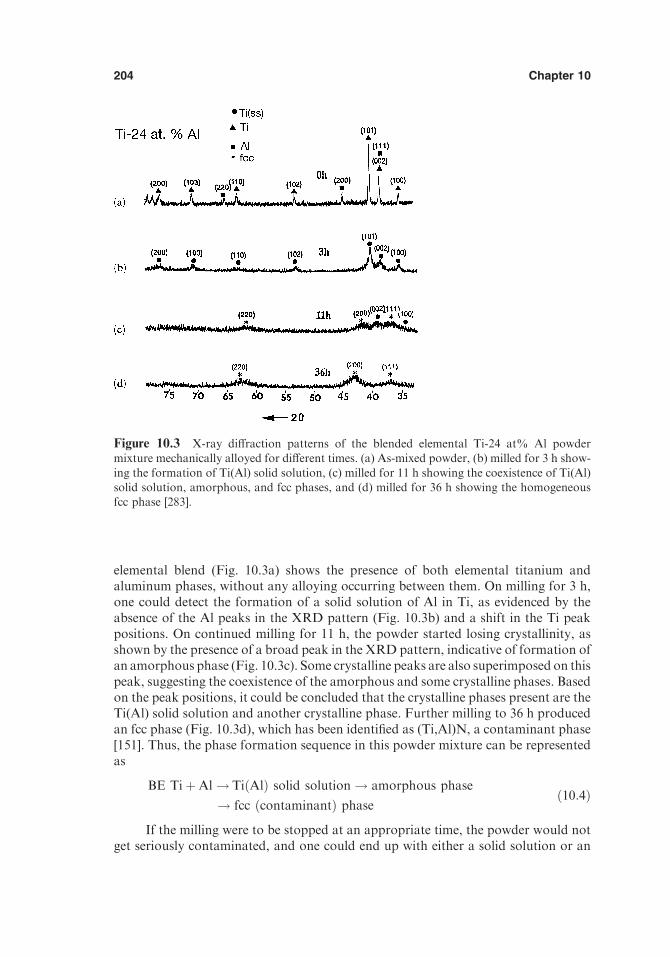
elemental blend (Fig. 10.3a) shows the presence of both elemental titanium andaluminum phases, without any alloying occurring between them. On milling for 3 h,one could detect the formation of a solid solution of Al in Ti, as evidenced by theabsence of the Al peaks in the XRD pattern (Fig. 10.3b) and a shift in the Ti peakpositions. On continued milling for 11 h, the powder started losing crystallinity, asshown by the presence of a broad peak in the XRD pattern, indicative of formation ofan amorphous phase (Fig. 10.3c). Some crystalline peaks are also superimposed on thispeak, suggesting the coexistence of the amorphous and some crystalline phases. Basedon the peak positions, it could be concluded that the crystalline phases present are theTi(Al) solid solution and another crystalline phase. Further milling to 36 h producedan fcc phase (Fig. 10.3d), which has been identified as (Ti,Al)N, a contaminant phase[151]. Thus, the phase formation sequence in this powder mixture can be representedas
BE TiþAl ! TiðAlÞ solid solution ! amorphous phase
! fcc ðcontaminantÞ phaseð10:4Þ
If the milling were to be stopped at an appropriate time, the powder would notget seriously contaminated, and one could end up with either a solid solution or an
MD: SURYANARAYANA, JOB: 03320, PAGE: 204
4103-X_Suryanarayana_Ch10_R2_080304
Figure 10.3 X-ray diffraction patterns of the blended elemental Ti-24 at% Al powdermixture mechanically alloyed for different times. (a) As-mixed powder, (b) milled for 3 h show-
ing the formation of Ti(Al) solid solution, (c) milled for 11 h showing the coexistence of Ti(Al)solid solution, amorphous, and fcc phases, and (d) milled for 36 h showing the homogeneousfcc phase [283].
Chapter 10204
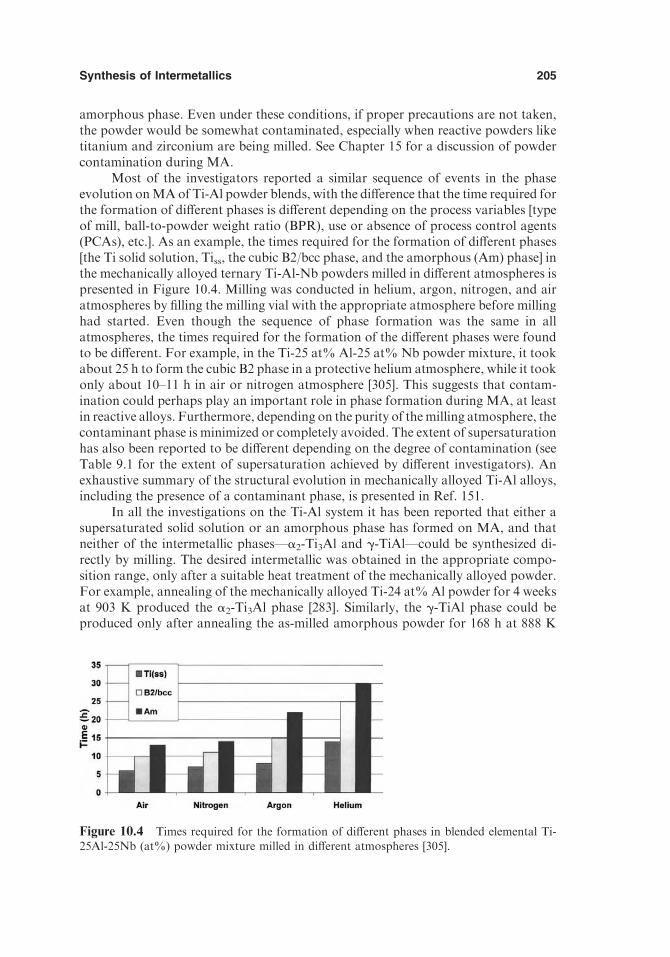
amorphous phase. Even under these conditions, if proper precautions are not taken,the powder would be somewhat contaminated, especially when reactive powders liketitanium and zirconium are being milled. See Chapter 15 for a discussion of powdercontamination during MA.
Most of the investigators reported a similar sequence of events in the phaseevolution onMAof Ti-Al powder blends, with the difference that the time required forthe formation of different phases is different depending on the process variables [typeof mill, ball-to-powder weight ratio (BPR), use or absence of process control agents(PCAs), etc.]. As an example, the times required for the formation of different phases[the Ti solid solution, Tiss, the cubic B2/bcc phase, and the amorphous (Am) phase] inthe mechanically alloyed ternary Ti-Al-Nb powders milled in different atmospheres ispresented in Figure 10.4. Milling was conducted in helium, argon, nitrogen, and airatmospheres by filling the milling vial with the appropriate atmosphere before millinghad started. Even though the sequence of phase formation was the same in allatmospheres, the times required for the formation of the different phases were foundto be different. For example, in the Ti-25 at% Al-25 at% Nb powder mixture, it tookabout 25 h to form the cubic B2 phase in a protective helium atmosphere, while it tookonly about 10–11 h in air or nitrogen atmosphere [305]. This suggests that contam-ination could perhaps play an important role in phase formation during MA, at leastin reactive alloys. Furthermore, depending on the purity of themilling atmosphere, thecontaminant phase is minimized or completely avoided. The extent of supersaturationhas also been reported to be different depending on the degree of contamination (seeTable 9.1 for the extent of supersaturation achieved by different investigators). Anexhaustive summary of the structural evolution in mechanically alloyed Ti-Al alloys,including the presence of a contaminant phase, is presented in Ref. 151.
In all the investigations on the Ti-Al system it has been reported that either asupersaturated solid solution or an amorphous phase has formed on MA, and thatneither of the intermetallic phases—a2-Ti3Al and g-TiAl—could be synthesized di-rectly by milling. The desired intermetallic was obtained in the appropriate compo-sition range, only after a suitable heat treatment of the mechanically alloyed powder.For example, annealing of the mechanically alloyed Ti-24 at% Al powder for 4 weeksat 903 K produced the a2-Ti3Al phase [283]. Similarly, the g-TiAl phase could beproduced only after annealing the as-milled amorphous powder for 168 h at 888 K
MD: SURYANARAYANA, JOB: 03320, PAGE: 205
4103-X_Suryanarayana_Ch10_R2_080304
Figure 10.4 Times required for the formation of different phases in blended elemental Ti-25Al-25Nb (at%) powder mixture milled in different atmospheres [305].
Synthesis of Intermetallics 205
[277,306]. These temperature and time combinations required for producing theintermetallics could vary considerably depending on the powder particle/grain size.However, the third intermetallic, i.e., the TiAl3 phase, could be synthesized in ametastable L12 structure directly by MA [66,71].
The times required to form a particular phase depend on the initial concentra-tion of the solute in the powder mixture. If the solute content is much less than theexact stoichiometry, the expected phase (although the proportion of the phase in themixture of phases is less) would form at much longer milling times. For example,while investigating the formation of the hV-AlCo phase in Al-Co alloys, Sui et al. [101]noted that it required 10 h to form the hV-AlCo phase in an Al-50 at% Co powdermixture. On the other hand, it required 30 h in Al-28.6 at% Co, 70 h in Al-23.5 at%Co, and 200 h in Al-18.2 at% Co mixtures to form the hV-AlCo phase under identicalmilling conditions. Thus, it is clear that the times required for the formation of thehV-AlCo phase increase as one deviates more from the stoichiometric compositionwith the times being much longer at larger deviations from stoichiometry. This is easyto understand because formation of a particular phase requires diffusion and equil-ibration, both requiring time at a given temperature. The times can be probably re-duced if the temperature at which milling is conducted is increased. However, therehave not been any investigations reported to confirm this hypothesis. The time re-quired to form a phase can also be substantially reduced if the BPR is increased. Thishas been shown to be true in several cases but is likely to lead to increased levels ofcontamination.
The sequence of phase formation during MA of blended elemental powdersappears to be related to the diffusivity of the predominantly mobile species. Thus, if inan alloy systemA-B, the diffusivity of A is higher than that of B, i.e.,DA>DB, then thefirst phase to form will be rich in the B component. Accordingly, it was reported [307]that in the Ni-Ti system, the first phase to form was NiTi2, sinceDNi>>DTi. Similarly,in the Al-Ti system, the first phase to form was AlTi3 because DAl>DTi, thusconfirming the above hypothesis. A similar situation was also reported for theformation of intermetallic phases in the Cu-Zn system [54]. It has been shown thatnucleation is an important factor in determining the first phase to be formed. This hasbeen predicted on the basis of the classical nucleation theory and the interfacial area ofthe particles obtained during MA [308].
Schaffer [309] showed that mixtures of intermetallic phases can be produced viaMA by choosing the appropriate compositions. If the two phases are in equalproportion, then it has been noted that grain growth was considerably hindered.Thus, by having approximately equal proportions of the NiAl and Ni3Al phases in ananocrystalline state, it was shown that grain growth could be slowed down up to atleast 500jC.
In majority of the cases, equilibrium crystalline phases have been synthesized atthe compositions at which they were expected to be present under equilibriumconditions.However, in some cases the intermetallics could be synthesized at compo-sitions away from the equilibrium homogeneity range, i.e., the homogeneity range ofthe intermetallics has been extended. For example, Sui et al. [101] reported that the h-AlCo phase formed at a composition corresponding to Co-70 at% Al, while theequilibrium h-AlCo phase was stable between 44.3 and 53.7 at% Al. A similar resultwas reported by Guerrero-Paz et al. [310], who had reported the formation of only the
MD: SURYANARAYANA, JOB: 03320, PAGE: 206
4103-X_Suryanarayana_Ch10_R2_080304
Chapter 10206
h-CoAl phase in the Co-68.5 at% Al alloy. Similarly, Singh et al. [311] reported thatthe homogeneity ranges of the h (Al3Mg2) and g (Al12Mg17) phases in the Mg-Alsystem could be significantly extended. While the h phase was expected to be presenthomogeneously between 59.7 and 61.5 at% Al under equilibrium conditions, it wasfound to be present homogeneously at even a low value of 50 at% Al in the me-chanically alloyed powders. Similarly, the g phase was expected to be stable between39.5 and 55 at% Al, but its homogeneity range could be extended down to 30 at% Alin the mechanically alloyed powders.
As was mentioned in Chapter 5, a number of process variables affect the natureand kinetics of the intermetallic phase formed duringMA. It was reported byGauthieret al. [312,313] that the Nb3Al intermetallic could be synthesized by a combination ofMA and another processing step. Accordingly, they hadmechanically alloyed blendedelemental powders of Nb and Al for a short time to obtain a nanoscale distribution ofthe reactants (without the formation of any product phase). This nanoscale mixturewas subsequently cold compacted and subjected to either field activation (simulta-neous application of pressure, 56–84 MPa, and current, 1500–1650 A) [312], or self-propagating high-temperature synthesis reaction [313]. The combination of theseprocesses led to the formation of the intermetallic in a short time (3–6min) as against amuch longer period required when only conventional MA was done without combin-ing it with other treatments.
10.4 ROLE OF HYDROGEN AS A TEMPORARY ALLOYING ELEMENT
Hydrogen can dissolve in titanium and its alloys up to 8.3 at% in the a phase and up to60.3 at% in the h phase. Since reaction of hydrogen with titanium is reversible [314],hydrogen can be easily removed from the alloy by vacuum annealing. Thus, hydrogencan be used as a temporary alloying element to improve the performance of the alloys(by bringing about phase transformations), and this process has come to be known asthermochemical processing (TCP). It has been shown earlier that TCP could enhancethe processability and mechanical behavior of titanium alloys, mostly through grainrefinement via a phase transformation [315]. The actual processing consists of addinghydrogen to the alloy by holding the material at a relatively high temperature (usuallyin the h-phase field to dissolve more hydrogen) in a hydrogen environment. Thepresence of hydrogen then allows the titanium alloy to be processed at lower stresses/lower temperatures due to the presence of an increased amount of the h phase. Thisalloy could then be heat treated to produce novel microstructures with enhancedmechanical behavior after hydrogen removal. The hydrogen is simply removed by avacuum annealing treatment to levels below which no detrimental effects occur.Consequently, thermomechanically processed titanium aluminides exhibit improvedstrength, ductility, and fatigue resistance (because hydrogen allows the material tobehave as a eutectoid former system).
As mentioned earlier, MA of alloy powders containing titanium results in theformation of a contaminant fcc TiN phase. The use of a PCA can also introducecontamination into the powder; therefore, avoiding the use of a PCA could also reducecontamination of the powder. Since a PCA is used mainly to minimize excessive coldwelding and obtain a balance between fracturing and cold welding of powder particles,
MD: SURYANARAYANA, JOB: 03320, PAGE: 207
4103-X_Suryanarayana_Ch10_R2_080304
Synthesis of Intermetallics 207

MD: SURYANARAYANA, JOB: 03320, PAGE: 208
4103-X_Suryanarayana_Ch10_R2_080304
nonusage of the PCA may result in excessive cold welding and formation of largerparticles; true alloying may also not occur. This problem can be overcome by usingintermetallics or other compounds, which are inherently brittle (reduced ductility),and therefore excessive cold welding between particles is not of a serious concern.Accordingly, Suryanarayana et al. [291] synthesized the g-TiAl phase by mixingtitaniumhydride (instead of pure titanium) and theAl3Ti intermetallic (instead of purealuminum) powders in the proper proportion, according to the relation:
Al3Tiþ 2TiH2 ! 3TiAlþ 2H2z ð10:5Þ
On mechanically alloying the above powder mixture for 52 h in a SPEX mill, theyobtained 55 vol% of the g-TiAl phase; this value was increased to 95%on hot isostaticpressing of the mechanically alloyed powder at 1023 K and 275MPa for 5 h. Based onthe success of synthesizing the g-TiAl phase, this procedure has been subsequentlyextended to synthesize the Ti3Al, TiAl, and Al3Ti phases by milling titanium hydrideand aluminum powders in the ratios of 3:1, 1:1, and 1:3, respectively [188,316].However, in these cases the respective intermetallics could not be synthesized directlybyMA; probably related to the ductile aluminum being present in the powder mixtureinstead of the brittle Al3Ti compound in the earlier investigation. A subsequentannealing treatment at 893 K for 7 days was necessary to produce the TiAl and Al3Tiphases. However, the Ti3Al phase could not be synthesized even after the heattreatment due to the very large amount of hydrogen content present in the powder.That is, hydrogen was not sufficiently removed by vacuum annealing. The Ti3Al phasecould, however, be synthesized after dehydrogenation of the mechanically alloyedpowder at 873 K for 22 h and then annealing this powder at 893 K for 7 days. Themajor advantage of using titanium hydride instead of titanium in the powder mixtureis that PCAs need not be used during milling, and this avoids or minimizes contami-nation of the powder.
Bououdina and Guo [91,317] investigated the powder yield and particle sizerefinement on MA of Ti-22Al-23Nb or TiH2-22Al-23Nb (at%) powder mixtures in aFritsch P5 planetary ball mill using stainless balls and a ball-to-powder weight ratio of10:1. They have noted that the total free-powder yield (the amount of powder that didnot stick to the container walls and therefore could be recovered) did not change withmilling time up to 20 h and remained constant at a high value of 80%when the hydridepowder was used. On the other hand, when titanium powder was used, the yielddecreased from about 70%at amilling time of 2 h to about 20% for amilling time of 20h. On continued milling the yield decreased more rapidly in the case of titaniumhydride, and eventually the yield was the same (about 10%) whether the hydride orpure titanium powder was used. This is shown schematically in Figure 10.5. It shouldbe noted, however, that the powder stuck to the walls of the vial could be easilyremoved after milling when the hydride powder was used.
It was also noted [317] that the powder particles were much finer and some hadeven reached nanometer levels when the titanium hydride powder was used instead ofpure titanium powder. This can be understood in terms of the hard and brittle natureof the hydride particles, which could be easily fractured during the milling process. Itwas also claimed that the use of hydride powder significantly lowered the levels ofoxygen and nitrogen contamination in the milled powder and consequently acceler-ated the amorphization process.
Chapter 10208

10.5 COMBUSTION REACTIONS DURING MA
There is a considerable amount of literature on the synthesis of nickel and ironaluminides byMA. Several intermetallic phases, such as Ni3Al, NiAl, and Al3Ni, havebeen synthesized by MA in the appropriate composition ranges of the Ni-Al system.An interesting observation is that the equiatomic NiAl phase is produced via acombustion synthesis [also known as the self-propagating high-temperature synthesis(SHS)] [55]. In this and other similar systems, the combustion reaction took place onlyafter ‘‘interruptedmilling,’’ i.e., milling of the powders for a given length of time, agingthe powder at room temperature after stopping the milling, and then resuming themilling operation. For example, in the Al-Ni system, an intimate mixture of Al and Niphases was detected after milling the blended elemental Al-Ni mixture for 2 h in aSPEX mill. If the milling was stopped and the powder stored at room temperature for30 min, and then milling resumed, it was noted that the NiAl phase formed just after 1min of milling due to the occurrence of an explosive reaction [55]. Similar reactionswere also observed in the synthesis of MoSi2 [123,318–321], Ti50Ni20C30 [322], NbSi2[323], TiB2 [324], PbTiO3 [266], and some other compounds. However, in the case ofsynthesis of NbSi2 phase, it was noted that interruption during milling was notrequired for the abrupt reaction to take place [323].
In the MA of blended elemental powder mixtures, which undergo the SHSreaction, it has been observed that milling of the powder mix produces only a fine andintimate mixture of the two or more metal powders involved. No reaction has beenfound to occur at this stage. However, on continued milling, an explosive reactionoccurs and the compound suddenly forms. This has been the sequence of events in theformation of compounds by the SHS reaction. (In fact, it has been noted that ob-taining a homogeneous mixture of the constituent powder particles is a prerequisite toachieve easy alloying. Subsequent treatments such as SHS or annealing at some hightemperature seem to make alloy formation easier.) The times at which the explosivereaction occurs depends on the condition of the powder mixture, e.g., the fineness ofthe powders. Refining the powder particle size, by premilling the powder beforemixingthe individual particles or by milling the powders at high intensities or large BPR
MD: SURYANARAYANA, JOB: 03320, PAGE: 209
4103-X_Suryanarayana_Ch10_R2_080304
Figure 10.5 Change in the weight of free powder with milling time for the blended elementalTi-22Al-23Nb and TiH2-22Al-23Nb powder mixtures [91].
Synthesis of Intermetallics 209
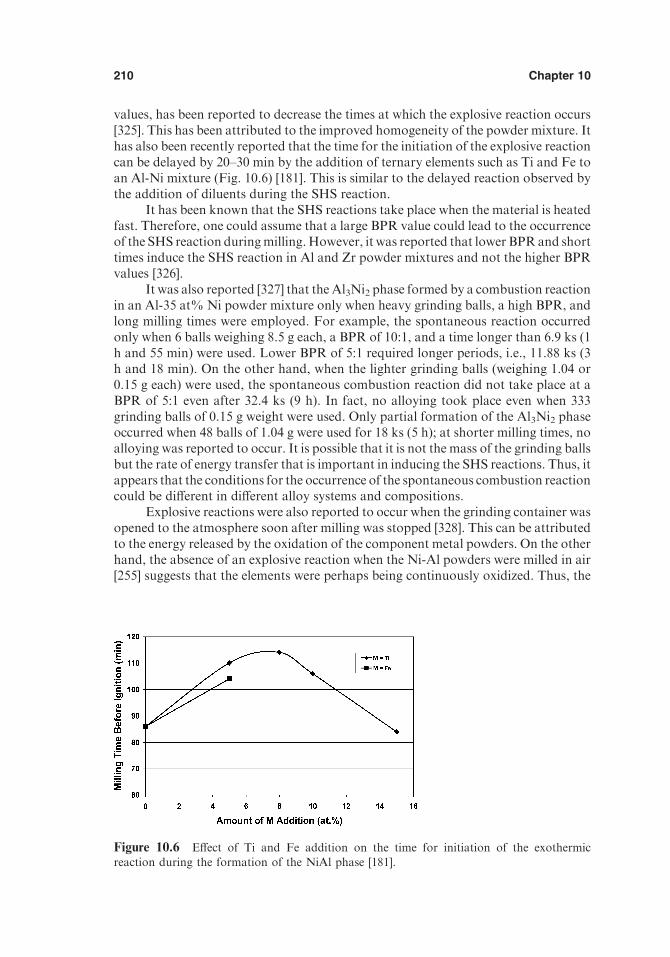
values, has been reported to decrease the times at which the explosive reaction occurs[325]. This has been attributed to the improved homogeneity of the powder mixture. Ithas also been recently reported that the time for the initiation of the explosive reactioncan be delayed by 20–30 min by the addition of ternary elements such as Ti and Fe toan Al-Ni mixture (Fig. 10.6) [181]. This is similar to the delayed reaction observed bythe addition of diluents during the SHS reaction.
It has been known that the SHS reactions take place when the material is heatedfast. Therefore, one could assume that a large BPR value could lead to the occurrenceof the SHS reaction duringmilling.However, it was reported that lower BPRand shorttimes induce the SHS reaction in Al and Zr powder mixtures and not the higher BPRvalues [326].
It was also reported [327] that the Al3Ni2 phase formed by a combustion reactionin an Al-35 at% Ni powder mixture only when heavy grinding balls, a high BPR, andlong milling times were employed. For example, the spontaneous reaction occurredonly when 6 balls weighing 8.5 g each, a BPR of 10:1, and a time longer than 6.9 ks (1h and 55 min) were used. Lower BPR of 5:1 required longer periods, i.e., 11.88 ks (3h and 18 min). On the other hand, when the lighter grinding balls (weighing 1.04 or0.15 g each) were used, the spontaneous combustion reaction did not take place at aBPR of 5:1 even after 32.4 ks (9 h). In fact, no alloying took place even when 333grinding balls of 0.15 g weight were used. Only partial formation of the Al3Ni2 phaseoccurred when 48 balls of 1.04 g were used for 18 ks (5 h); at shorter milling times, noalloying was reported to occur. It is possible that it is not the mass of the grinding ballsbut the rate of energy transfer that is important in inducing the SHS reactions. Thus, itappears that the conditions for the occurrence of the spontaneous combustion reactioncould be different in different alloy systems and compositions.
Explosive reactions were also reported to occur when the grinding container wasopened to the atmosphere soon after milling was stopped [328]. This can be attributedto the energy released by the oxidation of the component metal powders. On the otherhand, the absence of an explosive reaction when the Ni-Al powders were milled in air[255] suggests that the elements were perhaps being continuously oxidized. Thus, the
MD: SURYANARAYANA, JOB: 03320, PAGE: 210
4103-X_Suryanarayana_Ch10_R2_080304
Figure 10.6 Effect of Ti and Fe addition on the time for initiation of the exothermic
reaction during the formation of the NiAl phase [181].
Chapter 10210

slow diffusion between the oxide-coated components would have resulted in reducedkinetics and prevented the explosive reaction from occurring. Reactions similar to theexplosive type, termed ‘‘discontinuous additive mixing,’’ were also reported to occur,resulting in the formation of ordered intermetallics in the Ni-Al system [244]. In thesecases, it has been reported that the reactions occurred only when the componentpowder particles were refined to a minimal size. At this stage, an SHS-type reactionoccurs and the intermetallic forms. The crystallite size of the intermetallic at the time ofits formation was found to be the sum of the crystallite sizes of the individualcomponents before the reaction (Fig. 10.7). This minimal critical crystallite size belowwhich only the explosive-type reaction occurs was found to increase with a decrease inthe enthalpy of formation of the ordered intermetallic. It has also been reported that agradual diffusive mode of mixing occurs once the product is disordered, e.g., AlNi3 orAlNi(Cr) [329].
MD: SURYANARAYANA, JOB: 03320, PAGE: 211
4103-X_Suryanarayana_Ch10_R2_080304
Figure 10.7 Discontinuous additive mixing during the formation of (a) AlNi and (b) Al3Niordered intermetallic phases by MA. Note that the crystallite size of the intermetallic at the
time of its formation is the sum of the individual crystallite sizes of the components [244].
Synthesis of Intermetallics 211

MD: SURYANARAYANA, JOB: 03320, PAGE: 212
4103-X_Suryanarayana_Ch10_R2_080304
It has also been reported in some cases that intermixing among the powderparticles takes place continuously and metastable phases form prior to formation ofthe equilibrium phases. In other cases, a series of other equilibrium phases form beforethe actual expected phase forms. For example, the a-MoSi2 phase formed when theMo-Si powder mixture was milled in a planetary ball mill for 6 min, while the h-MoSi2phase formed after milling for 40 min [123]. Similarly, the Ni2Al3 phase formed aftermilling for 17min in anNi-65Al powder and theNiAl phase after 125min; both phaseswere formed by exothermic reaction [256].
10.6 CYCLIC PHASE TRANSFORMATIONS
As will be shown later, amorphous phase formation has been achieved in a number ofalloy systems by bothMA andmechanical milling (MM) techniques. In most cases theamorphous phase was found to exist in a metastable condition at room temperature.In other cases it has been reported that the amorphous phases formed by milling havetransformed to a crystalline phase, i.e., the amorphous phase has crystallized, oncontinued milling (or after thermal annealing in most cases. Here we will ignore thereport of the formation of a contaminant crystalline phase in the milled Ti-Al alloypowders beyond the formation of an amorphous phase as an example of formation ofa crystalline phase on prolonged milling). An interesting observation is that anamorphous phase can be crystallized to produce a crystalline intermetallic phase onmilling, and this is referred to as mechanical crystallization [51]. On the other hand, anintermetallic or a solid solution or a blended elemental powder mixture can bemade toundergo a crystalline ! amorphous transformation on milling, and this is sometimesreferred to as mechanical disordering or amorphization. These two processes, withfundamentally different mechanisms, are opposite in direction from a thermodynamicpoint of view. There have been few reports of combining these two phenomena(amorphization and crystallization) in the same metal or alloy, and even fewer on thecyclic behavior of these transformations.
It has been reported that the cyclic crystalline ! amorphous ! crystallinetransformation occurs in the Co-25 at% Ti and Co-50 at% Ti powder mixtures [75–77,196]. When the Co and Ti powders in the ratio of 3:1 were milled in a FritschPulverisette P5 mill, an amorphous phase had formed after milling for 3 h. Oncontinued milling for 24 h, the amorphous phase had crystallized to a metastable bcc-Co3Ti phase. This Co3Ti phase transformed into an amorphous phase on furthermilling to 48 h. Furthermore, it was shown that the amorphous and crystalline phasescould be produced alternately on continued milling as shown in Figure 10.8 [75,77].Since the bcc-Co3Ti phase is ferromagnetic in nature and the amorphous phase is not,the authors could follow the cyclic crystalline ! amorphous ! crystalline transfor-mation by measuring the magnetization behavior of the mechanically milled powder.This shows a cyclic behavior with time as represented in Figure 10.9 [196]. The rapiddecrease of magnetization during the first couple of hours indicates a significantdecrease in the volume fraction of the pure Co particles and the formation of anamorphous phase. On continued milling the amorphous phase crystallizes into thebcc-Co3Ti phase, which is ferromagnetic; therefore, the magnetization increases.Thus, the cyclic transformation between the amorphous and crystalline phases leadsto a cyclic decrease and increase in the magnetization of the powder, respectively.
On annealing the amorphous phase obtained byMA for 3 h in the Co-25 at%Tialloy at 1200 K, it had transformed to the equilibrium fcc-Co3Ti phase [77].
Chapter 10212

MD: SURYANARAYANA, JOB: 03320, PAGE: 213
4103-X_Suryanarayana_Ch10_R2_080304
Figure 10.8 X-ray diffraction patterns of Co-25 at% Ti powder milled for (a) 0, (b) 3, (c) 24,
(d) 48, (e) 100, (f ) 150, and (g) 200 h. Note the cyclic transformation of amorphous andcrystalline compounds [75].
Figure 10.9 Dependence of the room temperature magnetization behavior of mechanicallymilled Co-50 at% Ti alloy powder as a function of the milling time. While the bcc-CoTi phaseis ferromagnetic, the amorphous phase is not. The symbols in the figure represent the values
for three different runs showing the reproducibility of the result [196].
Synthesis of Intermetallics 213

Furthermore, the metastable bcc-Co3Ti phase formed on milling the Co-25 at% Tipowder for 24 h had also been transformed to the equilibrium fcc-Co3Ti phase onannealing at a high temperature of 1589 K. Thus, it appears that both the amorphousand metastable bcc-Co3Ti phases transformed to the equilibrium fcc-Co3Ti phase onannealing at a sufficiently high temperature, but only the metastable phases werefound to form during MA. This complete set of transformations that take place onmilling in the Co-25 at% Ti alloy powder is represented schematically in Figure 10.10[77].
A similar cyclic crystalline! amorphous! crystalline phase formationwas alsoreported in a mechanically alloyed Co-50 at% Ti powder mixture [196]. An amor-phous phase had formed onMAof a Co-50 at%Ti blended elemental powder mixturefor 6 h, which transformed into the equilibrium crystalline CoTi phase with a bccstructure on further milling to 24 h. This cyclic amorphous and crystalline phaseformation was reported to occur repeatedly on continued milling of the powdermixture. The sequence of phase formation in this alloy could be represented as
6 h 24 h 100 h 150 h 200 h
Coþ Ti ! amorphous ! bcc-CoTi ! amorphous ! bcc-CoTi ! amorphous
ð10:6ÞEven though reasons for the occurrence of the cyclic crystalline! amorphous!
crystalline transformation are not clear, a possible cause could be either the contam-
MD: SURYANARAYANA, JOB: 03320, PAGE: 214
4103-X_Suryanarayana_Ch10_R2_080304
Figure 10.10 Schematic illustration of the amorphous! crystalline! amorphous trans-formation during MA of Co-25 at% Ti powders. Formation of the equilibrium fcc-Co3Tiphase on annealing either the amorphous or metastable bcc-Co3Ti phases externally is also
indicated [77].
Chapter 10214

ination of the powder or an increase in the powder temperature during milling. It hasbeen shown earlier that a crystalline phase had formed on continued milling after theformation of the amorphous phase in some alloy systems, explained as due to severecontamination of the milled powder [151]. If the crystalline phase formed were due tocontamination, then subsequent milling would not transform that phase to theamorphous state. Furthermore, high-temperature annealing also would not changethe constitution of the powder. However, the present authors [77,196] have shown thatboth the metallic and interstitial contamination of the powder was much less than 1at% for each of these in both the alloy compositions (Fig. 10.11). Therefore it isunlikely that formation of the crystalline phase after formation of the amorphousphase is due to powder contamination. Furthermore, if the crystalline phase formedwere to be the contamination phase, it would not have transformed to the equilibriumphase on annealing.
Another possibility for the formation of the crystalline phase from the amor-phous phase on continuedmilling is an excessive rise of the powder temperature duringmilling. This possibility also was discounted by the authors who ensured that the Co-25 at%Ti powdermilled for 3 h (amorphous phase) and 24 h (bcc Co3Ti phase) did notshow any phase transformation even on annealing at 700 K, a temperature muchhigher than that obtained during milling.
The explanation offered by these authors for such cyclic transformations is asfollows: Introduction of crystal defects during MA raises the strain energy of thesystem and destroys the long-range periodic structure resulting in the formation of anamorphous phase. On continued milling the frictional forces between the grindingmedium or between the grinding medium and the vial surface generate some heat andthis relaxes the amorphous phase into forming a metastable crystalline phase. Butformation of a metastable phase was not reported in the Co-50 at% Ti powdermixture. Introduction of additional defects into the crystalline phase during continuedmilling is supposed to have destabilized the amorphous phase by mechanical disorder-
MD: SURYANARAYANA, JOB: 03320, PAGE: 215
4103-X_Suryanarayana_Ch10_R2_080304
Figure 10.11 Increase in the extent of contamination of iron, oxygen, hydrogen, andnitrogen as a function of milling time in the Co-50 at% Ti powder. Note that the highestcontent for each of the contaminants is less than 1 at%. A similar behavior is also reported for
the Co-25 at% powder [196].
Synthesis of Intermetallics 215

MD: SURYANARAYANA, JOB: 03320, PAGE: 216
4103-X_Suryanarayana_Ch10_R2_080304
ing. However, a more convincing explanation is needed to satisfactorily explain thecrystalline ! amorphous ! crystalline observations.
As noted above, a metastable intermediate phase did not form in the Co-50 at%Ti powder. Furthermore, it is not easy to understand the repetitive cyclic transfor-mation, like the one reported in the Co-Ti powder mixtures, on the basis of the aboveexplanations. Thus, alternative explanations for this phenomenon are needed.
Guo and Lu [330] have also reported that amorphous ! nanocrystalline !amorphous transformations could be observed in elemental selenium. Amorphous Se,obtained by melt quenching, was milled in a vibrating ball mill for 30 min, whendiffraction peaks of trigonal Se were detected. At later stages of milling only nano-crystalline (about 15 nm) trigonal Se was detected. On continued milling, theamorphous Se phase started appearing again at 5 h, and the material was completelyamorphous at 10 h. It should be noted that these authors have not continued theseexperiments to demonstrate that crystallization of the amorphous phase takes place onfurther milling.
During MA/MM two different processes can occur. First, the free energy of thesystem can be raised by the accumulation of different types of crystal defects. Second,the free energy can be lowered by activating a phase transformation to a more stablestate (such as crystallization).When the first process is predominant duringMA/MM,the material transforms into a highly defective state and eventually becomes amor-phous. On the other hand, when the second process dominates, a crystalline phasewould become more stable. Thus, the actual phase under the given processingconditions is determined by the interplay between these two competing processes—accumulation of crystal defects and activation of a phase transformation.
It is of interest to note that all the component metals, i.e., Co, Ti, and Se, exhibitallotropic transformations. For example, Co exhibits the fcc! hcp, Ti the hcp! bcc,and Se the trigonal ! monoclinic polymorphic transformations, under equilibriumconditions. Such cyclic transformations have not yet been reported to occur in otheralloy systems. Therefore, it would be instructive to investigate whether such cyclictransformations could be observed in other alloy systems not containing elements thatexhibit polymorphic transformations under equilibrium conditions.
10.7 FORMATION OF ORDERED INTERMETALLICS
Even though intermetallics synthesized by MA include both the ordered and disor-dered types, it is not surprising thatMAproducesmostly the disordered phases. This isbecause MA involves heavy deformation, which is known to destroy long-rangeordering in the lattice [48,331,332; see also Chapter 11]. Among the large number ofintermetallic phases synthesized by MA (Table 10.5) both the disordered and orderedtypes have been reported, even though the proportion of the disordered variety ismuch higher than the ordered type.
In some instances, ordered intermetallics have been found to form directly onMA. This has been shown to be particularly true in Al-rich Al-transition metalsystems. Some examples are Al5Fe2 [159,160], Al3Hf [68], and (Al,X)3Hf where X =Fe or Ni [68], Al3Nb [333], Al3Zr [66–68,72], and (Al,X)3Zr where X = Fe or Ni[72,73].
Reasons for the formation of ordered intermetallics have not been investigatedin detail. It may be assumed that a phase will exist either in the ordered or disorderedcondition depending on the balance between atomic disordering introduced by MA
Chapter 10216

MD: SURYANARAYANA, JOB: 03320, PAGE: 217
4103-X_Suryanarayana_Ch10_R2_080304
and the thermally activated reordering. The reordering is caused by the difference inenergy between the ordered and disordered states. Thus, if this difference in energy issmall the alloy will exist in the disordered state whereas if it is large the alloy will be inthe ordered state. It has been shown that the NiAl compound was produced in theordered state by MA of the blended elemental powder, and upon MM, the orderedNiAl compound continued to be in the ordered state without getting disordered.However, the FeAl phase was found to be in the disordered state both in the as-produced condition by MA and on mechanically milling of the ordered compound[251]. The ordering energy is related and scales up with the enthalpy of formation(DHf). The DHf values for NiAl and FeAl are 72 and 25 kJ/mol, respectively [251],confirming the above argument.
Superconducting compounds such as Nb3Sn [240], YBa2Cu3O7-y [203,293,334–336], MgB2 [337], and others [338–341], including YNi2B2C [342], have also beenprepared byMA.Thus, the capabilities ofMA in synthesizing a variety of intermetallicphases appear unlimited.
10.8 TRANSFORMATION BEHAVIOR OF METASTABLEINTERMETALLIC PHASES
Unlike in rapidly solidified alloys, systematic studies on the transformation behaviorof metastable crystalline phases to the equilibrium phases have not been undertaken indetail in the mechanically alloyed powders. Only a few reports are available. Forexample, the transformation behavior of the L12-type Al3Ti alloy phase produced inAl-25 at% Ti alloys was studied by annealing the powder at different temperatures[66]. The as-milled powder contained the L12 intermetallic and the Al(Ti) solidsolution phases. Annealing of this two-phase mixture at 673 K for 1 h producedanother metastable DO23 phase. The equilibrium DO22 phase was obtained only afterannealing the as-milled powder for 1 h at temperatures higher than 800jC [66] or1000jC [280]. The Al24Ti8 phase was produced on annealing the as-milled powder at800jC [280]. Thus, the transformation sequence of the metastable L12 phase in themechanically alloyed Al3Ti powders may be represented as
Metastable L12 structure ! metastable DO23 structure
! equilibrium DO22 structureð10:7Þ
Figure 10.12 presents the crystal structures of the L12, DO23, andDO22 phases. Itmay be clearly visualized that these crystal structures are closely related to each other.While the L12 phase has a cubic structure, the DO23 and DO22 phases have tetragonalstructures whose lattice parameters for the Al3Ti composition are listed in Table 10.6.From the relation between the lattice parameters of the different crystal structures, itmay be seen that
aDO23iaL12 ; cDO23
i4 aL12 ; ð10:8Þ
and
aDO22iaL12 ; cDO22
i2 aL12 ð10:9Þ
Consequently, it should be relatively easy to transform one crystal structure to theother under nonequilibrium processing conditions such as those obtained duringMA.
Synthesis of Intermetallics 217

Sun et al. [343] investigated the transformation behavior of the metastablephases produced in a mechanically milled Al67Mn8Ti24Nb1 alloy. The starting alloyhad the ordered L12 and DO22 phases, which transformed into the disordered fccsupersaturated solid solution on milling in a planetary ball mill for 15 h. On continuedmilling this supersaturated solid solution transformed into an amorphous phase at 60h. Crystallization occurred on annealing the amorphous alloy. A disordered fcc phase(without any superlattice peaks) started forming on annealing the amorphous alloy for30 min at 420jC, which transformed to the ordered L12 structure on annealing for 30min at 650jC. Simultaneously, diffraction peaks of the equilibrium DO22 phase alsostarted appearing. Fully ordered L12 structure with plenty of DO22 precipitates wasobtained on annealing the sample at 850jC. Even though the temperatures at whichthese transformations occurred were lower during hot-stage electron microscopy
MD: SURYANARAYANA, JOB: 03320, PAGE: 218
4103-X_Suryanarayana_Ch10_R2_080304
Figure 10.12 Crystal structures of the L12, DO23, and DO22 phases.
Table 10.6 Lattice Parameters of the Different Polytypes of the Al3Ti IntermetallicCompound [66]
Lattice parameters
PhaseCrystalstructure
Pearsonsymbol a (nm) c (nm) c/a
L12 Cubic cP4 0.3967 — —DO22 Tetragonal tI8 0.3851 0.8611 2.236DO23 Tetragonal tI16 0.3890 1.6822 4.324
Chapter 10218

MD: SURYANARAYANA, JOB: 03320, PAGE: 219
4103-X_Suryanarayana_Ch10_R2_080304
experiments, the sequence of transformation was identical. Thus, the sequence ofphase transformation could be represented as:
Al67Mn8Ti24Nb1ðL12 þDO22Þ
! MA=16h ! supersaturated solidsolution
! MA=60 h ! amorphous phase
! annealing at 420BC ! disordered fcc solid solution
! annealing at 650BC ! L12 phasewith a small amount of DO22
! annealing at 850BC
ð10:10Þ
The sequence of phase transformations in mechanically alloyed powders ofAl3Ti appears to be related to the lattice stability calculations of Carlsson andMeschter [344], who predicted that the stability of the different phases of Al3Ticomposition increases in the sequence reported above. That is, the DO22 is the moststable structure, the DO23 less stable, and the L12 the least stable under equilibriumconditions. The stability of these phases also appears to be related to the latticemismatches. The lattice mismatch between the Al solid solution and the differentstructures of Al3Ti is calculated using the equation suggested by Zedalis and Fine[345]:
y ¼ 1
32 1� a Al3Xð Þ
a Alð Þ
� �þ cV Al3Xð Þ
a Alð Þ � 1
� �� �ð10:11Þ
where y is the overall mismatch, a is the base lattice parameter, c V= c/4 for the DO23
structure, and c V = c/2 for the DO22 structure. The y values calculated were 2.0, 3.9,and 5.4, respectively for the L12, DO23, andDO22 structures. Since coherency could bemaintained when the y values are small, and also because it is easier to nucleate acoherent precipitate, it has been suggested that the lower coherency is responsible forthe formation of the L12 phase in the mechanically alloyed materials.
The Ti-Al binary phase diagram suggests that the g-TiAl phase is ordered up tothe melting point, i.e., it is a permanently ordered intermetallic (or irreversiblyordered) phase. A phase with an fcc structure is theoretically expected to form if theg-TiAl phase (with the fct structure) were to be disordered, and it was calculated thatthis hypothetical fcc phase should have a lattice parameter of a = 0.402 nm. Therehave been some reports on the possible synthesis of a disordered g-TiAl (fcc) phase byMA of blended elemental powders [89,90,276,346,347]. But a detailed analysis of theXRD patterns and a calculation of the expected intensities for the fcc phase reflectionsclearly show that the fcc phase, formed in mechanically alloyed alloy powders of nearTi-50 at%Al composition and interpreted as the disordered form of the g-TiAl phase,was the contaminant nitride phase referred to earlier [151]. A fine structure analysis ofthe contaminant phase using a combination of techniques (XRD, TEM, laser Ramanspectroscopy, and X-ray photoelectron spectroscopy) also indicated that the fcc phasewas nanocrystalline TiN [348]. It was suggested that MA under ambient atmosphereresults in the dynamic and rapid incorporation of excess nitrogen atoms, far beyondthe solid solubility limits, and leads to the formation of an amorphous phase. This
! L12 phase with a large amount of DO22 precipitates
Synthesis of Intermetallics 219

amorphous phase exhibits a nitride-like interaction with the titanium atoms. Pro-longed milling eventually led to the formation of a nanocrystalline TiN phase.
Whereas the disordered form of g-TiAl is expected to have an fcc structure with 4atoms per unit cell (Pearson symbol: cF4), the contaminant phases have fcc structureswith 8 atoms per unit cell (Pearson symbol: cF8). Accordingly, the intensity ratios ofthe 111 and 200 peaks in the XRD patterns of these two structures are reversed. Thatis, the 111 peak has a higher intensity than the 200 peak in the cF4 structure, while the200 peak has a much higher intensity than the 111 peak in the cF8 structure. Thepossible confusion between the contaminant phases and the disordered form of g-TiAlarises because the contaminant phases also have fcc structures with lattice parametersclose to that expected for the disordered g-TiAl phase (Table 10.7). Furthermore, itshould be noted that the disordered forms of ordered phases have been synthesized byMA only when that phase exists in the phase diagram at higher temperatures, i.e., thephase is reversibly ordered (see Chapter 11 for full details on this aspect). Since this isnot the situation in the Ti-Al system, the disordered form of the g-TiAl phase was notexpected to be produced by MA.
10.9 REFRACTORY COMPOUNDS
Refractory compounds based on metals and metalloids have desirable properties suchas extremely high hardness, high-temperature stability, high thermal conductivity, andgood corrosion resistance. For example, silicides could be used as potential structuralmaterials in the field of microelectronics and electrical technology [349]. In particular,MoSi2 has received considerable attention as a material for high-temperature appli-cations. Its properties include a desirable combination of highmelting point (2020jC),high Young’s modulus (440 GPa), high oxidation resistance in air or in a combustiongas environment, and a relatively low density (6.25 g/cm3) [350]. The refractory com-pounds, especially the carbides and nitrides, are usually synthesized on a commercialscale by direct reaction of the metal with the appropriate ambient at high temperaturesand pressures. This process is carried out under isothermal conditions and the endproduct is often heterogeneous with some unreacted metal being present. Thus, theconventional methods of preparing refractory compounds are time consuming,expensive, and involved. Mechanical alloying has been a one-step successful routein synthesizing these compounds in powder form in an inexpensive and faster way.
MD: SURYANARAYANA, JOB: 03320, PAGE: 220
4103-X_Suryanarayana_Ch10_R2_080304
Table 10.7 Crystal Structure Data of the Hypothetical g-TiAl Fcc Phase and the
Possible Contaminant Phases in Mechanically Alloyed Ti-Al and Ti-Al-Nb Powder Alloys
CompoundPearsonsymbol
Structuretype
Spacegroup
Latticeparameter (nm)
g-TiAl cF4 — — 0.4020y-TiN cF8 NaCl Fm3m 0.4242
H -TiO cF8 NaCl Fm3m 0.4177TiC cF8 NaCl Fm3m 0.4328AlN cF8 NaCl Fm3m 0.4120
NbN cF8 NaCl Fm3m 0.4390
Chapter 10220

Tables 10.8, 10.9, 10.10, and 10.11, respectively, list the borides, carbides, nitrides, andsilicides synthesized by MA.
It is clear from the data presented in these tables that the refractory compoundscould be synthesized by milling the metal powder along with required nonmetalloidsource. For example, the boride phases are synthesized bymilling themetal powders inthe presence of boron or a boron source. Sometimes the boride phase can besynthesized in situ and be dispersed in the metallic matrix. As an example, the TiB2
powder produced by MA can be successfully used in the development of dispersion-strengthened materials, e.g., Al-TiB2 composites [452], since these powder particleshave nanometer dimensions. It is also possible to produce TiB2 dispersions in situ bymilling blended elemental mixtures of Ti, Al, and B [453,454].
The boride phases are not always directly produced byMA. In some cases, suchas in the Fe-B system, MA of iron and boron powder mixture produces either anamorphous phase or a solid solution [353] depending on the milling conditions. Heattreatment of these powders then precipitates the boride phases such as Fe2B and FeB.However, Ruuskanen and Heczko [354] reported that they were able to directlysynthesize FeB by MA.
Detailed investigations were also conducted on the synthesis of carbide phasesby MA. Whereas some carbide phases were synthesized directly by MA, e.g., Al4C3,Fe3C, Fe7C3, etc., an appropriate heat treatment was necessary in other cases. Somephase transformations were also observed on continuedmilling and/or heat treatment.For example, during milling of Fe-25 at%C powders it was noted that the Fe3C phasewas produced after 5 h, whereas a mixture of q-Fe2C and m-Fe2.5C phases was
MD: SURYANARAYANA, JOB: 03320, PAGE: 221
4103-X_Suryanarayana_Ch10_R2_080304
Table 10.8 Synthesis of Boride Phases by Mechanical Alloying
System Phase Comments Ref.
Co-33B Co2B MA (Am) + 500jC 351Co-33 to 50B t-Co2B 352
Co-20 to 50B t-Co2B MA (Am) + HT 102Fe-20B Fe2B MA/400h (a-Fe) +
800jC/2 h353
Fe-20 to 30B Fe2B 354Fe-50B FeB 354Fe-50B FeB 78
Fe3BFe-50B FeB 200 h milling under impact
followed by 30 min ofspark milling
355
Nb-50B NbB 197, 356Nb-67B NbB2 356Ni-B Ni3B 357
Ti-B TiB2 324Ti-66B TiB2 324, 358Ti-67B TiB2 MA/1 h 359
TiO2-B TiB2 MA/25 h + 1050jC 360ZrO2 + B ZrB2 MA/20 h + 100jC 360
Synthesis of Intermetallics 221

MD: SURYANARAYANA, JOB: 03320, PAGE: 222
4103-X_Suryanarayana_Ch10_R2_080304
Table 10.9 Synthesis of Carbide Phases by Mechanical Alloying
System Phase Comments Ref.
Al-C Al4C3 361Al-27.4Fe-28.7C AlFe3C0.5 MA/24 h + 475jC 163
Al-25Fe-25Ti-25C TiC MA/3 h 362Co-C Co3C 361, 363Cr-C Cr3C2 361, 364–366
Cr7C3 365, 366Cr-40 C Cr3C2 20 h in a SPEX
mill + anneal
at 800jC/70 min
366
Cr-30 C Cr7C3 Milled for 192 hin a vibratorymill and 4 h in
a SPEX mill
366
Cr-21.5 C Cr23C6 MA + 800jC/2 h 364, 365Fe-40Al-10V-10C V4C3 (small amount) MA/16 h + heated
to 720jC inthe DSC
367
Fe-17 to 25C Fe3C 368
Fe- 29 to 70C Fe7C3 368Fe-C Fe3C 363Fe-C Fe3C 361
Fe5C2
Fe2CFe7C3
Fe-25 to 33C Fe3C 20 h in Fe-25C 369
15 h in Fe-29C12.5 h in Fe-33C
Fe-25 C Fe3C 5 h 370
Fe-25 C Fe3C MA/100 h + anneal1173 K for 15 min
371
Fe3C (+Cr, Mn,
V, Mo)
Fe3C MA/100 h + anneal
1173 K for 15 min
372
Fe-60 to 70C Fe7C3 373Fe-50C Fe7C3 210 h 374
Fe3C MA/210 h +
500jC/15 min
374
Fe-29C Fe3C 15 h 375Fe-29C HCP phase 20 h 375
Fe-25C q-Fe2C and m Fe2.5C 10 h 370Fe-25C Fe3C 20 h 375Fe-25C HCP phase 40 h 375
Fe-25C Fe3C 140 h 376Fe7C3 285 h
Mn-Al-C 237Mn-C Mn3C 361
Mo-C MoC andMoCx (x < 0.5)
361
Nb-C NbC0.75 and
NbCx(x < 0.5)
361
Chapter 10222

MD: SURYANARAYANA, JOB: 03320, PAGE: 223
4103-X_Suryanarayana_Ch10_R2_080304
Table 10.9 Continued
System Phase Comments Ref.
Nb + graphiteor hexane
NbC 377
Ni-40Al-5Nb-5C NiAl B2, a = 0.2865 nm;
MA/60 h
378
NbCNi-C Ni3C 361, 363
Re-C ReC 361Si-C h-SiC MA/300 h 361, 379–381Si-C SiC >10 h 382
Ti-45Al Ti2AlC MA/200 h +VHP 1173 K/1 h
282
Ti-Al-V-C (Ti,Al,V)C 361Ti-C TiC 361, 381–384
Ti-graphite TiC MA/5 h 385Ti-graphite TiC MA/19.5 h 386Ti-C60 (C70) TiC MA/3 h 385
Ti-50C TiC MA/25 min 387V-C VC and VCx(x<0.5) 361V-30C V2C Only at high-energy
milling
388
V-30C V2C Low-energy millingfor 700 h + anneal
389
V-50C VC Only at high-energymilling
388
V-50C VC Low-energy millingfor 700 h + anneal
389
V-50C VC High energy 390VC Medium energy + anneal 390V2C Low-energy MA
(nano V + am. C)+ anneal
390
V + VC Low-energy MA
(nano V + am. C)+ anneal
390
W-50C WC 391
W-C-Co WC >100 h 392W-C FeW3C and (Fe,W)6C 361W-activated C WC MA/310 h + 1000jC/1 h 393WO3-Mg-C WC 394
Y-Ni-B-C YNi2B2C 395Y + 2Ni + 2B + C YNi2B2C 396Y-Pd-Pt-B-C Y(Pd1-xPtx)2B2C
(0.1 V x V 0.7)
MA + 1273 K/10 min 397
Zr-C ZrC 361
Synthesis of Intermetallics 223

MD: SURYANARAYANA, JOB: 03320, PAGE: 224
4103-X_Suryanarayana_Ch10_R2_080304
Table 10.10 Synthesis of Nitride Phases by Mechanical Alloying
System Phase Comments Ref.
Al AlN In a nitrogen atmosphere 398
B BN MA/140 h in a nitrogen atm + 800jC/1 h 398B BN In a nitrogen or ammonia atmosphere 390B BN (hexagonal,
nanotubes)In anhydrous ammonia. MA/150 h +1300jC/6 h
399
Cr CrN, Cr2N MA/300 h + 800jC/1 h 398Cu Cu3N MA/60 h in N2 atm 398Fe q-Iron nitride In NH3 atm., HT phase 400
Fe s- Fe2N 401Fe Fe4N 401Fe q-Fe3N 402
Fe Fe3N MA of Fe with piperazine (H10C4N2)or pyrazine (H4C4N2)
403
Ga GaN In ammonia atm/300 h 404
Hf HfN 405Hf HfN, cF8,
a = 0.453 nmMA/4 h in a nitrogen flux 406
Mg Mg3N2 N2 atm/60 h 398
Mo Mo2N MA/300 h + 800jC/1 h; N2 atm 398Mo2N Nanostr. + 520jC/72 h; N2 atm 390MoN Nanostr. + 800jC/1 h; N2 atm 390
Mo Mo2N NH3 atm/280 h 390Nb NbN 407Si a-Si3N4 390, 398, 408
Si a-Si3N4 MA + annealing at 1000jC 409Si a-Si3N4 MA/168 h at RT or MA/48 h at
100jC in anhydrous ammonia +anneal at 1100jC
410
Si a-Si3N4 (partial) In ammonia atm MA/160 h +anneal 1200jC
411
Si MA in nitrogen atm + anneal
at 900jC/4 h
412
Ta TaN In a nitrogen atm; MA + 580jC/72 h 390Ta TaN In an ammonia atm., MA + 900jC/24 h 390
Ta Ta2N In an ammonia atm., MA + 450jC/72 h 390Ta-Al (Ta,Al)N and TaN In a nitrogen atm. 413Ti m-Ti2N Super Misuni NEV MA-8/6:1/100 h 87
Ti TiN andTi2N
High- or medium-energy millingLow-energy milling
390
Ti TiN In N2 atm 229, 414–420Ti Ti2N In N2 atm 401
Ti Ti(O,N) 421Ti-5Al Ti(O,N) 421Ti-25Al (Ti,Al)N 419, 420, 422
Ti-50Al (Ti,Al)N In N2 atm 419Ti-50V TiVN0.16 290Ti-50Zr (Ti,Zr)N0.9 423
V VN 398V-30Cu (V0.7Cu0.3)N In N2 atm 424
Chapter 10224

produced after 10 h [370]. Similarly, Wang et al. [374] reported that the Fe7C3 phasewas produced on milling an Fe-50C powder mixture for 210 h in a Uni-Ball mill. Onannealing the above-milled powder for 15 min at 500jC, it transformed into the Fe3Cphase.
As mentioned in Chapter 5, it is possible to change the intensity of milling in aUni-Ball mill by changing the position of the magnets. Thus, one can have high energy(HE), medium energy (ME), or low energy (LE). Calka et al. [390] milled a V-50 at%Cmixture under these three different conditions and observed differences in the nature ofthe final product. At the highest energy of milling, the equiatomic VC was directlyproduced. At intermediate milling energy, a nanostructured phase was produced,which on annealing transformed to the VC phase. At the lowest energy of milling amixture of amorphous carbon and nanostructured vanadium phases was produced,which on heat treatment transformed to the V2C phase. At slightly higher energiesthan the lowest energy, the mixture of amorphous carbon and nanostructuredvanadium transformed to a mixture of vanadium and VC on annealing. Similarly,direct formation of TiN was observed only when milling was conducted at highenergies and not at lower energies; low-energy milling led to the formation of the Ti2Nphase [390], again confirming that ‘‘soft’’milling conditions result in the formation ofmetastable phases.
Several nitride phases have been synthesized by milling pure metals either in anitrogen or ammonia atmosphere. These are listed in Table 10.10. Whereas a majorityof the nitride phases have formed directly by MA, in some cases an additional heattreatment was necessary. For example, nitrides of Al, B, Cu, Fe, Ga, Mg, Nb, Ta, Ti,V, and Zr could be produced directly byMA. In the case of molybdenum, it was notedthat milling in a nitrogen atmosphere produced a nanocrystalline phase, which onannealing for 72 h at 520jC produced a mixture of the Mo and Mo2N phases. Thesame as-milled nanocrystalline phase transformed to a mixture of Mo, MoN, andMo2N on annealing at 800jC for 1 h [390]. A similar situation was reported in thesynthesis of tungsten nitrides by MA [390].
Milling of reactive metals like titanium and zirconium in improperly sealedcontainers always produced the nitride phases. Since a minimal amount of nitrogen isrequired for the formation of the nitride phase, the nitride phase does not form in theinitial stages. Often the nitride contamination phase forms after the formation of anamorphous phase in the titanium and zirconium base alloy systems. The reader isadvised to consult Ref. 151 for a critical discussion of the nitride phase formation inmechanically alloyed titanium alloys.
MD: SURYANARAYANA, JOB: 03320, PAGE: 225
4103-X_Suryanarayana_Ch10_R2_080304
Table 10.10 Continued
System Phase Comments Ref.
W WN and W2N In N2 atm, MA/300 h + 800jC/1 h 398W WN and W2N In NH3 atm, MA (nano) + 1000jC/1 h 390Zr ZrN N2 atm 398, 425
Zr ZrN N2 atm 390, 425Zr ZrN NH3 atm 426
Synthesis of Intermetallics 225

MD: SURYANARAYANA, JOB: 03320, PAGE: 226
4103-X_Suryanarayana_Ch10_R2_080304
Table 10.11 Synthesis of Silicide Phases by Mechanical Alloying
System Phase Structure Comments Ref.
Cr-Si Cr3Si MA/35 h
(Cr-Si) +900jC/4 h
427
Cr-67Si CrSi2 356Fe-25Al-25Si Fe(Al,Si) B2, a =
0.2826 nm
MA/3.5 h 428
FeSi B20, a =0.4490 nm
Fe-Si a-FeSi2 MA + 300jC 429, 430Fe-Si h-FeSi2 500 h 431Fe-Si h-FeSi2 MA/500 h +
973 K/200 h
432
Fe-Si a-FeSi2 430FeSi
Fe-24.5Si Fe3Si DO3, ordered MA/8 h +anneal 1173 K
433
Fe-25 to 50Si FeSi 434Fe-40Si FeSi 354
Mg-Si Mg2Si Cubic, a =0.6359 nm
80, 435, 436
Mn-63
to 65Si
MnSi1.73 MA/50 h +
anneal at 700 K
437
Mo-25Si Mo5Si3 438Mo-37Si Mo5Si3 439
Mo-37.5Si Mo5Si3 115h-MoSi2 MA + 500jC
Mo-38Si Mo5Si3 318, 438Mo-67Si a-MoSi2 SHS reaction
occurred
318, 438
Mo-66.7Si a-MoSi2 MA/6 min 123h-MoSi2 MA/40 min
Mo-66.7Si MoSi2 MA/210 h 440Mo-66.7Si t-MoSi2 SHS at z3 h 441, 442Mo-66.7Si MoSi2 MA + 760jC/24 h 443
Mo-67Si MoSi2(a and h) 439Mo-80Si MoSi2(a and h) 318, 438Mo-Si a-MoSi2 SHS; 14 h 15 min 318
Mo5Si3 100 hNb-16Si Nb3Si 444Nb-35Si a-Nb5Si3 445Nb-45
to 59Si
NbSi2+h-Nb5Si3 446
Nb-37.5Si Nb5Si3 (a, h,and g types)
445, 446
Nb-66.7 Si NbSi2 SHS partly; reactiontakes place abruptlyafter 65 min
197, 323, 356, 446
Ni-Si Ni5Si2 and Ni2Si 200 h 447Ni-25 Si Ni3Si2 439
Chapter 10226

Synthesis of transition metal silicides by MA has attracted a great deal ofattention in recent times. Among the different silicides synthesized,MoSi2 has been thesubject of many investigations because it was found to form in different waysdepending on the milling conditions.
REFERENCES
1. Cahn, R. W. (1989).Metals Mater. Proc. 1:1–19.2. Fleischer,R.L.,Dimiduk,D.M.,Lipsitt,H.A. (1989).Annu.Rev.Mater. Sci. 19:231–263.3. Stoloff, N. S., Sikka, V. K., eds. (1996). Physical Metallurgy and Processing of
Intermetallic Compounds. New York: Chapman & Hall.4. Sauthoff, G. (1996). In: Matucha, K. H., ed. Structure and Properties of Nonferrous
Alloys. Vol. 8 of Materials Science and Technology—A Comprehensive Treatment.Weinheim, Germany: VCH, pp. 643–803.
5. George, E. P., Yamaguchi, M., Kumar, K. S., Liu, C. T. (1994). Annu. Rev. Mater. Sci.24:409–451.
MD: SURYANARAYANA, JOB: 03320, PAGE: 227
4103-X_Suryanarayana_Ch10_R2_080304
Table 10.11 Continued
System Phase Structure Comments Ref.
Ni-33 Si Ni2Si 439Ni-50 Si NiSi 439
Ni-50 Si NiSi MA + 700jC/1 h 94Ni-50 Si NiSi Milling for 400 h under
impact followed by
30 min of sparkmilling
355
Ni-67 Si NiSi2 Fcc 439
Pd-19 Si Pd9Si2 and Pd3Si 448Pd-20 Si Pd3Si 448Ta-66.7 Si TaSi2 446Ti-Si m-TiSi2 (C 49) Fritsch P5/10:1 92, 93
Ti-Si BCC Ball mill/180 h 94Ti-67 Si TiSi2 m-bcc + 800jC/30 min 94Ti-50 Si TiSi 325
Ti-44.4 Si Ti5Si4 325Ti-37.5 Si Ti5Si3 325Ti-37.5 Si Ti5Si3 278, 449
Ti-37 Si Ti5Si3 MA/180 h (Am) +800jC/10 min
94
Ti-Si Ti5Si3, Ti5Si4 450
Ti-Si TiSi, Ti5Si3, Ti5Si4 325V-25 Si V3Si + V5Si3 47V-37.5 Si V5Si3 446V-66.7 Si VSi2 446
W-Si WSi2 MA(W+Si) + HIPl200jC/100MPa/3h
364, 449
W-66.7 Si WSi2 MA/210 h 319
W-66.7 Si WSi2 +W 451
Synthesis of Intermetallics 227

MD: SURYANARAYANA, JOB: 03320, PAGE: 228
4103-X_Suryanarayana_Ch10_R2_080304
6. Westbrook, J. H., Fleischer, R. L., eds. Intermetallic Compounds: Principles and Practice,Vol. 1: Principles (1995), Vol. 2: Practice (1995), and Vol. 3: Progress (2002). Chichester,UK: Wiley.
7. Yamaguchi, M., Umakoshi, Y. (1990). Prog. Mater. Sci. 34:1–148.8. The Materials Research Society Conference Series on High Temperature Ordered Inter-
metallic Alloys I, II, III, etc. These proceedings have been published asMRS ProceedingsI (vol. 39, 1985), II (vol. 81, 1987), III (vol. 133, 1989), IV (vol. 213, 1991), V (vol. 288,1993), VI (vol. 364, 1995), VII (vol. 460, 1997), VIII (vol. 552, 1999), IX (vol. 646, 2001).
9. Proceedings of the series of conferences on Structural and Functional Intermetallics, I(1989), II (1991), III (1994), IV (1997), and V (2000). These proceedings have beenpublished. The first was published as a separate book (High Temperature Aluminidesand Intermetallics, edited by S. H. Whang, C. T. Liu, D. P. Pope, and J. O. Stiegler,
Warrendale, PA: TMS, 1989) and the subsequent ones as special issues of the journalMater. Sci. Eng. A (III, vols. 192–193, 1995; IV, vols. 239–240, 1997; V, vols. 329–331,2002).
10. Schechtman,D., Blech, I., Gratias, D., Cahn, J.W. (1984).Phys. Rev. Lett. 53:1951–1953.11. Sastry, G. V. S., Suryanarayana, C., Van Sande, M., Van Tendeloo, G. (1978). Mater.
Res. Bull. 13:1065–1070.
12. Tsai, A. P., Inoue, A., Masumoto, T. (1987). Jpn. J. Appl. Phys. 26:L1505–1507.13. Suryanarayana, C., Jones, H. (1988). Int. J. Rapid Solid. 3:253–293.14. Kelton, K. F. (1993). Int. Mater. Rev. 38:105–137.
15. Series of articles on different aspects of quasicrystals in MRS Bull. 22(11):34–72.16. Dubois, J. -M., Thiel, P. A., Tsai, A. P., Urban, K., eds. (1999). Quasicrystals: Prep-
aration, Properties and Applications,MRS Symp. Proc. Vol. 553. Warrendale, PA:Mater.Res. Soc.
17. Suck, J. -B., Schreiber, M., Haussler, P. (2002). Quasicrystals: An Introduction to theStructure, Physical Properties, and Applications. New York: Springer-Verlag (Vol. 55 ofSpringer Series in Materials Science).
18. Dubois, J. -M. (2001). J. Phys. C: Condens. Matter 13:7753–7762.19. Eckert, J., Schultz, L., Urban, K. (1989). Appl. Phys. Lett. 55:117–119.20. Ivanov, E., Konstanchuk, I. G., Bokhonov, B. D., Boldyrev, V. V. (1989).Reactiv. Solids
7:167–172.21. Eckert, J. (1992).Mater. Sci. For. 88–90:679–686.22. Barua, P., Srinivas, V., Murty, B. S. (2000). Phil. Mag. A80:1207–1217.23. Nasu, S., Miglierini, M., Ishihara, K. N., Shingu, P. H. (1992). J. Phys. Soc. Jpn. 61:
3766–3772.24. Asahi, N., Maki, T., Matsumoto, S., Sawai, T. (1994).Mater. Sci. Eng. A181/182:841–
844.
25. Salimon, A. I., Korsunsky, A. M., Kaloshkin, S. D., Tcherdyntsev, V. V., Shelekhov, E.V., Sviridova, T. A. (2001).Mater. Sci. For. 360–362:137–142.
26. Barua, P., Murty, B. S., Srinivas, V. (2001).Mater. Sci. Eng. A304–306:863–866.
27. Eckert, J., Schultz, L., Urban, K. (1990). Z. Metallkde. 81:862–868.28. Bahadur, D., Singh, K., Roy, M. (1992).Mater. Sci. Eng. A154:79–84.29. Politis, C., Krauss, W., Leitz, H., Schommers, W. (1989).Mod. Phys. Lett. 3:615–618.
30. Asahi, N., Noguchi, S., Matsumura, K. (1994).Mater. Sci. Eng. A181/182:819–822.31. Schurack, F., Borner, I., Eckert, J., Schultz, L. (1999).Mater. Sci. For. 312–314:49–54.32. Roy, M., Singh, K., Bahadur, D. (1992). J. Mater. Sci. Lett. 11:858–861.33. Meyer, M., Mendoza-Zelis, L., Sanchez, F. H. (1995).Mater. Sci. For. 179–181:177–182.
34. Asahi, N. (1997).Mater. Sci. Eng. A226:67–69.35. Ivanov, E. Yu., Konstanchuk, I. G., Bokhonov, B. D., Boldyrev, V. V. (1989). Doklady
Phys. Chem. 304(1–3):82–85.
36. Ivanov, E., Bokhonov, B., Konstanchuk, I. (1991). J. Jpn. Soc. Powder Powder Metall.38:903–905.
Chapter 10228

MD: SURYANARAYANA, JOB: 03320, PAGE: 229
4103-X_Suryanarayana_Ch10_R2_080304
37. Takeuchi, T., Yamada, Y., Fukunaga, T., Mizutani, U. (1994).Mater. Sci. Eng. A181/182:828–832.
38. Ivanov, E., Bokhonov, B., Konstanchuk, I. (1991). J. Mater. Sci. 26:1409–1411.
39. Ivanov, E., Bokhonov, B., Konstanchuk, I., Boldyrev, V. V. (1993). In: deBarbadillo, J.J., et al., eds.Mechanical Alloying for Structural Applications. Materials Park, OH: ASMInternational, pp. 421–424.
40. Bokhonov, B., Konstanchuk, I., Ivanov, E., Boldyrev, V. V. (1992). J. Alloys Compounds187:207–214.
41. Bokhonov, B. B., Ivanov, E. Y., Tolochko, B. P., Sharaphutdinov, M. P. (2000).Mater.
Sci. Eng. A278:236–241.42. Bahadur, D., Dunlap, R. A., Foldeaki, M. (1996). J. Alloys Compounds 240:278–284.43. Takasaki, A., Han, C. H., Furuya, Y., Kelton, K. F. (2002). Phil. Mag. Lett. 82:353–361.
44. Konstanchuk, I. G., Ivanov, E. Yu., Bokhonov, B. B., Boldyrev, V. V. (2001). J. AlloysCompounds 319:290–295.
45. Suryanarayana, C., Ivanov, E., Noufi, R., Contreras, M. A., Moore, J. J. (1999). J.Mater. Res. 14:377–383.
46. Gerasimov, K. B., Gusev, A. A., Ivanov, E. Y., Boldyrev, V. V. (1991). J. Mater. Sci.26:2495–2500.
47. Liu, L., Casadio, S., Magini, M., Nannetti, C. A., Qin, Y., Zheng, K. (1997).Mater. Sci.
For. 235–238:163–168.48. Bakker, H., Zhou, G. F., Yang, H. (1995). Prog. Mater. Sci. 39:159–241.49. Suryanarayana, C. (2001). Prog. Mater. Sci. 46:1–184.
50. Zhang, F. X., Wang, W. K. (1996). J. Alloys Compounds 240:256–260.51. Schulz, R., Trudeau, M. L., Dussault, D., Van Neste, A. (1990). In: Yavari, A. R., Desre,
P., eds. Multilayer Amorphisation by Solid State Reaction and Mechanical Alloying. J.
Physique 51(C4)Suppl 14:259–264.52. McDermott, B. T., Koch, C. C. (1986). Scripta Metall. 20:669–672.53. Martelli, S., Mazzone, G., Scaglione, S., Vittori, M. (1988). J. Less Common Metals
145:261–270.
54. Pabi, S. K., Joardar, J., Murty, B. S. (1996). J. Mater. Sci. 31:3207–3211.55. Atzmon, M. (1990). Phys. Rev. Lett. 64:487–490.56. Takacs, L. (2002). Prog. Mater. Sci. 47:355–414.
57. Moore, J. J., Feng, H. J. (1995). Prog. Mater. Sci. 39:243–316.58. Anantharaman, T. R., Suryanarayana, C. (1971). J. Mater. Sci. 6:1111–1135.59. Anantharaman, T. R., Ramachandrarao, P., Suryanarayana, C., Lele, S., Chattopad-
hyay, K. (1977). Trans. Indian Inst. Metals 30:423–448.60. Rawers, J. C., Doan, R. C. (1994).Metall. Mater. Trans. 25A:381–388.61. Rawers, J., Govier, D., Cook, D. (1995). Scripta Metall. Mater. 32:1319–1324.62. Yvon, P. J., Schwarz, R. B. (1993). In: deBarbadillo, J. J., et al., eds.Mechanical Alloying
for Structural Applications. Materials Park, OH: ASM International, pp. 421–424.63. Chattopadhyay, K., Wang, X.-M., Aoki, K., Masumoto, T. (1996). J. Alloys Compounds
232:224–231.
64. Martelli, S., Mazzone, G., Vittori-Antisari, M. (1991). J. Mater. Res. 6:499–504.65. Li, F., Ishihara, K. N., Shingu, P. H. (1991).Metall. Trans. 22A:2849–2854.66. Srinivasan, S., Desch, P. B., Schwarz, R. B. (1991). Scripta Metall. Mater. 25:2513–
2516.67. Schwarz, R. B., Desch, P. B., Srinivasan, S. (1993). In: deBarbadillo, J. J., et al., eds.
MechanicalAlloying forStructuralApplications.Materials Park,OH:ASMInternational,
pp. 227–235.68. Li, W., Suryanarayana, C., Froes, F. H. (1995). In: Phillips, M. A., Porter, J., eds.
Advances in Powder Metallurgy and Particulate Materials. Part I. Princeton, NJ: MetalPowder Industries Federation, pp. 145–157.
69. Suryanarayana, C., Sundaresan, R. (1991).Mater. Sci. Eng. A131:237–242.
Synthesis of Intermetallics 229

70. Lee, K.M., Yang, H. U., Lee, J. S., Kim, S. S., Ahn, I. S., Park,M.W. (2000).Mater. Sci.For. 343–346:314–319.
71. Klassen, T., Oehring, M., Bormann, R. (1994). J. Mater. Res. 9:47–52.
72. Suryanarayana, C., Li, W., Froes, F. H. (1994). Scripta Metall. Mater. 31:1465–1470.73. Li, W., Suryanarayana, C., Froes, F. H. (1995). In: Froes, F. H., Suryanarayana, C.,
Ward-Close, C. M., eds. Synthesis/Processing of Lightweight Metallic Materials. War-
rendale, PA: TMS, pp. 203–213.74. Tanaka, T., Ishihara, K. N., Shingu, P. H. (1992).Metall. Trans. 23A:2431–2435.75. Sherif El-Eskandarany,M., Aoki, K., Sumiyama,K., Suzuki, K. (1997).Appl. Phys. Lett.
70:1679–1681.76. Aoki, K., Sherif El-Eskandarany, M., Sumiyama, K., Suzuki, K. (1998).Mater. Sci. For.
269–272:119–126.
77. Sherif El-Eskandarany, M., Aoki, K., Sumiyama, K., Suzuki, K. (2002). Acta Mater.50:1113–1123.
78. Barinov, V. A., Tsurin, V. A., Elsukov, E. P., Ovechkin, L. V., Dorofeev, G. A.,Ermakov, A. E. (1992). Phys. Metals Metallogr. 74(4):412–415.
79. Lu, L., Lai, M. O., Toh, Y. H., Froyen, L. (2002).Mater. Sci. Eng. A334:163–172.80. Clark, C. R., Wright, C., Suryanarayana, C., Baburaj, E. G., Froes, F. H. (1997).Mater.
Lett. 33:71–75.
81. Kenik, E. A., Bayuzick, R. J., Kim, M. S., Koch, C. C. (1987). Scripta Metall. 21:1137–1142.
82. Cardellini, F., Mazzone, G., Montone, A., Vittori-Antisari, M. (1994). Acta Metall.
Mater. 42:2445–2451.83. Ahn, J. H.,Wang,G.X., Liu,H.K.,Dou, S. X. (2001).Mater. Sci. For. 360–362:595–602.84. Balaz, P., Ohtani, T. (2000).Mater. Sci. For. 343–346:389–392.
85. Balaz, P., Takacs, L., Ohtani, T.,Mack, D. E., Boldizarova, E., Soika, V., Achimovicova,M. (2002). J. Alloys Compounds 337:76–82.
86. Chitralekha, J., Raviprasad, K., Gopal, E. S. R., Chattopadhyay, K. (1995). J. Mater.Res. 10:1897–1904.
87. Sherif El-Eskandararany, M., Sumiyama, K., Aoki, K., Suzuki, K. (1992). J.Mater. Res.7:888–893.
88. Burgio, N., Guo,W.,Martelli, S., Magini,M., Padella, F., Soletta, I. (1990). In: Froes, F.
H., deBarbadillo, J. J., eds. Structural Applications of Mechanical Alloying. MaterialsPark, OH: ASM International, pp. 175–183.
89. Guo,W.,Martelli, S., Burgio, N.,Magini,M., Padella, F., Paradiso, E., Soletta, I. (1991).
J. Mater. Sci. 26:6190–6196.90. Guo, W., Iasonna, A., Magini, M., Martelli, S., Padella, F. (1994). J. Mater. Sci. 29:
2436–2444.91. Bououdina, M., Guo, Z. X. (2002).Mater. Sci. Eng. A332:210–222.
92. Oehring, M., Yan, Z. H., Klassen, T., Bormann, R. (1992). Phys. Stat. Sol. (a)131: 671–689.
93. Yan, Z. H., Oehring, M., Bormann, R. (1992). J. Appl. Phys. 72:2478–2487.
94. Radlinski, A. P., Calka, A. (1991).Mater. Sci. Eng. A134:1376–1379.95. Biswas, A., Dey, G. K., Haq, A. J., Bose, D. K., Banerjee, S. (1996). J. Mater. Res.
11:599–607.
96. Tonejc, A., Stubicar, M., Tonejc, A. M., Kosanovic, K., Subotic, B., Smit, I. (1994). J.Mater. Sci. Lett. 13:519–520.
97. Jiang, J. Z., Mørup, S., Linderoth, S. (1996).Mater. Sci. For. 225–227:489–496.
98. Kostic, E., Kiss, S., Boskovic, S., Zec, S. (1997). Powder Tech. 91:49–54.99. Huang, J. Y., Wu, Y. K., Ye, H. Q. (1996). Acta Mater. 44:1201–1209.100. Huang, J.Y.,Wu,Y.D.,Wu,Y.K., Li,D.X.,He,Y.Q. (1997). J.Mater.Res. 12:936–946.101. Sui, H. X., Zhu, M., Qi, M., Li, G. B., Yang, D. Z. (1992). J. Appl. Phys. 71:2945–2949.
MD: SURYANARAYANA, JOB: 03320, PAGE: 230
4103-X_Suryanarayana_Ch10_R2_080304
Chapter 10230

102. Corrias, A., Ennas, G., Marongiu, M., Musinu, A., Paschina, G. (1993). J. Mater. Res.8:1327–1333.
103. Huang, J. Y., Wu, Y. K., He, A. Q., Ye, H. Q. (1994). Nanostructured Mater. 4:293–302.
104. Di, L. M., Zhou, G. F., Bakker, H. (1993). Phys. Rev. B47:4890–4895.105. Takacs, L. (1993). Nanostructured Mater. 2:241–249.106. Ohtani, T., Motoki, M., Koh, K., Ohshima, K. (1995).Mater. Res. Bull. 30:1495–1504.
107. Gaffet, E., Michel, D., Mazerolles, L., Berthet, P. (1997).Mater. Sci. For. 235–238:103–108.
108. Han, S. H., Gshneidner, K. A., Beaudry, B. J. (1991). Scripta Metall. Mater. 25:295–298.
109. Barinov, V. A., Dorofeev, G. A., Ovechkin, L. V., Elsukov, E. P., Ermakov, A. E. (1991).Phys. Stat. Sol. (a)123:527–534.
110. Balogh, J., Bujdoso, L., Faigel, Gy, Granasy, L., Kemeny, T., Vincze, I., Szabo, S.,
Bakker, H. (1993). Nanostructured Mater. 2:11–18.111. Barinov, V. A., Dorofeev, G. A., Ovechkin, L. V., Elsukov, E. P., Ermakov, A. E. (1992).
Phys. Metals Metallogr. 73(1):93–96.112. Foct, J., de Figueiredo, R. S. (1994). Nanostructured Mater. 4:685–697.
113. Matteazzi, P., Le Caer, G. (1991).Mater. Sci. Eng. A149:135–142.114. Jiang, J. Z., Gerward, L., Mørup, S. (1999).Mater. Sci. For. 312–314:115–120.115. Kosmac, T., Courtney, T. H. (1992). J. Mater. Res. 7:1519–1525.
116. Wu, E., Campbell, S. J., Kaczmarek, W. A., Hoffmann, M., Kennedy, S. J., Studer, A. J.(1999).Mater. Sci. For. 312–314:121–126.
117. Torres Sanchez, R. M. (1996). J. Mater. Sci. Lett. 15:461–462.
118. Sorescu, M. (1998). J. Mater. Sci. Lett. 17:1059–1061.119. Balaz, P., Takacs, L., Jiang, J. Z., Soika, V., Luxova, M. (2002). Mater. Sci. For.
386–388:257–262.
120. Tokumitsu, K., Wada, M. (2002).Mater. Sci. For. 386–388:473–478.121. Chen, Y., Williams, J. S., Wang, G. M. (1996). J. Appl. Phys. 79:3956–3962.122. Bart, J. C. J. (1993). J. Mater. Sci. 28:278–284.123. Bokhonov, B. B., Konstanchuk, I. G., Boldyrev, V. V. (1995). J. Alloys Compounds
218:190–196.124. Urretavizcaya, G., Meyer, G. O. (2002). J. Alloys Compounds 339:211–215.125. Schilz, J., Riffel, M., Pixius, K., Meyer, H. J. (1999). Powder Technol. 105:149–154.
126. Chattopadhyay, P. P., Pabi, S. K.,Manna, I. (2001).Mater. Sci. Eng.A304–306:424–428.127. Khelifati, G., Le Breton, J. M., Teillet, J. (2000).Mater. Sci. For. 343–346:344–350.128. Alonso, T., Liu, Y., Parks, T. C., McCormick, P. G. (1991). Scripta Metall. Mater.
25:1607–1610.129. Datta, M. K., Pabi, S. K., Murty, B. S. (2000). J. Mater. Res. 15:1429–1432.130. Zhou, G. F., Di, L. M., Bakker, H. (1993). J. Appl. Phys. 73:1521–1527.131. Yang, X. Y., Wu, Y. K., Ye, H. Q. (2000). Phil. Mag. Lett. 80:333–339.
132. Yang, X. Y., Wu, Y. K., Ye, H. Q. (2001). J. Mater. Sci. Lett. 20:1517–1518.133. Mashimo, T., Tashiro, S. (1994). J. Mater. Sci. Lett. 13:174–176.134. Chaudhuri, J., Ram, M. L., Sarkar, B. K. (1994). J. Mater. Sci. 29:3484–3488.
135. Millet, P., Hwang, T. (1996). J. Mater. Sci. 31:351–355.136. Sen, S., Ram, M. L., Roy, S., Sarkar, B. K. (1999). J. Mater. Res. 14:841–848.137. Girot, T., Devaux, X., Begin-Colin, S., Le Caer, G., Mocellin, A. (2001). Phil. Mag.
A81:489–499.138. Ivanov, E., Sumiyama, K., Yamauchi, H., Suzuki, K. (1993). Solid State Ionics 59:
175–177.
139. Ivanov, E., Sumiyama, K., Yamauchi, H., Suzuki, K. (1993). J. Alloys Compounds192:251–252.
140. Liu, Z. T., Uwakweh, O. N. C. (1996). J. Mater. Res. 11:1665–1672.141. Michel, D., Faudot, F., Gaffet, E., Mazerolles, L. (1993). Rev. Metall.-CIT 219–225.
MD: SURYANARAYANA, JOB: 03320, PAGE: 231
4103-X_Suryanarayana_Ch10_R2_080304
Synthesis of Intermetallics 231

142. Tonejc, A. M., Tonejc, A. (1996).Mater. Sci. For. 225–227:497–502.143. Qi, M., Fecht, H. J. (1998).Mater. Sci. For. 269–272:187–191.144. Bailey, J. E. (1972). J. Br. Ceram. Soc. 71:25.
145. Tonejc, A., Duzevic, D., Tonejc, A. M. (1991).Mater. Sci. Eng. A134:1372–1375.146. Tonejc, A., Tonejc, A. M., Duzevic, D. (1991). Scripta Metall. Mater. 25:1111–1113.147. Garvie, R. J. (1965). J. Phys. Chem. 69:1238.
148. Maurice, D. R., Courtney, T. H. (1990).Metall. Trans. 21A:289–303.149. Davis, R. M., McDermott, B., Koch, C. C. (1988).Metall. Trans. A19:2867–2874.150. Alonso, T., Liu, Y., Parks, T. C., McCormick, P. G. (1992). Scripta Metall. Mater.
26:1931–1932.151. Suryanarayana, C. (1995). Intermetallics 3:153–160.152. Paruchuri, M. R., Zhang, D. L., Massalski, T. B. (1994).Mater. Sci. Eng.A174:119–125.
153. Ohtani, T., Maruyama, K., Ohshima, K. (1997).Mater. Res. Bull. 32:343–350.154. Angeles-Islas, J. (2002).Mater. Sci. For. 386–388:217–222.155. Makhlouf, S. A., Ivanov, E., Sumiyama, K., Suzuki, K. (1992). J. Alloys Compounds
189:117–121.
156. Guerro-Paz, J., Robles-Hernandez, F. C.,Martınez-Sanchez, R.,Hernandez-Silva, F.D.,Jaramillio-Viguera, D. (2001).Mater. Sci. For. 360–362:317–322.
157. Polkin, I. S., Kaputkin, E.Ya, Borzov, A. B. (1990). In: Froes, F. H., deBarbadillo, J. J.,
eds. Structural Applications of Mechanical Alloying. Materials Park, OH: ASM Inter-national, pp. 251–256.
158. Fadeeva, V. I., Portnoy, V. K., Baldokhin, Y. V., Kotchetov, G. A., Matyja, H. (1999).
Nanostructured Mater. 12:625–628.159. Cardellini, F., Contini, V., Mazzone, G., Montone, A. (1997). Phil. Mag. B76:629–638.160. Mukhopadhyay, D. K., Suryanarayana, C., Froes, F. H. (1994). Scripta Metall. Mater.
31:333–338.161. Morris, M. A., Morris, D. G. (1992).Mater. Sci. For. 88–90:529–535.162. Morris, M. A., Morris, D. G. (1991).Mater. Sci. Eng. A136:59–70.163. Zhang, D. L., Adam, G., Ammundsen, B. (2002). J. Alloys Compounds 340:226–230.
164. Portnoy, V. K., Leonov, A. V., Fadeeva, V. I., Matyja, H. (1998). Mater. Sci. For.269–272:69–74.
165. Krasnowski, M., Matyja, H. (2000).Mater. Sci. For. 343–346:302–307.
166. Burzynska-Szyszko, M., Fadeeva, V. I., Matyja, H. (1997). Mater. Sci. For. 235–238:97–102.
167. Zhang, D. L., Massalski, T. B., Paruchuri, M. R. (1994). Metall. Mater. Trans. 25A:
73–79.168. LeBrun, P., Froyen, L., Delaey, L. (1990). In: Froes, F. H., deBarbadillo, J. J., eds.
Structural Applications ofMechanical Alloying. Materials Park, OH: ASM International,pp. 155–161.
169. Zdujic, M., Kobayashi, K. F., Shingu, P. H. (1990). Z. Metallkde. 81:380–385.170. Zdujic, M., Poleti, D., Karanovie, Lj, Kobayashi, K. F., Shingu, P. H. (1994).Mater. Sci.
Eng. A185:77–86.
171. Peng, Z., Suryanarayana, C., Froes, F. H. (1993). In: deBarbadillo, J. J., et al., eds.Mechanical Alloying for Structural Applications. Materials Park, OH: ASM Interna-tional, pp. 335–341.
172. Hellstern, E., Schultz, L., Bormann, R., Lee, D. (1988). Appl. Phys. Lett. 53:1399–1401.173. Kaneyoshi, T., Takahashi, T., Hayashi, Y., Motoyama, M. (1992). In: Capus, J. M.,
German, R. M., eds. Advances in Powder Metallurgy and Particulate Materials. Vol. 7.
Princeton, NJ: Metal Powder Industries Federation, pp. 421–429.174. Kim, D. K., Okazaki, K. (1992).Mater. Sci. For. 88–90:553–560.175. Kawanishi, S., Ionishi, K., Okazaki, K. (1993).Mater. Trans. Jpn. Inst. Metals 34:43–48.176. Peng, Z., Suryanarayana, C., Froes, F. H. (1996).Metall. Mater. Trans. 27A:41–48.
MD: SURYANARAYANA, JOB: 03320, PAGE: 232
4103-X_Suryanarayana_Ch10_R2_080304
Chapter 10232

177. Ivanov, E., Golubkova, G. V., Grigorieva, T. F. (1990). Reactiv. Solids 8:73–76.178. Ivanov, E., Makhlouf, S. A., Sumiyama, K., Yamauchi, H., Suzuki, K., Golubkova, G.
V. (1992). J. Alloys Compounds 185:25–34.
179. Benameur, T., Inoue, A., Masumoto, T. (1994). Nanostructured Mater. 4:303–322.180. Schultz, L., Hellstern, E., Zorn, Z. (1988). Z. Phys. Chem. 157:203–210.181. Liu, Z. G., Guo, J. T., Hu, Z. Q. (1995).Mater. Sci. Eng. A192/193:577–582.
182. Itsukaichi, T., Norimatsu, T., Umemoto, M., Okane, I., Wu, B.-Y. (1992). In: Tamura,I., ed. Heat and Surface’92. Tokyo, Japan: Japan Tech. Info. Center, pp. 305–308.
183. Xu, Y., Makhlouf, S. A., Ivanov, E., Wakoh, K., Sumiyama, K., Suzuki, K. (1994).
Nanostructured Mater. 4:437–444.184. Uenishi, K., Kobayashi, K. F., Ishihara, K. N., Shingu, P. H. (1992). Mater. Sci. For.
88–90:453–458.
185. Sa Lisboa, R. D., Perdigao, M. N. R. V., Kiminami, C. S., Botta F, W. J. (2002).Mater.Sci. For. 386–388:59–64.
186. Lerf, R., Morris, D. G. (1990).Mater. Sci. Eng. A128:119–127.187. Zhang, L. P., Shi, J., Zin, J. Z. (1994).Mater. Lett. 21:303–306.
188. Mukhopadhyay, D. K., Suryanarayana, C., Froes, F. H., Yolton, C. F. (1993). In:deBarbadillo, J. J., et al., eds.Mechanical Alloying for Structural Applications. MaterialsPark, OH: ASM International, pp. 131–138.
189. Chen, G. H., Suryanarayana, C., Froes, F. H. (1993). In: deBarbadillo, J. J., et al., eds.Mechanical Alloying for Structural Applications. Materials Park, OH: ASM Interna-tional, pp. 367–375.
190. Ahn, J. H., Lee, K. Y. (1995).Mater. Trans. Jpn. Inst. Metals 36:297–304.191. Avvakumov, E. G., Karakchiev, L. G., Gusev, A. A., Vinokurova, O. B. (2002).Mater.
Sci. For. 386–388:245–250.
192. Welham, N. J. (1998). J. Mater. Res. 13:1607–1613.193. Chou, T. C., Nieh, T. G., Wadsworth, J. (1992). Scripta Metall. Mater. 27:881–886.194. Garcıa-Pacheco, G., Cabanas-Moreno, J. G., Cruz-Gandarilla, F., Yee-Madeira, H.,
Umemoto, M. (2002).Mater. Sci. For. 386–388:281–286.
195. Lopez Hirata, V. M., Juarez Martinez, U., Cabanas-Moreno, J. G. (1995). Mater. Sci.For. 179–181:261–266.
196. Sherif El-Eskandarany, M., Aoki, K., Sumiyama, K., Suzuki, K. (1997). Scripta Mater.
36:1001–1009.197. Morris, M. A., Morris, D. G. (1990). In: Yavari, A. R., Desre, P., eds. Multilayer
Amorphisation by Solid-State Reaction and Mechanical Alloying. Vol. 51. Colloq. C4.,
Suppl. 14. Les Ulis Cedex, France: Les editions de Physique, pp. 211–217.198. Xi, S., Zhou, J., Zhang, D., Wang, X. (1996).Mater. Lett. 26:245–248.199. Kim, K. J., Sherif El-Eskandarany, M., Sumiyama, K., Suzuki, K. (1993). J. Non-Cryst.
Solids 155:165–170.
200. Kim, K. J., Sumiyama, K., Suzuki, K. (1994). J. Non-Cryst. Solids 168:232–240.201. Kis-Varga, M., Beke, D. L. (1996).Mater. Sci. For. 225–227:465–470.202. Ivanov, E. Y., Grigorieva, T. F. (1997). Solid State Ionics 101–103:235–241.
203. Mizutani, U., Imaeda, C., Murasaki, S., Fukunaga, T. (1992). Mater. Sci. For.88–90:415–422.
204. Cardellini, F., Contini, V., Mazzone, G., Vittori, M. (1993). Scripta Metall. Mater.
28:1035–1038.205. Fair, G. H., Wood, J. V. (1994). J. Mater. Sci. 29:1935–1939.206. Bonetti, E., Scipione, G., Valdre, G., Cocco, G., Frattini, R., Macri, P. P. (1993). J. Appl.
Phys. 74:2053–2057.207. Fair, G. H., Wood, J. V. (1993). Powder Metall. 36:123–128.208. Wolski, K., Le Caer, G., Delcroix, P., Fillit, R., Thevenot, F., Le Coze, J. (1996).Mater.
Sci. Eng. A207:97–104.
MD: SURYANARAYANA, JOB: 03320, PAGE: 233
4103-X_Suryanarayana_Ch10_R2_080304
Synthesis of Intermetallics 233

209. Hashii, M. (1999).Mater. Sci. For. 312–314:139–144.210. Liu, Z. G., Guo, J. T., He, L. L., Hu, Z. Q. (1994). Nanostructured Mater. 4:787–794.211. Oleszak, D., Matyja, H. (2000).Mater. Sci. For. 343–346:320–325.
212. Elkalkouli, R., Grosbras, M., Dinhut, J. F. (1995). Nanostructured Mater. 5:733–743.213. Gonzalez, G., Sagarzazu, A., Villalba, R., Ochoa, J., D’Onofrio, L. (2001).Mater. Sci.
For. 360–362:355–360.
214. Goya, G. F. (2002).Mater. Sci. For. 386–388:491–496.215. Balaz, P.,Bastl,Z.,Havlık,T.,Lipka, J.,Toth, I. (1997).Mater.Sci. For.235–238:217–222.216. Pan, C. W., Hung, M. P., Chang, Y. H. (1994).Mater. Sci. Eng. A185:147–152.
217. Yelsukov, E. P., Dorofeev, G. A., Barinov, V. A., Grigorieva, T. F., Boldyrev, V. V.(1998).Mater. Sci. For. 269–272:151–156.
218. Ruuskanen, P. (1998).Mater. Sci. For. 269–272:139–144.
219. Trudeau, M. L., Schulz, R., Zaluski, L., Hosatte, S., Ryan, D. H., Doner, C. B., Tessier,P., Strom-Olsen, J. O., Van Neste, A. (1992).Mater. Sci. For. 88–90:537–544.
220. Oleszak, D., Jachimowicz, M., Matyja, H. (1995).Mater. Sci. For. 179–181:215–218.221. Burgio, N., Iasonna, A., Magini, M., Martelli, S., Padella, F. (1991). Il Nuovo Cimento
13D:459–476.222. Alonso, T., Liu, Y., McCormick, P. G. (1992). J. Mater. Sci. Lett. 11:164–166.223. Arcos, D., Rangavittal, N., Vazquez, M., Vallet-Regı, M. (1998). Mater. Sci. For.
269–272:87–92.224. Sepelak, V., Rogachev, A.Yu, Steinike, U., Uecker, D-Chr, Krumeich, F.,Wissmann, S.,
Becker, K. D. (1997).Mater. Sci. For. 235–238:139–144.
225. Al-Hajry, A., Al-Assiri,M., Enzo, S., Hefner, J., Al-Heniti, S., Cowlam,N., Al-Shahrani,A. (2001).Mater. Sci. For. 360–362:343–348.
226. Thompson, J. R., Politis, C., Kim, Y. C. (1988).Mater. Sci. Eng. 97:31–34.
227. Ivanov, E., Grigorieva, T. F. (1998).Mater. Sci. For. 269–272:241–246.228. Takai, S., Moriyama, M., Esaka, T. (1998).Mater. Sci. For. 269–272:93–98.229. Chen, Y., Williams, J. S. (1996).Mater. Sci. For. 225–227:881–888.230. Gennari, F. C., Castro, F. J., Urretavizcaya, G. (2001). J. Alloys Compounds 321:
46–53.231. Bobet, J.-L., Chevalier, B., Song, M. Y., Darriet, B., Etourneau, J. (2002). J. Alloys
Compounds 336:292–296.
232. Hwang, S., Nishimura, C. (2002).Mater. Sci. For. 386–388:615–620.233. Chen, J., Takeshita, H. T., Chartouni, D., Kuriyama, N., Sakai, T. (2001). J. Mater. Sci.
36:5829–5834.
234. Ruggeri, S., Lenain, C., Roue, L., Liang, G., Huot, J., Schulz, R. (2002). J. AlloysCompounds 339:195–201.
235. Chen, J., Dou, S. X., Liu, H. K. (1996). J. Alloys Compounds 244:184–189.236. Ahn, J. H., Kim, Y. J., Choi, C. J. (2002).Mater. Sci. For. 386–388:609–614.
237. Crew, D. C., McCormick, P. G., Street, R. (1995). Scripta Metall. Mater. 32:315–318.238. Wee, L., McCormick, P. G., Street, R. (1999). Scripta Mater. 40:1205–1208.239. Chernenko, V. A., Wee, L., McCormick, P. G., Street, R. (2000). J. Mater. Sci. 35:
613–616.240. Larson, J. M., Luhman, T. S., Merrick, H. F. (1977). In: Meyerhoff, R. W., ed.Manu-
facture of Superconducting Materials. Materials Park, OH: ASM International, pp. 155–
163.241. Tracy, M. J., Groza, J. R. (1992). Nanostructured Mater. 1:369–378.242. Groza, J. R., Tracy, M. J. H. (1993). In: deBarbadillo, J. J., et al., eds. Mechanical
Alloying for Structural Applications. Materials Park, OH: ASM International, pp. 327–334.
243. Portnoy, V. K., Tretjakov, K. V., Streletskii, A. N., Berestetskaya, I. V. (2000).Mater.Sci. For. 343–346:453–458.
MD: SURYANARAYANA, JOB: 03320, PAGE: 234
4103-X_Suryanarayana_Ch10_R2_080304
Chapter 10234

244. Pabi, S. K., Murty, B. S. (1996).Mater. Sci. Eng. A214:146–152.245. Tomasi, R., Pallone, E. M. J. A., Botta F., W. J. (1999). Mater. Sci. For. 312–314:
333–338.
246. Portnoy, V. K., Blinov, A. M., Tomilin, I. A., Kuznetsov, V. N., Kulik, T. (2002). J.Alloys Compounds 336:196–201.
247. Esaki, H., Tokizane, M. (1992).Mater. Sci. For. 88–90:625–630.
248. Ochiai, S., Shirokura, T., Doi, Y., Kojima, Y. (1991). ISIJ Int. 31:1106–1112.249. Lu, L., Lai, M. O., Zhang, S. (1994).Mater. Design 15:79–86.250. Lu, L., Lai, M. O., Zhang, S. (1995). J. Mater. Proc. Technol. 48:683–690.
251. Schropf, H., Kuhrt, C., Arzt, E., Schultz, L. (1994). ScriptaMetall. Mater. 30:1569–1574.252. Huang, B. L., Perez, R. J., Lavernia, E. J., Luton, M. J. (1996). Nanostructured Mater.
7:67–79.
253. Itsukaichi, T., Shiga, S.,Masuyama,K., Umemoto,M., Okane, I. (1992).Mater. Sci. For.88–90:631–638.
254. Murty, B. S., Joardar, J., Pabi, S. K. (1996). Nanostructured Mater. 7:691–697.255. Ivanov, E., Grigorieva, T. F., Golubkova, G. V., Boldyrev, V. V., Fasman, A. B.,
Mikhailenko, S. D., Kalinina, O. T. (1988).Mater. Lett. 7:51–54.256. Mikhailenko, S. D., Kalinina, O. T., Dyunusov, A. K., Fasman, A. B., Ivanov, E.,
Golubkova, G. V. (1991). Siberian J. Chem. No. 5:93–104.
257. Schaffer, G. B., Heron, A. J. (1993). In: deBarbadillo, J. J., et al., eds.Mechanical Alloyingfor Structural Applications. Materials Park, OH: ASM International, pp. 197–203.
258. Liu, Z. G., Guo, J. T., Hu, Z. Q. (1996). J. Alloys Compounds 1996 234:106–110.
259. Oleszak, D., Portnoy, V. K., Matyja, H. (1999).Mater. Sci. For. 312–314:345–350.260. Balaz, P., Havlık, T., Briancin, J., Kammel, R. (1995). Scripta Metall. Mater. 32:1357–
1362.
261. Wang, K. Y., Shen, T. D., Wang, J. T., Quan, M. X. (1991). Scripta Metall. Mater.25:2227–2231.
262. Wang, K. Y., Shen, T. D., Wang, J. T., Quan, M. X. (1993). J. Mater. Sci. 28:6474–6478.263. Oh, T. S., Choi, J. S., Hyun, D. B. (1995). Scripta Metall. Mater. 32:595–600.
264. Kong, L. B., Ma, J., Zhu, W., Tan, O. K. (2001). J. Mater. Sci. Lett. 20:1241–1243.265. Kong, L. B., Ma, J., Zhu, W., Tan, O. K. (2002). J. Alloys Compounds 336:242–246.266. Aning, A. O., Hong, C., Desu, S. B. (1995).Mater. Sci. For. 179–181:207–213.
267. Calka, A., Radlinski, A. P. (1989). Scripta Metall. 23:1497–1501.268. Liu, K. W., Mucklich, F., Birringer, R. (2001). Intermetallics 9:81–88.269. Liu, K. W., Mucklich, F. (2002).Mater. Sci. Eng. A329-331:112–117.
270. Liu, K. W., Mucklich, F., Pitschke, W., Birringer, R., Wetzig, K. (2001). Z. Metallkde.92:924–930.
271. Kis-Varga, M., Beke, D. L., Meszaros, S., Vad, K., Kerekes, Gy, Daroczi, L. (1998).Mater. Sci. For. 269–272:961–968.
272. Izard, V., Record, M. C., Tedenac, J. C. (2002). J. Alloys Compounds 345:257–264.273. Tan, M. (1994). J. Mater. Sci. 29:1306–1309.274. Ding, J., McCormick, P. G., Street, R. (1992). J. Alloys Compounds 189:83–86.
275. Guo, W., Martelli, S., Magini, M. (1994). Acta Metall. Mater. 42:411–417.276. Burgio, N., Guo,W.,Martelli, S., Magini,M., Padella, F., Soletta, I. (1990). In: Froes, F.
H., deBarbadillo, J. J., eds. Structural Applications of Mechanical Alloying pp. 175–183.
Materials Park, OH: ASM International.277. Frefer, A., Suryanarayana, C., Froes, F. H. (1993). In: Froes, F. H., Caplan, I. L., eds.
Titanium ’92: Science and Technology. Warrendale, PA: TMS, pp. 933–940.
278. Oleszak, D., Burzynska-Szyszko, M., Matyja, H. (1993). J. Mater. Sci. Lett. 12:3–5.279. Guo,W.,Martelli, S., Burgio, N.,Magini,M., Padella, F., Paradiso, E., Soletta, I. (1991).
J. Mater. Sci. 26:6190–6196.280. Ahn, J. H., Lee, K. R., Cho, H. K. (1995).Mater. Sci. For. 179–181:153–158.
MD: SURYANARAYANA, JOB: 03320, PAGE: 235
4103-X_Suryanarayana_Ch10_R2_080304
Synthesis of Intermetallics 235

281. Ahn, J. H., Chung, H. (1994). In: Ravi, V. A., Srivatsan, T. S., Moore, J. J., eds. Pro-cessing and Fabrication of Advanced Materials III. Warrendale, PA: TMS, pp. 227–237.
282. Ameyama, K., Okada, O., Hirai, K., Nakabo, N. (1995).Mater. Trans. Jpn. Inst. Metals
36:269–275.283. Suryanarayana, C., Chen, G. H., Frefer, A., Froes, F. H. (1992). Mater. Sci. Eng.
A158:93–101.
284. Chen, G. H., Suryanarayana, C., Froes, F. H. (1991). Scripta Metall. Mater. 25:2537–2540.
285. Suryanarayana, C., Chen, G. H., Froes, F. H. (1992). In: Froes, F. H., et al., eds.
Advancements in Synthesis and Processing. Covina, CA: SAMPE, pp. M671–M683.286. Chen, G. H., Suryanarayana, C., Froes, F. H. (1992). In: Capus, J. M., German, R. M.,
eds. Advances in Powder Metallurgy and Particulate Materials. Vol. 7. Princeton, NJ:
Metal Powder Industries Federation, pp. 183–194.287. Jurczyk, M., Jankowska, E., Nowak, M., Jakubowicz, J. (2002). J. Alloys Compounds
336:265–269.288. Skakov, YuA., Edneral, N. V., Frolov, E. V., Povolozki, J. A. (1995). Mater. Sci. For.
179–181:33–38.289. Blouin, M., Guay, D., Huot, J., Schulz, R. (1997). J. Mater. Res. 12:1492–1500.290. Aoki, K., Memezawa, A., Masumoto, T. (1994). J. Mater. Res. 9:39–46.
291. Suryanarayana, C., Sundaresan, R., Froes, F. H. (1992).Mater. Sci. Eng.A150:117–121.292. Abe, O., Suzuki, Y. (1996).Mater. Sci. Forum 225–227:563–568.293. Schiffini, L., Mulas, G., Daturi, M., Ferretti, M. (1993). In: deBarbadillo, J. J., et al., eds.
Mechanical Alloying for Structural Applications. Materials Park, OH: ASM Interna-tional, pp. 457–461.
294. Lopez-Hirata, V. M., Zhu, Y. H., Rodriguez-Hernandez, J. C., Saucedo Munoz, M. L.,
Arce-Estrada, E. M. (1999).Mater. Sci. For. 312–314:133–138.295. Hong, L. B., Bansal, C., Fultz, B. (1994). Nanostructured Mater. 4:949–956.296. Froes, F. H., Suryanarayana, C., Eliezer, D. (1992). J. Mater. Sci. 27:5113–5140.297. Froes F. H., Suryanarayana C. (1996). In: Stoloff, N. S., Sikka, V. K., eds. Physical
Metallurgy and Processing of Intermetallic Compounds. New York: Chapman & Hall,pp. 297–350.
298. Morris, D. G. (1998). Mechanical Behavior of Nanostructured Materials. Materials
Science Foundations 2. Zeurich, Switzerland: Trans Tech.299. Koch, C. C., Morris, D. G., Lu, K., Inoue, A. (1999).MRS Bull. 24(2):54–58.300. McFadden, S. X., Mishra, R. S., Valiev, R. Z., Zhilyaev, A. P., Mukherjee, A. K. (1999).
Nature 398:684–686.301. Suryanarayana, C., Koch, C. C. (2000). Hyperfine Interact. 130:5–44.302. Lu, L., Wang, L. B., Ding, B. Z., Lu, K. (2000). J. Mater. Res. 15:270–273.303. Lu, L., Sui, M. L., Lu, K. (2000). Science 287:1463–1465.
304. Wang, Y., Chen, M., Zhou, F., Ma, E. (2002). Nature 419:912–995.305. Suryanarayana, C. (2002). Int. J. Non-equilibrium Proc. 11:325–345.306. Frefer, A., Suryanarayana, C., Froes, F. H. (1993). In: Moore, J. J., et al., eds. Advanced
Synthesis of Engineered Materials. Materials Park, OH: ASM International, pp. 213–219.
307. Skakov, Yu A. (2000).Mater. Sci. For. 343–346:597–602.
308. Zhang, D. L., Ying, D. Y. (2001).Mater. Sci. For. 360–362:323–328.309. Schaffer, G. B. (1992). Scripta Metall. Mater 27:1–5.310. Guerrero-Paz, J., Robles-Hernandez, F. C., Martınez-Sanchez, R., Hernandez-Silva, D.,
Jaramillo-Vigueras, D. (2001).Mater. Sci. For. 360–362:317–322.311. Singh, D., Suryanarayana, C.,Mertus, L., Chen, R.-H. (2003). Intermetallics 11:373–376.312. Gauthier, V., Bernard, F., Gaffet, E., Munir, Z. A., Larpin, J. P. (2001). Intermetallics
9:571–580.
MD: SURYANARAYANA, JOB: 03320, PAGE: 236
4103-X_Suryanarayana_Ch10_R2_080304
Chapter 10236

313. Gauthier, V., Bernard, F., Gaffet, E., Vrel, D., Gailhanoud, M., Larpin, J. P. (2002).Intermetallics 10:377–389.
314. McQuillan, A. D. (1950). Proc. R. Soc. (London) A204:309.
315. Froes, F. H., Eylon, D., Suryanarayana, C. (1990). JOM 42(3):26–29.316. Mukhopadhyay, D.K., Suryanarayana, C., Froes, F. H. (1993). In: Froes, F. H., Caplan,
I., eds. Titanium’92: Science and Technology. Warrendale, PA: TMS, pp. 829–
835.317. Bououdina, M., Luklinska, Z., Guo, Z. X. (2001).Mater. Sci. For. 360–362:421–426.318. Yen, B. K., Aizawa, T., Kihara, J. (1996).Mater. Sci. Eng. A220:8–14.
319. Ma, E., Pagan, J., Cranford, G., Atzmon, M. (1993). J. Mater. Res. 8:1836–1844.320. Lee, P. Y., Chen, T. R., Yang, J. L., Chin, T. S. (1995). Mater. Sci. Eng. A192–193:
556–562.
321. Patankar, S. N., Xiao, S. Q., Lewandowski, J. J., Heuer, A. H. (1993). J. Mater. Res.8:1311–1316.
322. Huang, J. Y., Ye, L. L., Wu, Y. K., Ye, H. Q. (1995). Metall. Mater. Trans. 26A:2755–2758.
323. Lou, T., Fan, G., Ding, B., Hu, Z. (1997). J. Mater. Res. 12:1172–1175.324. Radev, D. D., Klissurski, D. (1994). J. Alloys Compounds 206:39–41.325. Lee, W. H., Reucroft, P. J., Byun, C. S., Kim, D. K. (2001). J. Mater. Sci. Lett. 20:
1647–1649.326. Pallone, E. M. J. A., Hanai, D. E., Tomasi, R., Botta F, W. J. (1998).Mater. Sci. For.
269–272:289–294.
327. Coreno-Alonso, O., Cabanas-Moreno, J. G., Cruz-Rivera, J. J., Florez-Dıaz, G., De Ita,A., Quintana-Molina, S., Falcony, C. (2000).Mater. Sci. For. 343–346:290–295.
328. Maric, R., Ishihara, K. N., Shingu, P. H. (1996). J. Mater. Sci. Lett. 15:1180–1183.
329. Pabi, S. K., Joardar, J., Manna, I., Murty, B. S. (1997). Nanostructured Mater. 9:149–152.
330. Guo, F. Q., Lu, K. (1998). Phil. Mag. Lett. 77:181–186.331. Stoloff, N. S., Davies, R. G. (1966). Prog. Mater. Sci. 13:1–84.
332. Suryanarayana, C. (2002). In: Westbrook, J. H., Fleischer, R. L., eds. Intermetallic Com-pounds. Principles and Practice: Vol. 3, Progress. Chichester, UK: Wiley, pp. 749–764.
333. Suryanarayana, C., Zhou, E., Peng, Z., Froes, F. H. (1994). Scripta Metall. Mater.
30:781–785.334. Ahn, J.-H., Ha, K.-H., Ko, J.-W., Kim, H.-D., Chung, H. (1992). In: Hayakawa, H.,
Koshizuka, N., eds. Advances in Superconductivity IV. Tokyo: Springer-Verlag pp.
459–462.335. Thompson, J. R., Politis, C., Kim, Y. C. (1992).Mater. Sci. Forum 88–90:545–552.336. Simoneau, M., Lvallee, F., L’Esperance, G., Trudeau, M. L., Schulz, R. (1992). In:
Yavari, A. R., ed. Ordering and Disordering in Alloys. London: Elsevier, pp. 385–393.
337. Gumbel, A., Eckert, J., Fuchs, G., Nenkov, K., Muller, K.-H., Schultz, L. (2002). Appl.Phys. Lett. 80:2725–2727.
338. Politis, C. (1985). Physica 135B:286–289.
339. Whang, S. H., Li, Z. X. (1989).Modern Phys. Lett. B3:665–672.340. Batalla, E., Zwartz, E. G. (1990). J. Mater. Res. 5:1802–1805.341. Luo, J. S., Lee, H. G., Sinha, S. N. (1994). J. Mater. Res. 9:297–304.
342. Gumbel, A., Ledig, L., Hough, D., Oerkel, C.-G., Skrotzki, W., Eckert, J., Schultz, L.(1999).Mater. Sci. For. 312–314:61–66.
343. Sun, J., Zhang, J. X., Fu, Y. Y., Hu, G. X. (2002).Mater. Sci. Eng. A329–331:703–707.
344. Carlsson, A. E., Meschter, P. J. (1989). J. Mater. Res. 4:1060.345. Zedalis, M., Fine, M. E. (1983). Scripta Metall. 17:1247–1251.346. Qi, M., Zhu, M., Li, G. B., Sui, H.-X., Yang, D. Z. (1993). J. Mater. Sci. Lett. 12:66–69.347. Gauvin, R., Bernier, M. A., Joy, D. C., Schmidt, M. (1993). In: deBarbadillo, J. J., et al.,
MD: SURYANARAYANA, JOB: 03320, PAGE: 237
4103-X_Suryanarayana_Ch10_R2_080304
Synthesis of Intermetallics 237

eds.Mechanical Alloying for Structural Applications. Materials Park, OH: ASM Interna-tional, pp. 93–100.
348. Sato,K., Ishizaki, K., Chen,G.H., Frefer, A., Suryanarayana, C., Froes, F.H. (1993). In:
Moore, J. J., et al., eds.Advanced Synthesis of Engineered Structural Materials. MaterialsPark, OH: ASM International, pp. 221–225.
349. Radhakrishnan, R., Bhaduri, S., Hanegar, C. H. Jr. (1997). JOM 49(1):41–45.
350. Vasudevan, A. K., Petrovic, J. J. (1992).Mater. Sci. Eng. A155:1–17.351. Corrias, A., Ennas, G., Licheri, G., Marongiu, G., Paschina, G. (1991).Mater. Sci. Eng.
A145:123–125.
352. Corrias, A., Ennas, G., Licheri, G., Marongiu, G., Musinu, A., Paschina, G. (1993). In:deBarbadillo, J. J., et al., eds.Mechanical Alloying for Structural Applications. MaterialsPark, OH: ASM International, pp. 451–456.
353. Calka, A., Radlinski, A. P. (1991). Appl. Phys. Lett. 58:119–121.354. Ruuskanen, P., Heczko, O. (1993). Key Engng. Mater. 81–83:159–168.355. Calka, A., Wexler, D. (2002).Mater. Sci. For. 386–388:125–134.356. Morris, M. A., Morris, D. G. (1991). J. Mater. Sci. 26:4687–4696.
357. Corrias, A., Ennas, G., Morangiu, G., Musinu, A., Paschina, G., Zedda, D. (1995).Mater. Sci. Eng. A204:211–216.
358. Calka, A., Radlinski, A. P. (1990). J. Less Common Metals 161:L23–L26.
359. Savyak,M., Uvarova, I., Timofeeva, I., Isayeva, L., Kirilenko, S. (2000).Mater. Sci. For.343–346:411–416.
360. Millet, P., Hwang, T. (1996). J. Mater. Sci. 31:351–355.
361. Matteazzi, P., Basset,D.,Miani, F., LeCaer,G. (1993).NanostructuredMater. 2:217–229.362. Krasnowski, M., Matyja, H. (2000).Mater. Sci. For. 343–346:302–307.363. Tokumitsu, K. (1997).Mater. Sci. For. 235–238:127–132.
364. Ivanov, E. (1993). In: deBarbadillo, J. J., et al., eds. Mechanical Alloying for StructuralApplications. Materials Park, OH: ASM International, pp. 171–176.
365. Ivanov, E., Golubkova, G. V. (1992). J. Alloys Compounds 190:L25–L26.366. Huang, H., McCormick, P. G. (1997). J. Alloys Compounds 256:258–262.
367. Oleszak, D., Matyja, H. (2000).Mater. Sci. For. 343–346:320–325.368. Tanaka, T., Nasu, S., Ishihara, K. N., Shingu, P. H. (1991). J. Less Common Metals
171:237–247.
369. Tokumitsu, K., Umemoto, M. (2002).Mater. Sci. For. 386–388:479–484.370. Basset, D., Matteazzi, P., Miani, F. (1993).Mater. Sci. Eng. A168:149–152.371. Liu, Z. G., Umemoto, M., Tsuchiya, K. (2002).Metall. Mater. Trans. 33A:2195–2203.
372. Umemoto,M., Liu, Z. G., Liu, D. Y., Takaoka, H., Tsuchiya, K. (2002).Mater. Sci. For.386–388:199–204.
373. Tanaka, T., Nasu, S., Nakagawa, K., Ishihara, K. N., Shingu, P. H. (1992).Mater. Sci.For. 88–90:269–274.
374. Wang, G.M., Calka, A., Campbell, S. J., Kaczmarek,W. A. (1995).Mater. Sci. For. 179-181:201–205.
375. Tokumitsu, K., Umemoto, M. (2001).Mater. Sci. For. 360–362:183–188.
376. Campbell, S. J., Wang, G. M., Calka, A., Kaczmarek, W. A. (1997). Mater. Sci. Eng.A226-228:75–80.
377. Murphy, B. R., Courtney, T. H. (1994). Nanostructured Mater. 4:365–369.
378. Krivoroutchko, K., Kulik, T., Matyja, H., Fadeeva, V. I., Portnoy, V. K. (2001).Mater.Sci. For. 360-362:385–390.
379. Gaffet, E., Marco, P., Fedoroff, M., Rouchaud, J. C. (1992). Mater. Sci. For. 88–90:
383–390.380. Sherif El-Eskandarany,M., Sumiyama, K., Suzuki, K. (1995). J.Mater. Res. 10:659–667.381. Malchere, A., Gaffet, E. (1993). In: deBarbadillo, J. J., et al., eds.Mechanical Alloying for
Structural Applications. Materials Park, OH: ASM International, pp. 297–305.
MD: SURYANARAYANA, JOB: 03320, PAGE: 238
4103-X_Suryanarayana_Ch10_R2_080304
Chapter 10238

382. Tomasi,R., Pallone,E.M. J.A.,Botta,F.,W. J. (1999).Mater. Sci. For. 312–314:333–338.383. Ye, L. L., Quan, M. X. (1995). Nanostructured Mater. 5:25–31.384. Sherif El-Eskandarany, M., Konno, T. J., Sumiyama, K., Suzuki, K. (1996).Mater. Sci.
Eng. A217/218:265–268.385. Umemoto, M., Liu, Z. G., Masuyama, K., Tsuchiya, K. (1999). Mater. Sci. For.
312–314:93–102.
386. Wu, N. Q., Lin, S., Wu, J. M., Li, Z. Z. (1998).Mater. Sci. Technol. 14:287–291.387. Wanikawa, S., Takeda, T. (1989). J. Jpn. Soc. Powder Powder Metall. 36:672–676.388. Calka, A., Kaczmarek, W. A. (1992). Scripta Metall. Mater. 26:249–253.
389. Calka, A., Williams, J. S. (1992). Scripta Metall. Mater. 27:999–1004.390. Calka, A., Nikolov, J. I., Ninham, B. W. (1993). In: deBarbadillo, J. J., et al., eds.
Mechanical Alloying for Structural Applications. Materials Park, OH: ASM Interna-
tional, pp. 189–195.391. Wang, G. M., Campbell, S. J., Calka, A., Kaczmarek, W. A. (1997). J. Mater. Sci.
32:1461–1467.392. Xueming, M. A., Gang, J. I. (1996). J. Alloys Compounds 245:L30–L32.
393. Wang, G. M., Millet, P., Calka, A., Campbell, S. J. (1995). Mater. Sci. For. 179–181:183–188.
394. Sherif El-Eskandarany, M., Omori, M., Ishikuro, M., Konno, T. J., Takada, K.,
Sumiyama, K., Suzuki, K. (1996).Metall. Mater. Trans. 27A:4210–4213.395. Eckert, J., Jost, K., De Haas, O., Schultz, L. (1997). Mater. Sci. For. 235–238:
133–138.
396. Muller, B., Ledig, L., Hough, D., Oertel, C. -G., Skrotzki, W., Gumbel, A., Eckert, J.(2000).Mater. Sci. For. 343–346:689–694.
397. Gumbel, A., Eckert, J., Handstein, A., Skrotzki, W., Schultz, L. (2000).Mater. Sci. For.
343–346:924–930.398. Calka, A., Williams, J. S. (1992).Mater. Sci. For. 88–90:787–794.399. Chen, Y., Gerald, J. F., Williams, J. S., Willis, P. (1999). Mater. Sci. For. 312–314:
173–178.
400. Koyano, T., Lee, C. H., Fukunaga, T., Mizutani, U. (1992). Mater. Sci. For. 88–90:809–816.
401. Sherif El-Eskandarany, M., Sumiyama, K., Aoki, K., Suzuki, K. (1992).Mater. Sci. For.
88–90:801–808.402. Calka, A., Nikolov, J. J., Williams, J. S. (1996).Mater. Sci. For. 225–227:527–532.403. Kaczmarek,W. A., Ninham, B.W., Onyszkiewicz, I. (1995). J.Mater. Sci. 30:5514–5521.
404. Millet, P., Calka, A., Williams, J. S., Vantenaar, G. J. H. (1993). Appl. Phys. Lett.63:2505–2507.
405. Bab, M. A., Mendoza-Zelis, L., Damonte, L. C. (2001). Acta Mater. 49:4205–4213.406. Mendoza-Zelis, L., Bab, M. A., Damonte, L. C., Sanchez, F. H. (1999).Mater. Sci. For.
312–314:179–184.407. Sherif El-Eskandarany, M., Sumiyama, K., Aoki, K., Masumoto, T., Suzuki, K. (1994).
J. Mater. Res. 9:2891–2898.
408. Bodart, M., Moret, F., Baccino, R. (1992). In: Capus, J. M., German, R. M., eds. Ad-vances in Powder Metallurgy and Particulate Materials. Vol. 7. Princeton, NJ: MetalPowder Industries Federation, pp. 207–219.
409. Li, Z. L., Williams, J. S., Calka, A. (1997). J. Appl. Phys. 81:8029–8034.410. Li, Z. L., Williams, J. S., Calka, A. (1998).Mater. Sci. For. 269–272:271–276.411. Wexler, D., Calka, A., Colburn, S. J. (1998).Mater. Sci. For. 269–272:219–224.
412. Chen, Y., Ninham, B. W., Ogarev, V. (1995). Scripta Metall. Mater. 32:19–22.413. Sherif El-Eskandarany, M. (1994). J. Alloys Compounds 203:117–126.414. Suryanarayana, C., Chen, G. H., Froes, F. H. (1992). Scripta Metall. Mater. 26:
1727–1732.
MD: SURYANARAYANA, JOB: 03320, PAGE: 239
4103-X_Suryanarayana_Ch10_R2_080304
Synthesis of Intermetallics 239

415. Saji, S., Neishi, Y., Araki, H., Minamino, Y., Yamane, T. (1995).Metall. Mater. Trans.26A:1305–1307.
416. Chin, Z. H., Perng, T. P. (1997).Mater. Sci. For. 235–238:73–78.
417. Chin, Z. H., Perng, T. P. (1997). Appl. Phys. Lett. 70:2380–2382.418. Shen, T. D., Koch, C. C. (1995). Nanostructured Mater. 5:615–629.419. Ogino, Y., Miki, M., Yamasaki, T., Inuma, T. (1992).Mater. Sci. For. 88–90:795–800.
420. Ogino, Y., Yamasaki, T., Miki, M., Atsumi, N., Yoshioka, K. (1993). Scripta Metall.Mater. 28:967–971.
421. Guo, W., Martelli, S., Padella, F., Magini, M., Burgio, N., Paradiso, E., Franzoni, U.
(1992).Mater. Sci. For. 88–90:139–146.422. Miki, M., Yamasaki, T., Ogino, Y. (1993). Mater. Trans. Jpn. Inst. Metals 34:952–
959.
423. Aoki, K., Memezawa, A., Masumoto, T. (1992). Appl. Phys. Lett. 61:1037–1039.424. Sakurai, K., Lee, C. H., Kuroda, N., Fukunaga, T., Mizutani, U. (1994). J. Appl. Phys.
75:7752–7755.425. Calka, A. (1991). Appl. Phys. Lett. 59:1568–1569.
426. Kuhrt, C., Schropf, H., Schultz, L., Arzt, E. (1993). In: deBarbadillo, J. J., et al., eds.Mechanical Alloying for Structural Applications. Materials Park, OH: ASM Interna-tional, pp. 269–273.
427. Bampton, C. C., Rhodes, C.G.,Mitchell,M.R., Vassiliou,M. S.,Graves, J. A. (1990). In:Yavari, A. R., Desre, P., eds. Multilayer Amorphisation by Solid-State Reaction andMechanical Alloying. Vol. 51. Colloq. C4., Suppl. 14. LesUlis Cedex, France: Les editions
de Physique, pp. 275–282.428. Fadeeva, V. I., Sviridov, I. A., Kochetov, G. A., Baldokhin, Yu. V. (2000).Mater. Sci.
For. 343–346:296–301.
429. Gaffet, E., Malhouroux-Gaffet, N., Abdellaoui, M. (1993). J. Alloys Compounds 194:339–360.
430. Malhouroux-Gaffet, N., Gaffet, E. (1993). J. Alloys Compounds 198:143–154.431. Umemoto, M., Shiga, S., Okane, I. (1993). In: Henein, H., Oki, T., eds. Processing
Materials for Properties. Warrendale, PA: TMS, pp. 679–682.432. Umemoto, M., Shiga, S., Raviprasad, K., Okane, I. (1995). Mater. Sci. For. 179–
181:165–170.
433. Yelsukov, E. P., Fomin, V. M., Nemtsova, O. M., Shklyaev, D. A. (2002). Mater. Sci.For. 386–388:181–186.
434. Garcia-Escoral, A., Adeva, P., Cristina, M. C., Martin, A., Carmona, F., Cebollada, F.,
Martin, V. E., Leonato, M., Gonzalez, J. M. (1991).Mater. Sci. Eng. A134:1394–1397.435. Munoz-Palos, J. M., Cristina, M. C., Adeva, P. (1996).Mater. Trans. Jpn. Inst. Metals
37:1602–1606.436. Riffel, M., Schilz, J. (1998). J. Mater. Sci. 33:3427–3431.
437. Umemoto, M., Liu, Z. G., Omatsuzawa, R., Tsuchiya, K. (2000). Mater. Sci. For.343–346:918–923.
438. Yen, B. K., Aizawa, T., Kihara, J. (1997).Mater. Sci. For. 235–238:157–162.
439. Iwamoto, N., Uesaka, S. (1992).Mater. Sci. For. 88–90:763–770.440. Fei, G. T., Liu, L., Ding, X. Z., Zhang, L. D., Zheng, Q. Q. (1995). J. Alloys Compounds
229:280–282.
441. Ma, E., Pagan, J., Cranford, G., Atzmon, M. (1993). J. Mater. Res. 8:1836–1844.442. Lee, P. Y., Chen, T. R., Yang, J. L., Chin, T. S. (1995). Mater. Sci. Eng. A192/193:
556–562.
443. Gaffet, E., Malhouroux-Gaffet, N. (1994). J. Alloys Compounds 205:27–34.444. Perdigao, M. N. R. V., Jordao, J. A. R., Kiminami, C. S., Botta Filho, W. J. (1997).
Mater. Sci. For. 235–238:151–156.445. Kumar, K. S., Mannan, S. K. (1989). In: Liu, C. T., Taub, A. I., Stoloff, N. S., Koch, C.
MD: SURYANARAYANA, JOB: 03320, PAGE: 240
4103-X_Suryanarayana_Ch10_R2_080304
Chapter 10240

C., eds. High Temperature Ordered Intermetallic Alloys III. Vol. 133. Pittsburgh, PA:Mater. Res. Soc., pp. 415–420.
446. Viswanadham, R. K., Mannan, S. K., Kumar, K. S. (1988). Scripta Metall. 22:1011–
1014.447. Omuro, K., Miura, H. (1991). Jpn. J. Appl. Phys. 30:L851–853.448. Zhang, D. L., Massalski, T. B. (1994). J. Mater. Res. 9:53–60.
449. Oehring, M., Bormann, R. (1991).Mater. Sci. Eng. A134:1330–1333.450. Zotov, N., Parlapanski, D. (1994). J. Mater. Sci. 29:2813–2820.451. Bokhonov, B., Ivanov, E., Boldyrev, V. V. (1993). J. Alloys Compounds 199:125–128.
452. Lu, L., Lai, M. O., Su, Y., Teo, H. L., Feng, C. F. (2001). Scripta Mater. 45:1017–1023.453. Brand, K., Suryanarayana, C., Kieback, B. F., Froes, F. H. (1996). In: Cadle, T. M.,
Narasimhan, K. S., eds. Advances in Powder Metallurgy and Particulate Materials—
1996. Vol. 2. Princeton, NJ:Metal Powder Industries Federation, pp. 49–58.454. Brand, K., Suryanarayana, C., Kieback, B. F., Froes, F. H. (1996). Mater. Sci. For.
225–227:471–476.
MD: SURYANARAYANA, JOB: 03320, PAGE: 241
4103-X_Suryanarayana_Ch10_R2_080304
Synthesis of Intermetallics 241

4103-X_Suryanarayana_Ch10_R2_080304
MD: SURYANARAYANA, JOB: 03320, PAGE: 242
11
Disordering of Intermetallics
11.1 INTRODUCTION
It has long been known that materials containing partially ordered phases are strongerthan those with wholly disordered or fully ordered phases. This is due to the fact that ata certain value of the long-range order parameter, S, superdislocations separate intounlinked singles. Thus, it is of interest to study the mechanical behavior of materials invarious states of partial order. Disordering phenomena of ordered alloys have alsobeen studied in an effort to understand the mechanism of disordering and toinvestigate the different methods by which the disordered phase could be retained atroom temperature. Disordered intermetallics are of interest because they could have ahigher ductility, and consequently higher formability, than their ordered counterparts.
It was mentioned in Chapter 10 that intermetallic compounds exist mostly in theordered state and that they suffer from unacceptably low levels of ambient temper-ature ductility. This has been the major obstacle in preventing their widespread use.The room temperature ductility of intermetallics could be increased either by disorder-ing them or by refining their grain sizes [1,2]. Several techniques have been employed todisorder the ordered intermetallics. These include irradiation [3,4], rapid solidificationprocessing [5,6], laser quenching [7], vapor quenching [8], chemical vapor depositionon a cold finger [9], or heavy plastic deformation [10]. This chapter deals with thephenomenon of disordering of ordered intermetallic compounds by mechanicalmilling (MM), a process of heavy plastic deformation. It will be shown that thetechnique of MM could lead to grain refinement (producing even nanocrystallinematerials), disordering of the ordered lattice, and synthesis ofmetastable phases. All ofthese effects, either singly or in combination, can lead to enhanced ductility of dis-ordered intermetallics.
4103-X_Suryanarayana_Ch11_R2_080304
MD: SURYANARAYANA, JOB: 03320, PAGE: 243
243
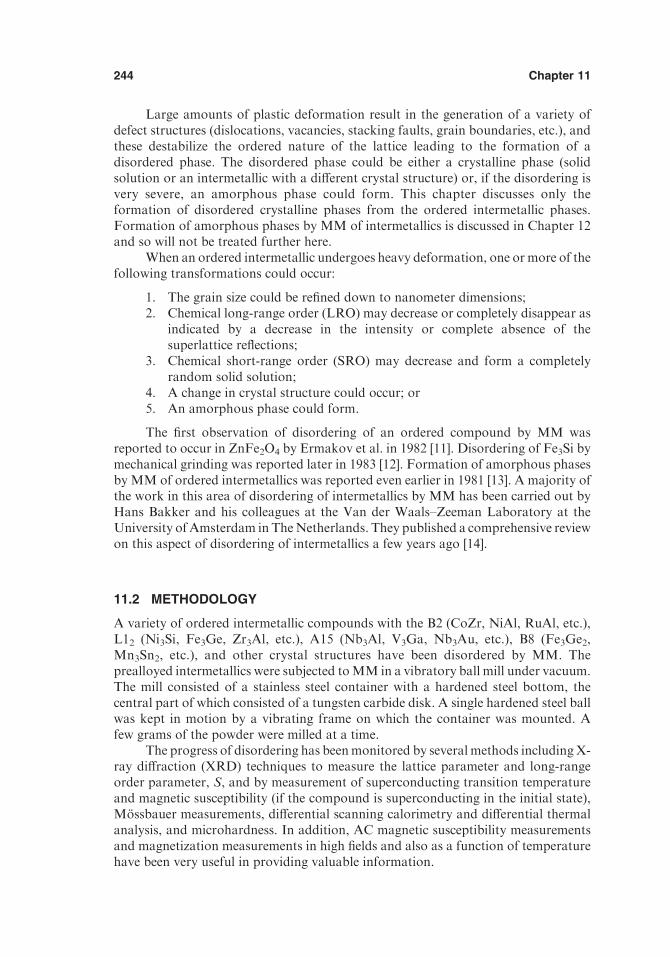
Large amounts of plastic deformation result in the generation of a variety ofdefect structures (dislocations, vacancies, stacking faults, grain boundaries, etc.), andthese destabilize the ordered nature of the lattice leading to the formation of adisordered phase. The disordered phase could be either a crystalline phase (solidsolution or an intermetallic with a different crystal structure) or, if the disordering isvery severe, an amorphous phase could form. This chapter discusses only theformation of disordered crystalline phases from the ordered intermetallic phases.Formation of amorphous phases by MM of intermetallics is discussed in Chapter 12and so will not be treated further here.
When an ordered intermetallic undergoes heavy deformation, one ormore of thefollowing transformations could occur:
1. The grain size could be refined down to nanometer dimensions;2. Chemical long-range order (LRO) may decrease or completely disappear as
indicated by a decrease in the intensity or complete absence of thesuperlattice reflections;
3. Chemical short-range order (SRO) may decrease and form a completelyrandom solid solution;
4. A change in crystal structure could occur; or5. An amorphous phase could form.
The first observation of disordering of an ordered compound by MM wasreported to occur in ZnFe2O4 by Ermakov et al. in 1982 [11]. Disordering of Fe3Si bymechanical grinding was reported later in 1983 [12]. Formation of amorphous phasesby MM of ordered intermetallics was reported even earlier in 1981 [13]. A majority ofthe work in this area of disordering of intermetallics by MM has been carried out byHans Bakker and his colleagues at the Van der Waals–Zeeman Laboratory at theUniversity ofAmsterdam in TheNetherlands. They published a comprehensive reviewon this aspect of disordering of intermetallics a few years ago [14].
11.2 METHODOLOGY
A variety of ordered intermetallic compounds with the B2 (CoZr, NiAl, RuAl, etc.),L12 (Ni3Si, Fe3Ge, Zr3Al, etc.), A15 (Nb3Al, V3Ga, Nb3Au, etc.), B8 (Fe3Ge2,Mn3Sn2, etc.), and other crystal structures have been disordered by MM. Theprealloyed intermetallics were subjected toMM in a vibratory ball mill under vacuum.The mill consisted of a stainless steel container with a hardened steel bottom, thecentral part of which consisted of a tungsten carbide disk. A single hardened steel ballwas kept in motion by a vibrating frame on which the container was mounted. Afew grams of the powder were milled at a time.
The progress of disordering has beenmonitored by several methods includingX-ray diffraction (XRD) techniques to measure the lattice parameter and long-rangeorder parameter, S, and by measurement of superconducting transition temperatureand magnetic susceptibility (if the compound is superconducting in the initial state),Mossbauer measurements, differential scanning calorimetry and differential thermalanalysis, and microhardness. In addition, AC magnetic susceptibility measurementsand magnetization measurements in high fields and also as a function of temperaturehave been very useful in providing valuable information.
MD: SURYANARAYANA, JOB: 03320, PAGE: 244
4103-X_Suryanarayana_Ch11_R2_080304
Chapter 11244

11.3 TYPES OF DEFECTS GENERATED DURING DISORDERINGAND THERMODYNAMIC STABILITY
The intense plastic deformation associated with mechanical alloying (MA) and MMcan introduce a variety of defects into the ordered lattice, which raise the free energy ofthe system. Furthermore, disordering of the lattice also can raise the free energy of thesystem. Thus, the difference in the free energy of the system before and after milling,DG (milling), can be represented as
DG ðmillingÞ ¼ DG ðdisorderÞ þ DG ðgrain boundaries and other defectsÞð11:1Þ
where DG (disorder) is the increase in free energy due to the disordering of the latticeand DG (grain boundaries and other defects) is the increase in free energy due to theintroduction of defects such as grain boundaries, stacking faults, and so on. Conse-quently, the type of phase produced (solid solution, disordered intermetallic, oramorphous phase) is determined by the relative position of the free energy of theproduct phase with respect to the several possible competing phases and the parentphase. Thus, as shown in Figure 11.1, if the free energy of the disordered intermetallicexceeds the free energy of the amorphous phase, then the amorphous phase becomesmore stable. On the other hand, if the free energy of the disordered intermetallic islower than that of the amorphous phase, then the disordered intermetallic is the morestable phase. If the solid solution phase has a lower free energy than either of the othertwo competing phases (disordered intermetallic and the amorphous phase), then thesolid solution becomes stable. While a detailed analysis of the nature and density of
MD: SURYANARAYANA, JOB: 03320, PAGE: 245
4103-X_Suryanarayana_Ch11_R2_080304
Figure 11.1 Relative positions of the free energies of competing phases in the system.Assuming that solid solution, ordered intermetallic, disordered intermetallic, and amorphous
phase are the competing phases, then the stability of the phase is decided by its free energyrelative to that of the others. For example, in (a), the ordered intermetallic is more stable, in(b) it is the solid solution, in (c) it is the disordered intermetallic, and in (d) it is the amorphous
phase.
Disordering of Intermetallics 245

defects introduced into the system is beyond the scope of this book, one can brieflydiscuss how the disordering of the lattice could take place by the introduction ofdefects.
The atomic disorder in an intermetallic can be manifested in different ways[14,15]:
Antisite disorderTriple-defect disorderQuadruple-defect disorder, andRedistribution of interstitials
11.3.1 Antisite Disorder
Let us consider the example of h-brass (CuZn) intermetallic as a typical example ofmaterials crystallizing in the B2 structure (Figure 11.2). This structure can beconsidered to consist of two sublattices—a sublattice occupied by the Cu atoms andthe h sublattice occupied by the Zn atoms, each forming a primitive cubic lattice.(Alternatively, thea sublattice can be occupied by the Zn atoms and theh sublattice bythe Cu atoms. There is no difference between these two situations.) Thus, the B2structure can be considered as made up of two interpenetrating primitive cubicsublattices.
At 0 K, the alloy is completely in the ordered state and the component atoms areexpected to occupy the ‘‘right’’ lattice sites. However, occupancy of the lattice sitescould be different at elevated temperatures. A majority of the atoms continue tooccupy the right lattice sites at temperatures higher than 0 K, and almost up to theorder–disorder transformation temperature, Tc. Above Tc, the alloy is completelydisordered, i.e., the component Cu and Zn atoms are randomly distributed in equalproportions over both sublattices. Occupation of the ‘‘wrong’’ sublattices by theatomic species at temperatures below Tc, is referred to as antisite disorder. Forexample, in the above case of h-brass (CuZn), occupation of the h sublattice by Cuatoms and occupation of the a sublattice by Zn atoms is considered to be antisitedisorder. Figure 11.3 shows a schematic of the antisite disorder in a B2 compound.Figure 11.3a shows a perfectly ordered arrangement of the component atoms, while
MD: SURYANARAYANA, JOB: 03320, PAGE: 246
4103-X_Suryanarayana_Ch11_R2_080304
Figure 11.2 The B2 structure exhibited by ordered intermetallic compounds such as CuZn,
NiAl, and CsCl. The structure can be visualized as consisting of two interpenetrating primitivecubic sublattices, one made up of Cu (or Ni or Cs) atoms and the other Zn (or Al or Cl).
Chapter 11246

Figure 11.3b represents the situation when some of the constituent atoms occupy thewrong sites. Even though the lattice is not completely disordered, a significant part ofthe strain resides in the disordered lattice; this is because atoms on the wrong sublatticeare to be accommodated on lattice sites, where they do not fit. This introduces straininto the lattice. The presence of antisite disorder can be monitored by following thechanges in lattice parameter and/or degradation in the superconducting transitiontemperature, Tc. A consequence of antisite disorder in the lattice is an increase in thelattice parameter. This type of disorder is observed in almost every type of orderedalloy. Some examples are a number of mechanically milled compounds with the A15structure (Nb3Sn, V3Ga, NiV3), L12 structure (Ni3Al, Ni3Si, Fe3Ge), and B2 structure(CoGa, CoAl, AlRu).
11.3.2 Triple-Defect Disorder
A different type of disorder has been observed in some ordered intermetalliccompounds. In this case only one of the two components can be accommodated onthe wrong sublattice, while compensating vacancies are formed on the other sublattice.In an equiatomic compound such asCoGa, for example, the transitionmetal Co atomscan substitute on the Ga sublattice, resulting in an antisite disorder. However, the Gaatoms stay on their own sublattice. The requirement of equal number of sublattice sitesthen dictates that for each wrong Co atom, two vacancies are formed on the Cosublattice. Thus, vacancies on the Co sublattice in combination with Co antisite atomsin a ratio of 2:1 constitute the triple-defect disorder. This type of defect is shownschematically in Figure 11.4. It has the important consequence that CoGa will notshow a transformation to a different structure upon prolonged milling because Gaatoms, remaining on their own sublattice, ‘‘freeze’’ or ‘‘lock’’ the original B2 structure.On the other hand, intermetallic compounds that exhibit antisite disorder of bothcomponents usually transform by milling to a disordered structure characteristic of arandom arrangement of atoms, i.e., either to a solid solution of one component in thelattice structure of another, or to the amorphous state.
A clear indication of the vacancy-type disorder is the decrease of the latticeparameter because of relaxation around the high concentration of vacancies, whereasthe antisite disorder is accompanied by an increase in the lattice parameter.
MD: SURYANARAYANA, JOB: 03320, PAGE: 247
4103-X_Suryanarayana_Ch11_R2_080304
Figure 11.3 Schematic of antisite disorder in a B2-type compound. (a) represents a
completely ordered structure and (b) shows the antisite order. Notice that some of the ‘‘black’’atoms are occupying the ‘‘white’’ sublattice.
Disordering of Intermetallics 247

In addition to a change in the lattice parameter (either decrease or increase),formation of these defects can also affect the magnetic behavior of the compound. Forexample, it was reported that the B2 Fe60Al40 compound, which is paramagnetic atT z 300 K, becomes strongly ferromagnetic in the disordered bcc state as the Fe-Fenearest-neighbor population increases [16]. On the other hand, heavy deformation ofequiatomic FeRh, which also has the B2 structure, transformed to a metastable fccstructure, similar to the high-temperature g-solid solution [17]. While the B2-FeRhis strongly ferromagnetic above room temperature, its metastable g-fcc polymorph isparamagnetic, with spin-glass behavior at low temperatures [18].
11.3.3 Quadruple-Defect Disorder
The vacancy-type disorder related to that mentioned above can also occur in otherintermetallic compounds. For example, in the C15 compounds with the AB2 structure,one could visualize the occurrence of quadruple-defect disorder. This involves acombination of three vacancies on the h sublattice, the sublattice that is mainlyoccupied by the B atoms, and one antisite B atom on the a sublattice, the sublatticethat is mainly occupied by A atoms [19,20].
In principle, one could also consider the presence of higher order vacancy-typedefects. These vacancy-type defects (triple, quadruple, etc.) preserve the correctstoichiometry as well as the given ratio of the sublattice sites.
Miedema analysis [21] enables calculation of the enthalpy associated with thedifferent type of defects produced in the intermetallics. Their relative values will thendetermine the actual type of defect created in themechanically alloyed/milledmaterial,noting that the enthalpy of the milled material is going to be slightly different in theannealed and milled condition for the same material. For example, Modder et al. [15]estimated the enthalpies for formation of antisite disorder and quadruple defects inAB2-type compounds (Table 11.1). It may be noted that in all the compounds exceptGdMg2, the enthalpy for quadruple-defect formation is lower than that for antisitedisorder. MM of these compounds was conducted and the XRD technique wasutilized to detect the nature of the phases present and calculation of the latticeparameter. The presence of antisite disorder was inferred from the change in thenature of the phase and the quadruple defect by the decrease in the lattice parameter.
MD: SURYANARAYANA, JOB: 03320, PAGE: 248
4103-X_Suryanarayana_Ch11_R2_080304
Figure 11.4 Schematic of triple-defect disorder. (a) A completely ordered structure and (b) a
triple-defect disorder. Notice that the ‘‘black’’ atoms are on the ‘‘white’’ sublattice and that twovacancies are present on the ‘‘black’’ sublattice.
Chapter 11248

In confirmation of the predictions made by theMiedema model, experimentally it wasshown that the GdAl2, GdPt2, GdIr2, and GdRh2 compounds generate quadruple-defect disorder whereasGdMg2 generates the antisite disorder. Even though themodelonly gives estimates of the enthalpy values, it provides a very good predictivecapability regarding the type of defect produced in mechanically milled materials.
11.3.4 Redistribution of Interstitials
Assuming that atoms are spherical, their arrangement into different crystal structuresproduces interstices (holes) between the atoms, with their sizes smaller than those ofthe atoms. There are two types and sizes of interstices in the different crystal structures,and these are termed tetrahedral and octahedral interstices. In one type, four atomssurround an interstice in the shape of a tetrahedron and hence this is referred to as atetrahedral interstice. In the other, six atoms surround an interstice in the shape of anoctahedron; hence this is referred to as an octahedral interstice. Figure 11.5 showsthese two types of interstices in a face-centered cubic (fcc) structure. Similar types ofinterstices exist in the hexagonal close-packed (hcp) and body-centered cubic (bcc)structures also. The only difference between the interstices in these structures is in theircoordinates, number, and size. The properties of these interstices are summarized inTable 11.2.
MD: SURYANARAYANA, JOB: 03320, PAGE: 249
4103-X_Suryanarayana_Ch11_R2_080304
Table 11.1 Estimated Enthalpies for the Formation of Antisite Disorder andQuadruple Defects in C15-type GdX2 Intermetallic Compounds
CompoundDH for quadruple defects,
kJ/mole (per defect)DH for antisite disorder,
kJ/mole
GdAl2 55 230GdPt2 35 320GdIr2 23 310GdRh2 40 330
GdMg2 70 48
Source: Data from Ref. 15.
Figure 11.5 Schematics of the tetrahedral and octahedral interstices in a face-centered cubic
lattice.
Disordering of Intermetallics 249

MD: SURYANARAYANA, JOB: 03320, PAGE: 250
4103-X_Suryanarayana_Ch11_R2_080304
New structures could be generated by placing atoms of a different nature at theinterstitial sites. Depending on which of the interstices and how many of them are‘‘filled,’’ completely different structures could be produced. For example, the cubicZnS structure can be produced by ‘‘filling’’ half of the tetrahedral interstitial sites in ahypothetical fcc lattice of Zn with S atoms (ions). A CaF2-type structure can beproduced by filling all the tetrahedral interstitial sites with F atoms (ions) in an fcclattice of Ca atoms (ions). It has been reported that some of the atoms could changetheir positions in the mechanically milled materials and thus form new structures withdifferent properties. It was reported that themagnetization behavior of the Fe3Ge2 andMn3Sn2 structures is completely opposite for both the compounds, even though bothof them have the same Ni3Sn2 structure in the ordered condition. Whereas themagnetization in ferromagnetic Fe3Ge2 increases on disordering, that for the ferri-magnetic Mn3Sn2 decreases. This has been explained based on the concept that thetransition metal atoms are transferred during milling from the fully occupiedoctahedral sites to the empty tetrahedral sites [14]. Thus, redistribution of theinterstitials could lead to some type of disordering.
Antisite disorder and triple-defect disorder have also been observed in com-pounds disordered by quenching from high temperatures [22] as well as by irradiation[23], mostly in the superconducting compounds. However, redistribution of intersti-tials appears to be quite unique to mechanically milled materials, suggesting that MMcan introduce a very unique type of disordering in ordered lattices.
In addition to the above types of disorder created in the lattice, grain refinement(often resulting in the formation of nanostructured material) increases the grainboundary area and this also raises the free energy of the system. Furthermore,introduction of lattice strain into the crystal and other types of crystal defects alsoraise the free energy of the system. Thus, the sum of the energy of all these effects
Table 11.2 Coordinates, Size, and Number of Tetrahedral and Octahedral Interstices inthe bcc, fcc, and hcp Structuresa
Property BCC FCC HCP
Coordinates of the
tetrahedral sites
1⁄2,1⁄4, 0, and
equivalent sites
1⁄4,1⁄4,
1⁄4, and
equivalent sites
0, 0, 3⁄8; 0, 0,5⁄8;
1⁄3,2⁄3,
1⁄8;1⁄3,
2⁄3,7⁄8
Coordinates of theoctahedral sites
0, 0, 1⁄2;1⁄2,
1⁄2, 0, andequivalent sites
0, 0, 1⁄2;1⁄2,
1⁄2,1⁄2,
and equivalent sites
1⁄3,2⁄3,
1⁄4;2⁄3,
1⁄3,3⁄4
Size of tetrahedral
site (ri/rA)
0.291 0.225 0.225
Size of octahedralsite (ri/rA)
0.155 0.414 0.414
Number of tetrahedralsites per host atom
6 2 2
Number of octahedral
sites per host atom
3 1 1
a The coordinates are given with reference to the unit cell of the host lattice. The sizes of the interstitial
sites are given in terms of the radius ratio (ri/rA) where ri is the radius of the largest atom that can ‘‘fit’’ into
the interstitial position and rA is the radius of the host atoms. The number of the interstitial sites is given in
terms of the number of sites per host atom.
Chapter 11250

(disordering, creation of grain boundaries, and other defects) will be the total energyintroduced into the material during milling.
11.4 THEORETICAL BACKGROUND
It has been reported that upon milling, the long-range order parameter (S) in theintermetallic is gradually reduced and, in many cases, the material may become totallydisordered (S = 0), e.g., Ni3Al [24,25]. Figure 11.6 shows the variation of S withmilling time in Ni3Al and Ni3Al-B powders. Even though the kinetics of disorderingare different, the S value reaches 0 in both the cases after milling for sufficient time, i.e.,5 h for Ni3Al and 8 h for Ni3Al-B powders. In other cases, S is reduced with millingtime but does not reach 0, i.e., partial order and partial disorder coexist in compoundssuch as CuTi [26] andAlRu [27]. In other cases, the S value does not decrease at all andis maintained at S=1; but, with continued milling the material becomes amorphous,e.g., in CoZr [28]. These three situations are schematically represented in Figure 11.7.Thus, upon milling, an ordered intermetallic can transform, with or without completeloss of long-range order, either into a disordered crystalline phase (solid solution) or anamorphous phase. If the product is a crystalline phase, the material has an extremelyfine grain size, usually in the nanometer range. Figure 11.8 summarizes the types ofchanges that can occur on milling an ordered intermetallic compound [29,30].
Even if the intermetallic does not become completely disordered on millingunder ‘‘normal’’ conditions, it could be made to fully disorder by changing the processparameters. It has been reported by Poecht et al. [31] that the FeAl intermetallic didnot become completely disordered, i.e., S p 0, on milling in a Fritsch P0 vibratory ballmill at an intensity of 1000 ms�2 at room temperature. However, by increasing themilling intensity, the authors reduced the value of S to zero (Figure 11.9). The NiAlintermetallic also did not become fully disordered on milling. Changing the millingparameters also did not have an effect in decreasing the value of S to zero [32,33]. Thismay be related to the high value of DHord, the ordering enthalpy. It has beendemonstrated that ternary alloying additions, e.g., Fe and Cr, to the extent of 18at% or more could completely disorder the NiAl compound [34] (Fig. 11.10a). It hasalso been noted that the S value reached zero faster when Fe was added than when Crwas added [35]. This was explained by the fact that Fe could easily dissolve inNiAl due
MD: SURYANARAYANA, JOB: 03320, PAGE: 251
4103-X_Suryanarayana_Ch11_R2_080304
Figure 11.6 Variation of the long-range ordered parameter, S, as a function of milling time in
Ni3Al [24] and Ni3Al-B [25] powders.
Disordering of Intermetallics 251

MD: SURYANARAYANA, JOB: 03320, PAGE: 252
4103-X_Suryanarayana_Ch11_R2_080304
to the isomorphous nature of FeAl and NiAl, which is not the case with Cr (Fig.11.10b).
Disordering of intermetallics has been studied primarily by XRD techniques[36]. The presence of superlattice reflections in the XRD pattern confirms the presenceof ordering in the lattice. For example, in a B2-type of structure, the superlatticereflections are those for which (h+ k+ l ) is odd, whereas (h+ k+ l ) is even for thefundamental reflections. Here h, k, and l are the Miller indices of the planes. Theintensity of the superlattice peaks decreases with increasing milling time due to anincrease in the amount of disordering (decrease of long-range order parameter, S).Figure 11.11 shows a series of XRD patterns of the mechanically milled FeAl orderedcompound [37]. One can notice a decrease in the intensity of the superlattice reflectionswith increasing milling time due to a decrease in S. In addition, both the fundamentaland superlattice reflections show peak broadening due to a decrease in crystallite sizeand increase in lattice strain. After sufficient milling, the superlattice reflectionscompletely disappear, indicating that the compound has become completely disor-dered. Therefore, the degree of disordering can be estimated bymeasuring the value ofS at different stages of milling, which in turn can be calculated by measuring theintegrated intensity of the superlattice reflections relative to those of the fundamentalreflections. The value of the long-range order parameter, S, is then calculated using therelationship:
S2 ¼IsðdisÞ=IfðdisÞIsðordÞ=IfðordÞ
ð11:2Þ
where Is and If represent the integrated intensities of the superlattice and fundamentalreflections, respectively, and the subscripts (dis) and (ord) refer to the partiallydisordered and fully ordered states, respectively [36].
It has also been reported that the lattice parameter of the alloy increases slightly(0.3–0.8%) in the disordered state, if disordering occurs by antisite disorder [38] (Fig.11.12), whereas the lattice parameter decreases if disordering occurs by the vacancy-
Figure 11.7 Variation of long-range order parameter, S, with milling time. Three differentsituations, i.e., complete loss of order (Ni3Al), partial loss of order (CuTi), and no loss of order(CoZr) on milling, have been represented.
Chapter 11252
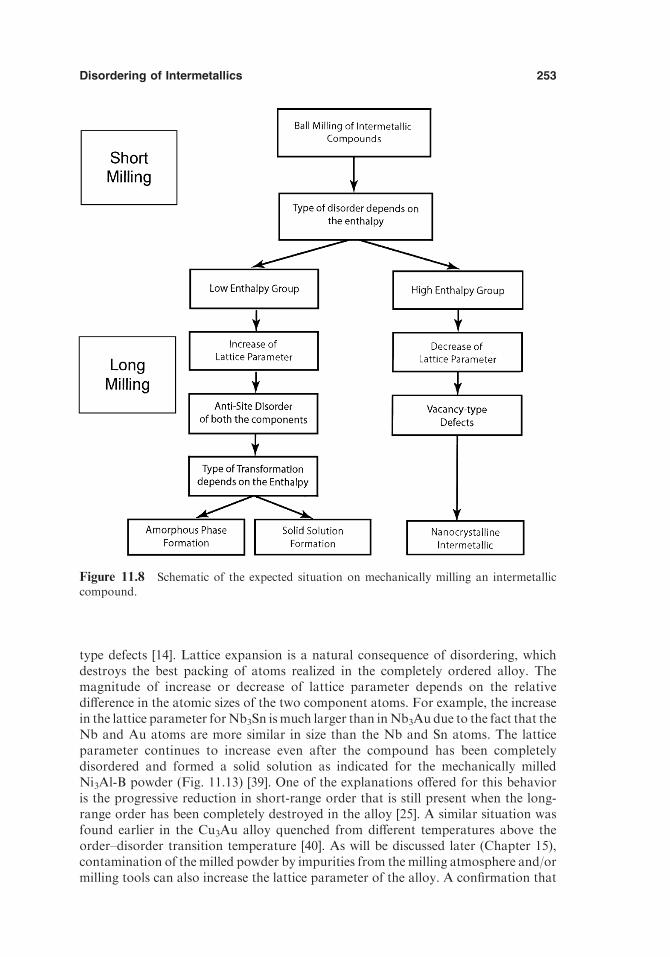
MD: SURYANARAYANA, JOB: 03320, PAGE: 253
4103-X_Suryanarayana_Ch11_R2_080304
type defects [14]. Lattice expansion is a natural consequence of disordering, whichdestroys the best packing of atoms realized in the completely ordered alloy. Themagnitude of increase or decrease of lattice parameter depends on the relativedifference in the atomic sizes of the two component atoms. For example, the increasein the lattice parameter forNb3Sn ismuch larger than inNb3Au due to the fact that theNb and Au atoms are more similar in size than the Nb and Sn atoms. The latticeparameter continues to increase even after the compound has been completelydisordered and formed a solid solution as indicated for the mechanically milledNi3Al-B powder (Fig. 11.13) [39]. One of the explanations offered for this behavioris the progressive reduction in short-range order that is still present when the long-range order has been completely destroyed in the alloy [25]. A similar situation wasfound earlier in the Cu3Au alloy quenched from different temperatures above theorder–disorder transition temperature [40]. As will be discussed later (Chapter 15),contamination of the milled powder by impurities from the milling atmosphere and/ormilling tools can also increase the lattice parameter of the alloy. A confirmation that
Figure 11.8 Schematic of the expected situation on mechanically milling an intermetalliccompound.
Disordering of Intermetallics 253

this is due to a progressive reduction in the short-range order and not a contaminationeffect will be when the increased lattice parameter is completely recovered by annealingthe samples. An inverse linear relationship has been shown to exist between the latticeexpansion and the relative long-range order parameter (Fig. 11.14).
Yavari et al. [41] made an interesting observation during a study of thedisordering of FeAl by MM. They noted that while there was gradual loss of long-range ordering in a coarse-grained alloy, fully ordered and fully disordered regionswere found to coexist in the nanocrystalline FeAl intermetallic. This was inferred bydeconvoluting the 110 peak of the Fe60Al40 compound milled for 30 min (Fig. 11.15).The peak appears to consist of two peaks, one positioned at the diffraction anglecorresponding to that of the fully ordered B2 phase and the other corresponding to thefully disordered bcc solid solution.
The explanation provided for this observation is as follows. When a coarse-grained intermetallic is milled, disordering and other transformations start at thedeformation bands as dislocations move, pile up, and eventually lead to grainrefinement. Under these circumstances, the measured properties, such as latticeparameters, defect densities, and magnetizations, reflect only the average values sincethe intermetallic contains regions, which are partially ordered and partially disor-dered. In this situation, the properties show a continuous variation between those ofthe completely ordered and completely disordered states. However, in those caseswhen one starts with a nanocrystalline ordered alloy, the disordered regions that formduring milling are of the order of the grain size. Therefore, it is possible to have somegrains that are completely disordered and some other grains that are completelyordered. Thus, the lattice parameter of the ordered state changes discontinuously tothat of the disordered state with the destruction of long-range order of the B2structure.
It may also be pointed out in this context that during MM both loss of long-range order and grain refinement take place simultaneously. The difference is that the
MD: SURYANARAYANA, JOB: 03320, PAGE: 254
4103-X_Suryanarayana_Ch11_R2_080304
Figure 11.9 Effect of milling intensity on the long-range order parameter, S, of mechanicallymilled FeAl [31]. Note that while the S value did not reach zero at a milling intensity of 1000
ms�2, it reached 0 when the milling intensity was raised to 4100 ms�2.
Chapter 11254

long-range order parameter is less than 1 in the disordered state. Thus, duringdisordering of nanocrystalline FeAl intermetallic, the lattice parameter seems toincrease suddenly for a particular time of milling, and this increased lattice parametercorresponds to that of the disordered FeAl (Fig. 11.16), explaining the coexistence offully ordered (S= 1) and fully disordered (S= 0) regions in the milled material.
Measurement of change in lattice parameter is not possible if there is a change inthe crystal structure due to disordering. Mossbauer spectroscopy techniques andmeasurement of superconducting transition temperature and/or magnetic suscepti-bility have also been employed to study the disordering phenomenon. Recently, Zhou
MD: SURYANARAYANA, JOB: 03320, PAGE: 255
4103-X_Suryanarayana_Ch11_R2_080304
Figure 11.10 (a) Effect of ternary additions of Fe andCr on long-range order parameter,S, of
mechanically milledNiAl [34]. (b) Change in the long-range order parameter, S, of mechanicallymilled NiAl(Cr) and NiAl(Fe) as a function of milling time [35].
Disordering of Intermetallics 255

and Bakker [42] demonstrated that magnetic measurements are very powerful indetermining the nature of disordering if one of the atoms involved has magneticmoments.
Cho and Koch [28] and Zhou and Bakker [42] studied the disordering behaviorof the CoZr compound having the B2 structure by MM. Even though, with millingtime, the intensities of both the fundamental and superlattice XRD peaks decreased
MD: SURYANARAYANA, JOB: 03320, PAGE: 256
4103-X_Suryanarayana_Ch11_R2_080304
Figure 11.12 Increase in lattice parameter with milling time for the FeAl powder. Theincrease is attributed to antisite disorder, wherein the larger aluminum atoms are
accommodated on the smaller iron atom sites [38].
Figure 11.11 X-ray diffraction patterns of the ordered FeAl compound as a function of
milling time. Notice that the intensity of the superlattice reflections (marked S) decreases withincreasing milling time and that they eventually disappear. The reflections marked F arefundamental [37].
Chapter 11256
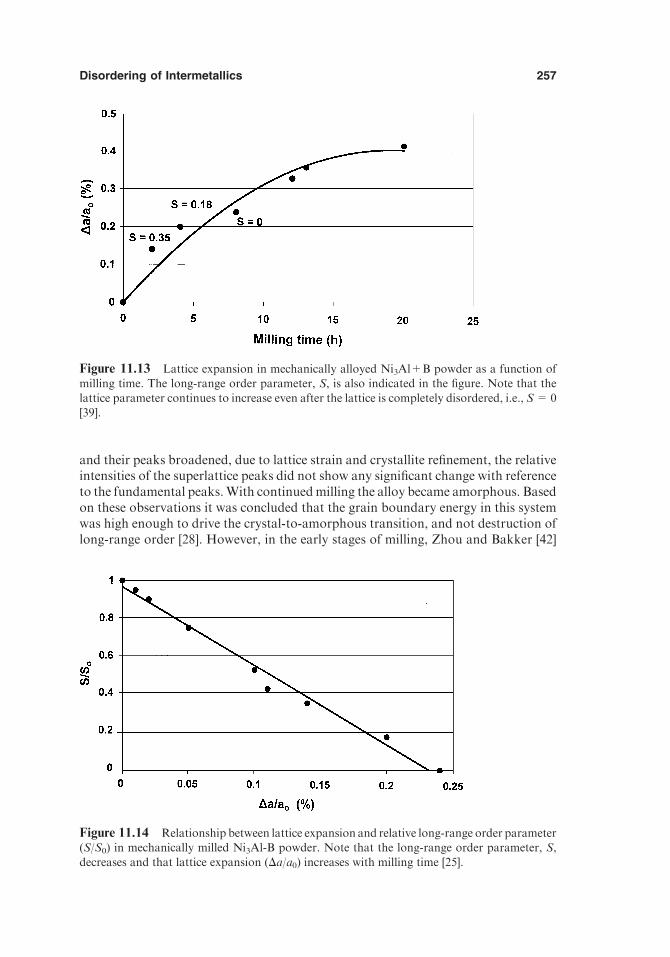
and their peaks broadened, due to lattice strain and crystallite refinement, the relativeintensities of the superlattice peaks did not show any significant change with referenceto the fundamental peaks.With continuedmilling the alloy became amorphous. Basedon these observations it was concluded that the grain boundary energy in this systemwas high enough to drive the crystal-to-amorphous transition, and not destruction oflong-range order [28]. However, in the early stages of milling, Zhou and Bakker [42]
MD: SURYANARAYANA, JOB: 03320, PAGE: 257
4103-X_Suryanarayana_Ch11_R2_080304
Figure 11.14 Relationship between lattice expansion and relative long-range order parameter(S/S0) in mechanically milled Ni3Al-B powder. Note that the long-range order parameter, S,
decreases and that lattice expansion (Da/a0) increases with milling time [25].
Figure 11.13 Lattice expansion in mechanically alloyed Ni3Al+B powder as a function ofmilling time. The long-range order parameter, S, is also indicated in the figure. Note that the
lattice parameter continues to increase even after the lattice is completely disordered, i.e., S=0[39].
Disordering of Intermetallics 257

observed thatmagnetization in themechanicallymilled CoZr alloy,measured at 4.2K,increased with milling time up to about 40 h. They also did not observe any reductionin the relative intensity of the superlattice reflections. The lattice parameter of thedisordered nanocrystalline phase also increased with milling time. The increase inmagnetization has been explained as follows: In the completely ordered alloy, theferromagnetic Co atoms are surrounded by Zr atoms, which makes the magnetizationlow. However, in the partially disordered alloy, when the Co atoms substitute on theZr sublattice, these antisite Co atoms have Co atoms on the Co sublattice as nearest
MD: SURYANARAYANA, JOB: 03320, PAGE: 258
4103-X_Suryanarayana_Ch11_R2_080304
Figure 11.15 (110) Bragg peaks of the Fe60Al40 ordered nanocrystalline powder as a functionof milling time. Note that at amilling time of 30min, the peak appears to be a convolution of the
ordered B2 and disordered bcc peak intensities [41].
Chapter 11258

MD: SURYANARAYANA, JOB: 03320, PAGE: 259
4103-X_Suryanarayana_Ch11_R2_080304
neighbors, leading to an increase in the magnetization. From these two observations(increase in the magnetization and the lattice parameter), Zhou and Bakker [42]concluded that disordering of CoZr occurs by atomic disorder and grain refinement(i.e., creation of additional grain boundaries). Thus, it appears that the magneticproperties are more sensitive to, and a better probe for, studying disordering (in alloysthat contain atoms with magnetic moments) than relative intensities of low-intensityand broadened XRD peaks. A combination of techniques can always shed additionalevidence and provide an accurate account of the mechanism of disordering.
11.5 PHASE SELECTION
Mechanical milling of ordered intermetallics has been shown to result in one of thethree following transformations [14,30,43]:
1. Formation of a solid solution of one component in the other, i.e., formationof the terminal solid solution based on the major component. This has beenobserved in compounds such as Nb3Al, V3Ga, Ni3Al, Fe3Ge, Ni2V, andNbAu2,
2. Formation of an amorphous phase, observed, for example, in Nb3Sn, NiZr,NiV2, and CoZr, or
3. Formation of a different phase with a complex crystal structure, noted inNi3Sn2 and TiSi2.
Thus, the sequence of transformations of an ordered intermetallic onMMcan berepresented as:
Ordered intermetallic ! disordered intermetallic ðor solid solutionÞ
! amorphous phaseð11:3Þ
Figure 11.16 Variation of lattice parameter with milling time for the nanocrystalline FeAl
intermetallic. Note the sudden increase in lattice parameter at 1 h of milling when the alloybecomes completely disordered [41].
Disordering of Intermetallics 259

Whether an ordered intermetallic transforms to a solid solution or an amor-phous phase on milling is determined by the relative free energy values of theamorphous and crystalline phases with respect to the energy stored in the intermetallicby MM (see Fig. 11.1). For example, the intermetallic will transform to the solidsolution if the enthalpy of the amorphous state as estimated by the Miedema analysis[21,44] is higher than that of the solid solution. Thus, if DG (milling) > DGa-c, whereDGa-c represents the difference in free energy between the ordered crystalline andamorphous phases, complete amorphization occurs. On the other hand, ifDG (milling)< DGa-c, no amorphization occurs; instead, a solid solution forms.
Conclusions similar to the above can also be reached by observing the nature ofphase diagrams. If the phase diagram shows that the ordered intermetallic transformsto a (disordered) solid solution before it melts, i.e., it is a reversibly orderedintermetallic, then milling of the intermetallic will result in the formation of a(disordered) solid solution. Continued milling may then produce the amorphousphase. But if the ordered intermetallic melts congruently (irreversibly ordered orpermanently ordered intermetallic), then milling of the intermetallic will produce anamorphous phase directly. This has been shown to be true in a number of cases [14].Thus, introduction of mechanical energy into the system is equivalent to heating thealloy to higher temperatures (Fig. 11.17), i.e., an alloy can become disordered either athigher temperatures or on MM. Depending on the nature of the phase, either meltingor formation of an amorphous phase can occur in some cases. It has been noted thatamong about 700 binary intermetallic compounds only very few compounds such asCuZn and Cu3Au are reversibly ordered compounds, i.e., they exhibit the order–disorder transformation beforemelting. Table 11.3 lists the compounds that have beendisordered byMM. In the table, the third column gives the type of disorder: a questionmark means that the type of disorder has not been investigated; ‘‘antisite’’ meansantisite disorder, ‘‘triple defect’’ means triple-defect disorder, ‘‘quadruple’’ meansquadruple-defect disorder, and ‘‘red. int.’’ means redistribution of interstitials. Thefourth column gives the type of transformation: ‘‘Amorphous’’ means that thecompound has become amorphous after milling and ‘‘SS’’ means that the compoundhas transformed to a solid solution phase; the crystal structure of the solid solution is
MD: SURYANARAYANA, JOB: 03320, PAGE: 260
4103-X_Suryanarayana_Ch11_R2_080304
Figure 11.17 Equivalence of mechanical energy and temperature in disordering of orderedintermetallic compounds.
Chapter 11260

MD: SURYANARAYANA, JOB: 03320, PAGE: 261
4103-X_Suryanarayana_Ch11_R2_080304
Table 11.3 Disordering of Intermetallics by Mechanical Milling
CompoundCrystalstructure
Type ofDisorder Transformation
Phasediagram Ref.
Nb3Al A15 ? SS (bcc) ? 44, 45
Nb3Au A15 Antisite SS (bcc) SS >Tc 46, 47Nb3Sn A15 Antisite Amorphous Liq. 48, 49NiV3 A15 ? SS (bcc) ? 50V3Ga A15 ? SS (bcc) SS > Tc 51
CoAl B2 Triple defect None Irrelevant 52CoGa B2 Triple defect None Irrelevant 53CoZr B2 Antisite Amorphous Liq. 28, 42
FeAl B2 Antisite SS (bcc) 32, 37NiAl B2 Triple defect None Irrelevant 32, 54RuAl B2 Triple defect? None Irrelevant? 27
Fe3Ge2 B82 Red. int. None Irrelevant 55Mn3Sn2 B82 Red. int. None Irrelevant 55LaAu B27 ? Amorphous LTP !
HTP ! liq.
56
NiZr Br ? Amorphous Liq. 57, 58Fe3Ge L12 Antisite SS (bcc) ? 14Ni3Al L12 Antisite SS (fcc) +
amorphous
? 24, 38,
59Ni3Ge L12 ? SS (fcc) +
amorphous? 57, 60
Ni3Si L12 Antisite SS (fcc) ? 28, 61,62
Zr3Al L12 ? Amorphous ? 63
Co41Cr59 j phase ? None j ! y ! liq. 64CoV j phase Disorder Amorphous Liq. 65Cr53Fe47 j phase Disorder SS (bcc) SS > Tc 66FeV j phase ? SS (bcc) SS > Tc 57, 64
NiV2 j phase ? Amorphous j ! j V ! liq. 50Ni4V6 j phase ? Amorphous j ! j V ! liq. 57Co2Ge Co2Si Antisite Amorphous LTP !
HTP ! liq.
67
Co2Ge Ni2In Antisite Amorphous HTP ! liq. 67Co3Sn2 Orthorhombic Red. int. LTP ! HTP LTP ! HTP 68
Cu2MnAl Disorder 69Fe2Sc C14 ? Amorphous ? 70Fe2Y C15 ? Amorphous ? 70
GdAl2 C15 Quadruple None Liq. 71GdIr2 C15 Quadruple None Liq. 15GdMg2 C15 Antisite SS 15GdPt2 C15 Quadruple None Liq. 15
GdRh2 C15 Quadruple None Liq. 15Nb60Au40 A15 + Tetra. ? SS (bcc) SS > Tc 46Nb58Au42 AlB2 + Tetra. ? SS (bcc/fcc) SS > Tc 46
Nb50Au50 AlB2 + Tetra. ? SS (fcc) SS > Tc 46NbAu2 AlB2 ? SS (fcc) SS > Tc 46Ni45Nb55 W6Fe7 ? Amorphous ? 72
Disordering of Intermetallics 261

mentioned within parentheses. ‘‘None’’ means that no transformation was observed,and LTP!HTP means a transformation from the low-temperature phase to a high-temperature phase in the phase diagram. Information on the type of transformationfrom the phase diagram is given in column 5. A question mark means that either theinformation is not available or not clear; ‘‘liq’’means that the compoundmelts directlyfrom its crystal structure, suggesting amorphization; SS > Tc means the formation ofa solid solution above a critical temperature, which could point in the direction offormation of a solid solution.
It should also be realized that contamination could play a significant role indetermining the nature of the final phase formed after milling. For example, it wasshown that MM of the Nb3Al intermetallic in a SPEX mill produced the expected bccsolid solution phase after 3 h. But whenmilling was conducted in an improperly sealedcontainer, an amorphous phase was produced after 10 h, which on heat treatmenttransformed to the crystalline NbN phase. This suggests that the amorphous phase inthis system had formed because of nitrogen contamination of the powder duringmilling [45]. Similarly, contamination of the milled near-equiatomic TiAl powdersresulted in the formation of an fcc phase, which wasmisinterpreted as the formation ofa disordered form of the g-TiAl phase [79].
The crystal structure of the phase alone does not appear to decide whether theintermetallic transforms to a solid solution or an amorphous phase onMM. The threeintermetallics—Ni3Al, Ni3Ge, and Zr3Al—have the L12-type cubic structures. OnMM, both Ni3Al and Ni3Ge form a disordered nanocrystalline fcc solid solution anddo not show any tendency for amorphization. On the other hand, Zr3Al amorphizescompletely after a short milling time. These differences in the milling behavior have
MD: SURYANARAYANA, JOB: 03320, PAGE: 262
4103-X_Suryanarayana_Ch11_R2_080304
Table 11.3 Continued
Compound
Crystal
structure
Type of
Disorder Transformation
Phase
diagram Ref.
Ni3Sn DO19 ? Amorphous LTP !HTP ! liq.
73
Ni3Sn2 Orthorhombic Red. int. LTP ! HTP LTP ! HTP 74
NiTi2 E93 ? Amorphous ? 75Ni3V DO22 ? SS (fcc) SS > Tc 50Ni2V MoPt2 ? SS (fcc) SS > Tc 50
Pd3Zr SS (fcc) 76RuAl B2 A2 (bcc SS) 77TiAl3 DO22 Antisite SS (fcc) ? 78Ti5Si3 D83 ? Amorphous Liq. 78
TiSi2 C54 ? C54 ! C49 Irrelevant 78YCo2 Cu2Mg ? Amorphous ? 13YCo3 CeNi3 ? Amorphous ? 13
Y2Co7 Co7Er2 ? Amorphous ? 13YCo5 Co5Y ? Amorphous ? 13Y2Co17 Ni17Th2 ? Amorphous ? 13
Source: Adapted from Ref. 14.
Chapter 11262

been attributed partly to the differences in the lattice stability in terms of theirrespective disordered fcc phases [80].
It was mentioned earlier that materials in a partially ordered state are strongerthan those that are completely disordered or fully ordered. It was shown that themicrohardness of mechanically milled Ni3Al powders exhibited a pronounced sharpmaximum corresponding to S = 0.5 [24]. This work suggests that the greater is theordering energy, the steeper will be this maximum of strength (or hardness). It mayalso be mentioned in passing that all ordered states (from S= 0 to S= 1) cannot beaccessed by traditional methods of disordering. For example, in equilibrium, the orderparameter for Cu3Au jumps discontinuously from 0.8 to zero at the critical temper-ature. However, MM can be used to obtain different degrees of order so that the effectof order parameter on structure and mechanical properties of the alloys can beinvestigated.
11.6 REORDERING KINETICS
There have also been several studies on reordering kinetics of disordered phasesobtained by MM (see, for example, Refs. 81–85). It was reported that on heating themilled powder in a differential scanning calorimeter, exothermic transformationoccurs over a wide range of temperatures from about 100jC to about 600jC (Fig.11.18). Because of the complex shape of the signal it can be concluded that thetransformation takes place in different stages. It was further noted that the trans-formations that occurred were irreversible since on repeating the thermal cycle on thesame specimen no sign of transformation was detected.
The different processes that contribute to each component of the complexdifferential scanning colorimetric peak have been analyzed using isothermal measure-ments andXRDmethods. The low- temperature low-intensity peak, occurring around170jC, has been attributed to the reestablishment of short-range order. This wasconfirmed by the results obtained from extended electron energy loss fine structure(EXELFS) studies. No other changes could be detected, after long-term annealing at150jC, than the localized creation of the right-ordered atomic environment around theconstituent atoms. On heating the powders to 200jC, a temperature just above thelow-temperature transformation peak, XRD analysis indicated a slight lattice con-traction and an increase of the average crystallite size. Lattice contraction is expectedto occur in the ordered state due to the efficient packing of atoms. The absence of sucha peak during reheating of the mechanically milled elemental powders also indirectlyconfirms this hypothesis since chemical reordering cannot occur in pure metalpowders. The effective activation energy of this process is about 100 kJ/mol for theNi3Al system and does not appear to depend sensibly on the initial degree of order.
The second and more intense major peak has its maximum at about 370jC. Thepeak temperature was found to decrease with increasing milling time but reached aconstant value in the completely disordered samples. This peak is associated with thesimultaneous evolution of ordering and grain growth [82,85]. The apparent activationenergy for the transformation has been found to be lower than expected duringordering of a conventional alloy. The explanation could be that the high density ofpoint defects such as vacancies and antisite defects, generated duringmilling, assist thediffusive processes and help in achieving reordering easily.
MD: SURYANARAYANA, JOB: 03320, PAGE: 263
4103-X_Suryanarayana_Ch11_R2_080304
Disordering of Intermetallics 263

Most of the mechanically milled disordered intermetallics exhibit these twopeaks in their differential scanning colorimetric plots, with the difference that theactual temperatures and peak shapes and heights could be different depending on thenature and composition of the alloy and milling time. In ternary intermetallics,however, a third low-temperature peak, often overlapping the second major peak, isobserved (Fig. 11.18a). Although a clear explanation is not available for the occur-rence of this peak, it is thought that this could be due to annealing out of dislocations,usually not mobile at temperatures as low as those of the first two peaks.
REFERENCES
1. Stoloff, N. S., Sikka, V. K., eds. (1996).PhysicalMetallurgy and Processing of IntermetallicCompounds. New York: Chapman & Hall.
2. Westbrook, J. H., Fleischer, R. L., eds. Intermetallic Compounds: Principles and Practice,Vol. 3, Progress. Chichester, UK: John Wiley & Sons Ltd.
3. Russel, K. C. (1985). Prog. Mater. Sci. 28:229–434.
4. Liu, B. X. (1999). In: Suryanarayana, C., ed. Non-equilibrium Processing of Materials.Oxford: Pergamon, pp. 197–224.
MD: SURYANARAYANA, JOB: 03320, PAGE: 264
4103-X_Suryanarayana_Ch11_R2_080304
Figure 11.18 DSC curves from (a) Ni3Al milled for 4 h and (b) Ni75Al12Fe13 milled for 8 h.Two distinct exothermic peaks can be seen in (a) and an additional low-intensity peak at higher
temperatures in (b) [82].
Chapter 11264

5. Koch, C. C. (1988). Int. Mater. Rev. 33:201–219.6. Boettinger, W., Aziz, M. J. (1989). Acta Met. 37:3379–3391.7. West, J. A.,Manos, J. T., Aziz,M. J. (1991). In: Johnson, L. A., Pope, D. P., Stiegler, J. O.,
eds. High Temperature Ordered Intermetallics IV. Pittsburgh, PA: Materials ResearchSociety, pp. 859–864.
8. Harris, S. R., Pearson,D.H., Garland, C.M., Fultz, B. (1991). J.Mater. Res. 6:2019–2021.
9. Haubold, T., Bohn, R., Birringer, R., Gleiter, H. (1992).Mater. Sci. Eng. A153:679–683.10. Stoloff, N. S., Davies, R. G. (1966). Prog. Mater. Sci. 13:1–84.11. Ermakov, A. E., Yurchikov, E. E., Elsukov, E. P. (1982). Fiz Tverd Tela No 4:1947–1952.
12. Elsukov, E. P., Barinov, V. A., Galakhov, V. R., Yurchikov, E. E., Ermakov, A. E. (1983).Phys. Met. Metallogr. 55(2):119–123.
13. Ermakov, A. E., Yurchikov, E. E., Barinov, V. A. (1981). Phys. Met. Metallogr. 52(6):50–
58.14. Bakker, H., Zhou, G. F., Yang, H. (1995). Prog. Mater. Sci. 39:159–241.15. Modder, I. W., Kuin, M. J., Bakker, H. (1998).Mater. Sci. For. 269–272:619–624.16. Gialanella, S., Amils, X., Baro, M. D., Delcroix, P., Le Caer, G., Lutterotti, L., Surinach,
S. (1998). Acta Mater. 46:3305–3316.17. Navarro, E. PhD thesis, University of Complutense, Madrid, Spain, May 1998.18. Navarro, E., Multigner, E. M., Yavari, A. R., Hernando, A. (1996). Europhys. Lett.
35:307.19. Modder, I. W., Bakker, H. (1997). Phys. Stat. Sol. (b)199:369–378.20. Zhou, G. F., Bakker, H. (1995). Phys. Rev. B52:9437–9445.
21. Bakker, H. (1998). Enthalpies in alloys: Miedema’s semi-empirical model. Mater. Sci.Foundations. Vol. 1.
22. Lo Cascio, D. M. R., Bakker, H. (1991). J. Phys. C: Condens. Matter. 3:5227–5229.
23. Fahnle, M. (1982). J. Low Temp. Phys. 46:3–25.24. Jang, J. S. C., Koch, C. C. (1990). J. Mater. Res. 5:498–510.25. Gialanella, S., Cahn, R. W., Malagelada, J., Surinach, S., Baro, M. D., Yavari, A. R.
(1992). In: Chen, H., Vasudevan, V. K., eds. Kinetics of Ordering Transformations in
Metals. Warrendale, PA: TMS, pp. 161–175.26. Seki, Y., Johnson, W. L. (1990). In: Clauer, A. H., deBarbadillo, J. J., eds. Solid State
Powder Processing. Warrendale, PA: TMS, pp. 287–297.
27. Hellstern, E., Fecht, H. J., Fu, Z., Johnson, W. L. (1989). J. Appl. Phys. 65:305–310.28. Cho, Y. S., Koch, C. C. (1993). J. Alloys & Compounds 194:287–294.29. Bakker, H., Modder, I. W., Zhou, G. F., Yang, H. (1997). Mater. Sci. For. 235–238:
477–486.30. Suryanarayana, C. (2002). In: Westbrook, J. H., Fleischer, R. L., eds. Intermetallic
Compounds. Principles and Practice: Vol. 3, Progress. Chichester, UK: JohnWiley & SonsLtd, pp. 749–764.
31. Poecht, P., Tominez, E., Chaffron, L., Martin, G. (1995). Phys. Rev. B52:4006–4016.32. Schropf, H., Kuhrt, C., Arzt, E., Schultz, L. (1994). Scripta Metall. Mater. 30:1569–1574.33. Murty, B. S., Joardar, J., Pabi, S. K. (1996). J. Mater. Sci. Lett. 15:2171–2172.
34. Murty, B. S., Joardar, J., Pabi, S. K. (1996). Nanostructured Mater. 7:691–697.35. Murty, B. S., Joardar, J., Pabi, S. K. (1997).Mater. Sci. Eng. A226:41–44.36. Suryanarayana, C., Norton, M. G. (1998). X-Ray Diffraction: A Practical Approach. New
York, NY: Plenum Publishing Corp.37. Gialanella, S. (1995). Intermetallics 3:73–76.38. Gialanella, S., Newcomb, S. B., Cahn, R. W. (1992). In: Yavari, A. R., ed. Ordering and
Disordering in Alloys. London: Elsevier Appl. Sci, pp. 67–78.39. Cahn, R.W. (1992). In: Liu, C. T., Cahn, R.W., Sauthoff, G., eds.Ordered Intermetallics–
Physical Metallurgy and Mechanical Behaviour. The Netherlands: Kluwer Acad PubDordrecht, pp. 511–524.
MD: SURYANARAYANA, JOB: 03320, PAGE: 265
4103-X_Suryanarayana_Ch11_R2_080304
Disordering of Intermetallics 265

40. Betteridge, W. (1949). J. Inst. Metals 75:559–570.41. Yavari, A. R., Negri, D., Navarro, E., Deriu, A., Hernando, A., Botta, W. J. (1999).
Mater. Sci. For. 312–314:229–236.
42. Zhou, G. F., Bakker, H. (1996). Scripta Mater. 34:29–35.43. Bakker, H., Zhou, G. F., Yang, H. (1995).Mater. Sci. For. 179–181:47–52.44. Oehring, M., Bormann, R. (1990). J. Phys. Colloq. 51:C4-169–C4-174.
45. Mukhopadhyay,D.K., Suryanarayana, C., Froes, F. H. (1995). In: Phillips,M., Porter, J.,eds. Advances in Powder Metallurgy & Particulate Materials–1995. Vol. 1. Princeton, NJ:Metal Powder Industries Federation, pp. 123–133.
46. Di, L. M., Bakker, H., Barczy, P., Gacsi, Z. (1993). Acta Metall. Mater. 41:2923–2932.47. Di, L. M., Bakker, H. (1992). J. Appl. Phys. 71:5650–5653.48. Di, L. M., Loeff, P. I., Bakker, H. (1991). J. Less-Common Metals 168:183–193.
49. Koch, C. C., Cho, Y. S. (1992). Nanostructured Mater. 1:207–212.50. Yang, H., Bakker, H. (1993). In: deBarbadillo, J. J., et al. eds. Mechanical Alloying for
Structural Applications. Materials Park, OH: ASM International, pp. 401–408.51. Di, L. M., Bakker, H. (1991). J. Phys. C: Condens. Matter. 3:3427–3432.
52. Di, L. M., Bakker, H., de Boer, F. R. (1992). Physica B182:91–98.53. Di, L. M., Bakker, H., Tamminga, Y., de Boer, F. R. (1991). Phys. Rev. B44:2444–2451.54. Gialanella, S., Guella, M., Baro, M. D., Malagelada, J. M., Surinach, S. (1993). In:
deBarbadillo, J. J., et al., eds.Mechanical Alloying for Structural Applications. MaterialsPark, OH: ASM International, pp. 321–325.
55. Zhou, G. F., Bakker, H. (1994). Phys. Rev. B49:12507–12518.
56. Loeff, P. I., Bakker, H. (1988). Scripta Metall. 22:401–404.57. Suzuki, K., Fukunaga, T. (1993). J. Alloys Compounds 194:303–309.58. Weeber, A. W., Bakker, H. (1988). J. Less-Common Metals 141:93–102.
59. Koch, C. C., Jang, J. S. C., Lee, P. Y. (1989). In: Arzt, E., Schultz, L., eds.NewMaterials byMechanical Alloying Techniques. Oberursel, Germany: DGM Informationgesellschaft, pp.101–110.
60. Wernick, J. H. (1967). In: Westbrook, J. H., ed. Intermetallic Compounds. New York, NY:
John Wiley, p. 197.61. Zhou, G. F., Bakker, H. (1994). Acta Metall. Mater. 42:3009–3017.62. Jang, J. S. C., Tsau, C. H. (1993). J. Mater. Sci. 28:982–988.
63. Gialanella, S., Yavari, A. R., Cahn, R. W. (1992). Scripta Metall. Mater. 26:1233–1238.64. Yang, H., Bakker, H. (1994).Mater. Sci. For. 150–151:109.65. Zhou, G. F., Bakker, H. (1994). Intermetallics 2:103–110.
66. Abe, O., Suzuki, Y. (1996).Mater. Sci. For. 225–227:563–568.67. Zhou, G. F., Bakker, H. (1993). Phys. Rev. B48:13383–13398.68. Di, L. M., Zhou, G. F., Bakker, H. (1993). Phys. Rev. B47:4890–4895.69. Robinson, J. S.,McCormick, P. G., Street, R. (1995). J. Phys. C: Condens.Matter. 7:4259–
4269.70. Xia, S. K., Larica, C., Rodriguez, V. A., Rizzo Assunc�ao, F. C., Baggio-Saitovitch, E.
(1996).Mater. Sci. For. 225–227:389–394.
71. Zhou, G. F., Bakker, H. (1994). Phys. Rev. Lett. 73:344–347.72. Schwarz, R. B., Koch, C. C. (1996). Appl. Phys. Lett. 49:146–148.73. Di, L. M., Loeff, P. I., Bakker, H. (1989). Phys. Stat. Sol. (a)117:K99–K101.
74. Zhou, G. F., Di, L. M., Bakker, H. (1993). J. Appl. Phys. 73:1521–1527.75. Schwarz, R. B., Petrich, R. R. (1988). J. Less Common Metals 140:171–184.76. Katona, G. L., Kis-Varga, M., Beke, D. L. (2002).Mater. Sci. For. 386–388:193–198.
77. Liu, K. W., Mucklich, F., Birringer, R. (2001). Intermetallics 9:81–88.78. Oehring,M., Yan, Z.H.,Klassen, T., Bormann,R. (1992).Phys. Stat. Sol. (a)131:671–689.79. Suryanarayana, C. (1995). Intermetallics 3:153–160.80. Benameur, T., Yavari, A. R. (1992). J. Mater. Res. 7:2971–2977.
MD: SURYANARAYANA, JOB: 03320, PAGE: 266
4103-X_Suryanarayana_Ch11_R2_080304
Chapter 11266

81. Yavari, A. R. (1993). Acta Metall. 41:1391–1396.82. Baro, M. D., Surinach, S., Malagelada, J. (1993). In: deBarbadillo, J. J., et al., eds.
Mechanical Alloying for Structural Applications. Materials Park, OH: ASM International,
pp. 343–348.83. Cardellini, F., Contini, V., Mazzone, G. (1995). Scripta Metall. Mater. 32:641–646.84. Gialanella, S., Delorenzo, R., Marino, F., Guella, M. (1995). Intermetallics 3:1–8.
85. Baro, M. D., Malagelada, J., Surinach, S., Clavaguera, N., Clavaguera-Mora, M. T.(1992). In: Yavari, A. R., ed.Ordering and Disordering in Alloys. London: Elsevier, pp. 55–66.
MD: SURYANARAYANA, JOB: 03320, PAGE: 267
4103-X_Suryanarayana_Ch11_R2_080304
Disordering of Intermetallics 267

4103-X_Suryanarayana_Ch11_R2_080304
MD: SURYANARAYANA, JOB: 03320, PAGE: 268

12
Solid-State Amorphization
12.1 INTRODUCTION
A solid alloy with a liquid-like (noncrystalline) atomic arrangement is called a metallicglass or an amorphous (metallic) alloy. A glass is obtained when a liquid is cooled to astate of rigidity without crystallizing; such an alloy will exhibit a glass transitiontemperature. On the other hand, if a material with a similar structure is made by someprocesses other than cooling from the liquid state, then it is called an amorphousalloy.
Amorphous alloys were first synthesized by vapor deposition in the form of thinfilms by Buckel and Hilsch [1]. However, the synthesis of a noncrystalline (glassy)phase by rapid solidification from the liquid state by Pol Duwez and his associates in1960 [2] paved the way for an enormous amount of activity during the last fourdecades. These metallic glasses have an unusual combination of properties such ashigh strength, good bend ductility, high fracture toughness, good corrosion resistance,and desirable soft magnetic properties. Because of this excellent combination ofproperties, metallic glasses have found a variety of industrial applications, the mostimportant of which is for core laminations in distribution transformers. Informationon the synthesis, properties, and applications of metallic glasses produced by thetechnique of rapid solidification processing (RSP) from the melt may be found inseveral reviews and books [3–10].
Noncrystalline alloys (or amorphous alloys or glasses) can now be formed inalloy systems by different nonequilibrium (far from equilibrium) processing tech-niques such as rapid solidification from the liquid state, vapor deposition, plasmaprocessing, and laser processing [3,4,9,10]. In these methods there is a change in thestate of matter, i.e., a solid phase is formed from either the liquid or the vapor phase,
4103-X_Suryanarayana_Ch12_R2_080304
MD: SURYANARAYANA, JOB: 03320, PAGE: 269
269

and the high effective ‘‘quenching’’ rate and the associated undercooling have beenshown to be responsible for formation of the glassy phase. There are also methods ofamorphizing a solid without passing through the liquid state at any stage. Known assolid-state amorphization reactions (SSARs), these include irradiation [11], hydrogen-assisted amorphization [12,13], interdiffusion of elemental metals [14], pressure-induced vitrification [15], and heavy mechanical deformation (cold rolling followedby low-temperature annealing). An amorphous phase was reported to form when theintermetallic Zr3Rh was annealed in a hydrogen atmosphere at a relatively lowtemperature of 200jC [12]; this was attributed to the fast diffusivity of hydrogen intothe intermetallic and formation of an amorphous hydride phase. Schwarz and Johnson[14] have reported amorphization on annealing vapor-deposited multilayer films of Laand Au; again attributed to the fast diffusivity of Au in La. Cold rolling of thin foils ofNi and Zr followed by a low-temperature anneal also produced an amorphous phase[16]. Apart from all these methods, which are being practiced to a limited extent,mechanical alloying (MA) and mechanical milling (MM) have been the most popularmethods for producing amorphous alloys in the solid state [17]. This chapter reviewsthe different aspects of amorphous phases produced in binary and higher order alloysystems by MA/MM. The topics discussed here include the thermodynamic andkinetic aspects of formation, mechanisms and models of phase formation, andtheoretical models for predicting the amorphous phase–forming range. The chapterconcludes with a comparison of the amorphous phases produced by MA and RSP, twopopular nonequilibrium processing techniques.
12.2 AMORPHOUS PHASES BY MA/MM
The synthesis of an amorphous phase in the Ni-Nb system by MA starting fromblended elemental powders of Ni and Nb was first reported in 1983 by Koch et al. [18].Since the Ni-40 at% Nb alloy was known to be a good glass former by RSP, theyinvestigated the effect of MA on the powder blend. They observed that the X-raydiffraction (XRD) pattern of the mechanically alloyed powder blend, milled for 14 h ina SPEX shaker mill, was typical of an amorphous phase and that the pattern wassimilar to the one obtained in the RSP alloy. Thus, they concluded that MA of powderblends could produce amorphous phases. This gave rise to research activity in thesolid-state synthesis of amorphous alloy phases, and since then there have beennumerous reports on formation of amorphous phases by MA in several binary andternary (and a few higher order) alloy systems. In fact, a majority of the recentliterature on MA is concerned with the synthesis and characterization of amorphousalloys obtained by MA and MM [17]. This has been mostly due to the earlier hugesuccess on the production and commercialization of metallic glasses by RSP [19], andto investigate whether MA/MM could offer any advantages. Amorphization ofintermetallic compounds (e.g., YCo3, Y2Co7, and YCo5) by MM was reported earlierby Ermakov et al. [20,21]. Apart from these two combinations, mixtures of interme-tallics and intermetallics/elemental metal powders were also amorphized.
Thus, it is now known that amorphous alloy phases could be synthesized by MAor MM starting from
1. Blended elemental powder mixtures2. Prealloyed powders and/or intermetallics
MD: SURYANARAYANA, JOB: 03320, PAGE: 270
4103-X_Suryanarayana_Ch12_R2_080304
Chapter 12270

3. Mixtures of intermetallics, or4. Mixtures of intermetallics and elemental powders
One of the early reviews, comprehensive at the time of writing and the only onedevoted exclusively to the topic of amorphous phases obtained by milling of powders,was published in 1988 by Weeber and Bakker [22].
An exhaustive listing of the alloy systems and the composition ranges in whichamorphous phases have been found to form by MA and MM is presented in Tables12.1 and 12.2, respectively. Since amorphous phase formation is known to be criticallydependent on the milling conditions, details about the mill, milling container, grindingmedium, ball-to-powder weight ratio (BPR), and other parameters have also beenincluded in these tables.
12.3 DIFFERENCE BETWEEN AMORPHOUS PHASE FORMATIONBY MA AND MM
A point to be considered is whether there exists a difference in the way an amorphousphase forms by MA from a mixture of powders (A and B) and by MM from theintermetallic compound (AmBn).
Starting from blended elemental powders of metals A and B, an amorphousphase could form by MA via different reaction routes. It can form either directly orthrough the formation of an intermetallic or a solid solution phase. These differentpossibilities may be represented as:
mA þ nB ! ðAmBnÞamorphous ð12:1ÞmA þ nB ! ðAmBnÞcrystalline ! ðAmBnÞamorphous ð12:2ÞmA þ nB ! AmðBnÞ ! ðAmBnÞamorphous ð12:3ÞmA þ nB ! AmðBnÞ ! ðAmBnÞcrystalline ! ðAmBnÞamorphous ð12:4Þ
where Am(Bn) represents a solid solution of B in A, (AmBn)crystalline represents acrystalline intermetallic phase, and (AmBn)amorphous represents the amorphous phasewith the composition AmBn. Even though an amorphous phase has eventually formedin all cases, in every case, except the first one, it is preceded by the formation of a solidsolution and/or an intermetallic. In some cases, a (supersaturated) solid solution wasshown to directly transform to an amorphous phase. Occurrence of amorphization byall these routes has been reported in the literature.
The basic difference between MA and MM is that no alloying is required duringMM when prealloyed powders or intermetallics are used. However, during MA, whenone starts with blended elemental powders, alloying is a prerequisite before amorphi-zation can occur and therefore additional time is required for alloying to occur. On theother hand, when the starting material is an intermetallic, i.e., during MM, no alloyingis needed but only amorphization. Thus, intuitively one would expect that the timesrequired for amorphization are shorter during MM than during MA, provided that allthe milling conditions remain the same. Weeber et al. [342] reported that the prealloyedNi-Zr powder could be amorphized much faster than the elemental blend. This wasexplained as being due to the reduction in energy requirement for amorphization by anamount equal to the energy required for alloying. Since prealloyed powders are lessprone to oxidation, crystallization temperature of the amorphous MM powder was
MD: SURYANARAYANA, JOB: 03320, PAGE: 271
4103-X_Suryanarayana_Ch12_R2_080304
Solid-State Amorphization 271

MD: SURYANARAYANA, JOB: 03320, PAGE: 272
4103-X_Suryanarayana_Ch12_R2_080304
Table12.1
Co
mp
osi
tio
nR
an
ges
an
dD
etails
of
Millin
gP
ara
met
ers
for
Fo
rmati
on
of
Am
orp
ho
us
Ph
ase
sin
Ble
nd
edE
lem
enta
lP
ow
der
Mix
ture
sb
yM
ech
an
ical
Allo
yin
ga
Syst
emM
ill
Via
lm
ate
rial
Gri
nd
ing
med
ium
mate
rial
BP
R
Sp
eed
(rp
m)
MA
tim
e(h
)
Gla
ss-f
orm
ing
ran
ge
(at%
)R
ef.
Ag-P
dS
PE
X8000
10.4
:1—
65
50
Pd
23
Al-
18.2
Co
Pla
net
ary
ball
mill
QM
-1F
SS
Hard
ened
stee
l20:1
200
80
24
Al
+A
l 13C
o4
(Al-
15C
o)
Fri
tsch
P5
SS
SS
10:1
150
100
25
Al-
15C
rB
all
mill
SS
SS
120:1
1000
Part
lyA
m.
26
Al-
20C
rB
all
mill
SS
SS
120:1
bP
art
lyA
m.
26
Al-
20C
u-1
5F
eP
lan
etary
ball
mill
QM
-1S
P
Ste
elH
ard
ened
stee
l10:1
200–300
300
27
Al-
20C
u-1
5M
nF
rits
chP
515:1
Int.
5510
28
Al-
15F
eP
lan
etary
ball
mill
Hard
ened
stee
lH
ard
ened
stee
l20:1
—300
—29
Al-
20F
eB
all
mill
170
30
Al-
20F
eF
rits
chP
7H
ard
ened
stee
lH
ard
ened
stee
l6:1
—40
31
Al-
20
Fe
Pla
net
ary
ball
mill
Hard
ened
stee
lC
r-st
eel
20:1
240
32
Al-
24.4
Fe
Ball
mill
SS
SS
90:1
33
Al-
1to
25F
eS
PE
Xm
ill
Ste
el521000
stee
l10:1
—50
25
Fe
34
Al-
25F
eH
ori
zon
tal
ball
mill
SS
SS
90
600
35
Al-
33F
eB
all
mill
SS
90:1
454
36
Al-
40F
eH
ori
zon
tal
ball
mill
SS
SS
50:1
90
35
Al-
Fe
Co
nven
tio
nal
ball
mill
SS
SS
90:1
—454
17–33
Fe
37
Al-
Fe
Pla
net
ary
ball
mill
Ste
elS
teel
230
180
20–50
Fe
38
Al-
27.4
Fe-
28.7
CS
PE
X8000
Hard
ened
stee
lS
S2.3
:1—
48
39
Al-
5F
e-5N
dH
igh
-en
ergy
shak
erm
ill
240
Part
ial;
coex
ists
wit
hfc
c-A
l
40
Al-
7F
e-3Z
rS
PE
X8000
Hard
ened
stee
lH
ard
ened
stee
l10:1
—30
Part
lyA
m.
41
Al-
25G
e-10F
eV
ibra
tory
ball
mill
SS
SS
5:1
—80
42
Al-
50H
f43
Al-
14M
nP
lan
etary
ball
mill
60:1
720
300
c44
Al-
6M
n-2
Ce
Fri
tsch
P5
——
13:1
180
400
45
Al-
20M
n-3
0S
iF
rits
ch20:1
450–650
85
46
Al-
50N
bR
od
mill
400
47
Al-
50N
bR
od
mill
SS
SS
30:1
—40
48
Chapter 12272

MD: SURYANARAYANA, JOB: 03320, PAGE: 273
4103-X_Suryanarayana_Ch12_R2_080304
Al-
Nb
SP
EX
8000
Ste
el52100
Ste
el10:1
—49
Al-
40N
iL
ow
-en
ergy
vib
rati
ng
mill
50
(Al 8
8N
i 8C
o4) 1
00-x
Zr x
Fri
tsch
10:1
120
x=
451
(Al 8
8N
i 8C
o4) 1
00-x
Zr x
Fri
tsch
pla
net
ary
mill
SS
10:1
280
52
Al 8
0N
i 8F
e 4G
d8
53
Al-
33
Ni-
33T
iB
all
mill
SS
SS
100:1
1000
54
Al-
30S
i-15F
e-5N
iS
PE
X8000
Hard
ened
stee
lH
ard
ened
stee
l15:1
—200
—55
Al-
50T
aB
all
mill
SS
SS
30:1
20
56
Al-
50T
aS
SS
S36:1
,108:1
—400
57
Al-
Ta
Ro
dm
ill
SS
SS
30:1
400
33–67
Ta
58,
59
Al-
6T
iA
ttri
tor
SS
Hard
ened
stee
l220:1
1300
60
Al-
12.4
Ti
Att
rito
rS
SH
ard
ened
stee
l220:1
175
400
60
Al-
25T
iF
rits
chP
7H
ard
ened
stee
lH
ard
ened
stee
l10:1
645
28
61
Al-
33.3
Ti
Ro
dm
ill
SS
SS
400
62
Al-
35
to48T
iP
lan
etary
ball
mill
Ste
el30:1
90
63
Al-
45T
iP
lan
etary
ball
mill
60:1
40
64
Al-
23T
i-23C
Pla
net
ary
ball
mill
Ste
el30:1
90
63
Al-
12T
i-7F
eP
lan
etary
ball
mill
SS
SS
100
65
Al 8
5Y
8N
i 5C
o2
Pla
net
ary
ball
mill
Ret
sch
PM
4000
Hard
ened
stee
lH
ard
ened
stee
l15:1
100
On
lya
small
am
ou
nt
of
Am
.
66
Al 8
5Y
8N
i 5C
o2
Fri
tsch
P5
——
13:1
180
280
45
Al 8
8Y
2N
i 6F
e 4P
lan
etary
ball
mill
Ret
sch
PM
4000
Hard
ened
stee
lH
ard
ened
stee
l15:1
100
On
lya
small
am
ou
nt
of
Am
.
66
Al-
50
Zr
Ro
dm
ill
SS
SS
30:1
400
67
Al 2
O3-3
8m
ol%
ZrO
2
Pla
net
ary
ball
mill
G7
Ste
elS
teel
7:1
500/7
00
72
Am
+tr
ace
Al 2
O3
68,
69
Al 2
O3-3
8m
ol%
ZrO
2-3
mo
l%
Y2O
3
Pla
net
ary
ball
mill
G7
Ste
elS
teel
7:1
500/7
00
72
Am
+tr
ace
Al 2
O3
68
Al 2
O3-4
0m
ol%
ZrS
iO4
Pla
net
ary
ball
mill
G7
Ste
elS
teel
7:1
500/7
00
240
69
Au
-45L
aF
rits
chP
0W
C-l
ined
hard
ened
stee
l
WC
-lin
ed
hard
ened
stee
l
130
70
BiF
eO3-2
5m
ol%
Zn
Fe 2
O4
SS
SS
80–110
250
71
Co
-20B
Fri
tsch
P5
Tem
per
edst
eel
10:1
320
45
72
Solid-State Amorphization 273

MD: SURYANARAYANA, JOB: 03320, PAGE: 274
4103-X_Suryanarayana_Ch12_R2_080304
Co
-33B
Fri
tsch
P5
Tem
per
edst
eel
10:1
320
13
72,
73
Co
-33B
Fri
tsch
P5
Tem
per
edst
eel
5.5
:170
Part
lyA
m.
74
Co
-BF
rits
chP
5T
emp
ered
stee
lS
S10:1
250
18–34
33–50
Co
75
Co
-Nb
Att
rito
r,M
itu
i
Miik
eM
A1D
SS
SS
300
60
15–20
Nb
76
Co
-25S
iP
lan
etary
ball
mill
Hard
ened
too
lst
eel
Hard
ened
too
lst
eel
11.3
:1220
77
Co
-66.7
Si
Lab
ball
mill
SS
SS
64:1
360
25
78
Co
-Si
Fri
tsch
P5
SS
SS
9.6
:1200
33
Si
79
Co
-Si
Lab
ball
mill
SS
SS
64:1
360
30
30–70
Si
80
Co
-10
an
d20S
nS
S150:1
110
300
Part
lyA
m.
81
Co
-25T
iF
rits
chP
5S
SS
S17:1
250
382,
83
Co
-25T
iF
rits
chP
5S
SS
S10:1
48
82,
83
Co
-50T
iF
rits
chP
5S
SS
S17:1
250
684
Co
-Ti
Att
rito
r,M
itu
i
Miik
eM
A1D
SS
SS
300
50
15–20
Ti
76
Co
-Ti
Fri
tsch
P5
Tem
per
ed
Cr
stee
l
Tem
per
ed
Cr
stee
l
14:1
2.1
s�1
24
25–67
85
Co
-V60
33–60
V86
Co
-15Z
rH
igh
-en
ergy
ball
mill
300
8.5
87
Co
-45Z
rP
lan
etary
ball
mill
13:1
30
88
Co
-Zr
Pla
net
ary
ball
mill
60
8–73
Zr
86
Cr-
30C
uV
ibra
tio
nal
mill
SS
45:1
100
d,e
89
Cr-
15
to65F
eS
PE
X8000
Hard
ened
stee
lH
ard
ened
stee
l7:1
—28
Fe
90
Cr-
33.3
Nb
Fri
tsch
P7
4:1
60
Part
lyA
m.
91
Cr-
Nb
Pla
net
ary
mill
30–68
Nb
92
Cr-
Nb
-Si
Fri
tsch
P7
Hard
ened
stee
lH
ard
ened
stee
l24
93
Cr-
25S
iP
lan
etary
ball
mill
Hard
ened
too
lst
eel
Hard
ened
too
lst
eel
11.3
:1220
77
Cu
-42N
b-1
4G
eL
ab
mill
WC
-Co
WC
-Co
50:1
24
94
Cu
-42N
b-1
4S
iL
ab
mill
WC
-Co
WC
-Co
50:1
24
94
Cu
-35N
b-2
0S
nL
ab
mill
WC
-Co
WC
-Co
50:1
24
95
Table
12.1
Co
nti
nu
ed
Syst
emM
ill
Via
lm
ate
rial
Gri
nd
ing
med
ium
mate
rial
BP
R
Sp
eed
(rp
m)
MA
tim
e(h
)
Gla
ss-f
orm
ing
ran
ge
(at%
)R
ef.
Chapter 12274

MD: SURYANARAYANA, JOB: 03320, PAGE: 275
4103-X_Suryanarayana_Ch12_R2_080304
Cu
-42N
b-1
4S
nL
ab
mill
WC
-Co
WC
-Co
50:1
24
94,
95
Cu
-50N
b-5
Sn
Lab
mill
WC
-Co
WC
-Co
50:1
24
95
Cu
-11N
i-18P
Ho
rizo
nta
lb
all
mill
SS
SS
30:1
80
300
96
Cu
-20P
Ho
rizo
nta
lb
all
mill
SS
SS
30:1
80
800
Part
lyA
m.
97
Cu
-50
an
d70S
bF
rits
chP
0S
SH
ard
ened
stee
l220:1
Sb
bec
om
es
Am
.
98
Cu
-10
an
d20S
nS
S150:1
110
300
Part
lyA
m.
81
Cu
86-x
Sn
xP
14
Hig
h-e
ner
gy
pla
net
ary
mill
Ste
elH
ard
ened
stee
l10:1
to15:1
—28,x
=4;
20,x
=5;
12,x
=8;
32,x
=10
4–10
Sn
99
Cu
-40T
iP
lan
etary
ball
mill
Ste
elH
ard
ened
stee
l10:1
to15:1
—16
100
Cu
-42T
iF
rits
chP
5S
SS
S4:1
436
43
101
Cu
-50T
iS
PE
X8000
16
Am
+T
iH2
102
Cu
-50T
iS
PE
X8000
Hard
ened
stee
lS
S6:1
—16
103
Cu
-60T
iS
PE
X8000
—42
104
Cu
-Ti
SP
EX
8000
Hard
ened
stee
l8.3
:1—
16
25–50
Ti
105
25–70
Ti
wit
h4
to10
at.
%H
2
Cu
-Ti
To
ol
stee
lo
rW
CW
C3:1
to10:1
613–90
Ti
106
Cu
-55[(
1-x
)Ti
+x
TiH
2]
SP
EX
8000
Hard
ened
stee
l
or
Cu
-Be
—x
=0
an
d0.0
2107
Cu
-20T
i-20Z
rP
lan
etary
ball
mill
Ste
elH
ard
ened
stee
l10:1
to15:1
16
100
Cu
-50V
Fri
tsch
P5
Cu
-Be
Cu
-Be
573
120
108
Cu
-WF
rits
chP
5T
emp
ered
stee
lS
teel
30–90
W109
Cu
-40Z
rF
rits
chS
teel
13:1
20
110
Cu
-40Z
rP
lan
etary
ball
mill
Ste
el13:1
30
88
Cu
-40
to60Z
rS
PE
X8000
Hard
ened
too
lst
eel
440C
stee
l10:1
—13
111
Cu
-42Z
rS
PE
X8001
Hard
ened
stee
l4
112
Cu
-50Z
rS
PE
X8000
Hard
ened
stee
lS
S6:1
—24
113
Cu
-Zr
Fri
tsch
Ste
el13:1
30
40–60
Zr
110,
111
Cu
90-x
Zr x
Ti 1
0
(x=
20–80)
SP
EX
80000
Hig
h-s
pee
dst
eel
Cr
stee
l5:1
—5–10
—114
Cu
80-x
Zr x
Ti 2
0
(x=
30–50)
SP
EX
80000
Hig
h-s
pee
dst
eel
Cr
stee
l5:1
—5–10
—114
Cu
70-x
Zr x
Ti 3
0
(x=
30–40)
SP
EX
80000
Hig
h-s
pee
dst
eel
Cr
stee
l5:1
—5–10
—114
Cu
40Z
r 20T
i 40
SP
EX
80000
Hig
h-s
pee
dst
eel
Cr
stee
l5:1
—5–10
—114
Solid-State Amorphization 275

MD: SURYANARAYANA, JOB: 03320, PAGE: 276
4103-X_Suryanarayana_Ch12_R2_080304
Fe+
FeB
(Fe-
20B
)F
rits
chP
55:1
350
115
Fe-
20
BP
lan
etary
ball
mill
100
116
Fe-
50B
Fri
tsch
WC
50:1
30
117
Fe-
50B
Ball
mill
SS
Hard
ened
stee
l10:1
250
118
Fe-
60B
Ball
mill
SS
Hard
ened
stee
l10:1
300
118
Fe-
BP
lan
etary
ball
mill
SS
15:1
200
35–40
B119
Fe-
15B
-10S
iF
rits
chP
55:1
350
115
Fe-
25C
Ball
mill
SS
Hard
ened
stee
l700
Mo
stly
Am
.
(+a
-Fe)
120
Fe-
70C
Ball
mill
SS
SS
100:1
1000
121
Fe-
CP
lan
etary
ball
mill
SS
15:1
200
72
20–25C
119
Fe-
CB
all
mill
SS
SS
100:1
200
17–60C
122
Fe-
32C
-14S
iB
all
mill
SS
SS
100:1
500
121
Fe-
16C
-16S
iB
all
mill
SS
SS
100:1
500
121
Fe-
30C
-25S
iB
all
mill
SS
SS
100:1
500
121
Fe-
15C
-29S
iB
all
mill
SS
SS
100:1
500
121
(Fe 0
.5C
o0.5
) 60C
u2V
8B
30
Pla
net
ary
ballm
ill
SS
15:1
240
100
—123
Fe-
50C
rF
rits
chP
5S
SS
S430
200
Mille
din
N2
atm
osp
her
e
124
Fe 8
3-x
Cr x
C17
x=
10
to60
Pla
net
ary
ball
mill
11.3
:1200
125
Fe 8
0-x
Cr x
N20
x=
0to
24
Pla
net
ary
ball
mill
11.3
:1200
125
(Fe 0
.5C
u0.5
) 83–87Z
r 13–17
Pla
net
ary
ball
mill
Hard
ened
stee
lH
ard
ened
stee
l15:1
85
126
(Fe 0
.5C
u0.5
) 85Z
r 15
Pla
net
ary
ball
mill
Hard
ened
stee
lH
ard
ened
stee
l15:1
85
127
Fe 8
3-x
Mo
xC
17
x=
5–60
Pla
net
ary
ball
mill
11.3
:1200
125
Fe-
50N
bS
PE
X8000
Hig
h-s
pee
dst
eel
Cr
stee
l5:1
—5
128
Fe+
Ni+
Fe-
B
(Fe 4
0N
i 40B
20)
Fri
tsch
P5
SS
SS
9.6
:1573
280
101
Fe+
Ni+
Fe-
B+
Fe-
P
(Fe 4
0N
i 40P
14B
6)
Fri
tsch
P5
SS
SS
9.6
:1573
24
101
Table
12.1
Co
nti
nu
ed
Syst
emM
ill
Via
lm
ate
rial
Gri
nd
ing
med
ium
mate
rial
BP
R
Sp
eed
(rp
m)
MA
tim
e(h
)
Gla
ss-f
orm
ing
ran
ge
(at%
)R
ef.
Chapter 12276

MD: SURYANARAYANA, JOB: 03320, PAGE: 277
4103-X_Suryanarayana_Ch12_R2_080304
Fe 4
0N
i 40P
20-x
Si x
(x=
6,
10,
14)
Fri
tsch
P7
SS
SS
5:1
——
Part
lyA
m.
129
Fe-
38N
i-12S
i-10B
SP
EX
8000
Hard
ened
too
lst
eel
8:1
—30
Part
lyA
m.
130
Fe-
PP
lan
etary
ball
mill
SS
15:1
200
c25P
131
Fe-
10
an
d20S
iP
lan
etary
ball
mill
300
116
Fe-
15S
i-15B
Pla
net
ary
ball
mill
300
116
Fe-
Si
Lab
ball
mill
SS
SS
64:1
360
250
10–40
Si
80
Fe-
Si
132
Fe-
67S
nP
art
lyA
m.
133,
134
Fe-
33T
iS
PE
X8000
WC
SS
—16
135
Fe-
Ti
SP
EX
8000
WC
-co
ate
dS
S—
136
Fe-
36T
bH
igh
-en
ergy
vib
rati
on
ball
mill
WC
WC
10:1
137
Fe-
VS
PE
X8000
WC
WC
6:1
—24–48
Part
lyA
m.
138
Fe 7
5-x
VxC
25
(x=
0–30)
Pla
net
ary
mill
11.3
:1200
125
Fe-
30W
Fri
tsch
P5
Hard
ened
stee
lH
ard
ened
stee
l10:1
153
1700
139
Fe-
50W
Fri
tsch
P5
Hard
ened
stee
lH
ard
ened
stee
l10:1
153
1700
139
Fe-
16
an
d20Z
rF
rits
chP
5S
teel
Ste
el60
140
Fe-
33Z
rF
rits
chP
5T
emp
ered
stee
l30:1
to90:1
141
Fe-
40Z
rP
lan
etary
ball
mill
13:1
30
88
Fe-
60Z
rF
rits
chS
teel
13:1
20
110
Fe-
Zr
Fri
tsch
P5
Ste
elS
teel
60
20
Zr
140
Fe-
Zr
22–70
Zr
110,
142
Fe-
Zr-
B21–25
Zr
an
d
0–15
B
143
Ge-
SP
lan
etary
ball
mill
Hard
bea
rin
g
stee
l
40:1
60
61–72
S144
Ge-
10,
30,
40,
50
Se
Fri
tsch
SS
SS
—300,
600
—50
Se
145
Ge-
25
to75
w/o
Si
Fri
tsch
P7/P
5T
emp
ered
stee
l146
Hf-
50
Co
SP
EX
8001
Hard
ened
stee
l—
——
3.7
5—
147
Hf-
Cu
Hard
ened
stee
lH
ard
ened
stee
l
or
WC
17
20–90
Cu
148
Hf-
Cu
SP
EX
8000
WC
WC
5:1
—12
30–70
Cu
149,
150
Hf-
Ni
SP
EX
8000
WC
WC
5:1
—12
15–65
Ni
150
Hf-
Ni
Hard
ened
stee
lH
ard
ened
stee
l
or
WC
17
10–85
Ni
148
Solid-State Amorphization 277

MD: SURYANARAYANA, JOB: 03320, PAGE: 278
4103-X_Suryanarayana_Ch12_R2_080304
Hf-
37P
dS
PE
X8001
Hard
ened
stee
l—
——
6—
151,
152
La-A
l-N
iP
lan
etary
ball
mill
WC
-Co
WC
-Co
20:1
180
30–70
La
153
10–50
Ni
Mg-N
iP
lan
etary
ball
mill
——
10:1
——
50–80
Ni
154
Mg-5
0N
iS
PE
X8000
SS
SS
10:1
10
155
Mg
2N
i+N
iP
lan
etary
ball
mill
——
10:1
——
50
Ni
154
MgN
i 2+
Mg
Pla
net
ary
ball
mill
——
10:1
——
50
Ni
154
Mg-N
iP
lan
etary
ball
mill
——
15:1
—120
40–70
Ni
156
Mg-5
7A
l-5C
aS
PE
X8000
52100
stee
l—
1157
Mg-1
5Y
-25C
uP
lan
etary
ball
mill
Ret
sch
PM
4000
Hard
ened
stee
lH
ard
ened
stee
l15:1
170
Part
lyA
m.
66
Mg-1
0Y
-30C
uP
lan
etary
ball
mill
Ret
sch
PM
4000
Hard
ened
stee
lH
ard
ened
stee
l15:1
170
Part
lyA
m.
66
Mg-1
5Y
-30C
uP
lan
etary
ball
mill
Ret
sch
PM
4000
Hard
ened
stee
lH
ard
ened
stee
l15:1
170
Part
lyA
m.
66
Mg-1
0Y
-35C
uP
lan
etary
ball
mill
Ret
sch
PM
4000
Hard
ened
stee
lH
ard
ened
stee
l15:1
170
Part
lyA
m.
66
Mg-1
5Y
-30C
u+
30
vo
l%Y
2O
3
Pla
net
ary
ball
mill
Ret
sch
PM
4000
Hard
ened
stee
lH
ard
ened
stee
l15:1
180
Part
lyA
m.
158
(Mg-1
5Y
-30C
u) 1
00-x
+(C
,S
i,C
e,C
a) x
x=
0.5
–10
at%
Pla
net
ary
ball
mill
Ret
sch
PM
4000
Hard
ened
stee
lH
ard
ened
stee
l15:1
180
Part
lyA
m.
158
Mn
-25S
iP
lan
etary
ball
mill
Hard
ened
too
lst
eel
Hard
ened
too
lst
eel
11.3
:1—
220
77
Mn
-66.7
Si
Lab
ball
mill
SS
SS
64:1
25
78
Mn
-40Z
rP
lan
etary
ball
mill
13:1
30
88
Mo
-47
Ni
SP
EX
8000D
Sim
olo
yer
SS
SS
5:1
—36
Part
lyA
m.
159
Mo
-50N
iS
PE
X8000
Hard
ened
too
lst
eel
10:1
—28
Part
lyA
m.
160
Mo
-25S
iP
lan
etary
ball
mill
20:1
600
m/s
210
min
161
Mo
-25S
iP
lan
etary
ball
mill
Hard
ened
too
lst
eel
Hard
ened
too
lst
eel
11.3
:1—
220
77
Table
12.1
Co
nti
nu
ed
Syst
emM
ill
Via
lm
ate
rial
Gri
nd
ing
med
ium
mate
rial
BP
R
Sp
eed
(rp
m)
MA
tim
e(h
)
Gla
ss-f
orm
ing
ran
ge
(at%
)R
ef.
Chapter 12278

MD: SURYANARAYANA, JOB: 03320, PAGE: 279
4103-X_Suryanarayana_Ch12_R2_080304
Mo
-67
Si
DS
P-1
PP
lan
etra
ry
ball
mill
Ref
ract
ory
allo
y
balls
30:1
—35
162
Nb
-25
an
d33.3
Al
Vib
rati
on
mill
SS
SS
5:1
40–20
163
Nb
-Al
SP
EX
8000
Ste
el52100
stee
l10:1
—25–85
Al
49,
164,
165
Nb
-Fe
Pla
net
ary
ball
mill
QM
-4H
To
ol
stee
lS
S10:1
——
30–70
Fe
166
Nb
-25G
eS
PE
X8000
—5
12–34
Ge
167
Nb
-Ge
Hig
h-e
ner
gy
ball
mill
WC
or
hard
ened
too
lst
eel
WC
or
hard
ened
too
lst
eel
10–16
18–27
Ge
168
Nb
-Ge
SP
EX
8000
Hard
ened
too
lst
eel
440C
stee
l10:1
—10–15
12–30
Ge
169
Nb
-Ge
25–27
168
Nb
75G
e 25-x
Al x
x=
6,1
2,
19
168
Nb
-(x
)G
e-(2
5-x
)S
iH
igh
-en
ergy
ball
mill
WC
or
hard
ened
too
lst
eel
WC
or
hard
ened
too
lst
eel
8x
=6–19
168
Nb
-Mn
35–60
Mn
92
Nb
-16S
iS
PE
X8000
SS
15:1
—4
170
Nb
-25S
iH
igh
-en
ergy
ball
mill
WC
or
hard
ened
too
lst
eel
WC
or
hard
ened
too
lst
eel
8168
Nb
-27S
iS
PE
X8000
WC
-lin
edst
eel
52100
stee
l10:1
—12
171
Nb
-50S
iP
lan
etary
ball
mill
QF
-1
Ste
elS
teel
34:1
150
172
Nb
-66.7
Si
Fri
tsch
P7
4:1
60
Part
lyA
m.
91
Nb
-Sn
25
94,
173
(Nb
0.7
Ta
0.3
) 5S
i 3S
PE
X8000
WC
-lin
edst
eel
52100
stee
l10:1
—171
(Nb
0.8
Ta
0.2
) 5S
i 3S
PE
X8000
WC
-lin
edst
eel
52100
stee
l10:1
—171
Nd
-77F
e-8B
Hig
h-e
ner
gy
ball
mill
WC
WC
40:1
750
100
170
Nd
-74F
e-15M
oL
ab
ball
mill
SS
SS
100:1
95
100
Am
+a
-Fe
+M
o174,
175
Nd
-82F
e-7T
iL
ab
ball
mill
SS
SS
100:1
95
100
Am
+a
-Fe
175
Nd
-74F
e-15T
iL
ab
ball
mill
SS
SS
100:1
95
100
Am
+a
-Fe
174
Nd
-74F
e-15V
Lab
ball
mill
SS
SS
100:1
95
100
Am
+a
-Fe
174,
175
Nd
-81F
e-4T
i-4M
oL
ab
ball
mill
SS
SS
100:1
95
100
Am
+a
-Fe
+M
o174
Ni-
Al
Lab
ball
mill
Hard
ened
stee
lH
ard
ened
stee
l10:1
27–35
Al
176
Ni-
25A
l-25T
iS
PE
X8000
Hard
ened
stee
l10:1
—30
Part
lyA
m.
177
Ni-
Mg
Pla
net
ary
ball
mill
10:1
180
20–50
Mg
154
Ni-
50M
oS
PE
X8000
Hard
ened
too
lst
eel
10:1
—10–32
Part
lyA
m.
178,
179
Ni-
20N
bF
rits
chP
610:1
80
180
Ni-
40N
bF
rits
chP
610:1
85
180
Solid-State Amorphization 279
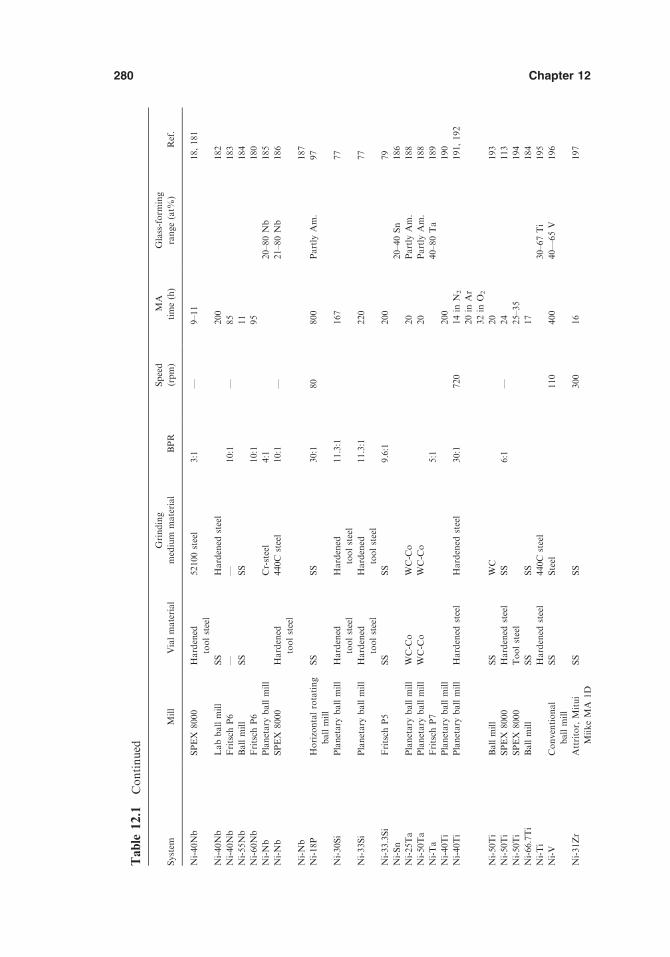
MD: SURYANARAYANA, JOB: 03320, PAGE: 280
4103-X_Suryanarayana_Ch12_R2_080304
Ni-
40N
bS
PE
X8000
Hard
ened
too
lst
eel
52100
stee
l3:1
—9–11
18,
181
Ni-
40N
bL
ab
ball
mill
SS
Hard
ened
stee
l200
182
Ni-
40N
bF
rits
chP
6—
—10:1
—85
183
Ni-
55N
bB
all
mill
SS
SS
11
184
Ni-
60N
bF
rits
chP
610:1
95
180
Ni-
Nb
Pla
net
ary
ball
mill
Cr-
stee
l4:1
20–80
Nb
185
Ni-
Nb
SP
EX
8000
Hard
ened
too
lst
eel
440C
stee
l10:1
—21–80
Nb
186
Ni-
Nb
187
Ni-
18P
Ho
rizo
nta
lro
tati
ng
ball
mill
SS
SS
30:1
80
800
Part
lyA
m.
97
Ni-
30S
iP
lan
etary
ball
mill
Hard
ened
too
lst
eel
Hard
ened
too
lst
eel
11.3
:1167
77
Ni-
33S
iP
lan
etary
ball
mill
Hard
ened
too
lst
eel
Hard
ened
too
lst
eel
11.3
:1220
77
Ni-
33.3
Si
Fri
tsch
P5
SS
SS
9.6
:1200
79
Ni-
Sn
20–40
Sn
186
Ni-
25T
aP
lan
etary
ball
mill
WC
-Co
WC
-Co
20
Part
lyA
m.
188
Ni-
50T
aP
lan
etary
ball
mill
WC
-Co
WC
-Co
20
Part
lyA
m.
188
Ni-
Ta
Fri
tsch
P7
5:1
40–80
Ta
189
Ni-
40T
iP
lan
etary
ball
mill
200
190
Ni-
40T
iP
lan
etary
ball
mill
Hard
ened
stee
lH
ard
ened
stee
l30:1
720
14
inN
2191,
192
20
inA
r
32
inO
2
Ni-
50T
iB
all
mill
SS
WC
20
193
Ni-
50T
iS
PE
X8000
Hard
ened
stee
lS
S6:1
—24
113
Ni-
50T
iS
PE
X8000
To
ol
stee
l25–35
194
Ni-
66.7
Ti
Ball
mill
SS
SS
17
184
Ni-
Ti
Hard
ened
stee
l440C
stee
l30–67
Ti
195
Ni-
VC
on
ven
tio
nal
ball
mill
SS
Ste
el110
400
40—
65
V196
Ni-
31Z
rA
ttri
tor,
Mit
ui
Miik
eM
A1D
SS
SS
300
16
197
Table
12.1
Co
nti
nu
ed
Syst
emM
ill
Via
lm
ate
rial
Gri
nd
ing
med
ium
mate
rial
BP
R
Sp
eed
(rp
m)
MA
tim
e(h
)
Gla
ss-f
orm
ing
ran
ge
(at%
)R
ef.
Chapter 12280

MD: SURYANARAYANA, JOB: 03320, PAGE: 281
4103-X_Suryanarayana_Ch12_R2_080304
Ni-
32Z
rF
rits
chP
5S
teel
Ste
el13:1
20
88
Am
Ni-
32Z
r+
Zr
Fri
tsch
P7
Ste
elS
teel
20
35–72
Zr
198
Ni-
35Z
rF
rits
chP
5S
teel
Ste
el199
Ni-
38Z
rU
ni
ball
mill
60
HE
mo
de
Part
lyA
m.
200
240
LE
mo
de
Ni-
50Z
rS
PE
X8000
Hard
ened
too
lst
eel
440C
stee
l10:1
—18
201
Ni-
50Z
rS
PE
X8000
Hard
ened
stee
lS
S6:1
—24
113
Ni-
50Z
rS
up
erM
isu
ni
NE
V-M
A8
SS
SS
7:1
—15
�180jC
No
Am
.
202
25jC
Part
lyA
m.
200jC
Am
Ni-
60Z
rS
PE
X8000
Hard
ened
too
l
stee
l
440C
stee
l10:1
—12
201
Ni
+N
iZr 2
SP
EX
8000
Hard
ened
too
lst
eel
440C
stee
l10:1
—15
20–60
Zr
203
Ni 1
1Z
r 9+
NiZ
r 2S
PE
X8000
Hard
ened
too
lst
eel
440C
stee
l10:1
—15–76
Zr
201,
203
Ni 1
0Z
r 7+
Ni 2
1Z
r 8
Hard
ened
stee
l21
204
Am
-Ni-
32Z
r
+Z
r
20
35–72
Zr
198
Ni-
Zr
15–73
Zr
110,
142,
198,
205–207
Ni-
Zr
Fri
tsch
P5
SS
SS
710
15–20
20–80
Zr
208
Ni-
Zr
Pla
net
ary
ball
mill
Ste
elH
ard
ened
stee
l35–45
Zr
209
Ni-
Zr
Vib
rato
ryb
all
mill
WC
or
440C
stee
l54:1
32
30–80
Zr
210
Ni-
Zr
Hig
h-e
ner
gy
ball
mill
Ste
el4:1
120
30–80
Zr
206
Ni-
Zr
17–70
Zr
211
Pd
-17S
iL
ab
ball
mill
SS
Hard
ened
stee
l200
212
Pd
-20S
iF
rits
chP
5T
emp
ered
stee
l5:1
10–15
213
Pd
-20S
iW
C-C
oW
C-C
o13
Am
+P
d3S
i214
Pd
-Si
SP
EX
8000
Hard
ened
stee
lS
S5:1
—8
19
Si
215
Pd
-Si
Fri
tsch
P5
13.5
–25
Si
216
Pd
-Ti
WC
-Co
WC
-Co
42–85
Ti
214
PT
FE
-Cu
Vib
rati
on
hig
h-e
ner
gy
mill
SS
SS
47:1
216
PT
FE
-Ni
Vib
rati
on
hig
h-e
ner
gy
mill
SS
SS
47:1
216
Solid-State Amorphization 281

MD: SURYANARAYANA, JOB: 03320, PAGE: 282
4103-X_Suryanarayana_Ch12_R2_080304
Se-
Te
Fri
tsch
P5
SS
SS
——
150
0–20
Te
217
Si-
30F
e218
Si-
10
to20S
nF
rits
chP
7/P
5T
emp
ered
stee
l1.4
:1219
Sm
-87.5
Fe
Pla
net
ary
ball
mill
Ret
sch
PM
4000
Am
(Sm
-Fe)
+a
-Fe
220
Sm
-Fe
SP
EX
8000
Hard
ened
stee
lH
ard
ened
stee
l10:1
—48
Am
(Sm
-Fe)
+a
-Fe
221
Ta-3
0A
lR
od
mill
SS
SS
36:1
85
400
222
Ta-3
3A
lR
od
mill
SS
SS
30:1
85
400
223
Ta-A
lB
all
mill
SS
SS
108:1
85
300
10–90
Al
224
Ta-2
0to
50C
uF
rits
chP
5S
SS
S4:1
Int.
7o
r5
15
20
Cu
225
Ta-2
0to
50C
uF
rits
chP
5C
u-B
eC
u-B
e4:1
Int.
7o
r5
75
30
Cu
225
Ta-3
0C
uS
up
erM
isu
ni
NE
V-M
A8
Cu
-Be
Cu
-Be
60
(200jC
)P
art
lyA
m.
226
Ta-3
0C
uF
rits
chP
5C
u-B
eC
u-B
e7:1
Int.
5120
227
Ta-3
0C
uP
lan
etary
ball
mill
Ste
elS
teel
15:1
100
228
Ta-C
uP
lan
etary
ball
mill
Ste
elS
teel
15:1
30–50
Cu
229
Ta-5
Fe
Fri
tsch
P5
SS
SS
4:1
30
225
Ta-N
iF
rits
chP
7H
igh
spee
dst
eel
Cr-
stee
l5:1
120
20–60
Ni
189
Ta-N
iS
PE
X8000
Hig
hsp
eed
stee
lC
r-st
eel
2:1
—15–20
10–80
Ni
230
Ta-3
7.5
Si
SP
EX
8000
WC
-lin
edS
S52100
stee
l5:1
—12
171,
231
Ti-
24
Al
SP
EX
8000
Ste
el52100
stee
l10:1
232
Ti-
25A
lS
PE
X8000
Hard
ened
too
lst
eel
—9–16
181
Ti-
25A
lS
PE
X8000
WC
8:1
—20–24
233
Ti-
25A
lB
all
mill
SS
SS
100:1
50
234
Ti-
25A
lV
ibra
tio
nm
ill
SS
SS
5:1
25
Am
+
Mic
rocr
yst
allin
e
163
Ti-
50A
lB
all
mill
SS
SS
100:1
500
234
Ti-
50A
lF
rits
chP
5S
SS
S18:1
20
235
Ti-
50A
lS
zegvari
att
rito
r60
236
Ti-
50A
lA
ttri
tor
SS
SS
15:1
150
15
237
Table
12.1
Co
nti
nu
ed
Syst
emM
ill
Via
lm
ate
rial
Gri
nd
ing
med
ium
mate
rial
BP
R
Sp
eed
(rp
m)
MA
tim
e(h
)
Gla
ss-f
orm
ing
ran
ge
(at%
)R
ef.
Chapter 12282
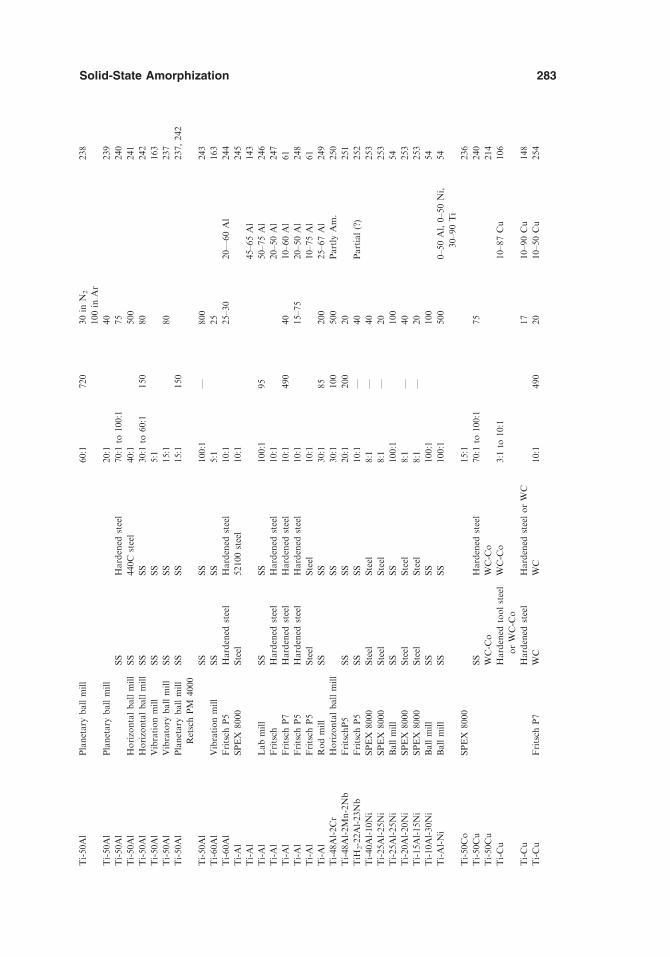
MD: SURYANARAYANA, JOB: 03320, PAGE: 283
4103-X_Suryanarayana_Ch12_R2_080304
Ti-
50A
lP
lan
etary
ball
mill
60:1
720
30
inN
2238
100
inA
r
Ti-
50A
lP
lan
etary
ball
mill
20:1
40
239
Ti-
50A
lS
SH
ard
ened
stee
l70:1
to100:1
75
240
Ti-
50A
lH
ori
zon
tal
ball
mill
SS
440C
stee
l40:1
500
241
Ti-
50A
lH
ori
zon
tal
ball
mill
SS
SS
30:1
to60:1
150
80
242
Ti-
50A
lV
ibra
tio
nm
ill
SS
SS
5:1
163
Ti-
50A
lV
ibra
tory
ball
mill
SS
SS
15:1
80
237
Ti-
50A
lP
lan
etary
ball
mill
Ret
sch
PM
4000
SS
SS
15:1
150
237,
242
Ti-
50A
lS
SS
S100:1
—800
243
Ti-
60A
lV
ibra
tio
nm
ill
SS
SS
5:1
25
163
Ti-
60A
lF
rits
chP
5H
ard
ened
stee
lH
ard
ened
stee
l10:1
25–30
20—
60
Al
244
Ti-
Al
SP
EX
8000
Ste
el52100
stee
l10:1
245
Ti-
Al
45–65
Al
143
Ti-
Al
Lab
mill
SS
SS
100:1
95
50–75
Al
246
Ti-
Al
Fri
tsch
Hard
ened
stee
lH
ard
ened
stee
l10:1
20–50
Al
247
Ti-
Al
Fri
tsch
P7
Hard
ened
stee
lH
ard
ened
stee
l10:1
490
40
10–60
Al
61
Ti-
Al
Fri
tsch
P5
Hard
ened
stee
lH
ard
ened
stee
l10:1
15–75
20–50
Al
248
Ti-
Al
Fri
tsch
P5
Ste
elS
teel
10:1
10–75
Al
61
Ti-
Al
Ro
dm
ill
SS
SS
30:1
85
200
25–67
Al
249
Ti-
48A
l-2C
rH
ori
zon
tal
ball
mill
SS
30:1
100
500
Part
lyA
m.
250
Ti-
48A
l-2M
n-2
Nb
Fri
tsch
P5
SS
SS
20:1
200
20
251
TiH
2-2
2A
l-23N
bF
rits
chP
5S
SS
S10:1
—40
Part
ial
(?)
252
Ti-
40A
l-10N
iS
PE
X8000
Ste
elS
teel
8:1
—40
253
Ti-
25A
l-25N
iS
PE
X8000
Ste
elS
teel
8:1
—20
253
Ti-
25A
l-25N
iB
all
mill
SS
SS
100:1
100
54
Ti-
20A
l-20N
iS
PE
X8000
Ste
elS
teel
8:1
—40
253
Ti-
15A
l-15N
iS
PE
X8000
Ste
elS
teel
8:1
—20
253
Ti-
10A
l-30N
iB
all
mill
SS
SS
100:1
100
54
Ti-
Al-
Ni
Ball
mill
SS
SS
100:1
500
0–50
Al,
0–50
Ni,
30–90
Ti
54
Ti-
50C
oS
PE
X8000
15:1
236
Ti-
50C
uS
SH
ard
ened
stee
l70:1
to100:1
75
240
Ti-
50C
uW
C-C
oW
C-C
o214
Ti-
Cu
Hard
ened
too
lst
eel
or
WC
-Co
WC
-Co
3:1
to10:1
10–87
Cu
106
Ti-
Cu
Hard
ened
stee
lH
ard
ened
stee
lo
rW
C17
10–90
Cu
148
Ti-
Cu
Fri
tsch
P7
WC
WC
10:1
490
20
10–50
Cu
254
Solid-State Amorphization 283

MD: SURYANARAYANA, JOB: 03320, PAGE: 284
4103-X_Suryanarayana_Ch12_R2_080304
Ti-
20C
u-2
4N
i-4S
i-2B
SP
EX
8000
Hard
ened
stee
lH
ard
ened
stee
l5:1
—32
255
Ti-
40
to60M
nF
rits
chP
6T
iT
i5:1
to7:1
460
55–40
256
Ti-
24.3
Ni
Ball
mill
110
400
257
Ti-
33N
iB
all
mill
SS
SS
17
184
Ti-
33N
iS
PE
X8000
Hard
ened
stee
lH
ard
ened
stee
l258
Ti-
35N
iS
PE
X8000
Hard
ened
stee
lH
ard
ened
stee
l11
181
Ti-
40N
iP
lan
etary
ball
mill
30:1
720
15
min
259
Ti-
50N
iB
all
mill
SS
SS
90:1
300
260
Ti-
Ni
Fri
tsch
P7
WC
WC
10:1
Int.
620
h10–70
Ni
254
Ti-
Ni
SP
EX
8000
Hard
ened
stee
l35–50
Ni
261
Ti 5
0N
i xA
l 50-x
x=
10,
25
253
Ti 6
0N
i xA
l 40-x
x=
15,
20
253
Ti 6
0N
i 1-x
Cu
x
(x=
10,
20,
an
d30)
Fri
tsch
P7
WC
WC
10:1
14–40
x=
30
part
lyA
m.
262
Ti-
(40-x
)Ni-x
Cu
Fri
tsch
P7
WC
WC
10:1
490
18
x=
10–20
254
Ti-
(50-x
)Ni-x
Cu
Fri
tsch
P7
WC
WC
10:1
490
18
x=
10–30
254
Ti-
(60-x
)Ni-x
Cu
Fri
tsch
P7
WC
WC
10:1
490
18
x=
10–40
254
Ti-
18N
i-15C
uS
PE
X8000
Ste
el52100
stee
l10:1
—16
263
Ti-
Ni-
Cu
Fri
tsch
P7
WC
WC
10:1
14–40
10–30
Ni
10–30
Cu
262
Ti-
18N
i-10F
e-16S
iS
PE
X8000
6:1
—30
264
Ti-
Pd
SP
EX
8000
WC
-Co
or
hard
ened
stee
l
WC
-Co
or
hard
ened
stee
l
5:1
17
15–58
Pd
214,
265
Ti-
30P
d-2
0C
uW
C-C
oW
C-C
o214
Ti-
35S
iB
all
mill
180
266
Ti-
37.5
Si
Fri
tsch
P5
Cr
stee
lC
rst
eel
10:1
153
Am
+T
i 5S
i 3267
Ti-
37.5
Si
Vib
rati
on
mill
SS
SS
5:1
60
163
Ti-
37.5
Si
Ho
rizo
nta
lb
all
mill
SS
440C
stee
l40:1
500
241
Ti-
37.5
Si
SP
EX
8000
SS
Hard
ened
stee
l5:1
—24
268
Ti-
66.7
Si
Lab
ball
mill
SS
SS
64:1
25
269
Ti-
Si
Vib
rom
ill
Hard
ened
stee
lW
C-C
o37
16–63
Si;
Part
lyA
m.
63–7
Si
270
Table
12.1
Co
nti
nu
ed
Syst
emM
ill
Via
lm
ate
rial
Gri
nd
ing
med
ium
mate
rial
BP
R
Sp
eed
(rp
m)
MA
tim
e(h
)
Gla
ss-f
orm
ing
ran
ge
(at%
)R
ef.
Chapter 12284

MD: SURYANARAYANA, JOB: 03320, PAGE: 285
4103-X_Suryanarayana_Ch12_R2_080304
Ti-
Si
Ball
mill
SS
SS
50:1
300
20–50
Si
271
Ti-
50V
Fri
tsch
P5
SS
20:1
7272
Ti-
50Z
rF
rits
chP
5S
SS
S5:1
24
273
Ti-
50Z
rF
rits
chP
5S
SS
S20:1
285
269
Ti-
38Z
r-17N
iF
rits
chP
7S
SS
S8:1
3,2
00
7274
TiH
1.9
24-2
5A
lS
PE
X8000
Ste
el52100
stee
l10:1
—30
275
TiH
1.9
24-5
0A
lS
PE
X8000
Ste
el52100
stee
l10:1
30
275
Ti-
22A
l-23N
bF
rits
chP
5—
——
335
40
Part
lyA
m.
276
TiH
2-2
2A
l-23N
bF
rits
chP
5—
——
335
40
Part
lyA
m.
276
V-4
0N
iB
all
mill
SS
SS
110
800
270
V-2
5S
iF
rits
chP
5S
SS
S10:1
280
30
277
V-3
7.5
Si
SP
EX
8000
WC
-lin
edS
S52100
stee
l10:1
—12
231
V-S
i25–50
Si
278
W-5
0F
eB
all
mill
SS
SS
30:1
85
300
279
W-5
0F
eB
all
mill
SS
SS
30:1
250
400
280
W-F
eF
rits
chP
5H
ard
ened
stee
lH
ard
ened
stee
l20:1
30–70
Fe
281
Y-N
i-B
-CS
up
erM
isu
ni
NE
VM
A-8
Hard
ened
stee
lH
ard
ened
stee
l10:1
—300
282
15:1
64
Y-N
i-B
-C+
15
wt%
Fe
Su
per
Mis
un
i
NE
VM
A-8
Hard
ened
stee
lH
ard
ened
stee
l10:1
—64
282
Y2O
3-B
aO
2-C
uO
SP
EX
8000
WC
WC
6:1
—25
283
Zn
-Ti
Pla
net
ary
ball
mill
Ste
elH
ard
ened
stee
l6:1
to10:1
—26
40
Ti
284
Zr-
30A
lA
ttri
tor
ZrO
2b
alls
10:1
45
285
Zr-
50A
lS
PE
X8000
Ste
el52100
stee
l10:1
—7
286
Zr-
Al
SP
EX
8000
SS
SS
4:1
—24
17.5
–30
Al
287
Zr-
Al
SP
EX
8000
SS
SS
4:1
—24
17.5
–40
Al
288
Zr-
Al
SP
EX
8000
Hard
ened
stee
lW
C4:1
—12
17.5
–40
Al
289
Zr 6
5A
l 10C
u25-x
Ni x
x=
5–20
Pla
net
ary
ball
mill
Ret
sch
PM
4000
Hard
ened
stee
lH
ard
ened
stee
l15:1
100
290
Zr 6
5A
l 7.5
Cu
17.5
Ni 1
0P
lan
etary
ball
mill
Ret
sch
PM
4000
Hard
ened
stee
lH
ard
ened
stee
l15:1
60
66
Zr 6
5A
l 7.5
Cu
17.5
Ni 1
0+
10
vo
l%A
lN,
TiN
,
or
Si 3
N4
NE
V-M
A8
vib
rati
ng
mill
SS
SS
15:1
—40
291
Zr 5
5C
u30A
l 10N
i 5P
lan
etary
ball
mill
Ret
sch
PM
4000
Hard
ened
stee
lH
ard
ened
stee
l14:1
150
100–200
292
Zr 5
0A
l 13.8
Cu
26.2
Ni 1
0P
lan
etary
ball
mill
Ret
sch
PM
4000
Hard
ened
stee
lH
ard
ened
stee
l15:1
60
66
Solid-State Amorphization 285

MD: SURYANARAYANA, JOB: 03320, PAGE: 286
4103-X_Suryanarayana_Ch12_R2_080304
Zr 4
1.2
Al 1
3.8
Cu
26.2
Ni 1
8.8
Pla
net
ary
ball
mill
Ret
sch
PM
4000
Hard
ened
stee
lH
ard
ened
stee
l15:1
60
66
(Zr 6
5A
l 7.5
Cu
17.5
Ni 1
0) 1
00-x
Fe x
(x=
0–20)
Pla
net
ary
ball
mill
Ret
sch
PM
4000
Hard
ened
stee
lH
ard
ened
stee
l15:1
100
293,
294
Zr 6
0A
l 10C
u18N
i 9C
o3
6:1
36
295,
296
Zr 6
0A
l 10C
u18N
i 9C
o3
SP
EX
8000
6:1
Part
lyA
m.
297
Zr 5
5C
u30A
l 10N
i 5+
5to
15
vo
l%C
aO
Pla
net
ary
ball
mill
Ret
sch
PM
4000
Hard
ened
stee
lH
ard
ened
stee
l14:1
150
100–200
Am
+C
aO
292
Zr 5
5C
u30A
l 10N
i 5+
5to
30
vo
l%Z
rC
Pla
net
ary
ball
mill
Ret
sch
PM
4000
Hard
ened
stee
lH
ard
ened
stee
l14:1
150
100–200
Am
.+
ZrC
292
Zr-
Co
Fri
tsch
P5
Ste
elS
teel
15:1
60
27–92
Co
298
Zr-
50C
uS
SS
S40:1
200
299,
300
Zr-
50C
uH
ori
zon
tal
ball
mill
SS
SS
20:1
80
400
Am
301
240
No
Am
ph
ase
Zr-
40F
eF
rits
ch13:1
20
110
Zr-
Fe
Fri
tsch
P5
Ste
elS
teel
15:1
60
30–78
Fe
298
Zr-
Fe
Hard
ened
stee
lH
ard
ened
stee
lo
rW
C17
20–50
Fe
148
Zr-
Mn
Fri
tsch
P5
Ste
elS
teel
15:1
60
20–85
Mn
298
Zr-
Ni
Fri
tsch
P5
Ste
elS
teel
15:1
60
27–83
Ni
298
Zr-
25N
i-20A
lP
lan
etary
ball
mill
Ret
sch
PM
4000
Ste
elS
teel
23:1
200
44
302
Zr-
NiZ
r 2S
PE
X8000
Hard
ened
too
lst
eel
440C
stee
l10:1
—15
24–27
Ni
203
Zr-
Pd
45–60
Pd
303
Zr-
20P
d-1
0N
iP
lan
etary
ball
mill
Tem
per
edC
rst
eel
Tem
per
ed
Cr
stee
l
14:1
250
48
304
Zr-
25R
hS
PE
X8001
Hard
ened
stee
l—
——
Part
lyA
m.
305
Zr-
50R
hS
PE
X8001
Hard
ened
stee
l—
——
6305
Table
12.1
Co
nti
nu
ed
Syst
emM
ill
Via
lm
ate
rial
Gri
nd
ing
med
ium
mate
rial
BP
R
Sp
eed
(rp
m)
MA
tim
e(h
)
Gla
ss-f
orm
ing
ran
ge
(at%
)R
ef.
Chapter 12286

MD: SURYANARAYANA, JOB: 03320, PAGE: 287
4103-X_Suryanarayana_Ch12_R2_080304
Zr 5
5T
i 2.5
Cu
27.5
Ni 1
5P
lan
etary
ball
mill
Ret
sch
PM
4000
Hard
ened
stee
lH
ard
ened
stee
l15:1
100
290
Zr 6
5T
i 7.5
Cu
17.5
Ni 1
0P
lan
etary
ball
mill
Ret
sch
PM
4000
Hard
ened
stee
lH
ard
ened
stee
l15:1
60
66
Zr 5
0T
i 13.8
Cu
26.2
Ni 1
0P
lan
etary
ball
mill
Ret
sch
PM
4000
Hard
ened
stee
lH
ard
ened
stee
l15:1
60
66
Zr 5
5T
i 13.8
Cu
26.2
Ni 1
8.8
Pla
net
ary
ball
mill
Ret
sch
PM
4000
Hard
ened
stee
lH
ard
ened
stee
l15:1
60
66
Zr 4
8.9
Ti 9
.5C
u29.6
Ni 1
2P
lan
etary
ball
mill
Ret
sch
PM
4000
Hard
ened
stee
lH
ard
ened
stee
l15:1
100
290
Zr 2
2.5
Ti 3
0C
u30N
i 17.5
Pla
net
ary
ball
mill
Ret
sch
PM
4000
Hard
ened
stee
lH
ard
ened
stee
l15:1
100
290
Zr 1
1.9
Ti 3
3.4
Cu
42.7
Ni 1
0P
lan
etary
ball
mill
Ret
sch
PM
4000
Hard
ened
stee
lH
ard
ened
stee
l15:1
100
290
Zr 5
Ti 4
5C
u30N
i 20
Pla
net
ary
ball
mill
Ret
sch
PM
4000
Hard
ened
stee
lH
ard
ened
stee
l15:1
100
290
Zr-
29V
WC
-lin
ed
hard
ened
stee
l
Hard
ened
stee
l140
299
ZrO
2-2
0m
ol%
MgO
Pla
net
ary
G7
Ste
elS
teel
7:1
500–700
188
Am
+cu
bic
ZrO
268
ZrO
2-T
iO2
Lab
pla
net
ary
ball
mill
AG
O-2
Ste
elS
teel
700
15
min
Part
ial
Am
ZrO
2306
ZrO
2.n
H2O
-TiO
2
nH
2O
Lab
pla
net
ary
ball
mill
AG
O-2
Ste
elS
teel
700
15
min
306
SS
,S
tain
less
stee
l.a
All
the
com
po
siti
on
sare
exp
ress
edin
ato
mic
per
cen
t,u
nle
sso
ther
wis
esp
ecifi
ed.
Th
esu
bsc
rip
tsin
colu
mn
1(u
nle
ssit
isth
ech
emic
al
form
ula
of
the
com
po
un
d)
rep
rese
nt
the
ato
mic
per
cen
tage
of
the
elem
ent
inth
ep
ow
der
mix
ture
.b
MA
/1000
h+
an
nea
lat
740
K+
qu
ench
.c
Inh
yd
rogen
atm
osp
her
e.d
Arg
on
-nit
rogen
mix
ture
.e
Arg
on
-air
mix
ture
.
Solid-State Amorphization 287
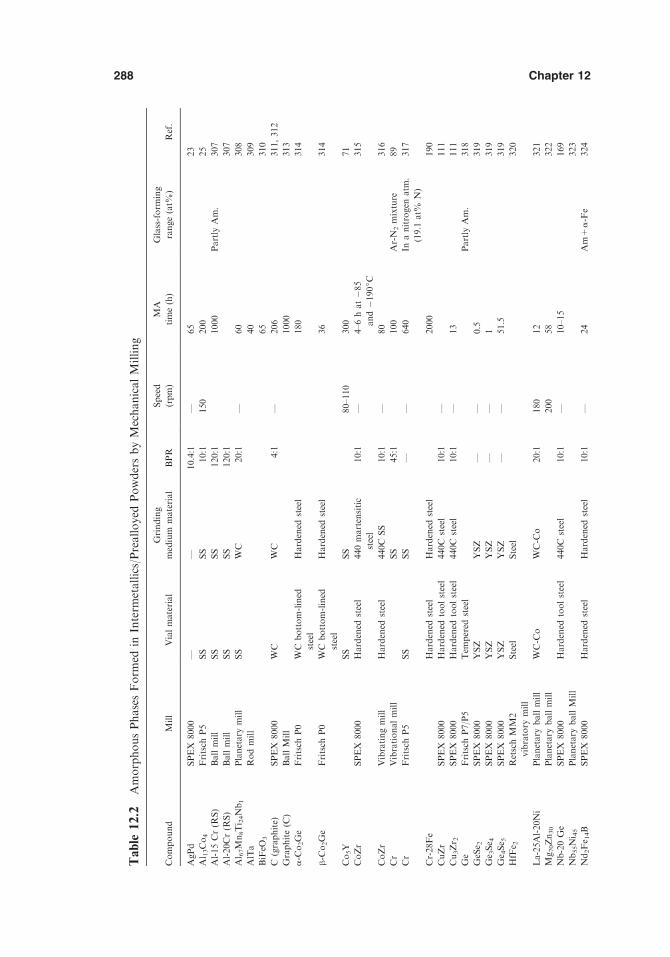
MD: SURYANARAYANA, JOB: 03320, PAGE: 288
4103-X_Suryanarayana_Ch12_R2_080304
Table
12.2
Am
orp
ho
us
Ph
ase
sF
orm
edin
Inte
rmet
allic
s/P
reallo
yed
Po
wd
ers
by
Mec
han
ical
Millin
g
Co
mp
ou
nd
Mill
Via
lm
ate
rial
Gri
nd
ing
med
ium
mate
rial
BP
R
Sp
eed
(rp
m)
MA
tim
e(h
)
Gla
ss-f
orm
ing
ran
ge
(at%
)R
ef.
AgP
dS
PE
X8000
——
10.4
:1—
65
23
Al 1
3C
o4
Fri
tsch
P5
SS
SS
10:1
150
200
25
Al-
15
Cr
(RS
)B
all
mill
SS
SS
120:1
1000
Part
lyA
m.
307
Al-
20C
r(R
S)
Ball
mill
SS
SS
120:1
307
Al 6
7M
n8T
i 24N
b1
Pla
net
ary
mill
SS
WC
20:1
—60
308
AlT
aR
od
mill
40
309
BiF
eO3
65
310
C(g
rap
hit
e)S
PE
X8000
WC
WC
4:1
—206
311,
312
Gra
ph
ite
(C)
Ball
Mill
1000
313
a-C
o2G
eF
rits
chP
0W
Cb
ott
om
-lin
ed
stee
l
Hard
ened
stee
l180
314
h-C
o2G
eF
rits
chP
0W
Cb
ott
om
-lin
ed
stee
l
Hard
ened
stee
l36
314
Co
5Y
SS
SS
80–110
300
71
Co
Zr
SP
EX
8000
Hard
ened
stee
l440
mart
ensi
tic
stee
l
10:1
—4–6
hat�
85
an
d�
190jC
315
Co
Zr
Vib
rati
ng
mill
Hard
ened
stee
l440C
SS
10:1
—80
316
Cr
Vib
rati
on
al
mill
SS
45:1
100
Ar-
N2
mix
ture
89
Cr
Fri
tsch
P5
SS
SS
——
640
Ina
nit
rogen
atm
.
(19.1
at%
N)
317
Cr-
28F
eH
ard
ened
stee
lH
ard
ened
stee
l2000
190
Cu
Zr
SP
EX
8000
Hard
ened
too
lst
eel
440C
stee
l10:1
—111
Cu
3Z
r 2S
PE
X8000
Hard
ened
too
lst
eel
440C
stee
l10:1
—13
111
Ge
Fri
tsch
P7/P
5T
emp
ered
stee
lP
art
lyA
m.
318
GeS
e 2S
PE
X8000
YS
ZY
SZ
——
0.5
319
Ge 3
Se 4
SP
EX
8000
YS
ZY
SZ
——
1319
Ge 4
Se 5
SP
EX
8000
YS
ZY
SZ
——
51.5
319
HfF
e 2R
etsc
hM
M2
vib
rato
rym
ill
Ste
elS
teel
320
La-2
5A
l-20N
iP
lan
etary
ball
mill
WC
-Co
WC
-Co
20:1
180
12
321
Mg
70Z
n30
Pla
net
ary
ball
mill
200
58
322
Nb
-20
Ge
SP
EX
8000
Hard
ened
too
lst
eel
440C
stee
l10:1
—10–15
169
Nb
55N
i 45
Pla
net
ary
ball
Mill
323
Nd
2F
e 14B
SP
EX
8000
Hard
ened
stee
lH
ard
ened
stee
l10:1
—24
Am
+a
-Fe
324
Chapter 12288

MD: SURYANARAYANA, JOB: 03320, PAGE: 289
4103-X_Suryanarayana_Ch12_R2_080304
Nd
-77F
e-8B
Hig
h-e
ner
gy
ball
mill
SS
18:1
24
325
Ni 3
Al
Invic
tavib
rato
r
mill
BX
920/2
Hard
ened
too
lst
eel
440C
SS
10:1
50
Part
lyA
m.
326
Ni 6
0N
b40
Fri
tsch
P6
10:1
85
183
Ni 4
5N
b55
Ball
mill
SS
SS
14
184
Ni 4
5N
b7V
48
Pla
net
ary
ball
mill
Part
lyA
m.
323
Ni 3
5–45N
b45–50V
5–20
Pla
net
ary
ball
mill
Part
lyA
m.
323
Ni 3
5–45N
b32V
23–33
Pla
net
ary
ball
mill
Part
lyA
m.
323
Ni 5
Si 2
Fri
tsch
P5
SS
SS
9.6
:1200
79
NiT
iS
PE
X8000
Hard
ened
stee
l440C
stee
l10:1
18
at
220jC
,
13
at
60jC
,2
at�
190jC
315
NiT
i 2B
all
mill
SS
SS
14
184
Ni 4
5V
55
Pla
net
ary
ball
mill
Part
lyA
m.
323
Ni 1
0Z
r 7F
rits
chP
0W
CH
ard
ened
stee
l95
327
NiZ
rS
PE
X8000
Hard
ened
too
lst
eel
440C
stee
l10:1
—18
201
NiZ
rF
rits
chP
5S
SS
S30:1
48
328
Ni-
60
Zr
SP
EX
8000
Hard
ened
too
lst
eel
440C
stee
l10:1
—8
201
NiZ
r 2S
up
erM
isu
ni
NE
V-M
A8
SS
SS
7:1
202
Pd
-32N
i-20P
Pla
net
ary
ball
mill
WC
-Co
WC
-Co
20:1
180
24
321
Sb
-12G
aB
all
mill
Agate
16
329
Se
Pla
net
ary
ball
mill
At
<50jC
330
Se
Su
per
Mis
un
i
Nis
shin
Gik
en
8:1
10
331,
332
Se
Hig
h-E
ner
gy
Ball
Mill
SS
SS
10:1
4h
10
min
333
Si
Fri
tsch
P7/P
5T
emp
ered
stee
lS
teel
1.4
:1In
t.5
or
10
70–95
219
Si
SP
EX
8000
Hard
ened
too
lst
eel
440C
stee
l8:1
—38
Part
lyA
m.
334
Si
Vib
rato
rym
ill
Hard
ened
Ste
elH
ard
ened
Ste
el15:1
126
SiC
(a)
WL
-P
lan
etary
ball
mill
Hard
ened
Ste
elH
ard
ened
Ste
el40:1
60
Part
lyA
m.
335
Talc
Vib
rati
on
mill
Ste
elS
teel
336
Ti-
33N
iB
all
mill
SS
SS
14
184
Ti-
33N
iS
PE
X8000
Hard
ened
stee
lH
ard
ened
stee
l258
TiN
iS
PE
X8000
To
ol
stee
l440C
stee
l10:1
—13
337
Ti-
18N
i-15C
u(R
S)
SP
EX
8000
16
263
Ti 5
Si 3
Fri
tsch
P5
Cr
stee
lC
rst
eel
10:1
228
Part
lyA
m.
267
TiV
Fri
tsch
P5
SS
20:1
100
b272
Solid-State Amorphization 289

MD: SURYANARAYANA, JOB: 03320, PAGE: 290
4103-X_Suryanarayana_Ch12_R2_080304
VF
rits
chP
5S
SS
S520
Ina
N2
atm
(24.3
at%
N)
317
YC
o2
Ball
mill
Ste
elS
teel
110
300
20,
113,
338
YC
o3
20
YC
o5
Ball
mill
Ste
elS
teel
110
300
113,
338
YN
i 2B
2C
Pla
net
ary
ball
mill
Ret
sch
PM
4000
WC
WC
56:1
50
339
YP
d5B
3C
0.3
Pla
net
ary
ball
mill
Ret
sch
PM
4000
WC
WC
56:1
50
339
Zr 2
Co
Pla
net
ary
ball
mill
Hard
ened
stee
l300
m/s
2340
ZrC
oP
lan
etary
ball
mill
Hard
ened
stee
l600
m/s
2340
ZrF
e 2R
etsc
hM
M2
vib
rato
rym
ill
Ste
elS
teel
320
Zr 2
Ni
202
Zr 7
0P
d30
Fri
tsch
P5
Cr-
Ste
elC
r-S
teel
14:1
2.1
s�1
72
341
ZrS
iO4
Pla
net
ary
G7
Ste
elS
teel
7:1
500–700
240
68
SS
,S
tain
less
stee
l.
Table
12.2
Co
nti
nu
ed
Co
mp
ou
nd
Mill
Via
lm
ate
rial
Gri
nd
ing
med
ium
mate
rial
BP
R
Sp
eed
(rp
m)
MA
tim
e(h
)
Gla
ss-f
orm
ing
ran
ge
(at%
)R
ef.
Chapter 12290

MD: SURYANARAYANA, JOB: 03320, PAGE: 291
4103-X_Suryanarayana_Ch12_R2_080304
higher. However, in some cases it has been reported that the times for the formation ofa fully amorphous phase are approximately the same in both MA and MM cases(reported in Ref. 184).
Formation of a crystalline intermetallic phase has been reported to occur beforeamorphization in Cu-Ti [105], Fe-Sn [134], Nb-Ge [169], Nb-Si [172], Nb-Sn [173], Ni-Zr [209], and Ti-Ni-Fe-Si [264], among others. In some instances, it has also beenreported that a solid solution forms first which on continued milling becomesamorphous. This has been reported to be true in case of Ta-Al [223], Ti-Al [232,245], Zr-Al [289,343], and several other alloy systems. In some systems, it was reportedthat MA of the blended elemental powder mixture results, with increasing milling time,in the sequential formation of phases of solid solution, followed by an intermetallicand finally an amorphous phase [163,344]. Whether an intermetallic or a solid solutionphase forms before amorphization depends on the relative free energies of the solidsolution and the intermetallic phases; the phase with the lower free energy forms first.On the other hand, if the amorphous phase has the lowest free energy of all thesecompeting phases, it forms directly without any other phase forming prior to that. (SeeChapter 11 for a brief thermodynamic explanation for this feature).
In general, the end product is the same irrespective of whether the startingmaterial is a mixture of the elements, a single intermetallic phase, or a mixture of twoor more such phases. This has been shown to be true in the Nb-Al system, where anamorphous phase was obtained whether the starting material was an intermetallic orblended elemental powder mixture. However, in the Mg-Zn system, it has beenreported that an amorphous phase could be produced only by MM starting fromthe intermetallic Mg70Zn30 and not by MA starting from the blended elementalpowder mixture of the Mg-30Zn composition [322]. On the other hand, an Fe-33Tipowder mixture could be amorphized by MA whereas the intermetallic Fe2Ti couldnot be amorphized by MM [135]. Reasons for differences in these behaviors will bediscussed later.
Amorphization in ordered alloys seems to follow the sequence [326]:
Ordered phase ! disordered phase ðloss of long-range orderÞ !Bne grained ðnanocrystallineÞ phase ! amorphous phase
ð12:5Þ
The formation of an amorphous phase can occur, at least in some cases, without theloss of long-range order (see Chapter 11 for examples that illustrate this behavior).
12.4 EFFECT OF PROCESS VARIABLES
Even though it may appear that any alloy can be made amorphous under appropriateconditions of milling, this has not been possible in all the cases. It is possible that theright conditions have not been obtained in these cases. This is because a number ofvariables, the more important of them being milling energy, milling temperature, andimpurity contamination, control the constitution of the final product. This observa-tion is similar to what was reported in the case of amorphization of alloys by thetechnique of RSP. It was reported [3–10] that any alloy could be amorphized underappropriate solidification rates, but these rates may be so high that it may not possibleto achieve them in practice.
The effect of process variables during MA on the amorphization behavior hasbeen studied in several alloy systems. Among these, the most important variables
Solid-State Amorphization 291

studied are milling energy (including higher BPR) and milling temperature. Sincepowder contamination also has been shown to be a key factor in the amorphizationprocess, this also has been discussed. The effect of other process variables wasdiscussed in Chapter 5.
12.4.1 Milling Energy
The kinetic energy of the grinding medium (balls) (E = ½mv2 ), where m is the mass ofthe balls and v is the relative velocity with which they move) can be increased byincreasing either the mass or the relative velocity of the balls. Increased milling energy(also achieved by use of higher BPR, increased speed of rotation, and so forth) isnormally expected to introduce more strain and consequently increase the defectconcentration in the powder, leading to easier and faster amorphization. However,higher milling energies also produce more heat (and higher temperatures), and this canresult in the crystallization of the amorphous phase. Therefore, a balance betweenthese two effects determines the nature of the final product phase. If the defectconcentration predominates, then an amorphous phase forms. On the other hand, ifthe temperature rise is higher so that recovery and recrystallization occur, theamorphous phase, even if it had formed, crystallizes during the milling process.
It was reported in the Ni-Zr system that milling in a planetary ball mill at anintensity of 3 did not produce any amorphous phase [211]; this was due to theinsufficient energy available at low intensities. However, when the intensity wasincreased to 5, amorphous phase formation was observed in a wide compositionrange of 17–70 at% Zr. At an intensity of 7, amorphous phase formation wasobserved, but only between 25 and 34 at% Zr. These observations suggest that withincreasing milling energy, the heat generated is high enough to raise the temperature ofthe powder above the crystallization temperature of the amorphous phase. Conse-quently, crystallization of the amorphous phase takes place. Similar results were alsoreported in other systems [196,322,345,346]. Thus, it appears that the maximalamorphization range is observed at intermediate values of milling intensity—toolow an intensity does not provide enough energy to amorphize, whereas at very highintensities the amorphous phase formed crystallizes.
It has also been reported that increasing the BPR has a similar effect. It wasshown in the Al-Ta system that a fully amorphous phase was obtained only at a BPRof 36:1 or 108:1. When the BPR used was 12:1 a crystalline phase was obtained,whereas at a BPR of 324:1 a mixture of amorphous and crystalline phases wasobtained [57].
It has been known for some time now that formation of metastable phases ingeneral, and amorphous phases in particular, is observed only when the millingconditions during MA/MM are not very severe. For example, Gerasimov et al. [340]reported that an amorphous phase could be obtained only under soft millingconditions. ‘‘Soft’’ milling conditions means that the milling energy/intensity is nothigh. In this study, the authors had used small-diameter grinding medium. On theother hand, when ‘‘hard’’ milling conditions were used (by increasing the diameter ofthe grinding medium), only a crystalline phase was produced. Many such examples areavailable in the literature [213,244,278,301]. Therefore, it may be safely concluded thatmetastable phases (including amorphous phases) could be produced only under softmilling conditions. Hard milling conditions produce less ‘‘metastable’’ (where the
MD: SURYANARAYANA, JOB: 03320, PAGE: 292
4103-X_Suryanarayana_Ch12_R2_080304
Chapter 12292
departure from equilibrium is less than in the other case) phases, including theequilibrium phases.
In some cases an amorphous phase may form at both low and high millingintensities, provided that the temperature rise at the high milling intensity is notsufficient to cause crystallization of the amorphous phase produced. However, thedifference may be in the time required for amorphization. It has been reported thatamorphization in a Ni-38 at% Zr powder mixture requires 60 h in a high-energy modein a Uni-Ball mill whereas 240 h is required at low and intermediate energies; even thenthe product is only partly amorphous [200].
12.4.2 Milling Temperature
There have been conflicting reports on the effect of milling temperature on the natureof the phase formed. Koch et al. [315] summarized the results of varying thetemperature of the mill on the kinetics of amorphization in intermetallics. Theyconcluded that generally a lower milling temperature led to faster formation of theamorphous phase. Since a nanostructured material can be easily produced at lowertemperatures of milling, the increased grain boundary area drives the crystal-to-amorphous transformation. For example, the time required for amorphization in NiTiwas 2 h at �190jC, 13 h at 60jC, and 18 h at 220jC [315]. Similar results were alsoreported by some others [327].
Figure 5.4a showed the grain size obtained at different milling temperatures forthe CoZr intermetallic. It may be seen that the grain size is smaller at lower millingtemperatures; therefore it is easier to form the amorphous phase at lower millingtemperatures. Note also the band representing the critical grain size for amorphiza-tion. The milling time required for obtaining an amorphous phase as a function of thenormalized milling temperature (ratio of the milling temperature to the meltingtemperature) is plotted for NiTi, CoZr, and NiZr2 intermetallics in Fig. 5.4b. Thisfigure confirms that the times are shorter at lower homologous temperatures [347].While a majority of the limited number of studies follow the above behavior, there is atleast one example in which the reverse behavior was reported. Lee et al. [202] observedthat the amorphization kinetics were faster at higher temperatures of milling. Theyindicated that while no amorphization occurred in the NiZr and NiZr2 intermetallicsafter milling for 15 h at �180jC, full amorphization was observed for the same millingtime at 200jC. A partially amorphous phase formed at an intermediate temperature of25jC. This was explained on the basis of the increased interdiffusion rates at highertemperatures. Later experiments by Koch [347] confirm that, in accordance with theirearlier results, rapid amorphization was achieved in the NiZr2 compound at lowertemperatures.
Room temperature MA of Zr-Al blended elemental powders is known toproduce an hcp solid solution of Al in Zr up to 10 at% Al. Amorphization was foundto occur beyond this concentration range, i.e., the crystal-to-amorphous transition inthe Zr-Al system seems to proceed under a polymorphic constraint. In other words,there is no observable two-phase (solid solution + amorphous phases) coexistenceregion as would be expected from a common tangent rule if a metastable two-phaseequilibrium was established. In contrast to this, milling at higher temperatures, say upto 573 K, clearly revealed a two-phase solid solution + amorphous phase region. Theauthors calculated the Gibbs free energy values for the solid solution and amorphous
MD: SURYANARAYANA, JOB: 03320, PAGE: 293
4103-X_Suryanarayana_Ch12_R2_080304
Solid-State Amorphization 293

phases and noted that the crossover point occurs at 10 at% Al at room temperature.On increasing the temperature, the crossover point shifted to higher Al contents andalso increased the width of the two-phase region. In fact, as Figure 12.1 shows, thewidth of the two-phase region increased from almost zero at room temperature toabout 17 at% Al at 573 K [343]. This was explained using the concept of g, theparameter that represents the ratio of the frequencies of atomic jumps caused byexternal forcing and that due to thermal diffusion (see Chapter 9 for details of thediscussion of the g parameter). However, such studies have not been reported in otheralloy systems.
12.4.3 Powder Contamination
Mechanical alloying/milling introduces contamination into the milled powder and thiscan substantially alter the constitution and stability of the powder product (seeChapter 15 for full details of this aspect). Generally, the presence of additionalelements favors amorphization since the increased number of species makes it difficultto allow arrangement of the constituent atoms into a well-crystallized structure. (Thisis very similar to the confusion principle enunciated for the formation of amorphousphases by RSP of liquid alloys and so frequently obeyed [9,10].) For example, it hasbeen reported that an amorphous phase was obtained in ball-milled Fe-Cr alloypowders only in the presence of oxygen; an intermetallic formed in the absence ofoxygen [124]. A similar situation was obtained in MM of Nb3Al powders where adisordered solid solution was produced when milled in a clean atmosphere whereas anamorphous phase formed in the presence of nitrogen [348]. Al-Ti [60] and Ni-Nb [187]systems also exhibited similar behavior. Substantial pickup of nitrogen and oxygen
MD: SURYANARAYANA, JOB: 03320, PAGE: 294
4103-X_Suryanarayana_Ch12_R2_080304
Figure 12.1 Increased two-phase (solid solution + amorphous) region at higher temper-atures of milling in the Zr-Al system [343].
Chapter 12294

was found to be the reason for amorphization observed in Ti-50 at% Al powders.Improved atmospheric control prevented amorphization even after milling for 100 h[349].
While the above results suggest that nitrogen contamination has increased thestability of the amorphous phase, there are also reports where the stability of theamorphous phase was known to decrease due to contamination. That is, the amor-phous phase is no longer stable, but a crystalline phase forms. (There are also somereports where continued milling of an amorphous phase results in the formation ofequilibrium crystalline phases, referred to as mechanical crystallization. This aspectwill be discussed later.) Formation of a crystalline phase has been reported oncontinued milling of Ti-Al powders after the formation of an amorphous phase[350]. Chemical analysis of the powder, fine-structure analysis by X-ray photoelectronspectroscopy techniques, and lattice parameter measurements strongly suggested thatthis fcc crystalline phase is due to increased nitrogen contamination of the milledpowder and the crystalline phase has been identified as TiN [351]. Similar results werereported on milling of Zr-Al powder [289].
Sometimes, iron contamination from the grinding medium and milling containercan be so high as to substantially alter the powder composition. For example, SaLisboa et al. [55] milled an Al-30 at% Si-15 at% Fe-5 at% Ni powder blend in a SPEX8000 mill for 200 h to produce an amorphous phase. They noted that an amorphousphase was formed. However, chemical analysis of the powder showed that excessivecontamination by Fe occurred and that the final composition of the powder was Al-18at% Si-48 at% Fe-3 at%Ni. Therefore, it was concluded that formation of theamorphous phase was due to increased Fe concentration in the powder.
12.5 THERMODYNAMICS AND KINETICS OF AMORPHOUSPHASE FORMATION
Metallic glasses have been obtained by rapidly solidifying the melts of appropriatecompositions in a number of binary, ternary, and higher order alloy systems [3–10,352]. It has been well established that, among other conditions, the likelihood ofobtaining a glassy phase is very high near deep eutectics. This was explained on thebasis of the higher reduced glass transition temperature, Trg (defined as the ratio of theglass transition temperature, Tg, to the melting point of the alloy, Tm, i.e., Trg = Tg/Tm). Since the glass transition temperature does not change very much with compo-sition, but the melting point of the alloy is drastically reduced at the eutecticcomposition, the Trg value is quite large. And the larger the Tgr value, the easier it isto obtain metallic glasses by quenching from the liquid state. This was one of the mostimportant criteria in selecting the composition of an alloy to investigate whether itwould form a glassy phase or not by rapid solidification from the liquid state [10]. Infact, it is the very large Trg values of alloys that are responsible for obtaining bulkmetallic glasses in millimeter section thickness in multicomponent alloys [353].
The situation in mechanically alloyed materials appears to be quite different. Forexample, most commonly amorphous phases are reported to form by MA aroundequiatomic compositions, irrespective of the nature of the phase diagram [354]. Thisobservation can be rationalized with reference to Figure 12.2. A hypothetical binaryphase diagram featuring some solid solubility on either end and also exhibiting thepresence of an intermetallic phase is shown in Figure 12.2a. a is the terminal solid
MD: SURYANARAYANA, JOB: 03320, PAGE: 295
4103-X_Suryanarayana_Ch12_R2_080304
Solid-State Amorphization 295

solution of B in A, h is the terminal solid solution of A in B, g is the intermetallic, and Lrepresents the liquid phase. The Gibbs free energy of the different phases at atemperature Tr is shown as a function of composition in Figure 12.2b, assuming thatthe free energy of the undercooled liquid fairly accurately represents the free energy ofthe amorphous phase. At this temperature, a, h, g, and mixtures of these phases arethermodynamically stable, whereas L is metastable.
The equiatomic blended elemental powder mixture has a free energy, Gc,corresponding to point 1 in Figure 12.2b, half way along the straight line joining thefree energies of the two pure metals A and B. If the two component elements A and Bare allowed to interdiffuse freely, then the lowest free energy state corresponding to theformation of the g phase, Gi (point 3), will be obtained. Even though thermodynam-ically this is the lowest free energy state, this can be kinetically prevented fromoccurring when the free energy Ga, corresponding to the formation of an amorphousphase (point 2), is reached.
Preventing the reaction c (crystalline elemental mixture) ! i (intermetallic) fromoccurring and favoring the c ! a (amorphous) to occur is possible by a proper choiceof metals A and B, the reaction temperature Tr, and the reaction time tr. Schwarz and
MD: SURYANARAYANA, JOB: 03320, PAGE: 296
4103-X_Suryanarayana_Ch12_R2_080304
Figure 12.2 (a) Hypothetical binary phase diagram featuring limited solid solubility on bothends and also showing the presence of an intermetallic phase. (b) Gibbs free energy vs.
composition at a temperature corresponding to Tr in the above diagram. Note that points 1, 2,and 3 represent the free energy values of the mixture of A and B, amorphous phase, and theintermetallic, respectively.
Chapter 12296

Johnson [14] proposed that two conditions must be satisfied for an amorphous phaseto form from a thin-film couple (or a blended elemental powder mixture). The twocomponents must have a large negative heat of mixing and asymmetrical diffusioncoefficients. That is, one of the components must be capable of diffusing much fasterthan the other. The condition of a large negative heat of mixing in the liquid(amorphous) state provides the thermodynamic driving force for the reaction tooccur. Other investigators [355,356] have also confirmed the importance of the largenegative heat of mixing. Hellstern and Schultz [355] demonstrated this by studying theglass-forming ability of several titanium-containing transition metal alloys. Systemssuch as Cu-Ti, Ni-Ti, and Co-Ti with a large negative heat of mixing could becompletely amorphized, whereas Fe-Ti, Mn-Ti, and Cr-Ti could be only partiallyamorphized due to their smaller heat of mixing. The isomorphous V-Ti system did notamorphize at all because a solid solution always formed on milling the powdermixture. Alloy systems with a positive heat of mixing have also been amorphized byMA in recent years. Thus, a large negative heat of mixing appears to be an essentialcondition for glass formation by RSP and not necessary for MA/MM. The secondcriterion of largely different diffusion rates into each other and in the amorphous alloyphase favors kinetics of the reaction path c ! a in Figure 12.2b over that of reactionpath c! i. This asymmetry in the diffusivities has been correlated with the difference inatomic sizes for several elements [354].
The reaction temperature is another important parameter. If the temperature atwhich milling is conducted is high, then formation of the amorphous phase would notbe generally expected. This is because the temperature rise during milling and the hightemperature of milling together may result in a situation wherein the temperatureattained by the powder is higher than the crystallization temperature of the amor-phous phase. Consequently, even if the amorphous phase were to form, it wouldcrystallize. This has been shown to be true when higher milling intensities or higherBPR values were employed during milling, i.e., ‘‘hard’’ milling conditions wereemployed. In this respect, it is better that milling be carried out at a relatively lowtemperature if formation of an amorphous phase is desired. Furthermore, diffusion ofone element into the other is slow at low temperatures; consequently, nucleation andgrowth of the intermetallic would not take place.
In some cases, it has been reported that an additional heat treatment, after MAof the powder blend, facilitates formation or completion of formation of theamorphous phase. In the case of an Al-15 at% Cr alloy powder mixture, only partialamorphous phase formation was observed after milling for 1000 h in a low-energy ballmill. However, when this milled powder was annealed at 740 K and quenched, a fullyamorphous phase was obtained [26]. A similar observation was made in the Ta-Cusystem [357]. In general, a lower temperature of milling favors amorphization. It wasalso reported that on milling a Co-Ti powder mixture, only an intimate mixture of theCo and Ti phases was observed at short milling time, say 1 h. But, when this fine-grained mixture was heated to a higher temperature (externally), amorphous phaseformation was noted [85]. The authors designated this process as thermally enhancedglass formation reaction (TEGFR). It is important to realize that alloying is alwaysfacilitated when the components are distributed evenly and on a fine scale. That is whyit was suggested that deformation-induced layer refinement during MA is an impor-tant component of the amorphization reaction in addition to the large negative heat ofmixing [356].
MD: SURYANARAYANA, JOB: 03320, PAGE: 297
4103-X_Suryanarayana_Ch12_R2_080304
Solid-State Amorphization 297

The reaction time scales also are important because not only should one allowthe formation of the amorphous phase, but one should also maintain it withouttransforming to the equilibrium phases. These concepts can be explained withreference to Figure 12.3. As in Figure 12.2, we assume that the free energies of theblended elemental mixture is Gc, that of the amorphous phase Ga, and that of theintermetallic is Gi, as shown schematically in Figure 12.3. To prevent the stableintermetallic from forming, the time scale for the formation of the amorphous phasefrom the blended elemental mixture, i.e., tc!a, should be much shorter than tc!i, thetime scale for the formation of the intermetallic from the blended elemental powdermixture. Furthermore, since the amorphous phase is metastable, ta!i should be muchlonger than tc!a so that the stability of the amorphous phase can be increased. Thus,the kinetic conditions for the formation of an amorphous phase by solid-statereactions can be summarized as
tc!ab tc!i and ta!i H tc!a ð12:6Þ
12.6 MECHANISMS AND MODELS FOR AMORPHIZATION
The mechanism of amorphization by MA and/or MM is not clearly understood. Earlyinvestigators [20,21] assumed that the powder particles melted because of the very hightemperatures experienced instantaneously by the powder particles due to the high rateof plastic deformation and the large amount of energy transferred to the powderparticles by the milling medium. Subsequent quenching of the liquid by heat con-duction into the less deformed, and hence cooler, interior regions of the particlesresulted in the formation of the amorphous phase (as in RSP). However, energy inputcalculations and temperature estimates and measurements suggest that the tempera-
MD: SURYANARAYANA, JOB: 03320, PAGE: 298
4103-X_Suryanarayana_Ch12_R2_080304
Figure 12.3 Schematic free energy diagram indicating the time scale criteria to be met for
solid state amorphization reaction. Gi represents the free energy of the stable equilibriumcrystalline phase, Gc the free energy of the metastable crystalline phase with higher free energy,and Ga the free energy of the amorphous phase. Gc can be achieved either by disordering the
intermetallic, or mixing two layers of the metals, or by introducing hydrogen gas into thesystem.
Chapter 12298
ture rise is not large enough for the powder particles to melt (see also Chapter 8).Therefore, it is unlikely that this is the mechanism by which amorphous phases areobtained in mechanically alloyed powders. Furthermore, were this mechanism true,the glass-forming composition ranges in mechanically alloyed and rapidly solidifiedalloys should be the same; and this is also not true, as will be shown later.
Researchers now believe that amorphization during MA is not purely amechanical process and that a solid-state reaction similar to that observed in thinfilms [14] occurs during MA also. During MM, however, destabilization of thecrystalline phase is thought to occur by the increase in free energy through accumu-lation of structural defects such as vacancies, dislocations, grain boundaries, andantiphase boundaries. The continuous decrease in grain size (and consequent increasein grain boundary area) and a lattice expansion would also contribute to the increase infree energy of the system [358]. It has also been reported that amorphization occurswhen the strain in the slowly diffusing species reaches a maximum [61]. In the case ofordered alloys, amorphization was reported to occur when the long-range orderparameter is less than 0.6 with a corresponding volume of expansion of about 2%[359]. It has been reported that the stored energy during MA can be about 50% of theenthalpy of fusion, whereas by cold rolling or wire drawing it is only a small fraction[360]. This explains why amorphization is not possible by simple cold workingoperations but is possible by MA/MM methods. These lattice defects introduced intothe material during MA raise the free energy of the intermetallic system to a levelhigher than that of the amorphous phase; consequently, it becomes possible for theamorphous phase to form.
Liu and Chang [361] have recently undertaken a detailed study of the amorph-ization behavior of Fe70-x-yCoxNiyZr10B20 (x = 0, 7, 21 and y = 14, 21, 28) alloypowders by MA and MM. They noted that both the blended elemental and prealloyedpowders first transformed to a supersaturated solid solution of bcc a-Fe and anamorphous phase was obtained later in Co-free alloys and Co-containing alloys withhigh Ni/Co ratios of 1 and 3. No amorphous phase was obtained in Co-containingalloys with a lower Ni/Co ratio of 0.33. Thus, depending on the composition of thepowders, three different routes have been noted:
1. Fully amorphous phase for all Co-free alloys and Co-containing alloy ofFe42Co7Ni21Zr10B20
2. A mixture of amorphous phase, nanocrystalline bcc a-Fe solid solutionand residual Zr70Ni30 crystalline phases for Fe56Co7Ni7Zr10B20, and
3. A mixture of single supersaturated nanocrystalline bcc a-Fe solid solutionand residual Zr70Ni30 crystalline phases for the Fe42Co21Ni7Zr10B20
The formation of the bcc a-Fe solid solution as a transition phase was explainedon the basis of the lower heat of mixing between the different alloying elements and theenhanced diffusion process. It was also reported that the dissolution of Ni, Co, and Zrinto the Fe lattice increases the elastic energy for the formation of the solid solutiondue to atomic size mismatch effect. This results in larger lattice parameter for the bcca-Fe solid solution and leads to destabilization of the crystalline phase and formation ofthe glassy phase. The increase in lattice strain could also be due to an increase in grainboundary volume fraction (due to formation of nanocrystalline structure) andmechanical deformation in addition to the size mismatch.
MD: SURYANARAYANA, JOB: 03320, PAGE: 299
4103-X_Suryanarayana_Ch12_R2_080304
Solid-State Amorphization 299

Irradiation of crystalline materials by energetic particles and electrons has beenknown to cause amorphization when the following criteria are obeyed [11]:
The intermetallic compound has a narrow or zero homogeneity range.
The order-disorder transition temperature of the intermetallic, Tc is higherthan the melting temperature, Tm, i.e., the intermetallic is of the perma-nently (or irreversibly) ordered variety.
The two components (elements) are separated by more than two groups in theperiodic table.
The intermetallic has a complex crystal structure.
The fraction of the solute atoms, fB z 1/3.
Intermetallics have also been amorphized by MM when the above criteria weregenerally followed. However, there have been several exceptions to the aboveempirical rules (too many to be ignored). For example, compounds with reasonablywide homogeneity ranges have also been amorphized. Furthermore, a number ofcompounds containing only 25 at% of the solute atoms (fraction of solute atoms = 1⁄4)have been made amorphous. In view of these observations, it should be realized thatthe above criteria may only be used as guidelines and not that if they are not obeyedamorphization will not be observed.
Beke et al. [362,363] estimated the elastic mismatch energy stored in an orderedsolid solution when its long-range chemical order is destroyed. They showed that ifTc > Tm (see the second condition above) and the ratio of the elastic mismatch energyto the ordering energy is high enough, amorphization is expected to occur. This hasbeen proved to be a valid criterion in many cases of amorphization observed byirradiation.
Recently, attempts have been made to predict the ability of an alloy to becomeamorphous under MA/MM conditions. For this purpose, Miedema’s coordinatescheme, which is a two-dimensional representation of the electronic properties of themetals, is employed. In these diagrams, |Df| = |fA – fB| and D(1/nws
1/3) = (1/nws1/3)A �
(1/nws1/3)B are plotted as the ordinate and abscissa, respectively, to study the regularity
of the formation of binary amorphous alloys.f and nWS are the Miedema coordinates.f represents the chemical potential (close to the work function), which is also a mea-sure of the electronegativity, and nWS is the electron density at the boundary of theWigner-Seitz atomic cell [364]. Zhang [365] studied 51 binary TM-TM (TM = tran-sition metal) alloy systems synthesized by MA. Of these, 37 formed the amorphousphase and 14 did not form the amorphous phase. When the results of the Miedemacoordinates are plotted, it was possible to separate regions indicating formation andabsence of the amorphous phase by an empirical straight line:
jDf j¼ 3:825 D1
n1=3ws
!���������� ð12:7Þ
Of the 37 amorphous phases formed in the mechanically alloyed powders, 6 werelocated in the non–amorphous phase forming region, and of the 14 non–amorphousphase formers, 5 were located in the amorphous phase–forming region. Obviously, thisis not a very satisfactory model.
Both the above Miedema coordinates are related to the electronic behavior andcorrespond to electron factors. However, it is well recognized that size factor (relative
MD: SURYANARAYANA, JOB: 03320, PAGE: 300
4103-X_Suryanarayana_Ch12_R2_080304
Chapter 12300

MD: SURYANARAYANA, JOB: 03320, PAGE: 301
4103-X_Suryanarayana_Ch12_R2_080304
sizes of the constituent atoms) also plays an important role in determining theformation of an amorphous phase. Accordingly, Zhang and Zhang [366] constructedtwo-dimensional plots with the coordinates:
X ¼ RA � RBð Þ=RAj j ð12:8Þ
Y ¼ Df=Dn1=3j�� ð12:9Þ
where RA and RB are the atomic radii of the elements A and B, respectively, Df = fA
� fB and Dn = nA�nB, and f (electronegativity) and n (electron density) areMiedema’s coordinates. X and Y are the size and electron factors. The values of Rwere taken as half of the interatomic distance of the element calculated from the roomtemperature crystal structure. This is reasonable because amorphization by MAoccurs at room temperature. The physical significance of this plot is that the greaterthe values of X and Y, the greater are the short-range forces between unlike atomsand the smaller is the tendency for crystallization during amorphous phase formation.The equation dividing the regions where amorphous phase formation occurs and doesnot occur is given by:
Y ¼ 2:52X�1=4 ð12:10Þ
Considering the same 51 systems mentioned above, of the 37 systems that formed theamorphous phase experimentally, 33 were located in the amorphous phase–formingregion, and of the 14 systems that did not form the amorphous phase, 11 were locatedin the amorphous phase nonforming region. Therefore, it may be considered that theaccuracy of correctly predicting the formation of the amorphous phase is 86.3%, upfrom the value of 78.4% when only the electron factors were considered.
Since both atomic sizes and heats of formation are important in the formation ofamorphous phases, Zhang [367] plotted (RA�RB)/RB (where RA and RB are theatomic radii of the components A and B, respectively) against DHf
a, heat of formationwith short-range chemical order at the equiatomic composition of the amorphousphase. He observed that the regions where an amorphous phase formed or did notform could be separated by a straight line given by the equation:
RA � RB
RB¼ 0:068DHa
f þ 0:716 ð12:11Þ
Figure 12.4 shows a plot of known systems of binary transition metals processed byMA. It separates the regions for the formation and absence of amorphous phases usingthe above criterion. The proportion of correct predictions for the glass-forming alloyswas 89.2% whereas that for the non-glass-forming alloys was only 71.4%.
Taking Cu-Sn-P as an example, Zhang et al. [99] noted that the nearest neighbordistances are smaller for P-P pairs and Cu-Cu pairs than Sn-Sn pairs due to the smallersize of Cu and P atoms (atomic radii are rCu = 0.128 nm, rP = 0.109 nm, and rSn =0.155 nm). They also noted that the theoretical glass-forming ability for the constit-uent binary alloys is different. For example, according to the above criterion, Cu-Sn isin the non–amorphous phase–forming region, Cu-P is in the amorphous region, andSn-P is on the borderline. Thus, the glass forming ability increases in the sequence Cu-Sn, Sn-P, and Cu-P. Experimentally, it was observed that Cu-P alloys could not beamorphized by RSP techniques [368]. MA produced only partial amorphization in thissystem at 20 at% P [97]. This could be due to the large electronegativity difference
Solid-State Amorphization 301

MD: SURYANARAYANA, JOB: 03320, PAGE: 302
4103-X_Suryanarayana_Ch12_R2_080304
between Cu and P resulting in the easy formation of the Cu3P compound. However,addition of Sn to Cu-P alloy increases the relative size difference and reduces theelectronegativity difference. Both of these factors favor amorphization. Accordingly,the authors were able to produce an amorphous phase in Cu86-xSnxP14 for x = 4, 5, 8,and 10 [99]. These empirical observations clearly demonstrate the importance ofatomic size and electronegativity differences between the components in deciding theamorphous phase formation in alloy systems.
Figure 12.4 Plot of DR/R vs. DH showing the regions in which the amorphous phases formand do not form [367]. Description of thermochemical coordinates for the amorphous systemsby mechanical alloying. o, Formed amorphous alloys: 1, CoNb [14]; 2, CoZr [15]; 3, NiZr [15];
4, CuZr [15]; 5, MnZr [15]; 6, FeZr [15]; 7, PdTi [2]; 8, CuTa [16]; 9, RuZr [17]; 10, RhZr [17];11, PdZr [18]; 12, NiTi [19]; 13, NiV [20]; 14, CuCr [21]; 15, VZr [18]; 16, CuTi [23]; 17, FeTi[23]; 18, CuV [24]; 19, CoTi [23]; 20, MnTi [23]; 21, CoV [25]; 22, FeV [26]; 23, CrTi [23]; 24,
NiMo [27]; 25, CoY [28]; 26, CuEu [17]; 27, NiHf [3]; 28, CuHf [3]; 29, FeHf [17]; 30, CoHf[17]; 31, PtZr [29]; 32, NiTa [30]; 33, Feta [31]; 34, CoGd [32]; 35, NbCr [33]; 36, TaZr [33]; 37,NiNb [1]. ., Non-formed amorphous systems: 1, NiCr [35]; 2, CuAg [34]; 3, CuRu [36]; 4,FeAg [37]; 5, NiMn [35]; 6, VTi [19]; 7, TiMo [38]; 8, CuNi [9]; 9, CuW [40]; 10, CoMn [25]; 11,
CoCr [25]; 12, FeNb [41]; 13, WZr [42]; 14, CrZr [2].
Chapter 12302

A theoretical model was also proposed in which amorphization was assumed tobe realized through interstitial impurity formation during MA [369]. It was assumedthat amorphization occurred when impurity atoms penetrated into interstitial sitesand distorted the lattice locally. When the local distortions reached some critical value,the long-range order of the lattice was destroyed (destabilization of the crystallinephase) and an amorphous phase formed. It was also shown that the minimalconcentration of solute atoms needed to amorphize a binary alloy system by MAwas strongly related to the atomic size ratio of the constituents as observed in RSPinvestigations [370,371]. For example, in fcc-based metal systems, an amorphousphase was formed by MA when the atomic size ratio was between 0.68 and 1.83,whereas the size ratio was between 0.66 and 1.31 for bcc-based metal systems [369].
Fecht and Johnson [372] explained the phenomenon of solid-state amorphiza-tion based on polymorphous phase diagrams. Figure 12.5 shows a temperature–composition plot (phase diagram) where temperatures corresponding to equal en-tropy, T s
i, and equal free energy, To, for the liquid and solid phases are plotted fordifferent compositions. Tgo
is the ideal glass transition temperature [373]. The way tointerpret this phase diagram is that if the composition of the alloy is above c* and if thetemperature is below T* (or Tg), the alloy will transform catastrophically into theamorphous phase. It has been known that one of the elements in alloys formingamorphous phases by MA is an anomalously fast diffuser, which is further enhancedby the increased defect density due to heavy plastic deformation. Thus, when the
MD: SURYANARAYANA, JOB: 03320, PAGE: 303
4103-X_Suryanarayana_Ch12_R2_080304
Figure 12.5 Schematic polymorphous phase diagram showing the possibility of crystal-to-
glass transition at relatively low temperatures. T si and To represent temperatures correspond-
ing to equal entropy and equal free energy of the solid and liquid phases for a particularcomposition of the alloy. T* and c* are the critical temperature and composition, respectively
[372].
Solid-State Amorphization 303

concentration of the fast-diffusing component in the relatively immobile componentreaches the critical concentration of c*, amorphization occurs catastrophically. It willbe instructive to determine if this critical concentration, c*, and the minimal soluteconcentration proposed by Egami and Waseda [370] for amorphization are equal or ifthey have some relationship to each other.
It was recently shown that large negative values of the interaction parameter xCA
promote amorphization [125]. The interaction parameter xCA is given by the equation:
xAC ¼ RTeA
C ð12:12Þwhere R is the gas constant, T is the absolute temperature, and eC
A is the interactioncoefficient defined as eC
A = d ln gC/dXA where gC is the activity coefficient and XA is theatom concentration of component A.
12.7 CRYSTALLIZATION BEHAVIOR OF AMORPHOUS ALLOYS
Amorphous alloys are metastable in nature and therefore they tend to crystallize whenheated above the crystallization temperature of the amorphous phase. Crystallizationtemperatures of amorphous alloys are determined by continuous heating of theamorphous samples in a differential thermal analyzer or a differential scanningcalorimeter. By heating the amorphous alloy at different heating rates and notingthe change in the crystallization temperature, one could calculate the activation energyfor crystallization using the Kissinger method (see Sec. 7.7).
A number of research investigations were conducted on the crystallizationbehavior of rapidly solidified glassy alloys. It was shown that crystallization ofmetallic glasses could occur in three different ways—polymorphic, primary, andeutectic (Figure 12.6). In the polymorphic type of crystallization, the amorphousalloy transforms into a crystalline phase without a change in the chemical composi-tion. In the case of primary crystallization, which seems to be the most commonvariety, the amorphous phase first transforms to a crystalline solid solution phasebased on the solvent metal. The remaining amorphous phase can then transformeither in a polymorphic mode into a crystalline phase or in a eutectic mode to amixture of two crystalline phases. In the eutectic mode, the amorphous phasetransforms simultaneously into two crystalline phases. (Even though it may appearthat a solid phase is transforming into a mixture of two solid phases and so this shouldbe called a eutectoid reaction, it is referred to as a eutectic reaction because theamorphous phase is considered as a supercooled liquid.) Some excellent reviews (eventhough dated) are available explaining the different aspects of crystallization ofamorphous alloys obtained by RSP techniques [374–376].
As Tables 12.1 and 12.2 clearly indicate, a number of amorphous phases havebeen synthesized by MA/MM techniques. Some of the systems are identical or at leastsimilar to those investigated by RSP and some are entirely different.
A number of researchers have reported differential thermal analysis/differentialscanning calorimetry (DTA/DSC) investigations to determine the transformation(glass transition and crystallization) temperatures and measure the activation energiesfor crystallization. A few investigators have even conducted transmission electronmicroscopy (TEM) studies to confirm the formation of the amorphous phase in themechanically alloyed/milled powders. But there are hardly any detailed investigations
MD: SURYANARAYANA, JOB: 03320, PAGE: 304
4103-X_Suryanarayana_Ch12_R2_080304
Chapter 12304

of the crystallization behavior of mechanically alloyed amorphous phases by TEMmethods. This is in stark contrast to rapidly solidified alloys, where a combination ofboth DTA/DSC and TEM investigations was the rule rather than the exception. Thisdifference in the two cases may be related to the ease of specimen preparation in thecase of rapidly solidified ribbons (some ribbons may even be electron transparent inthe as-solidified condition) and the associated specimen preparation difficulties for themechanically alloyed powders.
It has been noted that the radial distribution functions and structure factorsof amorphous alloys of the same composition processed by RSP and MA/MM tech-niques are similar. This is true in a number of cases [112,152,377].
However, differences have been noticed in the crystallization temperatures ofamorphous alloys of the same composition processed by RSP and MA/MM techni-ques. Cardoso et al. [40] reported that the first Tx for the Al-5 at% Fe-5 at% Ndprocessed by MA was 405.5jC, much higher than the value of 218jC for the glassyphase processed by RSP. On the other hand, Sunol et al. [129] reported that the Tx forthe Fe-40 at% Ni-(20-x) at% P-x at% Si (x = 6, 10, and 14) amorphous alloys was lessthan 407jC for the melt-spun ribbons, whereas it was only 277jC for MA powders.Furthermore, it has been reported that the number of stages in which the amorphousphase transforms into the crystalline phases is also generally different. It is noticed thatthe amorphous alloy processed by MA/MM crystallizes in fewer stages than thatprocessed by RSP.
MD: SURYANARAYANA, JOB: 03320, PAGE: 305
4103-X_Suryanarayana_Ch12_R2_080304
Figure 12.6 Schematic diagrams of typical crystallization reactions in amorphous Fe-Balloys.
Solid-State Amorphization 305

Cardoso et al. [40] studied the crystallization behavior of rapidly solidified andmechanically alloyed Al-5 at% Fe-5 at% Nd amorphous alloys. They reported thatthe mechanically alloyed powder underwent primary crystallization on annealingforming fcc-Al crystals in an amorphous matrix. Annealing at a higher temperatureresulted in complete crystallization of the remaining amorphous phase to a mixture ofthe equilibrium crystalline phases, i.e., Al11Nd3 and Al10Fe2Nd. The rapidly solidifiedribbon also underwent primary crystallization in the first stage. However, at highertemperature of annealing a metastable ternary Al-Fe-Nd phase formed. At still highertemperatures, of course, the equilibrium phases had formed. Thus, while the amor-phous phase in the MA powder crystallized in two stages, the RSP ribbons trans-formed in three stages. A similar situation was also reported for amorphous Co-Tialloys processed by RSP [378] and those processed by MA [85]. The RSP alloycrystallized in two stages, whereas the mechanically alloyed powder transformed inone single step.
A completely different situation was reported in some other alloy systems; thenumber of stages was more for crystallization of the MA powders than the RSPribbons. Zhou et al. [291] noted that crystallization of MA powders went through twostages for the crystallization of a Zr-7.5 at% Al-17.5 at% Cu-10 at% Ni alloy, while itwent through only one step for the RSP metallic glass. Seidel et al. [379] also reported asimilar behavior. This difference was suggested to be due to increased oxygen content(more than 0.2 at%) in the mechanically alloyed powder [380].
A low-temperature relaxation peak was observed in mechanically alloyedpowders but not in the rapidly solidified amorphous ribbons [129]. Thus, there appearto be very noticeable differences in the crystallization behavior of amorphous phasesobtained by MA and RSP techniques. Other major differences in the glass formingabilities and composition ranges of formation of amorphous phases will be discussedlater.
12.8 MECHANICAL CRYSTALLIZATION
As mentioned earlier blended elemental mixtures or intermetallics or combinations ofthem can be amorphized by MA or MM. In some cases a crystalline phase forms afterthe formation of an amorphous phase in certain alloy systems, especially those basedon reactive metals like titanium or zirconium. But it was convincingly shown that thiswas a contaminant phase and therefore to be discounted as a product of crystallizationof the amorphous phase. However, in some alloy systems a true crystallization event ofthe amorphous phase takes place on milling the powder containing the amorphousphase. This phenomenon is referred to as mechanical crystallization, since crystal-lization occurs on the application of mechanical energy. This was first reported byTrudeau et al. in 1999 [345].
Trudeau et al. [345] chose two commercially available metallic glasses manufac-tured by Allied Signal—Metglas 2605S-2 (Fe78Si9B13) and Metglas 2605CO(Fe66Co18Si1B15)—and subjected them to MM in a SPEX mill. They noted thatcrystalline phases were produced in both cases on MM with the difference that the Co-containing glass crystallized at shorter milling times. As mentioned earlier, thetemperature of the powder rises during milling (see Chapter 8 for the details) andtherefore one could explain this crystallization of the glassy alloy based on thetemperature rise during milling. The early crystallization of the Co-containing glass
MD: SURYANARAYANA, JOB: 03320, PAGE: 306
4103-X_Suryanarayana_Ch12_R2_080304
Chapter 12306

was attributed to its lower crystallization temperature of 441jC, in comparison to thehigher value of 553jC for the Metglas 2605CO alloy. With a view to change thecrystallization temperature, these investigators have added Co or Ni to the Fe78Si9B13
Metglas sample and investigated the crystallization behavior. It was observed that Coaddition resulted in rapid crystallization whereas the Ni addition was found tostabilize the amorphous phase, even though the crystallization temperature of theglassy sample is known to be decreased by Ni additions. Therefore, it does not appearthat the crystallization behavior is in any way directly related to the crystallizationtemperature of the glassy/amorphous alloy. Crystallization of the Metglas 2605S-2was also observed by other investigators [381,382].
Similar observations of formation of a crystalline phase after the formation ofthe amorphous phase have been reported in recent years. For example, a mechanicallyinduced solid-state devitrification (MISSD) phenomenon was reported in a Zr-20at% Pd-10 at% Ni powder mixture on milling in a planetary ball mill [304]. Theynoted that a fully amorphous phase was obtained on milling the powder for 48 h, buton continued milling for 130 h the amorphous phase crystallized into a nanocrystallinephase, which on milling for 150 h transformed into a ‘‘big cube’’ structure (closelyrelated to the Zr2Ni- and Zr2Cu-type phases). The authors have explained that thiscrystallization of the amorphous phase occurred due to the temperature increaseduring milling. A similar observation was made during milling of pure metal Se [331].
Even more interestingly, some of the investigators have reported that cyclictransformations occur during milling of some systems, e.g., Co-Ti [82–85]. That is,when the blended elemental powders were milled, an intermetallic phase was reportedto form first. Continued milling resulted in amorphization of the alloy, which on fur-ther milling again transformed to the crystalline phase. It was reported that this pro-cess of crystalline ! amorphous ! crystalline phase changes could be repeatedlyobserved by changing the milling time. Reasons for this transformation were given inSection 10.6.
The number of instances where blended elemental powders and/or intermetallicshave been amorphized are many (see Tables 12.1 and 12.2). But the reverse behavior ofcrystallization of amorphous alloys on milling was observed only in a few cases, andthese reports are also from select groups. It is a well-known fact that a crystalline phaseis more stable than an amorphous phase. However, the crystalline phase could beamorphized under nonequilibrium conditions by storing additional energy into thesystem, thus destabilizing the crystalline phase with respect to the amorphous phase.Therefore, it is difficult to understand that a metastable phase transforms into a stablephase on storing extra energy. Thus, it appears that this phenomenon of mechanicalcrystallization is not well understood and that more work is needed to ensure that thisalso is a general phenomenon.
12.9 BULK AMORPHOUS ALLOYS
During the 1970s it was realized that by a proper choice of the alloy system and thechemistry, it was possible to synthesize amorphous phases in some selected alloysystems even at solidification rates as low as 103 K/s. This enabled the thickness of therapidly solidified ribbon to be substantially increased. Thus, millimeter-diameter rodsof amorphous Pd-6 at% Cu-18 at% Si [383] and Pd-40 at% Ni-20 at% P [384] alloys
MD: SURYANARAYANA, JOB: 03320, PAGE: 307
4103-X_Suryanarayana_Ch12_R2_080304
Solid-State Amorphization 307
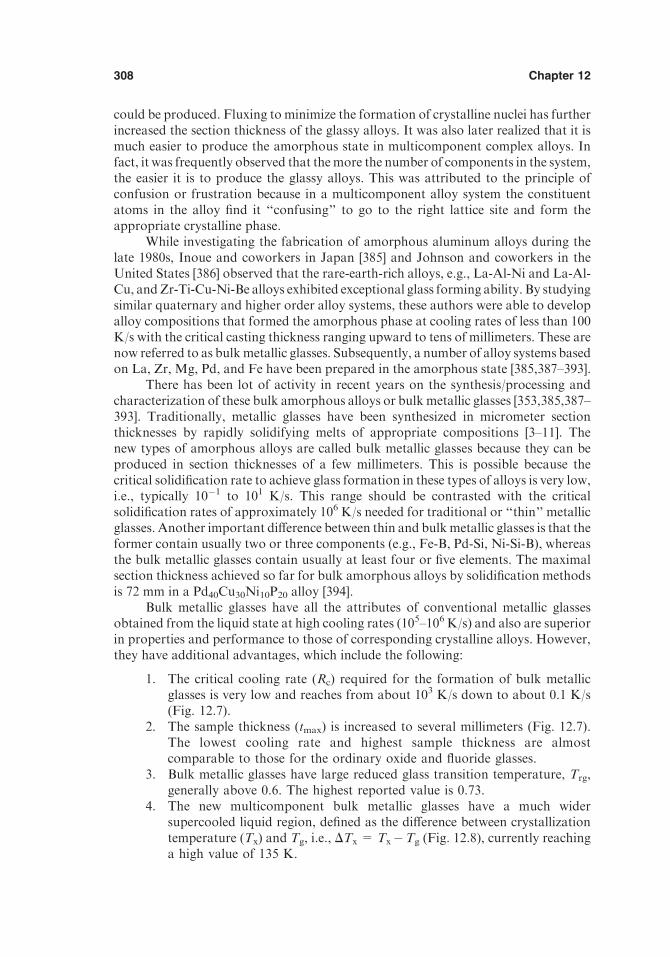
could be produced. Fluxing to minimize the formation of crystalline nuclei has furtherincreased the section thickness of the glassy alloys. It was also later realized that it ismuch easier to produce the amorphous state in multicomponent complex alloys. Infact, it was frequently observed that the more the number of components in the system,the easier it is to produce the glassy alloys. This was attributed to the principle ofconfusion or frustration because in a multicomponent alloy system the constituentatoms in the alloy find it ‘‘confusing’’ to go to the right lattice site and form theappropriate crystalline phase.
While investigating the fabrication of amorphous aluminum alloys during thelate 1980s, Inoue and coworkers in Japan [385] and Johnson and coworkers in theUnited States [386] observed that the rare-earth-rich alloys, e.g., La-Al-Ni and La-Al-Cu, and Zr-Ti-Cu-Ni-Be alloys exhibited exceptional glass forming ability. By studyingsimilar quaternary and higher order alloy systems, these authors were able to developalloy compositions that formed the amorphous phase at cooling rates of less than 100K/s with the critical casting thickness ranging upward to tens of millimeters. These arenow referred to as bulk metallic glasses. Subsequently, a number of alloy systems basedon La, Zr, Mg, Pd, and Fe have been prepared in the amorphous state [385,387–393].
There has been lot of activity in recent years on the synthesis/processing andcharacterization of these bulk amorphous alloys or bulk metallic glasses [353,385,387–393]. Traditionally, metallic glasses have been synthesized in micrometer sectionthicknesses by rapidly solidifying melts of appropriate compositions [3–11]. Thenew types of amorphous alloys are called bulk metallic glasses because they can beproduced in section thicknesses of a few millimeters. This is possible because thecritical solidification rate to achieve glass formation in these types of alloys is very low,i.e., typically 10�1 to 101 K/s. This range should be contrasted with the criticalsolidification rates of approximately 106 K/s needed for traditional or ‘‘thin’’ metallicglasses. Another important difference between thin and bulk metallic glasses is that theformer contain usually two or three components (e.g., Fe-B, Pd-Si, Ni-Si-B), whereasthe bulk metallic glasses contain usually at least four or five elements. The maximalsection thickness achieved so far for bulk amorphous alloys by solidification methodsis 72 mm in a Pd40Cu30Ni10P20 alloy [394].
Bulk metallic glasses have all the attributes of conventional metallic glassesobtained from the liquid state at high cooling rates (105–106 K/s) and also are superiorin properties and performance to those of corresponding crystalline alloys. However,they have additional advantages, which include the following:
1. The critical cooling rate (Rc) required for the formation of bulk metallicglasses is very low and reaches from about 103 K/s down to about 0.1 K/s(Fig. 12.7).
2. The sample thickness (tmax) is increased to several millimeters (Fig. 12.7).The lowest cooling rate and highest sample thickness are almostcomparable to those for the ordinary oxide and fluoride glasses.
3. Bulk metallic glasses have large reduced glass transition temperature, Trg,generally above 0.6. The highest reported value is 0.73.
4. The new multicomponent bulk metallic glasses have a much widersupercooled liquid region, defined as the difference between crystallizationtemperature (Tx) and Tg, i.e., DTx = Tx�Tg (Fig. 12.8), currently reachinga high value of 135 K.
MD: SURYANARAYANA, JOB: 03320, PAGE: 308
4103-X_Suryanarayana_Ch12_R2_080304
Chapter 12308

MD: SURYANARAYANA, JOB: 03320, PAGE: 309
4103-X_Suryanarayana_Ch12_R2_080304
Figure 12.7 Relation between the maximal critical cooling rate for glass formation (Rc),
maximal sample thickness (tmax), and the reduced glass transition temperature (Trg = Tg/Tm)for multicomponent bulk amorphous alloy systems.
Figure 12.8 Correlation between the critical cooling rate for glass formation (Rc), maximal
sample thickness (tmax), and the supercooled liquid region (DTx = Tx – Tg) for bulkamorphous alloys.
Solid-State Amorphization 309

From the strong correlation among Rc, tmax, Trg, and DTx, it may be concludedthat bulk metallic glasses are obtained when the alloy system has a high Trg andexhibits a largeDTx. Based on the extensive investigations that have been conducted sofar, three empirical rules have been formulated to achieve large glass forming ability inalloy systems [353]. These are as follows:
1. The alloy system should contain at least three elements. The larger thenumber of components, the easier it is to form the glassy phase at lowercooling rates and consequently with larger thickness.
2. A significant difference in atomic sizes (more than 12%) should existamong the main constituent elements.
3. The constituent elements should exhibit negative heats of mixing amongthem.
The reasons for the glass forming ability of alloys following the three empiricalrules is related to (1) higher degrees of dense randomly packed atomic configurations,(2) new local atomic configurations that are different from those of the correspondingcrystalline phases, and (3) a homogeneous atomic configuration of the differentconstituent atoms on a long-range scale. The small differences in the densities of0.30–0.54% between the as-cast bulk metallic glasses and fully crystallized states havebeen attributed to the higher dense randomly packed atomic configurations of bulkamorphous alloys in comparison to the ‘‘conventional’’ metallic glasses synthesized athigher solidification rates.
The limitation on section thickness for ‘‘thin’’ metallic glasses is imposed by therequired solidification rates to achieve glass formation in these alloys. It was alsomentioned earlier (Sec. 12.5) that glass formation becomes easier when the reducedglass temperature, Trg, is high. That is why alloys near eutectic compositions have beeneasy glass formers. If Trg could be increased by adjusting the composition of the alloy,then the critical cooling rate for glass formation could be reduced and consequentlythe section thickness could be increased. This has been possible by choosing alloycompositions in such a way that the component elements form among themselvesbinary, ternary, and higher order eutectics. In contrast to thin metallic glasses, the bulkmetallic glasses are characterized by a wide supercooled liquid region, i.e., a largetemperature difference exists between the glass transition and crystallization temper-atures for these glasses.
Based on an atomistic mechanism and extending the topological theory of glassformation to multicomponent systems, it was suggested that increasing the number ofelements involved, increasing the atomic size ratio, increasing the attractive forcebetween small and large atoms, and introducing a repulsive potential between smallatoms will help formation of bulk metallic glasses [395].
Miracle and Senkov [396] also proposed a topological model for metallic glassformation through destabilization of the host crystalline lattice by susbstitutional and/or interstitial solute atoms. The model calculates the frequency of occupation of thesolute atoms either in the substitutional or interstitial sites as a function of the strainenergy associated with each site. The strain energy, in turn, depends on the solute andsolvent elastic properties and relative sizes, and on temperature. The crystalline latticeis destabilized leading to amorphization when solute elements produce a criticalinternal strain required to change local coordination numbers. The critical concen-tration of a solute element required to destabilize the crystalline lattice of a binary alloy
MD: SURYANARAYANA, JOB: 03320, PAGE: 310
4103-X_Suryanarayana_Ch12_R2_080304
Chapter 12310

was calculated as a function of the radius ratio R = RB/RA of the solute and solventatoms. In the range of 0.5 < R < 1, the critical concentration decreases, reaches aminimum at R about 0.8, and then increases as the size of the solute element decreasesrelative to the solvent.
Bulk amorphous alloys (we will use the term ‘‘amorphous alloys’’ instead ofmetallic glasses because they are synthesized by solid-state processes and not from theliquid state) have also been synthesized by MA in a number of multicomponent Zr-Ti-Cu-Ni, Zr-Al-Cu-Ni, Mg-Y-Cu, and other systems [66,397]. In comparison to RSP orcasting techniques used to produce bulk metallic glasses, MA is an inexpensive andsimpler technique to process the material into an amorphous state. Furthermore, it iseasier to produce the amorphous phase in a wider composition range by MA than byany other technique. Phase diagram restrictions do not directly apply to the phasesproduced by MA, since the whole processing is carried out in the solid state. But thenumber of parameters that could be varied during MA is large and as such opti-mization of the process could be tricky. However, the complexity of these variablescould be used to our advantage since we have at our disposal a number of variablesthat could be varied to produce the required phase in the desired alloy composition.Furthermore, changing the parameters, e.g., temperature of milling and/or thecomposition of the alloy, could easily produce a composite of amorphous andcrystalline phases. Alternatively, the amorphous phase can be heat treated atsufficiently low temperatures and for short times to produce a uniform dispersion/precipitation of a crystalline phase in an amorphous matrix. Such combinations of auniform dispersion of fine-grained (or nanocrystalline) phases in an amorphous matrixhave been found to exhibit improved properties (e.g., improved strength and ductility)over alloys containing a monolithic amorphous phase.
The thermal stability of bulk amorphous alloys processed by MA appears tobe affected by impurities such as oxygen. However, amorphization by MA can beachieved even at relatively high impurity levels, where bulk glass formation by slowcooling from the melt is not possible. The ability to reheat and deform glassy powdersin the supercooled liquid state without crystallization allows consolidation andshaping of bulk glassy components using the easy flow of the supercooled liquid.Glass-matrix composites containing crystalline reinforcements appear to possessimproved mechanical properties than the monolithic glassy alloys.
The mechanical behavior of bulk metallic glasses (obtained by die casting) andnanocomposites has been investigated in recent times [398–402]. It has been noted thatwhile the fully amorphous alloys exhibit excellent tensile and compressive properties atroom temperature, the presence of crystalline precipitates decreases these values andthe fracture mode changes from ductile to brittle.
Bulk metallic glasses exhibit an excellent combination of properties such as hightensile strength, high elastic energy, good ductility, high fracture toughness, highimpact fracture energy, high bending flexural strength, high bending fatigue strength,high corrosion resistance, good soft magnetic properties, fine and precise viscousdeformability, good workability, good castability, and high consolidation tendencyinto bulk forms. Based on these properties several potential applications have beenenvisaged. For example, 3-mm-thick faceplate inserts made of Zr-based bulk metallicglasses have been used for high-end golf club heads, and these have been commer-cialized [403,404]. This application is based on the increased maximal stored elasticenergy, which is roughly four times that of conventional crystalline materials due to
MD: SURYANARAYANA, JOB: 03320, PAGE: 311
4103-X_Suryanarayana_Ch12_R2_080304
Solid-State Amorphization 311

MD: SURYANARAYANA, JOB: 03320, PAGE: 312
4103-X_Suryanarayana_Ch12_R2_080304
doubling of the elastic strain limit achieved by forming a composite of an amorphousmatrix containing a nanocrystalline phase. Another application for the bulk metallicglasses has been in developing ‘‘self-sharpening’’ kinetic energy penetrators [405].
12.10 THEORETICAL PREDICTIONS OF AMORPHOUS-PHASE-FORMING RANGE
It would be useful if one could predict if an alloy of a given composition will form anamorphous phase by MA/MM or not. The models discussed earlier (Sec. 12.6) weremostly empirical in the sense that they were proposed to fit the available experimentaldata to a model and draw conclusions. However, the predictive capability will help indesigning new compositions to achieve the desired properties. Attempts have beenmade to predict whether metallic glasses form (glass forming ability) and to determinethe glass-forming composition range (GFR) for metallic glasses formed by rapidsolidification from the liquid state. Since no liquid ! solid transformation is involvedin the MA/MM process, these models could not be directly used to predict theamorphous phase–forming composition range in milled powders. Therefore, attemptswere made to theoretically predict the composition ranges in which amorphous alloysare formed using the heats of formation of alloys.
Miedema and coworkers [364,406] developed methods to calculate the forma-tion enthalpies of alloys. By comparing the enthalpies of formation of differentcompeting phases in an alloy system, e.g., solid solution and an amorphous phase,one could calculate the composition range over which an amorphous phase is stable.These methods have been summarized by Bakker [407].
Miedema et al. [364,406] proposed that for a solid solution the formationenthalpy consists of three terms:
DH ðsolid solutionÞ ¼ DH c þ DH e þ DH s ð12:13Þ
where the superscripts c, e, and s represent the chemical, elastic, and structuralcontributions to the enthalpy of the solid solution. The chemical interaction contri-bution to the enthalpy of mixing of the solid solution consists of a negativecontribution from the electronegativity difference between the two elements and apositive contribution from the difference in the electron densities of the two elements.DH c can be calculated from the equation:
DHcAB ¼ cAcBðcADHo
B in A þ cBDHoA in BÞ ð12:14Þ
where cA and cB are the atom fractions of the A and B components in the alloy.DHo
A in B is the enthalpy of solution of element A in the other element B at infinitedilution for a binary alloy system. Values for DHo
A in B have been calculated by de Boeret al. for transition metal–transition metal and transition metal–nontransition metalalloy systems [408].
The elastic contribution to the enthalpy is due to the atomic size mismatch (dif-ference in atomic volumes between the solvent and the solute) and can be calculated as:
DH eAB ¼ cAcBðcADHe
B in A þ cBDHeA in BÞ ð12:15Þ
The values of DHeA in B , the size mismatch contributions, can be calculated from the
atomic radii and the bulk and shear modulus values of the component metals.
Chapter 12312
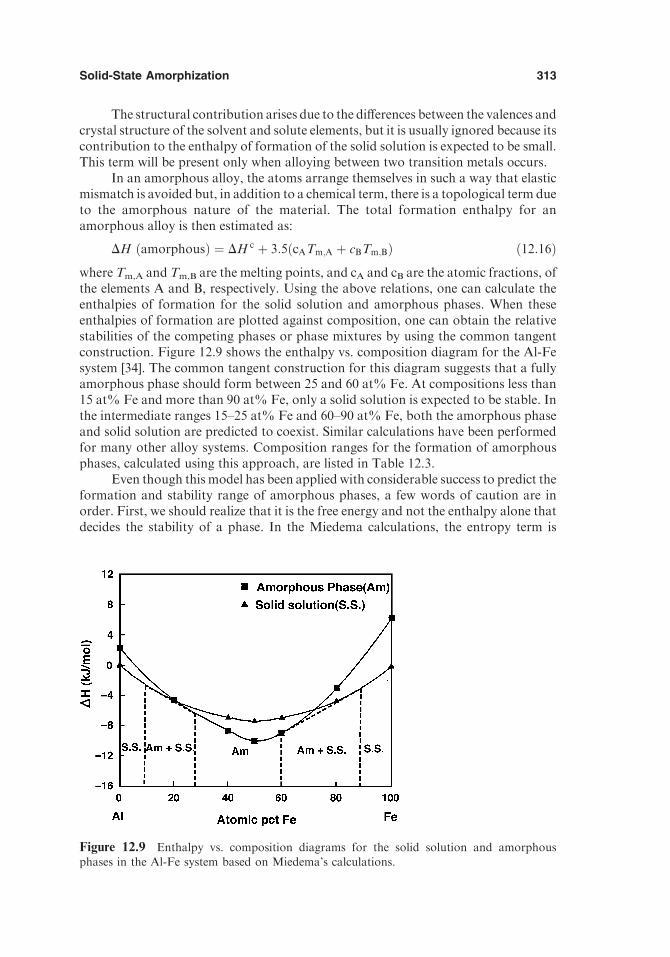
The structural contribution arises due to the differences between the valences andcrystal structure of the solvent and solute elements, but it is usually ignored because itscontribution to the enthalpy of formation of the solid solution is expected to be small.This term will be present only when alloying between two transition metals occurs.
In an amorphous alloy, the atoms arrange themselves in such a way that elasticmismatch is avoided but, in addition to a chemical term, there is a topological term dueto the amorphous nature of the material. The total formation enthalpy for anamorphous alloy is then estimated as:
DH ðamorphousÞ ¼ DH c þ 3:5ðcATm;A þ cBTm;BÞ ð12:16Þwhere Tm,A and Tm,B are the melting points, and cA and cB are the atomic fractions, ofthe elements A and B, respectively. Using the above relations, one can calculate theenthalpies of formation for the solid solution and amorphous phases. When theseenthalpies of formation are plotted against composition, one can obtain the relativestabilities of the competing phases or phase mixtures by using the common tangentconstruction. Figure 12.9 shows the enthalpy vs. composition diagram for the Al-Fesystem [34]. The common tangent construction for this diagram suggests that a fullyamorphous phase should form between 25 and 60 at% Fe. At compositions less than15 at% Fe and more than 90 at% Fe, only a solid solution is expected to be stable. Inthe intermediate ranges 15–25 at% Fe and 60–90 at% Fe, both the amorphous phaseand solid solution are predicted to coexist. Similar calculations have been performedfor many other alloy systems. Composition ranges for the formation of amorphousphases, calculated using this approach, are listed in Table 12.3.
Even though this model has been applied with considerable success to predict theformation and stability range of amorphous phases, a few words of caution are inorder. First, we should realize that it is the free energy and not the enthalpy alone thatdecides the stability of a phase. In the Miedema calculations, the entropy term is
MD: SURYANARAYANA, JOB: 03320, PAGE: 313
4103-X_Suryanarayana_Ch12_R2_080304
Figure 12.9 Enthalpy vs. composition diagrams for the solid solution and amorphousphases in the Al-Fe system based on Miedema’s calculations.
Solid-State Amorphization 313

ignored. This has been justified because the Miedema model is strictly valid only at 4.2K and therefore the enthalpy effects are far more important than the entropy effects atthis low temperature. Furthermore, since we are dealing here with situations far fromequilibrium, the kinetic path should be taken into account. The thermodynamicparameters (and the common tangent constructions) may then be used only as guide-lines. Second, significant discrepancies have been observed between the calculated andexperimentally observed heats of mixing. Third, the enthalpy calculations do notconsider the occurrence of intermetallics in the phase diagram; only the terminal solidsolutions and an amorphous phase are expected to be present under metastableconditions. Last, the prediction of glass-forming range using this model has beenapplied mostly to studies in the field of MA. Extremely few reports are available ofapplication of this model to nonequilibrium phases in materials processed by othernonequilibrium processing techniques [365,366,412]. In spite of these apparentlimitations, several researchers have calculated the glass-forming composition rangeusing the Miedema model, and these values are compared with the experimentallyobserved values in Table 12.3.
MD: SURYANARAYANA, JOB: 03320, PAGE: 314
4103-X_Suryanarayana_Ch12_R2_080304
Table 12.3 Comparison of the Predicted and Observed Glass-Forming Rangesin Mechanically Alloyed Powder Mixtures
System
Amorphous phase-forming range (at% solute)
Miedema model Ref. CALPHAD Observed Ref.
Al-Fe 25–60 Fe 34 25 Fe 34
Co-V 33x–60 V 86Co-Zr 22–61 Zr 88 27x–92 Zr 298Cu-Hf 21–71 Hf 22 30x–70 Hf 149
Cu-Sn-P 3–62 Sn 99 2x–3.4 Sn 99Cu-Ti 25–72 Ti 22 13x–90 Ti 106Cu-Zr 26–51 Zr 88
Fe-B 50x–60 B 118Fe-Zr 21–73 Zr 22 22x–70 Zr 409Fe-Zr 33–54 Zr 88
Nb-Fe 30–70 Fe 30x–70 Fe 166Nb-Ge 18–27 Ge 168 12x–30 Ge 169Ni-Hf 16–75 Hf 22 35x–85 Hf 149Ni-Nb 20–69 Nb 22 20x–79 Nb 187
Ni-Ti 23–76 Ti 22 28x–72 Ti 195Ni-V 45x–60 V 410Ni-Zr 20x–80 Zr 22, 208
Ni-Zr 17–76 Zr 22 17x–73 Zr 409Ni-Zr 22–63 Zr 88 17–67 Zr 24x–85 Zr 203Pd-Ti 46–80 Ti 22 42x–85 Ti 265
Pd-Zr 40x–55 Zr 411Ti-Al 15–88 Al 61 10–96 Al 10x–75 Al 61
35–75 Al 253Ti-Cu 46–65 Cu 254
Ti-Ni 25–83 Ni 253, 254
Chapter 12314

Another common approach of thermodynamic evaluation of binary systems isby CALPHAD (calculation of phase diagrams) [413], which uses analytical expres-sions to describe the free energies of different competing phases. These expressions arederived from models with parameters obtained from numerical fits to measuredequilibrium data. Extrapolations are then used to predict metastable equilibria. TheCALPHAD method is usually preferred to the Miedema model because the former isbased on more explicit thermodynamic data such as the equilibrium phase diagram.However, these calculations are also sometimes inadequate due to problems associ-ated with insufficient experimental input, fitting errors, and invalid extrapolation tolarge undercooling.
Generally, the amorphous phase–forming range is experimentally determined bylooking for the presence of broad peaks in XRD patterns of the processed alloy. Asmentioned earlier, this may not always prove that the material produced is trulyamorphous. It is much more reliable to measure the properties of the samples such ascrystallization temperature, enthalpy of crystallization, saturation magnetization, orsuperconducting transition temperatures. When these properties are plotted againstcomposition, a sudden change in the slope indicates the solute concentration up towhich the amorphous phase is homogeneous [143].
It should be remembered that a good match is not always found between theobserved and predicted amorphous phase–forming composition range. This is essen-tially because MA is a ‘‘complex’’ process and, further, the mechanically alloyedpowders could pick up lot of impurities and get contaminated. The presence of thesesubstitutional and interstitial impurities modifies the stability of the amorphous phase.
12.11 COMPARISON BETWEEN MA AND RSP
As mentioned earlier, the radial distribution functions of amorphous alloys synthe-sized by MA/MM or RSP techniques are similar. In fact, the structure factors forirradiated, rapidly solidified, and mechanically alloyed amorphous phases of differentalloy systems are very similar [377]. The structural and magnetic properties ofmechanically milled and sputtered YCo2 and YCo5 intermetallics are also very similar[113]. The crystallization temperatures of the amorphous alloys produced by MA havebeen found to be higher in some cases and lower in the others than those processed bythe RSP techniques. The activation energy for crystallization of RSP alloys was muchhigher than for MA alloys [63,201].
Even though amorphization has been observed by both MA and MM, there areno quantitative data available to define the ‘‘critical’’ energy input (or other param-eters) that could be equated with the critical cooling rate that should be exceeded toform the glassy phase in RSP studies. Modeling of MA/MM (currently in progress indifferent laboratories) may provide additional information in this direction.
The features of phase diagrams normally provide clues to the possibility ofproducing amorphous phases. Amorphous alloys are easily produced by RSPtechniques in the vicinity of deep eutectics. This is because the reduced glass transitiontemperature Trg is the highest at the eutectic point. The ease of forming an amorphousphase is higher the higher the Trg value. But in the case of mechanically alloyedmaterials the amorphous phase is mostly obtained around the equiatomic composi-tion. Furthermore, the composition ranges of the amorphous phases are much wider in
MD: SURYANARAYANA, JOB: 03320, PAGE: 315
4103-X_Suryanarayana_Ch12_R2_080304
Solid-State Amorphization 315

MD: SURYANARAYANA, JOB: 03320, PAGE: 316
4103-X_Suryanarayana_Ch12_R2_080304
alloys produced by MA than in those obtained by RSP. Note, for example, that Figure12.10 shows the glass formation composition ranges for Zr-Fe, Zr-Co, and Zr-Ni alloysystems by both RSP and MA methods [414]. Whereas glass formation is observed inthe vicinity of the eutectic compositions by RSP methods, amorphization by MAoccurs in the central part of the phase diagram. Accordingly, the amorphous phaseformation composition ranges for these Zr-based alloys are 30–78 at% Fe, 27–92 at%Co, and 27–85 at% Ni. Clearly, these composition ranges are much wider thanobserved for the rapidly solidified alloys.
Major differences were also noticed between the glass formability of alloys by thetwo techniques of MA/MM and RSP. Alloys near deep eutectics were the easiest toamorphize by RSP. It was very difficult to achieve amorphization at compositionscorresponding to melting point maxima, alloys with a cascade of peritectic reactions,shallow eutectics, and in alloys with a positive heat of mixing. However, amorphizationwas achieved in a number of these cases by MA/MM. MA allowed easy amorphizationof alloys corresponding to melting point maxima. For example, the intermetallicHf50Ni50, with an orthorhombic structure, exists as a line compound and has amelting point of 1800 K; this was amorphized by MM [149,150]. Similarly, amorphi-zation was reported in Cu-Hf alloys in the composition range of 60–70 at% Hf, close toand on either side of the Hf2Cu compound having the highest melting point of thecompounds in the system [149]. The intermetallic Ge4Sb5 could not be produced in theamorphous state by RSP techniques; but it was possible to do so by MM [319]. It has
Figure 12.10 Comparison of glass formation composition ranges by rapid solidificationprocessing and mechanical alloying methods in Zr-Fe, Zr-Co, and Zr-Ni alloy systems [414].
Chapter 12316

MD: SURYANARAYANA, JOB: 03320, PAGE: 317
4103-X_Suryanarayana_Ch12_R2_080304
Table 12.4 Comparison of Amorphous-Phase–Forming Ranges (at%) by Mechanical
Alloying and Rapid Solidification Processing Techniques
System By RSP By MA Ref.
Ag-Pd Not reported 50xPd 23Al-Fe Not reported 20x–50 Fe 38
17x–33 Fe 37
Al-Ta 33x–67 Ta 58, 59Co-B 33x–50 B 75Co-Ge Not reported 415
Co-Nb 15x–20 Nb 76Co-Si 30x–70 Si 80Co-Ti 15x–20 Ti 76
25x–67 Ti 85Co-V 33x–60 V 86Co-Zr 8x–73 Zr 86Cr-Fe 28xFe 90
Cr-Nb 30x–68 Nb 92Cu-P Not reported 20xP 97Cu-W 30x–90 W 109
Fe-B 35x–40 B 119Fe-C 20x–25 C 119
17x–60 C 122
Fe83-xCrxC17 24–50 Cr 10x–60 Cr 125Fe83-xMoxC17 5–26 Mo 5x–60 Mo 125Fe-P 25xP 131
Fe-Si 10x–40 Si 80Fe-Zr 22x–70 Zr 110, 142Ge-S 61x–72 S 144Hf-Cu 20x–90 Cu 148
30x–70 Cu 149, 150Hf-Ni 15x–65 Ni 150
10x–85 Ni 148
La-Al-Ni 30x–70 La 15310x–50 Ni
Mg-Ni 50x–80 Ni 154
40x–70 Ni 156Nb-Al 25x–85 Al 164Nb-Co 35x–85 Co 92Nb-Cr 32x–70 Cr 92
Nb-Fe 35x–75 Fe 92Nb-Ge 18x–27 Ge 168
12x–30 Ge 169
Nb-Mn 35x–60 Mn 92Nb-Ni 40–60 Ni 20x–80 Ni 92, 185, 186Ni-Mg 20x–50 Mg 154
Ni-Mo Not reported 50xMo 178Ni-Sn 20x–40 Sn 186Ni-Ta 35–65 Ta 40x–80 Ta 189
30–60 Ta 20x–90 Ta 230Ni-V 40x–65 V 196Ni-Zr 20x–80 Zr 208
30x–80 Zr 210
Solid-State Amorphization 317

MD: SURYANARAYANA, JOB: 03320, PAGE: 318
4103-X_Suryanarayana_Ch12_R2_080304
not been possible to amorphize alloy systems with a positive heat of mixing by RSP,but MA could produce them in the amorphous state. In general, it has been noted thatit is easier to produce an amorphous phase, and in a wider composition range, in analloy system by MA/MM than by RSP. There are some systems in which it is possibleto produce an amorphous phase by MA but not by RSP techniques. Among those therole of contamination on the formation of amorphous phases by MA, at least in somecases, cannot be completely ruled out. Table 12.4 compares the amorphous phase–
Pd-Si 15–23 Si 13.5x–25 Si 216Pd-Ti Not reported 42x–85 Ti 214, 265Ta-Al Not reported 10x–90 Al 224Ta-Cu 20x–50 Cu 229
Ti-Al Not reported 10x–60 Al 6110x–75 Al 6120x–50 Al 232, 247
20x–60 Al 24425x–67 Al 24945x–65 Al 143
50x–75 Al 246Ti-Al-Ni 0x–50 Al,
0–50 Ni,
30–90 Ni
54
Ti-Cu 30–70 Cu 10x–87 Cu 10610x–90 Cu 148
Ti-Ni 10x–70 Ni 254
35x–50 Ni 261Ti50NixAl50-x xx= 10, 25 253Ti60NixAl40-x x x= 15, 20 253
Ti-(40-x)Ni-xCu x x= 10–20 254Ti-(50-x)Ni-xCu x x= 10–30 254Ti-(60-x)Ni-xCu x x= 10–40 254
Ti-Ni-Cu 10x–30 Ni, 26210x–30 Cu
Ti-Si 16x–63 Si 270Zn-Ti 40xTi 284
W-Fe 30x–70 Fe 281Zr-Al 17.5x–30 Al 287
17.5x–40 Al 288, 289
Zr-Co 20–57 Co 27x–92 Co 298Zr-Cu 25–90 Cu 40x–60 Cu 110, 111Zr-Fe 8–17 Fe 20x–50 Fe 148
60–80 Fe 30x–78 Fe 140, 298, 416Zr-Mn 20x–50 Mn 298Zr-Ni 20–40 Ni and 27x–83 Ni 298
58–70 NiZr-Pd 20–35 Pd 45x–60 Pd 412
Table 12.4 Continued
System By RSP By MA Ref.
Chapter 12318

MD: SURYANARAYANA, JOB: 03320, PAGE: 319
4103-X_Suryanarayana_Ch12_R2_080304
forming composition ranges in some alloy systems produced by these two techniques.Amorphous phase formation has not been reported in all the listed alloy systems byboth the techniques. Information is included where available.
Several investigations were conducted on the crystallization behavior of rapidlysolidified amorphous alloys and also their transformation behavior on application ofpressure (see the relevant chapters in Refs. 4–10). However, only a few reports areavailable on such transformations of amorphous phases produced by MA/MM. Animportant difference observed in amorphous phases synthesized by MA and RSPtechniques is the degree of thermal relaxation. Since MA is conducted at or near roomtemperature, the amorphous alloy samples are in a very unrelaxed state [199]. How-ever, it has also been reported that a low-temperature relaxation peak was observed inmechanically alloyed powders but not in RSP ribbons [129]. Such differences mayprove to be very useful in probing the microscopic origin of the relaxation processes.Another important difference is in the nature of the transformation. For example, theamorphous phase at the Zr-24 at% Fe composition synthesized by MA directlytransforms to the equilibrium Zr3Fe phase. But, the first crystallization products ofrapidly solidified (melt spun) alloy are metastable Zr2Fe, N-Zr, and a-Zr, which werenot observed during the decomposition of the mechanically alloyed powder [417].
Amorphous phases are also synthesized by many other methods, such as laserprocessing, sputtering, and ion mixing. Differences have been observed in theamorphous phase–forming composition range between MA and these methods.Figure 12.11 compares the amorphous phase–forming composition ranges for theNi-Nb system processed into the amorphous state by several different techniques. Itmay be noted that the homogeneity range for the formation of the amorphous phase is
Figure 12.11 Composition of amorphous phase forming range achieved in the Ni-Nb
system by different nonequilibrium processing routes.
Solid-State Amorphization 319

quite wide for the mechanically alloyed powder. Alloys processed by laser quenchingonly come close to this range.
REFERENCES
1. Buckel, W., Hilsch, R. (1952). Z. Phys. 131:420.2. Klement, W., Willens, R. H., Duwez, P. (1960). Nature 187:869–871.3. Suryanarayana, C., ed. (1999). Non-equilibrium Processing of Materials. Oxford, UK:
Pergamon.4. Liebermann, H. H., ed. (1993). Rapidly Solidified Alloys: Processes, Structures, Pro-
perties, Applications. New York: Marcel Dekker.
5. Anantharaman, T. R., Suryanarayana, C. (1987). Rapidly Solidified Metals: ATechnological Overview. Aedermannsdorf, Switzerland: TransTech.
6. Luborsky, F. E., ed. (1983). Amorphous Metallic Alloys. London, UK: Butterworths.7. Anantharaman, T. R., ed. (1984). Metallic Glasses: Production, Properties, and Appli-
cations. Aedermannsdorf, Switzerland: TransTech.8. Beck, H., Guntherodt, H. J., eds. Glassy Metals. Berlin: Springer-Verlag, Vol. 1, 1981;
Vol. 2, 1983; Vol. 3, 1994.
9. Cahn, R. W. (1991). In: Zarzycki, J., ed. Glasses and Amorphous Materials. Vol. 9 ofMaterials Science and Technology—A Comprehensive Treatment. Weinheim: VCH,pp. 493–548.
10. Cahn, R. W., Greer, A. L. In: Cahn, R. W., Haasen, P., eds. Physical Metallurgy. Vol. 2.Amsterdam: Elsevier, pp. 1723–1830.
11. Russell, K. C. (1985). Prog. Mater. Sci. 28:229–434.12. Yeh, X. L., Samwer, K., Johnson, W. L. (1983). Appl. Phys. Lett. 42:242–244.
13. Aoki, K. (2001). Mater. Sci. Eng. A304–306:45–53.14. Schwarz, R. B., Johnson, W. L. (1983). Phys. Rev. Lett. 51:415–418.15. Sharma, S. M., Sikka, S. K. (1996). Prog. Mater. Sci. 40:1–77.
16. Atzmon, M., Verhoven, J. D., Gibson, E. D., Johnson, W. L. (1984). Appl. Phys. Lett.45:1052–1053.
17. Suryanarayana, C. (1995). Bibliography on Mechanical Alloying and Milling. Cambridge,
UK: Cambridge International Science Publishing.18. Koch, C. C., Cavin, O. B., McKamey, C. G., Scarbrough, J. O. (1983). Appl. Phys. Lett.
43:1017–1019.
19. See the articles starting on pp. 617 (Carl H Smith), 665 (Guthrie, M. S.), 691 (Rabinkin,A.; Liebermann, H. H.), and 737 (Suryanarayana, C.; Froes, F. H.) In: Liebermann, H.H., ed. Rapidly Solidified Alloys: Processes, Structures, Properties, Applications. NewYork: Marcel Dekker, 1993.
20. Ermakov, A. E., Yurchikov, E. E., Barinov, V. A. (1981). Phys. Met. Metallogr. 52(6):50–58.
21. Ermakov, A. E., Barinov, V. A., Yurchikov, E. E. (1982). Phys. Met. Metallogr. 54(5):90–
96.22. Weeber, A. W., Bakker, H. (1988). Physica B 153:93–135.23. Aymard, L., Dehahaye-Vidal, A., Portemer, F., Disma, F. (1996). J. Alloys Compounds
238:116–127.24. Sui, H. X., Zhu, M., Qi, M., Li, G. B., Yang, D. Z. (1992). J. Appl. Phys. 71:2945–
2949.
25. Tsurui, T., Tsai, A. P., Inoue, A., Masumoto, T. (1995). J. Alloys Compounds 218:L7–L10.
26. Kobayashi, K. F., Tachibana, N., Shingu, P. H. (1990). J. Mater. Sci. 25:3149–3154.27. Zhang, F. X., Wang, W. K. (1996). J. Alloys Compounds 240:256–260.
MD: SURYANARAYANA, JOB: 03320, PAGE: 320
4103-X_Suryanarayana_Ch12_R2_080304
Chapter 12320

28. Eckert, J., Schultz, L., Urban, K. (1990). Z. Metallkde. 81:862–868.29. Gu, X. J., Ye, F., Zhou, F., Lu, K. (2000). Mater. Sci. Eng. A278:61–65.30. Wang, G., Zhang, D., Chen, H., Lin, B., Wang, W., Dong, Y. (1991). Phys. Lett.
A155:57–61.31. Morris, M. A., Morris, D. G. (1992). Mater. Sci. For. 88–90:529–535.32. Zhou, F., Luck, R., Scheffer, M., Lang, D., Lu, K. (1999). J. Non-Cryst. Solids 250–
252:704–708.33. Nasu, S., Imaoka, S., Morimoto, S., Tanimoto, H., Huang, B., Tanaka, K., Kuyama, J.,
Ishihara, K. N., Shingu, P. H. (1992). Mater. Sci. For. 88–90:569–576.
34. Mukhopadhyay, D. K., Suryanarayana, C., Froes, F. H. (1995). Metall. Mater. Trans.26A:1939–1946.
35. Oleszak, D., Shingu, P. H. (1997). Mater. Sci. For. 235–238:91–96.
36. Shingu, P. H., Ishihara, K. N., Uenishi, K., Kuyama, J., Huang, B., Nasu, S. (1990). In:Clauer, A. H., deBarbadillo, J. J., eds. Solid State Powder Processing. Warrendale, PA:TMS, pp. 21–34.
37. Huang, B., Ishihara, K. N., Shingu, P. H. (1997). Mater. Sci. Eng. A231:72–79.
38. Dong, Y. D., Wang, W. H., Liu, L., Xiao, K. Q., Tong, S. H., He, Y. Z. (1991). Mater. Sci.Eng. A134:867–871.
39. Zhang, D. L., Adam, G., Ammundsen, B. (2002). J. Alloys Compounds 340:226–230.
40. Cardoso, K. R., Garcia-Escorial, A., Botta, W. J., Lieblich, M. (2001). Mater. Sci. For.360–362:161–166.
41. Rodrigues, C. A. D., Leiva, D. R., Cardoso, K. R., Kiminami, C. S., Botta, W. J. F.
(2002). Mater. Sci. For. 386–388:33–38.42. Burzynska-Szyske, M., Fadeeva, V. I., Matyja, H. (1997). Mater. Sci. For. 235–238:97–
102.
43. Schwarz, R. B., Hannigan, J. W., Sheinberg, H., Tiainen, T. (1988). In: Gummeson, P. U.Gustafson, D. A., eds. Modern Developments in Powder Metallurgy. Vol. 21. Princeton,NJ: Metal Powder Industries Federation, pp. 415–427.
44. Chen, G., Wang, K., Wang, J., Jiang, H., Quan, M. (1993). In: deBarbadillo, J. J., et al.,
eds. Mechanical Alloying for Structural Applications. Materials Park, OH: ASMInternational, pp. 183–187.
45. Schurack, F., Borner, I., Eckert, J., Schultz, L. (1999). Mater. Sci. For. 312–314:49–54.
46. Roy, M., Singh, K., Bahadur, D. (1992). J. Mater. Sci. Lett. 11:858–861.47. Sherif El-Eskandarany, M., Aoki, K., Suzuki, K. (1991). Scripta Metall. Mater. 25:1695–
1700.
48. Sherif El-Eskandarany, M., Aoki, K., Suzuki, K. (1992). J. Appl. Phys. 71:2924–2930.49. Peng, Z., Suryanarayana, C., Froes, F. H. (1996). Metall. Mater. Trans. 27A:41–48.50. Makhlouf, S. A., Sumiyama, K., Suzuki, K. (1993). J. Alloys Compounds 199:119–124.51. Benameur, T., Inoue, A., Masumoto, T. (1994). Nanostructured Mater. 4:303–322.
52. Benameur, T., Inoue, A. (1998). Mater. Sci. For. 269–272:163–168.53. Dougherty, G. M., Shiflet, G. J., Poon, S. J. (1994). Acta Metall. Mater. 42:2275–2283.54. Itsukaichi, T., Norimatsu, T., Umemoto, M., Okane, I., Wu, B. -Y. (1992). In: Tamura,
I., ed. Heat and Surface ‘92. Tokyo: Japan Tech Info Center, pp. 305–308.55. Sa Lisboa, R. D., Perdigao, M. N. R. V., Kiminami, C. S., Botta, W. J. F. (2002). Mater.
Sci. For. 386–388:59–64.
56. Sherif El-Eskandarany, M., Aoki, K., Suzuki, K. (1992). Appl. Phys. Lett. 60:1562–1563.57. Sherif El-Eskandarany, M., Aoki, K., Itoh, H., Suzuki, K. (1991). J. Less Common
Metals 169:235–244.
58. Sherif El-Eskandarany, M., Aoki, K., Suzuki, K. (1992). J. Alloys Compounds 186:15–31.
59. Sherif El-Eskandarany, M., Aoki, K., Suzuki, K. (1992). J. Non-Cryst. Solids 150:472–477.
MD: SURYANARAYANA, JOB: 03320, PAGE: 321
4103-X_Suryanarayana_Ch12_R2_080304
Solid-State Amorphization 321

MD: SURYANARAYANA, JOB: 03320, PAGE: 322
4103-X_Suryanarayana_Ch12_R2_080304
60. Saji, S., Abe, S., Matsumoto, K. (1992). Mater. Sci. For. 88–90:367–374.61. Murty, B. S., Naik, M. D., Mohan Rao, M., Ranganathan, S. (1992). Mater. For. 16:19–
26.
62. Kojima, Y., Senna, M., Shinohara, T., Ono, S., Sumiyama, K., Suzuki, K. (1995). J.Alloys Compounds 227:97–101.
63. Wu, N. Q., Wu, J. M., Li, Z. Z., Wang, G. X. (1997). Mater. Trans. Jpn. Inst. Metals
38:255–259.64. Fan, G. J., Quan, M. X., Hu, Z. Q. (1995). J. Mater. Sci. 30:4847–4851.65. Saji, S., Neishi, Y., Araki, H., Minamino, Y., Yamane, T. (1995). Metall. Mater. Trans.
26A:1305–1307.66. Eckert, J., Seidel, M., Schultz, L. (1996). Mater. Sci. For. 225–227:113–118.67. Sherif El-Eskandarany, M., Aoki, K., Suzuki, K. (1992). Metall. Trans. 23A:2131–2140.
68. Gaffet, E., Michael, D., Mazerolles, L., Berthet, P. (1997). Mater. Sci. For. 235–238:103–108.
69. Michel, D., Mazerolles, L., Berthet, P., Gaffet, E. (1995). Eur. J. Solid State Inorg. Chem.32:673–682.
70. Loeff, P. I., Bakker, H. (1988). Scripta Metall. 22:401–404.71. Suzuki, K. (1989). J. Non-Cryst. Solids 112:23–32.72. Corrias, A., Ennas, G., Marongiu, G., Musinu, A., Paschina, G. (1993). J. Mater. Res.
8:1327–1333.73. Atzeni, C., Pes, M., Sanna, U., Corrias, A., Paschina, G., Zedda, D. (1994). Adv. Perform.
Mater. 1:243–253.
74. Corrias, A., Ennas, G., Marongiu, G., Paschina, G. (1991). J. Mater. Sci. 26:5081–5084.75. Corrias, A., Ennas, G., Licheri, G., Marongiu, G., Musinu, A., Paschina, G. (1993). In:
deBarbadillo, J. J., et al., eds. Mechanical Alloying for Structural Applications. Materials
Park, OH: ASM International, pp. 451–456.76. Kimura, H., Takada, F., Myung, W. N. (1988). Mater. Sci. Eng. 97:125–128.77. Omuro, K., Miura, H. (1992). Appl. Phys. Lett. 60:1433–1435.78. Okadome, K., Unno, K., Arakawa, T. (1995). J. Mater. Sci. 30:1807–1810.
79. Omuro, K., Miura, H. (1991). Jpn. J. Appl. Phys. 30:L851–853.80. Sadano, H., Arakawa, T. (1996). Mater. Trans. Jpn. Inst. Metals 37:1099–1102.81. Lopez-Hirata, V. M., Juarez Martınez, U., Cabanas-Moreno, J. G. (1995). Mater. Sci.
For. 189–191:261–266.82. Sherif El-Eskandarany, M., Aoki, K., Sumiyama, K., Suzuki, K. (2002). Acta Mater.
50:1113–1123.
83. Sherif El-Eskandarany, M., Aoki, K., Sumiyama, K., Suzuki, K. (1997). Appl. Phys. Lett.70:1679–1681.
84. Sherif El-Eskandarany, M., Aoki, K., Sumiyama, K., Suzuki, K. (1997). Scripta Mater.36:1001–1009.
85. Sherif El-Eskandarany, M., Zhang, W., Inoue, A. (2003). J. Alloys Compounds 350:232–245.
86. Eckert, J., Schultz, L., Urban, K. (1990). J. Less Common Metals 166:293–302.
87. Kimura, H., Kimura, M., Ban, T. (1988). In: Lee, P. W., Moll, J. H., eds. RapidlySolidified Materials: Properties and Processing. Materials Park, OH: ASM International,pp. 171–176.
88. Hellstern, E., Schultz, L. (1987). Phil. Mag. B56:443–448.89. Ogino, Y., Maruyama, S., Yamasaki, T. (1991). J. Less Common Metals 168:221–235.90. Xia, S. K., Rizzo Assunc�ao, F. C., Baggio-Saitovich, E. (1996). Mater. Sci. For. 225–
227:459–464.91. Morris, M. A., Morris, D. G. (1991). J. Mater. Sci. 26:4687–4696.92. Schanzer, M., Mehrer, H. (1990). J. de Physique 51(Colloq. 4, Suppl. 14):C4-87–C4-93.93. Morris, M. A. (1992). Mater. Sci. For. 88–90:671–678.
Chapter 12322

MD: SURYANARAYANA, JOB: 03320, PAGE: 323
4103-X_Suryanarayana_Ch12_R2_080304
94. Matsuki, K., Inoue, A., Kimura, H. M., Masumoto, T. (1988). Mater. Sci. Eng. 97:47–51.
95. Inoue, A., Kimura, H. M., Matsuki, K., Masumoto, T. (1987). J. Mater. Sci. Lett. 6:979–
981.96. Kim, K. J., Sherif El-Eskandarany, M., Sumiyama, K., Suzuki, K. (1993). J. Non-Cryst.
Solids 155:165–170.
97. Kim, K. J., Sumiyama, K., Suzuki, K. (1994). J. Non-Cryst. Solids 168:232–240.98. Kis-Varga, M., Beke, D. L. (1996). Mater. Sci. For. 225–227:465–470.99. Zhang, B. W., Xie, H., Liao, S. (1999). J. Mater. Proc. Technol. 89–90:378–384.
100. Zhang, H., Naugle, D. G. (1992). Appl. Phys. Lett. 60:2738–2740.101. Miura, H., Isa, S., Omuro, K. (1990). Jpn. J. Appl. Phys. 29:L339–342.102. Battezzati, L., Baricco, M., Enzo, S., Schiffini, L., Soletta, I., Cocco, G. (1992). Mater.
Sci. For. 88–90:771–778.103. Baricco, M., Battezzati, L., Enzo, S., Soletta, I., Cocco, G. (1993). Spectrochim. Acta
A49:1331–1344.104. Hunt, J. A., Soletta, I., Enzo, S., Meiya, L., Havill, R. L., Battezzati, L., Cocco, G.,
Cowlam, N. (1995). Mater. Sci. For. 179–181:255–260.105. Ivison, P. K., Cowlam, N., Soletta, I., Cocco, G., Enzo, S., Battezzati, L. (1991). Mater.
Sci. Eng. A134:859–862.
106. Politis, C., Johnson, W. L. (1986). J. Appl. Phys. 60:1147–1151.107. Baricco, M., Battezzati, L., Cocco, G., Soletta, I., Enzo, S. (1993). J. Non-Cryst. Solids
156–158:527–531.
108. Fukunaga, T., Mori, M., Inou, K., Mizutani, U. (1991). Mater. Sci. Eng. A134:863–866.109. Gaffet, E., Louison, G., Harmelin, M., Faudot, F. (1991). Mater. Sci. Eng. A134:1380–
1384.
110. Hellstern, E., Schultz, L. (1986). Appl. Phys. Lett. 48:124–126.111. Jang, J. S. C., Koch, C. C. (1989). Scripta Metall. 23:1805–1810.112. Al-Hajry, A., Al-Assiri, M., Al-Heniti, S., Enzo, S., Hefne, J., Al-Shahrani, A., Al-
Salami, A. E. (2002). Mater. Sci. For. 386–388:205–210.
113. Boldrick, M. S., Wagner, C. N. J. (1991). Mater. Sci. Eng. A134:872–875.114. Lee, P. Y., Lin, C. K., Chen, G. S., Louh, R. F., Chen, K. C. (1999). Mater. Sci. For. 312–
314:67–72.
115. Surinach, S., Baro, M. D., Segura, J., Clavaguera-Mora, M. T., Clavaguera, N. (1991).Mater. Sci. Eng. A134:1368–1371.
116. Ruuskanen, P., Heczko, O. (1993). Key Eng. Mater. 81–83:159–168.
117. Barinov, V. A., Tsurin, V. A., Elsukov, E. P., Ovechkin, L. V., Dorofeev, G. A.,Ermakov, A. E. (1992). Phys. Metals Metallogr. 74(4):412–415.
118. Calka, A., Radlinski, A. P. (1991). Appl. Phys. Lett. 58:119–121.119. Osagawara, T., Inoue, A., Masumoto, T. (1992). Mater. Sci. For. 88–90:423–430.
120. Nasu, T., Koch, C. C., Nagaoka, K., Itoh, N., Sakurai, K., Suzuki, K. (1991). Mater. Sci.Eng. A134:1385–1388.
121. Tanaka, T., Nasu, S., Nakagawa, K., Ishihara, K. N., Shingu, P. H. (1992). Mater. Sci.
For. 88–90:269–274.122. Tanaka, T., Nasu, S., Ishihara, K. N., Shingu, P. H. (1991). J. Less Common Metals
171:237–247.
123. Ji, Y., Wang, G., Li, F., Wang, G., Zhao, J., Zhang, S. (2001). J. Mater. Sci. Lett.20:1267–1269.
124. Koyano, T., Takizawa, T., Fukunaga, T., Mizutani, U., Kamizuru, S., Kita, E., Tasaki,
A. (1993). J. Appl. Phys. 73:429–433.125. Omuro, K., Miura, H. (1995). Mater. Sci. For. 179–181:273–278.126. Streletskii, A. N., Leonov, A. V., Beresteskaya, I. V., Mudretsova, S. N., Majorova, A.
F., Ju Butyagin, P. (2002). Mater. Sci. For. 386–388:187–192.
Solid-State Amorphization 323
MD: SURYANARAYANA, JOB: 03320, PAGE: 324
4103-X_Suryanarayana_Ch12_R2_080304
127. Crespo, P., Hernando, A., Garcia-Escorial, A., Castano, F. J., Multigner, M. (2000).Mater. Sci. For. 343–346:793–799.
128. Lin, C. K., Lee, P. Y., Kao, S. W., Chen, G. S., Louh, R. F., Hwu, Y. (1999). Mater. Sci.
For. 312–314:55–60.129. Sunol, J. J., Pradell, T., Clavaguera, N., Clavaguera-Mora, M. T. (2001). Mater. Sci. For.
360–362:525–530.
130. Miao, W. F., Li, G. S., Li, S. L., Wang, J. T. (1992). Acta Phys. (Sinica) 41:924–928.131. Osagawara, T., Inoue, A., Masumoto, T. (1991). Mater. Sci. Eng. A134:1338–1341.132. Carmona, F., Gonzalez, J. M., Martin, A., Martin, V. E. (1991). J. Mag. Mag. Mater.
101:119.133. Le Caer, G., Matteazzi, P., Fultz, B. (1992). J. Mater. Res. 7:1387–1395.134. Pan, C. W., Hung, M. P., Chang, Y. H. (1994). Mater. Sci. Eng. A185:147–152.
135. Enzo, S., Macri, P., Rose, P., Cowlam, N. (1993). In: deBarbadillo, J. J., et al., eds.Mechanical Alloying for Structural Applications. Materials Park, OH: ASM Interna-tional, pp. 101–108.
136. Trudeau, M. L., Schulz, R., Zaluski, L., Hosatte, S., Ryan, D. H., Doner, C. B., Tessier,
P., Strom-Olsen, J. O., Van Neste, A. (1992). Mater. Sci. For. 88–90:537–544.137. Ruuskanen, P. (1998). Mater. Sci. For. 269–272:139–144.138. Fultz, B., Le Caer, G., Matteazzi, P. (1989). J. Mater. Res. 4:1450–1455.
139. Bai, H., Michaelsen, C., Sinkler, W., Bormann, R. (1997). Mater. Sci. For. 235–238:361–366.
140. Hellstern, E., Schultz, L. (1988). Mater. Sci. Eng. 97:39–42.
141. Burgio, N., Iasonna, A., Magini, M., Martelli, S., Padella, F. (1991). Il Nuovo Cimento13D:459–476.
142. Hellstern, E., Schultz, L., Bormann, R., Lee, D. (1988). Appl. Phys. Lett. 53:1399–1401.
143. Schultz, L. (1988). Mater. Sci. Eng. 97:15–23.144. Shen, T. D., Wang, K. Y., Quan, M. X., Hu, Z. Q. (1993). Appl. Phys. Lett. 63:1637–1639.145. Shirakawa, Y., Matsuda, T., Tani, Y., Shimosaka, A., Hidaka, J. J. Non-Cryst. Solids
293–295:764–768.
146. Gaffet, E. (1991). Mater. Sci. Eng. A149:85–94.147. Al-Hajry, A., Al-Assiri, M., Enzo, S., Hefne, J., Al-Heniti, S., Cowlam, N., Al-Shahrani,
A. (2001). Mater. Sci. For. 360–362:343–348.
148. Krauss, W., Politis, C., Weimar, P. (1988). Metal Powder Rep. 43:231–238.149. Thompson, J. R., Politis, C., Kim, Y. C. (1988). Mater. Sci. Eng. 97:31–34.150. Thompson, J. R., Politis, C., Kim, Y. C. (1992). Mater. Sci. For. 88–90:545–552.
151. Al-Assiri, M., Al-Hajry, A., Hefne, J., Al-Shahrani, A., Abboudy, S., Al-Heniti, S.,Cowlam, N. (2000). Mater. Sci. For. 343–346:732–737.
152. Al-Hajry, A., Al-Assiri, M., Enzo, S., Cowlam, N., Hefne, J., Jones, L., Delogu, F.,Brequel, H. (2002). Mater. Sci. For. 386–388:211–216.
153. Matsuki, K., Abe, F., Inoue, A., Masumoto, T. (1992). Mater. Sci. For. 88–90:313–320.154. Yang, Q. M., Lei, Y. Q., Wu, J., Qang, Q. D., Lu, G. L., Chen, L. S. (1993). Key Eng.
Mater. 81–83:169–173.
155. Ruggeri, S., Lenain, C., Roue, L., Liang, G., Huot, J., Schulz, R. (2002). J. AlloysCompounds 339:195–201.
156. Liu, W., Wu, H., Lei, Y., Wang, Q., Wu, J. (1997). J. Alloys Compounds 252:234–237.
157. Hazelton, L. E., Nielsen, C. A., Deshmukh, U. V., Pierini, P. E. (1990). In: Froes, F. H.,deBarbadillo, J. J., eds. Structural Applications of Mechanical Alloying. Materials Park,OH: ASM International, pp. 243–250.
158. Weiss, B., Eckert, J. (2000). Mater. Sci. For. 343–346:129–134.159. Martinez-Sanchez, R., Estrad-Guel, I., Jaramillo-Vigueras, D., De la Torre, S. D.,
Gaona-Tiburcio, C., Guerrero-Paz, J. (2002). Mater. Sci. For. 386–388:135–140.160. Cocco, G., Enzo, S., Barrett, N., Roberts, K. J. (1989). J. Less Common Metals 154:177–
186.
Chapter 12324

MD: SURYANARAYANA, JOB: 03320, PAGE: 325
4103-X_Suryanarayana_Ch12_R2_080304
161. Bokhonov, B. B., Konstanchuk, I. G., Boldyrev, V. V. (1995). J. Alloys Compounds218:190–196.
162. Zhang, H., Liu, X. (2001). Int. J. Ref. Metals Hard Mater. 19:203–208.
163. Oleszak, D., Burzynska-Szyszko, M., Matyja, H. (1993). J. Mater. Sci. Lett. 12:3–5.164. Peng, Z., Suryanarayana, C., Froes, F. H. (1993). In: deBarbadillo, J. J., et al., eds.
Mechanical Alloying for Structural Applications. Materials Park, OH: ASM Interna-
tional, pp. 335–341.165. Peng, Z. (1994). MS thesis, University of Idaho, Moscow, ID, USA.166. Yang, J. Y., Zhang, T. J., Cui, K., Li, X. G., Zhang, J. (1996). J. Alloys Compounds
242:153–156.167. Kenik, E. A., Bayuzick, R. J., Kim, M. S., Koch, C. C. (1987). Scripta Metall. 21:1137–
1142.
168. Politis, C. (1985). Physica B. 135:286–289.169. Cho, Y. S., Koch, C. C. (1993). Mater. Sci. Eng. A161:65–73.170. Harada, T., Kuji, T. (1996). J. Alloys Compounds 232:238–243.171. Kumar, K. S., Mannan, S. K. (1989). In: Liu, C. T., Taub, A. I., Stoloff, N. S., Koch
C. C., eds. High Temperature Ordered Intermetallic Alloys III. Vol. 133. Pittsburgh, PA:Mater Res Soc, pp. 415–420.
172. Li, B., Liu, L., Ma, X. M., Dong, Y. D. (1993). J. Alloys Compounds 202:161–163.
173. Kim, M. S., Koch, C. C. (1987). J. Appl. Phys. 62:3450–3453.174. Hirosawa, S., Makita, K., Ikegami, T., Umemoto, M. (1992). Proc. 6th Int. Conf. on
Ferrite, Tokyo: Japan Soc. Powder Powder Metall. , pp. 1100–1103.
175. Itsukaichi, T., Umemoto, M., Okane, I., Horosawa, S. (1993). J. Alloys Compounds193:262–265.
176. Ivanov, E., Grigorieva, T. F., Golubkova, G. V., Boldyrev, V. V., Fasman, A. B.,
Mikhailenko, S. D., Kalinina, O. T. (1988). Mater. Lett. 7:51–54.177. Luo, Z. G., Guo, J. T., Hu, Z. Q. (1996). J. Alloys Compounds 234:106–110.178. Cocco, G., Enzo, S., Barrett, N. T., Roberts, K. J. (1992). Phys. Rev. B45:7066–7076.179. Li, M., Enzo, S., Soletta, I., Cowlam, N., Cocco, G. (1993). J. Phys. C: Condens. Matter.
5:5235–5244.180. Enayati, M. H., Chang, I. T. H., Schumacher, P., Cantor, B. (1997). Mater. Sci. For. 235–
238:85–90.
181. Enzo, S., Bonetti, E., Soletta, I., Cocco, G. (1991). J. Phys. D: Appl. Phys. 24:209–216.182. Nasu, T., Nagaoka, K., Takahashi, S., Suganuma, E., Sekiuchi, T., Fukunaga, T.,
Suzuki, K. (1989). Mater. Trans. Jpn. Inst. Metals 30:620–623.
183. Schumacher, P., Enayati, M. H., Cantor, B. (1999). Mater. Sci. For. 312–314:351–356.184. Schwarz, R. B., Koch, C. C. (1986). Appl. Phys. Lett. 49:146–148.185. Petzoldt, F. (1988). J. Less Common Metals 140:85–92.186. Tiainen, T. J., Schwarz, R. B. (1988). J. Less Common Metals 140:99–112.
187. Lee, P. Y., Koch, C. C. (1987). J. Non-Cryst. Solids 94:88–100.188. Merk, N., Tanner, L. E. (1991). Scripta Metall. Mater. 25:309–313.189. Lee, P. Y., Chen, T. R. (1994). J. Mater. Sci. Lett. 13:888–890.
190. Xia, S. K., Baggio-Saitovich, E., Rizzo Assunc�ao, F. C., Pena Rodriguez, V. A. (1993). J.Phys. C: Condens. Matter. 5:2729–2738.
191. Wang, K. Y., Shen, T. D., Wang, J. T., Quan, M. X. (1991). Scripta Metall. Mater.
25:2227–2231.192. Wang, K. Y., Shen, T. D., Wang, J. T., Quan, M. X. (1993). J. Mater. Sci. 28:6474–6478.193. Sun, D. Z., Cheng, L. Z., Zhang, Y. M., Ho, K. Y. (1992). J. Alloys Compounds 186:33–35.
194. Cocco, G., Enzo, S., Schiffini, L., Battezzati, L. (1988). Mater. Sci. Eng. 97:43–46.195. Schwarz, R. B., Petrich, R. R., Saw, C. K. (1985). J. Non-Cryst. Solids 76:281–302.196. Fukunaga, T., Homma, Y., Suzuki, K., Misawa, M. (1991). Mater. Sci. Eng. A134:987–
991.
197. Kimura, H., Takada, F. (1988). Mater. Sci. Eng. 97:53–57.
Solid-State Amorphization 325

198. Weeber, A. W., Bakker, H. (1988). J. Phys. F.: Metal Phys. 18:1359–1369.199. Bruning, R., Altounian, Z., Strom-Olsen, J. O., Shultz, L. (1988). Mater. Sci. Eng. 97:
317–320.
200. Calka, A., Radlinski, A. P. (1991). Mater. Sci. Eng. A134:1350–1353.201. Lee, P. Y., Koch, C. C. (1987). Appl. Phys. Lett. 50:1578–1580.202. Lee, C. H., Mori, H., Fukunaga, T., Mizutani, U. (1990). Jpn. J. Appl. Phys. 29:540–544.
203. Lee, P. Y., Koch, C. C. (1988). J. Mater. Sci. 23:2837–2845.204. Weeber, A. W., Bakker, H., deBoer, F. R. (1986). Europhys. Lett. 2:445–448.205. Schultz, L., Hellstern, E., Thoma, A. (1987). Europhys. Lett. 3:921–926.
206. Weeber, A. W., Bakker, H. (1988). J. Less Common Metals 141:93–102.207. Petzoldt, F., Scholz, B., Kunze, H. D. (1988). Mater. Sci. Eng. 97:25–29.208. Mizutani, U., Lee, C. H. (1990). J. Mater. Sci. 25:399–406.
209. Weeber, A. W., Wester, A. J. H., Haag, W. J., Bakker, H. (1987). Physica B145:349–352.210. Haruyama, O., Asahi, N. (1992). Mater. Sci. For. 88–90:333–338.211. Eckert, J., Schultz, L., Hellstern, E., Urban, K. (1988). J. Appl. Phys. 64:3224–3228.212. Nasu, T., Nagaoka, K., Takahashi, S., Fukunaga, T., Suzuki, K. (1989). Mater. Trans.
Jpn. Inst. Metals 30:146–149.213. Padella, F., Paradiso, E., Burgio, N., Magini, M., Martelli, S., Guo, W., Iasonna, A.
(1991). J. Less Common Metals 175:79–90.
214. Politis, C., Thompson, J. R. (1987). In: Tenhover, M., Johnson, W. L., Tannner, L. E.,eds. Science and Technology of Rapidly Quenched Alloys. Vol. 80. Pittsburgh, PA: Mater.Res. Soc., pp. 91–96.
215. Zhang, D. L., Massalski, T. B. (1994). J. Mater. Res. 9:53–60.216. Ishida, T., Tamaru, S. (1993). J. Mater. Sci. Lett. 12:1851–1853.217. Itoh, K., Misawa, M., Fukunaga, T. (2001). J. Non-Cryst. Solids 293–295:575–579.
218. Malhouroux-Gaffet, N., Gaffet, E. (1993). J. Alloys Compounds 198:143–154.219. Gaffet, E., Harmelin, M. (1990). In: Froes, F. H., deBarbadillo, J. J., eds. Structural
Applications of Mechanical Alloying. Materials Park, OH: ASM International, pp. 257–264.
220. Schnitzke, K., Schultz, L., Wecker, J., Katter, M. (1990). Appl. Phys. Lett. 57:2853–2855.221. Ding, J., McCormick, P. G., Street, R. (1992). J. Alloys Compounds 189:83–86.222. Sherif El-Eskandarany, M., Aoki, K., Suzuki, K. (1990). J. Less Common Metals
167:113–118.223. Sherif El-Eskandarany, M. (1996). Metall. Mater. Trans. 27A:3267–3278.224. Sherif El-Eskandarany, M., Itoh, F., Aoki, K., Suzuki, K. (1990). J. Non-Cryst. Solids
117–118:729–732.225. Fukunaga, T., Nakamura, K., Suzuki, K., Mizutani, U. (1990). J. Non-Cryst. Solids 117–
118:700–703.226. Lee, C. H., Fukunaga, T., Mizutani, U. (1991). Mater. Sci. Eng. A134:1334–1337.
227. Lee, C. H., Mori, M., Fukunaga, T., Sakurai, K., Mizutani, U. (1992). Mater. Sci. For.88–90:399–406.
228. Liu, L., Chu, Z. Q., Dong, Y. D. (1992). J. Alloys Compounds 186:217–221.
229. Veltl, G., Scholz, B., Kunze, H. D. (1991). Mater. Sci. Eng. A134:1410–1413.230. Lee, P. Y., Yang, J. L., Lin, H. M. (1998). J. Mater. Sci. 33:235–239.231. Viswanadham, R. K., Mannan, S. K., Kumar, K. S. (1988). Scripta Metall. 22:1011–
1014.232. Suryanarayana, C., Chen, G. H., Frefer, A., Froes, F. H. (1992). Mater. Sci. Eng.
A158:93–101.
233. Bonetti, E., Valdre, G., Enzo, S., Cocco, G. (1993). J. Alloys Compounds 194:331–338.234. Itsukaichi, T., Shiga, S., Masuyama, K., Umemoto, M., Okane, I. (1992). Mater. Sci. For.
88–90:631–638.235. Suzuki, T., Ino, T., Nagumo, M. (1992). Mater. Sci. For. 88–90:639–646.
MD: SURYANARAYANA, JOB: 03320, PAGE: 326
4103-X_Suryanarayana_Ch12_R2_080304
Chapter 12326

236. Nash, P., Kim, H., Choo, H., Ardy, H., Hwang, S. J., Nash, A. S. (1992). Mater. Sci. For.88–90:603–610.
237. Ahn, J. H., Choi, C. J., Chung, H. S. (1993). In: Ravi, V. A., Srivatsan, T. S., eds.
Processing and Fabrication of Advanced Materials for High Temperature Applications II.Warrendale, PA: TMS, pp. 33–44.
238. Chen, G., Wang, K. (1993). In: deBarbadillo, J. J., et al., eds. Mechanical Alloying for
Structural Applications. Materials Park, OH: ASM International, pp. 149–155.239. Qi, M., Zhu, M., Li, G. B., Sui, H. X., Yang, D. Z. (1993). J. Mater. Sci. Lett. 12:66–69.240. Park, Y. H., Hashimoto, H., Watanabe, R. (1992). Mater. Sci. For. 88–90:59–66.
241. Ahn, J. H., Chung, H. S., Watanabe, R., Park, Y. H. (1992). Mater. Sci. For. 88–90:347–354.
242. Ahn, J. H., Lee, K. R., Cho, H. K. (1995). Mater. Sci. For. 179–181:153–158.
243. Kambara, M., Uenishi, K., Kobayashi, K. F. (2000). J. Mater. Sci. 35:2897–2905.244. Guo, W., Iasonna, A., Magnini, M., Martelli, S., Padella, F. (1994). J. Mater. Sci. 29:
2436–2444.245. Frefer, A., Suryanarayana, C., Froes, F. H. (1993). In: Moore, J. J., et al., eds. Advanced
Synthesis of Engineered Structural Materials. Materials Park, OH: ASM International,pp. 213–219.
246. Itsukaichi, T., Masuyama, K., Umemoto, M., Okane, I., Cabanas-Moreno, J. G. (1993).
J. Mater. Res. 8:1817–1828.247. Burgio, N., Guo, W., Martelli, S., Magini, M., Padella, F., Soletta, I. (1990). In: Froes, F.
H., deBarbadillo, J. J., eds. Structural Applications of Mechanical Alloying. Materials
Park, OH: ASM International, pp. 175–183.248. Guo, W., Martelli, S., Burgio, N., Magini, M., Padella, F., Paradiso, E., Soletta, I. (1991).
J. Mater. Sci. 26:6190–6196.
249. Sherif El-Eskandarany, M. (1996). J. Alloys Compounds 234:67–82.250. Ahn, J. H., Chung, H. (1994). In: Ravi, V. A., Srivatsan, T. S., Moore, J. J., eds. Pro-
cessing and Fabrication of Advanced Materials III. Warrendale, PA: TMS, pp. 227–237.251. Zhang, F., Lu, L., Lai, M. O., Liang, T. F. (1999). Mater. Sci. For. 312–314:109–114.
252. Bououdina, M., Guo, Z. X. (2002). Mater. Sci. Eng. A332:210–222.253. Nagarajan, R., Ranganathan, S. (1994). Mater. Sci. Eng. A179/180:168–172.254. Murty, B. S., Ranganathan, S., Mohan Rao, M. (1992). Mater. Sci. Eng. A149:231–240.
255. Zhang, L. C., Xu, J. (2002). Mater. Sci. For. 386–388:47–52.256. Chu, B. L., Chen, C. C., Perng, T. P. (1992). Metall. Trans. 23A:2105–2110.257. Fukunaga, T., Misawa, M., Suzuki, K., Mizutani, U. (1992). Mater. Sci. For. 88–90:325–
332.258. Schwarz, R. B., Petrich, R. R. (1988). J. Less Common Metals 140:171–184.259. Wang, K. Y., He, A., Quan, M., Chen, G. (1993). In: deBarbadillo, J. J., et al., eds. Me-
chanical Alloying for Structural Applications. Materials Park, OH: ASM International,
pp. 21–25.260. Esaki, H., Tokizane, M. (1992). Mater. Sci. For. 88–90:625–630.261. Battezzati, L., Enzo, S., Schiffini, L., Cocco, G. (1988). J. Less Common Metals 145:301–
308.262. Murty, B. S., Mohan Rao, M., Ranganathan, S. (1990). Scripta Metall. Mater. 24:1819–
1824.
263. Sundaresan, R., Jackson, A. G., Krishnamurthy, S., Froes, F. H. (1988). Mater. Sci. Eng.97:115–119.
264. Bahadur, D., Dunlap, R. A., Foldeaki, M. (1996). J. Alloys Compounds 240:278–284.
265. Thompson, J. R., Politis, C. (1987). Europhys. Lett. 3:199–205.266. Radlinski, A. P., Calka, A. (1991). Mater. Sci. Eng. A134:1376–1379.267. Oehring, M., Yan, Z. H., Klassen, T., Bormann, R. (1992). Phys. Stat. Sol. (a)131:671–
689.
MD: SURYANARAYANA, JOB: 03320, PAGE: 327
4103-X_Suryanarayana_Ch12_R2_080304
Solid-State Amorphization 327

268. Counihan, P. J., Crawford, A., Thadhani, N. N. (1999). Mater. Sci. Eng. A267:26–35.269. Parlapanski, D., Denev, S., Ruseva, R., Gatev, E. (1991). J. Less Common Metals
171:231–236.
270. Fukunaga, T., Homma, Y., Misawa, M., Suzuki, K. (1990). J. Non-Cryst. Solids 117–118:721–724.
271. Yamasaki, T., Ogino, Y., Morishita, K., Fukuoka, K., Atou, F., Syono, Y. (1994). Mater.
Sci. Eng. A179/180:220–223.272. Aoki, K., Memezawa, T., Masumoto, T. (1994). J. Mater. Res. 9:39–46.273. Aoki, K., Memezawa, T., Masumoto, T. (1992). Appl. Phys. Lett. 61:1037–1039.
274. Takasaki, A., Han, C. H., Furuya, Y., Kelton, K. F. (2002). Phil. Mag. Lett. 82:353–361.275. Cardelllini, F., Contini, V., Mazzone, G., Montone, A. (1997). Phil. Mag. B76:629–638.276. Bououdina, M., Luklinska, Z., Guo, Z. X. (2001). Mater. Sci. For. 360–362:421–426.
277. Liu, L., Casadio, S., Magini, M., Nannetti, C. A., Qin, Y., Zheng, K. (1997). Mater. Sci.For. 235–238:163–168.
278. Kaloshkin, S. D. (2000). Mater. Sci. For. 342–346:591–596.279. Sherif El-Eskandarany, M., Sumiyama, K., Suzuki, K. (1996). Sci. Rep.RITU A42:31–38.
280. Sherif El-Eskandarany, M., Sumiyama, K., Suzuki, K. (1997). Acta Mater. 45:1175–1187.
281. Herr, U., Samwer, K. (1992). Nanostructured Mater. 1:515–521.
282. Eckert, J., Jost, K., De Haas, O., Schultz, L. (1997). Mater. Sci. For. 235–238:133–138.283. Schiffini, L., Mulas, G., Daturi, M., Ferretti, M. (1993). In: deBarbadillo, J. J., et al., eds.
Mechanical Alloying for Structural Applications. Materials Park, OH: ASM Interna-
tional, pp. 457–461.284. Zhang, H., Su, Y., Wang, L., Wu, L., Tan, Z., Zhang, B. (1994). J. Alloys Compounds
204:27–31.
285. Biswas, A., Dey, G. K., Haq, A. J., Bose, D. K., Banerjee, S. (1996). J. Mater. Res.11:599–607.
286. Chen, G. H., Suryanarayana, C., Froes, F. H. (1993). In: deBarbadillo, J. J., et al., eds.Mechanical Alloying for Structural Applications. Materials Park, OH: ASM Interna-
tional, pp. 367–375.287. Ma, E., Atzmon, M. (1991). Phys. Rev. Lett. 67:1126–1129.288. Ma, E., Atzmon, M. (1993). J. Alloys Compounds 194:235–244.
289. Fecht, H. J., Han, G., Fu, Z., Johnson, W. L. (1990). J. Appl. Phys. 67:1744–1748.290. Eckert, J., Seidel, M., Schlorke, N., Kubler, A., Schultz, L. (1997). Mater. Sci. For. 235–
238:23–28.
291. Zhou, C. R., Lu, K., Xu, J. (2000). Mater. Sci. For. 343–346:116–122.292. Deledda, S., Eckert, J., Schultz, L. (2002). Mater. Sci. For. 386–388:71–76.293. Seidel, M., Eckert, J., Schultz, L. (1997). Mater. Sci. For. 235–238:29–34.294. Lin, R., Seidel, M., Jiang, J. Z., Eckert, J. (1998). Mater. Sci. For. 269–272:461–466.
295. Sagel, A., Wunderlich, R. K., Fecht, H. J. (1997). Mater. Sci. For. 235–238:389–394.296. Sagel, A., Wunderlich, R. K., Fecht, H. J. (1997). Mater. Lett. 33:123–127.297. Sagel, A., Wunderlich, R. K., Fecht, H. J. (1998). Mater. Sci. For. 269–272:81–86.
298. Eckert, J., Schultz, L., Urban, K. (1988). J. Less Common Metals 145:283–291.299. Weeber, A. W., Bakker, H. (1988). Mater. Sci. Eng. 97:133–135.300. Ahn, J. H., Park, Y. K. (1999). J. Mater. Sci. Lett. 18:17–19.
301. Ahn, J. H., Zhu, M. (1998). Mater. Sci. For. 269–272:201–206.302. Illekova, E., Jergel, M., Kuhnast, F.-A., Held, O. (1998). Mater. Sci. For. 269–272:583–
588.
303. Bokhonov, B., Konstanchuk, I., Ivanov, E., Boldyrev, V. V. (1992). J. Alloys Compounds187:207–214.
304. Sherif El-Eskandarany, M., Saida, J., Inoue, A. (2003). Metall. Mater. Trans. 34A:893–898.
MD: SURYANARAYANA, JOB: 03320, PAGE: 328
4103-X_Suryanarayana_Ch12_R2_080304
Chapter 12328

305. Al-Assiri, M., Al-Hajry, A., Hefne, J., Enzo, S., Cowlam, N., Al-Shahrani, A., Al-Salami,A. E. (2001). Mater. Sci. For. 360–362:379–384.
306. Avvakumov, E. G., Karakchiev, L. G., Gusev, A. A., Vinokurova, O. B. (2002). Mater.
Sci. For. 386–388:245–250.307. Kobayashi, K. F., Tachibana, N., Shingu, P. H. (1990). J. Mater. Sci. 25:801–804.308. Sun, J., Zhang, J. X., Fu, Y. Y., Hu, G. X. (2002). Mater. Sci. Eng. A329–331:703–
707.309. Sherif El-Eskandarany, M., Aoki, K., Suzuki, K. (1991). J. Alloys Compounds 177:229–
244.
310. Sakurai, M., Fukunaga, T., Sumiyama, K., Suzuki, K. (1991). J. Jpn. Soc. Powder PowderMetall. 38:63–66.
311. Tang, J. (1996). Mater. Sci. For. 225–227:477–482.
312. Tang, J., Zhao, W., Li, L., Falster, A. U., Simmons, W. B. Jr, Zhou, W. L., Ikuhara, Y.,Zhang, J. H. (1996). J. Mater. Res. 11:733–738.
313. Welham, N. J., Williams, J. S. (1998). Carbon 36:1309–1315.314. Zhou, G. F., Bakker, H. (1993). Phys. Rev. B48:13383–13398.
315. Koch, C. C., Pathak, D., Yamada, K. (1993). In: deBarbadillo, J. J., et al., eds.Mechanical Alloying for Structural Applications. Materials Park, OH: ASM Interna-tional, pp. 205–212.
316. Cho, Y. S., Koch, C. C. (1993). J. Alloys Compounds 194:287–294.317. Fukunaga, T. (2001). J. Non-Cryst. Solids 293–295:187–192.318. Gaffet, E. (1991). Mater. Sci. Eng. A136:161–169.
319. Nasu, T., Araki, F., Uemura, O., Usuki, T., Kameda, Y., Takahashi, S., Tokumitsu, K.(2001). Mater. Sci. For. 360–362:203–210.
320. Damonte, L. C., Mendoza-Zelis, L., Sanchez, F. H. (1998). Mater. Sci. For. 269–272:625–
630.321. Inoue, A., Matsuki, K., Masumoto, T. (1992). Mater. Sci. For. 88–90:305–312.322. Calka, A., Radlinski, A. P. (1989). Mater. Sci. Eng. A118:131–135.323. Skakov, YuA., Djakonova, N. P., Sviridova, T. A., Shelekhov, E. V. (1998). Mater. Sci.
For. 269–272:595–600.324. Alonso, T., Yang, H., Liu, Y., McCormick, P. G. (1992). Appl. Phys. Lett. 60:833–
834.
325. Nakamura, T., Inoue, A., Matsuki, K., Masumoto, T. (1989). J. Mater. Sci. Lett. 8:13–16.
326. Jang, J. S. C., Koch, C. C. (1990). J. Mater. Res. 5:498–510.
327. Chen, Y., Le Hazif, R., Martin, G. (1992). Mater. Sci. For. 88–90:35–41.328. Aoki, K., Memezawa, A., Masumoto, T. (1993). J. Mater. Res. 8:307–313.329. Tonejc, A., Duzevic, D., Tonejc, A. M. (1991). Mater. Sci. Eng. A134:1372–1375.330. Takeuchi, T., Koyano, T., Utsumi, M., Fukunaga, T., Kaneko, K., Mizutani, U. (1994).
Mater. Sci. Eng. A179/180:224–228.331. Guo, F. Q., Lu, K. (1998). Phil. Mag. Lett. 77:181–186.332. Lu, K., Guo, F. Q., Zhao, Y. H., Jin, Z. H. (1999). Mater. Sci. For. 312–314:43–48.
333. Zhao, Y. H., Jin, Z. H., Lu, K. (1999). Phil. Mag. Lett. 79:747–754.334. Shen, T. D., Koch, C. C., McCormick, T. L., Nemanich, R. J., Huang, J. Y., Huang, J. G.
(1995). J. Mater. Res. 10:139–148.
335. Yang, X. Y., Wu, Y. K., Ye, H. Q. (2001). J. Mater. Sci. Lett. 20:1517–1518.336. Liao, J., Senna, M. (1992). Mater. Sci. For. 88–90:753–758.337. Yamada, K., Koch, C. C. (1993). J. Mater. Res. 8:1317–1326.
338. Fukamichi, K., Goto, T., Fukunaga, T., Suzuki, K. (1991). Mater. Sci. Eng. A133:245–247.
339. Gumbel, A., Ledig, L., Hough, D., Oertel, C.-G., Skrotzki, W., Eckert, J., Schultz, L.(1999). Mater. Sci. For. 312–314:61–66.
MD: SURYANARAYANA, JOB: 03320, PAGE: 329
4103-X_Suryanarayana_Ch12_R2_080304
Solid-State Amorphization 329

MD: SURYANARAYANA, JOB: 03320, PAGE: 330
4103-X_Suryanarayana_Ch12_R2_080304
340. Gerasimov, K. B., Gusev, A. A., Ivanov, E. Y., Boldyrev, V. V. (1991). J. Mater. Sci.26:2495–2500.
341. Sherif El-Eskandarany, M., Saida, J., Inoue, A. (2002). Acta Mater. 50:2725–2736.
342. Weeber, A. W., Van der Meer, K., Bakker, H., de Boer, F. R., Thijse, B. J., Jungste, J. F.(1986). J. Phys. F: Metal. Phys. 16:1897–1900.
343. Sheng, H. W., Lu, K., Ma, E. (1999). J. Appl. Phys. 85:6400–6407.
344. Bonetti, E., Cocco, G., Enzo, S., Valdre, G. (1990). Mater. Sci. Technol. 6:1258–1262.345. Trudeau, M. L., Schulz, R., Dussault, D., Van Neste, A. (1990). Phys. Rev. Lett. 64:99–
102.
346. Trudeau, M. L. (1994). Appl. Phys. Lett. 64:3661–3663.347. Koch, C. C. (1995). Mater. Trans. Jpn. Inst. Metals 36:85–95.348. Mukhopadhyay, D. K., Suryanarayana, C., Froes, F. H. (1995). In: Phillips, M., Porter,
J., eds. Advances in Powder Metallurgy and Particulate Materials—1995. Vol. 1.Princeton, NJ: Metal Powder Industries Federation, pp. 123–133.
349. Nash, P., Higgins, G. T., Dillinger, N., Hwang, S. J., Kim, H. (1989). In: Gasbarre,T. G., Jandeska, W. F., eds. Advances in Powder Metallurgy—1989. Vol. 2. Princeton, NJ:
Metal Powder Industries Federation, pp. 473–479.350. Suryanarayana, C. (1995). Intermetallics (3,153–160.351. Sato, K., Ishizaki, K., Chen, G. H., Frefer, A., Suryanarayana, C., Froes, F. H. (1993). In:
Moore, J. J., et al., eds. Advanced Synthesis of Engineered Structural Materials. MaterialsPark, OH: ASM International, pp. 221–225.
352. Anantharaman, T. R., Suryanarayana, C. (1971). J. Mater. Sci. 6:1111–1135.
353. Inoue, A. (2000). Acta Mater. 48:279–306.354. Schwarz, R. B., Rubin, J. B. (1993). J. Alloys Compounds 194:189–197.355. Hellstern, E., Schultz, L. (1987). Mater. Sci. Eng. 93:213–216.
356. Herbert, R. J., Perepezko, J. H. (2002). Mater. Sci. For. 386–388:21–26.357. Lee, C. H., Fukunaga, T., Yamada, Y., Mizutani, U., Okamoto, H. (1993). J. Phase
Equilibria. 14:167–171.358. Gaffet, E., Faudot, F., Harmelin, M. (1992). Mater. Sci. For. 88–90:375–382.
359. Massobrio, C. (1990). J. Physique 51(Colloq. 4, Suppl. 14):C4-55–C4-61.360. Eckert, J., Holzer, J. C., Krill, C. E. III, Johnson, W. L. (1992). Mater. Sci. For. 88–
90:505–512.
361. Liu, Y. J., Chang, I. T. H. (2002). Acta Mater. 50:2747–2760.362. Beke, D. L., Loeff, P. I., Bakker, H. (1991). Acta Metall. Mater. 39:1259–1266.363. Beke, D. L., Bakker, H., Loeff, P. I. (1991). Acta Metall. Mater. 39:1267–1273.
364. Miedema, A. R. (1976). Philips Tech. Rev. 36:217.365. Zhang, B. W. (1985). Physica B. 132:319.366. Zhang, H., Zhang, B. W. (1995). Physica B205:263–268.367. Zhang, H. (1993). J. Phys. C: Condens. Matter. 5:L337–L342.
368. Zhang, H., Zhang, B. W. (1993). Physica B192:247–252.369. Chakk, Y., Berger, S., Weiss, B. Z., Brook-Levinson, E. (1994). Acta Metall. Mater.
42:3679–3685.
370. Egami, T., Waseda, Y. (1984). J. Non-Cryst. Solids 64:113–134.371. Egami, T. (1996). J. Non-Cryst. Solids 205–207:575–582.372. Fecht, H. J., Johnson, W. L. (1991). Mater. Sci. Eng. A133:427–430.
373. Kauzmann, W. (1948). Chem. Rev. 43:219–256.374. Koster, U., Herold, U. (1981). In: Guntherodt, H. J., Beck, H., eds. Glassy Metals I.
Berlin: Springer-Verlag, pp. 225–259.
375. Scott, M. G. (1983). In: Luborsky, F. E., ed. Amorphous Metallic Alloys. London:Butterworths, pp. 144–168.
376. Ranganathan, S., Suryanarayana, C. (1985). Mater. Sci. For. 3:173–185.
Chapter 12330

377. Wagner, C. N. J., Boldrick, M. S. (1993). J. Alloys Compounds 194:295–302.378. Inoue, A., Kobayashi, K., Suryanarayana, C., Masumoto, T. (1980). Scripta Metall.
14:119–122.
379. Seidel, M., Eckert, J., Schultz, L. (1995). J. Appl. Phys. 77:5446–5448.380. Eckert, J., Matten, N., Zinkevitch, M., Seidel, M. (1998). Mater. Trans. Jpn. Inst. Metals
39:623.
381. Bansal, C., Fultz, B., Johnson, W. L. (1994). Nanostructured Mater. 4:919–925.382. Huang, B., Perez, R. J., Crawford, P. J., Sharif, A. A., Nutt, S. R., Lavernia, E. J. (1995).
Nanostructured Mater. 5:545–553.
383. Chen, H. S. (1974). Acta Metall. 22:1505–1511.384. Chen, H. S. (1976). Mater. Sci. Eng. 24:153–158.385. Inoue, A. (2001). In: Inoue, A., Hashimoto, K., eds., Amorphous and Nanocrystalline
Materials: Preparation, Properties, and Applications. Berlin: Springer-Verlag, pp. 1–51.386. Peker, A., Johnson, W. L. (1993). Appl. Phys. Lett. 63:2342–2344.387. Inoue, A. (1999). In: Suryanarayana, C., ed. Non-equilibrium Processing of Materials.
Oxford: Pergamon, pp. 375–415.
388. Inoue, A. (1998). Bulk Amorphous Alloys: Preparation and Fundamental Characteristics.Vol. 4 of Materials Science Foundations. Zurich: TransTech.
389. Inoue, A. (1999). Bulk Amorphous Alloys: Practical Characteristics and Applications. Vol.
6 of Materials Science Foundations. Zurich: TransTech.390. Johnson, W. L. (1999). MRS Bull. 24(10):42–56.391. Johnson, W. L., Inoue, A., Liu, C. T., eds. (1999). Bulk Metallic Glasses. Vol 554 of MRS
Symp Proc. Warrendale, PA: Mater. Res. Soc.392. Inoue, A., Yavari, A. R., Johnson, W. L., Dauskardt, R. H., eds. (2001). Supercooled
Liquid, Bulk Glassy, and Nanocrystalline States of Alloys. Vol 644 of MRS Symp Proc.
Warrendale, PA: Mater. Res. Soc.393. Schneider, S. (2001). J. Phys.: Condens. Matter. 13:7723–7736.394. Inoue, A., Nishiyama, N., Kimura, H. M. (1997). Mater. Trans. JIM 38:179–183.395. Egami, T. (2003). J. Non-Cryst. Solids 317:30–33.
396. Miracle, D. B., Senkov, O. N. (2003). Mater. Sci. Eng. A347:50–58.397. Eckert, J. (1999). Mater. Sci. For. 312–314:3–12.398. Leonhard, A., Xing, L. Q., Heilmaier, M., Gebert, A., Eckert, J., Schultz, L. (1998).
Nanostructured Mater. 10:805–817.399. Leonhard, A., Heilmaier, M., Eckert, J., Schultz, L. (1999). In: Johnson, W. L., Inoue, A.,
Liu, C. T., eds. Bulk Metallic Glasses, vol. 554 of Symp. Proc. Warrendale, PA: Mater.
Res. Soc., pp. 137–142.400. Roger-Leonhard, A., Heilmaier, M., Eckert, J. (2000). Scripta Mater. 43:459–464.401. He, G., Bian, Z., Chen, G. L. (2001). J. Mater. Sci. Lett. 20:633–636.402. Gu, X., Jiao, T., Kecskes, L. J., Woodman, R. H., Fan, C., Ramesh, K. T., Hufnagel, T.
C. (2003). J. Non-Cryst. Solids 317:112–117.403. Ashley, S. (1998). Mech. Eng. 120(6):72–74.404. V.I.P. Vintage Model Amorphous Face Golf Club Catalog, Dunlop, Tokyo, 1998.
405. Conner, R. D., Dandliker, R. B., Johnson, W. L. (1998). Acta Mater. 46:6089–6102.406. Miedema, A. R., de Chatel, P. F., deBoer, F. R. (1980). Physica B100:1.407. Bakker, H. (1998). Enthalpies in Alloys—Miedema’s Semi-Empirical Model. Vol. 1 of
Materials Science Foundations. Zurich: TransTech.408. deBoer, F. R., Boom, R., Mattens, W. C. M., Miedema, A. R., Niessen, A. K. (1988). In:
deBoer, F. R., Pettifor, D. G., eds. Cohesion in Metals. Amsterdam: Elsevier.
409. Weeber, A. W., Loeff, P. I., Bakker, H. (1988). J. Less Common Metals 145:293–299.410. Eckert, J., Schultz, L., Urban, K. (1989). In: Arzt, E., Schultz, L., eds. New Materials by
Mechanical Alloying Techniques. Oberursel, Germany: DGM, pp. 85–90.
MD: SURYANARAYANA, JOB: 03320, PAGE: 331
4103-X_Suryanarayana_Ch12_R2_080304
Solid-State Amorphization 331

411. Loeff, P. I., Spit, F. H. M., Bakker, H. (1988). J. Less Common Metals 145:271–275.412. Zhang, B. W., Tan, Z. S. (1988). J. Mater. Sci. Lett. 7:681–682.413. Saunders, N., Miodownik, A. P. (1998). CALPHAD. Oxford, UK: Pergamon.
414. Hellstern, E., Schultz, L., Eckert, J. (1988). J. Less Common Metals 140:93–98.415. Zhou, G. F., Bakker, H. (1994). Phys. Rev. Lett. 72:2290–2293.416. Hellstern, E., Schultz, L. (1986). Appl. Phys. Lett. 49:1163–1165.
417. Biegel, W., Krebs, H. U., Michaelsen, C., Freyhardt, H. C., Hellstern, E. (1988). Mater.Sci. Eng. 97:59–62.
MD: SURYANARAYANA, JOB: 03320, PAGE: 332
4103-X_Suryanarayana_Ch12_R2_080304
Chapter 12332

13
Nanostructured Materials
13.1 INTRODUCTION
Nanocrystalline materials are single- or multiphase polycrystalline solids with a grainsize of the order of a few nanometers (1 nm = 10�9 m = 10 A), typically 1–100 nmin at least one dimension. Since the grain sizes are so small, a significant volume ofthe microstructure in nanocrystalline materials is composed of interfaces, mainlygrain boundaries. This means that a large volume fraction of the atoms resides in thegrain boundaries. Consequently, nanocrystalline materials exhibit properties that aresignificantly different from, and often improved over, their conventional coarse-grained polycrystalline counterparts. Compared to the material with a moreconventional grain size, i.e., larger than a few micrometers, nanocrystalline materialsshow increased strength, high hardness, extremely high diffusion rates, and conse-quently reduced sintering times for powder compaction. Several excellent reviews areavailable giving details on different aspects of processing, properties, and applica-tions of these materials [1–7].
13.2 CLASSIFICATION AND CHARACTERISTICSOF NANOSTRUCTURED MATERIALS
Nanocrystalline materials can be classified into different categories depending on thenumber of dimensions in which the material has nanometer modulations. Thus, theycan be classified into (1) layered or lamellar structures, (2) filamentary structures,and (3) equiaxed nanostructured materials. A layered or lamellar structure is a one-dimensional (1-D) nanostructure in which the magnitude of length and width aremuch greater than the thickness, which is only a few nanometers. One can also
4103-X_Suryanarayana_Ch13_R2_071504
MD: SURYANARAYANA, JOB: 03320, PAGE: 333
333

visualize a two-dimensional (2-D) rod-shaped nanostructure that can be termedfilamentary and in this the length is substantially larger than width and diameter,which are of nanometer dimensions. The most common of the nanostructures,however, is basically equiaxed (all three dimensions are of nanometer size) and aretermed nanostructured crystallites [three-dimensional (3-D) nanostructures] [8].
The nanostructured materials may contain crystalline, quasi-crystalline, oramorphous phases and can be metal, ceramic, polymer, or composite. If the grainsare made up of crystals, the material is called nanocrystalline; and this is the mostcommon variety of nanostructured materials. On the other hand, if the grains aremade up of quasi-crystalline or amorphous (glassy) phases, they are termed nano-quasi-crystals and nanoglasses, respectively [2]. Gleiter [9] has further classified thenanostructured materials according to the composition, morphology, and distribu-tion of the nanocrystalline component.
Table 13.1 shows this classification of the three types of nanostructures.Among these, maximal research is conducted on the synthesis, consolidation, andcharacterization of the 3-D nanostructured crystallites followed by the 1-D layerednanostructures. While the former are expected to find applications based on theirhigh strength, improved formability, and good combination of soft magneticproperties, the latter are targeted for electronic applications. Relatively few inves-tigations have been carried out on the 2-D filamentary nanostructures.
Figure 13.1 shows a schematic representation of a hard-sphere model of anequiaxed nanocrystalline metal. Two types of atoms can be distinguished: crystalatoms with nearest-neighbor configuration corresponding to the lattice and theboundary atoms with a variety of interatomic spacings, differing from boundary toboundary. A nanocrystalline metal contains typically a high number of interfaces(6 � 1025 m�3 for a 10-nm grain size) with random orientation relationships, andconsequently, a substantial fraction of the atoms lies in the interfaces. The totalintercrystalline region consists of grain boundaries, triple junctions, i.e., intersectionlines of three or more adjoining crystals, and other interfaces.
One can consider the grains to have the regular 14-sided tetrakaidecahedronshapes, with the hexagonal faces representing the grain boundaries, and edgescorresponding to triple junctions. Then, assuming that the maximal diameter ofan inscribed sphere as the grain size d, and the intercrystalline component as an outer‘‘skin’’ of the tetrakaidecahedron with a thickness of D/2, where D is the averagegrain boundary thickness, the intercrystalline volume fraction has been calculated as:
Vic ¼ 1� d� Dd
� �3
ð13:1Þ
MD: SURYANARAYANA, JOB: 03320, PAGE: 334
4103-X_Suryanarayana_Ch13_R2_071504
Table 13.1 Classification of Nanocrystalline Materials
Dimensionality Designation Typical method(s) of synthesis
One dimensional Layered (lamellar) Vapor depositionElectrodeposition
Two dimensional Filamentary Chemical vapor deposition
Three dimensional Crystallites (equiaxed) Gas condensationMechanical alloying/milling
Chapter 13334

The grain boundary component is given as:
Vgb ¼ 3Dðd� DÞ2
d 3ð13:2Þ
and therefore, the volume fraction associated with triple junctions, Vtj, is given by:
Vtj ¼ Vic � Vgb ð13:3ÞAll of the above equations are valid for d > D. Thus, it may be seen that the volumefraction of these components depends on the grain size of the metal. Figure 13.2shows variation of the volume fraction of grain boundaries, triple junctions, andintercrystalline region as a function of the grain size of the metal. It may be notedthat these values can be as much as 70–80% at very small grain sizes of 2–3 nm [10].Because of the significant fraction of the interfacial component, nanocrystallinematerials can be considered to be made up of two different components (‘‘phases’’)—grains and the intercrystalline region. Thus, properties of nanocrystalline materialscan be tailored by controlling the interfacial component via grain size control.
13.3 SYNTHESIS OF NANOSTRUCTURED MATERIALS
Nanocrystalline materials have been synthesized by a number of techniques startingfrom the vapor phase, liquid phase, or solid state. Two major approaches have beentaken to synthesize nanocrystalline materials. One is the ‘‘top-down’’ approach inwhich a bulk material with conventional coarse grain sizes is reduced in its grain sizeuntil it reaches nanometer dimensions. Mechanical alloying/milling methods comeunder this category. The other one is termed the ‘‘bottom-up’’ approach, in whichsmall clusters of material with nanometer dimensions are produced, and these arethen consolidated to produce the ‘‘bulk’’ nanocrystalline material. A number ofmethods have been developed over the years using these two basic approaches. The
MD: SURYANARAYANA, JOB: 03320, PAGE: 335
4103-X_Suryanarayana_Ch13_R2_071504
Figure 13.1 Schematic representation of an equiaxed nanocrystalline metal distinguishingbetween the atoms associated with the individual grains (filled circles) and those constituting
the grain boundary network (open circles) [1].
Nanostructured Materials 335

currently available methods of synthesis include inert gas condensation, mechanicalalloying, spray conversion processing, electrodeposition, rapid solidification fromthe melt, physical vapor deposition, chemical vapor processing, coprecipitation, sol-gel processing, sliding wear, severe plastic deformation, spark erosion, plasmaprocessing, autoignition, laser ablation, hydrothermal pyrolysis, thermophoreticforced flux system, quenching of the melt under high pressure, biological templating,sonochemical synthesis, and devitrification of amorphous phases. Research intonewer methods is continuing so as to achieve a particular grain size or shape or otherspecial features [11].
In practice any method capable of producing very-fine-grain materials can beused to synthesize nanocrystalline materials. The grain size, morphology, and texturecan be varied by suitably modifying or controlling the process variables in thesemethods. Each of these methods has advantages and disadvantages and one shouldchoose the appropriate method depending on the requirements. If a phase transfor-mation is involved, e.g., liquid to solid or vapor to solid, then steps should be takento increase the nucleation rate and decrease the growth rate during formation of theproduct phase. In fact, it is this strategy that is used during devitrification of metallicglasses to produce nanocrystalline materials [12].
Of all the methods indicated above, mechanical alloying (MA) has been usedmost extensively to synthesize nanocrystalline materials. This is essentially due to thefact that MA is a very simple room temperature technique that is capable ofproducing nanocrystalline structures in almost any type of material. The techniquerequires relatively simple and inexpensive equipment, and it is also possible to
MD: SURYANARAYANA, JOB: 03320, PAGE: 336
4103-X_Suryanarayana_Ch13_R2_071504
Figure 13.2 Effect of grain size on calculated volume fractions for intercrystalline regions,
grain boundaries, and triple junctions, assuming a grain boundary width of 1 nm [10].
Chapter 13336

produce bulk quantities of material in the solid state. Scaling up of this technique toproduce tonnage quantities on an industrial scale has already been proven.
The first report of formation of a nanostructured material synthesized by MAwas issued by Thompson and Politis in 1987 [13], even though specific reference toformation of ‘‘nanometer order crystalline structures produced by mechanicalalloying’’ was made by Shingu et al. in 1988 [14]. The field of synthesis ofnanostructured materials by MA is growing very rapidly, but Koch [15] hassummarized the results on the synthesis and structure of nanocrystalline structuresproduced by mechanical attrition; an updated version was published in 1997 [16].
13.4 MECHANISM OF FORMATION OF NANOSTRUCTURES
Grain sizes with nanometer dimensions have been observed in almost all mechan-ically alloyed pure metals, intermetallics, and alloys (if they continue to becrystalline). The minimal grain size achieved in mechanically alloyed materials hasbeen reported to be a few nanometers, ranging typically from about 5 to 50 nm, butvarying based on the material and processing conditions. Thus, it appears thatsynthesis of nanostructures by MA is a ubiquitous phenomenon and nanostructurescould be produced by MA in every material. In spite of this, there have not beenmany detailed investigations to explain why and how nanometer-sized grains areobtained in these materials.
Hellstern et al. [17] studied the evolution of nanostructure formation inmechanically milled AlRu compound through detailed transmission electron mi-croscopy (TEM) techniques. From high-resolution TEM observations, it wasreported that deformation was localized within shear bands in the early stages ofMA, due to the high deformation rates experienced during MA. These shear bands,which contain a high density of dislocations, have a typical width of approximately0.5–1.0 Am. Small grains, with a diameter of 8–12 nm, were seen within the shearbands and electron diffraction patterns suggested significant preferred orientation.With continued milling, the average atomic level strain increased due to increasingdislocation density, and at a certain dislocation density within these heavily strainedregions the crystal disintegrated into subgrains that are separated by low-angle grainboundaries. This resulted in a decrease of the lattice strain. The subgrains formedthis way were of nanometer dimensions, often between 20 and 30 nm.
On further processing, deformation occurred in shear bands located inpreviously unstrained parts of the material. The grain size decreased steadily andthe shear bands coalesced. The small-angle boundaries were replaced by higher anglegrain boundaries, implying grain rotation, as reflected by the absence of texture inthe electron diffraction patterns and random orientation of the grains observed fromthe lattice fringes in the high-resolution electron micrographs. Consequently,dislocation-free nanocrystalline grains were formed. This is the currently acceptedmechanism of nanocrystal formation in mechanically alloyed/milled powders.
Li et al. [18] also proposed a model for the refinement of grain size during ballmilling and noted that the grain size in the early stages of milling follows the relation:
d ¼ Kt�2=3 ð13:4Þ
where d is the grain size, t is the time, and K is a constant.
MD: SURYANARAYANA, JOB: 03320, PAGE: 337
4103-X_Suryanarayana_Ch13_R2_071504
Nanostructured Materials 337

Chung et al. [19] investigated the mechanisms of microstructure evolutionduring cryomilling of nickel containing hard AlN particles. They observed that, inthe presence of 2 wt% AlN particles, the grain size of Ni was reduced to 35 nm after8 h of cryomilling. In contrast, the grain size of Ni cryomilled under identicalconditions, but without the hard particles, exceeded 100 nm. They also concludedthat the rate of grain size refinement increased with increasing amount of hardparticles. This was explained on the basis of interaction of dislocations with hard,nondeformable nitride particles and generation of thermal dislocations caused by themismatch between the coefficients of thermal expansion between the Ni matrix andthe hard AlN particles.
13.5 MINIMAL GRAIN SIZE
As noted earlier, the grain size of materials decreases with milling time and reaches asaturation level when a balance is established between the fracturing and cold-welding events. This minimal grain size is different depending on the material andmilling conditions. For example, the grain size was smaller at lower milling temper-atures. Some efforts have been made in recent years to rationalize the minimal grainsize obtainable in different materials in terms of the material properties. The minimal
MD: SURYANARAYANA, JOB: 03320, PAGE: 338
4103-X_Suryanarayana_Ch13_R2_071504
Table 13.2 Crystal Structure, Melting Point, and Minimal Grain Size (dmin) of MetalsObtained by Mechanical Milling
MetalCrystalstructure
Meltingpoint (jC) dmin (nm) Ref.
Ag FCC 960.8 20 22Al FCC 660.3 20 23
Cu FCC 1084 14 24Ge FCC 937 10 25Ir FCC 2446 6 20
Ni FCC 1455 7.5 26Pd FCC 1552 7 20Rh FCC 1962 7 20Si FCC 1414 3 27
Cr BCC 1860 9 28a-Fe BCC 1536 3 29
Mo BCC 2615 5 30, 31Nb BCC 2467 9 32W BCC 3410 9 33
Co HCP 1495 10 34Hf HCP 2227 4 35Mg HCP 649 17 36
Ru HCP 2310 11 17Ti HCP 1667 12 37Zn HCP 420 23 38
Zr HCP 1852 12 24
Chapter 13338

grain size achievable by milling is determined by the competition between the plasticdeformation via dislocation motion that tends to decrease the grain size, and therecovery and recrystallization behavior of the material that tends to increase thegrain size [20,21]. This balance gives a lower bound for the grain size of pure metalsand alloys.
The minimal grain size, dmin, obtained by MM was different for different metalsand also varied with the crystal structure. Tables 13.2 and 13.3 give the dmin valuesreported for different metals and compounds, respectively. This list is not exhaustivesince all the available data on solid solutions, and results of all the investigators for
MD: SURYANARAYANA, JOB: 03320, PAGE: 339
4103-X_Suryanarayana_Ch13_R2_071504
Table 13.3 Crystal Structure, Melting Point, andMinimal Grain Size (dmin) of Compounds Obtainedby Mechanical Milling
Compound dmin (nm) Ref.
Al2O3 13 32
CeO2 10 39Cr3C2 15 40CuFe2O4 9 41
FeAl 12 42(Fe,Cr)2O3 18 43a-Fe2O3 8 44
FeSi 10 45h-FeSi2 15 46FeTi 6 47HfN 5 48
La2/3Ca1/3MnO3 10 49LaNi5 50 47Li2O 20 50
Mg2Ni 4 51Mg2Sn 30 52MnFe2O4 8 53
MoSi2 10 54Nb2Al 4 55NbC 6 56NiAl 8 55
NiO 10 57Ni3Si 15 58NiSn 5 59
Pd3Zr 8 60RuAl 5 61(Ru,Ir)Al 5 62
Sb2Fe 12.5 63SiC 8 32SmCo5 2.4 64
SnS2 15 65TiC 10 66TiH2 8 67ZnO 10 39
Nanostructured Materials 339

each metal or compound have not been included. Reference has been made only tothe source where the smallest grain size has been mentioned.
From the above data it may be noted that in most of the metals the minimalgrain size attained was in the nanometer dimensions. Furthermore, metals with thebcc crystal structure reach much smaller values than metals with the other crystalstructures. This is probably related to the difficulty of extensive plastic deformationand consequent enhanced fracturing tendency during MA/MM. Ceramics andcompounds are much harder and usually more brittle than the metals on whichthey are based. Therefore, intuitively one expects that the minimal grain size of thesecompounds should be smaller than those of the pure metals. But this does not appearto be always true (Table 13.3).
13.5.1 Correlation with Material Properties
The minimal grain size, dmin, obtained by MM was plotted against the meltingtemperature of metals with different crystal structures in Figure 13.3a–c. In line withthe suggestion of Eckert et al. [20], it may be noted from these figures that theminimal grain size achieved decreases with an increase in the melting temperature ofthe metal. This trend is amply clear in the case of metals with close-packed structures(fcc, Fig. 13.3a and hcp, Fig. 13.3c). Another point of interest is that the difference ingrain size is much less among metals that have high melting temperatures; theminimal grain size is virtually constant. Thus, for the hcp metals Co, Ti, Zr, Hf, andRu, the minimal grain size is almost the same even though the melting temperaturesvary between 1495jC for Co and 2310jC for Ru.
An inverse relation as above is less obvious in the case of bcc metals. However,an important point with respect to the bcc metals is that majority of the bcc metals
MD: SURYANARAYANA, JOB: 03320, PAGE: 340
4103-X_Suryanarayana_Ch13_R2_071504
Figure 13.3 Minimal grain size obtained by mechanical milling of different pure metals withdifferent crystal structures vs. melting temperature: (a) fcc, (b) bcc, and (c) hcp.
Chapter 13340

MD: SURYANARAYANA, JOB: 03320, PAGE: 341
4103-X_Suryanarayana_Ch13_R2_071504
have a high melting temperature. Consequently, the number of metals with a bccstructure and low melting temperatures are few. Therefore, based on the presentlyavailable data, it appears that there is no correlation between the minimal grain sizeand the melting temperature for the bcc metals. But, as noted above, the difference inthe grain size is not significant, even for close-packed metals, which have highmelting temperatures. Thus, the bcc metals also follow this trend. However, if millingis conducted on bcc metals with low melting temperatures, such as Na, K, Li, Cs,
Figure 13.3 Continued.
Nanostructured Materials 341

and Ba, it is possible that an inverse relationship is established in this case also. Mostof these low-melting bcc metals are reactive, and so it may not be easy to conductmilling of these metals without the fear of contaminating them.
Mohamed and Xun [68] have investigated the minimal grain size obtainable bycryomilling in a two-phase Zn-22 wt% Al alloy. They obtained a minimal grain sizeof 33 nm for the Al phase and 41 nm for the Zn phase. These values appear to followthe expected trend but are smaller than those reported earlier (Table 13.2). Thereason for the difference in dmin for Al was explained on the basis that Al in Zn-22wt% Al alloy exists as a solid solution alloy of Zn in Al, and not as the pure element.But for the higher value of dmin for Zn, it was speculated that the purity of thestarting material could be different.
Mohamed [69] has most recently analyzed the existing data on minimal grainsize, dmin, of mechanically milled pure metals and correlated them with differentproperties of the metals. For example, it was shown that by plotting the normalizedminimal grain size, dmin/b, where b is the Burgers vector of the dislocations in thatcrystal structure, vs. melting temperature, Tm, the data could be fit to the equation:
dmin=b ¼ 112 expð�0:0006TmÞ ð13:5Þ
A similar equation could also be set up for the normalized minimal grain size vs.activation energy for self-diffusion, since the self-diffusion activation energy scaleswith the melting temperature.
Mohamed [69] has also shown that the minimal grain size of mechanicallymilled metals can be related to several other material parameters such as hardness,stacking fault energy, activation energy for self-diffusion, bulk modulus, and theequilibrium distance between two edge dislocations. It was shown that a straight lineis obtained when log (dmin/b) is plotted against log (H/G), where H is the hardnessand G is the shear modulus, or log (g/Gb), where g is the stacking fault energy, or Q/R, where Q is the activation energy for self diffusion and R is the gas constant, or B,the bulk modulus. A linear relationship was also noted between dmin and log (Lc),where Lc is the critical equilibrium distance between two edge dislocations. Figure13.4a–c shows the plots of dmin/b vs. melting temperature, Tm, activation energy forself-diffusion, Q, and normalized hardness, H/G. The correlation appears to be verygood in all the three cases. Equations for these correlations may be summarized asfollows:
dmin=b ¼ 112 expð�0:0006TmÞ ð13:5Þ
dmin=b ¼ 112 expð�0:0037QÞ ð13:6Þ
dmin=b ¼ 100 expð�0:0046BÞ ð13:7Þ
13.5.2 Process Variables
Some information is available in the literature on the minimal grain size achievedunder different processing conditions. Among these, the effect of milling energy,milling temperature, and alloying effects have been reported.
MD: SURYANARAYANA, JOB: 03320, PAGE: 342
4103-X_Suryanarayana_Ch13_R2_071504
Chapter 13342

MD: SURYANARAYANA, JOB: 03320, PAGE: 343
4103-X_Suryanarayana_Ch13_R2_071504
Figure 13.4 Normalized grain size (dmin/b) obtained by milling vs. (a) melting temperature,Tm, (b) activation energy for self diffusion, Q, and (c) normalized hardness, H/G [68].
Nanostructured Materials 343
Milling Energy
Since the minimal grain size attained in a metal by mechanical milling is expected todepend on its mechanical properties, one suspects that neither the nature of the millnor the milling energy will have any effect on the minimal grain size achieved. It wasreported [70] that there was no significant effect of milling intensity on nanostructureformation in a Cu-Fe-Co powder blend, but results contrary to this expectation havebeen reported in the literature. It was shown that dmin was about 5 nm when the TiNiintermetallic powder was milled in a high-energy SPEX shaker mill, but only about15 nm in the less energetic Invicta vibratory ball mill [71]. Similar trends were notedfor variations in the ball-to-powder weight ratios (BPRs). The grain size of theniobium metal milled in the Invicta vibratory mill was about 26 F 2 nm at a BPR of5:1, but was only 18 F 1 at a BPR of 10:1 [15]. Similar results were also reported forthe pure metal Cu: 25 F 5 nm for a BPR of 5:1 and 20 F 1 for a BPR of 10:1.Furthermore, the kinetics of achieving this dmin could also depend on the millingenergy, but no such studies have been reported so far.
It was also reported that during nanocrystal formation, the average crystal sizeincreased and the internal lattice strain decreased at higher milling intensities due tothe enhanced thermal effects [72]. In accordance with this argument, the grain size ofSi milled at a high energy of 500 kJ/g was 25 nm, whereas that milled at a low energyof 20 kJ/g was only 4 nm [73].
Milling Temperature
It has been reported that the grain size of powders milled at low temperatures wassmaller than that milled at higher temperatures. For example, the grain size ofcopper milled at room temperature was 26 F 3 nm, while that milled at �85jC wasonly 17 F 2 nm [74]. Similar results were reported for other metals [75] as well as theCoZr intermetallic compound [16]. Milling of powders at higher temperatures alsoresulted in reduced root means square (rms) strain in addition to larger grain sizes[76].
Alloying Effects
Alloy composition appears to have a significant effect on the minimal grain sizeobtained after milling. Since solid solutions are harder and stronger than the puremetals on which they are based, it is expected that the minimal grain size is smallerfor solid solutions than for pure metals. This can be understood on the basis ofincreased fragmentation tendency of the harder (and brittle) powders. Accordingly,Figure 13.5 shows that the minimal grain size in the mechanically alloyed Cu-richCu-Fe powders decreases with increasing Fe content. It may be noted that the grainsize after milling for 24 h in a SPEX mill decreases from 20 nm for pure Cu to about9 nm for Cu-55 at% Fe. This was attributed to solid solution strengthening of the Cumatrix by segregation of Fe atoms to stacking faults [77]. For the Fe-rich Fe-Cupowders also, the grain size was reported to decrease from 6 nm for pure Fe to 4.6nm for Fe-15 at% Cu, again attributed to solid solution hardening [78].
A similar decrease in grain size with increasing Ni content was also reported forthe B2-NiAl phase [21]. The grain size decreased from 10 nm for the Al-rich Al-46at% Ni to about 5 nm for the Ni-rich Al-60 at% Ni. This observation again confirmsthat the alloy composition determines the final grain size. Since NiAl has a wide
MD: SURYANARAYANA, JOB: 03320, PAGE: 344
4103-X_Suryanarayana_Ch13_R2_071504
Chapter 13344

range of homogeneity, this compound can accommodate constitutional vacancies inits lattice. It is known that for the Al-rich compositions, excess vacancies in the Nisublattice lead to strong vacancy hardening and a large resistance against dislocationmotion in coarse-grained polycrystalline material [79]. Furthermore, the largediffusivity enhances dynamic recovery for Al-rich compositions [80]. A combinationof these two effects could prevent formation of very small grain sizes on milling theAl-rich Ni-Al alloys. The difficulty of cross-slip and low diffusivities of Ni-richcompositions hinder recovery. Thus, the transgranular fracture behavior coupledwith little recovery is reported to be the reason for efficient mechanical attrition andconsequent small grain sizes.
The above observations make it clear that the small grain sizes obtained insolid solution alloys are due to the effects of solid solution strengthening. Therefore,it is logical to expect that the grain size in the milled solid solution powder should belarger if the solid solution is softer than the pure metal and remain constant if there isno significant change in hardness. Results consistent with this observation werereported in Ni(Co) where the hardness remained the same in the solid solution as inthe pure metal [74] and in Ni(Cu), Fe(Cu), and Cr(Cu), which exhibited solidsolution softening [77].
Since a number of process variables (method to estimate the grain size, millingenergy, milling temperature, alloying effects, contamination, and so forth) caninfluence the minimal grain size achieved, precautions should be taken and system-atic investigations should be conducted in defining the minimal grain size achieved indifferent materials.
MD: SURYANARAYANA, JOB: 03320, PAGE: 345
4103-X_Suryanarayana_Ch13_R2_071504
Figure 13.5 Minimal grain size obtained by milling of Cu-Fe and Al-Ni powders vs. solutecontent. The Fe-Cu powders were milled for 24 h in a SPEX 8000 mill and the Al-Ni powdersfor 100 h in a Fritsch Pulverisette P5 planetary ball mill.
Nanostructured Materials 345

MD: SURYANARAYANA, JOB: 03320, PAGE: 346
4103-X_Suryanarayana_Ch13_R2_071504
13.5.3 Theoretical Estimates
It has been suggested that the minimal grain size achievable by milling is determinedby the balance between defect/dislocation structure introduced by the plasticdeformation of milling and its recovery by thermal processes. This gives a lowerbound for the grain size of pure metals and alloys and suggests that a small grain sizeitself provides a limit for further grain refinement by milling. Once the wholematerial has the nanocrystalline structure, further deformation can only be accom-plished by grain boundary sliding, which does not lead to microstructural refinementanymore.
It was proposed that the limiting grain size is determined by the minimal grainsize that can sustain a dislocation pile-up within a grain and by the rate of recovery[20]. Based on the dislocation pile-up model, the critical equilibrium distancebetween two edge dislocations in a pile-up, Lc (which could be assumed to be thecrystallite or grain size in milled powders), was calculated using the equation [81]:
Lc ¼3Gb
kð1� rÞH ð13:8Þ
where G is shear modulus, b is Burgers vector, r is Poisson’s ratio, and H is hardnessof the material. According to the above equation, increased hardness results insmaller values of Lc (grain size), and an approximate linear relationship wasobserved between Lc and the minimal grain size obtained by milling of a numberof metals [77].
It has been recently suggested that an inverse linear relationship exists betweenDH l�c and the grain size [82]. DH l�c is the enthalpy difference between the under-cooled liquid (amorphous phase) and conventional polycrystalline metal. Thedifference between the enthalpy of crystallization, DH cryst, and DH l�c is the excessenthalpy, DH c�nc, which can be expressed as
DH c�nc ¼ DH cryst � DH l�c ð13:9ÞDH c�nc is actually the excess enthalpy of nanocrystalline metal with respect to theconventional polycrystalline metal. Assuming that the excess enthalpy of the nano-crystalline metal is concentrated in the grain boundaries, DH c�nc can be expressed as
DH c�nc ¼ 2cgVm=d ð13:10Þwhere g is the grain boundary enthalpy, Vm is the molar volume, d is the averagegrain size, and g is the geometrical factor. Thus, a plot of DH c�nc against 1/d wouldproduce a straight line. On linearly extrapolating this straight line to DH c-nc =DH c�a, where DH c�a is the difference in the enthalpy between the amorphous phaseand the conventional polycrystalline metal, the enthalpy of the nanocrystallizedproduct will be equal to that of the amorphous state. The corresponding grain sizewill be the thermodynamics-based grain size limit. A similar value for the grain sizelimit could also be obtained by plotting DH cryst against 1/d and extrapolating thisstraight line to the value DH cryst = 0.
13.6 NANOCOMPOSITES
Nanocomposites are a new class of materials in which at least one of the phases (thematrix, the reinforcement, or both) is of nanometer dimensions. They have been
Chapter 13346

MD: SURYANARAYANA, JOB: 03320, PAGE: 347
4103-X_Suryanarayana_Ch13_R2_071504
generally classified based on the matrix (such as metal-matrix composites, MMCs;ceramic-matrix composites, CMCs; or polymer-matrix composites, PMCs). Anothermethod of classification is based on the microstructure. According to Niihara [83],nanocomposites can be divided into four categories: intragranular, intergranular,hybrid, and nano/nano composites (Fig. 13.6). In the first three types, the reinforce-ment phase is in the nanometer level whereas the matrix is not. But in the lastcategory, both the matrix and reinforcement are of nanometer dimensions and thesetwo components are randomly distributed. In the intergranular type (Fig. 13.6a), thenanometer-sized reinforcement is distributed along the grain boundaries of themicrometer-sized matrix phase. In the intragranular-type (Fig. 13.6b), the reinforce-ment is inside the coarse matrix grains, whereas in the hybrid type (Fig. 13.6c), thereinforcement is both inside the grains and along the grain boundaries of the matrix.
Nanocomposites are expected to exhibit high strength, fracture toughness,stiffness, wear resistance, and high-temperature properties compared to their coarse-
Figure 13.6 Classification of nanocomposites: (a) intergranular, (b) intragaranular, (c)hybrid, and (d) nano/nano. In the first three types, one of the phases, most probably the
reinforcement, is in the nanometer level, whereas in the last category both phases are innanometer level [83].
Nanostructured Materials 347

grained counterparts [84]. Hence they are potential candidate materials for structuralapplications in aerospace hardware and turbo engine parts and pumps. Magneticnanocomposites containing small (single domain) magnetic particles, isolated elec-trically and magnetically by a nonmagnetic, nonmetallic component, also exhibitinteresting magnetic properties. Therefore, there is considerable interest in develop-ing such nanocomposites.
Natural nanocomposites like bone and nacre (the pearly, iridescent inner layerof the abalone shell) have been known for millions of years. For example, bone hasimpressive strength and toughness. It consists in large part of nanoscale, plate-likecrystals of hydroxyapatite, Ca10(PO4)6(OH)2, dispersed in a matrix of collagen fibers.Hydroxyapatite and collagen by themselves are not particularly promising structuralmaterials. But when these and other ingredients are assembled to form the complexmicrostructure of bone, the resulting nanocomposite offers properties that haveproven extremely difficult to match with synthetic materials.
Nanocomposites are usually prepared by vacuum deposition or chemicalmethods. However, synthesis by mechanochemical methods offers unique advan-tages. Processing by these methods occurs at or near room temperature, andtherefore process control is easy. The size of the matrix and/or reinforcement canbe easily controlled by choosing proper milling conditions. The milling methods canbe easily scaled up to industrial levels, using equipment developed to produce tons ofoxide dispersion strengthened materials (see Chapter 4).
Several nanocomposites have been synthesized by MA. Nanocomposites havealso been obtained when the amorphous phases obtained by MA/MM werecrystallized at relatively low temperatures [85]. An important attribute of thesenanocomposites is in preventing or minimizing grain growth up to very hightemperatures. Reinforcement of Cu and Mg with Al2O3 was reported to preventgrain growth up to the melting point of the metals [86]. The grain size of ananocrystalline mixture of intermetallics [(Ni,Fe)3Al) and (Ni,Fe)Al] processed byMA was also shown to be more resistant to coarsening than that of a similar single-phase material [87]. Recently, there have also been efforts to develop intermetallic-ceramic nanocomposites such as g-TiAl-Ti5Si3 by high-energy milling methods forelevated-temperature applications [88,89].
Nanocomposites by MA methods can be prepared in different ways. The twoconstituents can be put together and milled when only blending and attrition areexpected to occur. Alternately, one could use mechanochemical methods (seeChapter 14) during which in situ reduction of oxides and simultaneous oxidationof the other metallic component could take place. For example, during milling of amixture of iron oxide and a more reactive metal like Al, reduction of iron oxide toiron and oxidation of Al to Al2O3 occurs according to the reaction:
3Fe3O4 þ 8Al ! 9Feþ 4Al2O3 ð13:11ÞReactions as mentioned above generate lot of heat, and so it is possible that theytake place spontaneously in the self-propagating mode. In some cases, the heatgenerated is so large that the reaction takes place in a ‘‘run-away’’ mode and it isdifficult to control the reaction. In such cases, addition of diluents slows down thereactions. The reader is advised to refer to Chapter 14 for details of the in situreduction reactions. It may be noted that the grain size of the nanostructure formed
MD: SURYANARAYANA, JOB: 03320, PAGE: 348
4103-X_Suryanarayana_Ch13_R2_071504
Chapter 13348

during mechanochemical reactions is large due to the excess heat generated duringthe self-propagating high-temperature synthesis (SHS) reaction. If the SHS reactiondoes not take place and only the displacement reaction occurs, then the grain size canstill be small.
Alloys prepared in the nanocrystalline state have been shown to have inter-esting properties that could lead to potential applications. Three such applicationshave been identified [90]. Details of these applications are discussed in Chapter 17.
13.7 PROPERTIES OF NANOCRYSTALLINE MATERIALS
Because of the very fine grain sizes and consequent high density of interfaces,nanocrystalline materials, including those prepared by MA methods, exhibit avariety of properties that are different from and often considerably improved overthose of conventional coarse-grained materials. These include increased strength/hardness, enhanced diffusivity, improved ductility/toughness, reduced density, re-duced elastic modulus, higher electrical resistivity, increased specific heat, highercoefficient of thermal expansion, lower thermal conductivity, and superior softmagnetic properties [1–7]. Among these, the most dramatic effect is seen in themechanical properties [91].
13.7.1 Hardness and Strength
The mechanically alloyed nanocrystalline materials have a hardness that is 4–5 timeshigher than that of the conventional coarse-grained counterparts. This has beenshown to be true in a number of cases [91,92]. The increase in hardness ofmechanically alloyed/milled materials is due to a combination of several parameters.First and foremost is the effect of grain size, explained on the basis of the Hall-Petchrelationship:
jðor HÞ ¼ joðor HoÞ þ kd �1=2 ð13:12Þwhere j is flow stress, H is hardness, d is grain size, and jo, Ho, and k are constants.This relationship has been used to explain the grain size dependence of strength andhardness of conventional coarse-grained polycrystalline materials. The strength (orhardness) increases with a decrease in grain size. The same equation, but withdifferent constants, could be used to explain the grain size dependence on thestrength of nanocrystalline materials also. Figure 13.7 shows the variation ofhardness vs. d�1/2, where d is the average grain size for mechanically alloyed/milledFe [93], Nb3Sn [93], Ti-24Al-11Nb (at%) [94], g-TiAl [94], and Ni3Al alloyscontaining oxide dispersoids [95]. It may be noted that the traditional Hall-Petchrelationship is obeyed in these cases also.
The second factor contributing to the increased strength of milled powders isthe lattice strain present in them. It was noted that the lattice strain increases withmilling time, reaches a peak value, and may show a decrease in the last stages ofmilling (Fig. 13.8). Since the main contribution to lattice strain comes from thedislocations introduced during milling, the strain increases with milling time due tothe increased dislocation density. However, beyond a particular milling time,nanometer-sized grains are produced, further grain refinement ceases due to the
MD: SURYANARAYANA, JOB: 03320, PAGE: 349
4103-X_Suryanarayana_Ch13_R2_071504
Nanostructured Materials 349

MD: SURYANARAYANA, JOB: 03320, PAGE: 350
4103-X_Suryanarayana_Ch13_R2_071504
Figure 13.8 Average lattice strain in mechanically milled AlRu as a function of milling time.
(After Ref. 17.)
Figure 13.7 Variation of hardness vs. d�1/2 for Fe, Nb3Sn, Ti-24Al-11Nb, g-TiAl, andNi3Al alloys. d is the average grain diameter. Note that the hardness increases with a decrease
in grain size.
Chapter 13350

inability of dislocation generation in these small grains; therefore, the strain remainsconstant. Since deformation in extremely small grains occurs not by formation andglide of dislocations but by grain boundary sliding accompanied by a reduction inoverall dislocation density by annihilation at grain boundaries, the strain coulddecrease. It was shown that the hardness of nanocrystalline materials produced byMA/MM scales with the atomic level strain in the powder. It is also useful toremember that for a given grain size (not the smallest achieved), dislocation activitycould still occur to a different extent depending on the milling conditions, andtherefore the strain could be different. Thus, both grain size and lattice strain shouldbe considered in explaining the hardening behavior of mechanically alloyed powders.In addition to the above two main factors, solid solution hardening and dispersionhardening also account for the increased hardness (and strength) of materials.
Even though nanocrystalline materials have been shown to follow the Hall-Petch behavior, they do so only up to a critical grain size. Below this critical size,there is an inverse relationship, i.e., hardness and strength decrease with a decrease ingrain size. This critical grain size is dependent on the material properties but is about10–20 nm in most cases. This suggests that the deformation mechanisms fornanocrystalline materials may be different from those of conventional polycrystallinematerials. It has been shown in some cases that when the hardness of a material isplotted against the reciprocal of the square root of the grain size, a straight line isobtained over a wide a range of grain sizes. These grain sizes have been obtained bydifferent methods, including conventional ingot solidification, rapid solidification,thermomechanical processing, and MA. Figure 13.9 shows the variation of hardnessof g-TiAl-type alloys over a very wide range of grain sizes obtained by differentprocessing techniques, including MA. The inverse Hall-Petch behavior can be clearlynoted in the figure [92]. Similar results have been reported in other cases also.
MD: SURYANARAYANA, JOB: 03320, PAGE: 351
4103-X_Suryanarayana_Ch13_R2_071504
Figure 13.9 Variation of hardness vs. reciprocal of the square root of grain size for g-TiAl
alloys processed by different methods including ingot solidification, thermomechanicalprocessing, rapid solidification, and MA. Note that the hardness increases with a decreasein grain size up to about 30 nm, following the normal Hall-Petch behavior. Below this value
the hardness decreases with a decrease in grain size (inverse Hall-Petch behavior).
Nanostructured Materials 351

MD: SURYANARAYANA, JOB: 03320, PAGE: 352
4103-X_Suryanarayana_Ch13_R2_071504
13.7.2 Ductility
The major driver for research in nanostructured materials has been the promisedimprovement in ductility of the inherently brittle intermetallics and ceramic com-pounds. It is well established that a decrease in grain size lowers the ductile-brittletransition temperature (DBTT) and therefore, nanocrystalline materials should alsoexhibit a lower DBTT than their coarse-grained counterparts. Further, the strain(creep) rate during Coble creep is given by:
dq
dt¼ BjVDDb
d 3kTð13:13Þ
where dq/dt is the creep rate, j the applied stress, V the atomic volume, D the grainboundary width, Db the grain boundary diffusivity, d the grain size, k the Boltzmannconstant, T the temperature, and B a constant. Accordingly, if the grain size isdecreased from 10 Am to 10 nm (by three orders of magnitude), the creep rate shouldincrease by nine orders of magnitude. In addition, the grain boundary diffusivity ishigher in nanocrystalline materials. The combination of these effects is expected tosignificantly increase the creep rate of nanocrystalline materials allowing theceramics and intermetallics to be deformed plastically even at room temperature.The observation of plastic behavior in compression of the inherently brittle ceramicsat low temperatures—CaF2 at 80jC and TiO2 at 180jC—gave the much needed fillipto activities in this area [96].
The results of ductility measurements on nanocrystalline materials are mixedand are sensitive to flaws and porosity, surface finish, and method of testing (e.g.,tension vs. compression). Available results show that the elongation to failure islower with a decrease in grain size. Furthermore, conventional materials that exhibithigh ductility show reduced ductility in the nanocrystalline state. Improvements inductility have been observed in the nanocrystalline state only when the coarse-grained counterparts show very limited ductility. This has been attributed to thedifferent degrees of dislocation activity in the conventional materials; a significantamount of dislocation activity occurs in ductile materials, whereas it is limited in theceramic materials. In addition, dislocation generation and movement are difficult innanocrystalline materials.
However, recent results indicate that it has been possible to observe increasedductility in nanocrystalline high-strength materials (though not yet in mechanicallymilled materials). Lu et al. [97] recently prepared fully dense nanocrystalline Cu witha grain size of 27 nm by electrodeposition. They reported that this material had atensile ductility of 30% even though the tensile strength was as high as 202 MPa.Coarse-grained Cu exhibits this large elongation only when the tensile strength isabout 120 MPa. Large extensions of more than 5000% without any cracking werealso reported when the copper specimen with a grain size of 20 nm was rolled atroom temperature [98]. Large amount of ductilities are also achieved in a purecopper sample that has been subjected to 95% cold work and subsequently annealedat 200jC for 3 min to produce a bimodal microstructure. The microstructureconsisted of micrometer-sized grains embedded inside a matrix of nanocrystallineand ultrafine (<300 nm) grains. The matrix grains impart high strength as expectedfrom the Hall-Petch equation. The inhomogeneous microstructure induces strainhardening mechanisms that stabilize the tensile deformation, leading to a high tensile
Chapter 13352

MD: SURYANARAYANA, JOB: 03320, PAGE: 353
4103-X_Suryanarayana_Ch13_R2_071504
ductility. Thus, the yield strength in this condition is about 350 MPa and theelongation to failure is about 65% [99]. The elongation to failure compares favorablywith that of annealed copper, but the yield strength is about 6–7 times higher thanthat of the annealed copper sample.
The promised room temperature superplasticity has not been observed in anynanocrystalline material so far. But the temperature at which superplasticity wasobserved is more than 400jC lower than that required for coarse-grained materials.For example, superplasticity has been reported in nanocrystalline Ni (20 nm) [100],Ni3Al (50 nm) [100], and Ti3Al (100 nm) at 350, 650, and 600jC, respectively,whereas the temperatures required for observance of superplasticity in the coarse-grained materials were 820, 1100, and 1100jC, respectively. The mechanical behav-ior of nanocrystalline materials is far from understood and lot more work needs tobe done to elucidate this important aspect of nanocrystalline materials. A criticalsummary of the present status on this important aspect of ductility of nanostruc-tured materials has been recently presented [101].
13.7.3 Enhanced Sinterability
Nanocrystalline materials have been shown to exhibit enhanced sintering behavior.This is reflected in the lowered sintering temperatures and increased sinteringkinetics. Since nanocrystalline materials contain a very large fraction of atoms atthe grain boundaries, the numerous interfaces provide a high density of short-circuitdiffusion paths. Thus, the measured diffusivities in nanocrystalline materials areseveral orders of magnitude higher than lattice diffusion and even grain boundarydiffusion. The most important consequence of increased diffusivity is that sinteringof nanocrystalline powders can occur at temperatures much lower than thoserequired for sintering coarse-grained polycrystalline powders. For example, TiO2
with a grain size of 12 nm could be sintered at ambient pressures and at temperatures400–600jC lower than those required for 1.3 Am powder, and without the need forany compacting or sintering aids [102]. Similarly, nanocrystalline titanium alumi-nides could be fully consolidated at temperatures about 400jC lower than thoserequired for coarse-grained materials [94,103].
Another consequence of the fine grain size of nanocrystalline materials hasbeen the increased solid solubility levels achieved in different alloy systems. Forexample, it was possible to have a solid solubility of 17 at% Hg in the immiscible Cu-Hg system [104]. Similarly, the solid solubility of Mg in Ti could be increased to highlevels in the nanostructured condition, even though under equilibrium conditions thesolid solubility is zero. Furthermore, no solid solubility increase was reported forcoarse-grained milled powders [105]. Details of the mechanisms for increased solidsolubility limits in nanocrystalline materials are discussed in Chapter 9.
13.7.4 Thermal Stability
Grain growth occurs in polycrystalline materials to reduce the interfacial energy andhence the total energy of the system. Since nanocrystalline materials have a highlydisordered large interfacial component (and therefore are in a high-energy state), thedriving force for grain growth is expected to be high. This driving force is
Nanostructured Materials 353

proportional to the specific grain boundary area and therefore varies as the inverseof the grain size.
Knowledge of the thermal stability of nanocrystalline materials is importantfor both technological and scientific reasons. From a technological point of view,thermal stability is important for consolidation of nanocrystalline powders withoutcoarsening the microstructure. From a scientific point of view, it would be instructiveto check whether the grain growth behavior in nanocrystalline materials is similar tothat in coarse-grained materials.
Contrary to expectations, experimental observations suggest that grain growthin nanocrystalline materials, prepared by any method, is very small (and almostnegligible) up to a reasonably high temperature. It has been suggested that theresistance to grain growth observed in nanocrystalline materials results primarilyfrom frustration, i.e., there is not sufficient driving force for grain growth [106]. Thishas been explained on the basis of structural factors such as narrow grain sizedistribution, equiaxed grain morphology, low-energy grain boundary structures,relatively flat grain boundary configurations, and porosity present in the samples. Insome cases, however, abnormal grain growth has been reported [107]. Recently,Shaw et al. [108] investigated the thermal stability of nanostructured Al-Fe-Cr-Tialloys prepared by MA and reported that the onset temperature grain growthcoincided with the onset temperature for Al6Fe precipitation. They also observedthat inhibition to grain growth below 330jC was due to solute drag, while it wassecond-phase (Zener) drag above 450jC. Between 330jC and 450jC, it could beeither solute drag, second phase drag, or both.
REFERENCES
1. Gleiter, H. (1989). Prog. Mater. Sci. 33:223–315.2. Siegel, R. W. (1991). In: Cahn, R. W., ed. Materials Science and Technology: A
Comprehensive Treatment, Vol. 15. Processing of Metals and Alloys. Weinheim: VCH,
pp. 583–614.3. Suryanarayana, C. (1995). Int. Mater. Rev. 40:41–64.4. Suryanarayana, C., Koch, C. C. (1999). In: Suryanarayana, C., ed. Non-equilibrium
Processing of Materials. Oxford: Pergamon, pp. 313–346.
5. Gleiter, H. (2000). Acta Mater. 48:1–29.6. Suryanarayana, C., Koch, C. C. (2000). Hyperfine Interactions 130:5–44.7. Koch, C. C. (2002). Nanostructured Materials: Processing, Properties, and Applications.
Westwood, NJ: Noyes Publications and William Andrews Press.8. Suryanarayana, C., Froes, F. H. (1992). Metall. Trans. 23A:1071–1081.9. Gleiter, H. (1995). Nanostructured Mater. 6:3–14.
10. Suryanarayana, C., Mukhopadhyay, D., Patankar, S. N., Froes, F. H. (1992). J. Mater.Res. 7:2114–2119.
11. Nalwa, H. S. (2000).Handbook of Nanostructured Materials and Nanotechnology. Vol. 1.
Synthesis and Processing. San Diego: Academic Press.12. Lu, K. (1996). Mater. Sci. Eng. Rep. R16:161–221.13. Thomson, J. R., Politis, C. (1987). Europhys. Lett. 3:199–205.14. Shingu, P. H., Huang, B., Nishitani, S. R., Nasu, S. (1988). Suppl. Trans. Jpn. Inst.
Metals 29:3–10.15. Koch, C. C. (1993). Nanostructured Mater. 2:109–129.16. Koch, C. C. (1997). Nanostructured Mater. 9:13–22.
MD: SURYANARAYANA, JOB: 03320, PAGE: 354
4103-X_Suryanarayana_Ch13_R2_071504
Chapter 13354
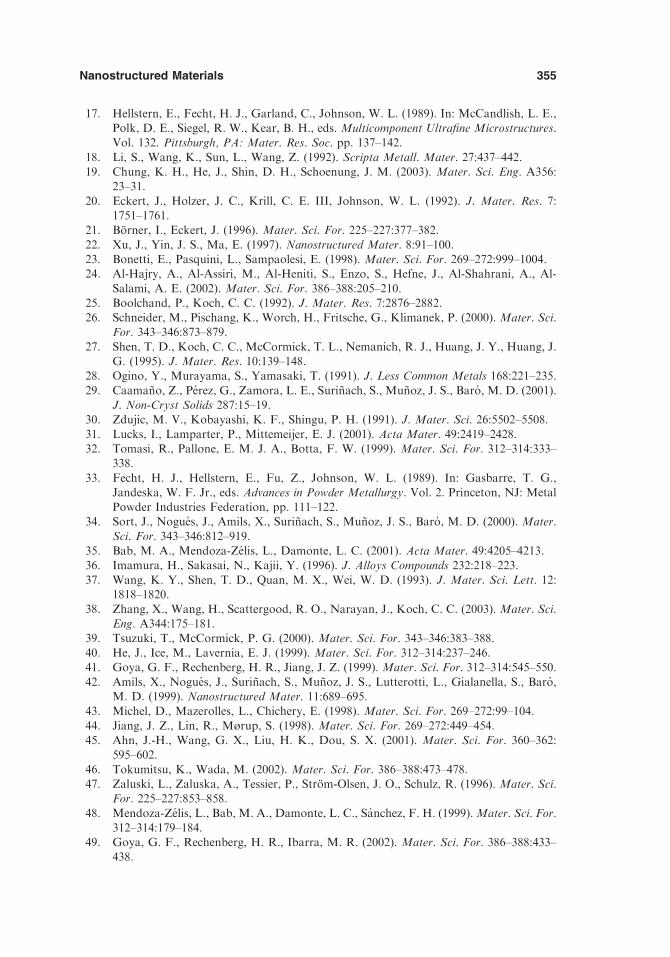
17. Hellstern, E., Fecht, H. J., Garland, C., Johnson, W. L. (1989). In: McCandlish, L. E.,Polk, D. E., Siegel, R. W., Kear, B. H., eds.Multicomponent Ultrafine Microstructures.Vol. 132. Pittsburgh, PA: Mater. Res. Soc. pp. 137–142.
18. Li, S., Wang, K., Sun, L., Wang, Z. (1992). Scripta Metall. Mater. 27:437–442.19. Chung, K. H., He, J., Shin, D. H., Schoenung, J. M. (2003). Mater. Sci. Eng. A356:
23–31.
20. Eckert, J., Holzer, J. C., Krill, C. E. III, Johnson, W. L. (1992). J. Mater. Res. 7:1751–1761.
21. Borner, I., Eckert, J. (1996). Mater. Sci. For. 225–227:377–382.
22. Xu, J., Yin, J. S., Ma, E. (1997). Nanostructured Mater. 8:91–100.23. Bonetti, E., Pasquini, L., Sampaolesi, E. (1998). Mater. Sci. For. 269–272:999–1004.24. Al-Hajry, A., Al-Assiri, M., Al-Heniti, S., Enzo, S., Hefne, J., Al-Shahrani, A., Al-
Salami, A. E. (2002). Mater. Sci. For. 386–388:205–210.25. Boolchand, P., Koch, C. C. (1992). J. Mater. Res. 7:2876–2882.26. Schneider, M., Pischang, K., Worch, H., Fritsche, G., Klimanek, P. (2000).Mater. Sci.
For. 343–346:873–879.
27. Shen, T. D., Koch, C. C., McCormick, T. L., Nemanich, R. J., Huang, J. Y., Huang, J.G. (1995). J. Mater. Res. 10:139–148.
28. Ogino, Y., Murayama, S., Yamasaki, T. (1991). J. Less Common Metals 168:221–235.
29. Caamano, Z., Perez, G., Zamora, L. E., Surinach, S., Munoz, J. S., Baro, M. D. (2001).J. Non-Cryst Solids 287:15–19.
30. Zdujic, M. V., Kobayashi, K. F., Shingu, P. H. (1991). J. Mater. Sci. 26:5502–5508.
31. Lucks, I., Lamparter, P., Mittemeijer, E. J. (2001). Acta Mater. 49:2419–2428.32. Tomasi, R., Pallone, E. M. J. A., Botta, F. W. (1999). Mater. Sci. For. 312–314:333–
338.
33. Fecht, H. J., Hellstern, E., Fu, Z., Johnson, W. L. (1989). In: Gasbarre, T. G.,Jandeska, W. F. Jr., eds. Advances in Powder Metallurgy. Vol. 2. Princeton, NJ: MetalPowder Industries Federation, pp. 111–122.
34. Sort, J., Nogues, J., Amils, X., Surinach, S., Munoz, J. S., Baro, M. D. (2000). Mater.
Sci. For. 343–346:812–919.35. Bab, M. A., Mendoza-Zelis, L., Damonte, L. C. (2001). Acta Mater. 49:4205–4213.36. Imamura, H., Sakasai, N., Kajii, Y. (1996). J. Alloys Compounds 232:218–223.
37. Wang, K. Y., Shen, T. D., Quan, M. X., Wei, W. D. (1993). J. Mater. Sci. Lett. 12:1818–1820.
38. Zhang, X., Wang, H., Scattergood, R. O., Narayan, J., Koch, C. C. (2003).Mater. Sci.
Eng. A344:175–181.39. Tsuzuki, T., McCormick, P. G. (2000). Mater. Sci. For. 343–346:383–388.40. He, J., Ice, M., Lavernia, E. J. (1999). Mater. Sci. For. 312–314:237–246.41. Goya, G. F., Rechenberg, H. R., Jiang, J. Z. (1999).Mater. Sci. For. 312–314:545–550.
42. Amils, X., Nogues, J., Surinach, S., Munoz, J. S., Lutterotti, L., Gialanella, S., Baro,M. D. (1999). Nanostructured Mater. 11:689–695.
43. Michel, D., Mazerolles, L., Chichery, E. (1998). Mater. Sci. For. 269–272:99–104.
44. Jiang, J. Z., Lin, R., Mørup, S. (1998). Mater. Sci. For. 269–272:449–454.45. Ahn, J.-H., Wang, G. X., Liu, H. K., Dou, S. X. (2001). Mater. Sci. For. 360–362:
595–602.
46. Tokumitsu, K., Wada, M. (2002). Mater. Sci. For. 386–388:473–478.47. Zaluski, L., Zaluska, A., Tessier, P., Strom-Olsen, J. O., Schulz, R. (1996). Mater. Sci.
For. 225–227:853–858.
48. Mendoza-Zelis, L., Bab, M. A., Damonte, L. C., Sanchez, F. H. (1999).Mater. Sci. For.312–314:179–184.
49. Goya, G. F., Rechenberg, H. R., Ibarra, M. R. (2002). Mater. Sci. For. 386–388:433–438.
MD: SURYANARAYANA, JOB: 03320, PAGE: 355
4103-X_Suryanarayana_Ch13_R2_071504
Nanostructured Materials 355

50. Indris, S., Heitjans, P. (2000). Mater. Sci. For. 343–346:417–422.51. Singh, Arvind Kumar, Singh, Ajay Kumar, Srivastava, O. N. (1995). J. Alloys
Compounds 227:63–68.
52. Urretavizcaya, G., Meyer, G. O. (2002). J. Alloys Compounds 339:211–215.53. Arcos, D., Rangavittal, N., Vazquez, M., Vallet-Regı, M. (1998).Mater. Sci. For. 269–
272:87–92.
54. Ahn, J. H., Kim, Y. (1999). Mater. Sci. For. 312–314:147–152.55. Krivoroutchko, K., Kulik, T., Fadeeeva, V. I., Portnoy, V. K. (2002). J. Alloys
Compounds 333:225–230.
56. Oleszak, D., Matyja, H. (2000). Mater. Sci. For. 343–346:320–325.57. Jiang, J. Z., Gerward, L., Mørup, S. (1999). Mater. Sci. For. 312–314:115–120.58. Jang, J. S. C., Tsau, C. H., Chen, W. D., Lee, P. Y. (1998). J. Mater. Sci. 33:265–270.
59. Ahn, J.-H., Wang, G. X., Liu, H. K., Dou, S. X. (2001). Mater. Sci. For. 360–362:595–602.
60. Katona, G. L., Kis-Varga, M., Beke, D. L. (2002). Mater. Sci. For. 386–388:193–197.61. Liu, K. W., Muklich, F., Birringer, R. (2001). Intermetallics 9:81–88.
62. Liu, K. W., Muklich, F., Pitschke, W., Birringer, R., Wetzig, K. (2001). Z. Metallkde.92:924–930.
63. Kis-Varga, M., Beke, D. L., Mezzaros, S., Vad, K., Kerekes, Gy, Daroczi, L. (1998).
Mater. Sci. For. 269–272:961–966.64. Sort, J., Nogues, J., Surinach, S., Munoz, J. S., Chappel, E., Dupont, F., Chouteau, G.,
Baro, M. D. (2002). Mater. Sci. For. 386–388:465–472.
65. Balaz, P., Takacs, L., Ohtani, T., Mack, D. E., Boldizarova, E., Soika, V.,Achimovicova, M. (2002). J. Alloys Compounds 337:76–82.
66. Baviera, P.,Harel, S.,Garem,H.,Grosbras,M. (2000).Mater. Sci. For. 343–346:629–634.
67. Bhosle, V., Baburaj, E. G., Miranova, M., Salama, K. (2003). Mater. Sci. Eng.A356:190–199.
68. Mohamed, F. A., Xun, Y. (2003). Mater. Sci. Eng. A358:178–185.69. Mohamed, F. A. (2003). Acta Mater. 51:4107–4119.
70. Galdeano, S., Chaffron, L., Mathon, M.-H., Vincent, E., De Novion, C.-H. (2001).Mater. Sci. For. 360–362:367–372.
71. Yamada, K., Koch, C. C. (1993). J. Mater. Res. 8:1317–1326.
72. Kuhrt, C., Schropf, H., Schultz, L., Arzt, E. (1993). In: deBarbadillo, J. J., et al., eds.Mechanical Alloying for Structural Applications. Materials Park, OH: ASM Interna-tional, pp. 269–273.
73. Streleski, A. N., Leonov, A. V., Beresteskaya, I. V., Mudretsova, S. N., Majorova, A.F., Butyagin, P. Ju. (2002). Mater. Sci. For. 386–388:187–192.
74. Shen, T. D., Koch, C. C. (1995). Mater. Sci. For. 179–181:17–24.75. Bonetti, E., Campari, E. G., Pasquini, L., Sampaolesi, E., Valdre, G. (1998).Mater. Sci.
For. 269–272:1005–1010.76. Hong, L. B., Bansal, C., Fultz, B. (1994). Nanostructured Mater. 4:949–956.77. Eckert, J., Holzer, J. C., Krill, C. E. III, Johnson, W. L. (1992). J. Mater. Res. 7:
1980–1983.78. Eckert, J., Holzer, J. C., Johnson, W. L. (1992). Scripta Metall. Mater. 27:1105–1110.79. Noebe, R. D., Bowman, R. R., Nathal, M. V. (1993). Int. Mater. Rev. 38:193–232.
80. Kao, C. R., Chang, Y. A. (1993). Intermetallics 1:237–250.81. Nieh, T. G., Wadsworth, J. (1991). Scripta Metall. Mater. 25:955–958.82. Sun, N. X., Lu, K. (1999). Phys. Rev. B59:5987–5989.
83. Niihara, K. (1991). J. Ceram. Soc. Jpn. 99:974–982.84. Bhaduri, S., Bhaduri, S. B. (1998). JOM 50(1):44–51.85. Suryanarayana, C., Froes, F. H. (1993). Nanostructured Mater. 3:147–153.86. Naser, J., Reinhemann, W., Ferkel, H. (1997). Mater. Sci. Eng. A234:467–469.
MD: SURYANARAYANA, JOB: 03320, PAGE: 356
4103-X_Suryanarayana_Ch13_R2_071504
Chapter 13356

87. Scahffer, G. B. (1992). Scripta Metall. Mater. 27:1–5.88. Bohn, R., Klassen, T., Bormann, R. (2001). Intermetallics 9:559–569.89. Bohn, R., Klassen, T., Bormann, R. (2001). Acta Mater. 49:299–311.
90. Klassen, T., Bohn, R., Fanta, G., Oelerich, W., Eigen, N., Gartner, F., Aust, E.,Bormann, R., Kreye, H. (2003). Z. Metallkde. 94:610–614.
91. Morris, D. G. (1998). Mechanical Behavior of Nanostructured Materials. Zurich:
TransTech.92. Suryanarayana, C. (2002). Int. J. Non-Eqm. Process. 11:325–345.93. Cho, Y. S., Koch, C. C. (1991). Mater. Sci. Eng. A141:139–148.
94. Suryanarayana, C., Korth, G. E., Froes, F. H. (1997). Metall. Mater. Trans. 28A:293–302.
95. Jang, J. S. C., Koch, C. C. (1988). Scripta Metall. 22:677–682.
96. Karch, J., Birringer, R., Gleiter, H. (1987). Nature 330:556–558.97. Lu, L., Wang, L. B., Ding, B. Z., Lu, K. (2000). J. Mater. Res. 15:270–273.98. Lu, L., Sui, M. L., Lu, K. (2000). Science 287:1463–1466.99. Wang, Y., Chen, M., Zhou, F., Ma, E. (2002). Nature 419:912–915.
100. McFadden, S. X., Mishra, R. S., Valiev, R. Z., Zhilyaev, A. P., Mukherjee, A. K.(1999). Nature 398:684–686.
101. Koch, C. C., Morris, D. G., Lu, K., Inoue, A. (1999). MRS Bull. 24(2):54–58.
102. Siegel, R. W., Ramasamy, S., Hahn, H., Li, Z., Lu, T., Gronsky, R. (1988). J. Mater.Res. 3:1367–1372.
103. Suryanarayana, C., Korth, G. E. (1999). Metals Mater. (Korea) 5:121–128.
104. Ivanov, E. (1992). Mater. Sci. For. 88–90:475–480.105. Suryanarayana, C., Froes, F. H. (1990). J. Mater. Res. 5:1880–1886.106. Siegel, R. W. (1992). In: Wolf, D., Yip, S., eds. Materials Interfaces: Atomic Level
Structure and Properties. London: Chapman & Hall, pp. 431–460.107. Gertsman, V. Y., Birringer, R. (1994). Scripta Metall. Mater. 30:577–581.108. Shaw, L., Luo, H., Villegas, J., Miracle, D. (2003). Acta Mater. 51:2647–2663.
MD: SURYANARAYANA, JOB: 03320, PAGE: 357
4103-X_Suryanarayana_Ch13_R2_071504
Nanostructured Materials 357

4103-X_Suryanarayana_Ch13_R2_071504
MD: SURYANARAYANA, JOB: 03320, PAGE: 358

14
Mechanochemical Processing
14.1 INTRODUCTION
Mechanochemical processing (MCP) is the term applied to the powder process inwhich chemical reactions and phase transformations take place due to application ofmechanical energy. The technique ofMCP had a long history with the first publicationdating back to 1892 [1]. It was shown that the order of decomposition and sublimationof mercury and silver halides was different upon heating and trituration in a mortar.This study clearly established that chemical changes could be brought about not onlyby heating but also by mechanical action. However, the use of mechanically activatedprocesses dates back to the early history of mankind, when fires were initiated byrubbing of flints one against the other. Ostwald coined the term ‘‘mechanochemical’’in 1911 [2]. A simple way of differentiating between mechanically activated processesand MCP methods is that no chemical reactions or phase transformations take placeduring mechanical activation, whereas these do occur in MCP. However, someinvestigators [3] use the term MCP to include mechanical alloying (MA), mechanicalmilling (MM), and reaction milling (RM), the last one involving chemical reactionsinduced by mechanical activation. In this chapter we will use the termMCP to denotethe process of mechanical activation to achieve chemical reactions. While the scientificbasis underlying MCP was investigated from the very beginning, applications for themechanochemical products were slow to come about mostly because of the limitationson the productivity of MCP reactors, the purity of the products, and the economics ofthe process. The general phenomenon of MCP has been a popular research topic inGermany [4,5], former USSR and Eastern Europe [6]. These researchers concentratedtheir efforts on both the fundamental principles ofMCP and the potential applicationsfor materials produced by MCP [7–13].
4103-X_Suryanarayana_Ch14_R2_071504
MD: SURYANARAYANA, JOB: 03320, PAGE: 359
359

MCP involves conversion of mechanical energy into chemical energy to bringabout chemical reactions. This has also been referred to in the literature as mechano-synthesis or mechanochemical synthesis. The effects of MCP include synthesis ofnovel materials, reduction/oxidation reactions, exchange reactions, decomposition ofcompounds, and phase transformations in both inorganic and organic solids [13]. Thecategory of exchange reactions in MCP has received a lot of attention in recent years[3,14]. This emanated from the reports in 1989 thatMA could be used to induce a widevariety of solid-solid and even liquid-solid chemical reactions [15,16]. For example, itwas shown that CuO could be reduced to pure metal Cu by ball milling CuO at roomtemperature with a more reactive metal like Ca. Milling together of CuO and ZnOwith Ca has resulted in the direct formation of hV-brass [16]. McCormick [3,14]presented an overview of the work from his group a few years ago. Gaffet et al. [17]presented a brief survey of the developments in the field of mechanical activation andmechanosynthesis. In fact, most of the work in this subarea of MA has been carriedout by McCormick [3,14], Takacs [18], Matteazzi [19], and Welham. Takacs [18]presented an exhaustive review of the self-sustaining reactions induced by ball millingvery recently. A few books are also available on the principles of MCP and theapplications of their products [5,7,13,20,21].
Mechanochemical synthesis has generally been performed in high-energy millssuch as SPEX mills, and rarely in low-energy mills, unless the heat of reaction is veryhigh. Accordingly, while almost all the investigations of displacement reactions havebeen carried out in a SPEX mill, Xi et al. [22] studied the highly exothermic reactionbetween CuO and Al in a low-energy stirred ball mill. Similarly, several mixtures ofCr2O3, Fe2O3, and NiO were reduced with Al in a Fritsch P5 planetary ball mill [23].
14.2 THERMODYNAMIC ASPECTS
Most of the mechanosynthesis reactions studied in recent years have been displace-ment reactions of the type:
MOþR ! MþRO ð14:1Þ
where a metal oxide (MO) is reduced by a more reactive metal (reductant, R) to thepure metal M. In addition to the oxides, metal chlorides and sulfides have also beenreduced to pure metals this way, and the results available to date are summarized inTable 14.1.
All solid-state reactions involve the formation of a product phase at the interfaceof the component phases. Thus, in the above example, the metal M forms at theinterface between the oxide MO and the reductant R and physically separates thereactants (Fig. 14.1). Further growth of the product phase involves diffusion of atomsof the reactant phases through the product phase, which constitutes a barrier layerpreventing further reaction from occurring. In other words, the reaction interface,defined as the nominal boundary surface between the reactants, continuouslydecreases during the course of the reaction. Consequently, kinetics of the reactionare slow. Since the reaction rates are determined by the diffusion rates of the reactantsthrough the product phase, which acts as a barrier, elevated temperatures are requiredto achieve reasonable reaction rates.
The reactions listed in Table 14.1 are characterized by a large negative freeenergy change and are therefore thermodynamically feasible at room temperature.
MD: SURYANARAYANA, JOB: 03320, PAGE: 360
4103-X_Suryanarayana_Ch14_R2_071504
Chapter 14360

The occurrence of these reactions at ambient temperatures is thus limited by kineticconsiderations alone.
Mechanical alloying can provide the means to substantially increase the reactionkinetics of the reduction reactions. This is because the repeated cold welding andfracturing of powder particles increases the area of contact between the reactantpowder particles by repeatedly bringing fresh surfaces into contact due to a reductionin particle size duringmilling. This allows the reaction to proceed without the necessityfor diffusion through the product layer. As a consequence, reactions that normallyrequire high temperatures occur at lower temperatures during MA or even withoutany externally applied heat. In addition, the high defect densities induced by MAaccelerate diffusion processes. Alternatively, the particle refinement and consequentreduction in diffusion distances (due to microstructural refinement) can at least reducethe reaction temperatures significantly, even if they do not occur at room temperature.
Depending on the milling conditions, two entirely different reaction kinetics arepossible [40,58,114]:
1. The reaction may extend to a very small volume during each collision,resulting in a gradual transformation, or
2. If the reaction enthalpy is sufficiently high, a self-propagating high-temper-ature synthesis (SHS) (also known as combustion reaction) can be initiated.
The latter type of reaction requires a critical milling time for combustion to beinitiated. If the temperature of the vial is recorded during the milling process, thetemperature initially increases slowly with time. After some time, the temperatureincreases abruptly, suggesting that ignition has occurred, and this is followed by arelatively slow decrease. This time at which the sudden increase in temperatureoccurs is referred to as the ignition time, tig, and these values are listed in Table 14.1.Figure 14.2a shows the variation of temperature with time during the millingoperation. Note that the temperature may remain constant or increase graduallywith milling time, and when the combustion reaction occurs there is a suddenincrease in temperature. After the combustion event, the temperature drops gradu-ally to the ambient. It may be noted that this temperature–time plot is very similar tothe one observed during the SHS reaction (Fig. 14.2b) [115].
The time at which the sudden increase in temperature (see Fig. 14.2) takes placein the powder is referred to as the ignition time.Measurements of ignition time providea useful means of characterizing the structural and chemical evolution during MA[116]. It has been noted that there is only particle refinement during milling until theignition starts. The reduction reaction occurs only after the combustion reaction.Accordingly, it was observed that no reaction occurs between PbO2 and TiO until 28min and 21 s at which time combustion takes place. The reaction resulting in theformation of PbTiO3 is complete at 28 min and 23 s [117]. Similarly, it was reportedthat no reaction occurred between Mo and Si on mechanically alloying the powdermix for 3 h and 12 min; a reaction resulting in the formation of MoSi2 took place at 3h and 13 min [118]. Similar observations have been made in several other systems also[36,51,81,100].
Intimate contact between the reactant powder particles is an essential require-ment for combustion to occur. This condition is easily met during milling of ductile-brittle systems. In these mixtures the microstructure consists of brittle oxide particlesdispersed in the ductile matrix; therefore, intimate contact exists between the two types
MD: SURYANARAYANA, JOB: 03320, PAGE: 361
4103-X_Suryanarayana_Ch14_R2_071504
Mechanochemical Processing 361

MD: SURYANARAYANA, JOB: 03320, PAGE: 362
4103-X_Suryanarayana_Ch14_R2_071504
Table
14.1
Chem
icalReactionsInvestigatedbyMechanicalAlloyingTechniques
Reaction
Mill
BPR
%Excess
reductant
DH(kJ)
Tad(K
)t ig(m
in)
Ref.
3Ag2O
+2Al!
6Ag+
Al 2O
3—
——
�532
4914
86
24
Ag3Sn+
2Ag2O
!7Ag+
SnO
2(96h)
Uni-Ballmill
25
2AlCl 3+
3CaO
!g-A
l 2O
3a+
3CaCl 2
SPEX
8000
——
——
—26
2BN
+3Al!
2AlN
+AlB
2(20h)
Planetary
ballmill
4:1
27
BaO
+ZrSiO
4!
BaSiO
3+
ZrO
2Uni-Ballmill
50:1
28
CaCl 2+
Na2CO
3+
3.5NaCl!
CaCO
3
+5.5NaCl
SPEX
8000
10:1
�100
29
CaO
+ZrSiO
4!
CaSiO
3+
ZrO
2Uni-Ballmill
50:1
28
CaWO
4+
4C
!CaO
+WC
+3CO
(40h)
50:1
30
CaWO
4+
C+
3Mg!
CaO
+WC
+3MgO
Ballmill
43:1
50
31
CaWO
4+
3Mg!
CaO
+W
+3MgO
Ballmill
42:1
32
CaWO
4+
1 ⁄ 2N
2+
3Mg!
CaO
+WN
+3MgO
Ballmill
43:1
50
31
CdCl 2+
Na2S+
16NaCl!
CdS+
18NaCl
SPEX
8000
33
CdCl 2+
Na2S!
CdS+
2NaCl
SPEX
8000
10:1
34
CdO
+Ca!
Cd+
CaO
SPEX
8000
3:1
10
�377
3561
37
16
4CeC
l 3+
6CaO
+O
2!
4CeO
2b+
6CaCl 2
SPEX
8000
�276
1427
35
2CeC
l 3+
3CaS!
Ce 2S3+
3CaCl 2
SPEX
8000
33
CeC
l 3+
3NaOH
!Ce(OH) 3
+3NaCl
�345
36
CoCl 2+
2Na!
Co+
2NaCl
SPEX
8000
3:1
25
�495
20
37
3CoS+
2Al!
3Co+
Al 2S3
SPEX
8000
11:1
�405
1710
—19
Cr 2O
3+
2Al!
2Cr+
Al 2O
3SPEX
8000
33:1
10
�273
——
38
Cr 2O
3+
3Zn!
2Cr+
3ZnO
SPEX
8000
33:1
10
+49
——
38
CuCl 2+
2Na!
Cu+
2NaCl
SPEX
8000
39
3CuO
+2Al!
3Cu+
Al 2O
3SPEX
8000
33:1
10
�1197
5151
15
40
5394
37
16,41
2CuO
+C
!2Cu+
CO
2(24h)
SPEX
8000
12:1
40
�135
——
42
CuO
+Ca!
Cu+
CaO
(100min)
SPEX
8000
3:1
—�473
4716
6.5
15,16,43
19
40
Chapter 14362

MD: SURYANARAYANA, JOB: 03320, PAGE: 363
4103-X_Suryanarayana_Ch14_R2_071504
3CuO
+xCu+
2Al!
(3+x)C
u+
Al 2O
3SPEX
8000
4.4:1
44
4CuO
+3Fe!
4Cu+
Fe 3O
4(20h)
SPEX
8000
3:1
10
�488
1380
170
16,40
Planetary
mill
30:1
1668
153
45–47
4CuO
+3Fe!
4Cu+
Fe 3O
4SPEX
8000
48
5CuO
+Fe!
5Cu+
Fe 3O
4+
FeO
SPEX
8000
15:1
10
49
CuO
+2H
!Cu+
H2O
(3h)
Attritor
�87
50
CuO
+Mg!
Cu+
MgO
SPEX
8000
3:1
10
�440
4531
34
40
90
16
CuO
+Mg!
Cu+
MgO
Vibrationmill
51
CuO
+Mn!
Cu+
MnO
SPEX
8000
3:1
10
�231
2227
43
40
CuO
+Ni!
Cu+
NiO
SPEX
8000
3:1
10
�382
988
—16
�78
1288
40
2CuO
+Si!
2Cu+
SiO
2(24h)
Stirringballmill
30:1
to
80:1
10
�596
——
52
2CuO
+Ti!
2Cu+
TiO
2SPEX
8000
3:1
10
�633
4175
0.3
16
2.8
40,41
Cu2O
+Mg!
2Cu+
MgO
SPEX
8000
�434
20
53
Cu2O
+Zn!
2Cu+
ZnO
SPEX
8000
�183
44
53
CuO
+ZnO
+Ca!
hV-brass
+CaO
(24h)
SPEX
8000
3:1
10
—15
3Cu2S+
2Al!
6Cu+
Al 2S3
SPEX
8000
10:1
�485
1740
19
Cu2S+
Fe!
2Cu+
FeS
SPEX
8000
8:1
�71
590
19
Cu2S+
Fe!
2Cu+
FeS
Fritsch
P6
54
2ErC
l 3+
3Ca!
2Er+
3CaCl 2
�407
55
FeC
l 3+
3Na!
Fe+
3NaCl(3
h)
SPEX
8000
56
3Fe 3O
4+
8Al!
9Fe+
4Al 2O
3SPEX
8000
8:1
10
�1716
3805
57
12:1
�75to
+100
58
3Fe 3O
4+
8Al!
9Fe+
4Al 2O
3SPEX
8000
�1704
48
Fe 3O
4+
2Ti!
3Fe+
2TiO
2SPEX
8000
8:1
10
�395
2737
20
38
Fe 3O
4+
4Zn!
3Fe+
4ZnO
SPEX
8000
16:1
10
�143
——
38,59
Fe 3O
4+
4Zn!
3Fe+
4ZnO
SPEX
8000
�142
48
Fe 2O
3+
2Al!
2Fe+
Al 2O
3(0.5
h)
Fritsch
P7
60
Fe 2O
3+
3Ca!
2Fe+
3CaO
SPEX
8000
3:1
�1080
3498
24
16
Mechanochemical Processing 363

MD: SURYANARAYANA, JOB: 03320, PAGE: 364
4103-X_Suryanarayana_Ch14_R2_071504
Fe 2O
3+
3Mg!
2Fe+
3MgO
(0.5
h)
Fritsch
P7
60
2Fe 2O
3+
3Ti!
4Fe+
3TiO
2Ballmill
61
a-Fe 2O
3+
C!
2FeO
+CO
SPEX
8000
11:1
62
a-Fe 2O
3+
3H
2!
2Fe+
3H
2O
(8h)
Super
Misuni
NEV-M
A8
100:1
63
3FeS
+2Al!
3Fe(Al)+
Al 2S3
SPEX
8000
9:1
�271
1146
19
FeS
+Mn!
Fe+
MnS
SPEX
8000
10:1
�117
1300
19
2FeS
+Si!
2Fe(Si)+
SiS
2SPEX
8000
12:1
+88
—19
2FeS
2+
6CaO
!Ca2Fe 2O
5+
15 ⁄ 4CaS+
1 ⁄ 4CaSO
4
SPEX
8000
40:1
64
FeT
iO3+
7Al!
FeA
l 2+
TiA
l 3+
2Al 2O
3Ballmill
47:1
10
65
FeT
iO3+
2Al+
C!
Fe+
TiC
+Al 2O
3Uni-Ballmill
�605
66
2FeT
iO3+
4Al+
N2+
C!
2Fe
+2Ti(C,N)+
2Al 2O
3
Ballmill
67,68
FeT
iO3+
4C
!Fe+
TiC
+3CO
Ballmill
69,70
FeT
iO3+
C!
Fe+
TiO
2+
CO
Uni-Ballmill
71
FeT
iO3+
3C
+1 ⁄ 2N
2!
Fe+
TiN
+3CO
Ballmill
69
FeT
iO3+
BaO
+1 ⁄ 2O
2!
1 ⁄ 2Fe 2O
3+
BaTiO
3Uni-Ballmill
72
FeT
iO3+
CaO
+1 ⁄ 2O
2!
1 ⁄ 2Fe 2O
3+
CaTiO
3Uni-Ballmill
72
FeT
iO3+
3Mg!
Fe+
Ti+
3MgO
Uni-Ballmill
73
FeT
iO3+
3Mg+
C!
Fe+
TiC
+3MgO
Uni-Ballmill
43:1
74
2FeT
iO3+
6Mg+
N2!
2Fe+
2TiN
+6MgO
Uni-Ballmill
43:1
74
FeT
iO3+
MgO
+1 ⁄ 2
O2!
1 ⁄ 2Fe 2O
3+
MgTiO
3Uni-Ballmill
72
4FeT
iO3+
7S!
FeSO
4+
3FeS
2+
4TiO
2Ballmill
�231
75
2FeT
iO3+
5Si!
2FeT
iSi+
3MgO
Uni-Ballmill
76
FeT
iO3+
SrO
+1 ⁄ 2O
2!
1 ⁄ 2Fe 2O
3+
SrT
iO3
Uni-Ballmill
72
2GdCl 3+
3Ca!
2Gd+
3CaCl 2
�378
55
2GdCl 3+
3CaO
!Gd2O
3+
3CaCl 2
SPEX
8000
40:1
77
Table
14.1
Continued
Reaction
Mill
BPR
%Excess
reductant
DH(kJ)
Tad(K
)t ig(m
in)
Ref.
Chapter 14364

MD: SURYANARAYANA, JOB: 03320, PAGE: 365
4103-X_Suryanarayana_Ch14_R2_071504
GdCl 3+
3NaOH
!Gd(O
H) 3
+3NaCl
SPEX
8000
10:1
78
3Mg+
CuCl+
Zr(SO
4) 2!
Cu-Zr(amorphous)
+1 ⁄ 2
MgCl 2+
2MgSO
4(50h)
QM-1SPplanetary
ballmill
30:1
79
0.1MgCl 2+
0.9ZrC
l 4+
1.9Ca(O
H) 2!
(MgO) 0.1
(ZrO
2) 0.9+
1.9CaCl 2.H
2O
80
MgO
+ZrSiO
4!
MgSiO
3+
ZrO
2Uni-Ballmill
50:1
28
Na2Cr 2O
7+
S!
Cr 2O
3+
Na2SO
4SPEX
8000
10:1
�562
29
2NbCl 5+
5Na2CO
3!
Nb2O
5+
10NaCl
+5CO
2(g)
SPEX
8000
10:1
�1029
29
3Nb2O
5+
10Al!
5Al 2O
3+
6Nb(3–5h)
SPEX
8000
>7:1
2740
81
Nb2O
5+
2Al+
Zr!
2Nb+
Al 2O
3
+ZrO
2(2
h)
SPEX
8000
>7:1
2929
81
Nb2O
5+
2Al+
Zr!
2Nb+
Al 2O
3+
ZrO
2SPEX
8000
2:1
82
Nb2O
5+
Al 2Zr!
Al 2O
3+
ZrO
2+
2Nb(2
h)
SPEX
8000
>7:1
2337
81
Nd2O
3+
Fe+
Ca!
Nd2Fe 1
4B+
CaO
83
NiCl 2+
Mg!
Ni+
MgCl 2
SPEX
8000
10:1
42
84
NiCl 2+
2Na!
Ni+
2NaCl
SPEX
8000
3:1
50
�507
37,85
3NiO
+5Al!
3NiA
l+
Al 2O
3Fritsch
P5
10:1
86
3NiO
+3Al!
Ni 3Al+
Al 2O
3(<
1h)
SPEX
8000
>7:1
3744
81
2NiO
+C
!2Ni+
CO
2SPEX
8000
12:1
87
3PbS+
2Al!
3Pb+
Al 2S3
SPEX
8000
13:1
�267
1247
19
SiC
+Fe!
Fe 3C
+Fe(Si)(100h)
Planetary
ballmill
40:1
88
SiC
+Fe!
Fe 3Si+
Fe 2Si+
C(100h)
Planetary
ballmill
40:1
88
SmCl 3+
3Na!
Sm
+3NaCl
SPEX
8000
10:1
15
�202
89
Sm
2O
3+
17CoO
+20Ca!
Sm
2Co17c+
20CaO
90
Sm
2O
3+
Co+
Ca!
SmCo5+
CaO
91
SnCl 2+
Ca(O
H) 2
+0.5O
2!
SnO
2+
CaCl 2
+H
2O
(g)
SPEX
8000
10:1
92
SnCl 2+
Ca(O
H) 2
!SnO
+CaCl 2+
H2O
SPEX
8000
10:1
�59
36
SnO
+1 ⁄ 2O
2!
SnO
2d
�229
SnCl 2+
Ca(O
H) 2
!SnO
+CaCl 2+
H2O
(g)
SnO
+1 ⁄ 2O
2!
SnO
2e
Centrifugalmill
9:1
93
SrO
+ZrSiO
4!
SrSiO
3+
ZrO
2Uni-Ballmill
50:1
28
Mechanochemical Processing 365

MD: SURYANARAYANA, JOB: 03320, PAGE: 366
4103-X_Suryanarayana_Ch14_R2_071504
2TaCl 5+
5Mg!
2Ta+
5MgCl 2
SPEX
8000
7:1
10
�745
1616
94,95
TiCl 4+
2Mg!
Ti+
2MgCl 2
SPEX
8000
3:1
to12:1
15
�479
96
3TiO
2+
13Al!
3TiA
l 3+
2Al 2O
3Ballmill
47:1
97,98
3TiO
2+
4Al!
3Ti+
2Al 2O
3SPEX
8000
4:1
599
3TiO
2+
4Al+
3C
!3TiC
+2Al 2O
3(7
h)
SPEX
8000
>7:1
�1038
2338
66,81
3TiO
2+
4Al+
3C
!3TiC
+2Al 2O
3100
3TiO
2+
4Al+
3/2N
2!
3TiN
+2Al 2O
3Ballmill
68
3TiO
2+
3B2O
3+
10Al!
3TiB
2+
5Al 2O
3101
TiO
2+
B2O
3+
10 ⁄ 3Al!
TiB
2+
5 ⁄ 3Al 2O
3(3
h)
SPEX
8000
>7:1
2655
81
TiO
2+
B2O
3+
5Mg!
TiB
2+
5MgO
Ballmill
43:1
102
TiO
2+
3C
!TiC
+2CO
(200h)
Ballmill
70
TiO
2+
2Ca+
2B!
TiB
2+
2CaO
Fritsch
P5
7.5:1
20
�642
103
TiO
2+
2Ca+
C!
TiC
+2CaO
Fritsch
P5
7.5:1
20
�510
103
TiO
2+
2Mg!
Ti+
2MgO
Uni-Ballmill
73
TiO
2+
2Mg+
C!
TiC
+2MgO
Uni-Ballmill
43:1
74
2TiO
2+
4Mg+
N2!
2TiN
+4MgO
Uni-Ballmill
43:1
74
3V2O
5+
10Al!
6V
+5Al 2O
3SPEX
8000
3:1
599
3V2O
5+
10Al!
6V
+5Al 2O
3SPEX
8000
7:1
10
�3727
3468
104
2V2O
5+
5C
!4V
+5CO
2(48h)
SPEX
8000
9.3:1
10
105
Table
14.1
Continued
Reaction
Mill
BPR
%Excess
reductant
DH(kJ)
Tad(K
)t ig(m
in)
Ref.
Chapter 14366

MD: SURYANARAYANA, JOB: 03320, PAGE: 367
4103-X_Suryanarayana_Ch14_R2_071504
2V2O
5+
5C
!4V
+5CO
2(4
h)
SPEX
8000
10:1
10
106
2V2O
5+
9C
!4VC
+5CO
2SPEX
8000
4:1
50and
100
106
V2O
5+
5Mg!
2V
+5MgO
SPEX
8000
7:1
10
�1457
3354
—104
2V2O
5+
5Ti!
4V
+5TiO
2SPEX
8000
7:1
10
�1623
2658
—104
WO
3+
3Mg!
W+
3MgO
SPEX
8000
10:1
10
107
WO
3+
3Mg+
C!
WC
+3MgO
10:1
108,109
ZnCl 2+
CaS!
ZnS+
CaCl 2
SPEX
8000
10:1
33,110
ZnCl 2+
Na2CO
3+
8.6NaCl!
ZnO
f
+10.6NaCl+
CO
2(g)
SPEX
8000
10:1
�80
36
ZnO
+Ca!
Zn+
CaO
(24h)
SPEX
8000
3:1
10
�285
2242
87
15,16
ZnO
+Mg!
Zn+
MgO
SPEX
8000
7:1
10
�253
2006
45
111
2ZnO
+Ti!2Zn+
TiO
2SPEX
8000
3:1
10
�249
1982
24
3ZnS+
2Al!
3Zn+
Al 2S3
SPEX
8000
13:1
�107
493
19
ZnS+
8CuO
!ZnSO
4+
4Cu2O
112
ZrC
l 4+
2CaO
!ZrO
2g+
2CaCl 2(20h)
SPEX
8000
5:1
—�440
——
113
ZrC
l 4+
2Mg!
Zr+
2MgCl 2
SPEX
8000
10:1
10
�303
95
ag-A
l 2O
3form
edonly
after
heatingthemilledpowder
tomore
than300jC
.bCeO
2form
edonannealingthemilledpowder
for6hat400jC
.cSm
2Co17form
edonannealingthemilledpowder
at800jC
.dSnO
2form
edonannealingthemilledpowder
at400jC
.eSnO
2form
edonannealingthemilledpowder
for1hat400jC
.fZnO
form
edonannealingthemilledpowder
for0.5
hat400jC
.gZrO
2form
edonly
after
heatingthemilledpowder
tomore
than400jC
.
Mechanochemical Processing 367

MD: SURYANARAYANA, JOB: 03320, PAGE: 368
4103-X_Suryanarayana_Ch14_R2_071504
Figure 14.2 (a) Variation of milling vial temperature during mechanical alloying when acombustion reaction takes place. Note that the temperature increases gradually with time until
the combustion reaction takes place. There is a sudden increase in temperature when thecombustion reaction occurs. (b) Schematic representation of the temperature–time plot duringan SHS reaction. Note the similarity of this curve to that shown in (a).
Figure 14.1 Schematic of the chemical reaction occurring between two components—metaloxide (MO) and reductant R in the mechanochemical reactions. The product phases (M and
RO) form at the interface between the reactants and prevents further reaction from takingplace since the reactants are not in contact with each other.
Chapter 14368

of particles. On the other hand, if both the oxide (which is brittle) and the reductantare hard and brittle, agglomerates of reactant particles cannot develop and combus-tion is not initiated. This may be why combustion was not achieved in the CuO/Crcouple, and even the gradual reaction was extremely slow between CuO and Si. Thispoint highlights the necessity of an intimate contact for achieving faster kineticsduring the reduction process.
The SHS (or combustion reaction) is known to take place in a number of powdercompacts of different alloy systems [115,119]. Conventional SHS reactions areinitiated when the powder compacts are heated to the ignition temperature, withrelatively little loss of heat to the environment. However, since the powder duringMAis in close contact with the milling tools, the heat generated is partly lost to the vial andthe balls. Thus, it should be realized that SHS reactions that take place in powdercompacts may not occur during MA in all the alloy systems. Consequently, somemoderately exothermic SHS systems do not show the combustion reaction duringMA(due to loss of heat to the surroundings). Even though preheating of the componentscould help in such systems, this is not generally done in the MA process.
The product of the displacement reactions normally consists of two phases: themetal (or a solid solution or a compound), and the oxide or chloride associated withthe reductant. Removal of the unwanted reaction by-product can be difficult due tothe high reactivity of the metal phase associated with the nanocrystalline grain sizesand intermixing of the phases induced by the MA process. The by-product phase canbe removed by leaching in a dilute acid or hot water, or by vacuum distillation. It wasreported that the salt (by-product MgCl2) formed during the reduction of TiCl4 withMg was removed either by vacuum distillation at 900jC for 24 h, or by washing thepowder in 10% nitric acid [96]. An important requirement for easy removal of the saltfrom the mixture is that it should be contiguous so that the leachant can easily reach it.The use of carbon or hydrogen as a reductant produces either gaseous CO2 or watervapor as the by-product and obviates the need for leaching/distillation [50,87].
14.3 PROCESS PARAMETERS
Process parameters such as milling temperature, grinding ball diameter, ball-to-powder weight ratio (BPR), use of a process control agent, and relative proportionof the reactants seem to play an important role on the nature and kinetics of theproduct phase obtained by the displacement reactions. For example, a combustionreaction could be initiated during the reduction of copper oxide by iron; but the samereaction progresses gradually under slightly different milling conditions. Consequent-ly, results from different laboratories can be effectively compared only if the exactconditions under which the reaction takes place are reported. These conditions shouldbe optimized for the best yield.
14.3.1 Milling Temperature
McCormick et al. [96] investigated the reduction of TiCl4 with Mg both at roomtemperature (20jC) when TiCl4 is in the liquid state and at �55jC when it is in thesolid state. They observed that the milling time required to synthesize Ti was reducedby a factor of 6 when milling was conducted at�55 jC (Fig. 14.3). This was explainedon the basis of the greater efficiency of solid-solid collision events occurring during
MD: SURYANARAYANA, JOB: 03320, PAGE: 369
4103-X_Suryanarayana_Ch14_R2_071504
Mechanochemical Processing 369

MA. However, if both the reactants were to be in the solid state at both temperatures,the enhanced diffusivity at the higher temperatures increases the reaction kinetics andconsequently the times required for reduction are shorter. No such measurementshave been made to date.
14.3.2 Ball-to-Powder Weight Ratio
The time required for the reduction reaction to be completed decreased with anincrease in the BPR. For example, the time required to form Ti during the reduction ofTiCl4 withMg at 20jCwas 48 h at a BPR of 3:1, while it was only 18 h at a BPR of 12:1(Fig. 14.3). A similar threefold reduction in time with increasing BPR was also notedat �55jC; the minimal milling time required being 3 h at a BPR of 12:1 at thistemperature. Similar results were also reported for other displacement reactions, e.g.,between CuO and Fe [116]. The authors also noted that the magnitude of reduction inthe ignition time with increasing BPR was most dramatic at low BPR values andalmost nonexistent when the BPR was increased to values greater than 20.
Xi et al. [52] studied the effect of BPR on the reduction of CuO by Si during MAin a stirring ball mill. They noted that CuO was completely reduced to the pure metalCu only at a BPR of 80:1. At lower BPR values, CuO was reduced only partially to Cuand Cu2O (BPR 60:1), and at a BPR of 30:1, CuO was reduced only to Cu2O; no Cuwas obtained. This result was explained on the basis that at a high BPR the collisionenergy is high and therefore complete reduction to the pure metal could be obtained.
Schaffer andMcCormick [116] conducted a systematic investigation on the effectof BPR on the ignition temperature and time. They observed that the ignitiontemperature Tig decreased with increasing milling time, suggesting that the reactionkinetics become faster during milling; the reaction rates decrease with time during
MD: SURYANARAYANA, JOB: 03320, PAGE: 370
4103-X_Suryanarayana_Ch14_R2_071504
Figure 14.3 Effect of ball-to-powder weight ratio (BPR) and milling temperature on the
time required to synthesize titanium during reduction of TiCl4 with Mg. Note that thereduction time decreases with increasing BPR and also with decreasing temperature.
Chapter 14370

conventional solid-state reactions. Furthermore, the rate of decrease of Tig increasedwith increasing BPR, and this is related to the decrease in particle size. The values ofthe ignition time, tig also decreased with increasing BPR. Both of these effects arerelated to the average frequency of collisions that increases with increasing BPR. Theyalso noted that the combustion reaction did not occur when small grinding media (1-and 3-g balls) were used, but it occurred only when large (8-g) balls were used [56].
Higher milling intensity (achieved by increasing the BPR) resulted in a com-bustive reaction during milling of a Mo+Si powder mixture in a SPEX mill[118,120,121]. On the other hand, formation of MoSi2 was gradual when the BPRused was low [122].
14.3.3 Process Control Agent
In many of the investigations on reduction reactions, the components involved aregenerally brittle and therefore a process control agent (PCA) was not used. However,it was used in a few specific instances with interesting results. When CuO was ballmilled with reactive metals in the absence of any PCA, a self-propagating combustionreaction occurred after an incubation period [40,41]. On the other hand, when toluenewas used as a PCA, the reduction of CuO proceeded in a controlled manner andreached completion in about 24 h [40]. The use of a PCA acts likes an additive (diluent)and either delays or completely suppresses the combustion event. The PCA alsoinhibits interparticle welding during collisions, slowing down the reaction rate as wellas decreasing the particle size. It may be noted in passing that a combustion reactionshould be avoided if one is interested in producing the product material in a nano-crystalline state. This is because combustion may result in partial melting andsubsequent solidification leads to the formation of a coarse-grained structure.Another requirement for formation of nanometer-sized particles is that the volumefraction of the by-product phase must be sufficient to prevent particle agglomeration.
14.3.4 Relative Proportion of the Reactants
Normally about 10–15% stoichiometric excess of the reductant has been used in mostof the investigations conducted so far. This excess reductant is used partly tocompensate for the surface oxidation of the reactive reductant powder particles,e.g., Al [57]. There have been only a few investigations that discussed the effect of theratio of the constituent reactants (off-stoichiometry).
Takacs [58] investigated the displacement reaction:
3Fe3O4 þ 8Al ! 9Feþ 4Al2O3 ð14:2Þ
without the use of a PCA and studied the effect of off-stoichiometry by millingmixtures corresponding to 3Fe3O4 + xAl, where 2 V x V 16. A combustion reactionoccurred in all the cases except when x=2.However, the nature of the product phaseswas quite different depending on the value of x, and the results are summarized inTable 14.2. It has been noted that a slight decrease in the amount of Al results in theformation of FeAl2O4 instead of Al2O3; excess Al suppresses the formation ofmetastable g-Al2O3 and FeAl2O4 and results in the formation of random bcc a-Fe(Al) solid solution and a-Al2O3.
MD: SURYANARAYANA, JOB: 03320, PAGE: 371
4103-X_Suryanarayana_Ch14_R2_071504
Mechanochemical Processing 371

14.3.5 Grinding Ball Diameter
Yang and McCormick [94] investigated the effect of grinding ball diameter on thecombustion reaction during milling of a mixture of TaCl5 andMg. They observed thatthe ignition time, tig, for the combustion reaction decreased with an increase in balldiameter.
Combustion requires that the powder mixture reaches the ignition temperatureTig. Since Tig is dependent on microstructural features, it decreases with increasingrefinement in the microstructure. During MA the collision between the powderparticles and the balls raises the powder temperature, Tc, and therefore Tc increaseswith increasing milling time. It has been postulated [24] that the ignition time, tig isequal to the milling time required for Tig to decrease to Tc. Since increasing ball sizeincreases the collision energy and therefore Tc, it is expected that tig decreases withan increase in the ball diameter.
As mentioned earlier, ‘‘soft’’ milling conditions produce metastable phasesfarther from equilibrium than ‘‘hard’’milling conditions. Accordingly, it was reportedthat lower energy milling with smaller balls produced the hexagonal high-temperatureform of MoSi2 rather than the low-temperature tetragonal form [123].
14.4 PHASE FORMATION
It is normally expected that the displacement reactions listed in Table 14.1 follow theroute indicated. In fact, the heats of formation for these reactions have been calculatedassuming that these reactions take place according to that sequence. However, it hasbeen noted that many of these reactions do not go to completion directly; instead,intermediate phases are formed. There are also instances when the phases formed arequite different from the expected ones. For example, it was noted that in some of thedisplacement reactions one of the product phases became amorphous and so could notbe easily detected after milling. This was reported to be true for AlCl3 during millingwith CaO when diffraction peaks due to CaO only were observed in the X-raydiffraction patterns [26]. It was inferred that AlCl3 became amorphous during milling.Similar results were reported for TaCl5 [94], SiO2 [95], ZrCl4 [113], and others [36,79].
MD: SURYANARAYANA, JOB: 03320, PAGE: 372
4103-X_Suryanarayana_Ch14_R2_071504
Table 14.2 Incubation Time and Phase Constitution After Milling a Mixture of 3Fe3O4
+ xAl for 2 ha
Sample, x Incubation time (min) Major (minor) phases present
2 No combustion Fe3O4, (Al)
6 53 a-Fe, FeAl2O4
8a 10 a-Fe, a-Al2O3, (g-Al2O3, FeAl2O4)11 14 a-FeAl0.333, a-Al2O3
16 56 a-FeAl0.890, a-Al2O3
8b 8 a-Fe, a-Al2O3, g-Al2O3, FeAl2O4, (Fe3O4, Al)8c — Fe3O4, Al8d 23 a-Fe, a-Al2O3, g-Al2O3, FeAl2O4
a Milling of samples 8b, 8c, and 8d was interrupted immediately after, somewhat before, and 5 min after
combustion [58].
Chapter 14372

Formation of an intermediate (transition) product phase has been observedduring the reduction reactions of Cr2O3 withAl and Zn [38], Fe3O4 withAl [57], Ti andZn [38], and CuO with Fe [45–47] or graphite [42]. For example, during reduction ofCuO with Fe, it was observed that the reaction proceeds in various stages that can berepresented as:
8CuO þ 3Fe ! 4Cu2Oþ Fe3O4 ð14:3Þ
or 5CuOþ 3Fe ! Cu2Oþ 3Cuþ Fe3O4 ð14:4Þ
4Cu2Oþ 3Fe ! 8Cuþ Fe3O4 ð14:5Þ
Formation of Cu2O as an intermediate product was also reported during the reductionof CuO with graphite [42]. Similarly, it was reported that Ti2O3 formed as anintermediate product (instead of TiO2) during the reduction of V2O5 with titanium[104]. The amount of CuO was reported to decrease monotonically during milling andthe proportion of Cu2O increased reaching amaximum of 45 wt% after milling for 9 h.Subsequently, it decreased to zero after milling of the powder mixture for 24 h, when100% Cu had formed (Fig. 14.4).
Reduction of Fe2O3 to pure Fe generally takes place in the sequence of Fe2O3!Fe3O4 ! FeO ! Fe, i.e., with intermediate phases containing lower and loweramounts of oxygen. However, in the case of mechanochemical reduction, it has beenreported [61] that the pure metal Fe formed directly from Fe2O3 upon milling withtitanium. This suggests that mechanical activation could alter the stages throughwhich reduction reactions take place.
Investigation of the nature and role of such intermediate phases is important tounderstand the reaction mechanism(s). It should also be mentioned that the reactionsstop with the formation of an intermediate phase when the reactions are endothermic.Accordingly, the metal Cr does not form when Cr2O3 is reduced with Zn [38].
MD: SURYANARAYANA, JOB: 03320, PAGE: 373
4103-X_Suryanarayana_Ch14_R2_071504
Figure 14.4 Effect of milling time on reaction kinetics during reduction of CuO withgraphite. Note that the amount of CuO decreases continuously and that the transition productCu2O increases reaching a value of 45 wt% with milling time. Formation of Cu takes place
eventually, and all of the CuO and Cu2O gets reduced to pure Cu.
Mechanochemical Processing 373

In a few instances it was also noted that instead of a pure metal a solid solutionwas formed. For example, an Fe(Zn) solid solution was formed during the reductionof Fe3O4 with Zn [38], and an Fe(Al) solid solution containing 1.7 at%Al was formedwhen Fe2O3 was reduced with Al [124] or 7 at%Al when FeS was reduced with Al [19].
It was also observed that in some cases the final phase formed is different fromthe expected phase. During the displacement reactions of FeS, WS2, and MoS2 withCaO, it was noted that the corresponding simple oxides did not form; instead, complexoxides, e.g., CaFeO3, CaWO4, and CaMoO4, were formed [19]. The product phase insome cases has also been found to be amorphous in nature [36,52,79,94,95,113].
14.5 COMBUSTION REACTION
Milling-induced combustion was first observed by Tschakarov et al. [125] during themechanochemical synthesis of metal chalcogenides from a mixture of elementalpowders. Subsequently, a number of similar reactions were reported to occur duringthe chemical reduction of oxides with reactive metals under MA conditions.
The large enthalpy changes associated with the chemical reactions are respon-sible for the occurrence of the combustion reaction. If the temperature generatedduring the milling process (due to ball-to-ball and ball-to-powder collisions), Tc, ishigher than the ignition temperature,Tig, then the combustion reaction can occur. Theignition temperature is a function of the enthalpy change and microstructuralparameters such as particle size and crystal size. Since the particle size and crystalsize get refined with the progress in the MA processing, Tig is found to decrease withmilling time. But with increasing milling time Tc increases and reaches a steady-statevalue. The time at which theTig andTc intersect is the critical milling time, tig, at whichignition would occur (Fig. 14.5).
It may also be interpreted that up to the milling time tig, intermixing of theparticles, particle refinement, and accumulation of lattice defects occurs and theseappear to favor the combustion reaction. Furthermore, room temperature aging wasfound to significantly accelerate the onset of combustion thereby substantially
MD: SURYANARAYANA, JOB: 03320, PAGE: 374
4103-X_Suryanarayana_Ch14_R2_071504
Figure 14.5 Schematic representation of the variation of Tig and Tc with milling time. The
time corresponding to the point of intersection at tig represents the minimal ignition time.
Chapter 14374

reducing the overall milling time [24]. A detailed review on this topic was recentlypublished [18].
Similar to what has been noted during conventional SHS reactions, the effect ofprocess variables on the reaction during MA has also been investigated. For example,it was reported that the ignition of the combustion reactions strongly depended on themilling intensity. High milling energy and frequency led to a shorter ignition time(activation period) [81]. The ignition temperature also decreased with mechanicalactivation. The ignition temperature of 1100–1300 K for the CuO + Mg reactiondecreased to 400–450 Kwith mechanical activation [51]. The addition of diluents, e.g.,Al2O3, toNi-Al mixtures duringmilling changed the spontaneous reactions to gradualreactions [81].
14.6 REACTION MECHANISMS
The complexity of deformation and comminution processes accompanying MCP hasbeen recognized right from the beginning. It has also been noted that mechanochem-ical reactions occur only when (1) the individual components are in intimate contactwith each other, (2) there is a fine dispersion of the two phases involved (at least one ofthe phases must be uniformly dispersed), (3) the components involved are preferen-tially on a nanometer scale, and (4) sufficient heat is generated so that the temperatureis high enough to allow ignition to occur. However, the question of how themechanical energy is transformed to chemical energy is the most fascinating and leastunderstood problems in MCP research. Several different approaches have beenemployed to explain the initiation and the mechanism of the mechanochemicalreactions. These include:
Thermal theories of initiation of mechanochemical reactionsMechanisms related to plastic deformation and creation of defects such as
dislocations and disclinationsTheory of surface-active states and electron excitations during fracturing of
crystals
14.6.1 Thermal Theories
The simplest way to explain the initiation of mechanochemical reactions is to assumethat the kinetic energy of the grinding medium transferred to the powder is convertedto thermal energy. The development of surface temperature peaks between two slidingsolids was investigated by Bowden and Thomas [126], and these temperature peakshave been used to explain detonation of explosives. Heinicke [5] proposed the simple‘‘tribo plasma’’ model to explain most of the mechanochemical effects. According tothis theory, the high temperatures developed during collisions can cause the materialto evaporate and form a plasma state, which promotes chemical reactions. Someevidence of electron and photon emissions was used to support this theory.
Occurrence of chemical reactions during crack propagation through crystals wasfirst studied by Fox and Soria-Ruiz [127] and later by Urakaev et al. [128]. It wasshown that when a crack propagates through a crystal, thermal excitation at its tipmay exceed 2000 K [129] for a short time (about 10�9 s), and this may result in thedecomposition of the solid. Analysis of the decomposition products emitted from thecrack propagating through anNaNO3 crystal using a time-of-flight mass spectrometer
MD: SURYANARAYANA, JOB: 03320, PAGE: 375
4103-X_Suryanarayana_Ch14_R2_071504
Mechanochemical Processing 375

revealed the presence of NO2 [128]. NO2 can typically form only at temperatureshigher than 1000 K, whereas oxygen usually forms during low-temperature decom-position. Thus, it was concluded that thermal spikes are responsible for mechano-chemical reactions. The early mechanisms of amorphization during MM were alsorelated to possible rise in temperature and formation of liquid metal pools under ballimpacts and subsequent rapid solidification of the melt by the surrounding cold solid[130].
14.6.2 Reactions Induced by Shear
Starting from the early work of Bridgeman [131] it was shown that application of shearstress to a solid or to a mixture of solids may result in phase transformations oracceleration of chemical interactions. Reactions such as synthesis of Cu2S and othersulfides from elements, decomposition of oxides, reduction of SnO2 into SnO,reduction of PbO and AgO to Pb and Ag, respectively, were demonstrated to takeplace in Bridgeman anvils. The importance of shear was demonstrated whenK3Fe(CN)6 has transformed into K4Fe(CN)6 under the combined action of shearand pressure in Bridgeman anvils; pressure alone did not produce any chemicalchanges [132]. It was later demonstrated that theNi-Al intermetallic compounds couldbe formed in Bridgeman anvils [133] as well as by MA processing [134]. It is wellestablished in the literature on MA that plastic deformation plays a major role infurther accelerating chemical reactions. Development of the ‘‘bulk’’ mechanicalalloying technique by Aizawa et al. [135] to synthesize Cu-Ag solid solutions andintermetallics such as Mg2Ni by a solid-state reaction between the constituentelemental powder mixtures involves multiple extrusion and forging. Since homoge-neous refining and alloying take place efficiently by repeated forging, the process timecan be reduced to one-fiftieth of the time necessary for conventional MM andattrition. Mg2Ni by this process can be obtained as a highly dense powder compactwith a relative mass density in the order of 85% of theoretical. The equal channelangular extrusion (ECAE) process invented in early 1970s by Segal [136] is nowbecoming very popular not only for refining the microstructure but also as a synthesismethod [137,138]. The large volume fraction of atoms residing in the grain boundariesof these ultrafine-grained materials is expected to enhance diffusion and consequentlyincrease the rate of mechanochemical reactions. Studies of the mechanochemicalreaction mechanisms at the atomic level are very limited. Transmission electronmicroscopy techniques were used to demonstrate early formation of rotationaldisclination-type defects in Frank-Kasper cubic crystals transformed into a quasi-crystalline phase [139]. It was shown that mass transfer at the first stage of thetransformation was due to rotation of crystal blocks rather than conventionaldiffusion process. In addition to the shear and deformation mechanisms mentionedabove, enhancement of diffusion due to defect formation also plays an important role.The diffusion process is accelerated due to the increased density of defects in plasticallydeformed powder particles.
14.6.3 Theory of Surface Active States
Fresh surfaces formed during the comminution process are usually electricallycharged, and this charge is localized reflecting the defect structure of the solid. Therelationship between mechanochemical reactions and electrochemical processes in
MD: SURYANARAYANA, JOB: 03320, PAGE: 376
4103-X_Suryanarayana_Ch14_R2_071504
Chapter 14376

solids was discussed by Gutman [7]. Formation of free radicals and detailed studies oftheir mechanisms during mechanical activation of quartz were studied by Butyagin[140]. Effects of reduced coordination number for Ca on the electron distributionduring Ca-O-Si bridge bonding from CaO or Ca(OH)2 and SiO2 was studied [141].The discrete variational X alpha method was used to elucidate the formation of aheterobridging bond, Ca-O-Si, when a Si-O pendant bond of SiO2 comes close to theCa atom on the surface of calcium oxide or hydroxide. A decrease in the coordinationnumber for Ca in CaO or Ca(OH)2 increases the electron population density betweenCa and O, and decreases the electron population density between Si and O. Thesesimultaneous changes in electron population density favor the formation and stabi-lization of a Ca-O-Si heterobridging bond. The calculated results agree with theexperimental observation of precursor formation towards calcium silicate duringmilling of a mixture of Ca(OH)2 and SiO2. Other examples may be mechanicaldegradation and mechanochemical reaction in heterogeneous and homogeneoussystems of polyvinyl chloride and polyethylene-co-propylene polymer caused byultrasonic irradiation at 303 K [142]. Mechanochemical reaction occurred due tothe free radicals produced from the chain scissions of both polymers by ultrasonicwaves. Detailed investigations of the reaction mechanisms of mechanochemicalreactions present challenges due to the complexity of the processes involving chemicalreactions of deformed solids; consequently, the number of detailed mechanism studiesis small.
14.7 MECHANOSYNTHESIS OF CERAMICS AND NANOCOMPOSITES
Apart from the displacement reactions described above to reduce oxides, chlorides,and sulfides to pure metals, the MA technique was also used to synthesize ceramiccompounds and nanocomposites using the mechanochemical reactions. In thiscategory, a variety of borides, carbides [143,144], fluorides, nitrides, oxides, silicides[143], stannides, and composites [114,124,145,146] have been synthesized by ballmilling of the respective powders for a few hours at room temperature. An importantcharacteristic of such phases is that they are nanocrystalline in nature. Consequently,like other nanocrystalline materials [147], they exhibit properties and performancemuch improved over their conventional coarse-grained counterparts. These nano-crystalline oxides can be used for dispersion strengthening the metals to improve theirhigh-temperature mechanical properties. Table 14.3 summarizes the results availableso far. The main advantage of synthesizing these ceramic compounds and compositesthrough mechanochemical displacement reactions is that they can be produced atrelatively low temperatures and also in an economical way through fewer steps than inthe conventional way.
Composites consisting of a metal oxide as a major phase (ranging from 48 to 73vol%) and a metal have been synthesized according to the reaction:
3=yMxOy þ 2Al ! Al2O3 þ 3x=yM ð14:6Þ
In some cases, instead of the pure metal, alloys have also been synthesized as in thecase of Fe-50 at% Cr or Fe-18 at% Cr-8 at% Ni. The crystallite size of the a-Al2O3
phase in all the cases is in the range of 10–20 nm. The great advantage of producingcomposites this way is that pure metal oxide or aluminum is not required; one coulduse recycled aluminum for largescale production.Metal ore can also be used instead of
MD: SURYANARAYANA, JOB: 03320, PAGE: 377
4103-X_Suryanarayana_Ch14_R2_071504
Mechanochemical Processing 377
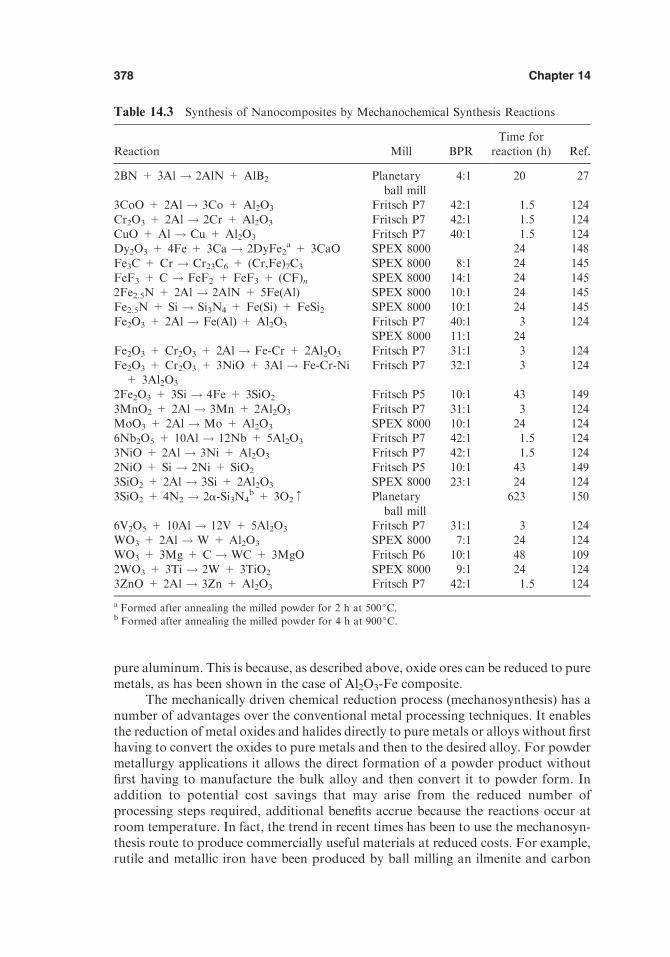
pure aluminum. This is because, as described above, oxide ores can be reduced to puremetals, as has been shown in the case of Al2O3-Fe composite.
The mechanically driven chemical reduction process (mechanosynthesis) has anumber of advantages over the conventional metal processing techniques. It enablesthe reduction of metal oxides and halides directly to pure metals or alloys without firsthaving to convert the oxides to pure metals and then to the desired alloy. For powdermetallurgy applications it allows the direct formation of a powder product withoutfirst having to manufacture the bulk alloy and then convert it to powder form. Inaddition to potential cost savings that may arise from the reduced number ofprocessing steps required, additional benefits accrue because the reactions occur atroom temperature. In fact, the trend in recent times has been to use the mechanosyn-thesis route to produce commercially useful materials at reduced costs. For example,rutile and metallic iron have been produced by ball milling an ilmenite and carbon
MD: SURYANARAYANA, JOB: 03320, PAGE: 378
4103-X_Suryanarayana_Ch14_R2_071504
Table 14.3 Synthesis of Nanocomposites by Mechanochemical Synthesis Reactions
Reaction Mill BPR
Time for
reaction (h) Ref.
2BN + 3Al ! 2AlN + AlB2 Planetaryball mill
4:1 20 27
3CoO + 2Al ! 3Co + Al2O3 Fritsch P7 42:1 1.5 124
Cr2O3 + 2Al ! 2Cr + Al2O3 Fritsch P7 42:1 1.5 124CuO + Al ! Cu + Al2O3 Fritsch P7 40:1 1.5 124Dy2O3 + 4Fe + 3Ca ! 2DyFe2
a + 3CaO SPEX 8000 24 148
Fe3C + Cr ! Cr23C6 + (Cr,Fe)7C3 SPEX 8000 8:1 24 145FeF3 + C ! FeF2 + FeF3 + (CF)n SPEX 8000 14:1 24 1452Fe2.5N + 2Al ! 2AlN + 5Fe(Al) SPEX 8000 10:1 24 145
Fe2.5N + Si ! Si3N4 + Fe(Si) + FeSi2 SPEX 8000 10:1 24 145Fe2O3 + 2Al ! Fe(Al) + Al2O3 Fritsch P7 40:1 3 124
SPEX 8000 11:1 24Fe2O3 + Cr2O3 + 2Al ! Fe-Cr + 2Al2O3 Fritsch P7 31:1 3 124
Fe2O3 + Cr2O3 + 3NiO + 3Al ! Fe-Cr-Ni+ 3Al2O3
Fritsch P7 32:1 3 124
2Fe2O3 + 3Si ! 4Fe + 3SiO2 Fritsch P5 10:1 43 149
3MnO2 + 2Al ! 3Mn + 2Al2O3 Fritsch P7 31:1 3 124MoO3 + 2Al ! Mo + Al2O3 SPEX 8000 10:1 24 1246Nb2O5 + 10Al ! 12Nb + 5Al2O3 Fritsch P7 42:1 1.5 124
3NiO + 2Al ! 3Ni + Al2O3 Fritsch P7 42:1 1.5 1242NiO + Si ! 2Ni + SiO2 Fritsch P5 10:1 43 1493SiO2 + 2Al ! 3Si + 2Al2O3 SPEX 8000 23:1 24 124
3SiO2 + 4N2 ! 2a-Si3N4b + 3O2z Planetary
ball mill623 150
6V2O5 + 10Al ! 12V + 5Al2O3 Fritsch P7 31:1 3 124WO3 + 2Al ! W + Al2O3 SPEX 8000 7:1 24 124
WO3 + 3Mg + C ! WC + 3MgO Fritsch P6 10:1 48 1092WO3 + 3Ti ! 2W + 3TiO2 SPEX 8000 9:1 24 1243ZnO + 2Al ! 3Zn + Al2O3 Fritsch P7 42:1 1.5 124
a Formed after annealing the milled powder for 2 h at 500jC.b Formed after annealing the milled powder for 4 h at 900jC.
Chapter 14378

mixture at room temperature [151,152]. Furthermore, production of nanocompositesconsisting of finely dispersed ferromagnetic Fe particles in a nonmagnetic matrix suchas Al2O3 can provide interesting combination of magnetic properties, including thegiant magnetoresistance effect.
REFERENCES
1. Carry-Lea, M. (1892), (1894). Phil. Mag. 34:46; 37:470–475.2. Ostwald, W. (1919). Handbuch der allgemeine Chemie. Vol. 1. Leipzig, p. 70.
3. McCormick, P. G. (1997). In: Gschneidner, K. A. Jr., Eyring, L., eds. Handbook on thePhysics and Chemistry of Rare Earths. Vol. 24. Amsterdam: Elsevier, pp. 47–81.
4. Tiessen, P. A., Meyer, K., Heinicke, G. (1966). Grundlagen der Tribochemie. Berlin:Akad Verlag.
5. Heinicke, G. (1984). Tribochemistry. Munchen: Hanser.6. Boldyrev, V. V. (1991). Siber. J. Chem. 5:4–21.7. Gutman, E. M. (1998). Mechanochemistry of Materials. Cambridge, UK: Cambridge
International Science Publishing.8. Gutman, E.M. (1994).Mechanochemistry of Solid Surfaces. Singapore: World Scientific.9. Tkacova, K. (1989). Mechanical Activation of Minerals. Amsterdam: Elsevier.
10. Juhasz, A. Z., Opoczky, L. (1990). Mechanical Activation of Minerals by Grinding,Pulverizing, and Morphology of Particles. Budapest: Akademia Kiado.
11. Ivanov, E. (1993). J. Mater. Synth. Proc. 1:405–413.
12. Ivanov, E., Suryanarayana, C. (2000). J. Mater. Synth. Proc. 8:235–244.13. Avvakumov, E. G. (1986). Mechanical Methods of Activation of Chemical Processes.
Novosibirsk, Russia: Nauka Publishing House.14. McCormick, P. G. (1995). Mater. Trans. Jpn. Inst. Metals 36:161–169.
15. Schaffer, G. B., McCormick, P. G. (1989). Appl. Phys. Lett. 55:45–46.16. McCormick, P. G., Wharton, V. N., Schaffer, G. B. (1989). In: Small, W. M., ed.
Physical Chemistry of Powder Metals Production and Processing. Warrendale, PA:
TMS, pp. 19–34.17. Gaffet, E., Bernard, F., Niepce, J.-C., Charlot, F., Gras, C., Le Caer, G., Guichard, J.-L.,
Delcroix, P., Mocellin, A., Tillement, O. (1999). J.Mater. Chem. 9:305–314.
18. Takacs, L. (2002). Prog. Mater. Sci. 47:355–414.19. Matteazzi, P., Le Caer, G. (1992). Mater. Sci. Eng. A156:229–237.20. Avvakumov, E. G., Senna, M., Kosova, N. V. (1998). Soft Mechanical Synthesis: A
Basis for New Chemical Technologies. Boston, MA: Kluwer.
21. Special issues of Journal of Materials Synthesis and Processing 8: Issues 3–6, 2000.22. Xi, S., Qu, X., Ma, M., Zhou, J., Zheng, X., Wang, X. (1998). J. Alloys Compounds
268:211–214.
23. Osso, D., Tillement, O., Le Caer, G., Mocellin, A. (1998). J. Mater. Sci. 33:3109–3119.24. Schaffer, G. B., McCormick, P. G. (1991). Metall. Trans. A22:3019–3024.25. Lorrain, N., Chaffron, L., Carry, C. (1999). Mater. Sci. For. 312–314:153–158.
26. Ding, J., Tsuzuki, T., McCormick, P. G. (1996). J. Am. Ceram. Soc. 79:2956–2958.27. Du, Y., Li, S., Zhang, K., Lu, K. (1997). Scripta Mater. 36:7–14.28. Welham, N. J. (1998). Metall. Mater. Trans. 29B:603–610.
29. McCormick, P. G., Tsuzuki, T. (2002). Mater. Sci. For. 386–388:377–386.30. Welham, N. J. (1998). Mater. Sci. Eng. A248:230–237.31. Welham, N. J. (1999). J. Mater. Res. 14:619–627.32. Welham, N. J. (1999). Mater. Sci. Technol. 15:456–458.
33. Tsuzuki, T., McCormick, P. G. (1999). Nanostructured Mater. 12:75–78.34. Tsuzuki, T., McCormick, P. G. (1997). Appl. Phys. A65:607–609.
MD: SURYANARAYANA, JOB: 03320, PAGE: 379
4103-X_Suryanarayana_Ch14_R2_071504
Mechanochemical Processing 379

35. Gopalan, S., Singhal, S. C. (2000). Scripta Mater. 42:993–996.36. Tsuzuki, T., McCormick, P. G. (2000). Mater. Sci. For. 343–346:383–388.37. Ding, J., Tsuzuki, T., McCormick, P. G., Street, R. (1996). J. Phys. D: Appl. Phys.
29:2365–2369.38. Takacs, L. (1993). Nanostructured Mater. 2:241–249.39. Ding, J., Tsuzuki, T., McCormick, P. G., Street, R. (1996). J. Alloys Compounds
234:L1–L3.40. Schaffer, G. B., McCormick, P. G. (1990). Metall. Trans. 21A:2789–2794.41. Schaffer, G. B., McCormick, P. G. (1990). J. Mater. Sci. Lett. 9:1014–1016.
42. Yang, H., Nguyen, G., McCormick, P. G. (1995). Scripta Metall. Mater. 32:681–684.43. Schaffer, G. B., McCormick, P. G. (1989). Scripta Metall. 23:835–838.44. Ying, D. Y., Zhang, D. L. (2000). Mater. Sci. Eng. A286:152–156.
45. Takacs, L., Pardavi-Horvath, M. (1994). In: Shull, R. D., Sanchez, J. M., ed. Na-nophases and Nanocrystalline Structures. Warrendale, PA: TMS, pp. 135–144.
46. Shen, T. D., Wang, K. Y., Quan, M. X., Wang, J. T. (1991). Scripta Metall. Mater.25:2143–2146.
47. Shen, T. D., Wang, K. Y., Wang, J. T., Quan, M. X. (1992).Mater. Sci. Eng. A151:189–195.
48. Pardavi-Horvath, M., Takacs, L. (1995). Scripta Metall. Mater. 33:1731–1740.
49. Forrester, J. S., Schaffer, G. B. (1995). Metall Mater. Trans. 26A:725–730.50. Durisin, J., Orolınova, M., Durisinova, K., Katana, V. (1994). J. Mater. Sci. Lett.
13:688–689.
51. Torosyan, A. R., Baghdasaryan, V. S., Martirosyan, V. G., Aloyan, S. G., Balayan, H.G., Navasardyan, H. V., Barseghyan, S. A. (2002). Mater. Sci. For. 386–388:229–234.
52. Xi, S., Zhou, J., Wang, X., Zhang, D. (1996). J. Mater. Sci. Lett. 15:634–635.
53. Takacs, L. (1996). Mater. Sci. For. 225–227:553–558.54. Balaz, P., Takacs, L., Jiang, J. Z., Soika, V., Luxova, M. (2002). Mater. Sci. For. 386–
388:257–262.55. McCormick, P. G., Alonso, T., Liu, Y., Lincoln, F. J., Parker, T. C., Schaffer, G. B.
(1992). In: Bautista, R. G., Jackson, N., eds. Rare Earths—Resources, Science, Tech-nology, and Applications. Warrendale, PA: TMS, p. 247.
56. Ding, J., Miao, W. F., McCormick, P. G., Street, R. (1995). Appl. Phys. Lett. 67:3804–
3806.57. Pardavi-Horvath, M., Takacs, L. (1992). IEEE Trans. Mag. 28:3186–3188.58. Takacs, L. (1992). Mater. Lett. 13:119–124.
59. Takacs, L., Pardavi-Horvath, M. (1994). J. Appl. Phys. 75:5864–5866.60. Nasu, T., Tokumitsu, K., Miyazawa, K., Greer, A. L., Suzuki, K. (1999). Mater. Sci.
For. 312–314:185–190.61. Tokumitsu, K., Nasu, T., Suzuki, K., Greer, A. L. (1998). Mater. Sci. For. 269–
272:181–186.62. Matteazzi, P., Le Caer, G. (1991). Mater. Sci. Eng. A149:135–142.63. Nasu, T., Tokumitsu, K., Konno, T., Suzuki, K. (2000). Mater. Sci. For. 343–346:435–
440.64. Warris, C. J., McCormick, P. G. (1997). Minerals Eng. 10:1119–1125.65. Welham, N. J. (1998). J. Alloys Compounds 270:228–236.
66. Willis, P. E., Welham, N. J., Kerr, A. (1998). J. Eur. Ceram. Soc. 18:701–708.67. Kerr, A., Welham, N. J., Willis, P. E. (1999). Nanostructured Mater. 11:233–239.68. Welham, N. J., Kerr, A., Willis, P. E. (1999). J. Am. Ceram. Soc. 82:2332–2336.
69. Welham, N. J., Willis, P. E. (1998). Metall. Mater. Trans. 29B:1077–1083.70. Welham, N. J., Williams, J. S. (1999). Metall. Mater. Trans. 30B:1075–1081.71. Chen, Y., Hwang, T., Marsh, M., Williams, J. S. (1997). Metall. Mater. Trans.
28A:1115–1121.
MD: SURYANARAYANA, JOB: 03320, PAGE: 380
4103-X_Suryanarayana_Ch14_R2_071504
Chapter 14380

72. Welham, N. J. (1998). J. Mater. Sci. 33:1795–1799.73. Welham, N. J. (1998). J. Alloys Compounds 274:260–265.74. Welham, N. J., Llewellyn, D. J. (1999). J. Eur. Ceram. Soc. 19:2833–2841.
75. Welham, N. J. (1998). Aust. J. Chem. 51:947–953.76. Welham, N. J. (1998). J. Alloys Compounds 274:303–307.77. Tsuzuki, T., Harrison, W. T. A., McCormick, P. G. (1998). J. Alloys Compounds
281:146–151.78. Tsuzuki, T., Pirault, E., McCormick, P. G. (1999). Nanostructured Mater. 11:125–131.79. Wu, N. Q., Su, L. Z., Yuan, M. Y., Wu, J. M., Li, Z. Z. (1998).Mater. Sci. Eng. A 257:
357–360.80. Dodd, A. C., McCormick, P. G. (1999). Mater. Sci. For. 312–314:221–226.81. Tomasi, R., Pallone, E. M. J. A., Botta F., W. J. (1999). Mater. Sci. For. 312–314:333–
338.82. Pallone, E. M. J. A., Hanai, D. E., Tomasi, R., Botta F., W. J. (1998). Mater. Sci. For.
269–272:289–294.83. Liu, Y., Alonso, T., Dallimore, M. P., McCormick, P. G. (1994). Trans. Mater. Res.
Soc. Jpn. 14:961.84. Baburaj, E. G., Hubert, K. T., Froes, F. H. (1997). J. Alloys Compounds 257:146–149.85. Ding, J., Tsuzuki, T., McCormick, P. G. (1999). J. Mater. Sci. 34:5293–5298.
86. Oleszak, D. (2002). Mater. Sci. For. 386–388:223–228.87. Yang, H., McCormick, P. G. (1998). Metall. Mater. Trans. 29B:449–455.88. Shen, T. D., Koch, C. C., Wang, K. Y., Quan, M. X., Wang, J. T. (1997). J. Mater. Sci.
32:3835–3839.89. Alonso, T., Liu, Y., Dallimore, M. P., McCormick, P. G. (1993). Scripta Metall. Mater.
29:55–58.
90. Liu, W., McCormick, P. G. (1999). Nanostructured Mater. 12:187–190.91. Liu, Y., Dallimore, M. P., McCormick, P. G., Alonso, T. (1992). Appl. Phys. Lett.
60:3186–3187.92. Tsuzuki, T., Mc Cormick, P. G. (1999). Mater. Sci. For. 315–317:586–591.
93. Kersen, U. (2002). Mater. Sci. For. 386–388:633–638.94. Yang, H., McCormick, P. G. (1993). J. Mater. Sci. Lett. 12:1088–1091.95. McCormick, P. G., Liu, Y., Yang, H., Nguyen, G., Alonso, T. (1993). In: deBarbadillo,
J. J., et al., eds., Mechanical Alloying for Structural Applications. Materials Park, OH:ASM International, pp. 165–169.
96. McCormick, P. G., Wharton, V. N., Reyhani, M. M., Schaffer, G. B. (1991). In: Van
Aken, D. C., Was, G. S., Ghosh, A. K., eds.Microcomposites and Nanophase Materials.Warrendale, PA: TMS, pp. 65–79.
97. Welham, N. J. (1998). Mater. Sci. Eng. A255:81–89.98. Welham, N. J. (1998). Intermetallics 6:363–368.
99. Zhang, D. L., Ying, D. Y., Adam, G. (2002). Mater. Sci. For. 386–388:287–292.100. Pallone, E. M. J. A., Tomasi, R., Botta F., W. J. (2000). Mater. Sci. For. 343–346:393–
398.
101. Lu, L., Lai, M. O., Su, Y., Teo, H. L., Feng, C. F. (2001). Scipta Mater. 45:1017–1023.102. Welham, N. J. (1999). Minerals Eng. 12:1213–1224.103. Kudaka, K., Iizumi, K., Izumi, H., Sasaki, T. (2001). J. Mater. Sci. Lett. 20:1619–1622.
104. Yang, H., McCormick, P. G. (1994). J. Solid State Chem. 110:136–141.105. Zhang, D. L., Zhang, Y. J. (1998). J. Mater. Sci. Lett. 17:1113–1115.106. Zhang, D. L., Adam, G. (2002). Mater. Sci. For. 386–388:293–298.
107. Mukhopadhyay, D. K., Prisbrey, K. A., Suryanarayana, C., Froes, F. H. (1996). In:Bose, A., Dowding, R. J., eds. Tungsten and Refractory Metals 3. Princeton, NJ: MetalPowder Industries Federation, pp. 239–246.
108. Sherif El-Eskandarany, M., Konno, T. J., Omori, M., Ishikuro, M., Takada, K.,
MD: SURYANARAYANA, JOB: 03320, PAGE: 381
4103-X_Suryanarayana_Ch14_R2_071504
Mechanochemical Processing 381

Sumiyama, K., Hirai, T., Suzuki, K. (1996). J. Japan Soc. Powder Powder Metall.43:1368–1373.
109. Sherif El-Eskandarany, M., Omori, M., Ishikuro, M., Konno, T. J., Takada, K.,
Sumiyama, K., Hirai, T., Suzuki, K. (1996). Metall. Mater. Trans. 27A:4210–4213.110. Tsuzuki, T., Ding, J., McCormick, P. G. (1997). Physica B239:378–387.111. Yang, H., McCormick, P. G. (1993). J. Solid State. Chem. 107:258–263.
112. Ryan, Z. Honors thesis, University of Western Australia, Nedlands, 1995; quoted inRef 64.
113. Ding, J., Tsuzuki, T., McCormick, P. G. (1997). Nanostructured Mater. 8:75–81.
114. Takacs, L. (1993). Mater. Res. Soc. Symp. Proc. 286:413–418.115. Moore, J. J., Feng, H. J. Prog. Mater. Sci. 39: 243-316.116. Schaffer, G. B., McCormick, P. G. (1992). Metall. Trans. 23A:1285–1290.
117. Aning, A. O., Hong, C., Desu, S. B. (1995). Mater. Sci. For. 179–181:207–214.118. Patankar, S. N., Xiao, S.-Q., Lewandowski, J. J., Heuer, A. H. (1993). J. Mater. Res.
8:1311–1316.119. Bhaduri, S. B., Bhaduri, S. (1999). In: Suryanarayana, C., ed. Non-equilibrium
Processing of Materials. Oxford, UK: Pergamon, pp. 287–309.120. Yen, B. K., Aizawa, T., Kihara, J. (1996). Mater. Sci. Eng. A220:8–14.121. Ma, E., Atzmon, M. (1993). Mater. Chem. Phys. 39:249–256.
122. Lee, P.-Y., Chen, T.-R., Yang, J.-L., Chin, T. S. (1995).Mater. Sci. Eng. A192/193:556–562.
123. Liu, L., Magini, M. (1997). J. Mater. Res. 12:2281–2287.
124. Matteazzi, P., Le Caer, G. (1992). J. Am. Ceram. Soc. 75:2749–2755.125. Tschakarov, Chr. G., Gospodinov, G. G., Bontschev, A. (1982). J. Solid State Chem.
41:244.
126. Bowden, F. P., Thomas, P. H. (1954). Proc. R. Soc. London A223:29–40.127. Fox, P. G., Soria-Ruiz, J. (1970). Proc. R. Soc. London A317:79–91.128. Urakaev, F., Boldyrev, V. V., Regel, V. R., Pozdnyakov, O. E. (1977). Kinet. Cat.
18:350–358.
129. Weichert, R., Schonert, K. (1994). J. Mech. Phys. Solids 22:127–133.130. Ermakov, A. E., Yurchikov, E. E., Barinov, V. V. (1981). Phys. Metals Metallogr.
52(6):50–58.
131. Bridgeman, P. (1931). The Physics of High Pressure. London: Bell.132. Larsen, H. A., Drickamer, H. G. (1957). J. Phys. Chem. 61:1249–1254.133. Ivanov, E., Neverov, V., Jitnikov, N., Suppes, V. (1998). Mater. Lett. 7:57–60.
134. Ivanov, E., Golubkova, G. V., Grigorieva, T. F. (1990). Reacti. Solids 8:73–76.135. Aizawa, T., Kuji, T., Nakano, H. (1999). J. Alloys Compounds 291:248–253.136. Segal, V. M. (1995). Mater. Sci. Eng. A197:157–164.137. Lowe, T. C., Valiev, R. Z., eds. (2000). Investigations and Applications of Severe Plastic
Deformation. NATO Science series, 3. High Technology. Vol. 80. Dordrecht, TheNetherlands: Kluwer.
138. Valiev, R. Z., Islamgaliev, R. K., Alexandrov, I. V. (2000). Prog. Mater. Sci. 45:103–
189.139. Bokhonov, B., Konstanchuk, I., Ivanov, E., Boldyrev, V. V. (1992). J. Alloys Com-
pounds 187:207–214.
140. Butyagin, P. Y. (1999). Colloid J. 61:537–544.141. Fujiwara, Y., Isobe, T., Senna, M., Tanaka, J. (1999). J. Phys. Chem. 103:9842–9846.142. Fujiwara, H., Minamoto, Y. (2000). Polym. Bull. 45(2):137–144.
143. Matteazzi, P., Basset, D., Miani, F., Le Caer, G. (1993). Nanostructured Mater. 2:217–229.
144. Matteazzi, P., Le Caer, G. (1991). J. Am. Ceram. Soc. 74:1382–1390.145. Matteazzi, P., Le Caer, G. (1992). J. Alloys. Compounds 187:305–315.
MD: SURYANARAYANA, JOB: 03320, PAGE: 382
4103-X_Suryanarayana_Ch14_R2_071504
Chapter 14382

146. Pardavi-Horvath, M., Takacs, L. (1995). Scripta Metall. Mater. 33:1731–1740.147. Suryanarayana, C. (1995). Int. Mater. Rev. 40:41–64.148. Milham, C. D. (1993). In: Henein, H., Oki, T., eds. Processing Materials for Properties.
Warrendale, PA: TMS, pp. 449–452.149. Corrias, A., Ennas, G., Musinu, A., Paschina, G., Zedda, D. (1997). J. Mater. Res. 12:
2767–2772.
150. Chen, Y., Ninham, B. W., Ogarev, V. (1995). Scripta Metall. Mater. 32:19–22.151. Millet, P., Calka, A., Ninham, B. W. (1994). J. Mater. Sci. Lett. 13:1428–1429.152. Chen, Y., Hwang, T., Marsh, M., Williams, J. S. (1997). Metall. Mater. Trans.
28A:1115–1121.
MD: SURYANARAYANA, JOB: 03320, PAGE: 383
4103-X_Suryanarayana_Ch14_R2_071504
Mechanochemical Processing 383

4103-X_Suryanarayana_Ch14_R2_071504
MD: SURYANARAYANA, JOB: 03320, PAGE: 384

15
Powder Contamination
15.1 INTRODUCTION
A major concern in the processing of metal powders by mechanical alloying/milling(MA/MM) is the nature and amount of impurities that get incorporated into thepowder and contaminate it. The small size of the powder particles and consequentavailability of large surface area, formation of fresh surfaces during milling, and wearand tear of the milling tools all contribute to contamination of the powder. Thesefactors are in addition to the purity of the starting raw materials and the millingconditions employed (especially the milling atmosphere). Thus, it appears that powdercontamination is an inherent drawback of the technique and that the milled powderwill be always contaminated with impurities unless special precautions are taken toavoid or minimize it.
As mentioned earlier, MA involves loading the constituent powder particles,grinding medium, and process control agent (PCA, at least in some instances) in amilling container and subjecting this mix to intense mechanical action. In the earlystages of MA, the metal powder generally coats the surface of the grinding mediumand the inner walls of the container. This was expected to prevent contamination ofthe powder from the milling tools and the container. Therefore, no attention was paid,especially in the early years of MA, to the problem of powder contamination.However, when different results were reported by various groups of researchers onthe same alloy system, and apparently under identical milling conditions, it wasrecognized that powder contamination to different levels could be the reason for thedifferences in the obtained results. This problem is now recognized to be ubiquitousand is frequently reported in many investigations, especially when reactive metals suchas titanium and zirconium are milled. The magnitude of powder contamination
4103-X_Suryanarayana_Ch15_R2_080304
MD: SURYANARAYANA, JOB: 03320, PAGE: 385
385

appears to depend on the time of milling, intensity of milling, atmosphere in which thepowder is milled, nature and size of the milling medium, and difference in the strength/hardness of the powder and the milling medium.
About 1–4 wt% Fe has been found to be normally present in most of the powdersmilled with steel grinding medium, but amounts as large as 20 at% Fe in a W-Cmixture milled for 310 h and 33 at% Fe in pure W milled for 50 h in a SPEX mill werealso reported [1]. In fact, amounts as large as 60 at% Fe were reported during millingof a W-5 wt% Ni alloy for 60 h in a SPEX mill [2]. These are very high levels ofcontamination. Similarly, large amounts of oxygen (up to 44.8 at%) [3] and nitrogen(up to 33 at%) have also been reported in Al-6 at%Ti powders milled for 1300 h in alow-energy ball mill and in a Ti-5 at%Al powder milled in a SPEX mill for 30 h,respectively [4]. Experimentally determined levels of powder contamination duringmilling of different types of powder are summarized in Table 15.1. The type of mill,ball-to-powder weight ratio (BPR), and milling time employed are also listed, sincethese parameters determine the magnitude of contamination. The major impuritieslisted are oxygen and nitrogen, mainly from the atmosphere and/or PCAs used, andiron from the steel grinding medium and the steel container. The levels of carbon,chromium, and other metallic impurities are also listed in some cases, wheneverreported.
The presence of contamination in the powders is suspected/inferred when (1) anunexpected phase appears to be present in the milled powder (of course, this could be agenuine metastable phase) or (2) when the lattice parameter(s) of the solid solution orintermetallic phases are substantially different from the values predicted or reported inthe literature. The difference in the lattice parameters could be due to formation ofsupersaturated solid solutions or increased homogeneity ranges of intermetallic phasesalso. However, since the presence of impurities can also cause similar effects, oneshould be aware of this possibility.
The presence of impurities in the powder can be easily detected if the amount ofthe contaminant or contaminated product is reasonably large. In that case, shifts inpeak positions and/or appearance of new diffraction peaks in the X-ray diffraction(XRD) patterns occur indicating either a change in lattice spacing or formation of anew phase. On the other hand, if the amount of impurities is small, specializedtechniques may be necessary for their detection. Furthermore, techniques like X-rayphotoelectron spectroscopy (XPS) can give additional information about the bondingstate of the impurity atoms [50].
15.2 SOURCES OF CONTAMINATION
Contamination of milled metal powders can be traced to (1) chemical purity of thestarting powders, (2) milling atmosphere, (3) milling equipment (milling container andgrinding medium), and (4) process control agents added to the powders during milling.Contamination from source (1) can be either substitutional or interstitial in nature,whereas contamination from source (2) is essentially interstitial in nature and thatfrom (3) is mainly substitutional, even though carbon from the steel milling equipmentcan be an interstitial impurity. Contamination from the PCA essentially leads tointerstitial contamination, since the PCAs used are mostly organic compoundscontaining carbon, oxygen, and nitrogen (see Chapter 5). Irrespective of whether
MD: SURYANARAYANA, JOB: 03320, PAGE: 386
4103-X_Suryanarayana_Ch15_R2_080304
Chapter 15386

the impurities are substitutional or interstitial in nature, their amount increases withmilling time and with increasing BPR, and reaches a saturation value. Since thepowder particles become finer with milling time, their surface area increases andconsequently the amount of contamination increases. Similarly, with increasing BPR,the wear and tear of the grinding medium increases and consequently contaminationalso is higher. However, when particle refinement reaches the limiting value and asteady-state condition is achieved, the level of contamination does not increase anyfurther.
The main difficulty in the MA of reactive metals has been the absorption ofoxygen and nitrogen from the continuous exposure of fresh metal surfaces to theatmosphere in the milling container. Even though presence of interstitial impuritiessuch as oxygen and nitrogen is generally deleterious to most metals, their presencebeyond certain limits is responsible for the formation of undesirable phases andconsequent degradation of their mechanical properties. Therefore, maximum impuritylevels are generally specified for acceptable microstructural and mechanical properties.For example, the suggested maximal level of combined nitrogen and oxygen in Ti-6wt% Al-4 wt% V is 2500 ppm and that in TiAl-based alloys is only 1000 ppm.Substantial amounts of nitrogen and oxygen (the amount of nitrogen is much morethan oxygen) are picked up during milling of titanium and zirconium alloys, and thepresence of these impurities has been shown to lead to a change in the constitution ofthe alloys [51–53].
Formation of an amorphous phase in Ti-Al alloys and a crystalline phase with aface-centered cubic (fcc) structure in powders milled beyond the formation of theamorphous phase have been attributed to the presence of large quantities of nitrogenin these alloys [54]. Again, milling of a Cu-50 at% Cr powder blend in a pure argonatmosphere was shown to result in the complete formation of a bcc solid solution. Onthe other hand, if argon (containing air) was used, then the bcc solid solutionformation did not go to completion [55]. Similarly, it was shown that milling of theNb3Al intermetallic in a SPEX mill produced the expected bcc solid solution phaseafter milling the powder for 3 h. But when milling was conducted in an improperlysealed vial, an amorphous phase was produced after 10 h, which on subsequent heattreatment transformed to the crystalline niobium nitride phase. This suggests that theamorphous phase in this system had formed because of nitrogen contamination of thepowder during milling [56].
15.2.1 Starting Powders
The starting powders for MA are mostly purchased from vendors, who normally storethem in appropriate containers and sometimes under protective atmospheres. How-ever, since the powders have a large surface area, some amount of nitrogen, oxygen,and water vapor gets adsorbed onto their surfaces. This problem becomes moreserious with the more reactive powders and also with finer powders, since the surfacearea is now much larger and therefore higher amounts of contaminants are adsorbed.Great care must be taken to choose the proper type of powder particles; coarserpowder particles are to be preferred if the milling conditions permit it. It is useful toremember that the impurity content of prealloyed powders is usually less than that inblended elemental powders. The interstitial impurity levels increase further when thesepowders are subjected to MA/MM. Thus, the total impurity content in the milled
MD: SURYANARAYANA, JOB: 03320, PAGE: 387
4103-X_Suryanarayana_Ch15_R2_080304
Powder Contamination 387

MD: SURYANARAYANA, JOB: 03320, PAGE: 388
4103-X_Suryanarayana_Ch15_R2_080304
Table
15.1
Po
wd
erC
on
tam
inati
on
Du
rin
gM
ech
an
ical
Allo
yin
ga
Millin
gM
illin
gC
on
tam
inati
on
level
(at%
)
Syst
emM
ill
med
ium
BP
Rti
me
(h)
Oxygen
Nit
rogen
Iro
nR
ef.
Al
SP
EX
8000
Hard
ened
stee
l
4:1
32
——
55
Al-
20C
u-1
5F
eP
lan
etary
ball
mill
QM
-1S
PH
ard
ened
stee
l10:1
300
——
1.2
6
Al-
5F
e-5N
dH
igh
-sp
eed
shak
erm
ill
Ste
el—
240
——
97
Al-
6T
iA
ttri
tor
Ste
el—
1300
44.8
8.2
50.5
23
Al-
12T
iA
ttri
tor
Ste
el—
400
27.4
22.6
0.0
73
Al-
12T
iA
ttri
tor
Ste
el—
1300
36.5
16.3
0.1
13
Al-
Ti
Pla
net
ary
ball
mill
Hard
ened
stee
l60:1
120
——
1.5
an
d0.3
Cr
8
BF
rits
chP
5S
S10:1
15
——
69
CR
etsc
hP
M4000
pla
net
ary
ball
mill
WC
——
——
3(W
,Co
)10
Co
-BF
rits
chP
5S
S10:1
——
—2
9C
uS
PE
X8000
——
V1
11
Cu
Pla
net
ary
ball
mill
G5
Tem
per
edst
eel
—240
——
14.2
Fe,
1.0
Cr
12
Cu
-1vo
l%A
l 2O
3
HE
mill
1.2
13
Cu
-43.1
Fe
Pla
net
ary
ball
mill
G5
Tem
per
edst
eel
—240
——
21.9
Fe,
V2.8
Cr
12
Cu
44N
b42S
n14
Lab
ball
mill
WC
-Co
50:1
24
13.5
2.4
14
Cu
-Ta
Fri
tsch
P5
SS
4:1
30
——
4-5
an
d1-2
Cr
15
Chapter 15388

MD: SURYANARAYANA, JOB: 03320, PAGE: 389
4103-X_Suryanarayana_Ch15_R2_080304
Cu
-50Z
rS
PE
X8000
440C
SS
10:1
13
3.3
—0.2
516
Cu
Zr
SP
EX
8000
WC
or
440C
SS
10:1
13
(WC
via
l)(s
teel
)2.3
—— 4.6
16
Fe-
50C
oS
PE
X8000
Ste
el49
——
2C
r17
Fe-
6N
b-1
2B
—H
ard
ened
stee
l5:1
220
(cycl
oh
exan
eas
PC
A)
——
11
wt%
C18
IrS
PE
X8000
Hard
ened
stee
l
4:1
8—
—5
5
Mo
Net
zsch
1S
att
rito
rS
teel
100:1
33
(180
h)
28
(320
h)
15
(180
h)
19
Mo
-66.7
Si
Pla
net
ary
ball
mill
G5
Tem
per
edst
eel
—48
——
10.5
20
Nb
-Al
Pla
net
ary
ball
mill
——
60
——
321
Nb
-92B
eS
PE
X8004
WC
7:1
65-6
22
Nb
-25G
eS
PE
X8000
——
13
10
—1.5
23
Ni
SP
EX
8000
——
13
11
Ni-
25A
lS
PE
X8000
——
40
——
424
Ni-
Al-
X(X
=F
e,C
r)F
rits
chP
5W
CH
ard
ened
stee
l
10:1
— —— —
—18
25
Ni-
40N
bF
rits
chP
610:1
100
2–3
26
Ni-
40N
bS
PE
X8000
52100
stee
l3:1
14
(air
)13.4
2.1
2.3
27
Ni-
40N
bS
PE
X8000
52100
stee
l3:1
11
(hel
ium
)2.0
1.9
5.1
27
Ni-
80.5
W24
——
6.4
28
Ni-
30Z
rV
ibra
tory
ball
mill
440C
SS
7–81:1
32
——
3.7
29
Ni-
Zr
Fri
tsch
P7
Hard
ened
stee
l—
20
——
230
Am
-Ni 6
8Z
r 32
+Z
rF
rits
chP
7H
ard
ened
stee
l—
20
——
530
Powder Contamination 389

MD: SURYANARAYANA, JOB: 03320, PAGE: 390
4103-X_Suryanarayana_Ch15_R2_080304
NiZ
rF
rits
chP
5S
S30:1
10
(nit
rogen
)—
—12
31
100
(arg
on
)6
Pd
-16Z
rS
PE
X8000
——
24
1.1
0.5
—32
Pd
-23Z
rS
PE
X8000
——
24
2.4
0.2
—32
Ru
SP
EX
8000
Hard
ened
stee
l—
8(a
rgo
n)
16
(arg
on
)32
(arg
on
)
——
3 510
33
Ru
SP
EX
8000
Hard
ened
stee
l4:1
8(m
eth
an
e)16
(met
han
e)32
(met
han
e)
——
3 822
34
Ru
-50
Al
SP
EX
8000
Hard
ened
stee
l
10:1
35
50
15
35
35
Ru
-20
CS
PE
X8000
Hard
ened
stee
l—
8(a
rgo
n)
16
(arg
on
)
32
(arg
on
)
——
0.3
1.5
18
34
Si
Un
i-B
all
mill
——
300
(nit
rogen
)16.6
3b
—0.9
5b
36
Si 3
N4
Pla
net
ary
ball
mill
Ret
sch
PM
4
WC
-Co
—195
18.8
—13.4 (W
,Co
);11.2
C
37
Ta-3
0A
lR
od
mill
SS
36:1
400
——
538
Ball
mill
400
16
Ti
Vib
rati
on
al
ball
mill
SS
45–90:1
(nit
rogen
)—
—8.8
an
d3.0
Cr
39
Ti-
5A
lS
PE
X8000
Hard
ened
stee
l
10:1
30
21
33
—4
Ti-
50A
lS
PE
X8000
Hard
ened
stee
l10:1
70
10
26
—4
Ti-
60A
lF
rits
chP
5—
10:1
70
6.7
7.4
—40
Table
15.1
Co
nti
nu
ed
Millin
gM
illin
gC
on
tam
inati
on
level
(at%
)
Syst
emM
ill
med
ium
BP
Rti
me
(h)
Oxygen
Nit
rogen
Iro
nR
ef.
Chapter 15390

MD: SURYANARAYANA, JOB: 03320, PAGE: 391
4103-X_Suryanarayana_Ch15_R2_080304
Ti-
20C
u-
24N
i-4S
i-2B
SP
EX
8000
Hard
ened
stee
l5:1
24
2.9
—0.3
541
Ti-
37.5
Si
SP
EX
8000
Hard
ened
stee
l
5:1
24
4.4
1.8
—42
V-C
Pla
net
ary
ball
mill
Hard
ened
stee
l—
70
——
8.6
(hig
hen
ergy)
43
0.6
(lo
w
ener
gy)
WS
PE
Xm
ill
440C
SS
4:1
50
——
33
44
W-C
Ball
mill
Hard
ened
SS
30:1
310
——
20
1
W-2
4.3
Cu
Fri
tsch
P5
Ste
el—
140–180
——
50.5
45
W-4
9.1
Cu
Fri
tsch
P5
Ste
el—
140–180
——
47.2
45
W-5
Ni
SP
EX
8000
Hard
ened
stee
l11:1
60
——
60
2
W-3
0N
iS
PE
X8000
Hard
ened
stee
l11:1
60
——
50
2
W-4
0N
iS
PE
X8000
Hard
ened
stee
l11:1
60
——
40
2
Zr
Un
i-B
all
mill
——
50
(am
mo
nia
)—
—10
46
250
(nit
rogen
)1.5
Zr-
50C
uH
ori
zon
tal
ball
mill
SS
20:1
400
3—
—47
Zr-
30C
u-
10A
l-5N
iR
etsc
hP
M4000
pla
net
ary
ball
mill
Hard
ened
stee
l14:1
100–200
1.5
–2
—0.5
48
Zr-
30N
iF
rits
chP
5S
S—
35
——
9.9
49
Zr-
70N
iF
rits
chP
5S
S—
120
——
13.8
49
aA
llallo
yco
mp
osi
tio
ns
are
exp
ress
edin
ato
mic
per
cen
t,u
nle
ssin
dic
ate
do
ther
wis
e.b
Aft
erM
Ain
nit
rogen
atm
osp
her
ep
lus
an
nea
lin
gfo
r10
hat
800jC
.
Powder Contamination 391
MD: SURYANARAYANA, JOB: 03320, PAGE: 392
4103-X_Suryanarayana_Ch15_R2_080304
powder will be the sum of the initial impurity content and that which was acquiredduring the milling operation. If the total impurity content is below the solid solubilitylevel in the metal powder that is being milled, then one would notice a change in thelattice parameter of the metal as evidenced by a change in the position of the metaldiffraction peaks in the XRD pattern. If the impurity content is sufficiently large, thenpeaks corresponding to a new interstitial phase may appear. For example, the presenceof a cubic Mo2N phase was reported in molybdenum powder mechanically alloyedin a nitrogen atmosphere [19,57] and the cubic TiN phase in Ti-Al alloys mechanicallyalloyed in nominally pure argon atmosphere [52,54].
15.2.2 Milling Atmosphere
The milling atmosphere is perhaps the most important factor that contributes to thecontamination of mechanically alloyed powders. The importance of maintaining aclean and noncontaminating environment and gas-tight seals for the container lidduring milling of reactive metal powders cannot be overemphasized. (This contam-ination, which is unwanted, should be distinguished from intentional milling of metalpowders in reactive atmospheres to synthesize nitrides, carbides, oxides, and so forth).The powders are normally loaded into and unloaded from the milling containers in aglove box that is maintained under a protective argon atmosphere. Care must be takento ensure that the glove box is purged with argon gas a few times prior to loading thepowder into the container. It is also essential that the powder not be subsequentlyexposed to the ambient atmosphere.
A general practice is to mill the powders in an inert atmosphere, such as argon, tominimize powder contamination. It has been reported that even repeated flushing withargon gas does not remove oxygen and nitrogen adsorbed on the powder and mill toolsurfaces, and that some trace contaminant species remain in even high-purity argon[58]. It is therefore the overall nitrogen and oxygen contents of the atmosphere sealedwithin the container that are relevant.
The integrity of the milling container seal preventing access of external atmo-sphere into the powder being milled is also very important. It has been observed that ifthe container is not properly sealed, the atmosphere surrounding the container,usually air (containing essentially nitrogen and oxygen), leaks into the containerand contaminates the powder. Thus, when reactive metals like titanium and zirconiumare milled in improperly sealed containers, the powders are contaminated withnitrogen and oxygen. In most cases, the nitrogen pickup has been found to be muchmore than that of oxygen. The formation of a cubic phase at long times of millingtitanium alloys has been attributed to the formation of titanium nitride having a cubicstructure [54]. In fact, the high levels of oxygen and nitrogen reported in powdersmilled under argon atmosphere could only be explained by leakage of air through theseals into the container [59]. Thus, the integrity of the milling container seals seems tobe most crucial in minimizing or avoiding contamination of metal powders and inproducing clean material.
Pickup of impurities during milling would reduce the pressure within thecontainer allowing the outside atmosphere to continuously leak into the containerthrough an ineffective seal. Thus, it has been noted experimentally that difficultyin opening the container lid, due to the vacuum present inside, is an indication thatcontamination of the powder is minimal.
Chapter 15392

The milling containers are sometimes opened before the milling operation iscomplete so that one could follow the different stages of alloying and also follow thechanges in the lattice parameter(s), crystallite size, and lattice strain as a function ofmilling time. Even though small quantities of the powders are generally taken outinside a glove box, frequent opening of the milling container could contaminate thepowder. In fact, it has been reported [19] that the uptake of iron and oxygen impuritiesin the powder correlated well with the number of interruptions (opening of thecontainer lid) of the milling process. Furthermore, the amount of iron impuritypresent in the powder appears to be coupled with that of oxygen. That is, the amountof oxygen, and consequently iron, is higher when the powder is milled in an oxygenatmosphere than when it is milled in an argon atmosphere (Fig. 15.1) [19]. On the otherhand, uptake of nitrogen during milling seems to be directly related to milling time andnot dependent on the number of interruptions.
15.2.3 Milling Equipment
During MA, the powder particles get trapped between the grinding media and undergosevere plastic deformation; fresh surfaces are created due to fracture of the powderparticles. In addition, collisions occur between the grinding medium and the vial, andalso among the grinding balls. All these effects cause wear and tear of the grinding
MD: SURYANARAYANA, JOB: 03320, PAGE: 393
4103-X_Suryanarayana_Ch15_R2_080304
Figure 15.1 (a) Iron content of the molybdenum samples milled under different atmo-spheres, as indicated in the figure, vs. the number of interruptions, N. (b) The corresponding
dependence of the oxygen content on the number of interruptions. The horizontal dashedline indicates the approximate, apparent asymptote for oxygen uptake (about 33 at%).
Powder Contamination 393

medium and the vial, resulting in the incorporation of these impurities into thepowder. It is essentially the metallic impurities, e.g., Fe from the steel containersand W and Co from the WC containers, that get incorporated into the powder andcontaminate it. The extent of contamination increases with increasing milling energy,use of higher BPR, higher speed of milling, and so forth. Even though it is well knownthat adsorption of elements takes place faster at higher temperatures, there has notbeen any report on the levels of contamination of powders milled at differenttemperatures.
Figure 15.2 shows the increase in iron contamination when blended elementalAl-Ta powders corresponding to the composition of Al-50 at% Ta were milled in aplanetary-type ball mill. It may be noted that the iron contamination increases withmilling time. Furthermore, it may be noted that the level of contamination increaseswith increasing BPR. Whereas the maximal iron content was only about<1 at% whenmilled at a BPR of 36:1, it was as much as 5 at% when milled at a BPR of 108:1 [60].
The extent of contamination could also be different depending on whether onestarts with prealloyed powders (mechanically disordered) or blended elementalpowders (mechanically alloyed). It was reported [61] that the amount of iron in themilled Al-50 at% Ta powder was about 1 at% when mechanically disordered(prealloyed powders), and only about 0.5 at% when mechanically alloyed (blendedelemental powders). In both the cases, the rod mill was used and a BPR of 36:1 wasused. It is normally expected that MA introduces more contamination due to thegeneration fresh surfaces and consequently large surface area of both the metalpowders. But surprisingly, the rate and amount of contamination were reported tobe higher for MA than for mechanical disordering (MD) (Fig. 15.3).
MD: SURYANARAYANA, JOB: 03320, PAGE: 394
4103-X_Suryanarayana_Ch15_R2_080304
Figure 15.2 Amount of iron impurity in the mechanically alloyed Al-50 at% Ta powder as afunction of milling time and BPR (36:1, 54:1, and 108:1) [60]. It may be noted that the iron
content increases with both milling time and BPR.
Chapter 15394

The type of mill also seems to be important in determining the magnitude ofcontamination of the milled powder. It has been reported [38] that during MA of Al-70at% Ta powders, the magnitude of iron contamination is higher in the ball mill than inthe rod mill (Fig. 15.4). Another point of interest is that the level of contaminationdecreases in the second and third runs. In this case, the powder is milled for the firsttime, and for the second and subsequent runs, the same grinding media and the vialsare used. Since the alloy powder is coated onto the grinding medium, thus preventingwear and tear, the amount of contamination is lower in later runs. Comparing theefficiency of obtaining clean powders using a SPEX and the Zoz Simoloyer mills, it wasnoted that the iron content in the milled Ag-70 at% Cu powder was less in the Zoz mill(Fig. 15.5) [62].
15.3 ELIMINATION/MINIMIZATION OF CONTAMINATION
Several attempts have been made in recent years to minimize powder contaminationduring MA. An important point to remember is that if the starting powders are highlypure, then the final product is going to be clean and pure, with minimal contaminationfrom other sources, provided that proper precautions were taken during milling. It isalso important to remember that all applications do not require ultraclean powdersand that the purity desired depends on the specific application. Nonetheless, it is agood practice to minimize powder contamination at every stage and to ensure thatadditional impurities are not picked up subsequently. We shall now discuss thedifferent ways of minimizing contamination by controlling the milling tools and/orthe atmosphere.
MD: SURYANARAYANA, JOB: 03320, PAGE: 395
4103-X_Suryanarayana_Ch15_R2_080304
Figure 15.3 The level of iron contamination in Al-50 at% Ta powder as a function ofmilling time and nature of the starting powder. The contamination level is higher when
mechanically disordered than when mechanically alloyed [61].
Powder Contamination 395

15.3.1 Milling Equipment
One way to minimize contamination from the grinding medium and the millingcontainer is to use the same material for the container and the grinding medium as thepowder being milled. Thus, one could use copper balls and copper container formilling copper and copper alloy powders [63]. In this case there will also be wear andtear of the grinding medium and this gets incorporated into the powder. Thus, even
MD: SURYANARAYANA, JOB: 03320, PAGE: 396
4103-X_Suryanarayana_Ch15_R2_080304
Figure 15.4 Level of iron contamination in the Al-70 at% Ta powder mechanically alloyedusing (a) rod mill and (b) ball mill. Note that the contamination level is less in the rod mill thanin the ball mill and that it is reduced in the second and third runs of the milling process in both
the mills [38].
Chapter 15396

though there is no ‘‘contamination,’’ the chemistry of the final powder will be differentfrom the starting powder; the metallic content in the final powder (from the containerand balls) would be higher than in the initial powder. This change in composition maybe tolerated if the desired phase has sufficient compositional homogeneity range. If itdoes not, the excess metal uptake must be compensated for. This can be done, if onehas prior knowledge of the extent of increase of the metallic content in the final powderor by conducting some preliminary experiments.
The above solution is possible in some cases, but in many cases it is difficult dueto the nonavailability of special milling tools (grinding media and containers). Theproblem is becoming more and more complex since the technique of MA is now beingapplied to a variety of materials such as metals, alloys, ceramics, composites [64], andpolymers [65,66], and it is almost impossible to get containers and grinding media of allthese types of materials. If a container of the same material to be milled is not available,then a thin adherent coating on the internal surface of the container (and also on thesurface of the grinding medium) with the material to be milled will minimizecontamination. Thus, as shown in Figure 15.4, the extent of iron contaminationduring milling of blended elemental Ta-Al powders is less in the second run and muchless in the third run [38]. The idea here is to mill the powder once, allowing the powderto be coated onto the grinding medium and the inner walls of the container. The milledloose powder is then discarded and a fresh batch of powder is milled, but with the oldgrinding media and container. If this operation is repeated several times, thencontamination due to the grinding medium and the vessel is likely to be minimal,provided that the powder does not cake up at the bottom of the vial and peel off.
In general, a simple rule for minimizing contamination from the millingcontainer and the grinding medium is that the container and grinding medium should
MD: SURYANARAYANA, JOB: 03320, PAGE: 397
4103-X_Suryanarayana_Ch15_R2_080304
Figure 15.5 Comparison of iron contamination when the Ag-70 at% Cu powder was milled
in the SPEX and Zoz Simoloyer mills. Note that the contamination is less in the ZozSimoloyer mill [62].
Powder Contamination 397

be harder and stronger than the powder being milled. Thus, in one study the reason forthe high amount of iron contamination during milling of tungsten and tungsten alloypowders is that a steel container and steel milling medium, which are much softer thantungsten, were used [2]. However, a disadvantage of using a very hard grindingmedium, such as tungsten carbide or Al2O3, during milling of very soft metal powdersis that these materials are brittle and so tend to break up or chip out, gettingincorporated into the powder and contaminating it. In fact, the amount incorporatedinto the powder can be so high that clear diffraction peaks from the contaminant couldbe observed in the XRD patterns of the milled powder [29].
Use of vacuum or an inert gas is desirable to prevent or minimize the powdercontamination. It has been reported that a Teflon seal could be used to prevent airfrom leaking from outside into the container [67].
15.3.2 Milling Atmosphere
Attempts have been made in the recent past to improve the container seal integrity toprevent the outside atmosphere from leaking inside. Goodwin and Ward-Close [68],using two different types of milling atmospheres, compared the powder contaminationlevels during milling of both prealloyed and blended elemental powders. In the firstatmosphere, referred to as AT1, a steel milling container was loaded in a glove boxcontaining research grade argon (99.995% pure) and the container was sealed using an‘‘O’’ ring of circular cross-section. In the second atmosphere, AT2, higher purity argon(guaranteed 99.998%), which is subsequently passed through moisture and oxygenfilter towers to further purify it, was used. Furthermore, the gasket used to obtain amore leak-tight seal was a flat neoprene one. The contamination levels obtained usingthese two types of atmosphere are listed in Table 15.2. It has been shown that bycareful control of the purity of the atmosphere and improvements of the seal quality,the interstitial contaminants in the titanium alloy could be reduced to as low as 100ppm of oxygen and 35 ppm of nitrogen [53]. With additional control of the atmospherethis could be reduced even further. This process, which was demonstrated on alaboratory scale, was subsequently scaled up. It was reported [58] that a large-scaleclean milling facility was developed at the Defence Evaluation and Research Agency,Farnborough, United Kingdom, which utilizes a proprietary design of a mill capable
MD: SURYANARAYANA, JOB: 03320, PAGE: 398
4103-X_Suryanarayana_Ch15_R2_080304
Table 15.2 Oxygen and Nitrogen Contents of Ti-24 Al-11 Nb (at%) PowdersMilled for 24 h in a SPEX Mill with a BPR of 4:1 and Using Two Different Types of
Atmospherea
Oxygencontent (wt%)
Nitrogencontent (wt%)
Powder (at%) AT1 AT2 AT1 AT2
Prealloyed
Ti-24Al-11Nb
3.6 0.10 6.8 0.015
Blended elementalTi-24Al-11Nb
4.8 0.48 7.6 0.035
a No PCA was used during milling [68].
Chapter 15398
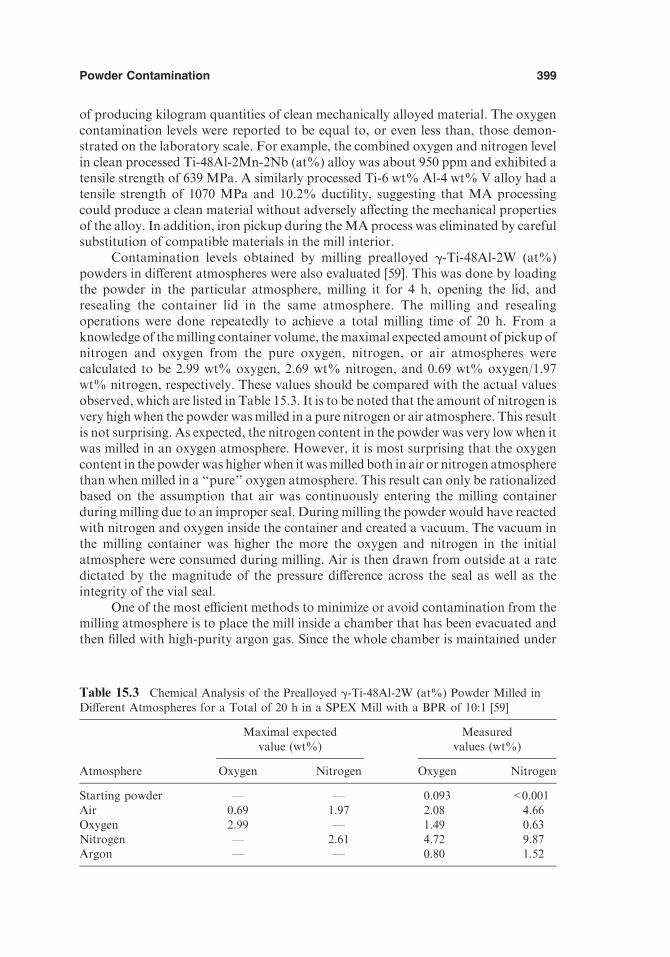
of producing kilogram quantities of clean mechanically alloyed material. The oxygencontamination levels were reported to be equal to, or even less than, those demon-strated on the laboratory scale. For example, the combined oxygen and nitrogen levelin clean processed Ti-48Al-2Mn-2Nb (at%) alloy was about 950 ppm and exhibited atensile strength of 639 MPa. A similarly processed Ti-6 wt% Al-4 wt% V alloy had atensile strength of 1070 MPa and 10.2% ductility, suggesting that MA processingcould produce a clean material without adversely affecting the mechanical propertiesof the alloy. In addition, iron pickup during the MA process was eliminated by carefulsubstitution of compatible materials in the mill interior.
Contamination levels obtained by milling prealloyed g-Ti-48Al-2W (at%)powders in different atmospheres were also evaluated [59]. This was done by loadingthe powder in the particular atmosphere, milling it for 4 h, opening the lid, andresealing the container lid in the same atmosphere. The milling and resealingoperations were done repeatedly to achieve a total milling time of 20 h. From aknowledge of the milling container volume, the maximal expected amount of pickup ofnitrogen and oxygen from the pure oxygen, nitrogen, or air atmospheres werecalculated to be 2.99 wt% oxygen, 2.69 wt% nitrogen, and 0.69 wt% oxygen/1.97wt% nitrogen, respectively. These values should be compared with the actual valuesobserved, which are listed in Table 15.3. It is to be noted that the amount of nitrogen isvery high when the powder was milled in a pure nitrogen or air atmosphere. This resultis not surprising. As expected, the nitrogen content in the powder was very low when itwas milled in an oxygen atmosphere. However, it is most surprising that the oxygencontent in the powder was higher when it was milled both in air or nitrogen atmospherethan when milled in a ‘‘pure’’ oxygen atmosphere. This result can only be rationalizedbased on the assumption that air was continuously entering the milling containerduring milling due to an improper seal. During milling the powder would have reactedwith nitrogen and oxygen inside the container and created a vacuum. The vacuum inthe milling container was higher the more the oxygen and nitrogen in the initialatmosphere were consumed during milling. Air is then drawn from outside at a ratedictated by the magnitude of the pressure difference across the seal as well as theintegrity of the vial seal.
One of the most efficient methods to minimize or avoid contamination from themilling atmosphere is to place the mill inside a chamber that has been evacuated andthen filled with high-purity argon gas. Since the whole chamber is maintained under
MD: SURYANARAYANA, JOB: 03320, PAGE: 399
4103-X_Suryanarayana_Ch15_R2_080304
Table 15.3 Chemical Analysis of the Prealloyed g-Ti-48Al-2W (at%) Powder Milled in
Different Atmospheres for a Total of 20 h in a SPEX Mill with a BPR of 10:1 [59]
Maximal expectedvalue (wt%)
Measuredvalues (wt%)
Atmosphere Oxygen Nitrogen Oxygen Nitrogen
Starting powder — — 0.093 <0.001
Air 0.69 1.97 2.08 4.66Oxygen 2.99 — 1.49 0.63Nitrogen — 2.61 4.72 9.87Argon — — 0.80 1.52
Powder Contamination 399

argon gas atmosphere (continuously purified to keep oxygen and water vapor below1 ppm each) and the container is inside the mill, which is inside the chamber,contamination from the atmosphere is minimal. Thus, Klassen et al. [69] reportedthat the oxygen content in their milled Ti51Al49 powder was only 0.30 wt% aftermilling for 100 h in a Fritsch P5 mill that was enclosed inside a glove box maintainedunder argon atmosphere. Iron contamination from the wear and tear of the millingtools, of course, could not be avoided. They reported about 1.4 at% Fe, but only 0.3at% oxygen and 0.12 at% nitrogen, in a Ti-45Al-2.4Si (at%) powder processed in thisway [70].
15.3.3 Process Control Agent
Contamination from PCAs is perhaps the most ubiquitous. Since most of the PCAsused are organic compounds, which have low melting and boiling points, theydecompose during milling due to the heat generated. The decomposition productsconsisting of carbon, oxygen, nitrogen, and hydrogen react with the metal atoms andform undesirable carbides, oxides, nitrides, and so forth. For example, use ofNopcowax 22-DS during milling of aluminum powder in a SPEX mill has resultedin the formation of oxide and carbide dispersoids [71]. Formation of carbide andhydride phases was reported during the milling of Ti-Al powders using hexane as aPCA [72]. Formation of Fe3O4 and Fe3C contaminants was reported during milling ofCu-Fe powders with ethanol as a PCA [12]. Similarly, other PCAs can introducedifferent types and amounts of impurities into the milled material. Mishurda et al. [73]studied the effect of several PCA’s on Fe and interstitial contamination during millingof prealloyed Ti-48Al-2W (at%) powder in a SPEX mill. The results of contamination,summarized in Table 15.4, show that boric acid and borax were quite effective inreducing the iron contamination from 1.04 wt% (when no PCA was used) to 0.44 wt%and 0.26 wt%, respectively. Use of a vial that was seasoned twice (meaning that thepowder was milled in the container using a particular grinding medium, during which
MD: SURYANARAYANA, JOB: 03320, PAGE: 400
4103-X_Suryanarayana_Ch15_R2_080304
Table 15.4 Chemical Analysis (wt%) of Prealloyed Ti-48Al-2W (at%) Powder Milled for24 h in a SPEX Mill Using Different PCA’s [73]
Chemical composition (wt%)
Condition PCA Iron Carbon Oxygen Nitrogen
Gas atomized(as received)
— 0.08 0.02 0.084 0.006
Milled None 1.04 0.08 1.81 5.09
Seasoneda 0.46 0.03 1.60 4.82Milled Stearic acid 0.78 0.78 1.79 4.82
Seasoned 0.43 0.85 1.74 4.06Milled Boric acid 0.44 0.08 1.28 0.41
Seasoned 0.06 0.03 1.32 0.71Milled Borax 0.26 0.02 1.35 1.20
Seasoned 0.09 0.03 1.46 1.47
a ‘‘Seasoned’’ means that the powder coated the grinding medium during the first run.
Chapter 15400

time the powder coats the grinding medium; this powder was subsequently discardedand the same set of milling container and grinding medium was again used) resulted ineven lower values of iron contamination—0.06 wt% with boric acid and 0.09 wt%with borax. Similarly, it was shown [12] that milling of Cu-Fe alloy powders withoutany PCA introduced considerable contamination from the steel milling tools. Thisreached as much as 21.9 at% Fe and 2.8 at% Cr for a Cu-43.1 at% Fe composition.However, when powder of the same composition was milled under identical con-ditions, but with ethanol as a PCA, the contamination was found to be much less, i.e.,2.9 wt% Fe and under 0.1 wt% Cr. This has been explained on the basis of decreasedcold welding between the milled powder and the balls and milling container walls whenthe PCA was used. Thus, a proper choice of PCA can substantially reduce the powdercontamination. Of course, the best situation would be not to use PCA at all, if it couldbe avoided.
It is also important to remember that cross-contamination could occur if acontainer that was used earlier to mill some powder is used again to mill anotherpowder without having undergone proper cleaning.
Another way of minimizing powder contamination is to control the milling time,ensuring of course that steady-state conditions were reached. If one knows a prioriwhat phase is desired in the milled powder, then milling can be stopped once thatphase has been obtained in the powder. Since powder contamination increases withprolonged milling time, it is advisable not to continue milling the powder beyond thetime required. A case in point is that formation of the nitride contaminant phase in Ti-Al alloys could be avoided if milling were stopped after the formation of theamorphous phase [54].
As pointed out earlier [19], the number of interruptions also increases the level ofcontamination. Accordingly, it was suggested that it is desirable to conduct the millingoperation without opening the vial in between; this minimizes the powder contamination.
In conclusion, it may be mentioned that to minimize powder contamination thefollowing steps may be followed:
1. Use milling tools that are harder than the powder being milled.2. Use grinding media and vials that have the same chemical composition, at
least the major component, as the powder being milled.3. Avoid using a PCA so that cold welding may increase. This will minimize
fracturing of the powder particles; consequently, the surface area of thepowder particles is smaller.
4. Minimize the number of interruptions. Continuous milling without open-ing the vial will also minimize powder contamination.
The level of contamination may be different under different processing con-ditions and is dependent on type of mill, intensity of milling, nature of the powder,nature of the grinding medium and container, ambient atmosphere, BPR, temperatureof milling, seal integrity, and others. Although not reported by anyone so far, millingat low temperatures (e.g., cryomilling) could certainly reduce the levels of powdercontamination. Claims have been made in the literature about the superiority ofcertain mills and practices over others [62]. However, systematic investigations onmilling the same powder and under identical conditions in different mills andevaluating the contamination levels have not been undertaken; and this appears tobe an important aspect of the production of clean powders.
MD: SURYANARAYANA, JOB: 03320, PAGE: 401
4103-X_Suryanarayana_Ch15_R2_080304
Powder Contamination 401

REFERENCES
1. Wang, G. M., Campbell, S. J., Calka, A., Kaczmarek, W. A. (1997). J. Mater. Sci.32:1461–1467.
2. Courtney, T. H., Wang, Z. (1992). Scripta Metall. Mater. 27:777–782.
3. Saji, S., Abe, S., Matsumoto, K. (1992). Mater. Sci. For. 88–90:367–374.4. Guo, W., Martelli, S., Padella, F., Magini, M., Burgio, N., Paradiso, E., Franzoni, U.
(1992). Mater. Sci. For. 88–90:139–146.
5. Eckert, J., Holzer, J. C., Krill, C. E. III, Johnson, W. L. (1992). Mater. Sci. For. 88–90:505–512.
6. Zhang, F. X., Wang, W. K. (1996). J. Alloys Compounds 240:256–260.
7. Cardoso, K. R., Garcia-Escorial, A., Botta, W. J., Lieblich, M. (2001). Mater. Sci. For.360–362:161–166.
8. Fan, G. J., Gao, W. N., Quan, M. X., Hu, Z. Q. (1995). Mater. Lett. 23:33–37.9. Corrias, A., Ennas, G., Marongiu, G., Musinu, A., Paschina, G. (1993). J. Mater. Res.
8:1327–1333.10. Hermann, H., Gruner, W., Mattern, N., Bauer, H.-D., Fugaciu, F., Schubert, Th. (1998).
Mater. Sci. For. 269–272:193–198.
11. Shen, T. D., Koch, C. C. (1996). Acta Mater. 44:753–761.12. Gaffet, E., Harmelin, M., Faudot, F. (1993). J. Alloys Compounds 194:23–30.13. Correia, J. B., Marques, M. T., Oliveira, M. M., Matteazzi, P. (2001). Mater. Sci. For.
360–362:241–246.14. Inoue, A., Kimura, H. M., Matsuki, K., Masumoto, T. (1987). J. Mater. Sci. Lett. 6:
979–981.15. Fukunaga, T., Nakamura, K., Suzuki, K., Mizutani, U. (1990). J. Non-Cryst. Solids 117–
118:700–703.16. Jang, J. S. C., Koch, C. C. (1989). Scripta Metall. 23:1805–1810.17. Gonzalez, G., Sagarzazu, A., Villalba, R., Ochoa, J., D’Onofrio, L. (2001). Mater. Sci.
For. 360–362:349–354.18. Caamano, Z., Perez, G., Zamora, L. E., Surinach, S., Munoz, J. S., Baro, M. D. (2001).
J. Non-Cryst. Solids 287:15–19.
19. Lucks, I., Lamparter, P., Mittemeijer, E. J. (2001). Acta Mater. 49:2419–2428.20. Gaffet, E., Malhouroux-Gaffet, N. (1994). J. Alloys Compounds 205:27–34.21. Hellstern, E., Schultz, L., Bormann, R., Lee, D. (1988). Appl. Phys. Lett. 53:1399–1401.
22. Di, L. M., Bakker, H. (1991). J. Phys. C: Condens. Matter. 3:9319–9326.23. Kenik, E. A., Bayuzick, R. J., Kim, M. S., Koch, C. C. (1987). Scripta Metall. 21:
1137–1142.24. Cardellini, F., Contini, V., Mazzone, G. (1995). Scripta Metall. Mater. 32:641–646.
25. Murty, B. S., Joardar, J., Pabi, S. K. (1996). Nanostructured Mater. 7:691–697.26. Schumacher, P., Enayati, M. H., Cantor, B. (1999). Mater. Sci. For. 312–314:351–356.27. Koch, C. C., Cavin, O. B., McKamey, C. G., Scarbrough, J. O. (1983). Appl. Phys. Lett.
43:1017–1019.28. Mi, S., Courtney, T. H. (1998). Scripta Mater. 38:637–644.29. Haruyama, O., Asahi, N. (1992). Mater. Sci. For. 88–90:333–338.
30. Weeber, A. W., Bakker, H. (1988). J. Phys. F: Metal Phys. 18:1359–1369.31. Aoki, K., Memezawa, A., Masumoto, T. (1993). J. Mater Res. 8:307–313.32. Krill, C. E., Klein, R., Janes, S., Birringer, R. (1995). Mater. Sci. For. 179–181:443–448.33. Hellstern, E., Fecht, H. J., Fu, Z., Johnson, W. L. (1989). J. Appl. Phys. 65:305–310.
34. Eckert, J., Holzer, J. C., Li, M., Johnson, W. L. (1993). Nanostructured Mater. 2:433–439.
35. Liu, K. W., Muklich, F., Birringer, R. (2001). Intermetallics 9:81–88.
36. Calka, A., Williams, J. S., Millet, P. (1992). Scripta Metall. Mater. 27:1853–1857.
MD: SURYANARAYANA, JOB: 03320, PAGE: 402
4103-X_Suryanarayana_Ch15_R2_080304
Chapter 15402

37. Lonnberg, B. (1994). J. Mater. Sci. 29:3224–3230.38. Sherif El-Eskandarany, M., Aoki, K., Suzuki, K. (1990). J. Less Common Metals
167:113–118.
39. Ogino, Y., Miki, M., Yamasaki, T., Inuma, T. (1992). Mater. Sci. For. 88–90:795–800.40. Guo, W., Iasonna, A., Magini, M., Martelli, S., Padella, F. (1994). J. Mater. Sci. 29:
2436–2444.
41. Zhang, L. C., Xu, J. (2002). Mater. Sci. For. 386–388:47–52.42. Counihan, P. J., Crawford, A., Thadhani, N. N. (1999). Mater. Sci. Eng. A267, 26–35.43. Calka, A., Kaczmarek, W. A. (1992). Scripta Metall. Mater. 26:249–253.
44. Yang, E., Wagner, C. N. J., Boldrick, M. S. (1993). Key Eng. Mater. 81–83:663–668.45. Gaffet, E., Louison, C., Harmelin, M., Faudot, F. (1991). Mater. Sci. Eng. A134, 1380–
1384.
46. Calka, A., Nikolov, J. I., Ninham, B. W. (1993). In: deBarbadillo, J. J., et al., eds.Mechanical Alloying for Structural Applications. Materials Park, OH: ASM. Interna-tional, pp. 189–195.
47. Ahn, J.-H., Zhu, M. (1998). Mater. Sci. For. 269–272:201–206.
48. Daledda, S., Eckert, J., Schultz, L. (2001). Mater. Sci. For. 360–362:85–90.49. Mizutani, U., Lee, C. H. (1990). J. Mater. Sci. 25:399–406.50. Sato, K., Ishizaki, K., Chen, G.-H., Frefer, A., Suryanarayana, C., Froes, F. H.
(1993). In: Moore, J. J., et al., eds. Advanced Synthesis of Engineered Structural Materials.Materials Park, OH: ASM International, pp. 221–225.
51. Klassen, T., Oehring, M., Bormann, R. (1994). J. Mater. Res. 9:47–52.
52. Chen, G.-H., Suryanarayana, C., Froes, F. H. (1995). Metall. Mater. Trans. 26A:1379–1387.
53. Goodwin, P. S., Ward-Close, C. M. (1995). Mater. Sci. For. 179–181:411–418.
54. Suryanarayana, C. (1995). Intermetallics 3:153–160.55. Ogino, Y., Yamasaki, T., Murayama, S., Sakai, R. (1990). J. Non-Cryst. Solids 117/
118:737–740.56. Mukhopadhyay, D. K., Suryanarayana, C., Froes, F. H. (1995). In: Phillips, M., Porter, J.,
eds. Advances in Powder Metallurgy and Particulate Materials—1995. Vol. 1. Princeton,NJ: Metal Powder Industries Federation, pp. 123–133.
57. Calka, A., Nikolov, J. I., Li, Z. L., Williams, J. (1995). Mater. Sci. For. 179–181:295–300.
58. Goodwin, P. S., Hinder, T. M. T., Wisbey, A., Ward-Close, C. M. (1998). Mater. Sci.For. 269–272:53–62.
59. Goodwin, P. S., Mukhopadhyay, D. K., Suryanarayana, C., Froes, F. H., Ward-Close,
C. M. (1996). In: Blenkinsop, P. A., Evans, W. J., Flower, H. M., eds. Titanium ’95:Science and Technology. Vol. 3. London: Institute of Materials, pp. 2626–2633.
60. Sherif El-Eskandarany, M., Aoki, K., Itoh, H., Suzuki, K. (1991). J. Less CommonMetals 169:235–244.
61. Sherif El-Eskandarany, M., Aoki, K., Suzuki, K. (1991). J. Less Common Metals177:229–244.
62. Zoz, H., Vernet, I., Jaramillo, D. (2003). V. Unpublished results.
63. Suryanarayana, C., Ivanov, E., Noufi, R., Contreras, M. A., Moore, J. J. (1999). J.Mater. Res. 14:377–383.
64. Suryanarayana, C. (2001). Prog. Mater. Sci. 46:1–184.
65. Shaw, W. J. D. (1998). Mater. Sci. For. 269–272:19–30.66. Koch, C. C., Smith, A. P., Bai, C., Spontak, R. J., Balik, C. M. (2000). Mater. Sci. For.
343–346:49–56.
67. Chen, Y., Hwang, T., Marsh, M., Williams, J. S. (1997). Metall. Mater. Trans.28A:1115–1121.
68. Goodwin, P. S., Ward-Close, C. M. (1993). In: deBarbadillo, J. J., et al., eds. MechanicalAlloying for Structural Applications. Materials Park, OH: ASM International, pp. 139–148.
MD: SURYANARAYANA, JOB: 03320, PAGE: 403
4103-X_Suryanarayana_Ch15_R2_080304
Powder Contamination 403

69. Klassen, T., Oehring, M., Bormann, R. (1997). Acta Mater. 45:3935–3948.70. Bohn, R., Klassen, T., Bormann, R. (2001). Acta Mater. 49:299–311.71. Singer, R. F., Oliver, W. C., Nix, W. D. (1980). Metall. Trans. 11A:1895–1901.
72. Keskinen, J., Pogany, A., Rubin, J., Ruuskanen, P. (1995). Mater. Sci. Eng. A196:205–211.
73. Mishurda, J. C., Suryanarayana, C., Froes, F. H. (1994). Moscow, ID: University of
Idaho. unpublished research.
MD: SURYANARAYANA, JOB: 03320, PAGE: 404
4103-X_Suryanarayana_Ch15_R2_080304
Chapter 15404

16
Modeling Studies and Milling Maps
16.1 INTRODUCTION
From the description of the process (Chapter 5) and mechanism (Chapter 6) ofmechanical alloying (MA), it is easy to realize thatMA is a process involving a numberof both independent and interdependent variables. As for any other process, modelingof MA has been carried out for the purpose of identifying the salient factors affectingthe process and establish process control optimization and instrumentation. Bymodeling the process effectively, it is possible to bring down the number of actualexperiments needed to optimize the process and achieve a particular application. Ahighly successful model would also predict the outcome of the process. In MA, forexample, if one can predict the nature of the phase produced under a given set ofmilling conditions, it would be considered a very successful model.
16.2 PROCESS VARIABLES
Mechanical alloying is a stochastic process, and the number of variables involved inthe process is very large. For a particular alloy system the variables include the type ofmill, intensity of milling (velocity of the grinding medium, frequency of impacts,energy transfer efficiency, and so on), size, shape and type of milling media, ball-to-powder weight ratio (BPR), the atmosphere under which the powder is milled, purityof the powders, milling time, milling temperature, and nature and amount of theprocess control agent (PCA) used. All these have a significant effect on the constitu-tion of the powder. Even on a local scale, the nature of impacts between two balls,the frequency of impacts, and the amount of powder trapped between two balls(grinding media) during a collision could vary from point to point. Furthermore, the
4103-X_Suryanarayana_Ch16_R2_071504
MD: SURYANARAYANA, JOB: 03320, PAGE: 405
405

motion of balls in different types of mills is quite complex. Thus, modeling the MAprocess is a difficult task. In spite of this, some attempts have been made in recenttimes and moderate success has been achieved in modeling the physics and mechan-ics of the process. From the actual experiments conducted, attempts have also beenmade to correlate the phases formed with the process parameters during milling, andmilling maps have been constructed. However, we are far from a situation where wecan predict the final chemical constitution of the powder (type and description ofphases formed).
16.3 EARLY MODELING ATTEMPTS
Modeling of the MA process has been conducted by several groups in recent years.The very first attempt at estimating the time required for alloying to occur wasmodeled by Benjamin and Volin [1]. Assuming that the rate at which material istrapped between two colliding balls is independent of time and that the energyrequired per unit strain for a constant volume of material is a linear function of theinstantaneous hardness of the powder, they calculated the strain, q, as a function oftime, t, as:
e ¼ K
4:57lnð1þ 0:365tÞ ð16:1Þ
where K is a constant. They suggested that the rate of structural refinement wasdependent on the rate of mechanical energy input to the process and the work-hardening rate of the material being processed. They also concluded that the specifictimes to develop a given structure in any system would be a function of the initialparticle size and characteristics of the ingredients as well as the particular apparatusand operating parameters. Subsequently more rigorous modeling was done.
Another early modeling attempt was to estimate the temperature rise duringcollision between two balls and/or the powder [2, 3; see also Chapter 8]. Subsequently,Maurice and Courtney [4] presented a first attempt to define the basic geometry,mechanics, and physics of MA. The model defined the volume of material affected percollision, and from this they approximated information about impact times, powderstrain rates and strains, powder temperature increase, powder cooling times, andmilling times. Efforts to improve this model were undertaken later. The mostimportant groups who conducted very detailed modeling studies are those led byCourtney [4–6], Gaffet [7], Magini [8], Koch [9], andWatanabe [10]. A few others havealso attempted the modeling [11–15].
Modeling of MA/MM is done to identify and define the important processparameters controlling the structure and properties of the resulting powder. Forexample, it is very difficult to accurately predict the nature of the phase formed underthe given conditions of MA/MM. This is due to the fact that phase transformationsthat occur during MA/MM are mostly dependent on the energy transferred to thepowder, deformation behavior of these powders, and the chemical reactions that takeplace in them. Sufficient information is not readily available on the deformation be-havior of metal powders at high strain rates, impact velocities, and impact frequencies,as encountered during MA. Due to these limitations, it is not possible to make accu-rate predictions but rather only to obtain the general trends. Therefore, it is important
MD: SURYANARAYANA, JOB: 03320, PAGE: 406
4103-X_Suryanarayana_Ch16_R2_071504
Chapter 16406

to realize that these models cannot provide information on all aspects of the process.As Courtney and Maurice [16] succinctly put it:
It is important to appreciate what can be expected of even the most successful efforts ofthis kind. ‘‘Absolute’’ predictions are unlikely; this is exacerbated in the case of MA by
its inherently stochastic nature. In addition, models require input ‘‘data’’; materialproperties (often not known to precision, particularly at the high strain levels to whichpowder is often subjected duringMA) and process characteristics (collision frequency and
velocity, also seldom known a priori). Thus, realistic goals of process modeling are tocorrectly predict general trends, and perhaps even to predict resulting properties/dimen-sions within an order of magnitude. The benefits of successful models lie not in their
abilities to predict outcomes, but in that they help identify critical process and materialvariables, and reduce the amount of testing needed for process optimization.
16.4 TYPES OF MODELING
Modeling of theMA process has been broadly classified into two categories: local andglobal. Local modeling considers a ‘‘typical’’ collision occurring in a specific millingdevice with a stipulated impact velocity and frequency. The size of the grinding me-dium, ball-to-powder weight ratio (BPR), and the mechanical characteristics of thepowder (hardness, ductility, fracture toughness, etc.) are also specified beforehand.During the collision involving powder trapped between two grinding media, thepowder hardness, size, and shape are altered. Thus, ‘‘local’’ modeling attempts tocalculate (1) the deformation the particle experiences, (2) the change in powder par-ticle shape, (3) the probability of a particle coalescing, and (4) the probability of aparticle fracturing.
Milling parameters such as impact frequency and angle, and media velocity aretaken into account during global modeling. Since many media impacts are ineffec-tive in bringing about deformation, fracture, and coalescence of powder particles, oneseeks to specify the frequency of effective media impacts by considering the colli-sion velocities, frequencies, and powder coating thickness. Thus, ‘‘global’’ modelingdetermines distribution of (1) impact angles, (2) velocities, (3) rolling forces, and soforth over the entire mill. It is important to appreciate that both local and globalmodeling are interrelated and complementary to each other. While local modelingdescribes the events that take place in the powder entrapped between two grindingmedia during a single collision, global modeling deals with macroscopic factors andmill-specific features. A combination of these two models can provide a complete pic-ture of the total milling process. Figure 16.1 shows the difference between these twotypes of modeling.
16.4.1 Local Modeling
Both analytical and phenomenological approaches have been taken for local model-ing. The collision between two grinding media was considered and the powder coatingwas ignored. It was reasoned that the powder only mildly perturbs the collision, i.e.,the plastic deformation (and other) work performed on the powder is assumed to beonly a small fraction of the precollision media kinetic energy. Thus, the collisionbetween grinding media involving entrapped powder between them is similar to theHertzian collision between balls without the powder. The collision volume is consid-
MD: SURYANARAYANA, JOB: 03320, PAGE: 407
4103-X_Suryanarayana_Ch16_R2_071504
Modeling Studies and Milling Maps 407

ered to be a cylinder of radius equal to the Hertz radius, rh, and height h0. Estimatingthe media collision velocity, v, as ranging from 0.5 m/s (e.g., for an attritor) to 5 m/s(e.g., for a SPEX mill) and to decrease linearly from the maximal value at the time ofimpact to zero after an elapsed time, H , Maurice and Courtney [4] calculated the strainrates to be of the order of 103–104s�1. Thus, the deformation strain in a single collisionwas calculated as
e ¼ �ln 1� vs2ho
� �ð16:2Þ
The estimated powder strains ranged from several tenths of a percent (for an attritor) tounity (for a SPEX mill with a high BPR). Courtney and Maurice [17] subsequentlyestimated the processing times by assuming that a critical amount of powder defor-mation (A) is needed to achieve alloying. The alloying time, tp, was shown to vary as
tpcAho
vsr2hhoð16:3Þ
Using the equations for the velocity dependence of the collision time and radius, it wasshown that the alloying time could be related to the precollision velocity as
tpfv�2:6 ð16:4Þ
The above model did not include the criteria for fracture and welding of powderparticles, nor the frequency of such events. Furthermore, the above treatment pro-vided only a ‘‘snapshot’’ of a single collision, and no attempt was made to obtaininformation about the powder particle size, shape, hardness, and microstructural re-finement scale fully. These aspects were subsequently undertaken.
A rigorous treatment of the single collision between grinding media coated witha uniform thickness of the powder helped in developing criteria for welding andfracture events [18]. Here it was considered that the powder particles are generally not
MD: SURYANARAYANA, JOB: 03320, PAGE: 408
4103-X_Suryanarayana_Ch16_R2_071504
Figure 16.1 Difference between ‘‘local’’ and ‘‘global’’ modeling of MA/MM.
Chapter 16408

spherical but more like oblate spheroids. At the initial impact of the grinding medium,the powders deform elastically; with continued milling the stress reaches the yieldstrength of the powder and consequently the powders get deformed plastically. Withfurther deformation, the radius of the plastically deformed zone spreads radiallyoutward. Thus, the powder-affected volume consists of a plastic cylindrical coresurrounded by an elastic annulus. The strain the powder experiences depends on thevalue of the center-to-center approach of the balls [a(r)] which is a function of thedistance (r) from the contact center. It is given by
aðrÞ ¼ RvqHv
� �1=2
� r2
Rð16:5Þ
where R is the ball radius, v the precollision velocity, Hv the powder hardness, and Uthe density of the grinding media. The strain experienced by the powder is thenexpressed as
eðrÞ ¼ �ln 1� aðrÞho
� �ð16:6Þ
and the maximal strain (at r = 0) is
eð0Þ ¼ �ln 1� Rv
h0
qHv
� �1=2( )
ð16:7Þ
Thus, if ho, the powder cylinder height, increases linearly with R, the radius of thegrinding medium (which is to be expected), the strain is independent of the size of thegrinding medium.
Powder coalescence takes place by cold welding of the plastically deformedparticles. If the powder particles contain a surface oxide layer, this brittle oxide layer isbroken down during deformation and the fresh metal surface establishes contact withother metal surfaces. For alloying of different materials, it is necessary that bothcomponents be deformed before welding occurs. Thus, if we have a situation whereone metal is softer than the other, then the softer metal has to get work hardened to alevel comparable to that of the harder metal before cold welding can take place.
The next step is fracture of the cold-welded particles, which was considered totake place through ‘‘forging’’ fracture. Based on macroscopic models of forging andinvoking sticking friction and work piece barreling, strain is greatest at the particlecircumference. Thus, edge fracture initiates there. If one disregards sticking friction,strain is greatest at the contact center and crack initiation is predicted to take place atthe center of the particle, as might be expected for a brittle material. A crack beginswhen the critical tensile strain is attained over a critical length and the crackpropagation occurs when the plastic energy release exceeds a value characteristic ofthe material. Thus, if the particle is sufficiently small so that the crack length is largerthan the particle size, i.e., the crack length is not reached, then the particle will notfracture. Thus, there appears to be a minimal particle size below which fracturing doesnot take place.
Maurice and Courtney [19] developed two computer programs. MAP1, thesimpler of the two, considers milling of a single species with the option of addingdispersoids, and MAP2, the more sophisticated, can be used to model the kinetics ofMA of two species (A and B) to form a third (i.e., alloy) species (C). These two
MD: SURYANARAYANA, JOB: 03320, PAGE: 409
4103-X_Suryanarayana_Ch16_R2_071504
Modeling Studies and Milling Maps 409

programs describe the changes in powder size, shape, hardness, and microstructuralscale observed during MA. The predicted results were compared with the experimen-tal observations of Benjamin and Volin [1] on SPEX milling of Fe-Cr powders. Eventhough experimental results and predictions display the same trends (they are typicallywithin a factor of two or three of each other), some discrepancies were found [20]. Forexample, the predicted welding frequencies exceed predicted fracture frequencies forthe first 12 min of processing; the average particle size (about 100 Am) is less than thatpredicted by the model (about 130 Am), and the time at which the maximum isobserved (30–40min) is threefold longer than the correspondingmodel predicted time.The hardness predicted by the model was less than the observed value.
Maurice and Courtney [21] showed that the processing time dependency onimpact velocity for different combinations of metals of different hardness and fracturetoughness is in the range of v�2 to v�3. The model also successfully predicted the in-fluence of atmosphere and premilling ofNi on the formation ofNi3Si2 duringMA [22].
Aikin and Courtney [23,24] subsequently developed a phenomenological de-scription of the process based on kinetic principles. Using these models, the authorsestimated the plastic strain and strain rate, the local temperature rise due to a collision,the particle hardness due to work hardening, the lamellar thickness, and the impactfrequency and velocity. They showed that the fracturing and welding probabilitiesscale directly with the BPR and vary almost linearly with mill power. In fact, in arecent publication Maurice and Courtney [21] compared the alloying behavior in theSPEX mill and the attritor and identified some of the commonalities and differencesbetween the two devices.While the lamellar thickness of the component metals and thehardness are almost the same in both milling devices, the time required for completionof the process was estimated as 15 min in the SPEX mill and 11,000 min (183 h) in theattritor—nearly three orders of magnitude longer. The composite particle diameterwas also calculated to be 52 Am in the SPEX mill and 910 Am in the attritor. Mauriceand Courtney [21] showed that these differences arise because of the differences in theaverage impact velocity (0.5 m/s in the attritor and 4 m/s in the SPEX mill) and theaverage impact frequency (0.88/s in the attritor and 7/s in the SPEXmill). Although ithas been long known that the SPEXmill is much more energetic than the attritor, thisprovides a more quantitative comparison. Similarly, Abdellaoui and Gaffet [25]calculated the velocity of the ball, kinetic energy per impact, shock frequency, andpower for different types of mills. Their results are presented in Table 16.1.
The kinetics of alloying has also been studied. It was shown that for the elementshaving the greatest difference in initial hardness, alloying has hardly begun after eightimpacts at a velocity of 2 m/s. This was reflected in a fine particle size (essentially theinitial size). However, for the same number of impacts and at the same velocity,alloying was essentially complete for elemental combination having the most similarproperties, inferred from a large particle size, reflecting the cold welding accompany-ing the formation of the composite particles. Themaximum in particle size for differentmaterial combinations is different and is found approximately at the velocity needed to‘‘alloy’’ in the given time.
The precision of the material properties and process parameters used in thecomputational applications varies, sometimes substantially. A partial listing of theseproperties and parameters, along with the comments regarding the precision up towhich they are known, is presented in Table 16.2. Some properties are known precisely(e.g., modulus and density); others are likely known only to a factor of 2 at best (e.g.,
MD: SURYANARAYANA, JOB: 03320, PAGE: 410
4103-X_Suryanarayana_Ch16_R2_071504
Chapter 16410

hardening laws at high strain, fracture initiation strain, etc.). Processing variables(collision frequencies and velocities) are known even less accurately. Global modelingand ‘‘intuitive’’ extrapolations from such modeling provide ‘‘ballpark’’ figures forprocess parameters. Global modeling can improve the accuracy of local modeling byproviding refined values of the process parameters used in local modeling.
16.4.2 Global Modeling
Global modeling is useful in two respects. First, knowledge of device-specific mediadynamics provides input information for local modeling. The availability of moreaccurate information could improve process modeling and lead to process optimiza-tion. Second, the device efficiency can be improved from a better understanding ofdevice-specific media motion.
MD: SURYANARAYANA, JOB: 03320, PAGE: 411
4103-X_Suryanarayana_Ch16_R2_071504
Table 16.2 Some Input Parameters Required for Numerical Application of theModel [6]
Parameter Precision known to
Material property Modulus High
Density HighInitial particle size HighInitial hardness HighTensile strength Moderate
Fracture strain Moderate to lowFracture toughness Moderate to lowPlastic flow law parameters Moderate to low
Process variable Ball-to-powder ratio HighPowder coating thickness ModerateImpact velocity Moderate to low
Impact frequency Moderate to low
Table 16.1 Kinetic Energy, Shock Frequency, and Shock Power for Different Types of MillsUsed for Mechanical Alloying
Parameter
Mill
Velocity of
the ball (m/s)
Kinetic energy
(10�3 J/hit)
Shock
frequency (Hz)
Power
(W/g/ball or rod)
Attritor 0–0.8 <10 >1000 <0.001Vibratory mills:Pulverisette ‘‘O’’ 0.14–0.24 3–30 15–50 0.005–0.14
SPEX Mill <3.9 <120 200 <0.24Planetary ball millsPulverisette P5 2.5–4.0 10–400 f100 0.01–0.8Pulverisette G7 0.24–6.58 0.4–303.2 5.0–92.4 (5 balls) 0–0.56
Pulverisette G5 0.28–11.24 0.53–884 4.5–90.7 (5 balls) 0–1.604Horizontal rod mill 0–1.25 0–190 0–2.4 (1 rod) 0–0.1
Modeling Studies and Milling Maps 411

Davis et al. [3] modeled the kinetics of ball milling by studying the actual collisionprocesses inside a SPEXmill. They obtained information on (1) the velocities acquiredby the milling media, (2) the amount of energy transferred to the powders during animpact, and (3) the amount of energy transferred to the powders as heat. The vialmotionwas recorded on a videotape after slowing its apparent velocity by use of a highprecision stroboscope. This videotape was then analyzed by a ‘‘motion analysis’’ com-puter translation system, which converted the analog motion of the vial into digitalcoordinate displacements and velocities, based on appropriate time constants andlength calibrations. The ball motion was also studied by observation through a trans-parent lucite vial. If any two balls were within one diameter of their loci, or if any oneball was within one radius of the vial interior surface, then an impact was recorded, theball impact dissipated kinetic energy, and mean free paths were recorded. The numberof impacts occurring for 0.5 s and 1.0 s ofmill operation at several different ball loads isshown in Table 16.3. Amajority of the impacts occurred in the 10�3- to 10�2-J range ofenergy dissipated during the collision. The impact velocity was predicted to be 6m/s orless. The model also predicted that a majority of the impacts were glancing in natureand not head-on; this was subsequently confirmed by others [4].
Basset et al. [12] estimated impact velocities from the indentation on a copperplate fixed at one end of the vial in a SPEX mill. The estimated velocities were inthe range of 1.8–3.3 m/s and were found to be strongly dependent on the ball size.Hashimoto andWatanabe [10,26–28] have also analyzed the motion of the balls, usingdiscrete element method, in vibratory, tumbler, and planetary ball mills. Le Brun et al.[11] analyzed the ball motion in a planetary ball mill and observed three modes of ballmotion—chaotic, impact + friction, and friction, with an increasing ratio of theangular velocities of the vial and the disk.
Rydin et al. [29] used high-speed cinematography to study the global dynamicsof a transparent attritor. They noted that substantial segregation of powder occurredat the edge of the attritor; this region was termed ‘‘dead zone.’’ It was reported thatan attritor is a very inefficient device because direct impacts were restricted to itscore (where little powder was present), but the region containing proportionally themost powder was characterized by a low frequency of ball sliding. Sliding is caused
MD: SURYANARAYANA, JOB: 03320, PAGE: 412
4103-X_Suryanarayana_Ch16_R2_071504
Table 16.3 Number of Impacts for Various Ball and Kinetic Energy Values in a SPEX
8000 Milla
Kinetic energy of impact (J)
Number of balls 10�7 to 10�4 10�4 to 10�3 10�3 to 10�2 10�2 to 10�1 10�1 to 1.0
Mill operation for 0.5 s5 0 43 297 3 010 0 78 505 13 1
15 4 124 928 24 0Mill operation for 1.0 s5 0 78 612 3 0
10 0 148 1201 13 215 4 229 1873 24 0
a The weight of each ball used is 2 g [3].
Chapter 16412

by the close-packed array of balls. Accordingly, Rydin et al. [29] suggested that theefficiency of the attritor could be improved by using a mixture of differently sizedballs in the mill. It was shown [30] that when differently sized balls were used, thesmaller balls segregated to the tank bottom at low device rotational velocities. In-creasing this velocity reduced ball segregation, and at a critical rotational velocity(which is dependent on ball size, ball size ratio, and tank diameter), complete ballmixing occurred. It was also reported that differently sized balls double both thewelding and fracture rates.
16.5 MILLING MAPS
The above modeling studies have been successful in predicting the trends of impactvelocities and frequencies, but have not taken into account the type of phase formedunder different milling conditions. The ability to predict the nature of the phaseformed is a great advantage in designing the microstructure and constitution of thealloy. Some investigations have been carried out with this objective in view. In all theseinvestigations, the energy (or other parameter) calculations are always compared withthe experimentally obtained phase constitution and conclusions are drawn.
Abdellaoui and Gaffet [25,31] studied the amorphization behavior of Ni10Zr7 indifferent types of mills and evaluated the shock power that is transmitted to the pow-der. Based on a mathematical treatment of the process taking place, they calculatedthe shock frequency and the shock power. Irrespective of the device used to accom-plish the milling process, it was shown that the injected shock power is the uniquephysical parameter governing the phase transformation. For the prealloyed Ni10Zr7
MD: SURYANARAYANA, JOB: 03320, PAGE: 413
4103-X_Suryanarayana_Ch16_R2_071504
Figure 16.2 Injected shock power as a function of the disk and vial rotation speeds for the
Fritsch Pulverisette G5 (—) and G7 (- - - -) planetary ball mills. The vial rotation speed values(in rpm) are referred by the numbers 1–5 written near each corresponding curve: 1 = 150, 2 =250, 3 = 350, 4 = 500, and 5 = 600 rpm.
Modeling Studies and Milling Maps 413

intermetallic compound, a homogeneous amorphous phase was obtained only whenthe injected shock power was in the range 0.4–0.8 W/g. At power values less than 0.4or greater than 0.8 W/g, a mixture of amorphous and crystalline phases was obtained(Fig. 16.2).
Since phase transformations in mechanically alloyed powders occur due to theenergy transferred from the milling media to the powder, it would be useful tocalculate the energy transferred. This, of course, depends on the type of mill and theoperating parameters. It was shown that collision is predominant when the grindingmedium fills only a small part of the mill; collision between the balls and the oppositewall is the dominant energy transfer event here. However, when the mill begins to befilled with the grinding medium, shear stress between neighboring balls is thedominant energy transfer event. In this case, a ‘‘filling factor’’ should be taken intoconsideration [32]. By considering that collision is the basic event by which energy getstransferred from the mill to the powder, one could calculate (1) kinetic energy of the
MD: SURYANARAYANA, JOB: 03320, PAGE: 414
4103-X_Suryanarayana_Ch16_R2_071504
Figure 16.3 Energy transferred per hit and per unit mass for the Pd-Si system as a function
of the rotation speed of the planetary ball mill for different ball diameters (given in mm neareach curve). The filled symbols represent experiments carried out in the planetary ball mill andthe open symbols for the SPEX mill. The horizontal broken line refers to the critical energy
above which an intermetallic forms and below which an amorphous phase forms. The ex-periments have been carried out with a Pd-20 at% Si composition except in (a) = Pd-13.5 at%Si and (b) = Pd-17 at% Si.
Chapter 16414

ball, (2) fraction of the kinetic energy transferred to the powder, and (3) quantity ofmaterial entrapped in the collision event. It was shown that the energy dissipated perhit duringmilling increases with increasing rotation speed and also with increasing sizeof the grinding ball [8]. These calculations assumed that the collisions are perfectlyinelastic. However, it was shown through video recordings thatmovements of the ballsare somewhat different from the expected ones and that one should consider a ‘‘slipfactor’’ that takes into account the sliding phenomena between balls and the containerwall [33]. The energy released by one ball as a function of the specific power (power perunit weight of the powder) was calculated. By comparing these calculations with theexperimentally determined phase constitution, a critical energy was identified belowwhich the phase formed is amorphous and above which it is intermetallic. This hasbeen shown to be true in the Fe-Zr system [32] as well as in the Pd-Si system [8]. Asimilar calculation for the case of a SPEX mill is difficult because the mill is subjectedto impulses in three directions. Since the vibration frequency is fixed for the SPEXmill, the situation can be compared with that in a planetary ball mill at fixed rotationspeed. An ‘‘energy map’’ featuring the phase constitution in the Pd-Si system is shownin Figure 16.3. It may be noted that these maps define a threshold value for the millingconditions above which an intermetallic phase forms. Below this critical value, anamorphous phase forms. These results confirm the earlier observations that soft MAconditions favor the formation of a nonequilibrium phase.
A milling map describing the phases present in a Ti-33 at% Al powder mix atdifferent milling times and for different BPR values is shown in Figure 16.4 [34]. It wasshown that the time required for the formation of a particular phase was shorter athigher BPR since the higher BPR value translates to higher mechanical energy input
MD: SURYANARAYANA, JOB: 03320, PAGE: 415
4103-X_Suryanarayana_Ch16_R2_071504
Figure 16.4 Milling map for blended elemental Ti-33 at% Al powder relating the BPR and
milling time to the phases present.
Modeling Studies and Milling Maps 415

per unit mass of the powder. At a constant BPR, the sequence of phase formation canbe determined as a function of milling time. Similarly, at a constant milling time, thephases occurring with increasing BPR can be identified. Thus, this map is somewhatsimilar to a phase diagram, except that the milling map is for a particular alloy com-position while the phase diagram is for the whole alloy system. It has been reportedearlier that increased speed of milling [32,35] or very high BPR [36] generates moreheat and leads to the formation of crystalline phases either by crystallization of theamorphous phase or by other mechanisms. Thus, the y axis on the milling map maybe equated to ‘‘temperature’’ and so the milling map can be considered as a constantcomposition section of a ternary phase diagram where the three axes are millingtime, composition, and BPR. These milling maps should be very useful in quicklyidentifying the phases present at anymilling time for a specific BPR and in defining thefinal phases produced by the MA process.
REFERENCES
1. Benjamin, J. S., Volin, T. E. (1974). Metall. Trans. 5:1929–1934.
2. Schwarz, R. B., Koch, C. C. (1986). Appl. Phys. Lett. 49:146–148.3. Davis, R. M., McDermott, B., Koch, C. C. (1988). Metall. Trans. 19A:2867–2874.4. Maurice, D. R., Courtney, T. H. (1990). Metall. Trans. 21A:289–303.
5. Courtney, T. H. (1994). Rev. Particulate Mater. 2:63–116.6. Courtney, T. H. (1995). Mater. Trans. Jpn. Inst. Metals 36:110–122.7. Gaffet, E., Abdellaoui, M., Gaffet, N. M. (1995).Mater. Trans. Jpn. Inst. Metals 36:198–
209.8. Magini, M., Iasonna, A. (1995). Mater. Trans. Jpn. Inst. Metals 36:123–133.9. Koch, C. C. (1995). Mater. Trans. Jpn. Inst. Metals 36:85–95.10. Watanabe, R., Hashimoto, H., Lee, G. G. (1995). Mater. Trans. Jpn. Inst. Metals
36:102–109.11. Le Brun, P., Froyen, L., Delaey, L. (1993). Mater. Sci. Eng. A161:75–82.12. Bassett, D., Matteazzi, P., Miani, F. (1994). Mater. Sci. Eng. A174:71–74.
13. Dallimore, M. P., McCormick, P. G. (1996). Mater. Trans. Jpn. Inst. Metals 37:1091–1098.
14. Bhattacharya, A. K., Arzt, E. (1992). Scripta Metall. Mater. 27:635–639.
15. Bhattacharya, A. K., Arzt, E. (1993). Scripta Metall. Mater. 28:395–400.16. Courtney, T. H., Maurice, D. R. (1996). Scripta Mater. 34:5–11.17. Courtney, T. H., Maurice, D. R. (1989). In: Clauer, A. H., deBarbadillo, J. J., eds. Solid
State Powder Processing. Warrendale, PA: TMS, pp. 3–19.18. Maurice, D. R., Courtney, T. H. (1994). Metall. Mater. Trans. 25A:147–158.19. Maurice, D. R., Courtney, T. H. (1995). Metall. Mater. Trans. 26A:2431–2435.20. Maurice, D. R., Courtney, T. H. (1995). Metall. Mater. Trans. 26A:2437–2444.
21. Maurice, D. R., Courtney, T. H. (1996). Metall. Mater. Trans. 27A:1981–1986.22. Kosmac, T., Maurice, D. R., Courtney, T. H. (1992). J. Am. Ceram. Soc. 76:2345–2352.23. Aikin, B. J. M., Courtney, T. H. (1993). Metall. Trans. 24A:647–657.
24. Aikin, B. J. M., Courtney, T. H. (1993). Metall. Trans. 24A:2465–2471.25. Abdellaoui, M., Gaffet, E. (1996). Acta Mater. 44:725–734.26. Hashimoto, H., Watanabe, R. (1990). Mater. Trans. Jpn. Inst. Metals 31:219–224.
27. Hashimoto, H., Watanabe, R. (1992). Mater. Sci. For. 88-90:89–96.28. Hashimoto, H., Watanabe, R. (1994). Mater. Trans. Jpn. Inst. Metals 35:40–45.29. Rydin, R. W., Maurice, D. R., Courtney, T. H. (1993). Metall. Trans. 24A:175–185.
30. Cook, T. M., Courtney, T. H. (1995). Metall. Mater. Trans. A26:2389–2397.
MD: SURYANARAYANA, JOB: 03320, PAGE: 416
4103-X_Suryanarayana_Ch16_R2_071504
Chapter 16416

31. Abdellaoui, M., Gaffet, E. (1994). J. Alloys Compounds 209:351–361.32. Burgio, N., Iasonna, A., Magini, M., Martelli, S., Padella, F. (1991). Il Nuovo Cimento
13D:459–476.
33. McCormick, P. G., Huang, H., Dallimore, M. P., Ding, J., Pan, J. (1993). In: deBarba-dillo, J. J., et al., eds. Mechanical Alloying for Structural Applications. Materials Park,OH: ASM International, pp. 45–50.
34. Suryanarayana, C., Chen, G.-H., Froes, F. H. (1992). Scripta Metall. Mater. 26:1727–1732.
35. Eckert, J., Schultz, L., Urban, K. (1990). Z. Metallkde. 81:862–868.
36. Sherif El-Eskandarany, M., Aoki, K., Itoh, H., Suzuki, K. (1991). J. Less CommonMetals 169:235–244.
MD: SURYANARAYANA, JOB: 03320, PAGE: 417
4103-X_Suryanarayana_Ch16_R2_071504
Modeling Studies and Milling Maps 417

4103-X_Suryanarayana_Ch16_R2_071504
MD: SURYANARAYANA, JOB: 03320, PAGE: 418

17
Applications
17.1 INTRODUCTION
From the previous chapters it becomes amply clear that the technique of mechanicalalloying (MA) has been used extensively in synthesizing a variety of materials in-cluding stable and metastable phases. The types of material include nanocrystalline,crystalline, quasi-crystalline, and amorphous alloys. The incentive and the most im-portant reason for the invention and development of the MA process was the pro-duction of oxide dispersion strengthened (ODS) materials in which fine particles ofY2O3 or ThO2 were uniformly dispersed in nickel- or iron-based superalloys. In themid-1980s it was realized that MA was also capable of producing true alloys fromelements that are not easily formed by conventional means or sometimes are evenimpossible to prepare, e.g., elements that are immiscible under equilibrium condi-tions. Investigations have revealed that metastable phases such as supersaturatedsolid solutions, nonequilibrium crystalline or quasi-crystalline intermediate phases,and amorphous alloys can be synthesized by MA. In addition, nanostructures witha grain size of a few nanometers, typically less than 100 nm, were also produced byMA. These metastable phases have interesting combinations of physical, chemical,mechanical, and magnetic properties and are being widely explored for potentialapplications [1–11]. It will be impossible to go into full details of each and every oneof these developments, and so only a brief survey of the present and potential ap-plications of the mechanically alloyed/milled materials is presented here. The twoproduction facilities of Inco Alloys International in the United States have a com-bined annual capacity approaching 300,000 kg. The yield of the final product variesgreatly with the product form and size, but the final wrought capacity is greater than200,000 kg.
4103-X_Suryanarayana_Ch17_R2_071504
MD: SURYANARAYANA, JOB: 03320, PAGE: 419
419

Mechanically alloyed materials (including those synthesized by mechanochem-istry and mechanical activation of solids) find applications in a variety of industries.The applications include synthesis and processing of advanced materials (magneticmaterials, superconductors, and functional ceramics), intermetallics, nanocomposites,catalysts, hydrogen storage materials, food heaters, gas absorbers, and also in themodification of solubility of organic compounds, waste management, and productionof fertilizers. However, the major industrial applications of mechanically alloyedmaterials have been in the areas of thermal processing, glass processing, energyproduction, aerospace, and other industries. These applications are based on theODS effect achieved in mechanically alloyed nickel-, iron-, or aluminum-based alloys.Applications in other areas are based on chemical homogeneity and fine dispersion ofone phase in the other, enhanced chemical activity of the mechanically alloyedproducts, and interesting properties of materials with nanometer-sized grains. Thesewill be briefly described now.
17.2 OXIDE DISPERSION STRENGTHENED MATERIALS
ODS alloys contain a solid-solution-strengthened matrix in which a fine dispersion ofan oxide is achieved. Usually about 1–2 wt% of an oxide is added to the alloy. Theoxide particles are very fine, about 5–50 nm, and have a spacing of the order of 100 nm.The commonly used oxides are Y2O3 (yttria), ThO2 (thoria), and La2O3 (lanthana).
The mechanically alloyed ODS alloy powders are degassed in vacuum and sealedin mild steel cans for extrusion. Extrusion is carried out in the temperature range of1000–1100jC and at an extrusion ratio of 13:1. The microstructure of the alloy at thisstage consists of very fine equiaxed grains of about 0.5 Am resulting from dynamicrecrystallization during hot deformation. The extruded alloy is then subjected to hotrolling at 1025jC with 20% thickness reduction per pass and a total reduction inthickness reaching up to 90%. Optimal high-temperature strength is developed byoptimizing the thermomechanical processing steps to produce a stable, recrystallizedgrain structure that is coarse and highly elongated in the direction of hot working.Grain aspect ratios may be as high as 10:1 to 15:1. The highly directional structureleads to varying degrees of anisotropy in mechanical and physical properties. A high-temperature recrystallization treatment is required to develop the desired grainstructure; the usual treatment is 1315jC for 1 h followed by air cooling. The detailsof temperature, extrusion ratios, and degree of deformation in thermomechanicalprocessing will be different for different alloys, and the reader is advised to refer to themanufacturer’s brochures for full details.
Mechanically alloyed ODS materials are strong both at room and elevatedtemperatures (Table 17.1). The elevated temperature strength of these materials isderived from more than one mechanism. First, the uniform dispersion of very fineoxide particles, which are stable at high temperatures, inhibit dislocation motion in themetal matrix and increase the resistance of the alloy to creep deformation. Anotherfunction of the dispersoid particles is to inhibit the recovery and recrystallizationprocesses because of which a very stable large grain size is obtained; these large grainsresist grain rotation during high-temperature deformation. A stable large grain sizecan also be obtained by secondary recrystallization mechanisms. Second, the veryhomogeneous distribution of alloying elements during MA gives both the solidsolution–strengthened and precipitation-hardened alloys more stability at elevated
MD: SURYANARAYANA, JOB: 03320, PAGE: 420
4103-X_Suryanarayana_Ch17_R2_071504
Chapter 17420

temperatures and overall improvement in properties. Mechanically alloyed materialsalso have excellent oxidation and hot corrosion resistance. The increased resistance tooxidation-sulfidation attack is due to the homogeneous distribution of the alloyingelements and the improved scale adherence due to the dispersoid itself [12,13]. Elliottand Hack [14] have presented an overview of the use of mechanically alloyed productsfor aerospace applications, and deBarbadillo and Smith [15] have described the uniquechallenges to manufacture and use posed by ODS alloys. A recent survey of theapplications of mechanically alloyed products can be found in Refs. 16–18. The differ-ent brochures produced by INCO should also be consulted for recent developmentsand applications of mechanically alloyed products.
17.2.1 ODS Nickel-Based Alloys
Today there are two manufacturers of ODS Ni-based superalloys: Inco AlloysInternational and Plansee GmbH Lechbruck. While the Inco alloys have the prefixMA, those from Plansee have the prefix PM. Typical compositions of the commer-cially available mechanically alloyed nickel-based superalloys from Inco AlloysInternational are presented in Table 17.2. These alloys typically have a solid solutionstrengthened Ni-Cr matrix with small amounts of Al, Ti, W, and Mo. About 1 wt% of
MD: SURYANARAYANA, JOB: 03320, PAGE: 421
4103-X_Suryanarayana_Ch17_R2_071504
Table 17.2 Nominal Compositions (wt%) of Mechanically Alloyed Nickel-BasedSuperalloys
Alloy Ni Cr Al Ti Mo W Y2O3 Ta
Inconel alloy MA754 Bal. 20 0.3 0.5 — — 0.6 —Inconel alloy MA757 Bal. 16 4.0 0.5 — — 0.6 —Inconel alloy MA758 Bal. 30 0.3 0.5 — — 0.6 —Inconel alloy MA760 Bal. 20 6.0 — 2.0 3.5 0.95 —
Inconel alloy MA6000 Bal. 15 4.5 2.5 2.0 4.0 1.1 2.0TMO-2a Bal. 6 4.2 0.8 2.0 12.4 1.1 4.7
a This alloy additionally contains 9.7 wt% cobalt.
Table 17.1 Room Temperature and Elevated Temperature Mechanical Propertiesof Commercial Oxide Dispersion Strengthened Nickel-and Iron-Based Superalloysa
Alloy Test temp. jC (F) 0.2% YS (MPa) UTS (MPa) % El % RA
MA 6000 Room temperature 1220 1253 7.2 6.5
871 (1600) 675 701 2.2 4.6982 (1800) 445 460 2.8 1.9
MA 754 Room temperature 586 965 21 33871 (1600) 214 248 31 58
982 (1800) 169 190 18 34MA 956 Room temperature 517 655 20 35
1000 (1832) 97 100 — —
1100 (2192) 69 72 12 30
YS, yield strength; UTS, ultimate tensile strength; El, elongation; RA, reduction in area.a See Tables 17.2 and 17.3 for chemical compositions of alloys.
Applications 421

Y2O3 is also added. Tungsten and molybdenum provide additional solid solutionstrengthening, while chromium along with titanium and tungsten improve oxidationand sulfidation resistance.
The most significant advantage of oxide dispersion–strengthened superalloys isthe increased stress rupture properties. Figure 17.1 compares the specific rupturestrength (strength/density) for a 1000-h life as a function of temperature for severalnickel-based superalloys used for turbine blade applications. Mar-M200 is a nickel-based alloy containing by weight percent 9.0 Cr, 5.0 Al, 2.0 Ti, 12.0 W, 10.0 Co, 1.0 Nb,and 1.8 Hf, while PWA454 is a nickel-based alloy containing 10.0 Cr, 5.0 Al, 1.5 Ti,12.0 Ta, 4.0 W, and 5.0 Co, and TD (thoria-dispersed) Ni is nickel containing 2.0 wt%ThO2. It is clear from this figure that the MA 6000 alloy can maintain a given stress fora much longer time than a conventional alloy for similar vane applications. This ismainly due to the benefits of the combined strengthening modes in the mechanicallyalloyed material. Due to the increased Al and Ti contents in MA 6000 (and PM 3030from Plansee), formation of cuboidal, coherent Ni3Al (gV) particles leads to theprecipitation hardening effect in addition to the dispersion hardening effect.
Mechanically alloyed nickel-based superalloys are considered mainly for threegroups of applications—gas turbine vanes, turbine blades, and sheets for use inoxidizing/corrosive atmospheres. The largest use of MA 754 is as vanes and bands
MD: SURYANARAYANA, JOB: 03320, PAGE: 422
4103-X_Suryanarayana_Ch17_R2_071504
Figure 17.1 Comparison of 1000-h specific rupture strength of Inconel MA 6000 with dis-persion strengthened Mar-M200+Hf, Thoria-dispersed (TD)-Ni, and single-crystal PWA 454.
Chapter 17422

for aircraft gas turbine engines (Fig. 17.2). For applications requiring good resistanceto thermal fatigue, such as gas turbine vanes, Inconel MA 754 is given a strong texture.Majority of the grains are aligned so that their <100> axes are parallel to the principalworking direction and along the length of the bar. Such texture results in low modulusof elasticity (149 GPa) in the longitudinal direction. The low modulus improvesresistance to thermal fatigue by lowering stresses for given thermal strains. Compo-nents are fabricated from bar stock using state-of-the-art machining and brazingprocesses typical for conventional wrought superalloys. Alloy MA 758 is used in anumber of industrial applications where its high chromium content makes it resistantto extremes of temperature and environment. The alloy is used in glass industry forhigh-temperature components requiring both elevated temperature strength andresistance to extremely corrosive molten glass. Alloy MA 758 is also used for internalcombustion engine components, mainly in critical fuel injection parts. One novelindustrial application of alloy MA 754 is for a high-temperature atmosphere circula-tion fan in a ‘‘floating’’ furnace design being commercialized in Japan. Large roundsare used for the hub and plate material is used for blades of the fan, which operates attemperatures over 1100jC.
New product forms of the commercial alloys continue to be developed. Large-diameter, thin-wall tubing of alloy MA 754 has been produced and evaluated forradiant tube applications, and alloy MA 758 has been used as tubing in heatexchangers and process equipment operating at very high temperatures.
The alloy MA 754 is used for brazed nozzle guide vane and band assemblies inU.S. military aero engines. The principal advantages of the alloy for these applicationsare thermal fatigue resistance, long-term creep strength, and high melting point.
MD: SURYANARAYANA, JOB: 03320, PAGE: 423
4103-X_Suryanarayana_Ch17_R2_071504
Figure 17.2 Some typical gas turbine engine components made of Inconel alloy MA 754.
Applications 423

The MA 6000 alloy is a more complex alloy developed as a blade material foradvanced gas turbines. It is used for first- and second-stage turbine vanes and bladesmachined from solid bar. Unlike cast alloys, MA 6000 exhibits nearly flat rupture-lifecurves at high temperatures due to the combination of ODS and high grain-to-widthratios (typically more than 10 to 1). Because of its composition, MA 6000 has excellentresistance to oxidation and sulfidation. The characteristics of this alloy allow bladecooling to be reduced or eliminated as the metal temperature can be increased by100jC or more in engines where the stresses are medium or low.
17.2.2 ODS Iron-Based Alloys
Table 17.3 lists the chemical compositions of mechanically alloyed iron-based super-alloys. These alloys are chromium-rich ferritic stainless steels containing aluminum foroxidation resistance and Y2O3 for creep resistance. They combine the high-temper-ature strength and stability of ODS with excellent resistance to oxidation, carburiza-tion, and hot corrosion. These alloys are suitable for use in gas turbine combustionchambers. Incoloy alloy MA 956 is particularly well suited for use in heat processingapplications. For example, vacuum furnace fixtures made of MA 956 have shownexcellent durability and can compete with wrought molybdenum, which is also used inthese applications. In comparison to molybdenum, MA 956 is about 30% lower indensity, providing weight savings and cost advantages. Furthermore, since MA 956has a lower vapor pressure than molybdenum, it does not coat the inside of the vacuumchamber or the parts being heat treated. Thus, MA 956 rods, flats, and sheets are usedin numerous atmosphere and vacuum furnace applications including muffles, baskets,trays, and thermowells. MA 956 in tubing form has also been used for hightemperature, severe service applications such as coke injection lance pipes in steelmaking. MA 956 is also being used in glass processing industry because of its resistanceto attack by molten glass. Because of this corrosion resistance, the alloy is beingevaluated for applications such as firing-kiln rollers, muffle tubes, and furnace racks.Other applications include molten-glass resistance heaters, thermocouple protectiontubes, glass processing components used in nuclear waste disposal, and the bushingsused to make single C-strand and multistrand fibers.
The MA 957 alloy, containing Mo and Ti in addition to aluminum, has receivedinternational consideration for fuel cladding applications in liquid-metal fast breederreactors [19]. The alloy shows excellent long term microstructural stability in irradi-ation environments and is expected to retain superb high-temperature strength. Themicrostructure consists of a metal matrix with uniformly distributed Y2O3 dispersoidson the order of 5 nm in diameter. It also contains a highly elongated subgrain structurethat is introduced by thermomechanical processing. Since such a material could beconsidered for first-wall applications of a fusion reactor, the composition of the alloy
MD: SURYANARAYANA, JOB: 03320, PAGE: 424
4103-X_Suryanarayana_Ch17_R2_071504
Table 17.3 Nominal Compositions (wt%) of Mechanically Alloyed Oxide Dispersion
Strengthened Iron-Based Superalloys
Alloy Fe Cr Al Ti Mo Y2O3
Incoloy alloy MA 956 Bal. 20 4.5 0.5 — 0.5Incoloy alloy MA 957 Bal. 14 — 1.0 0.3 0.25
Chapter 17424
has been altered to be in line with low activation data. Accordingly, Mo is substitutedby W. The optimized composition for this purpose without containing any austenitephase in the alloy was found to be Fe-13.5Cr-2W-0.5Ti-0.25Y2O3 (wt%) [20].
More recently, MA 957 has been evaluated for use as the fuel cladding in fastneutron, breeder reactors. Conventional austenitic alloys are unsuitable for thisapplication due to the dimensional swelling phenomenon caused by the high neutronfluxes. Mechanically alloyed materials are also being evaluated for heat exchangercomponents in high-temperature gas-cooled reactors. Figure 17.3 shows some typicalhigh-temperature applications of the alloy MA 956.
Dour Metal developed a series of dispersion-strengthened steels through MAmethods. These steels, designated as ODM (oxide dispersion microforged) alloys,contain Cr and Al as major solute elements and 1.5 wt% Mg, 0.6 wt% Ti, and 0.5 wt%Y2O3. Both Cr and Al impart oxidation resistance to the steels. Table 17.4 lists thecompositions and mechanical properties in the hot isostatically pressed condition.These alloys have satisfactory mechanical properties at temperatures up to 1100jC,which is the upper limit for use of superalloys from the viewpoint of both oxidationresistance and mechanical properties. Ductility of the ODM alloys has been improvedby giving a suitable heat treatment to favor transgranular rupture. Compared to MA956, the time to rupture for the ODM alloys is two orders of magnitude higher.Because of the combination of these excellent mechanical properties, ODM alloys areexpected to find applications in energy conversion systems (particularly heat exchang-er tubes), and also in systems requiring protection from corrosive atmospheres [21].
Some attempts have also been made to produce high-wear-resistant steels viaMA by incorporating hard phases such as NbC, TiC, TiN, and Al2O3 into iron. Thesteel contains about 0.9 wt% C and 0.6 wt% P. Since P causes grain boundaryembrittlement, its amount must be carefully controlled. The wear behavior of thesealloys was found to be the best when the amount of the refractory compound isabout 10 vol% [22,23]. Use of coarse hard-phase particles reduced dry wear, while finehard phase particles reduced wear for oil lubrication at higher surface pressures andlonger times.
17.2.3 ODS Aluminum-Based Alloys
The success of mechanically alloyed superalloys led to the development of dispersion-strengthened aluminum alloys. Table 17.5 lists the compositions of the mechanicallyalloyed dispersion-strengthened aluminum alloys. Since an aluminum oxide layer isalways present either on the surface of the powder particles at the start of processing orduring milling, its incorporation into the alloy during consolidation contributes tosignificant improvements in the mechanical properties of the alloy. Furthermore, sincealuminum is a ductile metal, process control agents (PCAs) are added to assist inminimizing cold welding during processing. Consequently, oxide and carbide (Al2O3
and Al4C3) particles are formed due to reaction of Al with oxygen and carbon duringMA by the decomposition of the PCA. Both the oxide- or carbide-type dispersions areabout 30–50 nm in size and stabilize the ultrafine grain size. This results in 50%increase in strength, higher fracture toughness, and improved resistance to stresscorrosion cracking and fatigue crack growth of the mechanically alloyed materials.Additional strengthening is also achieved due to the dislocation substructure devel-oped during thermomechanical processing. These alloys also exhibit excellent thermal
MD: SURYANARAYANA, JOB: 03320, PAGE: 425
4103-X_Suryanarayana_Ch17_R2_071504
Applications 425

MD: SURYANARAYANA, JOB: 03320, PAGE: 426
4103-X_Suryanarayana_Ch17_R2_071504
Figure 17.3 (a) Furnace baskets made of Incoloy alloy MA 956 operating in air attemperatures above 1200jC. (b) Removable hearth of vacuum heat treating furnace fabricatedfrom 1.0- and 0.5-in. diam. rods of Incoloy alloy MA 956. The hearth legs are encased in alumina
sleeves to prevent direct contact with the graphite heating elements.
Chapter 17426

shock resistance and high sound damping capacity. Additional benefits can be accruedby adding carbide-forming elements such as titanium. ODS aluminum alloys, with thetrade name DISPAL (DISPersion strengthened ALuminum), have been jointlydeveloped by Krebsoge, Erbsloh-Aluminium, and Eckart-Werke. These materialscan be used in combustion engines (e.g., motor cycle pistons). The major obstacle totheir widespread use is their cost; thus, they are used only in some specific applications.
As in the case of rapid solidification processed (RSP) aluminum alloy develop-ment, progress in mechanically alloyed aluminum alloys also has occurred in threedifferent groups. These are (1) high-strength alloys, (2) ultra-light-weight alloys, and(3) high-temperature alloys.
High-Strength Alloys
IncoMAP alloy AL-9052 is a solid solution alloy that provides a good combination oftensile strength, fatigue strength, and toughness, normally observed in precipitation-hardened 7XXX series alloys. The high strength of this alloy arises from solid solutionstrengthening due to Mg; ultrafine grain size of the matrix; fine dispersion of MgO,Al2O3, and Al4C3 particles; and substructure strengthening. Since this is a solidsolution–type alloy, it has also good resistance to corrosion and stress corrosioncracking. This alloy has a density 5% less than that of conventional age-hardenablealuminum alloys of comparable strength such as 2024. With its combination of lightweight, high strength, and corrosion resistance, IncoMAP alloy AL-9052 is appro-priate for aerospace applications where marine corrosion is also a factor.
Recently, high-strength Al-Ti alloys have been developed using MA by dispers-ing nanometer or submicrometer-sized Al3Ti intermetallic particles (in addition to the
MD: SURYANARAYANA, JOB: 03320, PAGE: 427
4103-X_Suryanarayana_Ch17_R2_071504
Table 17.4 Compositions and Mechanical Properties of the Oxide Dispersion Microforged Alloys(Fe-xCr-yAl-1.5Mg-0.6Ti-0.5Y2O3, all in wt%) in the Hot Isostatically Pressed Condition
Microcrystal 900jC Macrograin 900jC
Alloy % Cr % Al
0.2% YS
(MPa)
UTS
(MPa) % El
0.2% YS
(MPa)
UTS
(MPa) % El
ODM 331 13 3 28 41 157 169 176 10ODM 361 13 6 42 61 86 166 177 12ODM 061 20 3 49 71 88 159 173 16
ODM 751 16.5 4.5 32 47 134 — — —MA 956 20 4.5 108 115 8
Table 17.5 Nominal Compositions (wt%) of Mechanically Alloyed DispersionStrengthened Aluminum-Based Alloys
Alloy Al Mg Li C O
IncoMAP alloy AL-9021 Bal. 1.5 — 1.1 0.8IncoMAP alloy AL-9052 Bal. 4.0 — 1.1 0.6
IncoMAP alloy AL-905XL Bal. 4.0 1.3 1.1 0.6
Applications 427

Al2O3 and Al4C3 dispersoids from addition of PCAs) in an Al matrix [24]. Similarapproaches could be used to develop high-strength alloys in other systems. In fact, ithas been reported that Nb additions at the level of about 10 wt% produced a fine-grained microstructure with Al3Nb, Al2O3, and Al4C3 and NbC dispersoids, whichpossessed a high strength of 400 MPa at room temperature [25]. Addition of 1 wt%Y2O3 increased the strength further to 450 MPa, without any deleterious effect on theductility [25].
Ultra-Lightweight Alloys
Addition of lithium to mechanically alloyed aluminum alloys has produced an ultra-light-weight alloy IncoMAP alloy AL-905XL. Its density is 8% lower and stiffness10% greater than the age-hardenable conventional alloy 7075-T73 of comparablestrength. The excellent combination of the properties makes this alloy very attractivefor airframe applications. In particular, the freedom from age-hardening treatmentsmakes it possible to produce forgings and heavy sections with homogeneous metal-lurgical structures.
High-Temperature Alloys
Reactive milling of aluminum alloys leads to incorporation of dispersoids, such asAl2O3 and Al4C3, into the aluminum matrix, which increases the strength of the alloy.This strength is retained to relatively high temperatures. In addition to these alloys,which are DISPAL alloys, high-strength Al-Fe-Ce alloys synthesized through rapidsolidification processing have also been developed by MA methods. Addition oftransition metals, such as Fe, and rare-earth elements, such as Ce, to aluminum hasresulted in alloys that can be used up to 590 K, competing with the performance oftitanium alloys [26]. Strengthening in these alloys is achieved by the transition metalintermetallic compounds. The low solubility and diffusivity of the transition and rare-earth elements result in slow coarsening of these precipitates [27]. Many investigationson rapidly solidified Al-Fe-Ce alloys have revealed that the strength decreases rapidlyat elevated temperatures [28]. MA of the rapidly solidified alloys resulted in a uniformdispersion of the thermodynamically stable carbides and oxides in the aluminummatrix, which helped in supplementing the strengthening achieved by the intermetal-lics. This led to increased stiffness and strength at temperatures, much higher thanthose obtained for the nonmechanically alloyed rapidly solidified alloys [29]. Thestrength of the mechanically alloyed alloy was found to be six times stronger, even at
MD: SURYANARAYANA, JOB: 03320, PAGE: 428
4103-X_Suryanarayana_Ch17_R2_071504
Table 17.6 Steady-State Creep Rates of Mechanically Alloyed (MA)and Non–Mechanically Alloyed (Non-MA) Al-8 wt% Fe-4 wt% CeAlloys at Different Temperatures and Stresses
Creep rate (s�1)
Temp. (jC) Stress (MPa) MA Non-MA
350 103 8.3 � 10�10 4.1 � 10�7
380 83 1.6 � 10�9 2.6 � 10�7
380 103 1.4 � 10�9 4.9 � 10�5
Chapter 17428
773 K, than the rapidly solidified alloy. Comparison of the creep response of thenonmechanically alloyed and mechanically alloyed Al-Fe-Ce alloys at the sameconditions of stress and temperature shows that the mechanically alloyed materialshows significant enhancement in creep resistance [30]. Table 17.6 summarizes thesteady-state (minimum) creep rates at different temperatures and stresses.
17.3 MAGNESIUM-BASED ALLOYS
Several mechanically alloyed magnesium alloys have also found useful applications.We will, however, concentrate on two specific applications here: supercorroding alloysand hydrogen storage materials.
17.3.1 Supercorroding Alloys
A useful application of the MA technique has been in the production of super-corroding magnesium alloys that operate as short-circuited galvanic cells to corrode(react) rapidly and predictably with an electrolyte such as seawater to produce heatand hydrogen gas [31,32]. Such an alloy system is suitable as a heat source for warmingdeep-sea divers, as a gas generator to provide gas for buoyancy, or as a fuel inhydrogen engines or fuel cells. The corrosion rate of alloys can be maximized byproviding (1) a short electrolyte path, (2) a large amount of exposed surface area, and(3) a strong bond (weld) between the cathode and the anode. It is also useful to providea very low resistance path for external currents to flow through the corroding pairs. Allthese requirements can be met with MA processing. Consequently, magnesium-basedalloys containing Fe, Cu, C, Cr, or Ti have been evaluated for such applications. TheMg-5 to 20 at% Fe alloy is ideal because of its extremely fast reaction rate, high poweroutput, and high percentage of theoretical completion of the actual reaction. Forcorrodable release links an alloy with a slower reaction rate, such as Mg-5 at% Ti isuseful. The corrosion rates can be precisely controlled by adjusting the alloycomposition.
One of the recent applications of this phenomenon of increased activity for themechanically alloyed Mg alloys is the development of meals, ready to eat (MRE) usedto provide hot food for the U.S. soldiers during the Gulf War (Desert StormOperation). This is a very good example of commercialization of a simple idea withtremendous potential.
In this food heater (Fig. 17.4), the starting materials are finely ground,mechanically alloyed powders of Mg and Fe. A mixture of this powder is pressedinto the pocket. When water is added to the finely ground mix, the following reactiontakes place generating heat:
Mg=Fe þ 2H2O ! MgðOHÞ2 þ H2zþ heat ð17:1ÞA galvanic couple exists between the two dissimilar metals (Mg and Fe) and this
reacts with water to produce heat. This heat raises the temperature of the food storedinside the packet making hot meals available, ready to eat.
17.3.2 Hydrogen Storage Materials
In recent years, there has been intense activity on the synthesis of metal hydridesthrough MA [33–35]. Although not yet commercialized, metal hydrides have been
MD: SURYANARAYANA, JOB: 03320, PAGE: 429
4103-X_Suryanarayana_Ch17_R2_071504
Applications 429

attracting very serious attention because metal hydrides are materials for safe storageof hydrogen and they can store hydrogen with a higher volume density than liquidhydrogen. For a material to be seriously considered for hydrogen storage, it shouldhave (1) high hydrogen storage capacity, (2) fast kinetics of storage and removal(reversible hydrogenation and dehydrogenation), (3) low hysteresis, (4) possibility ofhydriding/dehydriding at relatively low temperatures and pressures, preferably atroom temperature and atmospheric pressure, (5) long lifetime, (6) high chemicalstability and thermally easily decomposable, (7) no or minimal need to activate thematerial, (8) easy availability, (9) relative immunity to impurities, and (10) low cost(including that of fabrication). Among the different alloy systems investigated so far(based on Ti, La, Zr, Hf, V, Pd, and Mg), magnesium alloys have the pronouncedadvantage because of their large hydrogen capacity (7.6 wt%), low cost, and easyavailability [36]. However, Mg is hard to activate, its temperature of operation is high,and the sorption kinetics are slow. For example, Mg desorbs hydrogen at a minimaltemperature of 300jC, whereas a temperature of 180jC is desired for applications.Furthermore, due to its low melting point and high vapor pressure, preparation of Mg-based alloys by conventional metallurgical processes is difficult. It is easier to produce
MD: SURYANARAYANA, JOB: 03320, PAGE: 430
4103-X_Suryanarayana_Ch17_R2_071504
Figure 17.4 Cover of the MRE (Meal, Ready to Eat) heater packet used to provide hot mealsto U.S. soldiers during the Desert Storm operation. The food heater contains mechanicallyalloyed powders of Mg and Fe, which on contact with water produce heat.
Chapter 17430

MD: SURYANARAYANA, JOB: 03320, PAGE: 431
4103-X_Suryanarayana_Ch17_R2_071504
Figure 17.4 Continued.
Applications 431

Mg-Ni alloys by MA than by ingot metallurgy methods because of the large differencein the melting points of the two metals and the high vapor pressure of magnesium.These are some of the reasons why MA has been utilized to produce Mg-based alloysfor use as hydrogen storage materials [37].
Figure 17.5 shows the hydrogen absorption behavior at 300jC of the interme-tallic Mg2Ni as a function of grain size. It may be noted that while the coarse-grainedpolycrystalline intermetallic powder absorbs hydrogen slowly, the nanocrystallineintermetallic obtained by MA absorbs hydrogen faster. Furthermore, the maximalamount of hydrogen absorbed is also higher (3.5 wt%) for the nanocrystallinecompound in comparison to about 3 wt% for the coarse-grained polycrystallinecompound. In fact, it has been noted that the rate of absorption is higher the smaller isthe grain size. A similar trend was also noted for other materials. The desorptionbehavior of hydrogen has also been found to be faster for nanocrystalline materials.
It was reported that even faster hydrogen sorption kinetics and easier activationcould be achieved by preparing a multicomponent Mg-based system. The additivescould be classified into six groups [36]:
1. Ni which forms Mg2Ni2. Elements such as Ce, Nb, and Ti, which form hydrides and which can serve
as ‘‘hydrogen pumps’’3. Low-temperature metal hydrides such as LaNi5 and FeTi, which give rise
to multiphase systems4. Metal catalysts such as Fe, Co, or Cr, which do not form hydrides
themselves5. Elements that form covalent bonds with Mg, such as Si and C, and6. Metal oxides
Figure 17.6 shows the absorption and desorption behavior of hydrogen inmagnesium with microcrystalline and nanocrystalline structures and with and without
MD: SURYANARAYANA, JOB: 03320, PAGE: 432
4103-X_Suryanarayana_Ch17_R2_071504
Figure 17.5 Effect of grain size on hydrogen absorption in mechanically alloyed Mg2Nipowder at 300jC and 7 bar pressure.
Chapter 17432

an oxide catalyst in the nanocrystalline powder. It may be noted again from Figure17.6a that the hydride formation reaction in the microcrystalline material is slow. Lessthan half of the full hydrogen storage capacity was realized in less than 30 min. Incontrast, nanocrystalline Mg could be completely converted to the hydride phase in afew minutes. This has been related to the larger grain boundary area in the nano-crystalline material and consequent higher diffusion rate. The presence of a highdensity of heterogeneous nucleation sites aids the situation further. It has also beenknown that diffusion of hydrogen through MgH2 is more than a factor of 5000 timesslower than diffusion through Mg. Formation of the hydride along the grainboundaries, may result in slow filling of the interior of the micrometer-sized Mgcrystallites, i.e., growth of the hydride slows down since the hydride shell of thecrystallites acts as a diffusion barrier for hydrogen. In the nanocrystalline material, thesmall dimensions of the crystallites eliminate this problem, and consequently hydrideformation is faster.
The desorption behavior is also accelerated in the case of nanocrystallinematerials (Fig. 17.6b). While the unmilled microcrystalline material does not desorbany hydrogen within 1 h, the hydrided milled powder (with a nanocrystallinestructure) can desorb completely in about 30 min. The reaction kinetics of hydrogenabsorption and desorption are further enhanced by the addition of different metaloxides, e.g., Cr2O3, which act as catalysts. Figure 17.6a shows that 95% of the fullcapacity (of hydrogen absorption) is reached within 30 s, in the presence of a catalyst.The effect of a catalyst is even more dramatic for the desorption reaction (Fig. 17.6b).While desorption from pure nanocrystalline Mg may require about 30 min (themicrocrystalline material does not show any desorption in this time range), completedesorption is possible in less than 5 min in the presence of a catalyst. Anotheradvantage of the addition of a catalyst is that significant reaction rates can be achievedeven at reduced temperatures [38]. Although at a lower rate, absorption was found tobe possible at 40jC. For technical applications, the heat release upon absorptionincreases the temperature of the hydride bed, and this continues to accelerate the
MD: SURYANARAYANA, JOB: 03320, PAGE: 433
4103-X_Suryanarayana_Ch17_R2_071504
Figure 17.6 (a) Hydrogen absorption of nanocrystalline Mg with and without the catalyst in
comparison to coarse-grained Mg. (b) Hydrogen desorption behavior of nanocrystalline MgH2
with and without the oxide catalyst in comparison to coarse-grained MgH2.
Applications 433

process. Thus, the fast kinetics, in combination with one of the highest reversiblestorage capacities, qualifies these light-weight hydride materials for application in zeroemission vehicles [39].
While investigating the application of MA to hydrogen storage materials, Schulzand coworkers at Hydro Quebec, Canada [40] demonstrated results that are useful forpilot plant scale studies. Intensive milling of magnesium hydride with vanadiumproduced a nanocomposite of h-MgH2 + g-MgH2 +VH0.81. The MgH2+5 at% Vcomposite produced by mechanical milling desorbed hydrogen at 473 K under vacuumand reabsorbed hydrogen rapidly even at room temperature. The activation energy forhydrogen desorption was 62 kJ mol�1. The fast kinetics of the ball-milled MgH2-Vcomposite primarily comes from the catalytic effect of vanadium and the small powderparticle size. The formation enthalpy and entropy of the composite were identical tothat of pure magnesium.
Several magnesium-based and titanium-based intermetallics are being evaluatedfor this application. It was reported that MA of MgH2 and vanadium had the best everreported hydrogen storage (about 5.5 wt%) properties for an Mg-based system [34].
With increasing interest in ‘‘green’’ energy sources and relatively low-purityrequirements, hydrogen storage materials hold the most promise for the next MAapplication to be commercialized.
17.4 OTHER APPLICATIONS
17.4.1 Spray Coatings
Nanostructured materials show high potential for various engineering applicationsdue to their improved mechanical properties [41–43], and these could be convenientlyproduced by MA/MM methods (see Chapter 13). For example, it has been shown thatmechanically alloyed and hot isostatically pressed or sintered WC-Co compositesretain a nanocrystalline microstructure and show higher hardness and wear resistancethan coarse-grained material of equivalent ceramic content [44]. Since for mostapplications it is not necessary to produce costly massive components, coatingtechniques can be used to protect local areas of materials against wear or corrosion.Several hard coatings based on WC, TiC, or Cr3C2 have been developed in recentyears. The wide variety of thermal spray techniques and especially the opportunity touse powder as a feedstock has opened a wide field of applications for single-phase orcomposite materials.
The major advantages of mechanically alloyed/milled powders include achieve-ment of a homogeneous and fine distribution of metallic and ceramic componentsin an economical and cost-effective manner. Due to high particle velocities, high-velocity oxy fuel (HVOF) spraying exposes the coating material to high flame tem-peratures only for less than a millisecond, and consequently only slight changes inmicrostructure occur. The large mechanical impact due to the high velocity guaran-tees the formation of dense, solid coatings without requiring complete melting of thepowder stock.
Gartner et al. [45] studied the microstructure and mechanical and tribologicalproperties of thermally sprayed WC- or TiC-based coatings and noted that, in contrastto conventional powder, nanocrystalline cermet powders generally showed morehomogeneous coating microstructure. The hardness of the nanocrystalline composite
MD: SURYANARAYANA, JOB: 03320, PAGE: 434
4103-X_Suryanarayana_Ch17_R2_071504
Chapter 17434

coatings was reported to be higher than that of the coarse-grained powder. Stateddifferently, hardness similar to that of the coarse-grained powder coating can be ob-tained in the nanocrystalline coating, even with significantly higher metallic contents.The resistance of nanocrystalline composites against abrasive or adhesive wear wascomparable or even superior to that of coatings of conventionally processed powders.Furthermore, since the microstructure of nanostructured coatings was homogeneousand less porous than that from conventional powder, corrosion resistance is also ex-pected to be better.
Mechanical alloying can be used to produce powders of MCrAlY type, where Mis Fe, Co, Ni or a combination of these elements. These powders can be plasma-sprayed in a low-pressure chamber to provide oxidation- and corrosion-resistantcoatings on gas turbine blades and vanes [2]. These coatings provide corrosion andwear resistance. Uniform dispersion of oxide, nitride, and carbide phases formed insitu during MA can be beneficial in increasing the hardness of the coatings. It has alsobeen noted that these coatings are useful for environmental protection [46]. Additionsof yttrium can form Y2O3 dispersoids and such composites can be used as diffusionbarrier coatings [47]. This type of barrier reduces the adverse effects of concentrationgradients between the substrate and an overlay coating.
Mechanically alloyed powders can also be used as feedstock for powder injec-tion, since MA can easily achieve a very intimate mixture of the constituents. It hasbeen recently reported that mechanically alloyed Fe-SiC composite powders can becoated with a detonation gun to improve the wear resistance of medium carbonsteel [48]. There was very little SiC phase in the coating layer when the powder wasnot mechanically alloyed. MA helped in uniformly distributing up to about 60 vol%of SiC powder in the iron matrix.
17.4.2 Thermoelectric Power Generator Materials
Thermoelectric power generator has assumed lot of importance in recent years as areliable source of electric power. A number of different materials have been investi-gated for use in the thermoelectric power generation. h-FeSi2 is one of the mostpromising materials for energy conversion in the temperature range of 200–900jC.This material exhibits high electrical conductivity and large thermoelectric power.FeSi2 is a traditional thermoelectric material, which is nonpoisonous, has goodresistance to oxidation, and can be operated in air without any protection. However,the biggest disadvantage of this material is that it is porous and brittle in the as-castcondition. Furthermore, the presence of the eutectic and peritectoid reactions duringcooling from the liquid to the h phase causes difficulties in obtaining a homogeneousbulk material due to problems of segregation. Thus, conventional processing includesseveral steps: melting and casting, grinding the ingot to fine size, screening the powder,sintering the powder of uniform size, homogenization heat treatment, and annealingto produce the material in the h form to be used as thermoelectric material.
MA-processed powders will not have the segregation problem because no liquidphase is involved during processing. In addition, the number of processing steps is alsominimized. For example, Fe, Si, and the dopant powders (to make the material eitherp-type or n-type semiconductor) can be mechanically alloyed and then subjected tosintering followed by h annealing to produce the desired material [49,50]. Figure 17.7shows two different ways of making the h-FeSi2 thermoelectric generator material.
MD: SURYANARAYANA, JOB: 03320, PAGE: 435
4103-X_Suryanarayana_Ch17_R2_071504
Applications 435

The thermoelectric performance of materials is represented by the effectivemaximal power (Peff) and maximal conversion efficiency (Dmax). Both factors shouldbe large for the material used in a thermoelectric power generator. Improvement inboth these factors can be achieved by reducing the thermal conductivity of thematerial. Since MA is known to increase solid solubility limits, reduce grain size,and increase defect density, mechanically alloyed materials should exhibit lowerthermal conductivity than the ingot-processed material.
Table 17.7 shows the thermoelectric properties of the specimens prepared fromingot metallurgy and MA processes. It may be noted that the mechanically alloyedpowder shows a higher conversion efficiency and exhibits higher values for almost allthe properties; the power produced is slightly less.
17.4.3 Waste Utilization
Approximately 100 million tons of mining waste is produced annually in the UnitedStates as a result of the crushing and processing of rock minerals to produceconstruction and road products. An estimated one-fourth of this is sold as an inertfiller while the remaining material must be stored or disposed. The stockpiling anddisposal of these wastes produced as a result of aggregate crushing and productionoperations is considered one of the major problems facing the aggregate industrytoday. Methods have been developed to add this material as nonreactive filler toconcrete and asphalt products, with little added value. Other limited studies haveevaluated use as soil admixtures or amendments, and use in flowable fill materials.However, until recently little attention was paid to chemically changing these materialsto alter their reactive characteristics.
Lessard and Havens-Cook [51] have recently developed a process to convert by-product granite dust (‘‘fines’’) into reactive ‘‘pozzolan’’ using an attritor mill.
MD: SURYANARAYANA, JOB: 03320, PAGE: 436
4103-X_Suryanarayana_Ch17_R2_071504
Figure 17.7 Schematic illustration showing the traditional (ingot solidification method) andmodified (MA) methods of forming the h-FeSi2 thermoelectric generator material.
Chapter 17436

According to the American Society for Testing and Materials, (ASTM), pozzolanmaterials are ‘‘siliceous or siliceous and aluminous materials which in themselvespossess little or no cementitious value but will, in finely divided form and in thepresence of moisture, chemically react with calcium hydroxide at ordinary temper-atures to form compounds possessing cementitious properties.’’When the granite rockdust milled for 1 h was mixed with lime, water, and sand, the compressive strength ofthe samples exceeded the minimal required value of 600 psi, specified by ASTM. It wasalso noted that the compressive strength increased with increasing milling time. In fact,one of the samples prepared with mechanically activated granite fines had a compres-sive strength almost twice that made from commercially available fly ash.
Similar to the above-mentioned granite dust, about 300 million tires arediscarded every year in Europe alone. Most of these are landfilled at present, but thissituation cannot continue for long due to the new proposed regulations. Therefore,reuse of the scrap tire rubber is desirable. Although energy recovery from tire scraps isa practical option, it is preferable to recycle rubber in new articles rather than to simplyuse it as fuel; this could also mitigate environmental pollution. Accordingly, Maginiet al. [52] used the process of MA to convert the scrap tire rubber into value-addedproduct. The major problem in this process is that the vulcanized rubber must bedevulcanized. Vulcanization is the chemical process by which polymer molecules arejoined together by cross-linking into larger molecules to restrict molecular movement,i.e., they become rigid. This happens when the carbon-carbon double bonds ofpolyisoprene rubber open up and cross-link with sulfur atoms. These bonds need tobe broken down for utilizing this scrap rubber into useful forms; this was achieved byMA [52]. Progress of de-cross-linking at different milling times was monitored bymeasuring the extracted sol fractions and cross-linking densities of the milled samples.The cross-linking density decreased and the sol fraction increased when milling wasconducted in air in the presence of an antioxidant agent. When this milled rubber wasblended with virgin rubber, great homogeneity was observed with the surrounding
MD: SURYANARAYANA, JOB: 03320, PAGE: 437
4103-X_Suryanarayana_Ch17_R2_071504
Table 17.7 Thermoelectrical Properties of Fe-Mn-Al-Si Alloy Powders Processed byIngot Metallurgy (IM) and Mechanical Alloying (MA) Methodsa
Specimen IM (Fe30.7Mn2.7Si64.6Al2) MA (Fe28Mn2Si67Al3)
Seebeck potential,
Eo (mV)
1.5 � 102 1.9 � 102
Seebeck coefficient,a (mV/K)
0.21 0.27
Average specific
resistance, Um
5.7 11
Thermal conductivity,K (W/m.K)
6.9 c5
Figure of merit, Z (1/K) 1.1 � 10�4 1.3 � 10�4
Effective maximalpower, P (W.cm/cm2)
0.97 0.86
Maximal conversionefficiency, D (%)
1.9 2.3
a DT, Temperature difference one which operation takes place at 720 K.
Applications 437

matrix. Optimization of the process parameters must be done to achieve the bestpossible degree of devulcanization by milling.
17.4.4 Metal Extraction
It was described in Chapter 14 that mechanochemical reactions could be utilized toreduce oxides, chlorides, and sulfides to pure metals by reacting the ores with a morereactive metal in a high-energy ball mill. This process is now utilized on a commercialscale to produce pure metals.
Mechanical milling has been used in mineral processing basically to increase thesurface area and improve the chemical reactivity of the milled materials. It is now clearthat mechanical activation increases defect concentration in the milled material andthus changes the reactivity of the solids. Although mineral processing requires veryhigh productivity and very low cost, Balaz [53] exploited the principles of mechanicalactivation for extracting metals from minerals. The sulfide concentrates from differentsources (e.g., from Chile, Peru, Slovakia) were successfully used for extractingantimony and arsenic from them. The mechanochemical treatment improved thedegree of recovery and the rate of leaching of both metals. The process of mechano-chemical leaching of tetrahedrite was patented and tested on a pilot plant scale ineastern Slovakia. Tests have shown that with alkaline Na2S solution applied at 357–361 K and atmospheric pressure, 20–40 min was sufficient for almost full recovery ofantimony from tetrahedrite (Fig. 17.8). The other valuable metals (Cu, Ag, and Au)form the main economic components of the solid residue. The liquid/solid ratio(4.8:2.5) and power inputs (150–250 kWh per ton of a product applied in optimizedexperiments) were acceptable from the viewpoint of plant operation. The processcould be conducted at a lower temperature and for much shorter leaching times incomparison with the Sunshine process currently used in the United States. This isprobably the only known example of detailed understanding of mechanochemicaleffects and their application on pilot plant scale technology.
MD: SURYANARAYANA, JOB: 03320, PAGE: 438
4103-X_Suryanarayana_Ch17_R2_071504
Figure 17.8 Recovery of Sb, As, and Hg into leach (qMe) vs. time of leaching, t. (I)Mechanochemical leaching and (II) combined mechanochemical and chemical leaching. Theleaching conditions are: leaching agent 300 g/L Na2S + 50 g/L NaOH, temperature 361 K,
liquid/solid ratio 3.3, and power input 245 kWh/ton.
Chapter 17438
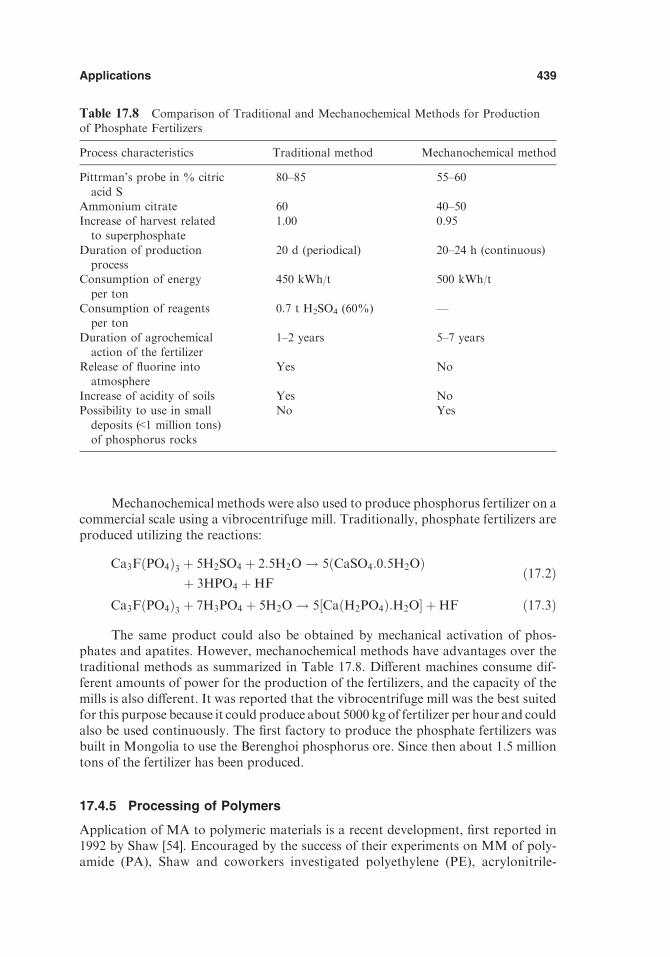
Mechanochemical methods were also used to produce phosphorus fertilizer on acommercial scale using a vibrocentrifuge mill. Traditionally, phosphate fertilizers areproduced utilizing the reactions:
Ca3FðPO4Þ3 þ 5H2SO4 þ 2:5H2O ! 5ðCaSO4:0:5H2OÞþ 3HPO4 þ HF
ð17:2Þ
Ca3FðPO4Þ3 þ 7H3PO4 þ 5H2O ! 5½CaðH2PO4Þ:H2O� þ HF ð17:3Þ
The same product could also be obtained by mechanical activation of phos-phates and apatites. However, mechanochemical methods have advantages over thetraditional methods as summarized in Table 17.8. Different machines consume dif-ferent amounts of power for the production of the fertilizers, and the capacity of themills is also different. It was reported that the vibrocentrifuge mill was the best suitedfor this purpose because it could produce about 5000 kg of fertilizer per hour and couldalso be used continuously. The first factory to produce the phosphate fertilizers wasbuilt in Mongolia to use the Berenghoi phosphorus ore. Since then about 1.5 milliontons of the fertilizer has been produced.
17.4.5 Processing of Polymers
Application of MA to polymeric materials is a recent development, first reported in1992 by Shaw [54]. Encouraged by the success of their experiments on MM of poly-amide (PA), Shaw and coworkers investigated polyethylene (PE), acrylonitrile-
MD: SURYANARAYANA, JOB: 03320, PAGE: 439
4103-X_Suryanarayana_Ch17_R2_071504
Table 17.8 Comparison of Traditional and Mechanochemical Methods for Productionof Phosphate Fertilizers
Process characteristics Traditional method Mechanochemical method
Pittrman’s probe in % citric
acid S
80–85 55–60
Ammonium citrate 60 40–50Increase of harvest related
to superphosphate1.00 0.95
Duration of productionprocess
20 d (periodical) 20–24 h (continuous)
Consumption of energy
per ton
450 kWh/t 500 kWh/t
Consumption of reagentsper ton
0.7 t H2SO4 (60%) —
Duration of agrochemicalaction of the fertilizer
1–2 years 5–7 years
Release of fluorine into
atmosphere
Yes No
Increase of acidity of soils Yes NoPossibility to use in small
deposits (<1 million tons)
of phosphorus rocks
No Yes
Applications 439

butadiene-styrene (ABS), polypropylene (PP), polystyrene (PS), and combinations ofthese [55–61]. Shaw recently summarized the results of his group [62], and otherinvestigators have also started similar investigations [63–69].
It was originally thought that MA of polymers could lead to (1) degradation dueto continual breaking of the long polymer chains, resulting in a large number of shortchains with no useful physical properties; (2) inability to recombine the resultantparticles to form a solid component due to their low diffusivity; and (3) difficulty incombining different polymers (which may be incompatible) to produce polymericalloys. However, actual experiments on different polymeric materials have provedthese suspicions to be unwarranted.
Polymeric materials are usually processed at low temperatures so that process-ing takes place below the glass transition temperature, Tg. It was reported that me-chanically alloyed polymers have lower amounts of crystallinity, and that both weight-averaged and number-averaged molecular weights decreased with increasing millingtime. Furthermore, ambient temperature milling produced much more pronouncedreduction in molecular weight than cryomilling. It was noted that MA of polymersdid not result in chain degradation but rather in new bond formations. Some poly-mers showed chain grafting resulting in increase of molecular weight; others showedchain breakage and decrease in molecular weight. Cross-linking and interpenetratingnetworks, and some attachment to the carbon rings were also noted. In most of thecases, the strength of the milled polymer was higher than the unmilled one. Thestrength could be increased further by heat treatment and increasing the crystallin-ity. The mechanically alloyed polymers also showed increased impact resistance,although the reasons for this are not known. Koch et al. [70] reported that millinginitially disrupted polyethylene terephthalate (PET) crystals by shearing parallel tothe (010), planes which left the intermolecular spacings within the (010) planesintact. After about 1 h of milling the PET chains underwent rotational disorderingabout the chain axis and the intermolecular spacing within the (010) planes increased.Extended milling produced an oriented amorphous morphology, regardless of thecrystallinity of the PET sample before milling. This oriented amorphous morphologycrystallized upon annealing into extended-chain crystals, as evidenced by an increasein their melting temperature.
Normally incompatible polymers could be made to react on an atomic level byMA. Thus, PA/PE and PA/ABS combinations could be successfully processed.Alloying was inferred from the shifting of the Tg peaks of the two individualcomponents toward each other, as determined from the differential scanning calori-metric traces. This is somewhat similar to alloy formation in normally immisciblemetals as described in Chapter 9. Mechanical properties of these polymeric alloys aresome combination of the individual constituent properties but are not necessarilybased on a rule of mixtures as found in composite materials [62].
There seem to be many similarities in the milling behavior of polymeric andmetallic materials. In both cases, grain refinement (or chain breakage) occurs. Themechanical properties of the milled materials are improved over those in the unmilledcondition. The temperature for full consolidation of the mechanically processedpolymers and metals seems to be lower than for the unmilled powder. This may berelated to the formation of ultrafine grains or small chains and enhancement ofdiffusivity. Lastly, traditionally immiscible metals could be alloyed; a similar phe-nomenon seems to happen in polymers also.
MD: SURYANARAYANA, JOB: 03320, PAGE: 440
4103-X_Suryanarayana_Ch17_R2_071504
Chapter 17440

Polymeric materials were found to form bonds with metals, ceramics, and otherpolymers, thus opening up the possibility of synthesizing many different types ofcomposites.
17.4.6 Room Temperature Solders
Reactions between Ga or liquid Ga–based eutectics with metal powders such as Cu,Ag, Au, Ni, and Sn have been investigated for possible use as low-temperature soldersor as dental filling materials. However, it was reported that neither pure metal powdersnor equilibrium commercial Cu-Sn alloys mixed with Ga-based liquids are suitable forpractical use due to their long solidification times and poor mechanical properties [71].These solders, required to join sputtering targets to the copper backing plates, shouldremain workable at room temperature for at least 15 min after initial mixing and thensolidify at room temperature in a reasonable time (preferably less than 24 h) to yieldgood mechanical properties. Since reaction of the metallic powder with a liquid alloy isa diffusion-controlled process, the process of MA could be utilized to change thereactivity of the solid.
Ivanov et al.[71] mechanically alloyed Cu-20 wt% Sn powders in three differenttypes of mills and noted that the solid solubility of Sn in Cu could be increased to 16.9wt% (or 9.8 at%) Sn. The minimum crystallite size obtained was 7 nm. Themechanically alloyed Cu-Sn alloy powder was mixed with a Ga-based eutectic alloyto react in the following manner:
Cu88Sn12 þ Ga74In16Sn10 ! CuGa2 þ h-InSn
þ Cu þ unknown phaseð17:4Þ
A strong correlation was observed between the reaction rate (measured as theintensity of the CuGa2 peak in the XRD pattern) and the crystallite size of the milledpowder; the reaction rate increased significantly with milling time, due to a decrease inthe crystallite size (Fig. 17.9).
Different sputtering targets (Si, W, W-10Ti, indium tin oxide, and MoSi2.7) werebonded to copper backing plates using this room-temperature solder. In all the cases,the solder was found to be good to achieve room temperature bonding, in spite of thefact that these materials showed large differences in coefficients of thermal expansion.The compositions and shapes of these targets do not allow for joining usingconventional methods.
17.4.7 Biomaterials
The search for biomaterials has been directed to those that exhibit a good physiolog-ical response and offer the additional advantage of excellent biocompatibility, endur-ability, and osteoconductive properties. The ideal material should be susceptible tototal resorption by the ossean cells and be biocompatible with the natural bone.Among the possible materials, hydroxyapatite (HAp), tricalcium phosphate, andbioactive glasses have been successfully exploited. But new, simple, and economicmethods for synthesizing these materials are desirable, and in this respect mechano-chemical processing appears to be very promising. HAp has been successfullysynthesized by MA methods [72–75]. Kim et al. [72] synthesized HAp using mixturesof Ca(OH)2-P2O5 and CaO-Ca(OH)2-P2O5 in a planetary ball mill. Yeong et al.[73]
MD: SURYANARAYANA, JOB: 03320, PAGE: 441
4103-X_Suryanarayana_Ch17_R2_071504
Applications 441

milled CaO and brushite together and calcined it at 800jC to obtain HAp. Gonzalez etal.[75], employing a Fisher mortar dry grinder, used stoichiometric mixtures ofCa(OH)2 and either P2O5 or (NH4)2HPO4 to obtain HAp after calcination accordingto the following equations:
10CaðOHÞ2 þ 3P2O5 ! Ca10ðPO4Þ6:2ðOHÞ þ 9H2O ð17:5Þ
10CaðOHÞ2 þ 6ðNH4Þ2HPO4 ! Ca10ðPO4Þ6:2ðOHÞþ 12NH4OH þ 6H2O
ð17:6Þ
The average particle size of the product obtained after calcination at 800jC was200 nm. Short needle-like HAp crystals were obtained for short milling periods (lessthan 5 h) even without further calcination from the Ca(OH)2 + (NH4)2HPO4 mixture.The presence of water contained in the starting mixtures played a key role inpromoting the synthesis reaction.
17.4.8 Bearings
Today the state of the art is the application of slide bearings based on Stellite againstStellite, which is, in general, a 50–60 wt% Co-matrix alloy containing Cr and Wcarbides and other composites. (Stellite is a trademark registered in the United Statesand owned by Deloro Stellite Company). Stellite is used as the bearing materialalthough its chemical properties and physical properties—in particular, the poorlubricating properties—are not satisfactory. To increase the sliding behavior in thebearing system, about 0.15–0.2 wt% of lead was added to the hot bath. Due toenvironmental regulations, use of lead had to be reduced dramatically. To improve thesituation, the technique of MA has been used [76] to produce advanced Stellite-based
MD: SURYANARAYANA, JOB: 03320, PAGE: 442
4103-X_Suryanarayana_Ch17_R2_071504
Figure 17.9 Reaction rate of mechanically alloyed Cu-20 wt% Sn powders. (a) Mechanicallyalloyed for 90 min, (b) mechanically alloyed for 30 min, and (c) commercial alloy. The reactionrates have been normalized to the surface area of the powders. Note that the reaction rate is
higher the longer the MA time due to a decrease in the crystallite size.
Chapter 17442

bearing materials. A lubricating phase is introduced into Stellite powder material byMA and the composite powder particles are coated by high-energy milling in order toproduce bearing bushes of approximately 12 kg by sintering, liquid phase sintering,and hot isostatic pressing.
17.4.9 Miscellaneous Applications
Some miscellaneous applications have also been proposed for mechanically alloyedmaterials. One such application involves use of MA to decrease the extent of damagecaused by aspirin to the stomach. When aspirin is consumed, it will dissolve in thefluids of the stomach and cause damage to it. This is essentially due to the fast rate ofdissolution, reported to be 40 � 10�2 s�1. However, when aspirin is encapsulated intocellulose, a chemical bond is created between cellulose and aspirin. The dissolutionrate of this mixture was then found to be an order of magnitude slower, 3.9 � 10�2 s�1.Thus, damage to the stomach can be minimized.
Yet another application where MA has been found to be very useful is theeconomical production of large quantities of powders for industrial applications, e.g.,in paints and soldering materials. A production facility of 600 kg/day was establishedto supply powder to Fukuda Metal Foil and Powder Co. Ltd. in Japan. Zoz GmbH inWenden, Germany has collaborated with the Fukuda to produce this powder on asemicontinuous basis [77]. Such a process appears to be beneficial in countries wherelabor costs are high. For example, it was calculated that, per ton of powder, the totalprocessing cost in Germany would be DM 759 (about 380 euros) for continuousprocessing and DM 1399 (about 700 euros) for the batch operation. On the other hand,the cost in China would be DM 663 (about 330 euros) for the continuous process andDM 641 (about 320 euros) for the batch process, a clear indication of the low laborcosts in China.
Copper-based [78] and nickel-based [79] shape memory alloys have also beensynthesized by MA methods.
Mechanochemical processing of nanopowders using exchange reactions is underdevelopment, by Advanced Powder Technology Ltd. in Australia., with the use ofconventional ball mill as a low-temperature chemical reactor.
17.5 CONCLUDING REMARKS
The technique of MA/MM has been very useful in the synthesis of advanced materialsfor different applications. The major application for this technique still is in theproduction of ODS superalloys. Other applications are emerging and new applicationsare also being proposed. In this context, it should be remembered that mechanicallyalloyed materials have a very small grain/crystallite size and that it is possible toachieve a uniform dispersion of the different constituent phases. However, contam-ination of the powder during milling and/or consolidation is still a matter of concern.Therefore, potential applications of mechanically alloyed materials should take thesefactors into consideration. As an example, one could search for new applicationswhere homogenization of the product phase and formation of new active interfaces areimportant. These could include hydrogen storage alloys, composite materials, andmodification of drugs. Consolidation of the powder is involved in these cases, and careshould be taken not to introduce additional contamination in this process. Alterna-
MD: SURYANARAYANA, JOB: 03320, PAGE: 443
4103-X_Suryanarayana_Ch17_R2_071504
Applications 443

tively, one could use this technique to produce advanced materials that show hightolerance to gas content. One could also consider using the MA technique to synthesizematerials that could be used in the powder form without the need for consolidation.Such applications include catalysts, paints, pigments, fertilizers, solder components,and carbides for inclusion as hardening phases and the like. New applications arecontinuously being explored.
REFERENCES
1. Benjamin, J. S. (1976). Sci. Am. 234(5):40–48.
2. Gilman, P. S., Benjamin, J. S. (1983). Annu. Rev. Mater. Sci. 13:279–300.3. Koch, C. C. (1991). In: Cahn, R. W., ed. Processing of Metals and Alloys, Vol. 15 of
Materials Science and Technology—A Comprehensive Treatment. Weinheim: VCH, pp.
193–245.4. Bakker, H., Zhou, G. F., Yang, H. (1995). Prog. Mater. Sci. 39:159–241.5. Suryanarayana, C. (1995). Bibliography on Mechanical Alloying and Milling. Cambridge,
UK: Cambridge International Science Publishing.6. Lu, L., Lai, M. O. (1998). Mechanical Alloying. Boston: Kluwer.7. Murty, B. S., Ranganathan, S. (1998). Int. Mater. Rev. 43:101–141.
8. Soni, P. R. (2000). Mechanical Alloying. Cambridge, UK: Cambridge International Sci-ence Publishing.
9. Sherif El-Eskandarany, M. (2001). Mechanical Alloying for Fabrication of Advanced Engi-neering Materials. New York: William Andrew.
10. Suryanarayana, C. (2001). Prog. Mater. Sci. 46:1–184.11. Takacs, L. (2002). Prog. Mater. Sci. 47:355–414.12. Hack, G. A. J. (1987). Metals Mater. 3:457–462.
13. Fischer, J. J., deBarbadillo, J. J., Shaw, M. J. (1991). Heat Treating 23(5):15–16.14. Elliott, I. C., Hack, G. A. J. (1990). In: Froes, F. H., deBarbadillo, J. J., eds. Structural
Applications of Mechanical Alloying. Materials Park, OH: ASM International, pp. 15–24.
15. deBarbadillo, J. J., Smith, G. D. (1992). Mater. Sci. For. 88–90:167–174.16. Suryanarayana, C. (1998). In: Powder Metal Technologies and Applications. ASM
Handbook. Vol. 7, Materials Park, OH: ASM International, pp. 80–90.17. Ivanov, E., Suryanarayana, C. (2000). J. Mater. Synth. Proc. 8:235–244.
18. Suryanarayana, C., Ivanov, E., Boldyrev, V. V. (2001).Mater. Sci. Eng.A304–306:151–158.19. Gelles, D. S. (1990). ISIJ Int. 30:905.20. Mukhopadhyay, D. K., Suryanarayana, C., Froes, F. H., Hebeisen, J., Gelles, D. S. (1996).
In: Froes, F. H., Hebeisen, J., Widmer, R., eds.Hot Isostatic Pressing. Materials Park, OH:ASM International, pp. 175–179.
21. Kazimierzak, B., Prigon, M., Lecomte-Mertens, Ch., Coutsouradis, D. (1990). In: Bachelet,
E., Brunetaud, R., Coutsouradis, D., et al., eds. High-Temperature Materials for the PowerEngineering 1990–II. Dordrecht: Kluwer, pp. 131–142.
22. Kohler, E., Gutsfeld, C., Thummler, F. (1990). Powder Metall. Int. 22(3):11–14.
23. Gutsfeld, C., Thummler, F. (1990). Metal Powder Rep. 45:769–771.24. Lee, K. M., Moon, I. H. (1994). Mater. Sci. Eng. A185:165–170.25. Hawk, J. A., Lawless, K. R., Wilsdorf, H. G. F. (1988). Scripta Metall. 22:1317–1322.26. Griffith, W. M., Sanders, R. E. Jr, Hildeman, G. J. (1982). In: Koczak, M. J., Hildeman, G.
J., eds. Elevated Temperature Aluminum Alloys for Aerospace Applications. Warrendale,PA: AIME, pp. 209–221.
27. Angers., L. 1985. Ph.D. dissertation, Northwestern University, Evanston, IL.
28. Yaney, D. L., Nix, W. D. (1987). Metall. Trans. 18A:893–902.29. Ovec� oglu, M. L., Nix, W. D. (1989). In: Arzt, E., Schultz, L., eds. New Materials by
MD: SURYANARAYANA, JOB: 03320, PAGE: 444
4103-X_Suryanarayana_Ch17_R2_071504
Chapter 17444

Mechanical Alloying Techniques. Oberursel: Deutsche Gesellschaft fur Metallkunde. pp. 287–295.
30. Ezz, S. S., Lawley, A., Koczak, M. J. (1988). In: Kim, Y. -W., Griffith, W. M., eds.
Dispersion Strengthened Aluminum Alloys. Warrendale, PA: TMS, pp. 243–263.31. Black, S. A. (1979). Development of Supercorroding Alloys for Use as Timed Releases for
Ocean Engineering Applications. Port Hueneme, CA: Civil Engineering Laboratory
(Navy), p. 40.32. Sergev, S. S., Black, S. A., Jenkins, J. F. US Patent 4,264,362, August 13, 1979.33. Suryanarayana, C., Ivanov, E., Konstanchuk, I. G. (2001). In: Kim, N. J., Lee, C. S.,
Eylon, D., eds. Proc LIMAT 2001. Vol. 1. Pohang, Korea: Pohang University of Scienceand Technology, pp. 261–268.
34. Schulz, R., Liang, G., Huot, J. (2001). In: Dinesen, A. R., Eldrup, M., Juul Jensen, D.,
Linderoth, S., Pedersen, T. B., Pryds, N. H., Schrøder Pedersen, A., Wert, J. A., eds.Science of Metastable and Nanocrystalline Alloys: Structure, Properties, and Modelling.Roskilde, Denmark: Risø National Laboratory, pp. 141–153.
35. Klassen, T., Oelerich, W., Bormann, R. (2001). Mater. Sci. For. 360–362:603–608.
36. Konstanchuk, I. G., Ivanov, E., Boldyrev, V. V. (1998). Russian Chem. Rev. 67:69–79.37. Ivanov, E., Konstanchuk, I. G., Stepanov, A., Boldyrev, V. V. (1987). J. Less Common
Metals 131:25–29.
38. Oelerich, W., Klassen, T., Bormann, R. (2001). Adv. Eng. Mater. 3:487–490.39. Klassen, T., Bohn, R., Fanta, G., Oelerich, W., Eigen, N., Gartner, F., Aust, E., Bormann,
R., Kreye, H. (2003). Z. Metallkde. 94:610–614.
40. Liang, G., Huot, J., Boily, S., Van Neste, A., Schulz, R. (1999). J. Alloys Compounds291:295–299.
41. Suryanarayana, C. (1995). Int. Mater. Rev. 40:41–64.
42. Gleiter, H. (2000). Acta Mater. 48:1–29.43. Suryanarayana, C., Koch, C. C. (2000). Hyperfine Interactions 130:5–44.44. Schlump, W., Willbrand, J., Grewe, H. (1994). Metall. 48:34.45. Gartner, F., Bormann, R., Klassen, T., Kreye, H., Mitra, N. (2000). Mater. Sci. For.
343–346:933–940.46. Rairden, J. R., Habesch, E. M. (1981). Thin Solid Films 83:353–360.47. Gedwill, M. A., Glasgow, T. K., Levine, S. R. (1982). Metallurgical Coatings. Vol. 1. New
York: Elsevier.48. Jia, C., Li, Z., Xie, Z. (1999). Mater. Sci. Eng. A263: 96–100.49. Umemoto, M., Shiga, S., Raviprasad, K., Okane, I. (1995). Mater. Sci. For. 179–181:
165–170.50. Umemoto, M. (1995). Mater. Trans. Jpn. Inst. Metals 36:373–383.51. Lessard, P. C., Havens-Cook, M. (2002). Mater. Sci. For. 386–388:589–596.52. Magini, M., Cavalieri, F., Padella, F. (2002). Mater. Sci. For. 386–388:263–268.
53. Balaz, P. (2000). Extractive Metallurgy of Activated Minerals. Amsterdam: Elsevier.54. Pan, J., Shaw, W. J. D. (1992). Microstruct. Sci. 19:659–668.55. Pan, J., Shaw, W. J. D. (1992). In: Reinhart, T. S., Rosenow, M., Cull, R. A., Struckholt,
E., eds. Advanced Materials: Meeting the Economics Challenge. Vol. 24. Covina, CA:SAMPE, pp. T762–T775.
56. Pan, J., Shaw, W. J. D. (1993). Microstruct. Sci. 20:351–365.
57. Shaw, W. J. D., Pan, J., Gowler, M. A. (1993). In: deBarbadillo, J. J., et al., eds.MechanicalAlloying for Structural Applications. Materials Park, OH: ASM International, pp. 431–437.
58. Shaw, W. J. D., Gowler, M. A. (1993). In: Henein, H. Oki, T., eds.ProcessingMaterials forProperties. Warrendale, PA: TMS, pp. 687–690.
59. Pan, J., Shaw, W. J. D. (1994). Microstruct. Sci. 21:95–106.60. Pan, J., Shaw, W. J. D. (1994). J. Appl. Polym. Sci. 52:507–514.
MD: SURYANARAYANA, JOB: 03320, PAGE: 445
4103-X_Suryanarayana_Ch17_R2_071504
Applications 445

61. Pan, J., Shaw, W. J. D. (1995). J. Appl. Polym. Sci. 56:557–566.62. Shaw, W. J. D. (1998). Mater. Sci. For. 269–272:19–30.63. Ishida, T., Tamaru, S. (1993). J. Mater. Sci. Lett. 12:1851–1853.
64. Ishida, T. (1994). J. Mater. Sci. Lett. 13:623–628.65. Farrel, M. P., Kander, R. G., Aning, A. O. (1996). J. Mater. Synth. Process 4:151–161.66. Namboodri, S. L., Zhou, H., Aning, A. O., Kander, R. G. (1996). Polymer 35:4088–4091.
67. Bai, C., Spontak, R. J., Koch, C. C., Saw, C. K., Balik, C. M. (2000). Polymer. 41:7147–7157.
68. Smith, A. P., Shay, J. S., Spontak, R. J., Balik, C. M., Ade, H., Smith, S. D., Koch, C. C.
(2000). Polymer. 41:6271–6283.69. Smith, A. P., Ade, H., Balik, C. M., Koch, C. C., Smith, S. D., Spontak, R. J. (2000).
Macromolecules 33:1163.
70. Koch, C. C., Smith, A. P., Bai, C., Spontak, R. J., Balik, C. M. (2000). Mater. Sci. For.343–346:49–56.
71. Ivanov, E., Patton, V., Grogorieva, T. (1996). In: Suryanarayana, C., et al., eds.Processingand Properties of Nanocrystalline Materials. Warrendale, PA: TMS, pp. 189–197.
72. Kim, W., Zhang, Q., Saito, F. (2000). J. Mater. Sci. 35:5401–5405.73. Yeong, B., Junmin, X., Wang, J. (2001). J. Am. Ceram. Soc. 84:465–467.74. Shuk, P., Suchanek, W. L., Hao, T., Gulliver, E., Riman, R. E., Senna, M., TenHuisen, K.
S., Janas, V. F. (2001). J. Mater. Res. 16:1231–1234.75. Gonzalez, G., Villalba, R., Sagarzazu, A. (2002). Mater. Sci. For. 386–388:645–650.76. Zoz, H., Ren, H. (2000). Mater. Sci. For. 343–346:955–963.
77. Zoz, H., Reichardt, R., Ernst, D. (1998). Metall. 51:521–527.78. Zhang, S., Lu, L., Lai, M. O. (1993). Mater. Sci. Eng. A171:257–262.79. Crone, W. C., Yahya, A. N., Perepezko, J. H. (2002). Mater. Sci. For. 386–388:597–602.
MD: SURYANARAYANA, JOB: 03320, PAGE: 446
4103-X_Suryanarayana_Ch17_R2_071504
Chapter 17446

18
Safety Hazards
18.1 INTRODUCTION
The safety hazards related to processing and handling of production quantities ofmetal or metallic powders have been the subject of extensive study and concern formany years. Injury to personnel and production facilities due to fire and/or explosionare often reported and could be catastrophic. Frequently, research personnel assumethat such major accidents occur only in production facilities and not in laboratories.This is not right. Many accidents have been reported in situations where only gramquantities of powders are involved. Weber et al. [1] have summarized some of thesafety hazards associated with milling of metal powders in laboratories andproduction facilities.
Powder handling requires safety precautions and cleanliness since certainpowders can have harmful effects on personnel exposed to them. Respirable powdersare a health concern and can cause disease or lung dysfunction. The particle size andspecific gravity of the powder largely determine the deposition site for an inhaledparticle. Coarse particles (larger than 10 Am) are trapped on the mucous membranesand do not reach the lungs; however, particles in the size range of 0.01–10 Am canreach the lungs and may be dissolved in the body. The specific consequences of suchdissolution depend on powder chemistry. However, it has been reported that powderparticles in the size range of 0.1–1.0 Am (100–1000 nm) require the greatest care inhandling.
Powders of some metals are toxic, especially when small; these include As, Be,Cd, Co, Cr, Pb, Ni, and Te. Hence, it is desirable to avoid contact with those metalsin the powdered form. The maximal occupational air exposure for many of the toxicmetals is less than 10�4 g/m3. Therefore, using protective equipment, safe handling of
4103-X_Suryanarayana_Ch18_R2_071504
MD: SURYANARAYANA, JOB: 03320, PAGE: 447
447

powders (such as in glove boxes) or robotic handling may be practiced. On alaboratory scale, however, handling of powders inside an evacuated (or inert gas-filled) glove box is recommended. It may also be emphasized that not all powders arehazardous; in fact, some powders are intentionally added to foods as vitamin andmineral supplements.
Another hazard with metal powders, especially when they are fine, is that theyare pyrophoric (burn in air) in the presence of oxygen. Therefore, a dust-freeenvironment is recommended. Metals such as Al, Zr, Ta, Th, Ti, and Mg can ignitein air at concentrations on the order of 40 g/m3, and this can occur at relatively lowtemperatures. The general precautions that must be taken in handling of powders ingeneral have been described [2].
Mechanically alloyed powders are produced by severe plastic deformation ofcoarse powder particles. As mentioned in earlier chapters, the characteristics ofmechanically alloyed/milled powder particles are small crystallite (grain) size, latticestrain, and presence of different metastable phases. All these effects increase the freeenergy of the system and make the material highly active. Due to the small particlesize, these powders have a large surface area and therefore chemical reactions couldoccur much faster than in coarse-grained materials. Furthermore, chemical reactionscould occur in these powders resulting in the evolution of heat (due to occurrence ofexothermic reactions). Therefore, in comparison to conventional powders, safetyhazards are accentuated in the mechanically alloyed powders due to the increasedstress and strain, temperature, and chemical reactivity.
18.2 HAZARDS RELATED TO MECHANICAL ALLOYING PROCESSES
In order to avoid damage to equipment and personnel during mechanical alloying(MA), one should be aware of the different processes that occur during MA/mechanical milling of powders. These have been described in earlier chapters andinclude powder deformation; fragmentation and cold welding of powder particles;solid-state diffusion to promote formation of solid solutions, intermetallics, andamorphous phases; occurrence of mechanochemical reactions; and formation ofultrafine grains, reaching down to nanometer dimensions. Thus, the safety hazardsassociated with MA are related to one or more of these processes.
During the-above mentioned processes, some phenomena occur irrespective ofthe nature of the final product phase, e.g., evolution of heat. Other phenomena thatoccur are gas evolution, especially during mechanochemical reactions, and increasedreaction rates during processing. All of these either alone or in combination couldcause explosions.
18.2.1 Heat Evolution
As mentioned in Chapter 8, the temperature of the powder increases during MA.This temperature increase could be due to the energy added via the mechanicalsystem used to run the mill (e.g., kinetic energy transferred to the milling powder andalso the frictional forces of the machine). In addition, chemical reactions occurring inthe powders could also raise the temperature of the powder. Temperature rise due to
MD: SURYANARAYANA, JOB: 03320, PAGE: 448
4103-X_Suryanarayana_Ch18_R2_071504
Chapter 18448

the first part could be minimized by a good basic design of the mill. Furthermore, inpractice, a fan is used to cool the system during the milling of powders. However, themore important aspect to be kept in mind is the temperature rise due to the chemicalreactions that occurs during milling. If the temperature reached by the powder ismuch higher than some critical ‘‘reaction temperature’’ for one or more of thecomponents being milled, then unexpected and possibly uncontrolled reactions couldoccur. The extent to which the heat generated could be hazardous depends on theamount of powder being processed, the rate at which the reaction occurs, and theability of the equipment to remove the heat.
It was also mentioned earlier that the instantaneous temperature experiencedby the powder particles at the time of impact of the grinding media could be a fewhundred degrees Celsius. This could lead to increased reaction rates and even meltingof the powder constituents.
18.2.2 Gas Evolution
Gases may be produced during milling due to decomposition of process controlagents, vaporization and/or sublimation of a deliberately added component, orchemical reactions among the components. All these effects could increase thepressure in the milling container. It is also possible in some instances when the millingcontainer lid is not tight that air or other ambient gases may leak into the containerand change the partial pressure of the gases inside the container.
In addition to the nature and volume of the gases inside the container, it isimportant to realize that some of the gases produced may be flammable, and so thepotential for fire or explosion exists. The partial pressures of the gases should notexceed the lower limit of inflammability for the atmosphere–temperature–pressurecombination.
18.2.3 Explosions
The presence of fuel and oxidant clouds, combined with an ignition source, is thenecessary condition for explosions. It is very easy to realize these conditions duringMA. Presence of extremely fine particles with a large surface area is a potentialsource of fuel. The oxidant is a gas such as oxygen. The ignition source could be thehigh temperatures reached by the powder or the static electricity generated whensolids move one over the other, i.e., during flow of powders. Explosion due to staticelectricity occurs whenever charge buildup takes place. This can be minimized byusing only electrically conducting containers, vessels, scoops, and tools, and bondingand grounding such items. Other sources of ignition are (1) electric devices thatproduce a spark such as electric switches; (2) impact sparks resulting from metalcontact with metal concrete; (3) friction heating as might be experienced with sleevebearings; and (4) failure of equipment, such as breakage of an attritor arm.
18.3 HANDLING OF MECHANICALLY ALLOYED POWDERS
Special precautions should also be taken during handling of powders subsequent toMA. This depends on powder characteristics such as particle size and shape,
MD: SURYANARAYANA, JOB: 03320, PAGE: 449
4103-X_Suryanarayana_Ch18_R2_071504
Safety Hazards 449

composition, surface condition, and gas content. Knowledge of these parametersfacilitates safe handling of powders as well as their conversion to a consolidatedform.
Pyrophorocity may be defined as the ability of a powder or dust to ignite whenexposed to a gaseous environment. Most commonly the gas is oxygen, but othergases, such as chlorine, nitrogen, carbon monoxide, and carbon dioxide, may also bevigorous oxidants. Mechanically alloyed powders are very fine and consequentlyhave a large surface area. Such powders have an increased tendency to pyrophoro-city. Thus, fine and/or irregularly shaped powder particles are more sensitive. Thecleaner and fresh powder surfaces produced during MA further accentuate theirsensitivity to pyrophorocity. For example, many metal powders in the 1-Am sizerange, (a size commonly seen during MA), such as iron and nickel, may bepyrophoric.
Mechanically alloyed powders tend to contain very large volumes of gases. Thegases can arise from occlusion of the milling atmosphere, volatile content or processcontrol agents, and products of reactions between the milled constituents. Thehazard potential for these high gas levels is significant, as many milled powders aresubjected to elevated temperatures during subsequent processing. Containment ofthese evolved gases can lead to high pressures and can cause explosions.
Immediately after MA the powders are hot (or at least warm). Therefore, thelid should not be immediately opened and the powder exposed to atmosphere. Insuch an event, the powder may ignite because of interaction with the oxygen. This ismuch more important when dealing with reactive powders such as magnesium.
Safety hazards such as explosions have been reported during milling ofpowders or subsequent handling of milled powders. Some of these have beencataloged by Weber et al. [1].
18.4 ACCIDENT AVOIDANCE
Knowledge about causes of accidents, education, and specialized test techniques willhelp the people involved in conducting MA to avoid injury to equipment andpersonnel, and even to prevent loss of life. Many sources of education andinformation are available to assist in the development and design of safe equipmentand powder production practices. When using commercially available equipment, itis necessary to consult the manufacturers’ brochures and data sheets.
An important source of information is the National Fire Protection Associa-tion (NFPA) at 1 Batterymarch Park, Quincy, MA 02169-3000, USA (Tel: 617-770-3000 or 1-800-344-3555; FAX: 617-770-0700; www.nfpa.org). The mission of thisassociation is ‘‘to reduce the worldwide burden of fire and other hazards on thequality of life by providing and advocating scientifically-based consensus codes andstandards, research, training, and education.’’ Two publications that are of primaryrelevance to the current discussion are the Fire Protection Handbook [3] and theNational Fire Codes [4]. The handbook is a general source guide and the codes areannual compilation of codes, standards, and guides. Other professional associations,such as the Aluminum Association, (Washington, DC, USA), American PowderMetallurgy Institute and the Metal Powder Industries Federation (Princeton, NJ,USA) are also valuable sources of information related to powder safety.
MD: SURYANARAYANA, JOB: 03320, PAGE: 450
4103-X_Suryanarayana_Ch18_R2_071504
Chapter 18450

REFERENCES
1. Weber, J. H., deBarbadillo, J. J., Mehltretter, J. C. Paper presented at the Second Interna-tional Conference on Mechanical Alloying for Structural Applications, Vancouver, BC,Canada, September 20–22, 1993 (not included in the Proceedings).
2. German, R. M. (1994). Powder Metallurgy Science. 2nd ed. Princeton, NJ: Metal PowderIndustries Federation, pp. 159–160.
3. Fire Protection Handbook. (2003). Quincy, MA: National Fire Protection Association (in
two volumes and about 3100 pages long).4. National Fire Codes, Quincy, MA: National Fire Protection Association (available on
CD-ROM and with automatic updates).
MD: SURYANARAYANA, JOB: 03320, PAGE: 451
4103-X_Suryanarayana_Ch18_R2_071504
Safety Hazards 451

4103-X_Suryanarayana_Ch18_R2_071504
MD: SURYANARAYANA, JOB: 03320, PAGE: 452

19
Concluding Remarks
From the previous chapters it becomes clear that mechanical alloying (MA) and therelated processes are simple, elegant, and useful and that they continue to attract theserious attention of researchers. Even though the technique was originally developedto produce oxide dispersion strengthened (ODS) nickel-based superalloys for aero-space applications, the technique has now matured to be applied to the synthesis of avariety of equilibrium and metastable alloy phases including solid solutions, quasi-crystalline and crystalline intermetallic phases, and amorphous alloys. New andvaried applications are being explored. This has resulted in significant research inrecent years. It is estimated that so far more than 7000 research/review papers havebeen published in this area, with nearly 500 papers being published annually duringthe past 4–5 years.
One of the greatest advantages of MA is in the synthesis of novel alloys that areeither impossible or difficult to prepare by any other technique, such as alloying ofnormally immiscible elements. This is because MA is a completely solid-stateprocessing technique and limitations imposed by phase diagrams do not apply here.The synthesis of nanostructured materials—both monolithic and composites—byMA has become an accepted practice in recent years due to the ease with which theyare obtained. However, the number of investigations that deal with the decompositionbehavior of metastable phases obtained by MA is still small.
On an industrial scale, MA is an accepted process. The ODS alloys processed byMA have a higher temperature operating capability at the same stress or increasedload bearing capability at the same temperature than alloys without an oxide dis-persion. The ODS alloys continue to find applications in a wide variety of industries.
In spite of a lot of research effort, the mechanism of phase formation duringMAis not well understood. It is most often proposed that the process of MA introduces a
4103-X_Suryanarayana_Ch19_R2_071504
MD: SURYANARAYANA, JOB: 03320, PAGE: 453
453

variety of defects (vacancies, dislocations, grain boundaries, stacking faults, and soforth) which raise the free energy of the system making it possible to producemetastable phases. But there are very few investigations that deal with the character-ization and quantification of the defects produced in mechanically alloyed powders.Furthermore, properties of the mechanically alloyed products (after consolidation ofthe powders) are reported only in a few cases, except for the ODS alloys. This isunderstandable because researchers are still struggling to find out the mechanism offormation of the different phases.
MA is a complex process that involves many variables, and many of them areinterdependent. Therefore, modeling of the MA process is difficult. In spite of somesuccess, one has to go much farther in developing models that can reach the final goalof predicting the nature of phases produced under a given set of milling conditions.
MD: SURYANARAYANA, JOB: 03320, PAGE: 454
4103-X_Suryanarayana_Ch19_R2_071504
Figure 19.1 Transmission electron micrographs showing the difference in the matrix grainsize, and size and distribution of dispersoids in rapidly solidified (RS) and mechanicallyalloyed (MA) materials.
Chapter 19454

There have not been enough investigations to predict the formation of different typesof phases based on thermodynamic or other models.
As mentioned in the text in different places, mechanically alloyed powderscontain a variety of metastable phases. Since there are many other nonequilibriumprocessing techniques that produce similar phases, comparisons are frequently made.The major comparison has been between MA and rapid solidification processing(RSP) techniques. Each of these two techniques has its own advantages andlimitations. An important difference between mechanically alloyed and rapidlysolidified alloys containing dispersoids appears to be in the size and distribution ofdispersoids. Figure 19.1 shows a pair of transmission electronmicrographs comparingthe matrix grain sizes, as well as size and distribution of dispersoids in hot isostaticallypressed compacts of Ti3Al-based alloys containing Er2O3 dispersoids. The rapidlysolidified alloy was Ti3Al to which 2 wt% Er was added and this was hot isostaticallypressed at 850jC after rapid solidification. The mechanically alloyed material wasTi-25Al-10Nb-3V-1Mo (at%) to which 2 wt% Er was added and the alloy powderwas hot isostatically pressed at 1000jC after MA. Even after hot isostatic pressing ata higher temperature, in comparison to the RSP alloy, the mechanically alloyed mate-rial showed a finer matrix grain size, more uniform distribution of the dispersoids,absence of large dispersoids at the grain boundaries, and absence of dispersoid-freezones near the grain boundaries.
Many other differences are also reported in the constitution of the alloysprocessed by RSP and MA methods. And these have been discussed in the respectivechapters. For example, mechanically alloyed materials show the formation ofamorphous phases in much wider composition ranges than in rapidly solidified alloys.Furthermore, it also appears that it is easier to produce an amorphous phase(including the bulk amorphous alloy compositions) by MA than by RSP. Sectionthickness limitations in bulk amorphous alloys obtained by solidification methods donot apply in the case of MA. This is because amorphous alloys produced by MA canbe consolidated into any thickness. This should also be possible in the amorphousalloys produced by solidification methods. However, detailed investigations on themechanism of formation of metastable phases and their decomposition to equilibriumcondition (including crystallization of amorphous alloys) have not been undertakenfor mechanically alloyed powders.
It is clear fromwhat has been described in the earlier chapters that research in thearea of MA is continuing to flourish and that new and exciting discoveries are takingplace. However, the industrial applications of mechanically alloyed materials stillappear to be confined to ODS alloys, even though new application avenues are beingexplored. One such area with immediate application potential is synthesis of materialswith novel compositions for hydrogen storage. There is so much more to learn aboutthe ‘‘science’’ of MA that the future of MA is assured for several years to come.
MD: SURYANARAYANA, JOB: 03320, PAGE: 455
4103-X_Suryanarayana_Ch19_R2_071504
Concluding Remarks 455

4103-X_Suryanarayana_Ch19_R2_071504
MD: SURYANARAYANA, JOB: 03320, PAGE: 456

Index
Abnormal grain growth, 354
Accident avoidance, 450Accumulative roll bonding, 30–32Acronyms, 32
Activation energy, 60, 74, 116, 118, 263, 304,315, 342, 344
Adjustable magnets, 50Advanced materials, 2
Aerospace applications, 11, 453Agate, 56Alumina, 22, 23, 56, 70, 96, 133, 134, 147,
153, 194, 197, 273, 285, 339, 348,362–367, 371, 372, 375, 377–379,388, 398, 425, 427, 428
Aluminum nitride, 70Alloying time, 408Amorphization kinetics, 76, 78, 293
Amorphization mechanism, 298Amorphous phase, 8, 9, 14, 21, 22, 28–30, 54,
59, 60, 63–67, 69, 70, 72–74, 76–78, 83,90, 92, 95, 101, 102, 105–107, 110, 113,
115, 116, 121, 122, 127, 129, 141, 159,160, 185, 187–190, 201, 202, 204, 205,212, 214, 215, 218–221, 225, 244, 245,
247, 251, 253, 257, 259–262, 269–272,291–307, 311–315, 318, 319, 333, 348,
[Amorphous phase]
374, 387, 401, 414–416, 419, 448,453, 455
Amorphous phase-forming range, 270, 292,
299, 317, 319Antiphase boundaries, 110, 121, 299Anti-site disorder, 78, 246–250, 252, 253, 256,
259–263
Atom probe-field ion microscopy, 108, 118Atomic-size factor, 139, 299–303, 310, 312Atomization, 7
Attritor mills, 23, 26, 29, 41, 43, 45, 47,54–56, 66, 129, 192, 273, 274, 282, 285,363, 388, 408, 410–413, 436
Mitui Miike MA 1D, 274, 280Netzsch 1S, 389Union Process (Szegvari), 23, 41, 43, 282
Zoz (Simoloyer), 41, 43–48, 55, 60, 395, 397Auger electron spectroscopy, 108, 118Autoignition, 336
Ball collisions, 122Ball impact, 124Ball milling, 12, 14, 32, 48
Ball mill, 21, 23, 24, 41, 43, 44, 47, 55, 88,192, 227, 272–274, 276, 278, 279, 280,
4103-X_Suryanarayana_Index_R2_080304
MD: SURYANARAYANA, JOB: 03320, PAGE: 457
457

MD: SURYANARAYANA, JOB: 03320, PAGE: 458
4103-X_Suryanarayana_Index_R2_080304
[Ball mill]282, 284, 285, 288–290, 362, 364, 366,388, 390, 391, 395, 396
Ball-to-ball collisions, 86, 122, 133, 374Ball-to-powder collisions, 83, 85, 86, 90, 122,
126, 133, 374
Ball-to-powder weight ratio (BPR), 32, 50,59, 62, 64–68, 122, 130, 132, 171, 188–190, 192, 194, 205, 206, 208–210, 271,
272, 274, 276, 278, 280, 282, 284, 286,288, 290, 292, 297, 344, 362, 364, 366,369, 370, 378, 386–388, 390, 394, 398,
399, 401, 405, 407, 408, 410, 411, 415,416
Ball-to-wall collisions, 86, 122, 133Ball size, 36, 67, 122, 125, 130, 131, 133, 369,
372, 412, 414, 415Ball temperature, 133–135Ball velocity, 37, 124, 410
Bearing bushes, 443Bearing materials, 442, 443Biocompatibility, 441
Benzene, 71, 73Bioactive glasses, 441Biological templating, 336
Biomaterials, 441Blended elemental powders, 7, 11, 14, 15, 22,
63–65, 83, 86, 98, 104, 127, 142, 143,146, 156, 159, 161, 162, 188, 190, 203,
205–207, 209, 212, 214, 217, 219, 221,270–272, 291, 293, 296–299, 306, 307,387, 394, 397, 398, 415
Borax, 70, 400, 401Boric acid, 70, 400, 401Boride phases, 221
Brittle-brittle system, 36, 89, 92–94Brunauer-Emmett-Teller (BET) method, 100Bulk amorphous alloy (metallic glass), 106,
295, 307–312, 455
Bulk mechanical alloying, 376Bulk modulus, 342
CALPHAD, 315Carbide phases, 221–223Catalysts, 26, 187, 420, 433, 444
Centrifugal ball mill, 129, 365Ceramic-matrix composites, 347Chain grafting, 440
Charge ratio, 32, 66Chemical reactivity, 448, 449Coble creep, 352Coefficient of thermal expansion, 338, 441
Cold welding, 12, 84, 90
Collision energy, 66Collision frequency, 407, 411Collision time, 408
Collision velocity, 407, 408, 411Combustion engines, 427Combustion reaction, 190, 209, 210, 361, 368,
369, 371, 372, 374, 375Combustion synthesis, 8, 209Commercial mills, 44–46, 51
Common tangent approach, 4, 5, 160, 161,313, 314
Comparison between MA and RSP, 16, 17,
169, 315, 454, 455Composite materials, 440Consolidation, 95, 96, 443Constitutional vacancies, 345
Contact temperature, 127Continuous production, 42Controlled atmosphere, 50
Corrosion rate, 429Corrosion resistance, 11, 12, 203, 220, 269,
311, 424, 427, 435
Creep resistance, 183, 429Creep strength, 423Critical grain size, 351
Critical milling time, 374Critical solidification (cooling) rate, 308, 309, 315Critical temperature, 263Cross contamination, 401
Cross-linking, 437, 440Cross slip, 345Cryomilling, 22, 23, 36, 37, 72, 122, 157, 337,
342, 401, 440Crystal structure, 1, 2, 104, 108, 116, 118,
140, 164, 184, 194–202, 217, 218, 220,
224, 226, 244, 262, 300, 301, 313,338–340, 342
Crystallite size, 61, 68, 74, 75, 89, 90, 96, 99,102, 110–113, 154–156, 161, 162, 187,
193, 211, 252, 263, 344, 346, 374, 377,393, 441–443, 448
Crystallization, 107, 115, 135, 189, 190, 199, 212,
216, 218, 292, 293, 304–307, 319, 342Crystallization reactions, 305Crystallization temperature, 60, 69, 106, 115,
271, 297, 304, 305, 307, 310, 315Cyclic phase transformations, 63, 197,
212–214, 216, 307
Cyclohexane, 71, 74
Damping capacity, 427Darken-Gurry plots, 167–169
Dead zones, 23, 44, 54, 412
Index458

MD: SURYANARAYANA, JOB: 03320, PAGE: 459
4103-X_Suryanarayana_Index_R2_080304
Defect density, 90, 121, 254, 361Deformation bands, 128Deformation-induced martensite, 191, 192
Dental amalgams, 7Dental filling materials, 441Devitrification of amorphous phases, 336
Devulcanization, 438Didodecyl dimethyl ammonium acetate, 71Dihexadecyl dimethyl ammonium acetate,
71Differential scanning calorimetry, 106, 107,
114–116, 128, 154, 222, 244, 263, 264,
304, 305, 440Differential thermal analysis, 106, 107,
114–116, 244, 304, 305Diffusion, 76, 88, 121, 156, 159, 189, 297, 333,
343, 349, 428, 433Grain boundary, 353Lattice, 353
Diffusion barrier coatings, 433, 435Disclinations, 375Discontinuous additive mixing, 211
Dislocations, 86, 88, 94, 110, 121, 128, 158,162–164, 184, 244, 254, 264, 299, 337,338, 351, 352, 375, 454
Dislocation pile-up, 346Disordering mechanism, 243, 259DISPAL, 22, 427, 428Dispersion strengthening, 72, 221, 351, 377,
422Dispersoids, 400, 428Dispersoid-free zones, 455
Displacement reactions, 15, 360, 370, 372,374, 377
Dodecane, 70–72
Double mechanical alloying (dMA), 22, 24,25, 32
Driven alloys, 5Dry grinding, 37, 42
Ductile-brittle system, 36, 37, 89, 91, 92, 94Ductile-brittle transition temperature, 352Ductile-ductile system, 36, 87, 89, 91, 94
Ductility, 184, 203, 243, 311, 349, 352, 353,407, 428
Dynamic recovery, 345
Dynamic recrystallization, 420
Elastic mismatch energy, 300, 311, 313
Elastic modulus, 203, 349Electric shavers, 187Electrical resistivity, 118, 349Electrochemical effect, 140
Electrochemical processes, 376
Electrodeposition, 5, 203, 334, 336, 352Electronegativity, 140, 164, 167, 168, 301,
302, 312
Electron compounds, 190Electron diffraction, 102–106, 185, 186,
337
Electron excitations, 375Electron micrograph, 97, 99, 102, 103, 108,
185, 186
Energy conversion, 435Energy-dispersive X-ray analysis, 161Energy transfer, 125, 405, 412, 415
Enhanced sinterability, 353Enthalpy, 2, 3Entropy, 2, 3Environmental pollution, 437
Environmental resistance, 183Equal channel angular extrusion, 32, 376Equal channel angular pressing, 29–32
Ethyl acetate, 70–73Ethyl alcohol, 70–72, 147–149, 158, 400,
401
Ethylenebisdistearamide (Nopcowax-22DSP), 71, 72, 400
Eutectic crystallization, 304
Eutectic system, 4, 140,Evolution of particle size, 87–91Exchange reactions, 26, 360Exothermic reaction, 107
Explosive reactions, 209, 210Extended electron energy loss fine structure,
263
Fatigue crack growth, 425Fertilizers, 444
Field activation, 207Field-ion microscopy, 108Figure of merit, 437Filamentary structure, 333, 334
Filling factor, 414Firing kiln rollers, 424Flat-ended vial, 38, 61, 66
Flexural strength, 311Focused ion beam lift-out method, 108Focused ion beam milling, 107
Food heater, 420, 429Forcing parameter (g), 157, 158, 294Formation enthalpy, 312, 313
Fracture toughness, 184, 269, 311, 347, 407,410, 411, 425
Free energy, 2–6, 78, 117, 141, 160–162, 193,216, 245, 250, 260, 291, 293, 296, 298,
299, 303, 313, 315, 448
Index 459

Friction-free mechanical grinder, 53Fritsch Pulverisette, 40, 47, 48, 60, 62–64, 96,
128, 129, 188, 189, 192, 194, 195, 208,
212, 227, 251, 272–277, 279–290, 344,360, 363–366, 378, 388–391, 400, 411,413
Fuel cells, 429Fuel cladding, 425Functional ceramics, 420
Fundamental reflections, 252, 256, 257Furnace baskets, 425
Gas absorbers, 26, 420Gas condensation, 334Gas-cooled reactors, 425Gas evolution, 449
Gas pressure measuring system, 40Gas turbine applications, 7, 11, 424Giant magnetoresistance, 379
Glass-forming ability, 297, 301, 306, 308,310, 312, 316
Glass-forming range, 72, 272, 274, 276, 278,
280, 282, 284, 286, 288, 290, 306, 312,314–319
Glass transition temperature, 106, 115, 269,
295, 303, 304, 310, 440Glove boxes, 448Golf club heads, 311Grain boundaries, 29, 30, 78, 86, 88, 94, 121,
156, 158, 161, 162, 244, 245, 250, 251,259, 293, 299, 333–336, 346, 351, 353,433, 454, 455
High-angle, 337Low-angle, 337
Grain boundary diffusivity, 352
Grain boundary energy, 78Grain boundary sliding, 351Grain boundary thickness, 334, 336, 352Grain growth, 23, 107, 117, 118, 206, 263,
348, 353, 354Grain refinement, 35, 207, 243, 250, 254, 257,
259, 338, 346, 349
Grain size, 14, 24, 65, 74–78, 89, 90, 99, 107,108, 110–113, 117, 161, 162, 184, 206,293, 299, 333, 335–339, 344–346, 348,
349, 351, 352, 354, 369, 419, 432, 436,443, 448, 455
Grain size distribution, 108, 109, 354
Grain size exponent, 117, 118Granite dust, 436, 437Graphite, 71Grinding ball, 39, 40
Grinding medium, 23, 35, 39–43, 47, 48, 53–56,59–61, 64–66, 68, 76, 83–85, 87, 90, 123,124, 126, 130, 131, 155, 202, 210, 271,
272, 274, 276, 278, 280, 282, 284, 286,288, 290, 292, 295, 371, 385–388, 390,393, 395, 397, 398, 400, 401, 405, 407,
409, 412, 414Grinding medium selection, 55–57Grinding vial, 40
Growth rate, 336Guide vane, 423
Hall-Petch relationship, 349, 351Inverse behavior, 351
Hard magnetic properties, 7Hard sphere model, 334
Hardness, 56, 67, 90, 160, 333, 343, 348, 350,351, 407–410, 434
Head-on collisions, 124, 126
Heat of adsorption, 100Heat capacity, 41Heat conductivity, 133
Heat exchangers, 423, 425Heat of formation, 301, 312, 372Heat of mixing, 158, 159, 163, 297, 299, 310,
314, 316Heat transfer, 123, 127, 135Heptane, 71, 72Hexagonal close-packed structure, 155
Hexane, 70–72, 223, 400Hertz radius, 408High-energy ball mill, 7, 12, 21, 22, 37, 50,
52–54, 64, 66, 88, 129, 223–225, 274,275, 279, 281, 289, 360, 388, 438, 443
High-pressure phases, 193, 195, 202
High-speed MA, 54High-speed shaker mill, 13High-temperature alloys, 427, 428High-temperature phases, 194, 195, 224, 261,
262High-temperature superconductors, 1High-velocity oxy fuel spray, 434
Hollow spherical powders, 96Horizontal ball mill, 199, 272, 275, 283, 284,
286, 391, 411
Hot corrosion resistance, 421, 424Hot extrusion, 13, 14, 95Hot isostatic pressing, 13, 95, 108, 109, 117,
208, 427, 434, 443, 455Hot pressing, 95, 199, 201Hot-stage electron microscopy, 218Hume-Rothery phases, 190
MD: SURYANARAYANA, JOB: 03320, PAGE: 460
4103-X_Suryanarayana_Index_R2_080304
Index460

Hume-Rothery rules, 139, 140, 164–166Hydrogen absorption, 432, 433Hydrogen desorption, 432, 433
Hydrogen pumps, 432Hydrogen sorption kinetics, 432Hydrogen storage material, 26, 187, 420, 429,
430, 432, 434, 443, 455Hydrostatic pressing, 54Hydrothermal pyrolysis, 336
Hydroxyapatite, 441
Ignition temperature, 25, 369, 370, 372, 374, 375
Ignition time, 361, 362, 364, 366, 371, 372, 375Ilmenite, 378Immiscible alloy systems, 156Impact angle, 408
Impact energy, 39, 48, 49, 62, 65, 311Impact forces, 42Impact frequency, 40, 50, 53, 62, 405–407,
410, 411Impact velocity, 50, 53, 406–408, 410–412IN-9021, 427
IN-9052, 427IN-905XL, 427Incubation time, 372
Industrial applications, 419, 455Inert gas condensation, 336Infrared thermography, 104Instrumental broadening, 110, 112
Intercrystalline region, 334–336Interfacial component, 353Intermetallic, 8, 14, 21, 22, 24, 63, 70, 76, 83, 84,
89–92, 101, 121, 122, 140, 160–162, 183,184, 189, 190, 196, 203, 205–209, 211,212, 216–218, 243, 244, 247, 253, 254,
259, 260, 262, 270, 271, 291, 294–296,298–300, 306, 307, 314–316, 372, 376,386, 428, 432, 434, 448, 453
Amorphization of, 190
Disordered, 245, 259, 264Disordering of, 9, 14, 15, 184, 203, 243,
252, 260–262
Nanostructured, 203, 253, 432Ordered, 211, 216, 244, 246, 247, 251, 259,
260
Permanently ordered, 183, 219, 260Reversibly ordered, 183, 260
Interrupted milling, 190, 209
Interstitial compounds, 203, 392, 398Interstitial positions
Octahedral, 249, 250Tetrahedral, 249, 250
Ion implantation, 6Ion mixing, 8, 319Irradiation, 5, 6, 243, 250, 270, 300, 315
Isomorphous system, 140, 144, 167
Johnson-Mehl-Avrami analysis, 116
Kinetic energy, 65, 130, 292, 410–412Kinetics of
Alloying, 159Amorphization, 293, 295Disordering, 251
Reordering, 263Kissinger method, 116, 304
Lamellar spacing, 85, 86, 88–92, 133, 160, 410
Lamellar structure, 85, 160, 333, 334Lance pipes, 424Laser processing, 7, 8, 140, 243, 269, 319,
320, 336Lattice defects, 63, 160, 299, 374Lattice disordering, 184
Lattice expansion, 253, 254–259, 299Lattice mismatch, 219Lattice parameter, 74, 104, 118, 142–145,
154, 155, 163, 218–220, 244, 247, 248,252–256, 258, 259, 392, 393
Lattice stability, 219Lattice strain, 74, 76, 96, 102, 104, 110–113,
154, 187, 250, 252, 257, 299, 337, 344,349–351, 393, 448
Layered structure, 87, 333, 334
Linear intercept method, 108Liquid phase sintering, 443Literature resources, 14–17
Lithium-1,2 bisdodecyloxycarbonylsulfasuccinate, 71
Local temperature pulse, 122Long-range order, 22, 216, 244, 251, 253, 254,
257, 291, 300, 303Long-range order parameter, 243, 244, 251,
252, 254, 255, 257, 299
Low-energy grain boundary structures, 354Low-energy mill, 45, 64, 66, 223–225, 297,
360, 386
Low-temperature phase, 194, 195, 261, 262Low-temperature solders, 441Lubricating properties, 442
Magnesium hydride, 433, 434Magnetic properties, 212, 213, 250, 254, 256,
259, 315
MD: SURYANARAYANA, JOB: 03320, PAGE: 461
4103-X_Suryanarayana_Index_R2_080304
Index 461
Magnetoresistance, 154MA 6000, 421, 422, 424MA 754, 421–423
MA 757, 421MA 758, 421, 423MA 760, 421
MA 956, 421, 424–427MA 957, 424, 425Magnesium alloys, 429–434
Magnetic properties, 248, 348, 379Magnetic susceptibility, 244, 255Mar-M200, 422
Martensitic transformation, 191Meals, ready-to-eat, 429, 430Mechanical activation, 37, 190, 202, 360, 373,
375, 377, 420, 438, 439
Mechanical crystallization, 212, 295, 306, 307Mechanical degradation, 377Mechanical disordering, 22, 32, 212, 215, 394,
395Mechanical grinding, 22, 32, 244Mechanical milling, 22, 32, 35, 78, 83, 95,
190, 194, 212, 243, 254, 255, 270, 288,334, 340, 359, 376, 434, 438, 448
Mechanically activated annealing, 22, 24, 32
Mechanically activated self-propagatinghigh-temperature synthesis, 22, 24,25, 32, 104
Mechanically induced glass formation
reaction, 32Mechanically induced solid-state
devitrification, 32, 307
Mechanochemical leaching, 438Mechanochemical processing, 9, 14, 15, 26,
32, 62, 185, 348, 359, 360, 368, 373,
375–377, 420, 439, 441, 443, 448Mechanochemical synthesis, 26, 360, 374,
377, 378, 438Hard, 26
Soft, 26Medical implants, 7Medium-energy mill, 223–225
Megamill, 48, 49Megapact, 48, 49Melt spinning, 7, 216
Mesh number, 98Mesh size, 98Metal extraction, 438
Metal hydrides, 429, 430Metal matrix composites, 187, 347Metallic glasses, 1, 106, 116, 269, 270, 295,
306, 308, 310, 312
Metastable phases, 5, 7–9, 14, 27, 30, 64, 66,67, 73, 74, 83, 86, 95, 104, 115, 185,189, 191, 192, 202, 212, 214, 216, 225,
243, 292, 307, 372, 386, 419, 448, 453,455
Metglas 2605CO, 306, 307
Metglas 2605-S2, 306, 307Methyl alcohol, 70–75Microhardness, 67, 87, 244, 263
Microstructural features, 2, 95, 116, 118, 352Microstructural refinement, 85, 86, 88, 90,
123, 205, 361, 406, 408
Miedema model, 248, 249, 260, 300, 313–315Milling atmosphere, 22, 48, 50, 59, 69, 155,
197, 200, 224, 253, 385, 386, 392, 393,395, 398, 399, 405, 410, 450
Milling conditions, 385, 387, 405, 454Hard, 64, 66, 67, 292, 297, 372Soft, 64, 66, 67, 189, 225, 292, 372, 415
Milling container, 35, 41, 50, 59–61, 72, 76,122, 131, 155, 157, 271, 295, 385–387,392, 393, 396–398, 401
Milling container seal, 392, 398, 399, 401Milling efficiency, 37, 65, 171Milling energy, 45, 48, 49, 59, 62–64, 291,
292, 342, 344, 345, 394Milling equipment, 385, 386, 393, 395, 396,
400Milling intensity, 61–64, 155, 160, 171, 188,
189, 225, 251, 254, 292, 293, 297, 344,371, 375, 386, 401, 405
Milling maps, 9, 405, 406, 413, 415, 416
Milling speed, 50, 61–63, 122, 272, 274,276, 278, 280, 282, 284, 286, 288,290, 394, 416
Milling temperature, 36, 48, 59, 60, 62, 64,76–78, 122, 131–133, 156, 158, 291–294,297, 311, 338, 342, 344, 345, 369, 370,401, 405
Milling time, 37, 45, 51, 54, 55, 59, 63, 64, 67,68, 73, 75, 96, 110–112, 122, 130, 133,142–145, 162, 188, 192, 194, 195, 204,
206, 210, 213, 215, 251, 252, 255–259,263, 264, 291, 293, 306, 350, 369, 370,373–375, 386–388, 390, 392–395, 401,
405, 406, 415, 416, 437, 440, 441Milling vial temperature, 368Mineral processing, 438
Minimal grain size, 29, 30, 111, 338–346Normalized, 342, 343
Minimal solute concentration, 303, 304, 310Misfit parameter, 163
MD: SURYANARAYANA, JOB: 03320, PAGE: 462
4103-X_Suryanarayana_Index_R2_080304
Index462

Models for amorphization, 298–304Modeling, 9, 14, 405–407, 454
Global, 407, 408, 411
Local, 407, 408, 411Mossbauer spectroscopy, 109, 244, 255Motor cycle pistons, 427
Multilayer amorphization, 26, 28Multiple mill chambers, 49
Nanocomposites, 9, 14, 311, 346–348,377–379, 420, 434, 435, 453
Nanocrystalline materials, 1, 5, 9, 15, 25, 29,
54, 89, 110, 116, 161, 162, 333, 335,336, 346, 348, 349, 351–354, 377, 453
Nanoglasses, 334, 419, 432–434Nanoquasicrystals, 334
Nanostructure, 61, 76, 78, 95, 105, 107, 121,122, 127, 162, 187, 188, 224, 225, 250,291, 293, 299, 307, 311, 334, 337, 346,
371, 432Nanostructured coatings, 435Neutron diffraction, 105
New designs (of mills), 47–55Nickel-base superalloys, 421–424Nitride phases, 221, 224, 225
Nomenclature, 8Non-equilibrium processing, 2, 5–8, 14, 17,
140, 154, 169, 171Nucleation rate, 336
Octane, 71ODM 061, 427
ODM 331, 427ODM 361, 427ODM 751, 427
Ordering energy, 263, 300Ordering enthalpy, 251Oscillatory ball mill, 63, 194Osteoconductive properties, 441
Oxidation-attrition milling-reduction, 25, 32Oxidation reactions, 360Oxidation resistance, 8, 11, 220, 421, 422,
424, 425, 435Oxide dispersion microforged material, 425,
427
Oxide Dispersion Strengthened (ODS) alloys,7, 11, 13, 32, 36, 85, 90, 92, 419–422,443, 455
Aluminum-based alloys, 425, 427Iron-based alloys, 421, 424Nickel-based alloys, 15, 421, 424, 453
Oxalic acid, 70
PM 3030, 422PWA 454, 422Paints, 443, 444
Paraffin, 71Partially stabilized zirconia, 61, 64Particle shape, 95, 96, 449
Particle size, 13, 36, 67, 70, 72, 73, 75, 76,87–90, 92, 96, 98, 99, 110, 154, 156,161, 193–195, 206, 209, 371, 374,
408–410, 442, 447, 449Particle size distribution, 88, 89, 96–98, 100Particle size refinement, 35, 95, 208, 361, 387
Peak broadening, 104, 110–113, 154, 155, 187,252, 257
Perovskite structure, 201Pearson symbol, 218, 220
Petrol, 71Phase constitution, 95Phase separation, 102, 158
Phase stability, 3, 4Phase transformations, 26, 36, 40, 41, 123,
127, 207, 219, 221, 336, 360, 376, 406,
413, 414Phosphate fertilizer, 439Pigments, 444
Planetary ball mill, 39–41, 47, 54, 55, 62, 63,72, 74, 76, 125, 129, 131–133, 187, 188,195, 212, 218, 272, 274–290, 292, 307,344, 360, 362, 363, 365, 378, 388, 389,
391, 394, 411–415, 441AGO-2, 40, 131, 133, 134, 188, 192, 287DSP-1P, 279
QF-1, 279QM-1F, 272QM-1SP, 190, 272, 365, 388
QM-4H, 279Retsch PM 4000, 273, 278, 282, 283,
285–287, 290, 388, 390, 391WL-1, 195
Plasma activated sintering, 95Plasma processing, 2, 8, 269, 336Plasma spraying, 435
Plastic deformation, 12, 26, 29, 70, 184, 191,243, 245, 298, 303
Plate velocity, 125
Point defects, 128, 158Polyethylene glycol, 70–73, 75Polymer-matrix composites, 347
Polymeric materials, 439–441Polymorphic crystallization, 304Polymorphs, 193, 194Polymorphous phase diagram, 303
MD: SURYANARAYANA, JOB: 03320, PAGE: 463
4103-X_Suryanarayana_Index_R2_080304
Index 463

Powder coating, 407, 411Powder contamination, 9, 12, 23, 24, 37, 48,
53, 56, 57, 60, 61, 64, 66, 69, 85, 155,
195, 202, 204, 205, 207, 208, 215, 220,253, 262, 291, 292, 294, 345, 385, 386,388, 392, 394–398, 401, 443
Minimization of, 395–401Sources of, 386, 387, 392–395
Powder diffraction files, 102, 104
Powder handling, 447, 449Powder morphology, 67, 84(Powder) processing stages, 84–87
Powder safety, 450Powder temperature, 133, 372, 448, 449Powder yield, 47, 61, 72, 75, 208Pozzolan, 436, 437
Prealloyed powders, 8, 22, 35, 36, 83, 87, 270,271, 288, 299, 387, 394, 398–400
Prealloyed intermetallics, 244
Precipitation hardening, 11, 420, 422Preferred orientation, 337Premilling, 209, 410
Primary crystallization, 304, 306Process control agent (PCA), 22, 32,
35, 59, 70–76, 155, 156, 158,
159, 205, 207, 208, 369, 371,385, 386, 398, 400, 401, 405,425, 428
Process control optimization, 405, 407, 411
Process variables, 9, 35, 121, 156, 159, 291, 292Mechanochemical processing, 369, 375Minimal grain size, 342, 345
Modeling, 405–407, 410Quasicrystalline phases, 189, 190Solid solubility extensions, 156–160
Solid-state amorphization, 291–295Pyrophoricity, 12, 450
Quadruple-defect disorder, 246, 248, 249,
260, 261Quantitative microscopy, 107Quasiperiodicity, 186
Quasicrystals, 1, 7, 14, 15, 101, 102, 186, 334Decagonal, 101, 102, 105, 185–187Icosahedral, 101, 102, 105, 185, 187, 189
Stable, 186Quasicrystalline phases, 63, 83, 95, 101, 102,
113, 127, 185, 187–190, 334, 376, 419,
453
Radial distribution function, 105, 305, 315Raman spectroscopy, 219
Rapid solidification processing, 2, 5–8, 16, 17,26, 115, 129, 140, 141, 169–173, 186,187, 190, 243, 269, 270, 291, 294, 295,
297–299, 301, 303–306, 312, 315–318,336, 351, 376, 427, 428, 454, 455
Reaction byproduct, 369
Reaction kinetics, 116, 370, 373, 433Reaction mechanism, 373, 375Reaction milling, 22, 32, 359, 428
Reaction rates, 360, 370, 441, 449Recovery, 121, 292, 339, 420Recrystallization, 121, 292, 339, 420
Recrystallization temperature, 31, 128Redistribution of interstitials, 246, 249, 250,
260–262Reduced glass transition temperature, 295,
308–310, 315Reduction reaction, 360, 361, 370, 371,
373
Refractory compounds, 8, 36, 220, 221Relative valency effect, 140Relative velocity, 130
Reordering kinetics, 263Repeated cold rolling, 27, 28Rod milling, 22–24, 47, 48, 272, 273, 282,
283, 288, 390, 394–396, 411Roll bonding, 30Rotation speed, 62Round-ended vial, 38, 61, 66
Rule of mixtures, 440
Safety hazards, 9, 447, 450
Sample preparation, 110Scanning electron microscopy, 93, 96–99,
118
Scherrer formula, 110, 111, 113Scrap tire rubber, 437Secondary recrystallization, 420Seebeck coefficient, 436
Seebeck potential, 436Severe plastic deformation, 29, 33, 83, 94,
156, 160, 203, 243, 336, 448
Self-propagating high-temperature synthesis,24, 25, 68, 190, 207, 209, 210, 226, 349,361, 368, 369, 374
Self-sustaining reactions, 360Shape memory alloys, 443Shear bands, 337
Shearing forces, 42Shock consolidation, 95Short-circuit diffusion paths, 86, 353Short-range order, 244, 253, 254, 263, 301
MD: SURYANARAYANA, JOB: 03320, PAGE: 464
4103-X_Suryanarayana_Index_R2_080304
Index464

Silicide phases, 221, 226, 227Silicon grease, 71Size refinement, 24
Sliding friction, 124Sliding wear, 336Slip factor, 415
Slip lines, 128Sodium chloride, 71Sodium-1,2 bis(dodecyl carbonyl)
ethane-1-sulfonate, 71Soft magnetic materials, 7, 311, 334, 349Sol-gel method, 26, 336
Soldering materials, 443, 444Solid solubility, 4, 72, 76, 92, 140, 141, 145,
154–161, 163, 164, 166–168, 171, 173,295, 296, 353, 428, 441
Equilibrium, 141, 146–153, 164Solid solubilitydetermination,142–145,153–156Solid solubility extension, 122, 140, 142, 145,
153, 155, 156, 160, 164, 169, 171, 173Solid solubility limit, 14, 139, 141–146, 154,
155, 158–161, 163–165, 170, 171, 220,
392, 436Solid solubility plots, 164Solid solution, 21, 22, 28, 36, 59, 62, 65,
74–76, 83, 90, 101, 109, 121, 127,139–145, 154, 156–160, 162, 204,205, 217, 219, 221, 244, 245, 247,248, 251, 253, 259–262, 271, 291,
293, 294, 296, 297, 299, 300, 304,313, 314, 342, 344, 345, 369, 374,376, 386, 387, 427, 448, 453
Equilibrium, 21, 142Supersaturated, 7, 9, 14, 21, 27, 61, 64, 67,
70, 76, 95, 139–142, 154, 156, 157, 160,
162, 163, 169, 205, 218, 219, 299, 386,419
Solid solution softening, 345Solid solution strengthening, 344, 345, 351,
420–422, 427Solid state amorphization, 15, 33, 76, 270,
298, 303
Solid-state quenching, 5Solid-state reactions, 360Solid-state transformations, 3
Solute drag, 354Sonochemical synthesis, 336Spark erosion, 336
Specific heat, 3, 124, 349SPEX8000 mill, 38, 60, 96, 129, 188, 192, 194,
195, 272–286, 288, 289, 295, 344, 345,362–367, 378, 388–391, 412
SPEX mill, 37, 40, 41, 45, 53, 60–62, 66, 67,77, 78, 97, 99, 124, 125, 130, 135, 202,208, 209, 222, 262, 270, 275, 277, 278,
286, 306, 344, 360, 371, 386, 387, 389,395, 397–400, 408–412, 414, 415
Spin-glass behavior, 248
Spinodal decomposition, 154Spray coatings, 434Spray conversion processing, 336
Spray forming, 2, 8Sputtering, 140, 171, 319Stacking faults, 88, 102, 110, 113, 121, 154,
155, 244, 245, 454Stacking fault diameter, 155Stacking fault energy, 155, 342Steady-state condition, 35, 87–90, 96, 111,
130, 132, 144, 155, 157, 387, 401Steady-state creep rate, 428, 429Stearic acid, 12, 70–75, 400
Stirred ball mill, 13, 41, 363, 370Strain broadening, 113Strain energy, 310
Strain hardening, 352Strain rate, 410Strain-rate sensitivity, 31
Stress corrosion cracking, 425, 427Stress rupture properties, 422Structural relaxation, 115Structure factor, 305, 315
Subgrains, 337Sulfidation resistance, 422, 424Superconducting compounds, 217, 250, 420
Superconducting transition temperature,244, 247, 255, 315
Supercooled liquid region, 308–311
Supercorroding alloys, 429Superdislocations, 183, 184, 243Superlattice reflections, 244, 252, 256, 258Super Misuni NEV mill, 48, 50, 192, 224, 281,
282, 285, 289, 364Superplasticity, 31, 353Surface active agents, 12
Surface active states, 375, 376Surface area, 95, 99, 100, 102, 117, 387, 449, 450Surface energy, 193
TMO-2, 421T0 curve, 141
Temperature measuring system, 40Temperature rise, 9, 67, 71, 86, 88, 94, 121–124,
126, 128–133, 135, 156, 157, 189, 215,297, 299, 306, 307, 406, 410, 448, 449
MD: SURYANARAYANA, JOB: 03320, PAGE: 465
4103-X_Suryanarayana_Index_R2_080304
Index 465

MD: SURYANARAYANA, JOB: 03320, PAGE: 466
4103-X_Suryanarayana_Index_R2_080304
Terminal solid solution, 160Tetrahydrofuran, 71Thermal conductivity, 123, 124, 126, 132,
220, 349, 436, 437Thermal diffusivity, 126, 134Thermal fatigue resistance, 423
Thermal relaxation, 319Thermal spray methods, 434Thermal stability, 76, 311, 353, 354
Thermally enhanced glass formationreaction, 33, 297
Thermochemical processing (TCP), 207
Thermocouple protection tubes, 424Thermodynamic stability, 2, 5Thermodynamics, 295, 360Thermoelectric performance, 436
Thermoelectric power, 437Thermoelectric power generator materials,
435, 436
Thermoelectric properties, 436, 437Thermomechanical processing, 1, 351, 420,
424, 425
Thermophoretic forced flux system, 336Thermopower generation, 187Thin foil specimen, 107
Time-resolved X-ray diffraction, 104Titanium aluminides, 93, 108, 109, 218–220,
364, 398–400, 427Toluene, 71, 371
Transformation behavior, 113, 114, 118Transformation temperature, 116, 246, 300Transgranular rupture, 425
Transition phase, 373Transmission electron microscopy, 92, 93, 96,
102, 105, 106, 108, 110–113, 116, 118,
145, 161, 185, 187, 190, 219, 304, 305,337, 376, 454, 455
Tribological properties, 434Tricalcium phosphate, 441
Triple-defect disorder, 246–248, 250, 260, 261Triple junctions, 108, 334–336Turbine blades, 422, 435
Turbine vanes, 422, 423, 435Twin boundaries, 110, 113
Ultrafine-grained material, 29Ultra lightweight alloys, 427, 428Undercooled liquid, 296
Uni-ball mill, 48, 49–51, 54, 62, 96, 195, 225,281, 293, 362, 364–366, 390, 391
Vacancies, 86, 88, 121, 156, 244, 263, 299, 454
Vacancy hardening, 345
Vacancy-type disorder, 247, 253Vacuum grease, 71Vacuum furnace fixtures, 424
Baskets, 424Furnace racks, 424Muffles, 424
Thermowells, 424Trays, 424
Vacuum hot pressing, 13
Valence electron concentration, 190Vapor deposition, 2, 5, 6, 8, 140, 243, 269,
270, 334, 348
Chemical, 8, 243, 334, 336Physical, 8, 336
Vegard’s law, 154Vial diameter, 131
Vial filling, 59, 68, 133Vial temperature, 130Vibration ball mill, 48, 76, 96, 129, 130, 132,
216, 222, 244, 272–274, 277, 279,281–284, 288, 363, 389, 390, 412, 439
Invicta BX920/2, 45, 289, 344
Retsch MM2, 288Vibrating frame mill, 47Vulcanization, 437
Warren-Averbach analysis, 111
Waste utilization, 420, 436WC-Co composites, 434Wear
Abrasive, 435Adhesive, 435
Wear-resistance, 7, 8, 347, 434, 435
Wet grinding, 37, 194Williamson-Hall analysis, 111
‘‘X-ray’’ amorphous, 105X-ray diffraction, 61, 102–106, 110, 111, 113,
116, 118, 128, 142, 145, 153, 154, 187,204, 213, 219, 244, 248, 252, 256, 263,315, 386, 392, 398
X-ray photoelectron spectroscopy, 108, 118,219, 295, 386
Yield strength, 353
Young’s modulus, 184, 220Yttria-stabilized zirconia, 61, 64
Zener drag, 354Zero emission vehicle, 434
Zirconia, 64
Index466

4103-X_Suryanarayana_Ch19_R2_071504
MD: SURYANARAYANA, JOB: 03320, PAGE: 456

4103-X_Suryanarayana_Ch19_R2_071504
MD: SURYANARAYANA, JOB: 03320, PAGE: 456

4103-X_Suryanarayana_Ch19_R2_071504
MD: SURYANARAYANA, JOB: 03320, PAGE: 456

4103-X_Suryanarayana_Ch19_R2_071504
MD: SURYANARAYANA, JOB: 03320, PAGE: 456

4103-X_Suryanarayana_Ch19_R2_071504
MD: SURYANARAYANA, JOB: 03320, PAGE: 456

4103-X_Suryanarayana_Ch19_R2_071504
MD: SURYANARAYANA, JOB: 03320, PAGE: 456