
4.5 Primary Data Processing Menu (PR) - USGSADAPS: Chapter 4.5 Primary Data Processing Menu (PR) The...
115
ADAPS: Chapter 4.5 Primary Data Processing Menu (PR) 4.5 Primary Data Processing Menu (PR) This section presents the programs used for primary data processing of records. These programs provide for the entry and update of all elements necessary to process a record of hydrologic data. The programs are presented in the order that they generally would be used in the record computation process, including the edit of time-series data, entry and update of data corrections, ratings and shift corrections, primary computations, and editing and tabling programs to complete the record. The programs can be accessed from the ADAPS menu as well as from outside ADAPS by using the program name. PROGRAM NAME TASK DESCRIPTION SECTION THRESHOLD_EDIT Update Data Descriptor Thresholds 4.5.1 TS_EDIT Edit Time-Series Data using Hydra 4.5.2 MISTE Missing Streamflow Estimation 4.5.3 DC_EDIT Update/Display Data Corrections 4.5.4 RT_EDIT Update/Display Rating Tables 4.5.5 SHIFT_ANLY Shift Analysis and Error Bars 4.5.6 SV_EDIT Update/Display Shifts 4.5.7 PRIMARY Primary Computations 4.5.8 DVTABLE_EDIT Edit Daily-values Statistical Summary 4.5.9 DV_MANIP Daily-values Manipulation 4.5.10 UV_TABLE Print/Display Unit-Values Tables 4.5.11 DVTABLE Daily-values Tables 4.5.12 EOYSUMM End-Of-Year Summary 4.5.13 PEAKFLOW Peak-flow Entry and Retrieval 4.5.14 SETSTATUS Manage Record Data Aging 4.5.15 PLOTWAT Plot Time-Series Data 4.5.16 SHOWSITE Show Site Information 4.5.17 STATION_ANALYSIS Station Analysis Report 4.5.18 ADAPS NWIS User 84
Transcript of 4.5 Primary Data Processing Menu (PR) - USGSADAPS: Chapter 4.5 Primary Data Processing Menu (PR) The...
ADAPS: Chapter 4.5 Primary Data Processing Menu (PR)
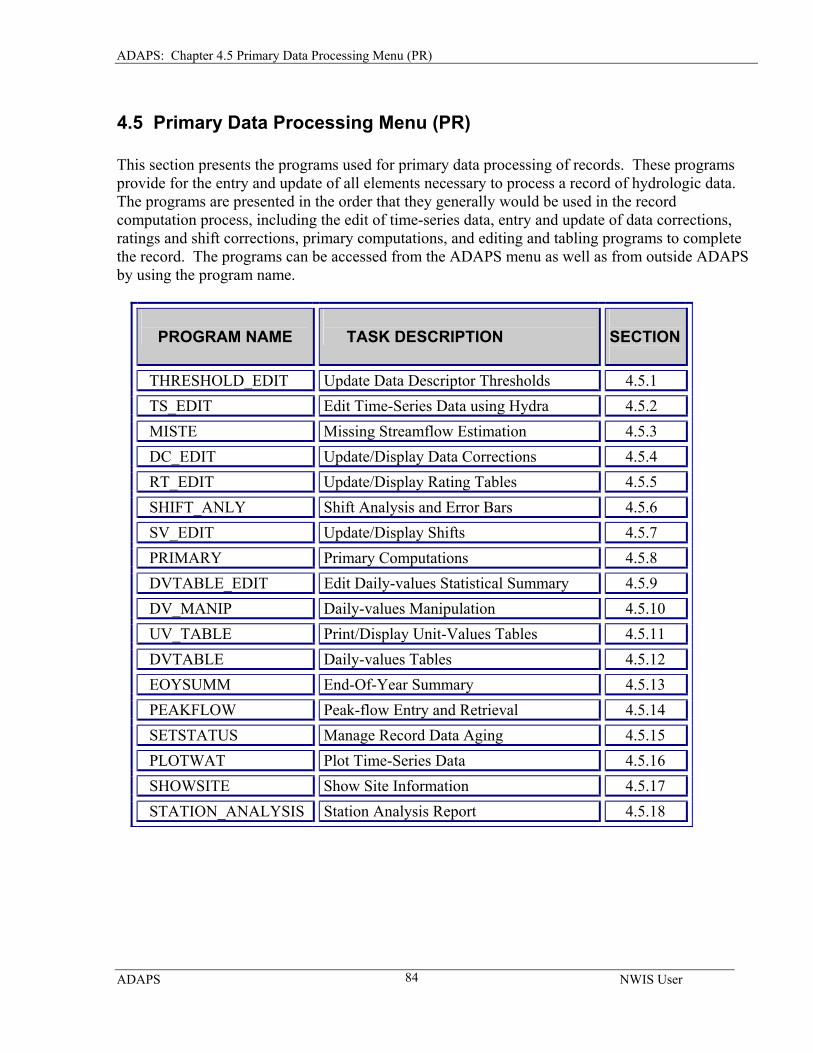
4.5 Primary Data Processing Menu (PR) This section presents the programs used for primary data processing of records. These programs provide for the entry and update of all elements necessary to process a record of hydrologic data. The programs are presented in the order that they generally would be used in the record computation process, including the edit of time-series data, entry and update of data corrections, ratings and shift corrections, primary computations, and editing and tabling programs to complete the record. The programs can be accessed from the ADAPS menu as well as from outside ADAPS by using the program name.
PROGRAM NAME
TASK DESCRIPTION
SECTION
THRESHOLD_EDIT Update Data Descriptor Thresholds 4.5.1 TS_EDIT Edit Time-Series Data using Hydra 4.5.2 MISTE Missing Streamflow Estimation 4.5.3 DC_EDIT Update/Display Data Corrections 4.5.4 RT_EDIT Update/Display Rating Tables 4.5.5 SHIFT_ANLY Shift Analysis and Error Bars 4.5.6 SV_EDIT Update/Display Shifts 4.5.7 PRIMARY Primary Computations 4.5.8 DVTABLE_EDIT Edit Daily-values Statistical Summary 4.5.9 DV_MANIP Daily-values Manipulation 4.5.10 UV_TABLE Print/Display Unit-Values Tables 4.5.11 DVTABLE Daily-values Tables 4.5.12 EOYSUMM End-Of-Year Summary 4.5.13 PEAKFLOW Peak-flow Entry and Retrieval 4.5.14 SETSTATUS Manage Record Data Aging 4.5.15 PLOTWAT Plot Time-Series Data 4.5.16 SHOWSITE Show Site Information 4.5.17 STATION_ANALYSIS Station Analysis Report 4.5.18
ADAPS NWIS User
84
ADAPS: Chapter 4.5 Primary Data Processing Menu (PR)
4.5.1 Update Data Descriptor Thresholds by Glenn B. Engel
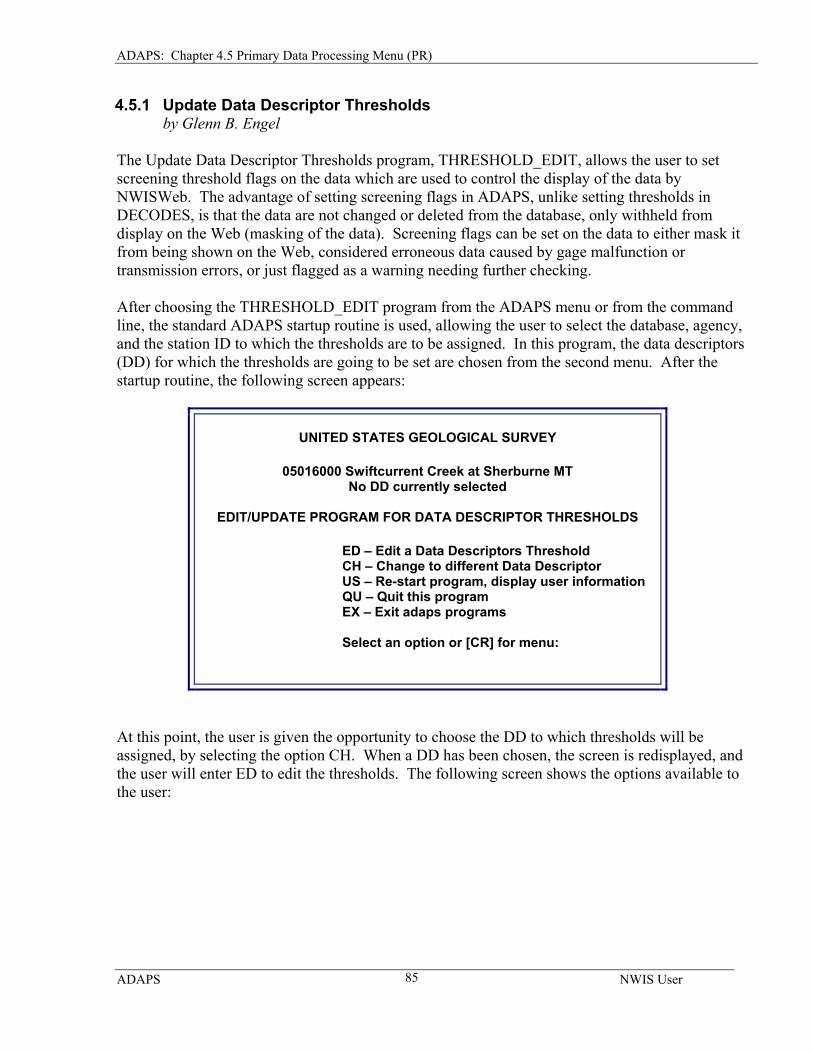
The Update Data Descriptor Thresholds program, THRESHOLD_EDIT, allows the user to set screening threshold flags on the data which are used to control the display of the data by NWISWeb. The advantage of setting screening flags in ADAPS, unlike setting thresholds in DECODES, is that the data are not changed or deleted from the database, only withheld from display on the Web (masking of the data). Screening flags can be set on the data to either mask it from being shown on the Web, considered erroneous data caused by gage malfunction or transmission errors, or just flagged as a warning needing further checking. After choosing the THRESHOLD_EDIT program from the ADAPS menu or from the command line, the standard ADAPS startup routine is used, allowing the user to select the database, agency, and the station ID to which the thresholds are to be assigned. In this program, the data descriptors (DD) for which the thresholds are going to be set are chosen from the second menu. After the startup routine, the following screen appears:
UNITED STATES GEOLOGICAL SURVEY
05016000 Swiftcurrent Creek at Sherburne MT No DD currently selected
EDIT/UPDATE PROGRAM FOR DATA DESCRIPTOR THRESHOLDS
ED – Edit a Data Descriptors Threshold CH – Change to different Data Descriptor US – Re-start program, display user information QU – Quit this program EX – Exit adaps programs Select an option or [CR] for menu:
At this point, the user is given the opportunity to choose the DD to which thresholds will be assigned, by selecting the option CH. When a DD has been chosen, the screen is redisplayed, and the user will enter ED to edit the thresholds. The following screen shows the options available to the user:
ADAPS NWIS User
85
ADAPS: Chapter 4.5 Primary Data Processing Menu (PR)
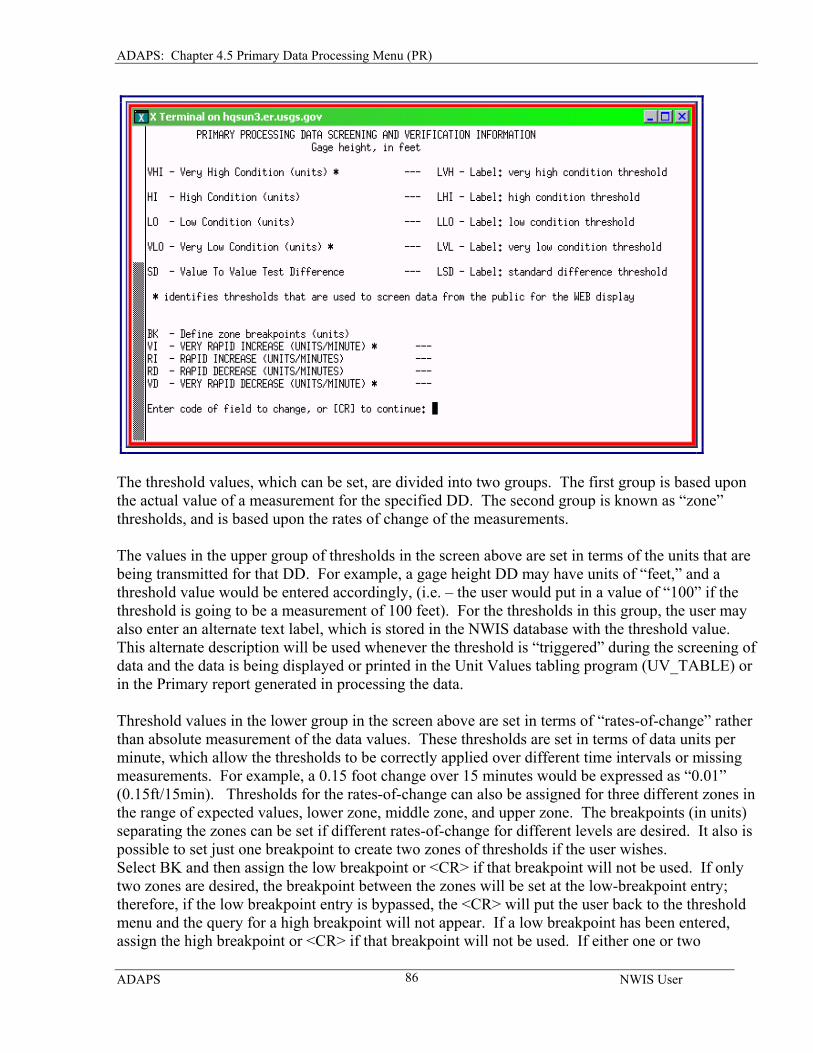
The threshold values, which can be set, are divided into two groups. The first group is based upon the actual value of a measurement for the specified DD. The second group is known as “zone” thresholds, and is based upon the rates of change of the measurements. The values in the upper group of thresholds in the screen above are set in terms of the units that are being transmitted for that DD. For example, a gage height DD may have units of “feet,” and a threshold value would be entered accordingly, (i.e. – the user would put in a value of “100” if the threshold is going to be a measurement of 100 feet). For the thresholds in this group, the user may also enter an alternate text label, which is stored in the NWIS database with the threshold value. This alternate description will be used whenever the threshold is “triggered” during the screening of data and the data is being displayed or printed in the Unit Values tabling program (UV_TABLE) or in the Primary report generated in processing the data. Threshold values in the lower group in the screen above are set in terms of “rates-of-change” rather than absolute measurement of the data values. These thresholds are set in terms of data units per minute, which allow the thresholds to be correctly applied over different time intervals or missing measurements. For example, a 0.15 foot change over 15 minutes would be expressed as “0.01” (0.15ft/15min). Thresholds for the rates-of-change can also be assigned for three different zones in the range of expected values, lower zone, middle zone, and upper zone. The breakpoints (in units) separating the zones can be set if different rates-of-change for different levels are desired. It also is possible to set just one breakpoint to create two zones of thresholds if the user wishes. Select BK and then assign the low breakpoint or <CR> if that breakpoint will not be used. If only two zones are desired, the breakpoint between the zones will be set at the low-breakpoint entry; therefore, if the low breakpoint entry is bypassed, the <CR> will put the user back to the threshold menu and the query for a high breakpoint will not appear. If a low breakpoint has been entered, assign the high breakpoint or <CR> if that breakpoint will not be used. If either one or two
ADAPS NWIS User
86
ADAPS: Chapter 4.5 Primary Data Processing Menu (PR)
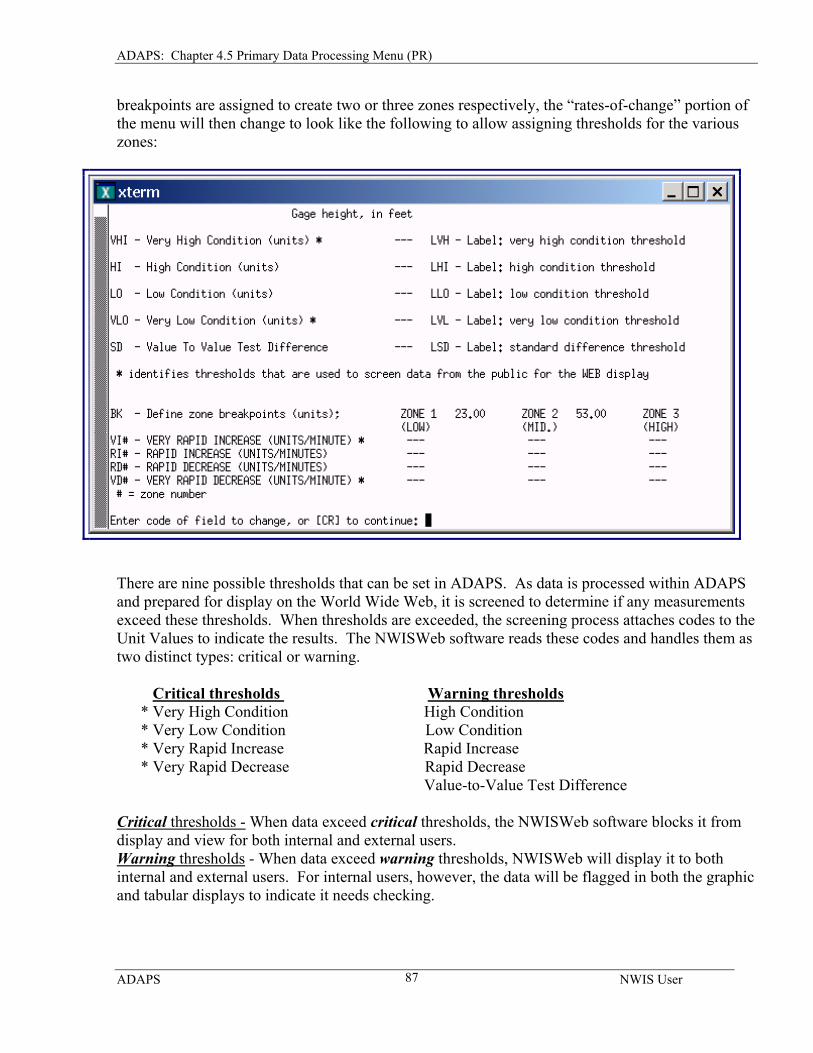
breakpoints are assigned to create two or three zones respectively, the “rates-of-change” portion of the menu will then change to look like the following to allow assigning thresholds for the various zones:
There are nine possible thresholds that can be set in ADAPS. As data is processed within ADAPS and prepared for display on the World Wide Web, it is screened to determine if any measurements exceed these thresholds. When thresholds are exceeded, the screening process attaches codes to the Unit Values to indicate the results. The NWISWeb software reads these codes and handles them as two distinct types: critical or warning. Critical thresholds Warning thresholds * Very High Condition High Condition * Very Low Condition Low Condition * Very Rapid Increase Rapid Increase * Very Rapid Decrease Rapid Decrease Value-to-Value Test Difference Critical thresholds - When data exceed critical thresholds, the NWISWeb software blocks it from display and view for both internal and external users. Warning thresholds - When data exceed warning thresholds, NWISWeb will display it to both internal and external users. For internal users, however, the data will be flagged in both the graphic and tabular displays to indicate it needs checking.
ADAPS NWIS User
87
ADAPS: Chapter 4.5 Primary Data Processing Menu (PR)
The critical thresholds should be set to values which are not possible for the site. This will ensure that only those erroneous values are blocked from NWISWeb, while allowing true extreme values to be displayed. The warning thresholds can be set to values which are possible but should be flagged for further checking. For example, a 7-foot stage may be possible at a site, but a rise from 3 feet to 7 feet in 15 minutes may not be; therefore the “Very Rapid Increase” threshold should be used to block this data point. Users should be very careful in setting threshold points, in order to avoid blocking a true extreme data point.
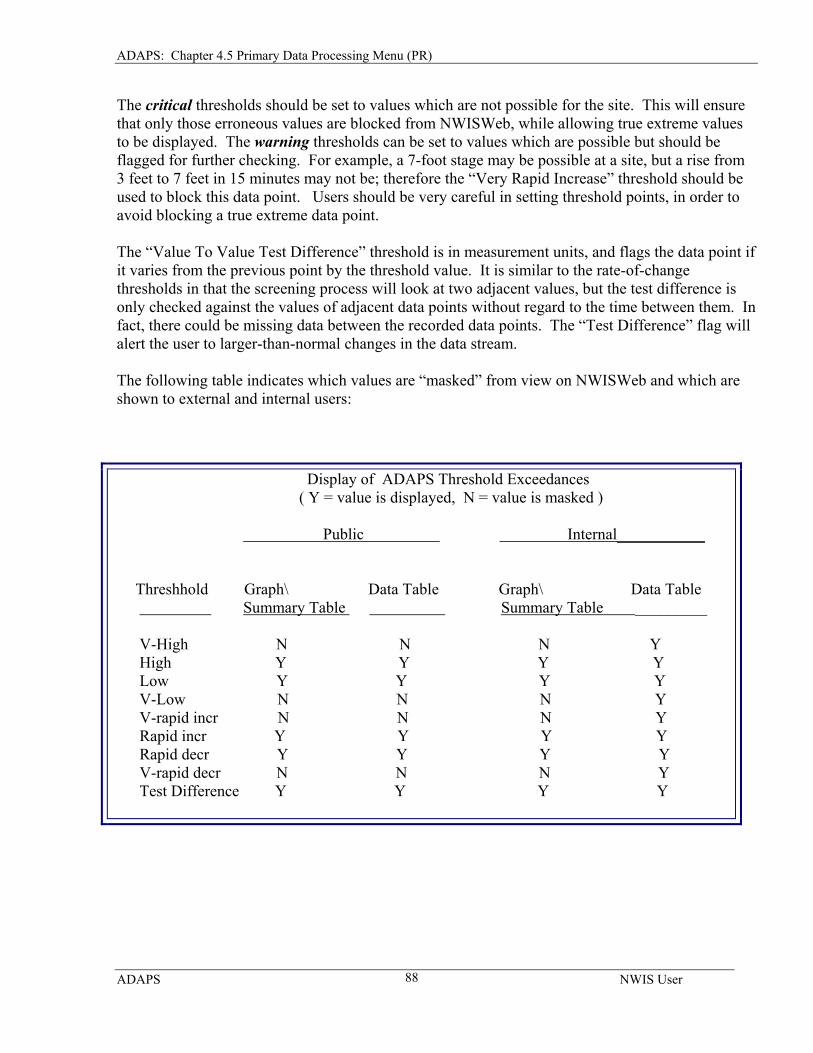
The “Value To Value Test Difference” threshold is in measurement units, and flags the data point if it varies from the previous point by the threshold value. It is similar to the rate-of-change thresholds in that the screening process will look at two adjacent values, but the test difference is only checked against the values of adjacent data points without regard to the time between them. In fact, there could be missing data between the recorded data points. The “Test Difference” flag will alert the user to larger-than-normal changes in the data stream. The following table indicates which values are “masked” from view on NWISWeb and which are shown to external and internal users:
Display of ADAPS Threshold Exceedances ( Y = value is displayed, N = value is masked ) Public Internal___________ Threshhold Graph\ Data Table Graph\ Data Table Summary Table Summary Table _________ V-High N N N Y High Y Y Y Y Low Y Y Y Y V-Low N N N Y V-rapid incr N N N Y Rapid incr Y Y Y Y Rapid decr Y Y Y Y V-rapid decr N N N Y Test Difference Y Y Y Y
ADAPS NWIS User
88
ADAPS: Chapter 4.5 Primary Data Processing Menu (PR)
4.5.2 Edit Time-Series Data Using Hydra by Timothy C. Stamey The Hydra program is designed to provide a graphical display of data and a method for graphically editing these data. 4.5.2.1 Overview The data that can be edited by using Hydra, are Daily-Values and Edited Unit-Values. Computed Unit-Values cannot be edited with Hydra, but can be displayed as reference curves. Program Structure Hydra uses three windows for its operation. The Control window is placed in the lower left portion of the screen by default. This window displays the data in tabular form, and is also used for various control functions such as selecting the active curve and saving the changes back to the database. The Graph window appears in the upper right by default. This window shows, in graphical form, the overview of all the data currently loaded into Hydra. Data cannot be edited in this window. The Zoom window appears in the upper left by default. This window shows subsets of the data in graphical form. It is blank when the program starts up, and remains that way until the user specifies an area on the Graph window to be zoomed. Edited unit-values can be edited graphically in this window. Program Environment This documentation assumes the reader is familiar with the basic concepts of working in a Windows environment, such as moving the mouse cursor and clicking or double-clicking on-screen objects with the mouse. A familiarity with common Window-based application items such as menu bars and scrollable lists is also assumed. Throughout this document, the mouse buttons are referred to as the first, second, and third buttons. Typically, the “first” button is the leftmost one, the “second” button the middle one, and the “third” button the rightmost one. This orientation may be reversed if the user’s mouse is in a left-handed mode, however. Hydra is written using Motif widgets, and supports the common functions of most window managers. A quick rundown of the important features of this follows. For further information on this, the interested reader should consult a reference that covers Motif or the user’s specific window manager; a complete description is beyond the scope of this document.
• Any of the three Hydra windows can be resized, moved, or iconified the same way as any other windows on the user’s system.
• Some visual characteristics can be specified using a standard X resource file.
ADAPS NWIS User
89
ADAPS: Chapter 4.5 Primary Data Processing Menu (PR)
• Keyboard shortcuts can be used to navigate within windows.
The arrow keys and the <tab> key allow the user to move between various fields within a window.
• The F10 key activates the menu bar. One reference that describes these in more detail, as well as explaining various other functionality that Motif provides, is the “X Window System User's Guide: OSF/Motif Edition,” by Valerie Quercia and Tim O'Reilly, published by O'Reilly & Associates. This book covers far more than what is needed to work with Hydra, but to those unfamiliar with X and Motif, a good starting point will be chapters 1, 4, and the “Working with Motif Applications,” section of Chapter 8. 4.5.2.2 Starting Hydra To start Hydra, first select the PR submenu from the ADAPS main menu and then select the option “Edit Time-Series Data using Hydra.” This brings up the program TS_EDIT, which allows the user to specify the data to view or edit in Hydra. The standard ADAPS startup menu is displayed and this menu allows the user to specify the database, agency, station ID, data descriptor, unit- or daily- values, statistic code (if daily values), and date range. A <CR> at the ADAPS startup menu for TS_EDIT starts up Hydra and loads the data the user specified. After Hydra finishes, TS_EDIT loads the edited data back into the database, after which another time-series can be selected for editing. 4.5.2.3 Hydra Basics The basics of the Hydra program are included in the sections that follow. Graph Structure and Axes The Zoom and Graph window are structured in similar fashion. The horizontal axis is the time axis, and the vertical axis shows the values of the data. Each axis is labeled, and contains a tic mark corresponding to each label. The interval between the tic marks on each axis is automatically chosen to give the best compromise between a workable number of tics and a logical interval between them. The tic interval may change with a window resize. For the value (vertical) axis, the labels are real numbers. For the time (horizontal) axis, what each label represents depends upon the time range chosen. For example, a plot that shows a range from noon to midnight in the same day, might have a tic mark placed every three hours, whereas one displaying an entire year might have a tic mark for every month.
ADAPS NWIS User
90
ADAPS: Chapter 4.5 Primary Data Processing Menu (PR)
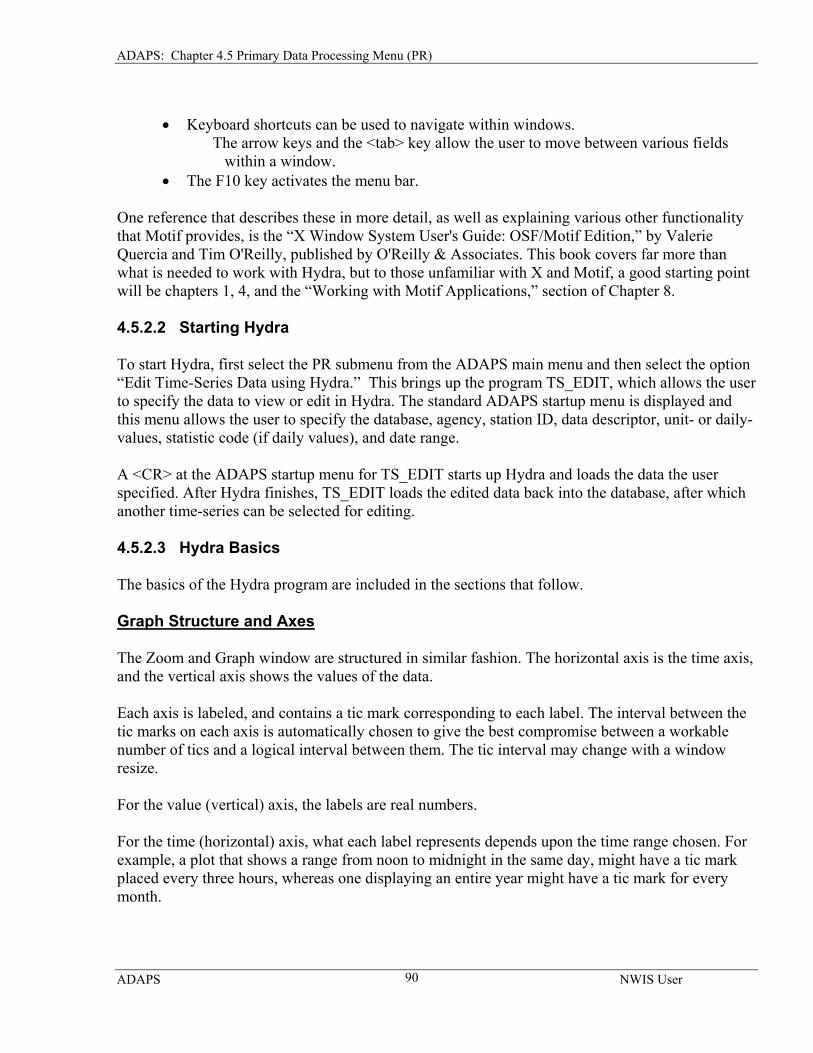
To determine what a tic label represents, look at the label in the lower left corner of the window. This will contain part of a string of the form “1998 Mar 25 10:36:20.” Whatever unit is represented by the last element in this string is the base. The tic labels will represent the next smaller unit. If the base changes, the new base will be placed underneath the tic where the change takes place. An example is shown in figure 1:
Base units Figure 1. Base units
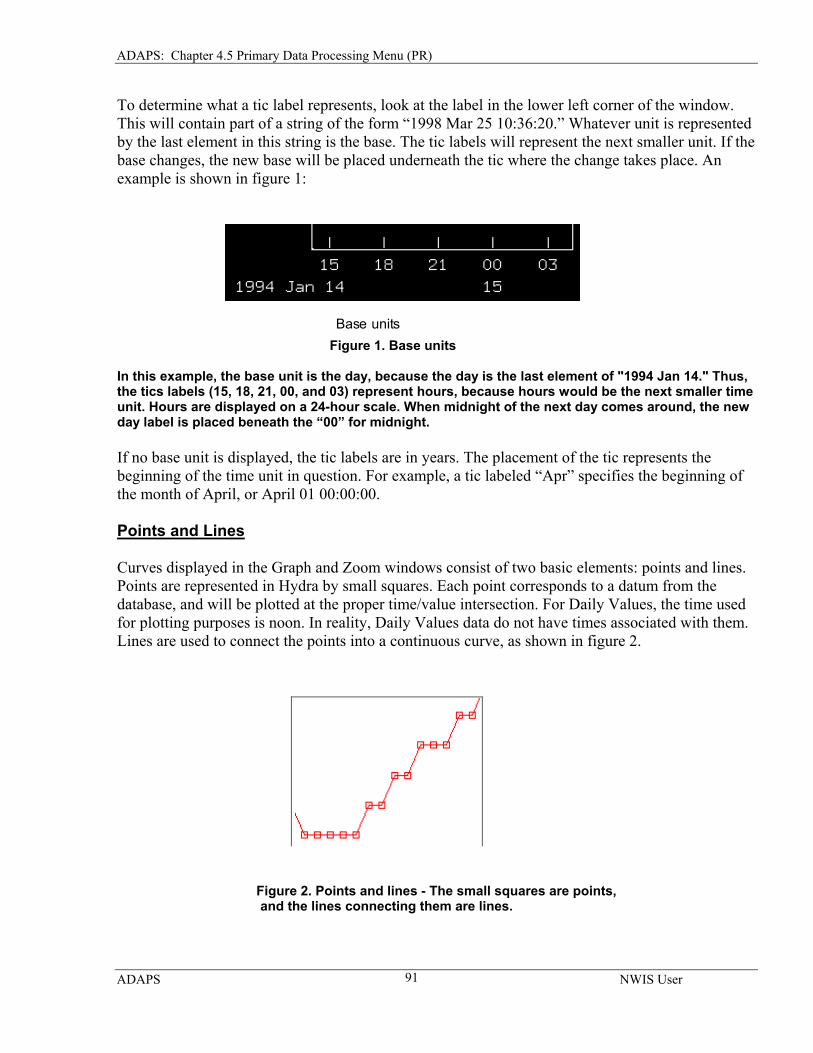
In this example, the base unit is the day, because the day is the last element of "1994 Jan 14." Thus, the tics labels (15, 18, 21, 00, and 03) represent hours, because hours would be the next smaller time unit. Hours are displayed on a 24-hour scale. When midnight of the next day comes around, the new day label is placed beneath the “00” for midnight. If no base unit is displayed, the tic labels are in years. The placement of the tic represents the beginning of the time unit in question. For example, a tic labeled “Apr” specifies the beginning of the month of April, or April 01 00:00:00. Points and Lines Curves displayed in the Graph and Zoom windows consist of two basic elements: points and lines. Points are represented in Hydra by small squares. Each point corresponds to a datum from the database, and will be plotted at the proper time/value intersection. For Daily Values, the time used for plotting purposes is noon. In reality, Daily Values data do not have times associated with them. Lines are used to connect the points into a continuous curve, as shown in figure 2.
Figure 2. Points and lines - The small squares are points, and the lines connecting them are lines.
ADAPS NWIS User
91
ADAPS: Chapter 4.5 Primary Data Processing Menu (PR)
By default, the Graph window comes up showing only the lines and not the points. The Zoom window shows both points and lines by default. Either of these settings can be changed in the CurveInfo window. Either of the plot windows can show just the points, just the lines, both, or neither. Study-Site Curve, Multiple Curves and Active Curve Hydra allows the display of multiple curves simultaneously. Each curve will be assigned a color so that they can be distinguished from one another. When Hydra is started from ADAPS, it will begin with one curve displayed. (It is possible this curve will contain no data; however, there is still a “curve” associated with the parameters and date range specified in TS_EDIT.) The start-up curve is considered the study-site curve. It is the only one that can be modified by the user, and the only one that can be saved back to the database upon exiting Hydra. Other curves can be loaded into Hydra once it is running. These will be considered reference curves. Reference curves cannot be modified. Various types of data can be used as reference curves including raw measured, measured, edited, and computed unit-values; computed daily-values (even after being edited, which are called final daily-values); and measurements. Only one curve at a time can be considered the active curve. The active curve is selected in the Control window. Making a curve active implies two different things:
1. The active curve's values will be displayed in the Tabular Curve list in the Control window. 2. Any changes made in the Zoom window will be applied to the active curve. Since only the
study-site curve can be modified, this means that if a change is attempted in the Zoom window when the study-site curve is not active, it will have no effect.
The curve that is currently active is the one that is toggled in the Active display of the Control window. To provide additional feedback on which curve is currently active, various things are given the same color as that of the active curve, including:
• the mouse pointer in the Zoom window when it is in modify, add, or select mode • the scrollbar trough color • the background for the filename field in the SaveAs popup
Edited-Values Any time a unit-value is changed in Hydra through any means, that value is automatically given a flag code of “*.” This applies to both existing data whose values are changed, and new data that is added. Note: The flag gets set to “*” only when the value is changed or a point is added. Changing the precision or the remark (obviously) does not set the flag code to “*.” If a different flag already existed on the data point, it is changed to “*.” This flag code is visible in the Tabular Curve list in
ADAPS NWIS User
92
ADAPS: Chapter 4.5 Primary Data Processing Menu (PR)
the Control window. Remark codes may also be assigned to unit-values by the user as explained later. The “*” code is applied to unit-values automatically whenever a data point is changed or inserted. For the daily-values, an “e” is automatically entered in the remarks column in Hydra and is stored with the “e” when stored back into the daily-values table. The “e” will be printed on the daily-values tables also so if the value is not considered estimated, the “e” will have to be edited out in order for it not to show up on the daily-values tables. For unit-values, “*” will cause the “Edited by USGS personnel” bit to be set in the unit-values flag variable. Daily-Values versus Unit-Values For the most part, Hydra handles both Daily and Unit-Values in the same manner. There are a few differences, however; these will be covered in more detail in later sections of the documentation. In summary, the differences are: • Daily-Values curves have one and only one value per day. There are no restrictions on
date/time population within a range for Unit-Values; any given range can have 0 or more values. The consequences of this for Hydra are:
Daily-Values have an entry in the Tabular Curve list for every day in the specified range. If
there is no datum for a particular day, the value is considered to be missing, and the value field for that day is blank. For Unit-Values, there are only rows in the Tabular Curve list for which there are values. The concept of a “missing value” is meaningless in the Unit-Values realm.
When a value or set of values is deleted from a Daily-Values curve, the values are set to
missing value. When a value or set of values is deleted from a Unit-Values curve, they are removed from the data set altogether.
Points can only be added to a Daily-Values curve in places where there are missing values.
Points can be added anywhere to a Unit-Values curve.
• Two adjacent Unit-Values points will not be connected via a line if the time interval between them exceeds the DV-abort limit. Daily-Values points are disconnected if there is a missing value between them.
• In the Control window, Daily-Values curves do not display a TIME column or a FLAGS
column, either in the Tabular Curve list or the Tabular Editor.
• In the Graph and Zoom windows, Daily-Values points will plot at noon for the day they represent. Unit-Values plot at the time specified by the data.
ADAPS NWIS User
93
ADAPS: Chapter 4.5 Primary Data Processing Menu (PR)
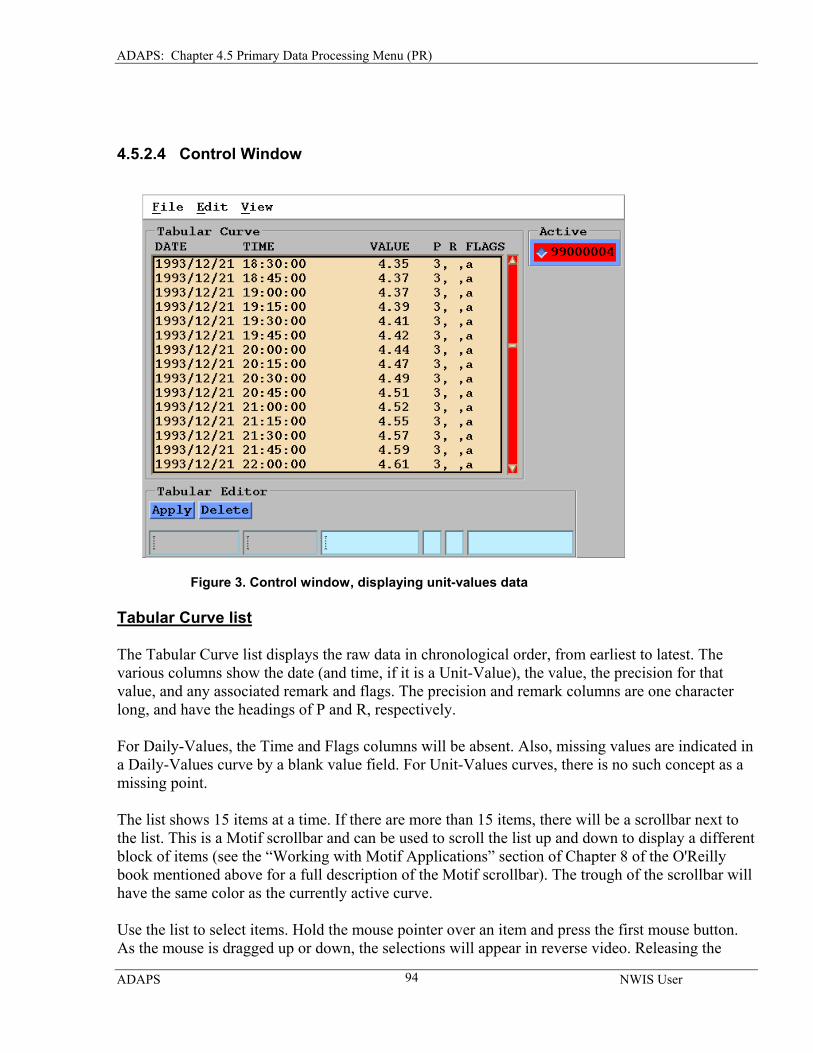
4.5.2.4 Control Window
Figure 3. Control window, displaying unit-values data Tabular Curve list The Tabular Curve list displays the raw data in chronological order, from earliest to latest. The various columns show the date (and time, if it is a Unit-Value), the value, the precision for that value, and any associated remark and flags. The precision and remark columns are one character long, and have the headings of P and R, respectively. For Daily-Values, the Time and Flags columns will be absent. Also, missing values are indicated in a Daily-Values curve by a blank value field. For Unit-Values curves, there is no such concept as a missing point. The list shows 15 items at a time. If there are more than 15 items, there will be a scrollbar next to the list. This is a Motif scrollbar and can be used to scroll the list up and down to display a different block of items (see the “Working with Motif Applications” section of Chapter 8 of the O'Reilly book mentioned above for a full description of the Motif scrollbar). The trough of the scrollbar will have the same color as the currently active curve. Use the list to select items. Hold the mouse pointer over an item and press the first mouse button. As the mouse is dragged up or down, the selections will appear in reverse video. Releasing the
ADAPS NWIS User
94
ADAPS: Chapter 4.5 Primary Data Processing Menu (PR)
mouse button will make the selection take effect. This selection can be used for three different purposes:
1. To bring an item into the Tabular Editor. This only happens if exactly one row is selected. 2. To paste data into another curve 3. To delete rows
The range of values displayed by the Tabular Curve list at one time is indicated in the Graph and Zoom windows by means of two delimiters. These are vertical lines that intersect the points in these windows corresponding to the first and last items displayed in the Tabular Curve list. If the Tabular Curve list is displaying all of the data points in the curve, no delimiters will be drawn. Details of the columns in the Tabular Curve list follow. Date, Time, and Value These three items are the actual data. They show where the corresponding point will be plotted in the Graph and Zoom windows. Precision This column will contain a number from 1 to 9, specifying how many significant figures to display for the number in the Value column. The number that is stored in the database may contain more digits than the precision specified; the value displayed by Hydra is rounded according to the Precision. Please note that the value that is plotted is the actual stored value and not the rounded one. Remark The remark column contains human-specified or automatically applied information about the value. If it is not blank, it also protects the value from being overwritten by automated processes, such as the ADAPS primary processing program. Possible unit-values remark codes and their descriptions are: Codes assignable by user A – Value is affected by ice. B – Value is affected by backwater. R – Rating is undefined for this value. & - Value is affected by unspecified causes. K – Value is affected by instrument calibration drift. X – Value is erroneous and will not be used. < - Actual value is known to be less than the displayed. > - Actual value is known to be greater than the displayed value.
ADAPS NWIS User
95
ADAPS: Chapter 4.5 Primary Data Processing Menu (PR)
Codes assignable by system F – Value was modified by automated filtering. ~ - Value was automatically interpolated from two successive values.
Daily values remarks codes Assigned by system
e – Value was edited or estimated by USGS personnel and is write-protected. & - Value was computed from affected unit values. Assigned by user
< - Actual value is known to be less than the displayed value and is write-protected. > - Actual value is known to be greater than the displayed value and is write-protected.
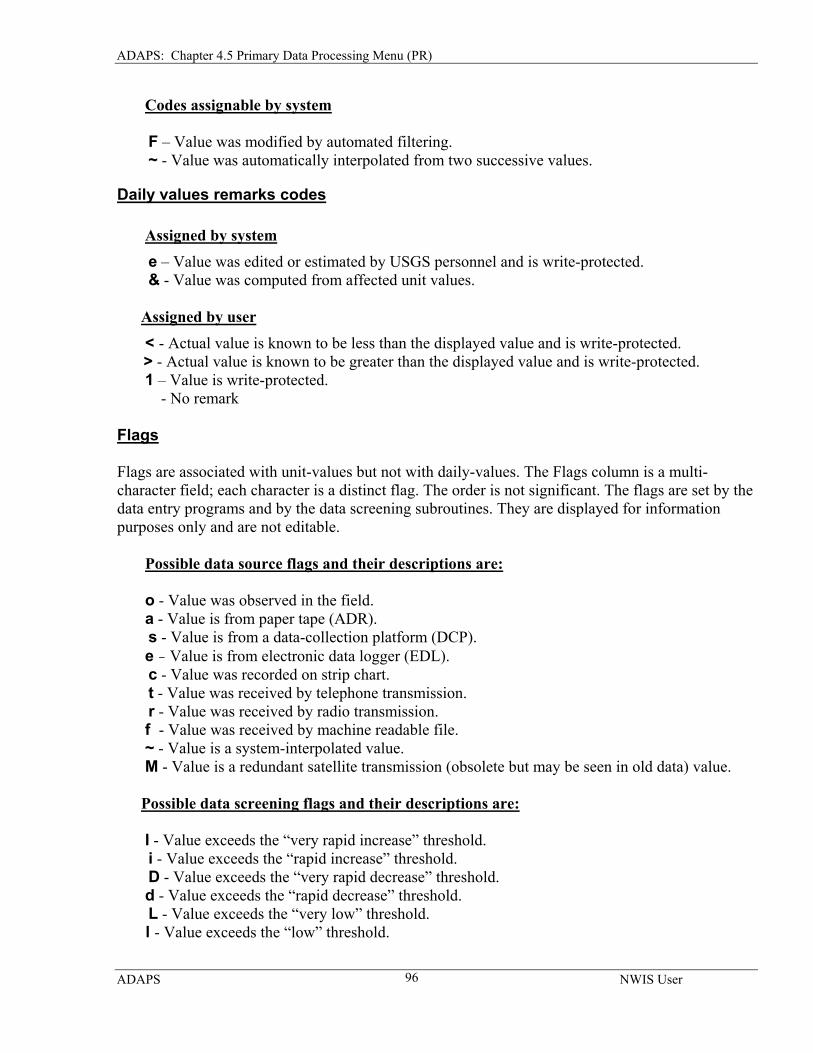
1 – Value is write-protected. - No remark Flags Flags are associated with unit-values but not with daily-values. The Flags column is a multi-character field; each character is a distinct flag. The order is not significant. The flags are set by the data entry programs and by the data screening subroutines. They are displayed for information purposes only and are not editable. Possible data source flags and their descriptions are: o - Value was observed in the field. a - Value is from paper tape (ADR). s - Value is from a data-collection platform (DCP). e - Value is from electronic data logger (EDL). c - Value was recorded on strip chart. t - Value was received by telephone transmission. r - Value was received by radio transmission. f - Value was received by machine readable file. ~ - Value is a system-interpolated value. M - Value is a redundant satellite transmission (obsolete but may be seen in old data) value. Possible data screening flags and their descriptions are: I - Value exceeds the “very rapid increase” threshold. i - Value exceeds the “rapid increase” threshold. D - Value exceeds the “very rapid decrease” threshold. d - Value exceeds the “rapid decrease” threshold. L - Value exceeds the “very low” threshold. l - Value exceeds the “low” threshold.
ADAPS NWIS User
96
ADAPS: Chapter 4.5 Primary Data Processing Menu (PR)
H - Value exceeds the “very high” threshold. h - Value exceeds the “high” threshold. T - Value exceeds the “standard difference” threshold. Flags indicating processing status are: * - Value was edited by USGS personnel. @ - Value was reviewed by USGS personnel. Active Toggle If more than one curve is loaded into Hydra, this is used to select which one is currently active. Click on the name of a curve with the first mouse button to select a new active curve. The color of each button in the list of active curves matches the color of the curve in the Graph and Zoom windows. 4.5.2.5 Menu Bar File Menu A. Reference curves This menu item is used to manipulate reference curves. There are three items in the submenu: (1) New This brings in a new reference curve from the database. When this menu item is chosen, a new window is brought up which displays the ADAPS startup window in which the user can specify a database, station, data descriptor, and statistic code (if daily values), and the data-type to load from the database. The data-type choices listed in ADAPS are computed and final daily-values; raw measured, measured, edited, computed, correction, and shift unit-values; and measured values. The date range retrieved will be that of the study-site curve and cannot be changed. (2) Open This brings up a file selection popup. From here, the user can select a file that contains RDB data in a format Hydra will recognize. Such files will probably have been generated by the SaveAs option, described below. See Section (4) below for more information on the file selection popup. (3) Save As This item also brings up a file selection popup. The data for the current active curve will be saved to the filename specified. If an existing file is specified, its contents will be overwritten. If a new file is specified, it will be created. To provide a reminder about which curve is currently active, the background color of the text field for the filename will be the same color as that of the active curve.
ADAPS NWIS User
97
ADAPS: Chapter 4.5 Primary Data Processing Menu (PR)
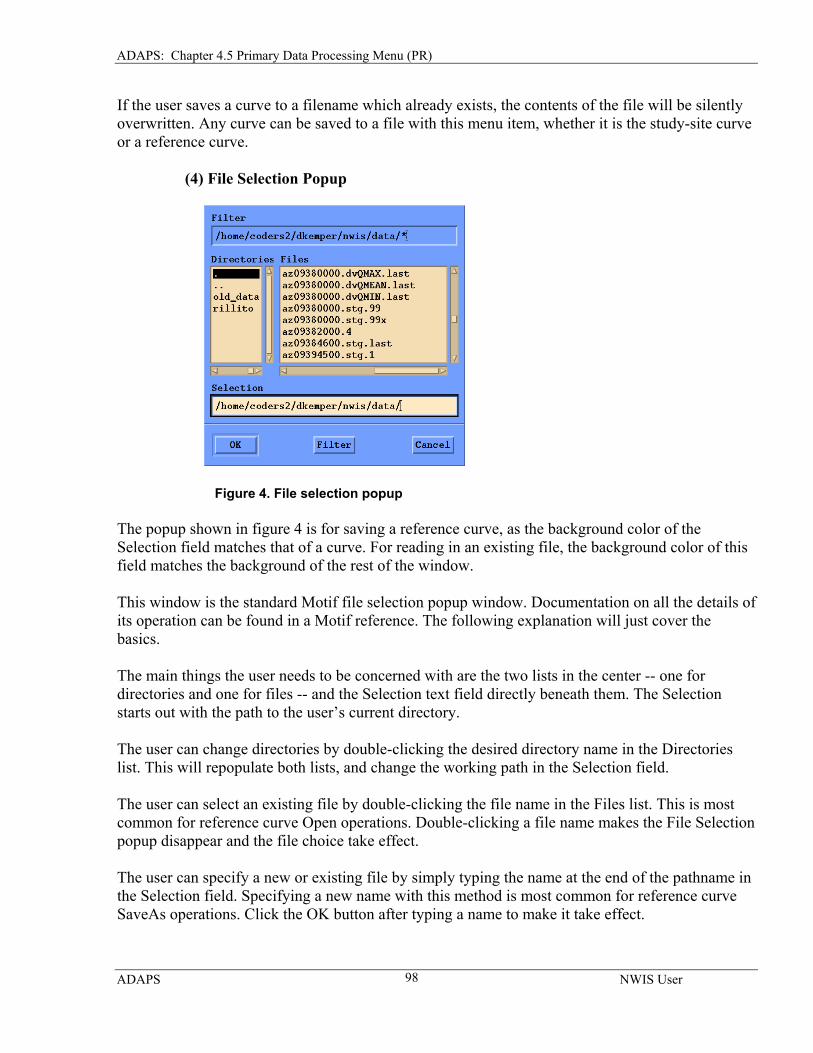
If the user saves a curve to a filename which already exists, the contents of the file will be silently overwritten. Any curve can be saved to a file with this menu item, whether it is the study-site curve or a reference curve. (4) File Selection Popup
Figure 4. File selection popup The popup shown in figure 4 is for saving a reference curve, as the background color of the Selection field matches that of a curve. For reading in an existing file, the background color of this field matches the background of the rest of the window. This window is the standard Motif file selection popup window. Documentation on all the details of its operation can be found in a Motif reference. The following explanation will just cover the basics. The main things the user needs to be concerned with are the two lists in the center -- one for directories and one for files -- and the Selection text field directly beneath them. The Selection starts out with the path to the user’s current directory. The user can change directories by double-clicking the desired directory name in the Directories list. This will repopulate both lists, and change the working path in the Selection field. The user can select an existing file by double-clicking the file name in the Files list. This is most common for reference curve Open operations. Double-clicking a file name makes the File Selection popup disappear and the file choice take effect. The user can specify a new or existing file by simply typing the name at the end of the pathname in the Selection field. Specifying a new name with this method is most common for reference curve SaveAs operations. Click the OK button after typing a name to make it take effect.
ADAPS NWIS User
98
ADAPS: Chapter 4.5 Primary Data Processing Menu (PR)
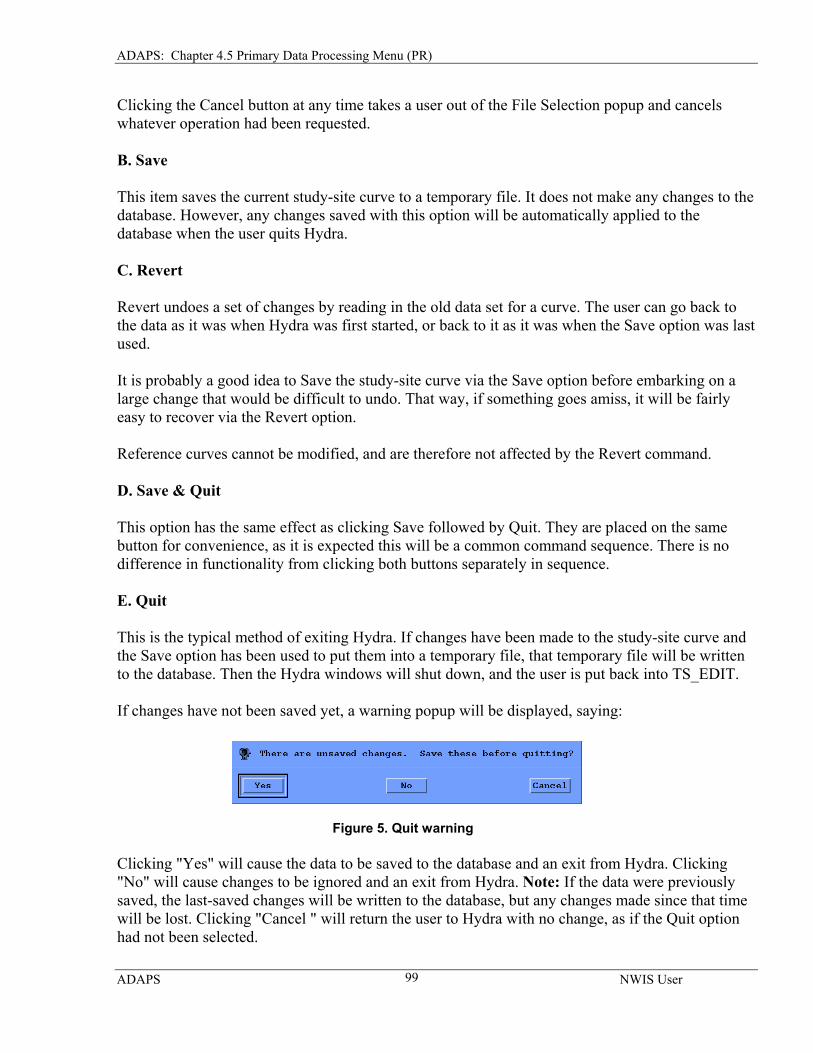
Clicking the Cancel button at any time takes a user out of the File Selection popup and cancels whatever operation had been requested. B. Save This item saves the current study-site curve to a temporary file. It does not make any changes to the database. However, any changes saved with this option will be automatically applied to the database when the user quits Hydra. C. Revert Revert undoes a set of changes by reading in the old data set for a curve. The user can go back to the data as it was when Hydra was first started, or back to it as it was when the Save option was last used. It is probably a good idea to Save the study-site curve via the Save option before embarking on a large change that would be difficult to undo. That way, if something goes amiss, it will be fairly easy to recover via the Revert option. Reference curves cannot be modified, and are therefore not affected by the Revert command. D. Save & Quit This option has the same effect as clicking Save followed by Quit. They are placed on the same button for convenience, as it is expected this will be a common command sequence. There is no difference in functionality from clicking both buttons separately in sequence. E. Quit This is the typical method of exiting Hydra. If changes have been made to the study-site curve and the Save option has been used to put them into a temporary file, that temporary file will be written to the database. Then the Hydra windows will shut down, and the user is put back into TS_EDIT. If changes have not been saved yet, a warning popup will be displayed, saying:
Figure 5. Quit warning Clicking "Yes" will cause the data to be saved to the database and an exit from Hydra. Clicking "No" will cause changes to be ignored and an exit from Hydra. Note: If the data were previously saved, the last-saved changes will be written to the database, but any changes made since that time will be lost. Clicking "Cancel " will return the user to Hydra with no change, as if the Quit option had not been selected.
ADAPS NWIS User
99
ADAPS: Chapter 4.5 Primary Data Processing Menu (PR)
If the user wants to quit Hydra and have it ignore all the changes that have been made, including ones saved to a temporary file with the Save option, it will be necessary to first do a Revert back to the original data, or one of the Exit options below can be chosen. F. Exit Exit takes a user out of Hydra completely without saving any changes to the database at all, even those that may have been saved to a temporary file with the Save option. If there are any changes, a warning popup will appear to make sure the user understands what is happening. There are two different Exit buttons, one to go back to the ADAPS menu from which Hydra was invoked, and one to take the user out of ADAPS entirely and back to the UNIX prompt. Edit Menu A. Paste This option takes the data that was last selected, and places it into the active curve. This overwrites any existing data in the active curve that shares the same date range as that covered by the selected data. Typically, the Paste option is used to take data from a reference curve and paste it into the study-site curve. A common sequence of events would be to make a reference curve the active curve, select a range, then make the study-site curve the active curve, and select the Paste operation from the menu. The selected data will be inserted into the study-site curve as soon as this menu item is selected. It is possible to do a paste to the same curve from which the data was selected, but the only effect of this is to set the flag code to a "*" for all affected values. Hydra will not allow a user to paste data from a Daily-Values curve into a Unit-Values curve, nor from a Unit-Values curve into a Daily-Values curve. The data are selected by one of the two selection methods: selecting from the Tabular Curve list or from the Zoom window. When a selection is made, it stays in effect until the user does one of the following:
• makes another selection • deletes the current selected items • changes the active curve from a Daily to a Unit-Values curve, or from a Unit to a Daily-
Values curve Note: Certain actions cause a new selection to be made automatically. For example, when a point is modified, that point becomes the new selected point, erasing whatever the previous selection may have been.
ADAPS NWIS User
100
ADAPS: Chapter 4.5 Primary Data Processing Menu (PR)
The paste operation essentially looks at the date/time range of the selected items, and replaces all items in the curve that fall within that range with the selected items. This may mean that after the paste is complete, the active curve may contain more, less, or the same number of points that it had before. B. Add/Modify modes This toggle controls the action of the Tabular Editor. Only one of these can be set at a time. Clicking one on turns the other off automatically. Modify mode is the default. In this mode, in the Tabular Editor the user can edit the value, precision, and remark code. In add mode, the user can modify the date and time in the Tabular Editor, in addition to the fields mentioned above. This also allows the user to populate the Tabular Editor from scratch. C. Delayed Update This is an on/off toggle. By default Hydra is in delayed-update mode. Selecting this menu item turns off this mode. Selecting it again turns it back on. Delayed-update mode means that any changes made to the curve via the editing options of the Zoom window are not reflected in the Tabular Curve list until the entire operation has been completed. If delayed-update is turned off, the Tabular Curve list is continuously updated. This mode is on by default because it gives better performance. More information about delayed-update will be given in the section that deals with editing via the Zoom window. View Menu Selecting the Header menu item pops up a window that displays the RDB file header of the active curve. The color of the Dismiss button in this window is set to match that of the active curve to provide a visual reminder which curve's information is being displayed. Some of the information included in the RDB file header (this is not a complete list):
• the name of the station • the parameter name • the DV-abort limit (expressed in minutes) • the date range
This window is a view-only window. No changes can be made to the RDB header. Pressing Dismiss will get rid of the window.
ADAPS NWIS User
101
ADAPS: Chapter 4.5 Primary Data Processing Menu (PR)
The user can view more than one header at once by selecting this menu item again with a different active curve. A. Delete Button This button is used to delete the currently selected range. Although it appears in the Tabular Editor section, the Delete button has nothing to do with the Tabular Editor. The delete button works on the currently selected region. The user can select a region either in the Tabular Curve list or in the Zoom window. The selected rows will show up as highlighted in the Tabular Curve list regardless of which method is used to select them. Clicking delete simply removes these selected points from the curve. For a Unit-Values curve, points can only be edited in the control window and then would be removed entirely. For a Daily- Values curve, this means that they become missing. This distinction is reflected only in the Tabular Curve list; the Graph and Zoom windows behave the same either way. B. Tabular Editor This portion of the Control window is used to make text-based adjustments to data values, or to delete a value or range of values. The Tabular Editor is used differently, depending on whether it is set to Add or Modify mode. Add mode is used to add points to the curve -- when in this mode, the user can start with a blank Tabular Editor and populate all the fields. Modify mode only allows changes to the value, precision, remark, and flags -- the user must load an existing point into the Tabular Editor to modify it. The user can tell if he is in Add or Modify mode by examining the background color of the date and time fields in the Tabular Editor. They will be the same as the background of the rest of the window if in Modify mode, and they will be the same as the background of the value field in Add mode. In general, any fields that have the same background color as the rest of the window cannot be modified; those with a different colored background are user-modifiable. A data point is loaded into the Tabular Editor by selecting it. This can be done either in the Tabular Curve list or in the Zoom window. In either case, a single point must be selected in order for anything to be loaded into the Tabular Editor. When a point is selected, the fields from the Tabular Curve list for that point are copied into the text fields of the Tabular Editor. Each text field of the Tabular Editor corresponds to the column from the Tabular Curve list directly above. Thus, for a Unit-Values curve, the text fields represent, in order from left to right, date, time, value, precision, remark, and flags. For a Daily-Values curve, the time and flags will not be present. Give the focus to any of the fields in the Tabular Editor by moving the mouse cursor into that field and clicking the first button. If the field chosen is editable, its background color will change when it takes the focus. The field with the focus is the one that will be affected by anything typed from the
ADAPS NWIS User
102
ADAPS: Chapter 4.5 Primary Data Processing Menu (PR)
keyboard. In Add mode, the date, time, and value fields are all fully editable, so anything can be entered into these fields. In Modify mode, this is true only of the value field; the date and time cannot be modified at all. Any changes made to any of these three fields will cause the flag field to be set to a “*.” For Unit-Values, anything that may have previously been in the flag field is replaced. For Daily-Values, anything that may have been in the flag field is replaced. The precision and remark fields are editable only to certain values. Place the mouse cursor into either of these fields, then press and hold the first button. A list of possible values will pop up. Slide the mouse over the desired value, release the button, and the field will take this value. If the menu is brought up and it is determined not to change the value of this field, simply release the mouse button from the popup list with the cursor. Changing the precision field also affects the value field. When a new precision is selected, the precision of the value changes to reflect it. Similarly, a value of any precision can be typed into the value field. If <return> is pressed, the value will format itself to reflect the precision displayed in the Tabular Editor. If the user leaves the value field without pressing < return>, the value will not format itself until the user either changes the precision field or clicks the Apply button. The flags field is not editable. When all the fields in the Tabular Editor are as wished, the user can click Apply to make the values in the Tabular Editor take effect in the Tabular Curve list. This also updates the displays in the Graph and Zoom windows. If the user decides not to change this point after all, or wants to start over, a new point (or the same one) can be selected and the changes will be ignored. Changes only take effect if the Apply button is clicked. When Apply is clicked, the validity of the fields is checked. If an invalid value appears in any one of them, a popup message is displayed telling which field has the problem, and the Apply is not performed. The user will have to fix the problem field and click Apply again. 4.5.2.6 Graph Window The graph window displays an overview of all the curves currently loaded into Hydra, as shown in figure 6.
ADAPS NWIS User
103
ADAPS: Chapter 4.5 Primary Data Processing Menu (PR)
ADAPS NWIS User
104
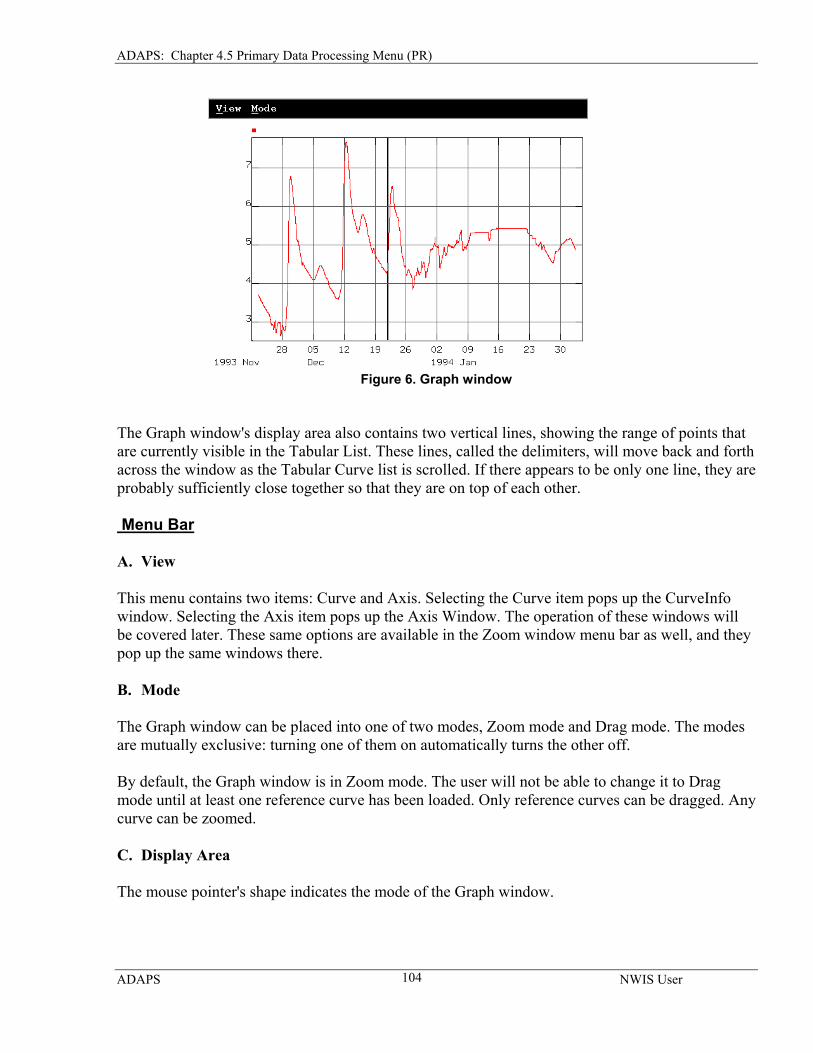
Figure 6. Graph window
The Graph window's display area also contains two vertical lines, showing the range of points that are currently visible in the Tabular List. These lines, called the delimiters, will move back and forth across the window as the Tabular Curve list is scrolled. If there appears to be only one line, they are probably sufficiently close together so that they are on top of each other. Menu Bar A. View This menu contains two items: Curve and Axis. Selecting the Curve item pops up the CurveInfo window. Selecting the Axis item pops up the Axis Window. The operation of these windows will be covered later. These same options are available in the Zoom window menu bar as well, and they pop up the same windows there. B. Mode The Graph window can be placed into one of two modes, Zoom mode and Drag mode. The modes are mutually exclusive: turning one of them on automatically turns the other off. By default, the Graph window is in Zoom mode. The user will not be able to change it to Drag mode until at least one reference curve has been loaded. Only reference curves can be dragged. Any curve can be zoomed. C. Display Area
The mouse pointer's shape indicates the mode of the Graph window.
ADAPS: Chapter 4.5 Primary Data Processing Menu (PR)
• for Zoom mode, it looks like:
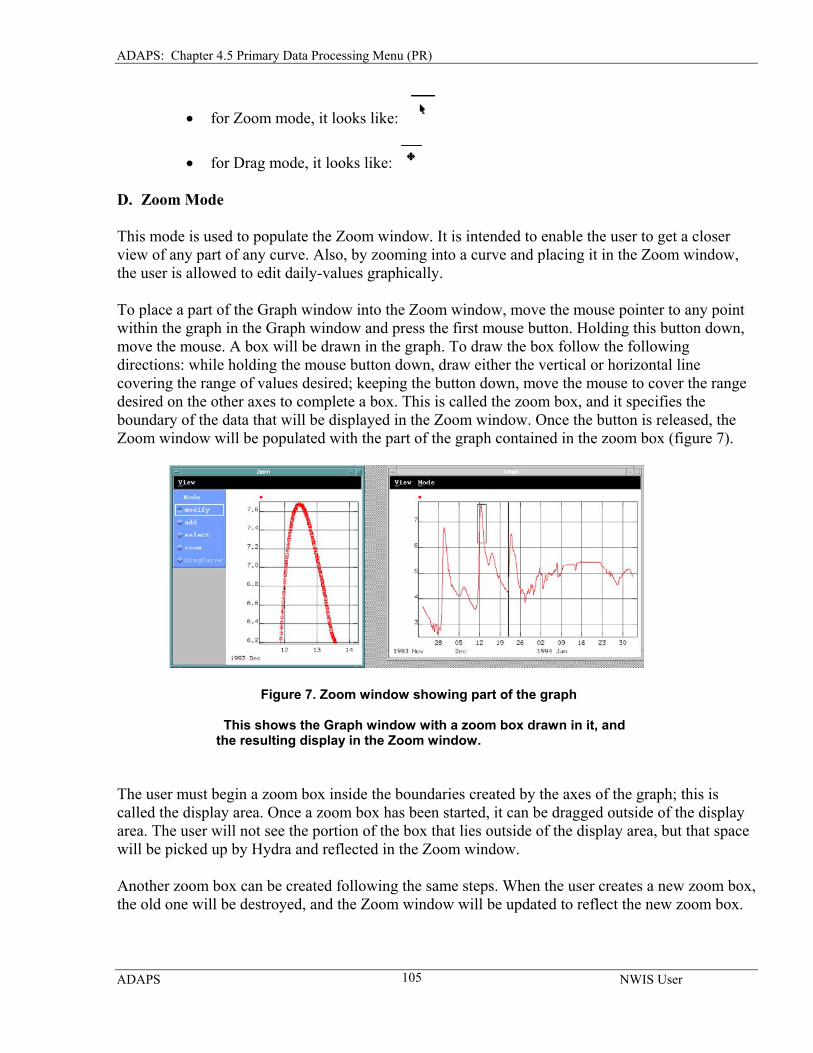
• for Drag mode, it looks like: D. Zoom Mode This mode is used to populate the Zoom window. It is intended to enable the user to get a closer view of any part of any curve. Also, by zooming into a curve and placing it in the Zoom window, the user is allowed to edit daily-values graphically. To place a part of the Graph window into the Zoom window, move the mouse pointer to any point within the graph in the Graph window and press the first mouse button. Holding this button down, move the mouse. A box will be drawn in the graph. To draw the box follow the following directions: while holding the mouse button down, draw either the vertical or horizontal line covering the range of values desired; keeping the button down, move the mouse to cover the range desired on the other axes to complete a box. This is called the zoom box, and it specifies the boundary of the data that will be displayed in the Zoom window. Once the button is released, the Zoom window will be populated with the part of the graph contained in the zoom box (figure 7).
Figure 7. Zoom window showing part of the graph This shows the Graph window with a zoom box drawn in it, and the resulting display in the Zoom window. The user must begin a zoom box inside the boundaries created by the axes of the graph; this is called the display area. Once a zoom box has been started, it can be dragged outside of the display area. The user will not see the portion of the box that lies outside of the display area, but that space will be picked up by Hydra and reflected in the Zoom window. Another zoom box can be created following the same steps. When the user creates a new zoom box, the old one will be destroyed, and the Zoom window will be updated to reflect the new zoom box.
ADAPS NWIS User
105
ADAPS: Chapter 4.5 Primary Data Processing Menu (PR)
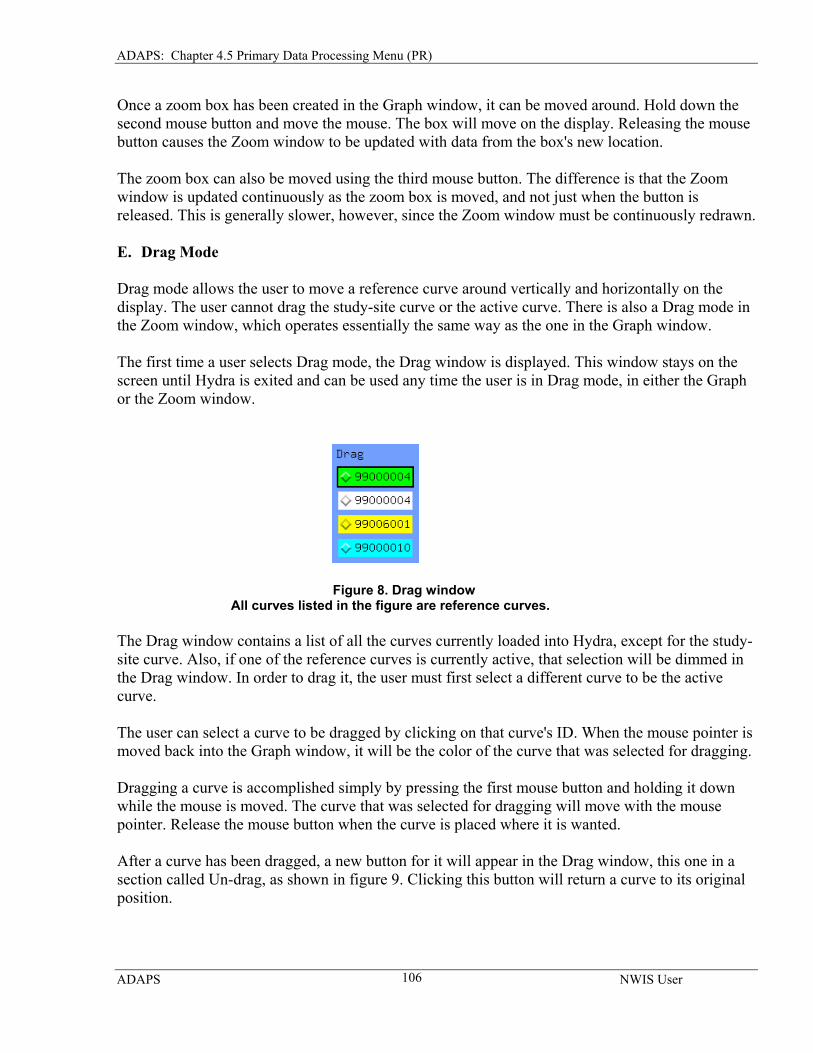
Once a zoom box has been created in the Graph window, it can be moved around. Hold down the second mouse button and move the mouse. The box will move on the display. Releasing the mouse button causes the Zoom window to be updated with data from the box's new location. The zoom box can also be moved using the third mouse button. The difference is that the Zoom window is updated continuously as the zoom box is moved, and not just when the button is released. This is generally slower, however, since the Zoom window must be continuously redrawn. E. Drag Mode Drag mode allows the user to move a reference curve around vertically and horizontally on the display. The user cannot drag the study-site curve or the active curve. There is also a Drag mode in the Zoom window, which operates essentially the same way as the one in the Graph window. The first time a user selects Drag mode, the Drag window is displayed. This window stays on the screen until Hydra is exited and can be used any time the user is in Drag mode, in either the Graph or the Zoom window.
Figure 8. Drag window All curves listed in the figure are reference curves. The Drag window contains a list of all the curves currently loaded into Hydra, except for the study-site curve. Also, if one of the reference curves is currently active, that selection will be dimmed in the Drag window. In order to drag it, the user must first select a different curve to be the active curve. The user can select a curve to be dragged by clicking on that curve's ID. When the mouse pointer is moved back into the Graph window, it will be the color of the curve that was selected for dragging. Dragging a curve is accomplished simply by pressing the first mouse button and holding it down while the mouse is moved. The curve that was selected for dragging will move with the mouse pointer. Release the mouse button when the curve is placed where it is wanted. After a curve has been dragged, a new button for it will appear in the Drag window, this one in a section called Un-drag, as shown in figure 9. Clicking this button will return a curve to its original position.
ADAPS NWIS User
106
ADAPS: Chapter 4.5 Primary Data Processing Menu (PR)
ADAPS NWIS User
107
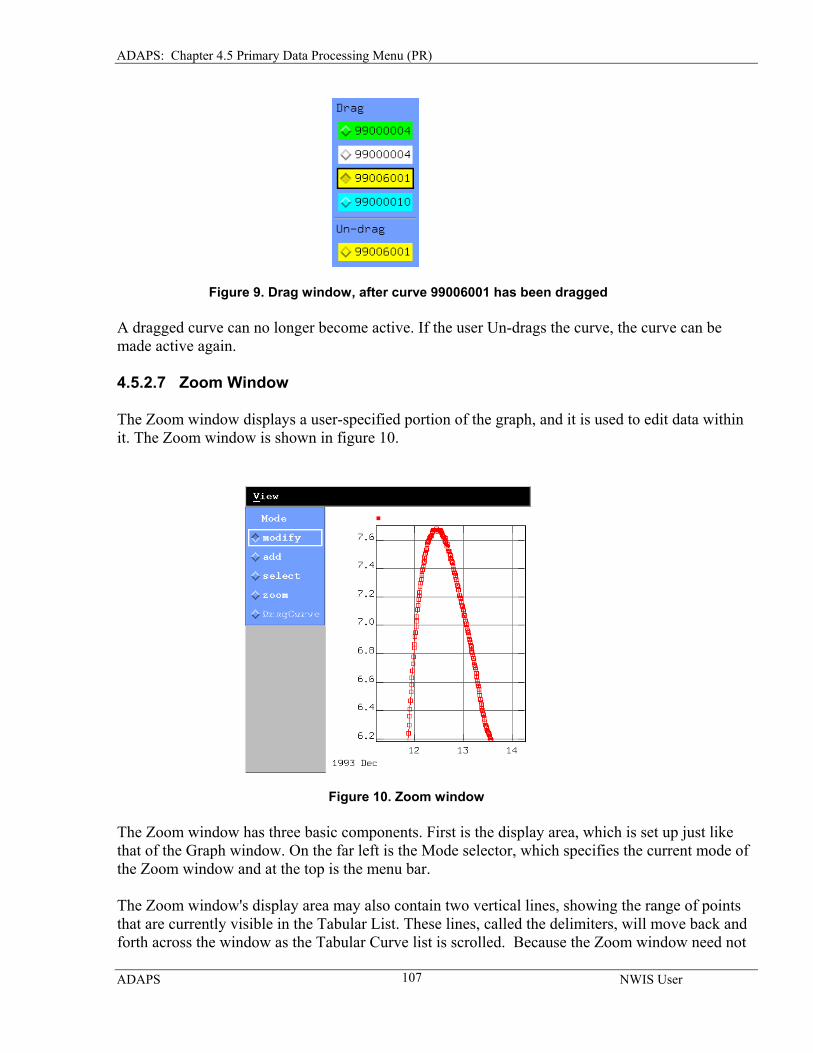
Figure 9. Drag window, after curve 99006001 has been dragged A dragged curve can no longer become active. If the user Un-drags the curve, the curve can be made active again. 4.5.2.7 Zoom Window The Zoom window displays a user-specified portion of the graph, and it is used to edit data within it. The Zoom window is shown in figure 10.
Figure 10. Zoom window The Zoom window has three basic components. First is the display area, which is set up just like that of the Graph window. On the far left is the Mode selector, which specifies the current mode of the Zoom window and at the top is the menu bar. The Zoom window's display area may also contain two vertical lines, showing the range of points that are currently visible in the Tabular List. These lines, called the delimiters, will move back and forth across the window as the Tabular Curve list is scrolled. Because the Zoom window need not
ADAPS: Chapter 4.5 Primary Data Processing Menu (PR)
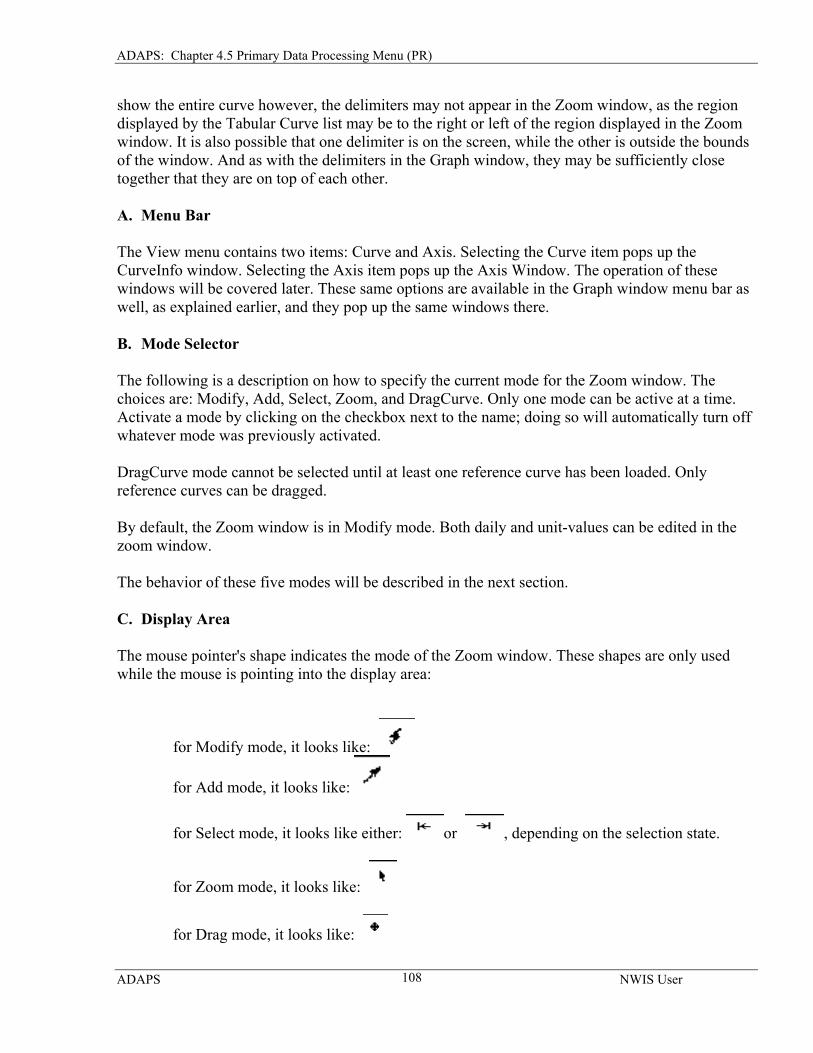
show the entire curve however, the delimiters may not appear in the Zoom window, as the region displayed by the Tabular Curve list may be to the right or left of the region displayed in the Zoom window. It is also possible that one delimiter is on the screen, while the other is outside the bounds of the window. And as with the delimiters in the Graph window, they may be sufficiently close together that they are on top of each other. A. Menu Bar The View menu contains two items: Curve and Axis. Selecting the Curve item pops up the CurveInfo window. Selecting the Axis item pops up the Axis Window. The operation of these windows will be covered later. These same options are available in the Graph window menu bar as well, as explained earlier, and they pop up the same windows there. B. Mode Selector The following is a description on how to specify the current mode for the Zoom window. The choices are: Modify, Add, Select, Zoom, and DragCurve. Only one mode can be active at a time. Activate a mode by clicking on the checkbox next to the name; doing so will automatically turn off whatever mode was previously activated. DragCurve mode cannot be selected until at least one reference curve has been loaded. Only reference curves can be dragged. By default, the Zoom window is in Modify mode. Both daily and unit-values can be edited in the zoom window. The behavior of these five modes will be described in the next section. C. Display Area The mouse pointer's shape indicates the mode of the Zoom window. These shapes are only used while the mouse is pointing into the display area:
for Modify mode, it looks like:
for Add mode, it looks like:
for Select mode, it looks like either: or , depending on the selection state.
for Zoom mode, it looks like:
for Drag mode, it looks like:
ADAPS NWIS User
108
ADAPS: Chapter 4.5 Primary Data Processing Menu (PR)
D. Modify Mode Modify mode lets the user modify the value of any points displayed in the Zoom window. It does not let the date/time be modified. Modify mode does not apply to unit-values. To modify a curve, the curve must be active. The mouse pointer will be the same color as the active curve to give a visual clue as to which curve will be modified. There are three methods to modify a curve, each one corresponding to one of the three mouse buttons. These are covered in the sections below. 1. Single-point edit The first method to modify points operates on a single point at a time. Place the mouse pointer over the point to modify, then press and hold the first mouse button. Move the mouse up and down, and it will drag the point. Moving the mouse to the left or right while the button is depressed has no effect. Releasing the button makes the change take effect. The Tabular Curve list in the Control window currently may be displaying the point being modified, but when the list gets updated depends on whether the Control window is in delayed-update mode or not. If the Control window is in delayed-update mode, the corresponding value in the Tabular Curve list will not be updated until the button is released. If it is not in delayed-update mode, the value will change as the point is dragged, reflecting the point's current position. This mode may run slower. Modifying a single point in this manner causes the point to become selected and loaded into the Tabular Editor. 2. Multi-point edit The user can also change values of points using the second mouse button. This works essentially the same way, but with the difference that if the mouse is moved left or right while the button is depressed, other points will be modified. This is useful for changing the value of several points at once, while being able to finely adjust where each point ends up. The Control window's delayed-update status is applied the same way for this modification method as it is for the single-point method. At the end of this modification sequence, the first point affected will be selected and placed into the Tabular Editor. Note: If the mouse is moved too quickly from left to right while the second button is depressed, it may "skip" some points, leaving them in their original positions. It is also possible that the points in the Zoom window are packed closely enough together that it is impossible to pick them all up with this method regardless of how slowly the mouse is moved. In cases such as this, it will be necessary to zoom in closer, enlarge the window, or use the lightweight-curve method (described below) to modify the points.
ADAPS NWIS User
109
ADAPS: Chapter 4.5 Primary Data Processing Menu (PR)
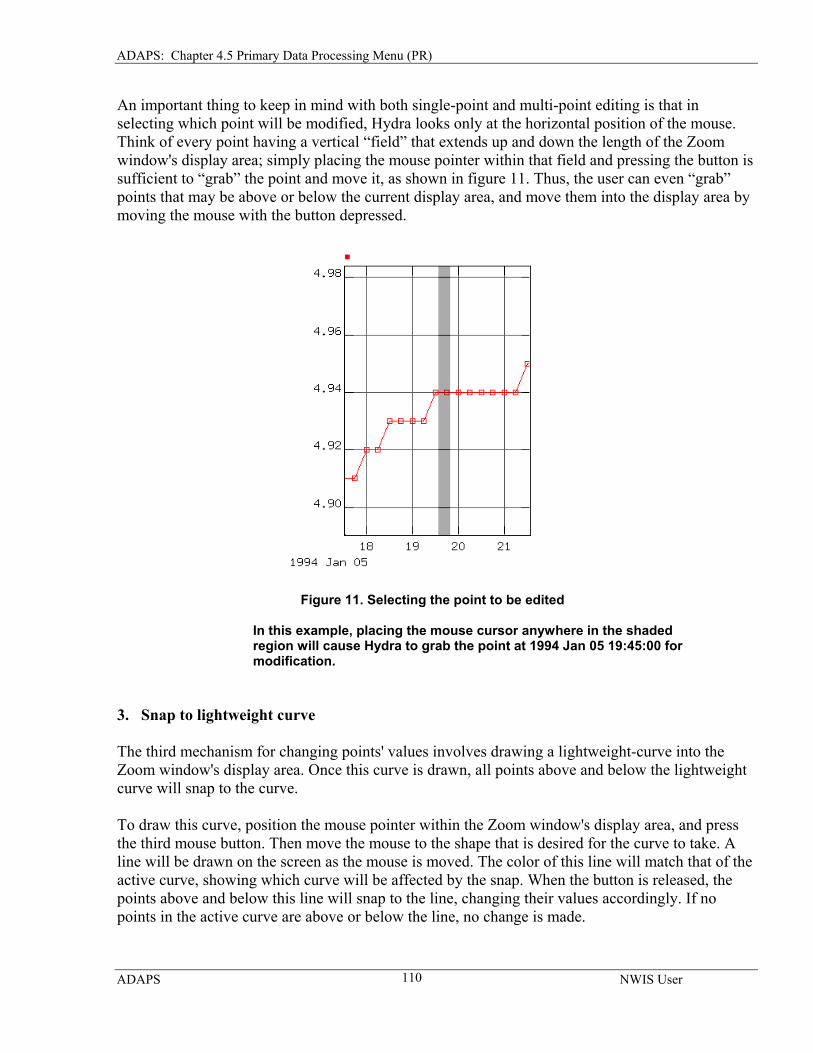
An important thing to keep in mind with both single-point and multi-point editing is that in selecting which point will be modified, Hydra looks only at the horizontal position of the mouse. Think of every point having a vertical “field” that extends up and down the length of the Zoom window's display area; simply placing the mouse pointer within that field and pressing the button is sufficient to “grab” the point and move it, as shown in figure 11. Thus, the user can even “grab” points that may be above or below the current display area, and move them into the display area by moving the mouse with the button depressed.
Figure 11. Selecting the point to be edited In this example, placing the mouse cursor anywhere in the shaded region will cause Hydra to grab the point at 1994 Jan 05 19:45:00 for modification. 3. Snap to lightweight curve The third mechanism for changing points' values involves drawing a lightweight-curve into the Zoom window's display area. Once this curve is drawn, all points above and below the lightweight curve will snap to the curve. To draw this curve, position the mouse pointer within the Zoom window's display area, and press the third mouse button. Then move the mouse to the shape that is desired for the curve to take. A line will be drawn on the screen as the mouse is moved. The color of this line will match that of the active curve, showing which curve will be affected by the snap. When the button is released, the points above and below this line will snap to the line, changing their values accordingly. If no points in the active curve are above or below the line, no change is made.
ADAPS NWIS User
110
ADAPS: Chapter 4.5 Primary Data Processing Menu (PR)
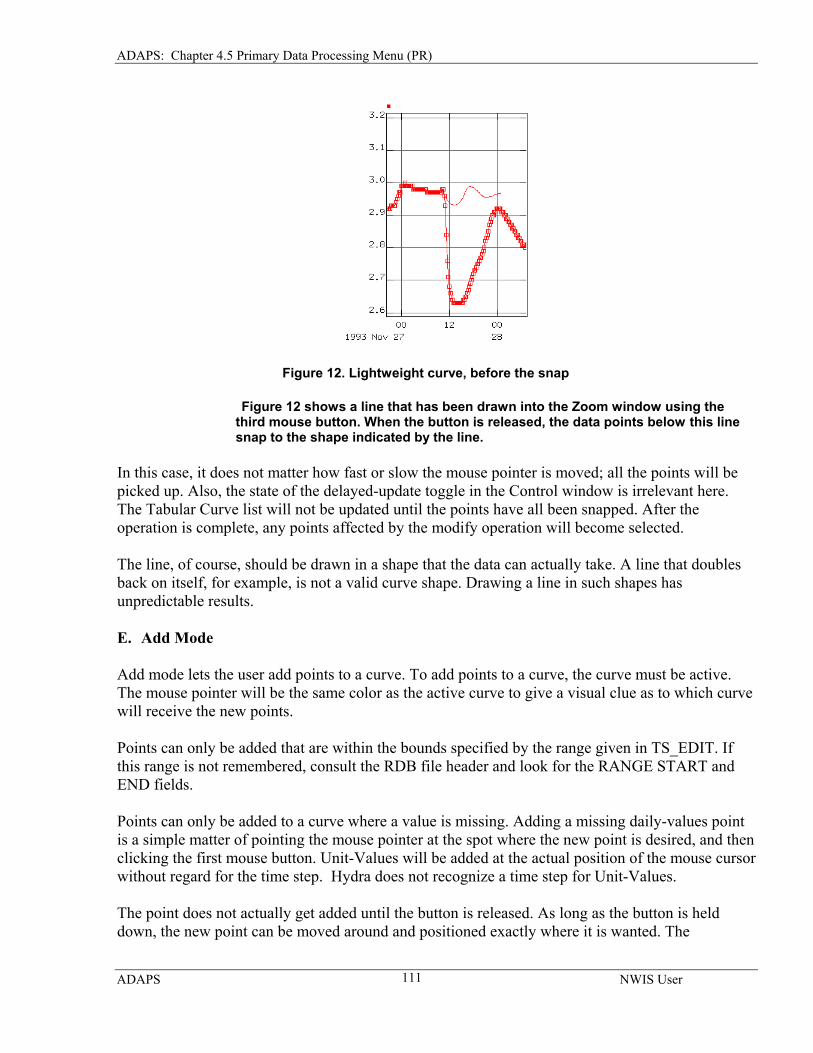
Figure 12. Lightweight curve, before the snap
Figure 12 shows a line that has been drawn into the Zoom window using the third mouse button. When the button is released, the data points below this line snap to the shape indicated by the line.
In this case, it does not matter how fast or slow the mouse pointer is moved; all the points will be picked up. Also, the state of the delayed-update toggle in the Control window is irrelevant here. The Tabular Curve list will not be updated until the points have all been snapped. After the operation is complete, any points affected by the modify operation will become selected. The line, of course, should be drawn in a shape that the data can actually take. A line that doubles back on itself, for example, is not a valid curve shape. Drawing a line in such shapes has unpredictable results. E. Add Mode Add mode lets the user add points to a curve. To add points to a curve, the curve must be active. The mouse pointer will be the same color as the active curve to give a visual clue as to which curve will receive the new points. Points can only be added that are within the bounds specified by the range given in TS_EDIT. If this range is not remembered, consult the RDB file header and look for the RANGE START and END fields. Points can only be added to a curve where a value is missing. Adding a missing daily-values point is a simple matter of pointing the mouse pointer at the spot where the new point is desired, and then clicking the first mouse button. Unit-Values will be added at the actual position of the mouse cursor without regard for the time step. Hydra does not recognize a time step for Unit-Values. The point does not actually get added until the button is released. As long as the button is held down, the new point can be moved around and positioned exactly where it is wanted. The
ADAPS NWIS User
111
ADAPS: Chapter 4.5 Primary Data Processing Menu (PR)
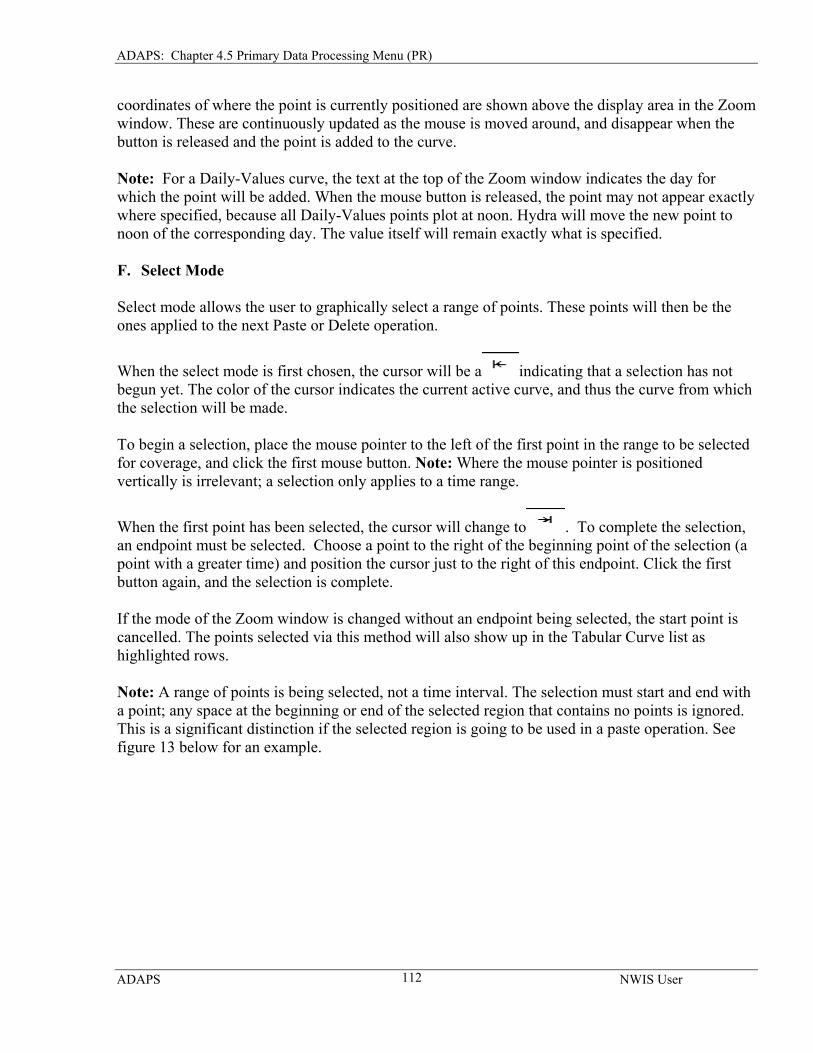
coordinates of where the point is currently positioned are shown above the display area in the Zoom window. These are continuously updated as the mouse is moved around, and disappear when the button is released and the point is added to the curve. Note: For a Daily-Values curve, the text at the top of the Zoom window indicates the day for which the point will be added. When the mouse button is released, the point may not appear exactly where specified, because all Daily-Values points plot at noon. Hydra will move the new point to noon of the corresponding day. The value itself will remain exactly what is specified. F. Select Mode Select mode allows the user to graphically select a range of points. These points will then be the ones applied to the next Paste or Delete operation.
When the select mode is first chosen, the cursor will be a indicating that a selection has not begun yet. The color of the cursor indicates the current active curve, and thus the curve from which the selection will be made. To begin a selection, place the mouse pointer to the left of the first point in the range to be selected for coverage, and click the first mouse button. Note: Where the mouse pointer is positioned vertically is irrelevant; a selection only applies to a time range.
When the first point has been selected, the cursor will change to . To complete the selection, an endpoint must be selected. Choose a point to the right of the beginning point of the selection (a point with a greater time) and position the cursor just to the right of this endpoint. Click the first button again, and the selection is complete. If the mode of the Zoom window is changed without an endpoint being selected, the start point is cancelled. The points selected via this method will also show up in the Tabular Curve list as highlighted rows. Note: A range of points is being selected, not a time interval. The selection must start and end with a point; any space at the beginning or end of the selected region that contains no points is ignored. This is a significant distinction if the selected region is going to be used in a paste operation. See figure 13 below for an example.
ADAPS NWIS User
112
ADAPS: Chapter 4.5 Primary Data Processing Menu (PR)
ADAPS NWIS User
113
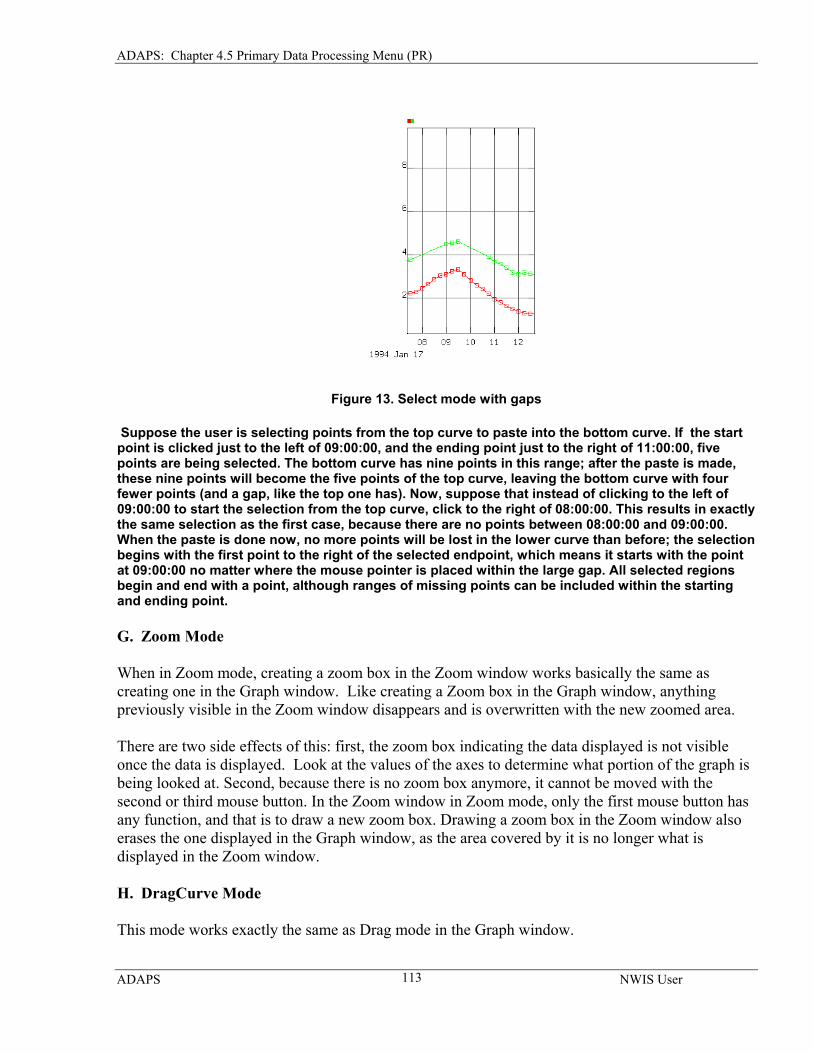
Figure 13. Select mode with gaps
Suppose the user is selecting points from the top curve to paste into the bottom curve. If the start point is clicked just to the left of 09:00:00, and the ending point just to the right of 11:00:00, five points are being selected. The bottom curve has nine points in this range; after the paste is made, these nine points will become the five points of the top curve, leaving the bottom curve with four fewer points (and a gap, like the top one has). Now, suppose that instead of clicking to the left of 09:00:00 to start the selection from the top curve, click to the right of 08:00:00. This results in exactly the same selection as the first case, because there are no points between 08:00:00 and 09:00:00. When the paste is done now, no more points will be lost in the lower curve than before; the selection begins with the first point to the right of the selected endpoint, which means it starts with the point at 09:00:00 no matter where the mouse pointer is placed within the large gap. All selected regions begin and end with a point, although ranges of missing points can be included within the starting and ending point. G. Zoom Mode When in Zoom mode, creating a zoom box in the Zoom window works basically the same as creating one in the Graph window. Like creating a Zoom box in the Graph window, anything previously visible in the Zoom window disappears and is overwritten with the new zoomed area. There are two side effects of this: first, the zoom box indicating the data displayed is not visible once the data is displayed. Look at the values of the axes to determine what portion of the graph is being looked at. Second, because there is no zoom box anymore, it cannot be moved with the second or third mouse button. In the Zoom window in Zoom mode, only the first mouse button has any function, and that is to draw a new zoom box. Drawing a zoom box in the Zoom window also erases the one displayed in the Graph window, as the area covered by it is no longer what is displayed in the Zoom window. H. DragCurve Mode This mode works exactly the same as Drag mode in the Graph window.
ADAPS: Chapter 4.5 Primary Data Processing Menu (PR)
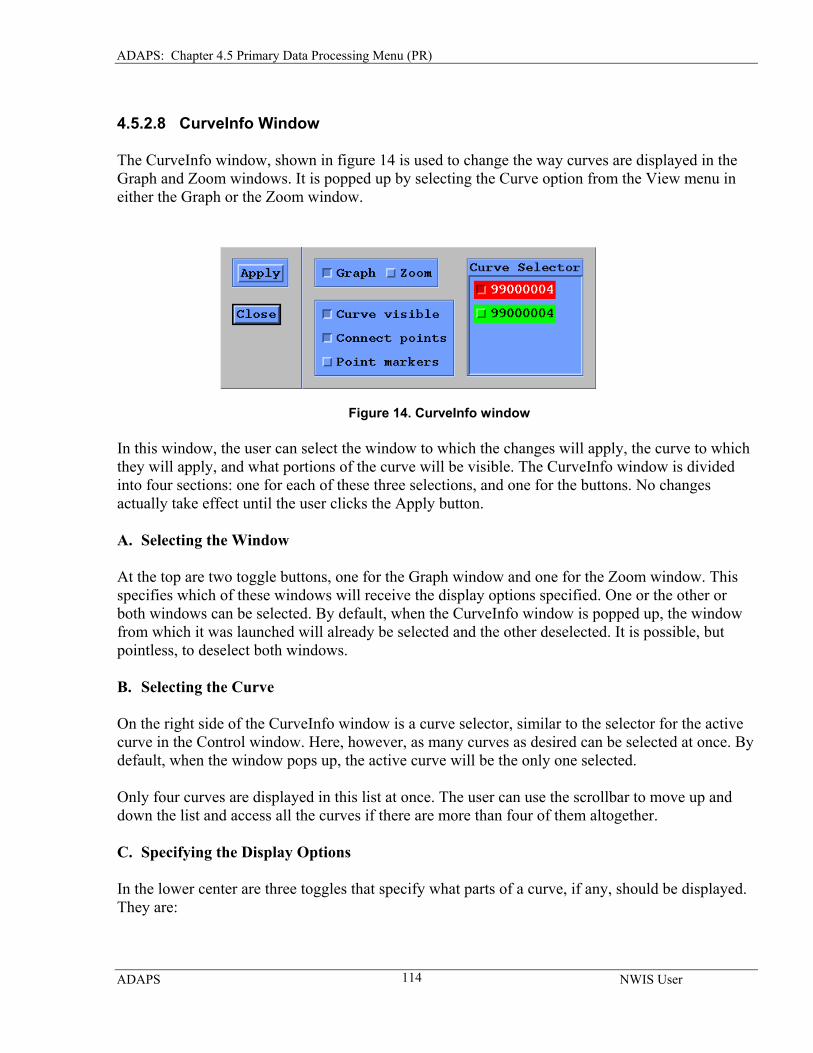
4.5.2.8 CurveInfo Window The CurveInfo window, shown in figure 14 is used to change the way curves are displayed in the Graph and Zoom windows. It is popped up by selecting the Curve option from the View menu in either the Graph or the Zoom window.
Figure 14. CurveInfo window In this window, the user can select the window to which the changes will apply, the curve to which they will apply, and what portions of the curve will be visible. The CurveInfo window is divided into four sections: one for each of these three selections, and one for the buttons. No changes actually take effect until the user clicks the Apply button. A. Selecting the Window At the top are two toggle buttons, one for the Graph window and one for the Zoom window. This specifies which of these windows will receive the display options specified. One or the other or both windows can be selected. By default, when the CurveInfo window is popped up, the window from which it was launched will already be selected and the other deselected. It is possible, but pointless, to deselect both windows. B. Selecting the Curve On the right side of the CurveInfo window is a curve selector, similar to the selector for the active curve in the Control window. Here, however, as many curves as desired can be selected at once. By default, when the window pops up, the active curve will be the only one selected. Only four curves are displayed in this list at once. The user can use the scrollbar to move up and down the list and access all the curves if there are more than four of them altogether. C. Specifying the Display Options In the lower center are three toggles that specify what parts of a curve, if any, should be displayed. They are:
ADAPS NWIS User
114
ADAPS: Chapter 4.5 Primary Data Processing Menu (PR)
1. Curve Visible: This setting overrides the two below. If this toggle is turned off, no part of the curve will be displayed regardless of the settings of the following two toggles.
2. Connect Points: This setting specifies whether the lines are visible. 3. Point Markers: This setting specifies whether the points are visible.
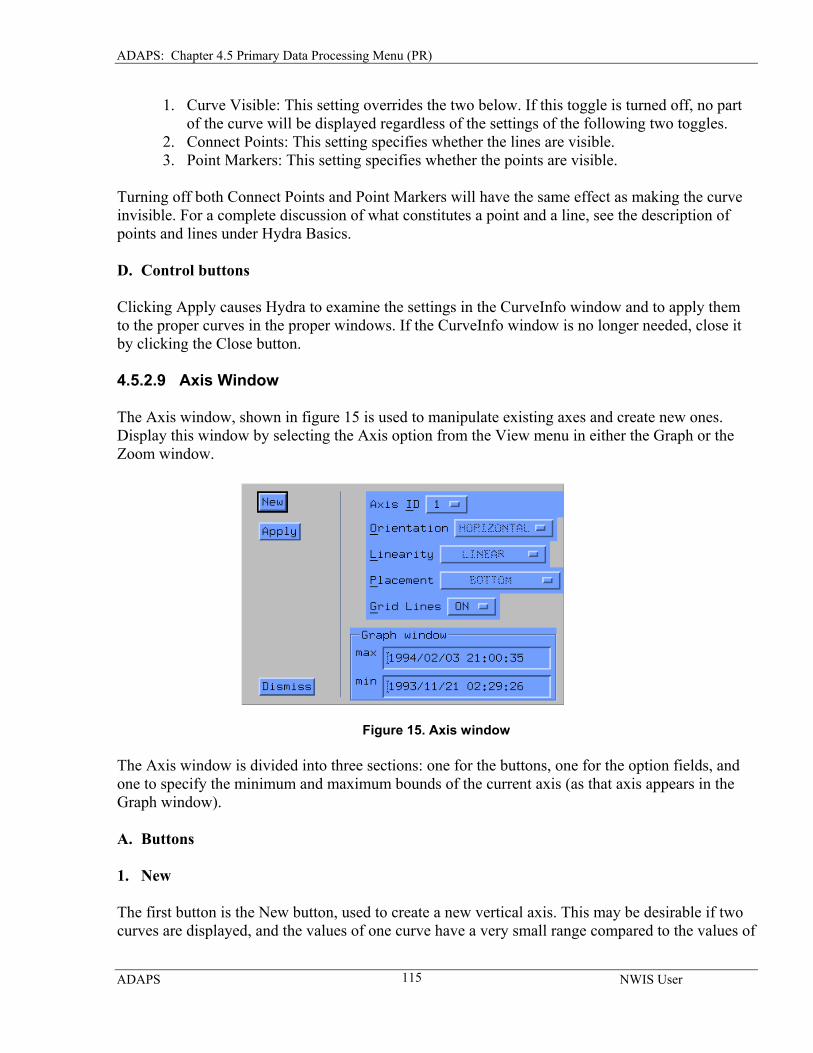
Turning off both Connect Points and Point Markers will have the same effect as making the curve invisible. For a complete discussion of what constitutes a point and a line, see the description of points and lines under Hydra Basics. D. Control buttons Clicking Apply causes Hydra to examine the settings in the CurveInfo window and to apply them to the proper curves in the proper windows. If the CurveInfo window is no longer needed, close it by clicking the Close button. 4.5.2.9 Axis Window The Axis window, shown in figure 15 is used to manipulate existing axes and create new ones. Display this window by selecting the Axis option from the View menu in either the Graph or the Zoom window.
Figure 15. Axis window
The Axis window is divided into three sections: one for the buttons, one for the option fields, and one to specify the minimum and maximum bounds of the current axis (as that axis appears in the Graph window). A. Buttons 1. New The first button is the New button, used to create a new vertical axis. This may be desirable if two curves are displayed, and the values of one curve have a very small range compared to the values of
ADAPS NWIS User
115
ADAPS: Chapter 4.5 Primary Data Processing Menu (PR)
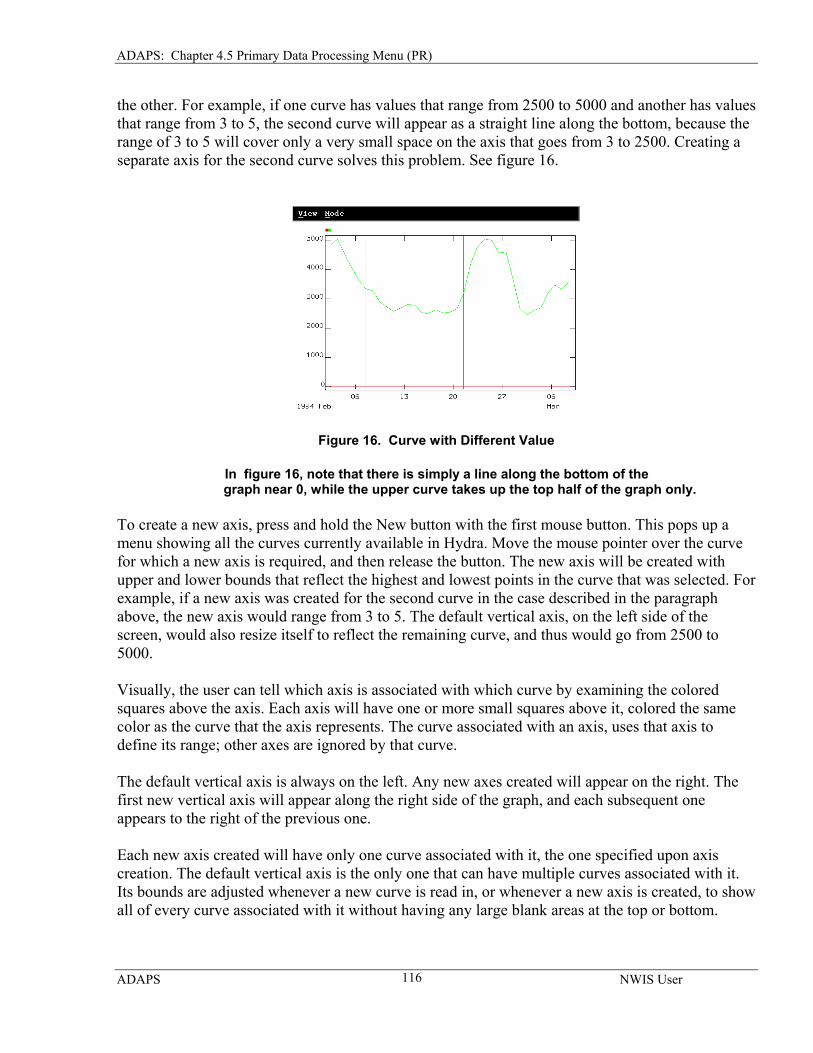
the other. For example, if one curve has values that range from 2500 to 5000 and another has values that range from 3 to 5, the second curve will appear as a straight line along the bottom, because the range of 3 to 5 will cover only a very small space on the axis that goes from 3 to 2500. Creating a separate axis for the second curve solves this problem. See figure 16.
Figure 16. Curve with Different Value In figure 16, note that there is simply a line along the bottom of the graph near 0, while the upper curve takes up the top half of the graph only. To create a new axis, press and hold the New button with the first mouse button. This pops up a menu showing all the curves currently available in Hydra. Move the mouse pointer over the curve for which a new axis is required, and then release the button. The new axis will be created with upper and lower bounds that reflect the highest and lowest points in the curve that was selected. For example, if a new axis was created for the second curve in the case described in the paragraph above, the new axis would range from 3 to 5. The default vertical axis, on the left side of the screen, would also resize itself to reflect the remaining curve, and thus would go from 2500 to 5000. Visually, the user can tell which axis is associated with which curve by examining the colored squares above the axis. Each axis will have one or more small squares above it, colored the same color as the curve that the axis represents. The curve associated with an axis, uses that axis to define its range; other axes are ignored by that curve. The default vertical axis is always on the left. Any new axes created will appear on the right. The first new vertical axis will appear along the right side of the graph, and each subsequent one appears to the right of the previous one. Each new axis created will have only one curve associated with it, the one specified upon axis creation. The default vertical axis is the only one that can have multiple curves associated with it. Its bounds are adjusted whenever a new curve is read in, or whenever a new axis is created, to show all of every curve associated with it without having any large blank areas at the top or bottom.
ADAPS NWIS User
116
ADAPS: Chapter 4.5 Primary Data Processing Menu (PR)
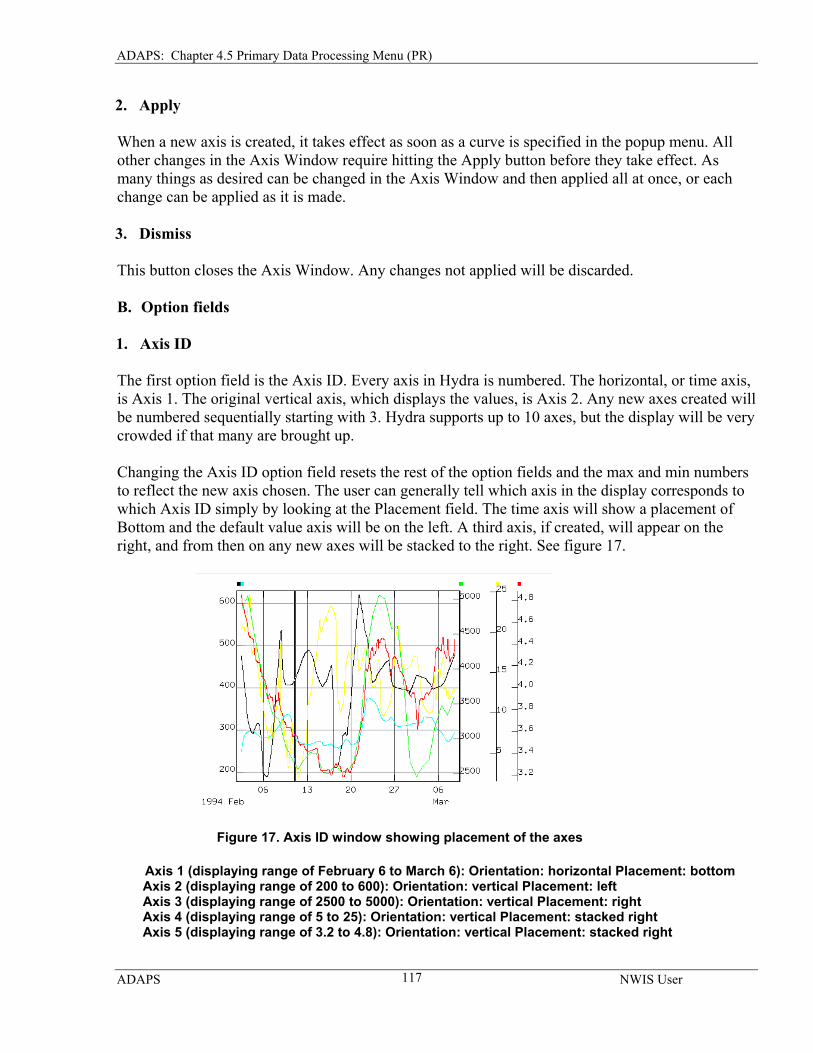
2. Apply When a new axis is created, it takes effect as soon as a curve is specified in the popup menu. All other changes in the Axis Window require hitting the Apply button before they take effect. As many things as desired can be changed in the Axis Window and then applied all at once, or each change can be applied as it is made. 3. Dismiss This button closes the Axis Window. Any changes not applied will be discarded. B. Option fields 1. Axis ID The first option field is the Axis ID. Every axis in Hydra is numbered. The horizontal, or time axis, is Axis 1. The original vertical axis, which displays the values, is Axis 2. Any new axes created will be numbered sequentially starting with 3. Hydra supports up to 10 axes, but the display will be very crowded if that many are brought up. Changing the Axis ID option field resets the rest of the option fields and the max and min numbers to reflect the new axis chosen. The user can generally tell which axis in the display corresponds to which Axis ID simply by looking at the Placement field. The time axis will show a placement of Bottom and the default value axis will be on the left. A third axis, if created, will appear on the right, and from then on any new axes will be stacked to the right. See figure 17.
Figure 17. Axis ID window showing placement of the axes Axis 1 (displaying range of February 6 to March 6): Orientation: horizontal Placement: bottom Axis 2 (displaying range of 200 to 600): Orientation: vertical Placement: left Axis 3 (displaying range of 2500 to 5000): Orientation: vertical Placement: right Axis 4 (displaying range of 5 to 25): Orientation: vertical Placement: stacked right Axis 5 (displaying range of 3.2 to 4.8): Orientation: vertical Placement: stacked right
ADAPS NWIS User
117
ADAPS: Chapter 4.5 Primary Data Processing Menu (PR)
The Axis ID field merely controls which axis' information is displayed, and to which axis changes will be made if Apply is clicked. Thus, there is no need to click Apply to select a new axis; the information comes up immediately when the Axis ID field is changed. 2. Orientation and Placement The Orientation and Placement fields are for informational purposes only; they are not user-modifiable. 3. Linearity The Linearity field controls whether an axis is displayed in Linear or Logarithmic form. The time axis Linearity cannot be changed. Other axes all start with Linear as default, but can be changed to Logarithmic by changing this setting. Apply must be clicked for the change to take effect. 4. Grid lines This setting controls whether grid lines are drawn in the display area. All axes have tic marks and labels associated with them. If grid lines are turned on, thin lines running the width or height of the display area are drawn for each tic mark of that axis. By default, the two default axes, time and values, have grid lines turned on, and all new axes that are created have them turned off. That setting can be changed for any of them with this option field. Apply must be clicked for the change to take effect. C. Max and Min These fields display the current maximum and minimum of the axis currently selected, as it appears in the Graph window. Note: This is not the same as the domain or range of the data the axis contains: a small amount of padding is added to the extremes of each axis so that the curves displayed do not get lost in the boundaries of the display area. The max and min values can be changed if desired, to display a larger area than the Graph window currently shows. The max and min cannot be changed to numbers that would show only a subset of a curve; this is done to preserve the integrity of the Graph window as a complete overview of all the curves. To take a closer look at something, use the Zoom window. Click Apply for the change to take effect. To change the axis bounds of the Zoom window, simply draw a new zoom box.
ADAPS NWIS User
118
ADAPS: Chapter 4.5 Primary Data Processing Menu (PR)
4.5.3 MISTE (MIssing STreamflow Estimation) by Joseph P. Nielsen and William H. Kirby
Introduction
MISTE (MIssing STreamflow Estimation) is a tool for estimating missing daily discharge values for a (study) site using daily values that have been determined for other (index) sites. It is a program in the ADAPS suite of programs that processes primary hydrologic data. It is started from within the program HYDRA at the time daily values are edited. The estimated values that are computed by MISTE are returned to HYDRA as a reference curve by which the study-site daily values may be edited. Although MISTE is designed for streamflow data, any mean daily-value data may be used in a session as either a study site or an index site.
Background
The program uses stepwise regression analysis to correlate daily discharge data at the study site with daily discharge data from one or more index sites. The analysis produces a missing-values estimation equation for the study site. Input to the program consists of concomitant vectors (arrays) of known daily-values for the study site (dependent variable) and for the index sites (independent variables). A single independent variable is a vector of index-site daily-values that is lagged a specific number of time steps with respect to the study-site values. Up to 100 variables can be considered at one time.
The estimation equation is of the form:
y = a + a x + a x + … + a x 0 1 1 2 2 n n
where the x are independent variables and the a are coefficients determined by the regression. Up to 10 variables may be included in the final equation (
n n
≤1 n ≤ 10).
The user has available the following regression parameters by which the analysis can be reviewed: the equation variables, the coefficients, the standard error of estimate, the coefficient of determination, R2, diagnostic statistics standard error of the coefficients (not yet available), and variance inflation factor, (VIF) for assessing the reliability of the estimated coefficient values. Also provided for each equation is a plot of the residuals versus time, a plot of the residuals versus day-of-the-year, a plot of the residuals versus study-site daily values, and a hydrograph of the study-site daily-values and estimated daily-values. The user should keep in mind that the intended use of MISTE is to provide a means of hydrograph comparison and missing-record estimation that is similar in principle to overlaying plotted hydrographs on a light table, but with the advantages of “objective” (i.e., reproducible) computation rather than freehand sketching and of digital output to HYDRA and the daily-values file. Although MISTE is able to process large amounts of data using powerful statistical techniques, there are statistical and hydrological pitfalls in application of these techniques to estimation of missing hydrologic record. The pitfalls include sensitivity to outliers, non-constant variance
ADAPS NWIS User
119
ADAPS: Chapter 4.5 Primary Data Processing Menu (PR)
(heteroscedasticity), serial correlation, cross-correlation among index sites, and possible conflicts between the linear-regression equations and the governing hydrologic laws. Therefore, MISTE cannot be relied on to identify a reliable equation from a large selection of index sites and lags. MISTE does not contain any built-in hydrologic knowledge. The user must supply it. The user bears the primary responsibility for identifying good index sites and supplying reasonable lag values. This identification must be done outside of MISTE, using hydrograph comparisons on a light table, in PLOTWAT, or in HYDRA. Similarly, the regression results and diagnostics do not reflect any hydrologic knowledge. The user is responsible for assessing whether the results make any hydrologic sense. The primary tool for this must be graphical comparison of the regression results with study-site and index-site hydrographs and with the user's knowledge of local hydrology. Creating an Equation
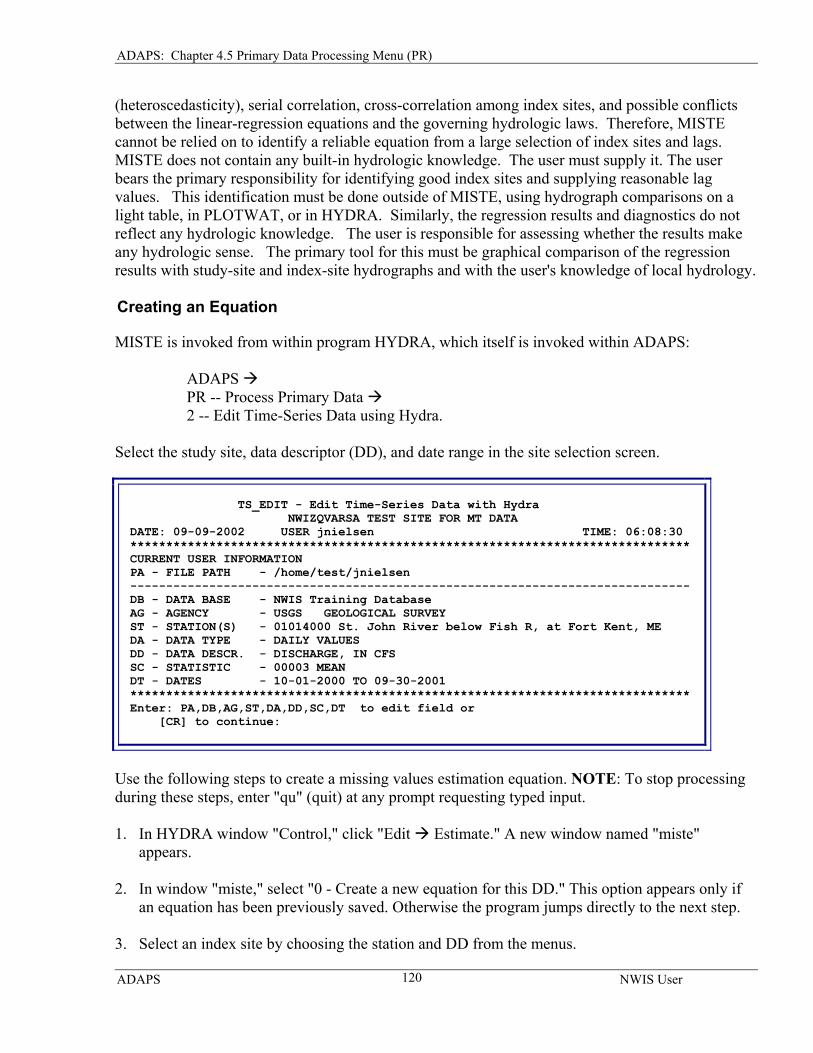
MISTE is invoked from within program HYDRA, which itself is invoked within ADAPS:
ADAPS PR -- Process Primary Data 2 -- Edit Time-Series Data using Hydra.
Select the study site, data descriptor (DD), and date range in the site selection screen.
TS_EDIT - Edit Time-Series Data with Hydra NWIZQVARSA TEST SITE FOR MT DATA DATE: 09-09-2002 USER jnielsen TIME: 06:08:30 ****************************************************************************** CURRENT USER INFORMATION PA - FILE PATH - /home/test/jnielsen ------------------------------------------------------------------------------ DB - DATA BASE - NWIS Training Database AG - AGENCY - USGS GEOLOGICAL SURVEY ST - STATION(S) - 01014000 St. John River below Fish R, at Fort Kent, ME DA - DATA TYPE - DAILY VALUES DD - DATA DESCR. - DISCHARGE, IN CFS SC - STATISTIC - 00003 MEAN DT - DATES - 10-01-2000 TO 09-30-2001 ****************************************************************************** Enter: PA,DB,AG,ST,DA,DD,SC,DT to edit field or [CR] to continue:
Use the following steps to create a missing values estimation equation. NOTE: To stop processing during these steps, enter "qu" (quit) at any prompt requesting typed input.
1. In HYDRA window "Control," click "Edit Estimate." A new window named "miste"
appears. 2. In window "miste," select "0 - Create a new equation for this DD." This option appears only if
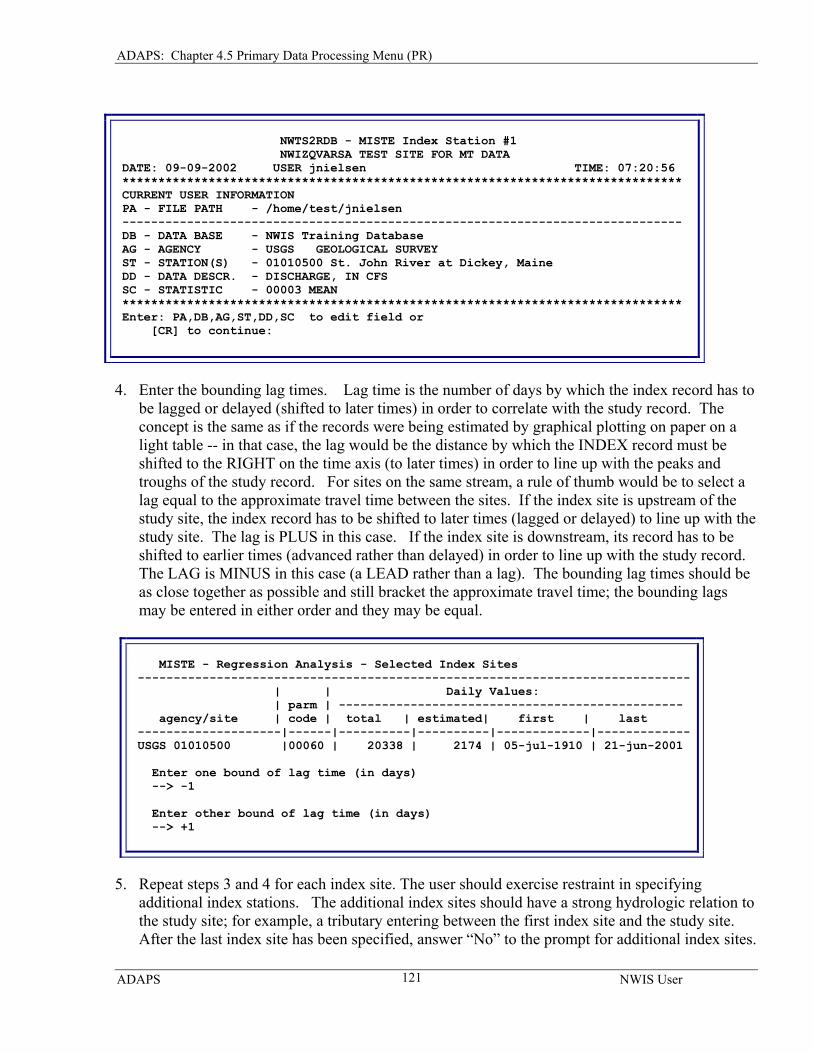
an equation has been previously saved. Otherwise the program jumps directly to the next step. 3. Select an index site by choosing the station and DD from the menus.
ADAPS NWIS User
120
ADAPS: Chapter 4.5 Primary Data Processing Menu (PR)
NWTS2RDB - MISTE Index Station #1 NWIZQVARSA TEST SITE FOR MT DATA DATE: 09-09-2002 USER jnielsen TIME: 07:20:56 ****************************************************************************** CURRENT USER INFORMATION PA - FILE PATH - /home/test/jnielsen ------------------------------------------------------------------------------ DB - DATA BASE - NWIS Training Database AG - AGENCY - USGS GEOLOGICAL SURVEY ST - STATION(S) - 01010500 St. John River at Dickey, Maine DD - DATA DESCR. - DISCHARGE, IN CFS SC - STATISTIC - 00003 MEAN ****************************************************************************** Enter: PA,DB,AG,ST,DD,SC to edit field or [CR] to continue:
4. Enter the bounding lag times. Lag time is the number of days by which the index record has to be lagged or delayed (shifted to later times) in order to correlate with the study record. The concept is the same as if the records were being estimated by graphical plotting on paper on a light table -- in that case, the lag would be the distance by which the INDEX record must be shifted to the RIGHT on the time axis (to later times) in order to line up with the peaks and troughs of the study record. For sites on the same stream, a rule of thumb would be to select a lag equal to the approximate travel time between the sites. If the index site is upstream of the study site, the index record has to be shifted to later times (lagged or delayed) to line up with the study site. The lag is PLUS in this case. If the index site is downstream, its record has to be shifted to earlier times (advanced rather than delayed) in order to line up with the study record. The LAG is MINUS in this case (a LEAD rather than a lag). The bounding lag times should be as close together as possible and still bracket the approximate travel time; the bounding lags may be entered in either order and they may be equal.
MISTE - Regression Analysis - Selected Index Sites ----------------------------------------------------------------------------- | | Daily Values: | parm | ------------------------------------------------ agency/site | code | total | estimated| first | last --------------------|------|----------|----------|-------------|------------- USGS 01010500 |00060 | 20338 | 2174 | 05-jul-1910 | 21-jun-2001 Enter one bound of lag time (in days) --> -1 Enter other bound of lag time (in days) --> +1
5. Repeat steps 3 and 4 for each index site. The user should exercise restraint in specifying
additional index stations. The additional index sites should have a strong hydrologic relation to the study site; for example, a tributary entering between the first index site and the study site. After the last index site has been specified, answer “No” to the prompt for additional index sites.
ADAPS NWIS User
121
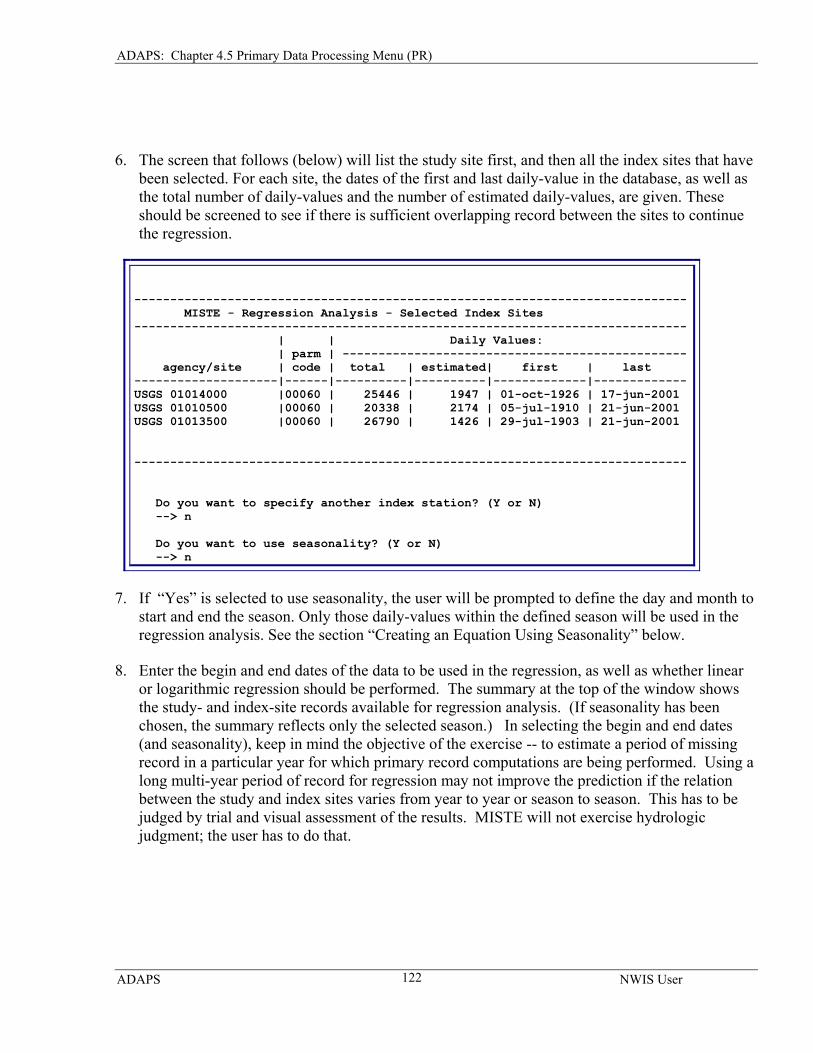
ADAPS: Chapter 4.5 Primary Data Processing Menu (PR)
6. The screen that follows (below) will list the study site first, and then all the index sites that have
been selected. For each site, the dates of the first and last daily-value in the database, as well as the total number of daily-values and the number of estimated daily-values, are given. These should be screened to see if there is sufficient overlapping record between the sites to continue the regression.
----------------------------------------------------------------------------- MISTE - Regression Analysis - Selected Index Sites ----------------------------------------------------------------------------- | | Daily Values: | parm | ------------------------------------------------ agency/site | code | total | estimated| first | last --------------------|------|----------|----------|-------------|-------------USGS 01014000 |00060 | 25446 | 1947 | 01-oct-1926 | 17-jun-2001 USGS 01010500 |00060 | 20338 | 2174 | 05-jul-1910 | 21-jun-2001 USGS 01013500 |00060 | 26790 | 1426 | 29-jul-1903 | 21-jun-2001 ----------------------------------------------------------------------------- Do you want to specify another index station? (Y or N) --> n Do you want to use seasonality? (Y or N) --> n
7. If “Yes” is selected to use seasonality, the user will be prompted to define the day and month to start and end the season. Only those daily-values within the defined season will be used in the regression analysis. See the section “Creating an Equation Using Seasonality” below.
8. Enter the begin and end dates of the data to be used in the regression, as well as whether linear or logarithmic regression should be performed. The summary at the top of the window shows the study- and index-site records available for regression analysis. (If seasonality has been chosen, the summary reflects only the selected season.) In selecting the begin and end dates (and seasonality), keep in mind the objective of the exercise -- to estimate a period of missing record in a particular year for which primary record computations are being performed. Using a long multi-year period of record for regression may not improve the prediction if the relation between the study and index sites varies from year to year or season to season. This has to be judged by trial and visual assessment of the results. MISTE will not exercise hydrologic judgment; the user has to do that.
ADAPS NWIS User
122
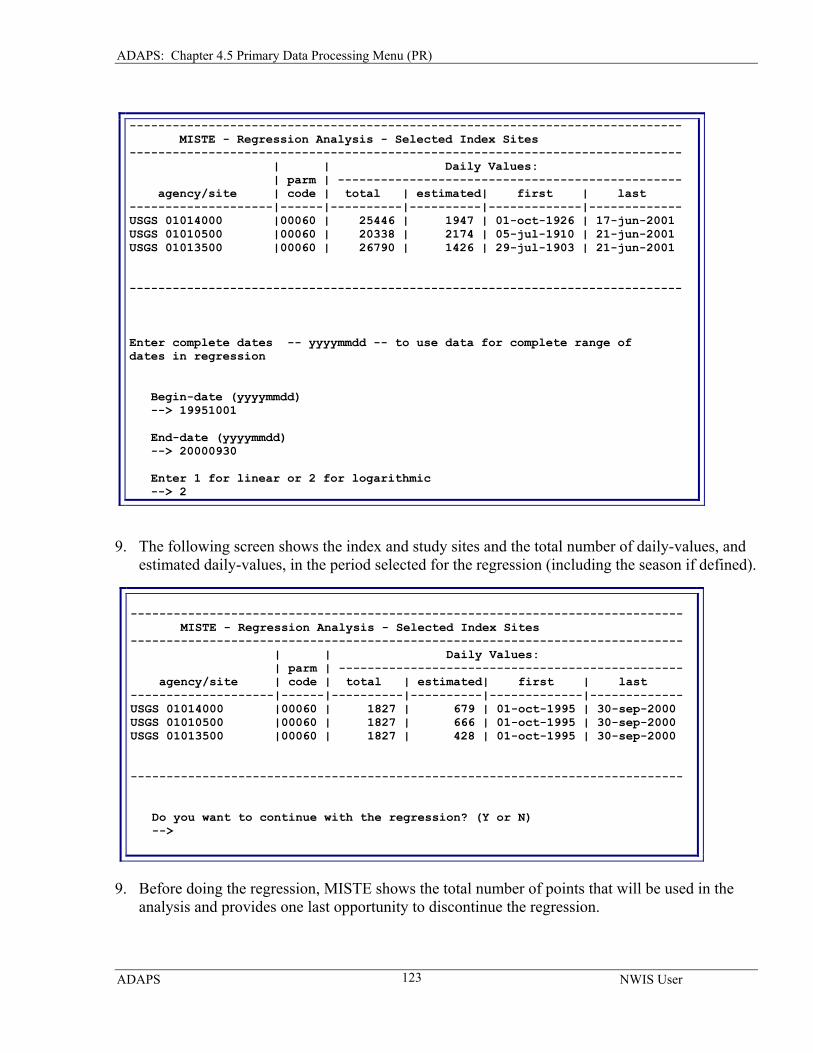
ADAPS: Chapter 4.5 Primary Data Processing Menu (PR)
----------------------------------------------------------------------------- MISTE - Regression Analysis - Selected Index Sites ----------------------------------------------------------------------------- | | Daily Values: | parm | ------------------------------------------------ agency/site | code | total | estimated| first | last --------------------|------|----------|----------|-------------|------------- USGS 01014000 |00060 | 25446 | 1947 | 01-oct-1926 | 17-jun-2001 USGS 01010500 |00060 | 20338 | 2174 | 05-jul-1910 | 21-jun-2001 USGS 01013500 |00060 | 26790 | 1426 | 29-jul-1903 | 21-jun-2001 ----------------------------------------------------------------------------- Enter complete dates -- yyyymmdd -- to use data for complete range of dates in regression Begin-date (yyyymmdd) --> 19951001 End-date (yyyymmdd) --> 20000930 Enter 1 for linear or 2 for logarithmic --> 2
9. The following screen shows the index and study sites and the total number of daily-values, and estimated daily-values, in the period selected for the regression (including the season if defined).
----------------------------------------------------------------------------- MISTE - Regression Analysis - Selected Index Sites ----------------------------------------------------------------------------- | | Daily Values: | parm | ------------------------------------------------ agency/site | code | total | estimated| first | last --------------------|------|----------|----------|-------------|------------- USGS 01014000 |00060 | 1827 | 679 | 01-oct-1995 | 30-sep-2000 USGS 01010500 |00060 | 1827 | 666 | 01-oct-1995 | 30-sep-2000 USGS 01013500 |00060 | 1827 | 428 | 01-oct-1995 | 30-sep-2000 ----------------------------------------------------------------------------- Do you want to continue with the regression? (Y or N) -->
9. Before doing the regression, MISTE shows the total number of points that will be used in the analysis and provides one last opportunity to discontinue the regression.
ADAPS NWIS User
123
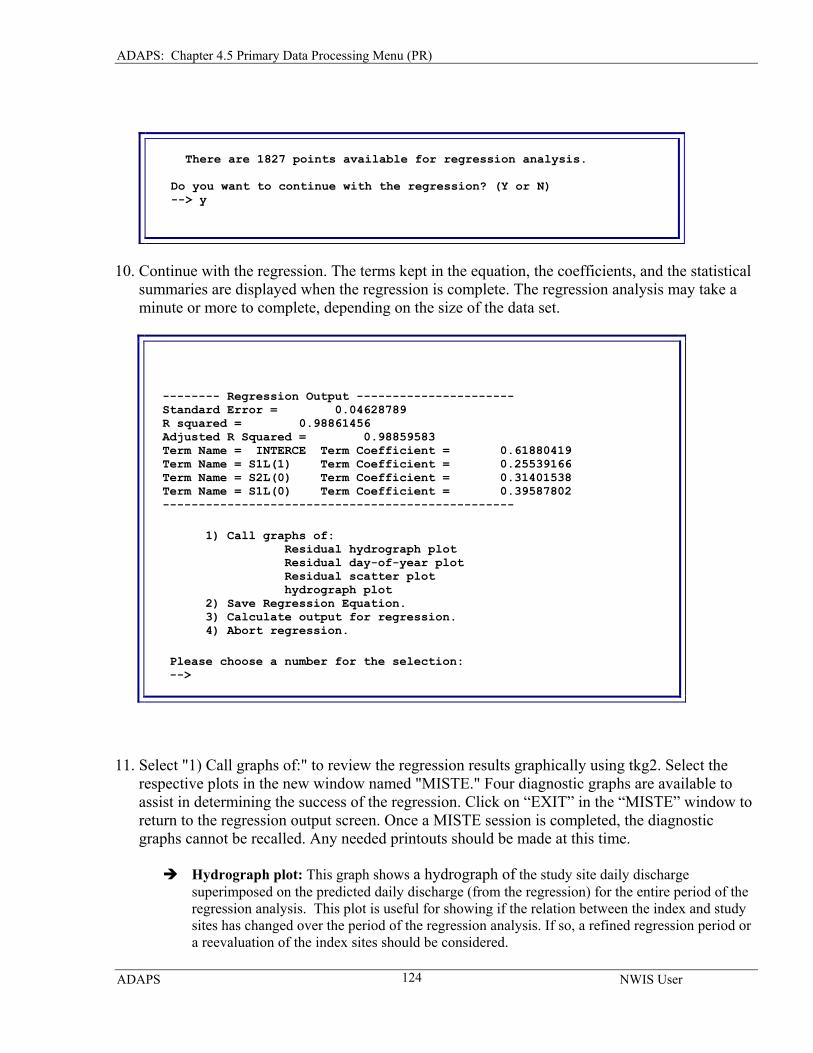
ADAPS: Chapter 4.5 Primary Data Processing Menu (PR)
There are 1827 points available for regression analysis. Do you want to continue with the regression? (Y or N) --> y
10. Continue with the regression. The terms kept in the equation, the coefficients, and the statistical summaries are displayed when the regression is complete. The regression analysis may take a minute or more to complete, depending on the size of the data set.
-------- Regression Output ---------------------- Standard Error = 0.04628789 R squared = 0.98861456 Adjusted R Squared = 0.98859583 Term Name = INTERCE Term Coefficient = 0.61880419 Term Name = S1L(1) Term Coefficient = 0.25539166 Term Name = S2L(0) Term Coefficient = 0.31401538 Term Name = S1L(0) Term Coefficient = 0.39587802 -------------------------------------------------
1) Call graphs of: Residual hydrograph plot Residual day-of-year plot Residual scatter plot hydrograph plot 2) Save Regression Equation. 3) Calculate output for regression. 4) Abort regression.
Please choose a number for the selection: -->
11. Select "1) Call graphs of:" to review the regression results graphically using tkg2. Select the respective plots in the new window named "MISTE." Four diagnostic graphs are available to assist in determining the success of the regression. Click on “EXIT” in the “MISTE” window to return to the regression output screen. Once a MISTE session is completed, the diagnostic graphs cannot be recalled. Any needed printouts should be made at this time.
Hydrograph plot: This graph shows a hydrograph of the study site daily discharge superimposed on the predicted daily discharge (from the regression) for the entire period of the regression analysis. This plot is useful for showing if the relation between the index and study sites has changed over the period of the regression analysis. If so, a refined regression period or a reevaluation of the index sites should be considered.
ADAPS NWIS User
124
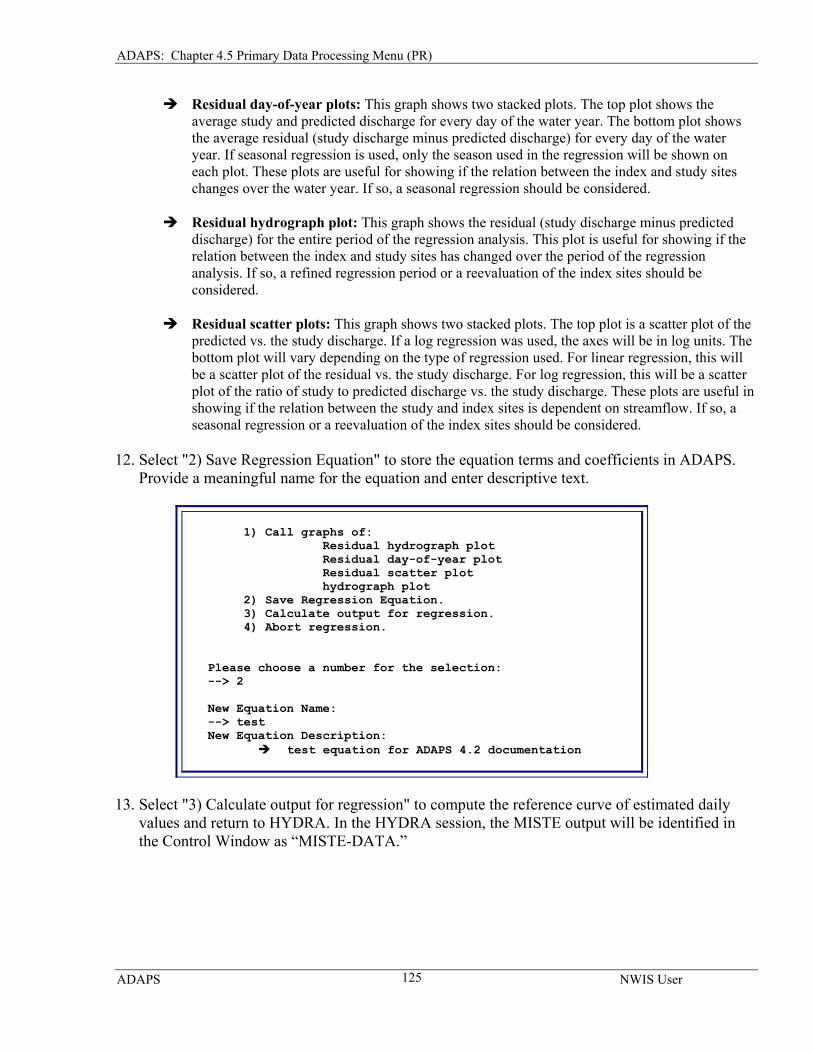
ADAPS: Chapter 4.5 Primary Data Processing Menu (PR)
Residual day-of-year plots: This graph shows two stacked plots. The top plot shows the average study and predicted discharge for every day of the water year. The bottom plot shows the average residual (study discharge minus predicted discharge) for every day of the water year. If seasonal regression is used, only the season used in the regression will be shown on each plot. These plots are useful for showing if the relation between the index and study sites changes over the water year. If so, a seasonal regression should be considered.
Residual hydrograph plot: This graph shows the residual (study discharge minus predicted discharge) for the entire period of the regression analysis. This plot is useful for showing if the relation between the index and study sites has changed over the period of the regression analysis. If so, a refined regression period or a reevaluation of the index sites should be considered.
Residual scatter plots: This graph shows two stacked plots. The top plot is a scatter plot of the predicted vs. the study discharge. If a log regression was used, the axes will be in log units. The bottom plot will vary depending on the type of regression used. For linear regression, this will be a scatter plot of the residual vs. the study discharge. For log regression, this will be a scatter plot of the ratio of study to predicted discharge vs. the study discharge. These plots are useful in showing if the relation between the study and index sites is dependent on streamflow. If so, a seasonal regression or a reevaluation of the index sites should be considered.
12. Select "2) Save Regression Equation" to store the equation terms and coefficients in ADAPS. Provide a meaningful name for the equation and enter descriptive text.
1) Call graphs of: Residual hydrograph plot Residual day-of-year plot Residual scatter plot hydrograph plot 2) Save Regression Equation. 3) Calculate output for regression. 4) Abort regression. Please choose a number for the selection: --> 2 New Equation Name: --> test New Equation Description:
test equation for ADAPS 4.2 documentation
13. Select "3) Calculate output for regression" to compute the reference curve of estimated daily values and return to HYDRA. In the HYDRA session, the MISTE output will be identified in the Control Window as “MISTE-DATA.”
ADAPS NWIS User
125
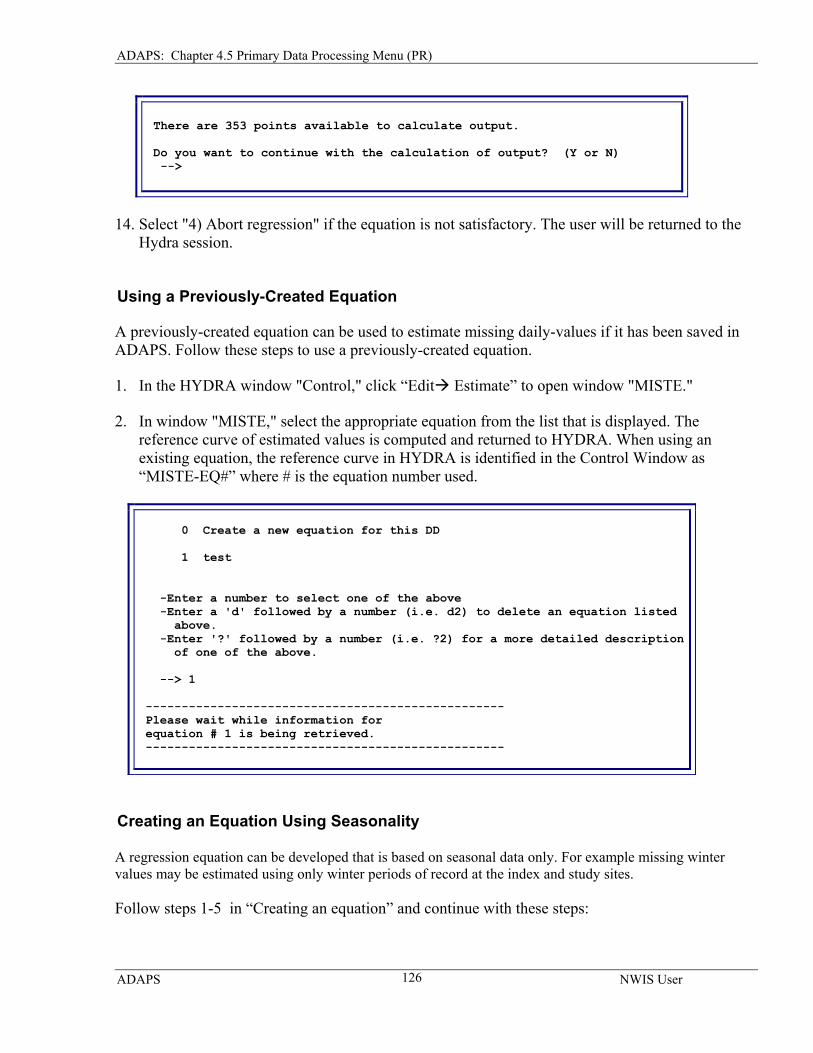
ADAPS: Chapter 4.5 Primary Data Processing Menu (PR)
There are 353 points available to calculate output. Do you want to continue with the calculation of output? (Y or N) -->
14. Select "4) Abort regression" if the equation is not satisfactory. The user will be returned to the Hydra session.
Using a Previously-Created Equation
A previously-created equation can be used to estimate missing daily-values if it has been saved in ADAPS. Follow these steps to use a previously-created equation.
1. In the HYDRA window "Control," click “Edit Estimate” to open window "MISTE."
2. In window "MISTE," select the appropriate equation from the list that is displayed. The reference curve of estimated values is computed and returned to HYDRA. When using an existing equation, the reference curve in HYDRA is identified in the Control Window as “MISTE-EQ#” where # is the equation number used.
0 Create a new equation for this DD 1 test -Enter a number to select one of the above -Enter a 'd' followed by a number (i.e. d2) to delete an equation listed above. -Enter '?' followed by a number (i.e. ?2) for a more detailed description of one of the above. --> 1 -------------------------------------------------- Please wait while information for equation # 1 is being retrieved. --------------------------------------------------
Creating an Equation Using Seasonality A regression equation can be developed that is based on seasonal data only. For example missing winter values may be estimated using only winter periods of record at the index and study sites.
Follow steps 1-5 in “Creating an equation” and continue with these steps:
ADAPS NWIS User
126
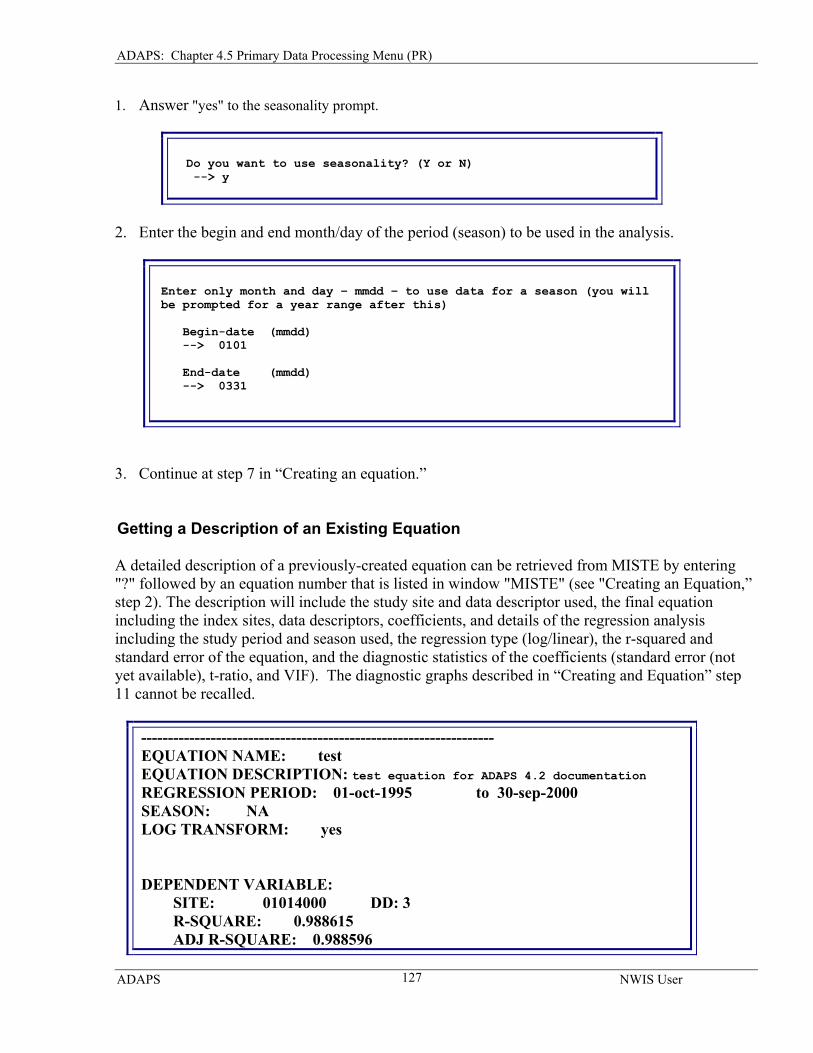
ADAPS: Chapter 4.5 Primary Data Processing Menu (PR)
1. Answer "yes" to the seasonality prompt.
Do you want to use seasonality? (Y or N) --> y
2. Enter the begin and end month/day of the period (season) to be used in the analysis.
Enter only month and day – mmdd – to use data for a season (you will be prompted for a year range after this) Begin-date (mmdd) --> 0101 End-date (mmdd) --> 0331
3. Continue at step 7 in “Creating an equation.” Getting a Description of an Existing Equation A detailed description of a previously-created equation can be retrieved from MISTE by entering "?" followed by an equation number that is listed in window "MISTE" (see "Creating an Equation,” step 2). The description will include the study site and data descriptor used, the final equation including the index sites, data descriptors, coefficients, and details of the regression analysis including the study period and season used, the regression type (log/linear), the r-squared and standard error of the equation, and the diagnostic statistics of the coefficients (standard error (not yet available), t-ratio, and VIF). The diagnostic graphs described in “Creating and Equation” step 11 cannot be recalled.
------------------------------------------------------------------ EQUATION NAME: test EQUATION DESCRIPTION: test equation for ADAPS 4.2 documentation REGRESSION PERIOD: 01-oct-1995 to 30-sep-2000 SEASON: NA LOG TRANSFORM: yes DEPENDENT VARIABLE: SITE: 01014000 DD: 3 R-SQUARE: 0.988615 ADJ R-SQUARE: 0.988596
ADAPS NWIS User
127
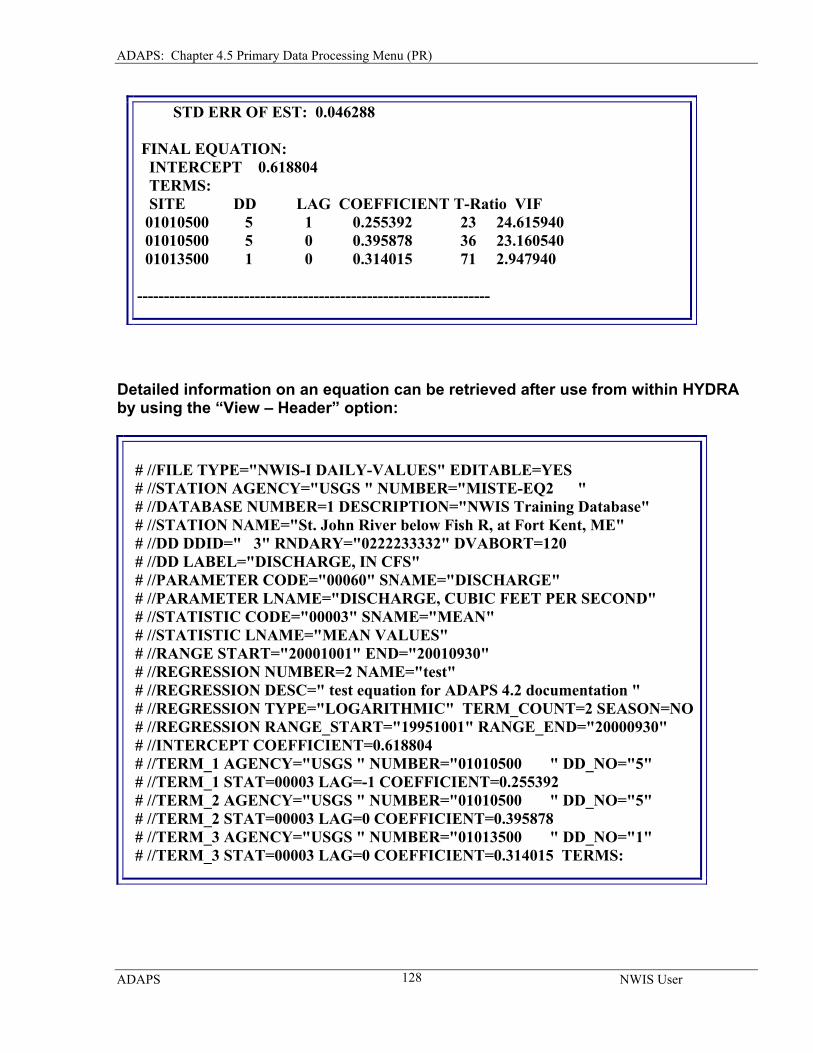
ADAPS: Chapter 4.5 Primary Data Processing Menu (PR)
STD ERR OF EST: 0.046288 FINAL EQUATION: INTERCEPT 0.618804 TERMS: SITE DD LAG COEFFICIENT T-Ratio VIF 01010500 5 1 0.255392 23 24.615940 01010500 5 0 0.395878 36 23.160540 01013500 1 0 0.314015 71 2.947940 ------------------------------------------------------------------
Detailed information on an equation can be retrieved after use from within HYDRA by using the “View – Header” option:
# //FILE TYPE="NWIS-I DAILY-VALUES" EDITABLE=YES # //STATION AGENCY="USGS " NUMBER="MISTE-EQ2 " # //DATABASE NUMBER=1 DESCRIPTION="NWIS Training Database" # //STATION NAME="St. John River below Fish R, at Fort Kent, ME" # //DD DDID=" 3" RNDARY="0222233332" DVABORT=120 # //DD LABEL="DISCHARGE, IN CFS" # //PARAMETER CODE="00060" SNAME="DISCHARGE" # //PARAMETER LNAME="DISCHARGE, CUBIC FEET PER SECOND" # //STATISTIC CODE="00003" SNAME="MEAN" # //STATISTIC LNAME="MEAN VALUES" # //RANGE START="20001001" END="20010930" # //REGRESSION NUMBER=2 NAME="test" # //REGRESSION DESC=" test equation for ADAPS 4.2 documentation " # //REGRESSION TYPE="LOGARITHMIC" TERM_COUNT=2 SEASON=NO # //REGRESSION RANGE_START="19951001" RANGE_END="20000930" # //INTERCEPT COEFFICIENT=0.618804 # //TERM_1 AGENCY="USGS " NUMBER="01010500 " DD_NO="5" # //TERM_1 STAT=00003 LAG=-1 COEFFICIENT=0.255392 # //TERM_2 AGENCY="USGS " NUMBER="01010500 " DD_NO="5" # //TERM_2 STAT=00003 LAG=0 COEFFICIENT=0.395878 # //TERM_3 AGENCY="USGS " NUMBER="01013500 " DD_NO="1" # //TERM_3 STAT=00003 LAG=0 COEFFICIENT=0.314015 TERMS:
ADAPS NWIS User
128
ADAPS: Chapter 4.5 Primary Data Processing Menu (PR)
The diagnostic statistics of the regression are intended to indicate whether the regression equation represents "real" hydrologic effects or whether it is merely an artifact of random sampling fluctuations. (Consider tossing a fair coin four times. Suppose that there are three heads. Does that prove that the coin is not fair? The diagnostic statistics are intended to answer this kind of question.) The diagnostic statistics can be explained in general terms as follows:
• R-square and adjusted r-square -- the fraction of the variance of the study site data that is "explained" by the index site data and the regression equation.
• Standard error of estimate -- the magnitude of scatter of the study site data around the regression line or equation; the standard deviation of the residuals from the regression equation.
• T-ratio -- the ratio of the coefficient value to its standard error of estimate. The magnitude of this ratio indicates whether the coefficient value is significantly different from zero in a statistical sense. If the t-ratio is less than one, the value of the coefficient is less than the uncertainty in its determination; such a value might occur by random sampling error even if the index site had no real relation to the study site. T-ratios greater than about two or three are commonly taken as indicative of real effects.
• Variance Inflation Factor (VIF) -- a measure of the degree of correlation between an independent variable and the other independent variables ("multicollinearity"). A value of one indicates no multicollinearity; values greater than 10 indicate potential for serious problems with the validity of the coefficients. Problems include unrealistic magnitudes and signs, unrealistic numbers of variables included in the equation, and terms that seem nearly to cancel each other. These problems do not necessarily affect the standard error of estimate or r-square, but they can cause inaccurate predictions if the values of the predictor variables (index sites) are outside of the range used to establish the regression equation. Since streamflows at neighboring sites or different lags are highly intercorrelated, multicollinearity is expected if multiple index sites or lags are specified. MISTE has no algorithm for detecting or correcting for multicollinearity. It is the user's responsibility to exercise restraint and specify only those index sites and lags that have clear physical relations to the study site.
The regression diagnostic statistics require some judgment in their interpretation in the context of estimating missing record. These statistics are based on assumptions of uniform variability of the observations ("homoscedasticity") and serial independence of successive observations. These assumptions may not be satisfied by stream-flow data. This does not invalidate the use of the regression equation for estimation of missing record, but it does mean that no hard and fast rules for interpreting and using the diagnostic statistics can be provided. In particular, the value of r-square or the standard error of estimate should not be taken as the sole measure of goodness of the regression equation -- hydrologic reasonability, visual assessment of the graphical diagnostic products, and visual assessment of the estimated record in HYDRA should be the main criteria for judging the regression results. Deleting an Equation A previously-created equation can be deleted from ADAPS by entering "d" followed by an equation number that is listed in window "MISTE" (see "Creating an Equation,” step 2).
ADAPS NWIS User
129
ADAPS: Chapter 4.5 Primary Data Processing Menu (PR)
4.5.4 Update/Display Data Corrections by Sarah E. Giffen
Data corrections are applied to recorded water data parameter readings to compensate for erroneous recordings. These corrections can vary by both time and data value. They are usually applied for short durations of time. There are three separate sets of data corrections available, which can be applied independently of one another. For stage data these sets are referred to as the “Gage Height Correction,” “Datum Correction from Levels,” and “Other” and are displayed as such in ADAPS. Gage Height Corrections are defined as corrections applied to the gage height due to instrument errors. Datum Corrections from Levels are defined as corrections applied to that gage height to correct for vertical movement of the gage documented by levels run at the station. Other corrections refer to any other corrections that need to be applied to the gage height that don’t fall within the other two categories. For QW data, the three sets of corrections have been named “Sensor Fouling,” “Calibration Drift,” and “Other” corrections. Other non-stage data corrections may be named by the user based on what is relevant for that type of data. The three correction sets are displayed separately. All three sets of data corrections can vary both by time and parameter, and can consist of up to three points, each point being an input data point and the corresponding data correction at that point. The interpolation between these points is linear. The first correction value will be used for data below the first input point and the last correction value will be used for data above the last input point. The proration of data corrections between values is done as an unweighted linear calculation between the individual user-supplied input and correction value pairs. This proration process also occurs automatically across water year boundaries. The last value in the previous water year and the first values of the current water year are used for the proration. If there are no entries in the previous water year’s file, the data correction values from the previous water year are not applied and the data correction begins at the time and with the values available in the current water year. Up to 100 datum corrections can be stored for each water year, and are displayed as 28 entries per page. To Update/Display data corrections select “Update/Display Data Corrections” from the “PR-Primary Data Processing” menu (DC_EDIT). In the “current user information” menu verify or change DB-database, AG-agency, ST-station, DD-data descriptor and YR-year options as needed. For multi-parameter processing, the data descriptor must be an input parameter, since data corrections are not applied to computed parameters (for example, discharge in stage-discharge processing). The output (OT – output to) should also be specified. Options are to file, to terminal, or to a printer. After these items have been specified, a carriage return will display a list of the number of corrections that have already been entered for each of the three types of corrections for three consecutive water years: the water year previous to the specified year, the specified water year, and the year following the specified water year. This menu for stage data is shown below. If a data set other than stage is selected, the name column heading with the data correction, gage height correction, and other correction entries will not be shown. In the “id menu” for the data set displayed below, no corrections have been entered in the selected water year (the 2001 water year).
ADAPS NWIS User
130
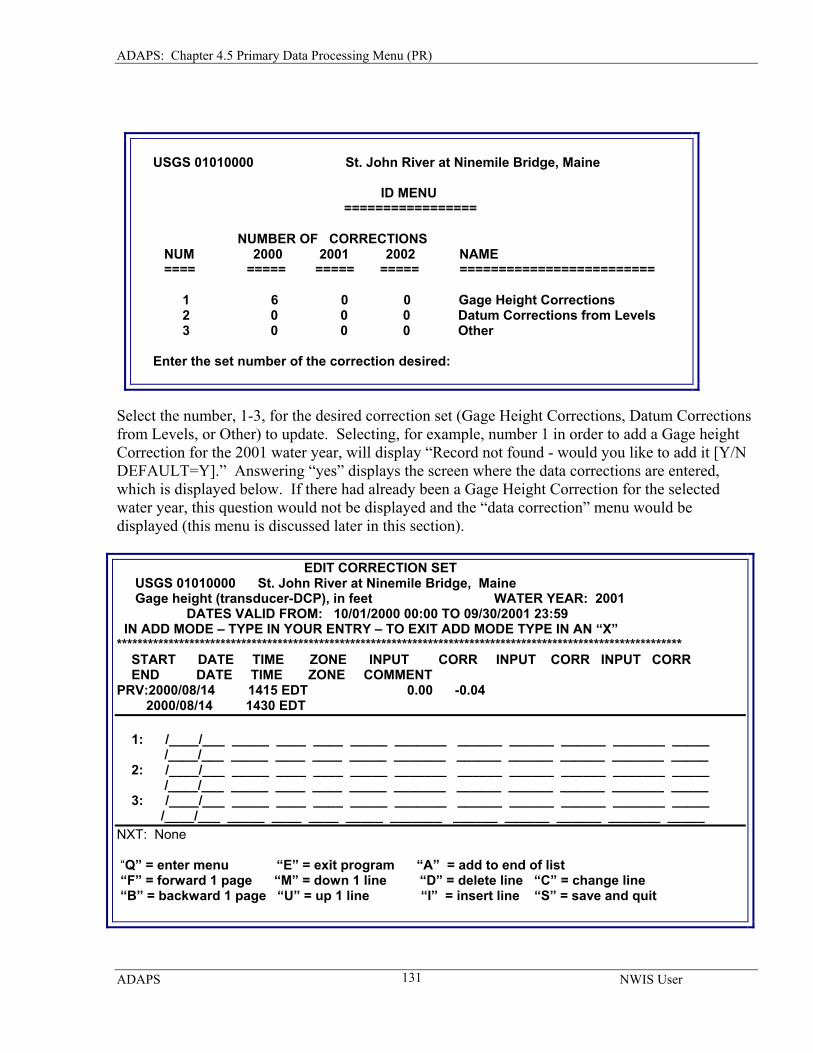
ADAPS: Chapter 4.5 Primary Data Processing Menu (PR)
USGS 01010000 St. John River at Ninemile Bridge, Maine ID MENU ================= NUMBER OF CORRECTIONS NUM 2000 2001 2002 NAME ==== ===== ===== ===== ========================= 1 6 0 0 Gage Height Corrections 2 0 0 0 Datum Corrections from Levels 3 0 0 0 Other Enter the set number of the correction desired:
Select the number, 1-3, for the desired correction set (Gage Height Corrections, Datum Corrections from Levels, or Other) to update. Selecting, for example, number 1 in order to add a Gage height Correction for the 2001 water year, will display “Record not found - would you like to add it [Y/N DEFAULT=Y].” Answering “yes” displays the screen where the data corrections are entered, which is displayed below. If there had already been a Gage Height Correction for the selected water year, this question would not be displayed and the “data correction” menu would be displayed (this menu is discussed later in this section). EDIT CORRECTION SET USGS 01010000 St. John River at Ninemile Bridge, Maine Gage height (transducer-DCP), in feet WATER YEAR: 2001 DATES VALID FROM: 10/01/2000 00:00 TO 09/30/2001 23:59 IN ADD MODE – TYPE IN YOUR ENTRY – TO EXIT ADD MODE TYPE IN AN “X” ************************************************************************************************************* START DATE TIME ZONE INPUT CORR INPUT CORR INPUT CORR END DATE TIME ZONE COMMENT PRV:2000/08/14 1415 EDT 0.00 -0.04 2000/08/14 1430 EDT 1: /____/___ _____ ____ ____ _____ _______ ______ ______ ______ _______ _____ /____/___ _____ ____ ____ _____ _______ ______ ______ ______ _______ _____ 2: /____/___ _____ ____ ____ _____ _______ ______ ______ ______ _______ _____ /____/___ _____ ____ ____ _____ _______ ______ ______ ______ _______ _____ 3: /____/___ _____ ____ ____ _____ _______ ______ ______ ______ _______ _____ /____/___ _____ ____ ____ _____ _______ ______ ______ ______ _______ _____ NXT: None “Q” = enter menu “E” = exit program “A” = add to end of list “F” = forward 1 page “M” = down 1 line “D” = delete line “C” = change line “B” = backward 1 page “U” = up 1 line “I” = insert line “S” = save and quit
ADAPS NWIS User
131
ADAPS: Chapter 4.5 Primary Data Processing Menu (PR)
The correction set to update (set 1 in this case), station number, station name, and water year are listed at the top of the table. Below that is a message telling the user that they are automatically in “add” mode since there are no preexisting data corrections. The user can start to add data corrections or can exit “add” mode by typing an “X.” The line with the “PRV” heading displays the last data correction (for the specified correction set) from a previous water year. The start date, time and input, and correction value pair is listed on the first line. The end date and time, as well as a comment field, are listed on the second line. The start date and time specifies the time that a correction is started and the end date and time specifies the time when the correction ends. The first correction, gage height correction for the 2001 water year in this case, is entered under the “1:” line heading. To enter a correction, enter the month, day, time, time datum (PST, etc.), input value, and corresponding correction in the spaces provided. The time datum can be skipped by hitting enter after the time. The default time datum for that station at that date and time will be automatically entered and the entry will skip to the first correction input point. Up to three pairs of input points and corrections may be entered on a line after the time data. These three points are entered with the first point being the lowest data input point and corresponding correction. After entry of the first line of correction information, hit enter to get to the second line. On the second line the date and time can be left blank, with or without a comment, and the correction will prorate linearly through time to the next available correction. If a date and time is entered on the second line, the correction will be held constant through time and ended at the date and time specified. The values will not be lined up perfectly under the headers as they are entered. After entering all data on the first line, a carriage return will center the data in their respective columns. The correction can have one, two, or three input and corresponding correction value pairs. If it is a one-point correction, the data correction will be applied as a constant across the entire range of input, regardless of the input point entered. If it is a two or three-point correction, the correction values will be prorated between the input points and will be carried as a flat correction for values less than or greater than the least and greatest specified input points respectively. An example of a correction is displayed and explained below:
ADAPS NWIS User
132
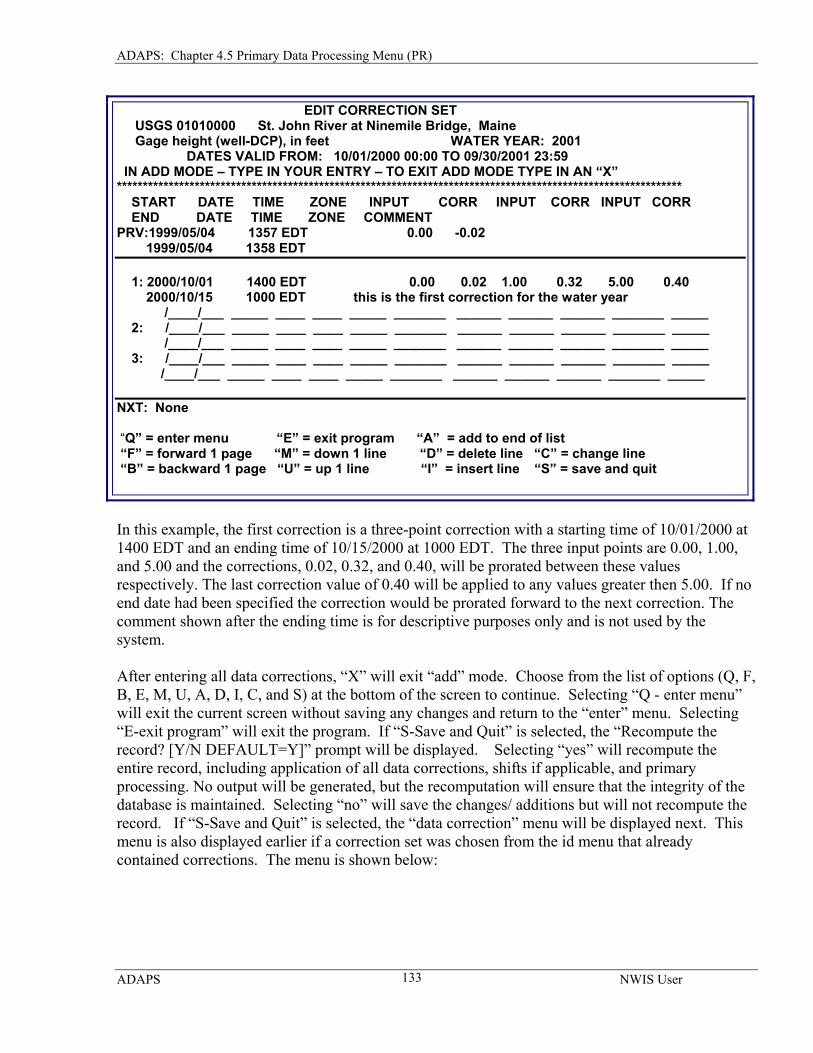
ADAPS: Chapter 4.5 Primary Data Processing Menu (PR)
EDIT CORRECTION SET USGS 01010000 St. John River at Ninemile Bridge, Maine Gage height (well-DCP), in feet WATER YEAR: 2001 DATES VALID FROM: 10/01/2000 00:00 TO 09/30/2001 23:59 IN ADD MODE – TYPE IN YOUR ENTRY – TO EXIT ADD MODE TYPE IN AN “X” ************************************************************************************************************* START DATE TIME ZONE INPUT CORR INPUT CORR INPUT CORR END DATE TIME ZONE COMMENT PRV:1999/05/04 1357 EDT 0.00 -0.02 1999/05/04 1358 EDT 1: 2000/10/01 1400 EDT 0.00 0.02 1.00 0.32 5.00 0.40 2000/10/15 1000 EDT this is the first correction for the water year /____/___ _____ ____ ____ _____ _______ ______ ______ ______ _______ _____ 2: /____/___ _____ ____ ____ _____ _______ ______ ______ ______ _______ _____ /____/___ _____ ____ ____ _____ _______ ______ ______ ______ _______ _____ 3: /____/___ _____ ____ ____ _____ _______ ______ ______ ______ _______ _____ /____/___ _____ ____ ____ _____ _______ ______ ______ ______ _______ _____ NXT: None “Q” = enter menu “E” = exit program “A” = add to end of list “F” = forward 1 page “M” = down 1 line “D” = delete line “C” = change line “B” = backward 1 page “U” = up 1 line “I” = insert line “S” = save and quit In this example, the first correction is a three-point correction with a starting time of 10/01/2000 at 1400 EDT and an ending time of 10/15/2000 at 1000 EDT. The three input points are 0.00, 1.00, and 5.00 and the corrections, 0.02, 0.32, and 0.40, will be prorated between these values respectively. The last correction value of 0.40 will be applied to any values greater then 5.00. If no end date had been specified the correction would be prorated forward to the next correction. The comment shown after the ending time is for descriptive purposes only and is not used by the system. After entering all data corrections, “X” will exit “add” mode. Choose from the list of options (Q, F, B, E, M, U, A, D, I, C, and S) at the bottom of the screen to continue. Selecting “Q - enter menu” will exit the current screen without saving any changes and return to the “enter” menu. Selecting “E-exit program” will exit the program. If “S-Save and Quit” is selected, the “Recompute the record? [Y/N DEFAULT=Y]” prompt will be displayed. Selecting “yes” will recompute the entire record, including application of all data corrections, shifts if applicable, and primary processing. No output will be generated, but the recomputation will ensure that the integrity of the database is maintained. Selecting “no” will save the changes/ additions but will not recompute the record. If “S-Save and Quit” is selected, the “data correction” menu will be displayed next. This menu is also displayed earlier if a correction set was chosen from the id menu that already contained corrections. The menu is shown below:
ADAPS NWIS User
133
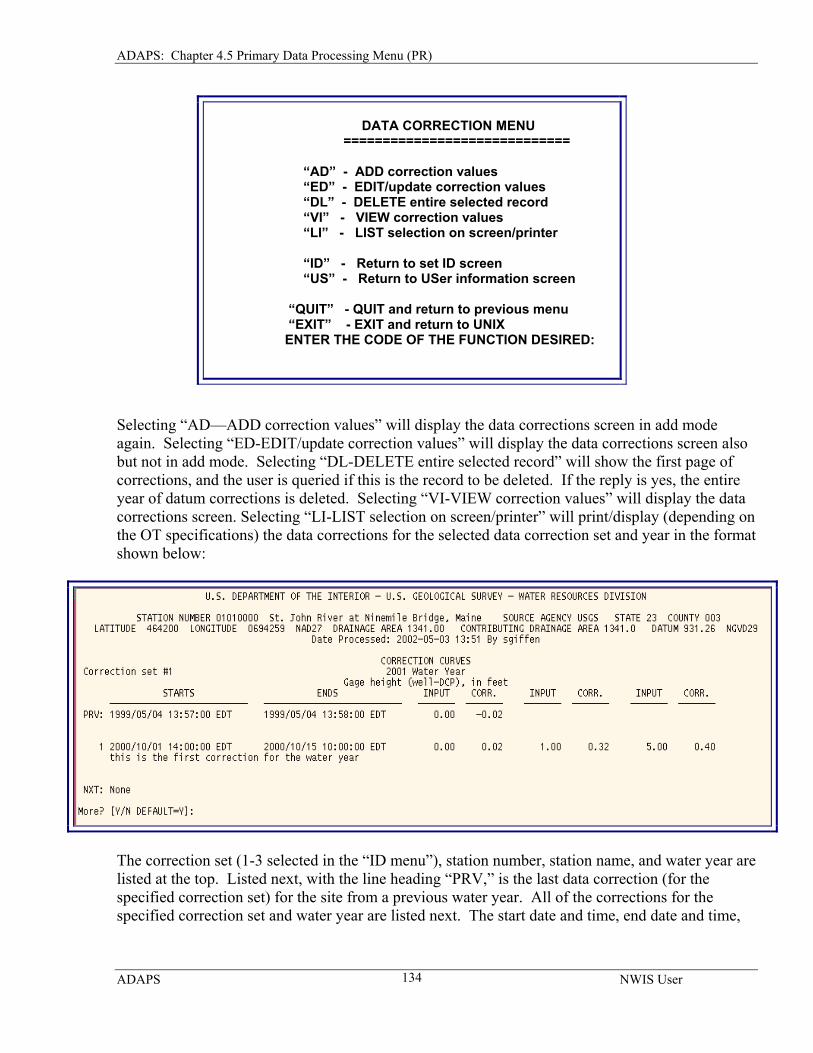
ADAPS: Chapter 4.5 Primary Data Processing Menu (PR)
DATA CORRECTION MENU ============================= “AD” - ADD correction values “ED” - EDIT/update correction values “DL” - DELETE entire selected record “VI” - VIEW correction values “LI” - LIST selection on screen/printer “ID” - Return to set ID screen “US” - Return to USer information screen “QUIT” - QUIT and return to previous menu “EXIT” - EXIT and return to UNIX ENTER THE CODE OF THE FUNCTION DESIRED:
Selecting “AD—ADD correction values” will display the data corrections screen in add mode again. Selecting “ED-EDIT/update correction values” will display the data corrections screen also but not in add mode. Selecting “DL-DELETE entire selected record” will show the first page of corrections, and the user is queried if this is the record to be deleted. If the reply is yes, the entire year of datum corrections is deleted. Selecting “VI-VIEW correction values” will display the data corrections screen. Selecting “LI-LIST selection on screen/printer” will print/display (depending on the OT specifications) the data corrections for the selected data correction set and year in the format shown below:
The correction set (1-3 selected in the “ID menu”), station number, station name, and water year are listed at the top. Listed next, with the line heading “PRV,” is the last data correction (for the specified correction set) for the site from a previous water year. All of the corrections for the specified correction set and water year are listed next. The start date and time, end date and time,
ADAPS NWIS User
134
ADAPS: Chapter 4.5 Primary Data Processing Menu (PR)
input point and correction value pairs are listed in columns from left to right. Any comment fields will be shown on the line following the correction for which it applies. Selecting “ID-Return to set ID screen” will display the “ID screen” menu. Selecting “US-Return to user information screen” will return the user to the information screen display menu.
4.5.5 Update/Display Rating Tables by James M. Caldwell
The RT_EDIT program allows the user to update and display rating tables. Valid rating types are:
• Conversion of input • Standard rating • Stage-fall (slope) rating • Fall/discharge ratio rating • Stage-area rating • Stage-velocity correction factor rating • Deflection-velocity rating • Conversion of auxiliary input
Ratings are stored under the data descriptor (DD) associated with the computed side of the rating. Where there are auxiliary DDs and ratings, all ratings are stored under the DD associated with the base input DD. For example, the slope-discharge computation has an auxiliary gage-height DD and a base gage-height DD. The rating to convert the auxiliary gage-height dial readings to feet (called an input conversion or a Conversion Of Input rating, COI) must be stored with the corresponding base gage-height DD, not the auxiliary gage-height DD.
Note: in ADAPS 4.2, multi-parameter ratings have been moved from the input parameter to the computed parameter. For example, with stage-discharge ratings, the data descriptor used is discharge. To display or update ratings, select “Update/Display Rating Tables” from the PR – primary data processing menu. From the initial menu, the database, agency, station, and data descriptor are specified. The program checks to see if the site and data descriptor chosen have any existing ratings. If a rating does not exist, the program queries whether one is to be added: “There are no ratings for this DD, do you wish to add a new rating.” For creating a new rating, see the section on “AD - Rating” below. If a rating exists, the rating selection list menu displays the ratings available for the chosen site and data descriptor with the prompt: “Enter the number of the rating desired, or key return to add a new rating.” Update/ Display Existing Rating To update or display an existing rating choose the appropriate rating from the rating selection list menu. The currently active rating is displayed with an (*) appended. After choosing the desired
ADAPS NWIS User
135
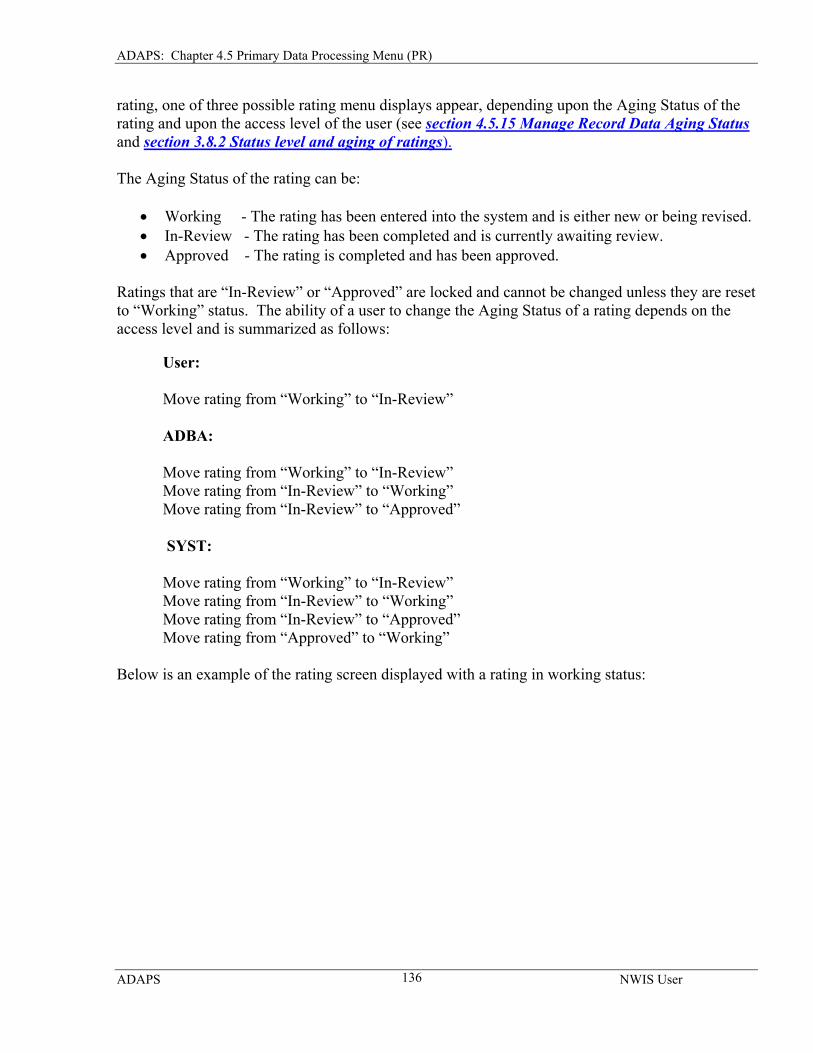
ADAPS: Chapter 4.5 Primary Data Processing Menu (PR)
rating, one of three possible rating menu displays appear, depending upon the Aging Status of the rating and upon the access level of the user (see section 4.5.15 Manage Record Data Aging Status and section 3.8.2 Status level and aging of ratings). The Aging Status of the rating can be:
• Working - The rating has been entered into the system and is either new or being revised. • In-Review - The rating has been completed and is currently awaiting review. • Approved - The rating is completed and has been approved.
Ratings that are “In-Review” or “Approved” are locked and cannot be changed unless they are reset to “Working” status. The ability of a user to change the Aging Status of a rating depends on the access level and is summarized as follows:
User: Move rating from “Working” to “In-Review” ADBA: Move rating from “Working” to “In-Review” Move rating from “In-Review” to “Working” Move rating from “In-Review” to “Approved” SYST: Move rating from “Working” to “In-Review” Move rating from “In-Review” to “Working” Move rating from “In-Review” to “Approved” Move rating from “Approved” to “Working” Below is an example of the rating screen displayed with a rating in working status:
ADAPS NWIS User
136
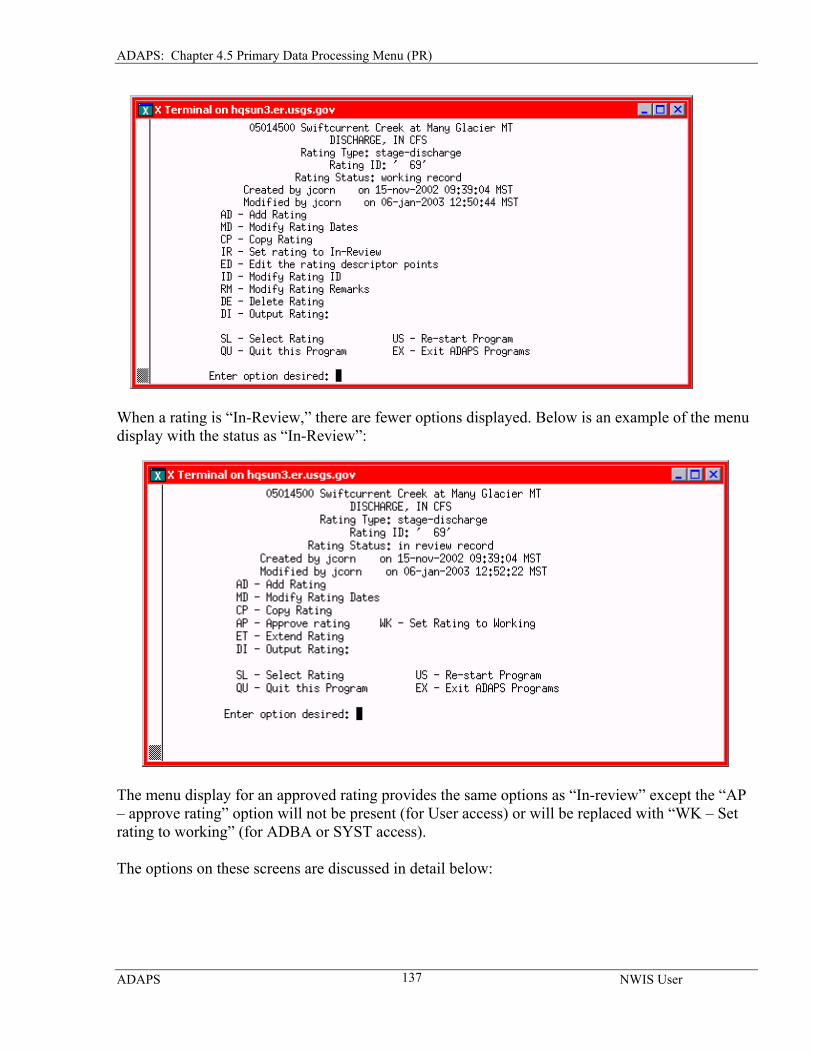
ADAPS: Chapter 4.5 Primary Data Processing Menu (PR)
When a rating is “In-Review,” there are fewer options displayed. Below is an example of the menu display with the status as “In-Review”:
The menu display for an approved rating provides the same options as “In-review” except the “AP – approve rating” option will not be present (for User access) or will be replaced with “WK – Set rating to working” (for ADBA or SYST access). The options on these screens are discussed in detail below:
ADAPS NWIS User
137
ADAPS: Chapter 4.5 Primary Data Processing Menu (PR)
AD – Add Rating If creating a new rating, the user is initially queried for the four-digit rating ID. Next, the options for expansion types are selected: linear, log or an equation. An option to enter remarks is the next option provided. The remarks will be saved with the rating and will be printed along with the rating.
For linear or log ratings, the rating value in/out points are displayed in four columns on a page. The first column contains the first ten rating value in/out points; the second column contains the next ten rating points; and so on up through the fourth column. If there are more than 40 points in the rating, they are stored on the succeeding pages. Up to 999 rating point pairs can be entered for one rating. Options on these pages are:
• S - Save and return • Q - Quit (no save) • F - Forward one page • B - Backward one page • U - Up one line • M - Down one line • I - Insert line • D - Delete line • C - Change line • A - Add points. An “X” is used to exit add or insert mode (usually entered in
Column one or first field on the form).
To begin adding entries in the record choose the “A” key.
Add a New Rating Point
A new rating point is added to the end of the rating pair (input and output values) list by entering “A.” This automatically places the cursor at the end of the list after which the entry is made. If there are no entries for the particular rating, an “A” (Add mode) must be entered to begin adding entries. The user must enter the input value, then a blank, and then the output value. A carriage return is necessary after a pair of values has been entered. The cursor goes to the next line and a new entry is made. The user can enter as many pairs of rating points as needed while in Add mode. To stop making entries and exit from Add mode, enter “X.” Insert a Rating Point
A rating point is inserted the same way as adding a rating point except that only one pair of rating points is inserted at a time. To make an insertion, place the cursor on the line where the entry is to be made and then enter “I.” To exit from Insert mode without making an insertion, enter “X.”
ADAPS NWIS User
138
ADAPS: Chapter 4.5 Primary Data Processing Menu (PR)
Change a Rating Point
A rating point is changed by placing the cursor on the line that is to be changed and entering “C.” This puts the user in Change mode, after which a new rating point is entered over the current one. Once in Change mode, a new rating point must be entered. Delete a Rating Point
Rating points are deleted one at a time. To delete a rating point, place the cursor on the rating point to be deleted and enter a “D.” There is a prompt to ensure that this is the rating point to be deleted. Save Rating Table
The user can save the new or updated rating table data by entering an “S.” This saves all the current changes that have been made. All changes that were made will be present the next time the user enters the rating table program. Saving the rating table takes the user back to the program menu level. Quit ( no save) The user can quit the rating edit program without saving any edited points, if so desired. This option removes the user completely from the RT_EDIT program and back to the PR sub-menu level. For a logarithmic expansion-type rating, the rating offset screen (next screen after entering all definition points) allows the entry of two breakpoints and three offset values. The rating edit offset screen accurately reflects how the ADAPS software handles multiple offset values and breakpoints. The first offset value is always applied until the first breakpoint is reached. The second offset value is then applied from the first breakpoint until a second breakpoint, if any, is reached and a third offset value is picked up. Several programs are dependent upon the rating offset breakpoints matching a rating table input value. The Rating Edit program does not allow a SAVE (s) command at the rating table input/value editing screen level if an offset breakpoint does not have a rating table input value match. If this occurs, the breakpoint is displayed and an option given to edit either the offset screen or the rating table input/value screen. The SAVE command may then be given again for execution. For an equation-type rating, follow the steps above to the option for an equation rating. The Equation is: output = A * (B + input) C + D. Enter values for the coefficients A, B, C and D. Values for C (the power for the equation) are limited to –25 to +25 excluding zero. The maximum of any other coefficient is 10E30. The program checks for ascending and descending rating table input and output values according to the “rating type” (i.e., conversion of input, stage-area, etc.) The following validation rules apply to ratings:
ADAPS NWIS User
139
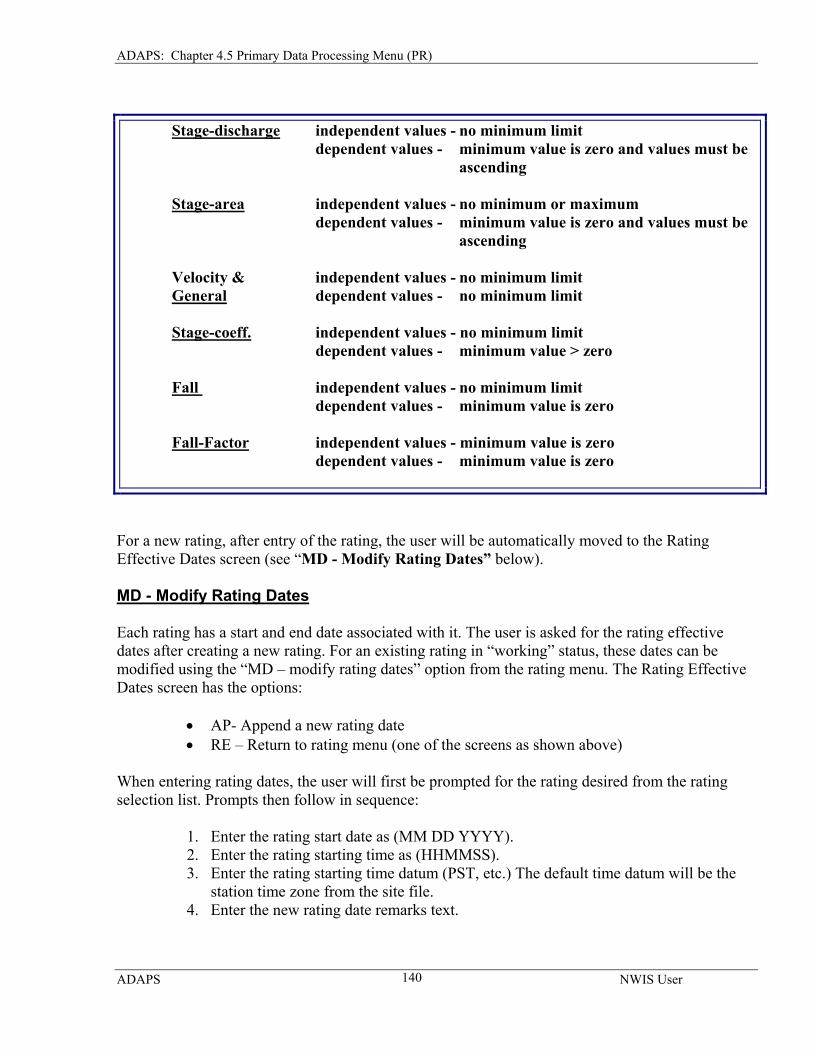
ADAPS: Chapter 4.5 Primary Data Processing Menu (PR)
Stage-discharge independent values - no minimum limit dependent values - minimum value is zero and values must be ascending Stage-area independent values - no minimum or maximum dependent values - minimum value is zero and values must be ascending Velocity & independent values - no minimum limit General dependent values - no minimum limit Stage-coeff. independent values - no minimum limit dependent values - minimum value > zero Fall independent values - no minimum limit dependent values - minimum value is zero Fall-Factor independent values - minimum value is zero dependent values - minimum value is zero
For a new rating, after entry of the rating, the user will be automatically moved to the Rating Effective Dates screen (see “MD - Modify Rating Dates” below). MD - Modify Rating Dates Each rating has a start and end date associated with it. The user is asked for the rating effective dates after creating a new rating. For an existing rating in “working” status, these dates can be modified using the “MD – modify rating dates” option from the rating menu. The Rating Effective Dates screen has the options:
• AP- Append a new rating date • RE – Return to rating menu (one of the screens as shown above)
When entering rating dates, the user will first be prompted for the rating desired from the rating selection list. Prompts then follow in sequence:
1. Enter the rating start date as (MM DD YYYY). 2. Enter the rating starting time as (HHMMSS). 3. Enter the rating starting time datum (PST, etc.) The default time datum will be the
station time zone from the site file. 4. Enter the new rating date remarks text.
ADAPS NWIS User
140
ADAPS: Chapter 4.5 Primary Data Processing Menu (PR)
After completing entry of the starting date, a screen showing all ratings and dates for that data descriptor is displayed with the options:
• AP - Append a new rating date • ED - Edit a rating date • RM - Remove a rating date • RE - Return to rating menu
The rating has no direct links to dates and times. The function of the rating effective dates is to apply those links. The data aging status for Rating Dates (setting them to in-review or approved) is not done as part of approving the ratings themselves, but instead takes place in the SETSTATUS program used to set the aging status of the daily and unit-values, shifts, and data corrections. This is because the Rating Dates are tied to the processing of the raw data and thus are tied to the final values computed from the raw data, and need to be aged along with these data categories. ET - Extend Rating This option is only available for ratings set to “In-Review” or “Approved.” It will create a copy of the rating in the “Working” status. The user will be asked to enter a new rating ID that reflects the original base rating being extended. (For example, if the original rating ID was 5 then enter 5.1 as the ID for the extended rating). It is recommended that this option be used to extend a rating that has been set to “Approved.” CP - Copy Rating This option will create a new rating from the current one selected and place it in “Working” status. Options to apply this copied rating to a new data descriptor, a new station ID, or new rating ID number are available on the first screen. One of these options must be selected and changed, as duplicates are not allowed. To activate the copied rating, switch to the site and DD where the rating was copied, and add one or more rating dates to the copied rating. IR – Set Rating to In-Review This option is shown for ratings set to “Working” and is available for all access levels. It is used to set the aging code of the active rating to “In-Review.” AP – Approve Rating This option is shown for ratings set to “In-Review” and is only available for the “ADBA” and “SYST” access levels. It is used to set the aging code of the active rating to “Approved.” WK – Set Rating to Working This option is shown for ratings set to “In-Review” or “Approved” and is only available for the “ADBA” or “SYST” access level. It is used to set the aging code of an “In Review” rating back to “Working” by the ADBA or to set the aging code of an “In Review” or “Approved” rating back to
ADAPS NWIS User
141
ADAPS: Chapter 4.5 Primary Data Processing Menu (PR)
“Working” by the SYST. While the system allows an “Approved” rating that was used to compute “Approved” data to be set back to “Working” without also resetting the data, this is strongly discouraged. Instead, it is recommended that a new rating be created using the extend (ET) or copy (CP) options described above. ED - Edit the Rating Descriptor Points (or the equation) This option, which is only available for ratings set to “Working”’ returns the user to the screen showing all rating input/output points (for linear or log ratings) or the screen showing the rating equation (for equation ratings). See the section above, “AD – Add Rating,” for an explanation of working with these screens. OF – Modify Rating Offsets This option is only available for log ratings set to “Working.” The user is returned to the Rating Offset Screen. See the section above, “AD – Add Rating,” for an explanation of working with this screen. ID – Modify Rating ID This option is only available for ratings set to “Working.” The user is returned to the Rating ID Screen and given the opportunity to change the rating ID number. RM – Modify Rating Remarks This option is only available for ratings set to “Working.” The user is returned to the Rating Remarks Screen. See the section above, “AD – Add Rating,” for an explanation of working with this screen. DE – Delete Rating This option is only available for ratings set to “Working” that do not have any “Approved” rating dates. To delete a rating with “Approved” rating dates, all of the data in the water years contained in the rating dates for that rating must be first set to “Working.” Please note that deleting a rating from the database may take a couple of minutes to complete. DI - Output Rating
In this option the current rating is sent to the output as specified in the “current user information” menu at the initial startup (OT – output to). Options are: to file, to terminal, or to a printer. If outputting to a file the file path can be specified with the PA option. Upon entry into the DI option, the following menu options are available:
ADAPS NWIS User
142
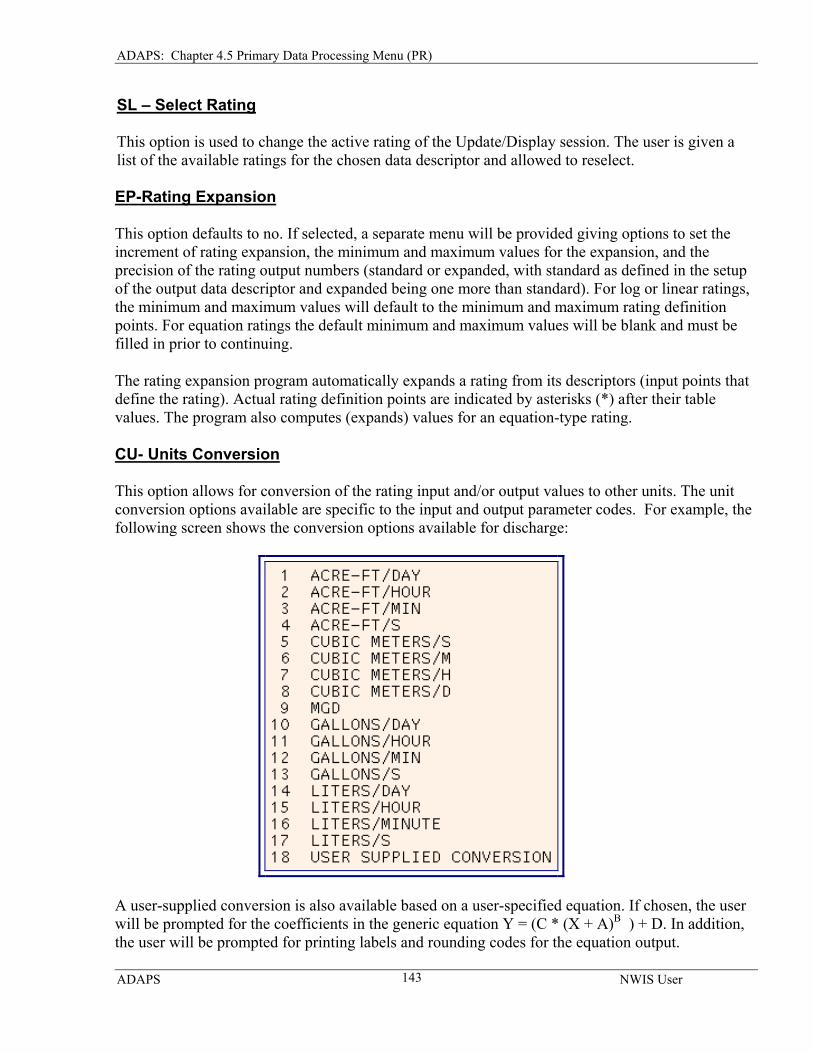
ADAPS: Chapter 4.5 Primary Data Processing Menu (PR)
SL – Select Rating This option is used to change the active rating of the Update/Display session. The user is given a list of the available ratings for the chosen data descriptor and allowed to reselect. EP-Rating Expansion
This option defaults to no. If selected, a separate menu will be provided giving options to set the increment of rating expansion, the minimum and maximum values for the expansion, and the precision of the rating output numbers (standard or expanded, with standard as defined in the setup of the output data descriptor and expanded being one more than standard). For log or linear ratings, the minimum and maximum values will default to the minimum and maximum rating definition points. For equation ratings the default minimum and maximum values will be blank and must be filled in prior to continuing.
The rating expansion program automatically expands a rating from its descriptors (input points that define the rating). Actual rating definition points are indicated by asterisks (*) after their table values. The program also computes (expands) values for an equation-type rating.
CU- Units Conversion
This option allows for conversion of the rating input and/or output values to other units. The unit conversion options available are specific to the input and output parameter codes. For example, the following screen shows the conversion options available for discharge:
A user-supplied conversion is also available based on a user-specified equation. If chosen, the user will be prompted for the coefficients in the generic equation Y = (C * (X + A)B ) + D. In addition, the user will be prompted for printing labels and rounding codes for the equation output.
ADAPS NWIS User
143
ADAPS: Chapter 4.5 Primary Data Processing Menu (PR)
SH - Shift Adjusted Rating This option produces a rating for a specific date with shifts applied that can be output in either
tabular or RDB format.
DI – Display Rating Table
This option sends the rating to the chosen output device using the settings as specified in the EP and CU options (see above). RD – Output Rating in RDB Format This option is used to output the rating in RDB (relational-database) format. These are tab-delimited ASCII files, which can be used in other applications (see section 6.4). Upon selection of this option, the user will always be prompted for a file name for the RDB output. (The output option as specified in the initial entry to the Upate/Display Ratings program is not used.) An RDB file of the requested name will be created using the settings as specified in the EP and CU options (see above). 4.5.6 SHIFT_ANLY, Shift Analysis and Error Bars
by Glenn B. Engel The SHIFT_ANLY program performs a shift analysis for a specified period using data from the measurement and rating files. The program also computes the range of discharge and shifts represented by the error range as indicated by the discharge-measurement rating. Shifts in discharge ratings reflect the fact that stage-discharge relations are not permanent but vary from time to time, either gradually or abruptly, because of changes in the physical features that form the control for the station. If the effective period of a specific rating change is of short duration or is small and within certain limits, the original rating is usually kept in effect. During this period, shifts or adjustments are computed and applied (shifting-control method). The shifting-control method is used extensively to compute discharge records; therefore a shift analysis is necessary.
Program Operation
The shift-analysis program operates as follows: (1) the program takes the measured (recorded) stage (gage height) from the measurement file and applies the relation from the Rating File for the station to obtain an “original” rating discharge corresponding to that measured gage height, (2) the measured discharge from the measurement file and the relation from the Rating File are used to obtain a corresponding “rating” stage (backward look-up), and (3) the shift is computed by subtracting the measured stage from the "rating” stage. The percent difference (either with or without the shift) in discharges is computed by subtracting the rating discharge from the measured discharge, dividing by the rating discharge, and multiplying by 100.
ADAPS NWIS User
144
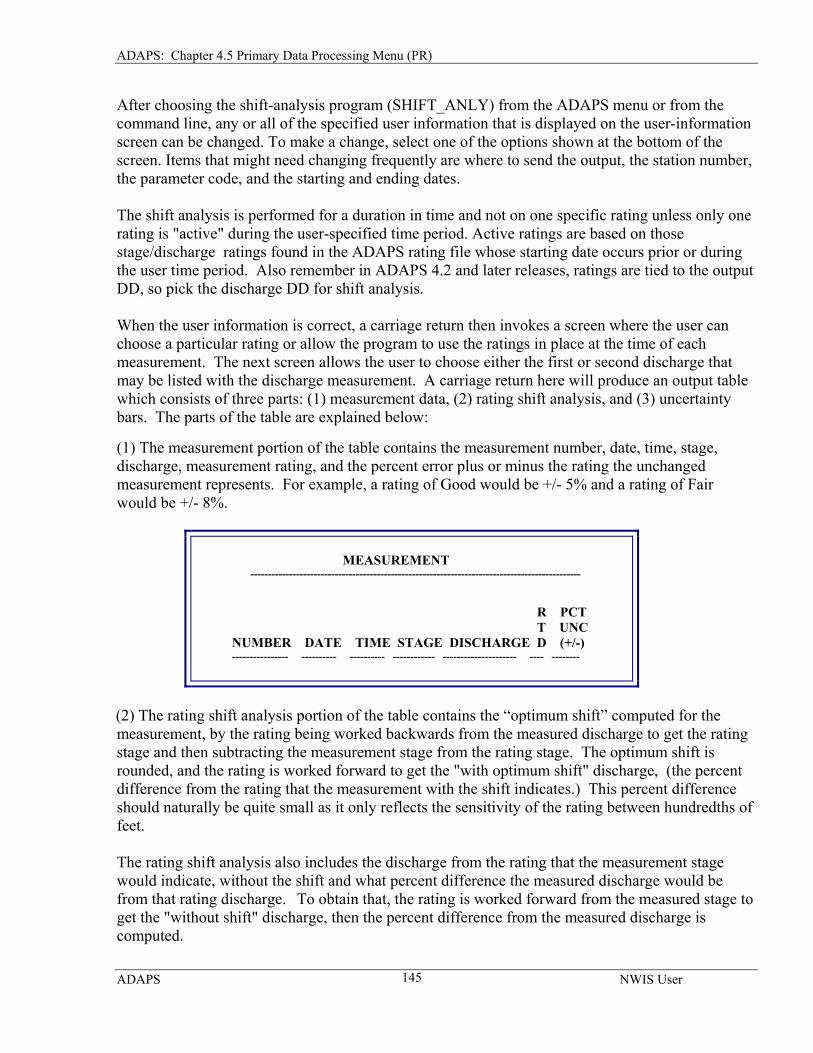
ADAPS: Chapter 4.5 Primary Data Processing Menu (PR)
After choosing the shift-analysis program (SHIFT_ANLY) from the ADAPS menu or from the command line, any or all of the specified user information that is displayed on the user-information screen can be changed. To make a change, select one of the options shown at the bottom of the screen. Items that might need changing frequently are where to send the output, the station number, the parameter code, and the starting and ending dates. The shift analysis is performed for a duration in time and not on one specific rating unless only one rating is "active" during the user-specified time period. Active ratings are based on those stage/discharge ratings found in the ADAPS rating file whose starting date occurs prior or during the user time period. Also remember in ADAPS 4.2 and later releases, ratings are tied to the output DD, so pick the discharge DD for shift analysis. When the user information is correct, a carriage return then invokes a screen where the user can choose a particular rating or allow the program to use the ratings in place at the time of each measurement. The next screen allows the user to choose either the first or second discharge that may be listed with the discharge measurement. A carriage return here will produce an output table which consists of three parts: (1) measurement data, (2) rating shift analysis, and (3) uncertainty bars. The parts of the table are explained below: (1) The measurement portion of the table contains the measurement number, date, time, stage, discharge, measurement rating, and the percent error plus or minus the rating the unchanged measurement represents. For example, a rating of Good would be +/- 5% and a rating of Fair would be +/- 8%.
MEASUREMENT ---------------------------------------------------------------------------------------------- R PCT T UNC NUMBER DATE TIME STAGE DISCHARGE D (+/-) ---------------- ---------- ---------- ------------ --------------------- ---- --------
(2) The rating shift analysis portion of the table contains the “optimum shift” computed for the
measurement, by the rating being worked backwards from the measured discharge to get the rating stage and then subtracting the measurement stage from the rating stage. The optimum shift is rounded, and the rating is worked forward to get the "with optimum shift" discharge, (the percent difference from the rating that the measurement with the shift indicates.) This percent difference should naturally be quite small as it only reflects the sensitivity of the rating between hundredths of feet.
The rating shift analysis also includes the discharge from the rating that the measurement stage would indicate, without the shift and what percent difference the measured discharge would be from that rating discharge. To obtain that, the rating is worked forward from the measured stage to get the "without shift" discharge, then the percent difference from the measured discharge is computed.
ADAPS NWIS User
145
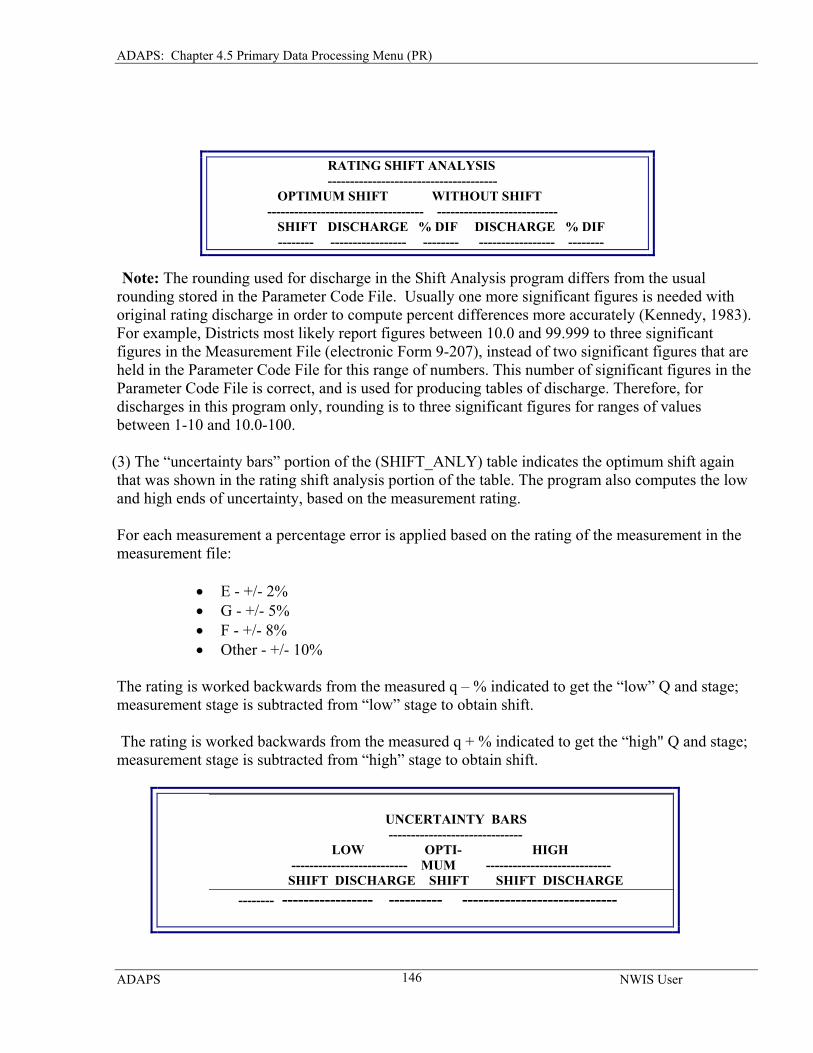
ADAPS: Chapter 4.5 Primary Data Processing Menu (PR)
RATING SHIFT ANALYSIS -------------------------------------- OPTIMUM SHIFT WITHOUT SHIFT ----------------------------------- --------------------------- SHIFT DISCHARGE % DIF DISCHARGE % DIF
-------- ----------------- -------- ----------------- -------- Note: The rounding used for discharge in the Shift Analysis program differs from the usual rounding stored in the Parameter Code File. Usually one more significant figures is needed with original rating discharge in order to compute percent differences more accurately (Kennedy, 1983). For example, Districts most likely report figures between 10.0 and 99.999 to three significant figures in the Measurement File (electronic Form 9-207), instead of two significant figures that are held in the Parameter Code File for this range of numbers. This number of significant figures in the Parameter Code File is correct, and is used for producing tables of discharge. Therefore, for discharges in this program only, rounding is to three significant figures for ranges of values between 1-10 and 10.0-100.
(3) The “uncertainty bars” portion of the (SHIFT_ANLY) table indicates the optimum shift again that was shown in the rating shift analysis portion of the table. The program also computes the low and high ends of uncertainty, based on the measurement rating. For each measurement a percentage error is applied based on the rating of the measurement in the measurement file:
• E - +/- 2% • G - +/- 5% • F - +/- 8% • Other - +/- 10%
The rating is worked backwards from the measured q – % indicated to get the “low” Q and stage; measurement stage is subtracted from “low” stage to obtain shift. The rating is worked backwards from the measured q + % indicated to get the “high" Q and stage; measurement stage is subtracted from “high” stage to obtain shift.
UNCERTAINTY BARS ------------------------------ LOW OPTI- HIGH -------------------------- MUM ---------------------------- SHIFT DISCHARGE SHIFT SHIFT DISCHARGE
-------- ----------------- ---------- -----------------------------
ADAPS NWIS User
146
ADAPS: Chapter 4.5 Primary Data Processing Menu (PR)
At this point the user can request that the error bars be plotted on a shift (X-axis) vs. stage (Y-axis) plot, which is used to help develop shift diagrams.
4.5.7 Update/Display Shifts by James M. Caldwell
Shifts in the stage-discharge rating reflect the fact that stage-discharge relations are not constant but vary from time to time because of changes to the physical features that form the control. A shift is a table of rating points and corresponding adjustment shifts that indicate how much the base rating is adjusted at that point. A shift is used to avoid multiple changes to an unstable rating, to allow for gradual movement of a rating through time, or to more easily apply a preliminary rating until enough information is gathered to create a new base rating. Although it is important to understand that a shift represents a change in the stage-discharge relation, ADAPS applies the shift by adjusting the recorded gage-heights and using the base rating. Shifts can vary by both stage and time and can consist of up to three points. The interpolation between these points is linear. A shift is held constant above the highest stage and below the lowest stage entered. In ADAPS 4.2 and later releases, variable shifts are used exclusively with stage-discharge ratings. These shifts are fixed (hard-wired) to a particular rating. The data descriptor used is discharge. The input points refer to gage height. To update or display shifts, select “Update / Display Shifts (SV_EDIT)” from the PR-Primary Data Processing submenu. In the “current user information” menu verify or change DB-database, AG-agency, ST-station, DD-data descriptor and YR-year options as needed. The DD-Data descriptor must be set to discharge. The output (OT – output to) should also be specified. Options are: to file, to terminal, or to a printer. If outputting to a file, the file path can be specified with PA. After these items have been specified, a carriage return will display the ratings available for the selected station. Select the sequence number for the desired rating. If no shift exists for the selected rating for the given water year the following prompt will appear: “RECORD NOT FOUND - WOULD YOU LIKE TO ADD IT [Y/N DEFAULT=Y].” A carriage return or yes answer at this prompt will bring up the edit screen to add shifts. If a shift exists for the given rating in the given water year, a “shift correction” menu will appear with the following options: “AD- ADD correction values,” “ED- EDIT/update correction values,” “DL- DELETE entire selected record,” “VI- VIEW correction values,” “LI- LIST selection on screen/printer,” “ID- Return to ID screen,” “US_ Return to user information screen,” “QUIT,” and “EXIT.” Selecting AD will bring up the edit screen with the cursor at a new line below the existing shifts. Selecting ED will bring up the edit screen with the cursor on an existing shift line. Selecting DL will bring up the edit screen displaying the existing shifts with the prompt: “ARE YOU SURE THIS IS THE RECORD YOU WANT TO DELETE? [Y/N DEFAULT=Y].” Selecting VI will display the variable shifts for this rating. The shifts for the specified water year will be numbered sequentially with the first shift of that water year being number one. Selecting LI will list on the
ADAPS NWIS User
147
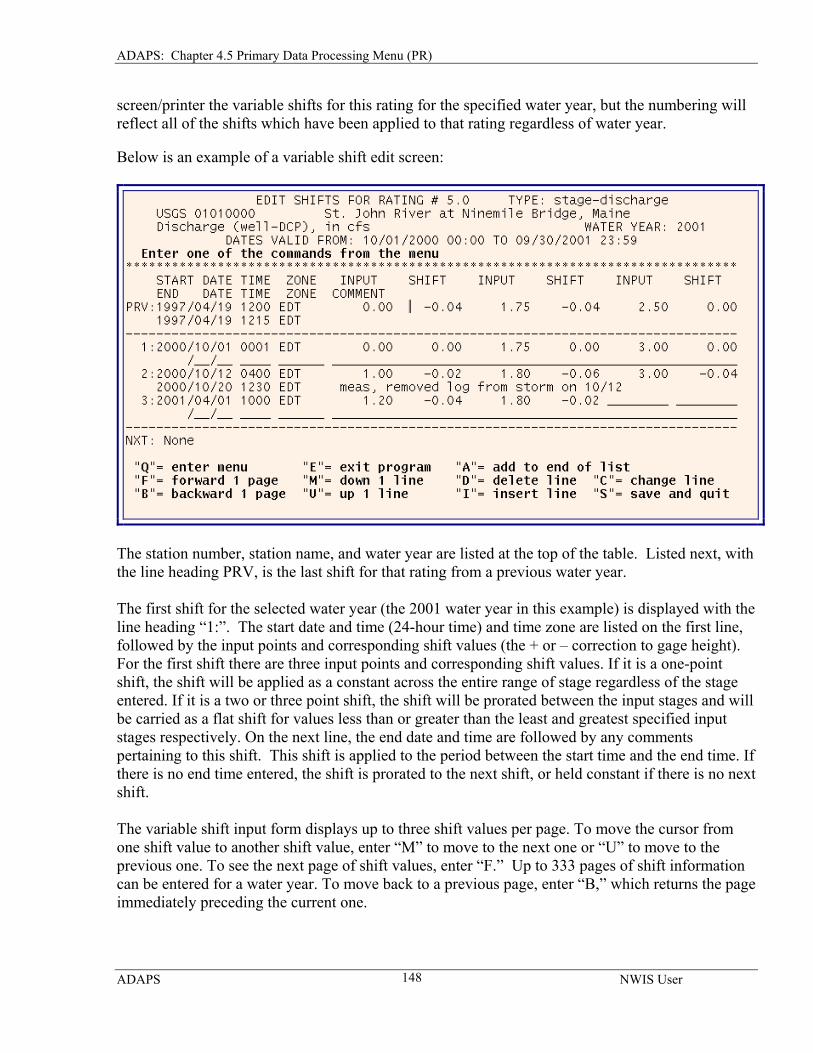
ADAPS: Chapter 4.5 Primary Data Processing Menu (PR)
screen/printer the variable shifts for this rating for the specified water year, but the numbering will reflect all of the shifts which have been applied to that rating regardless of water year. Below is an example of a variable shift edit screen:
The station number, station name, and water year are listed at the top of the table. Listed next, with the line heading PRV, is the last shift for that rating from a previous water year. The first shift for the selected water year (the 2001 water year in this example) is displayed with the line heading “1:”. The start date and time (24-hour time) and time zone are listed on the first line, followed by the input points and corresponding shift values (the + or – correction to gage height). For the first shift there are three input points and corresponding shift values. If it is a one-point shift, the shift will be applied as a constant across the entire range of stage regardless of the stage entered. If it is a two or three point shift, the shift will be prorated between the input stages and will be carried as a flat shift for values less than or greater than the least and greatest specified input stages respectively. On the next line, the end date and time are followed by any comments pertaining to this shift. This shift is applied to the period between the start time and the end time. If there is no end time entered, the shift is prorated to the next shift, or held constant if there is no next shift. The variable shift input form displays up to three shift values per page. To move the cursor from one shift value to another shift value, enter “M” to move to the next one or “U” to move to the previous one. To see the next page of shift values, enter “F.” Up to 333 pages of shift information can be entered for a water year. To move back to a previous page, enter “B,” which returns the page immediately preceding the current one.
ADAPS NWIS User
148
ADAPS: Chapter 4.5 Primary Data Processing Menu (PR)
Add a new variable shift value to the end of the list by entering “A.” This automatically places the cursor at the end of the list after which the entry is then made. If there are no entries for the particular site, “A” (Add mode) must be entered to begin adding entries. To discontinue entries and exit from the Add mode, enter “X.” To insert a variable shift value, place the cursor on the line where the entry is to be made and then enter “I.” The date and time of the inserted shift value must be between the previous shift value and the next shift value, and only one correction can be inserted at a time. To exit from Insert mode without making an insertion, enter “X.” Change a variable shift value by placing the cursor on the line to be changed and then entering “C.” This puts the user in Change mode, after which new values are entered over the current ones. Once in Change mode, new values must be entered. To enter or change a shift, enter the month, day, time, time zone, input value, and corresponding shift values in the spaces provided. The time zone can be skipped by hitting enter after the time. The default time zone for that station at that date and time will be automatically entered and the entry will skip to the first shift stage input point. Up to three pairs of stages and shifts may be entered on a line after the time data. These three points are entered with the first point being the lowest stage and corresponding shift. After entry of the first line of shift information, hit enter to get to the second line. On the second line the date and time can be left blank, with or without a comment, and the shift will prorate linearly through time to the next available shift. If a date and time is entered on the second line, the shift will be held constant through time and ended at the date and time specified. Note: When inputting shifts (whether inserting, adding or changing), the input points and the corresponding shift are separated by spaces. The values will not be lined up perfectly under the headers as they are entered. After entering all data on a line, a carriage return will center the data in their respective columns. Any comments on the end date line should be lined up under the comment header.
4.5.8 Primary Computations by Joseph P. Nielsen
The primary computations program (PRIMARY) allows the user to select the station number, the data descriptor, the time period to be processed, and the destination of the printed output before proceeding with interactive or batch mode computations. Once these user values are set, the program then loads the applicable processor file record(s) and uses those values along with the initial values to complete the processing automatically.
Note the following when running the PRIMARY computations program:
1. Primary computations actually run a number of individual computation programs in series: • Computation of data correction and computed unit values for the input parameter(s) • Computation of shift-correction unit values (if discharge processing)
ADAPS NWIS User
149
ADAPS: Chapter 4.5 Primary Data Processing Menu (PR)
• Computation of computed unit-values for the output parameter, daily-values, and production of the primary report
As the steps in the primary computation progress, the status is displayed to the screen.
2. The date range given for primary computations can cross a water-year boundary (October 1 and September 30) but can only consist of up to 366 days. It will prorate shifts, data corrections, and ratings automatically across water years as well.
3. The primary computations are performed from either the input or output DD record. If an input DD is specified, the primary computation will proceed on all the processors that use that input DD.
4. For primary computations to proceed, a processor record must be established for either the chosen DD or for a DD that uses the chosen DD as input. If no processor record is available, the user is returned to the main PR menu.
5. Primary computations, other than a “Report Only” primary, cannot be performed during a water year where “Approved” or “In-Review” daily-values records already exist for the DDs concerned in the computation. For example, a slope station cannot be recomputed anytime in a particular water year if any one of the DDs involved in the computation (base gage height, auxiliary gage height or discharge) has a daily-values record for any statistic in that water year marked “Approved” or “In-Review.”
6. The screening of unit-values for a computed DD, such as discharge, is done during the PRIMARY program. The Threshold limits used for this screening are the computed DD thresholds that were entered in the DD_EDIT or THRESHOLD_EDIT programs.
7. The limit on the total number of rating changes that can be accommodated for any one site/DD during a computation is 500.
8. The maximum number of unit-values processed by the Primary program is 2880 UVs per day.
This allows processing of data collected at fixed intervals down to 30 seconds. The actual data-collection intervals may be less than that, for example measurements from an event-driven recorder, but the Primary can only process 2880 such measurements.
Program Operation:
Interactive primary computations are controlled through two menu screens. After selecting “Primary Computations” from the PR menu, the first screen displayed is the standard ADAPS startup menu. This menu displays the user's current settings. Any of the options can be changed by entering the two-character identifier for the option to be changed. The options available are:
• PA - File Path • OT - Output To • DB - Data Base
ADAPS NWIS User
150
ADAPS: Chapter 4.5 Primary Data Processing Menu (PR)
• AG - Agency • ST - Station(s) • DD - Data Descriptor • DT - Dates • BA - Job mode
The second menu screen is the primary computations menu. This menu displays the primary report options. Any of the options can be changed by entering the two-character identifier for the option to be changed. The options available in this table are.
• RP- Primary Report • RO- Report Only • DG- Diagnostic Report • QU- Quit Primary • EX- Exit ADAPS
RP-Primary Report: Two primary report options are available, “historical” and “standard.” The historical primary report includes hourly unit-values, whereas the standard primary report does not. The report will automatically be set to the default, which is established in the setup of the data descriptor. The type of report selected can be changed from the default to the other option by typing “RP.” RO- Report Only will be set to “NO” when the screen first appears. Changing Report Only to “YES” will generate a primary report but will not save the computed values back to the database. The report will state “Report Only Primary” in the upper right hand corner along with the data aging status. DG- Diagnostic Report will be set to “NO” when the screen first appears. Changing Diagnostic Report to “YES” provides a report of unit-value computational information including date/time, corrected input unit-value, shift used, and shifted unit-value for each unit-value for the time period requested (times shown on the report are the original recorded UTC times). The specific information may vary from above depending on the type of computation.
After the interactive computations are completed, the user is returned to the PR menu.
The batch mode primary computations option uses a control file to direct the computations. An existing control file may be used as input to the program, or a new one can be created based on a single data descriptor, a single instrument, or a group. In addition, a batch queue must be selected for job submission, and a file name must be supplied for logging of processing errors.
4.5.9 DVTABLE_EDIT, Edit Daily-Values Statistical Summary by Glenn B. Engel The DVTABLE_EDIT program is used to edit the current year and period-of-record statistics portion of the daily-values table statistical summary. The instantaneous peak-flow, peak stage,
ADAPS NWIS User
151
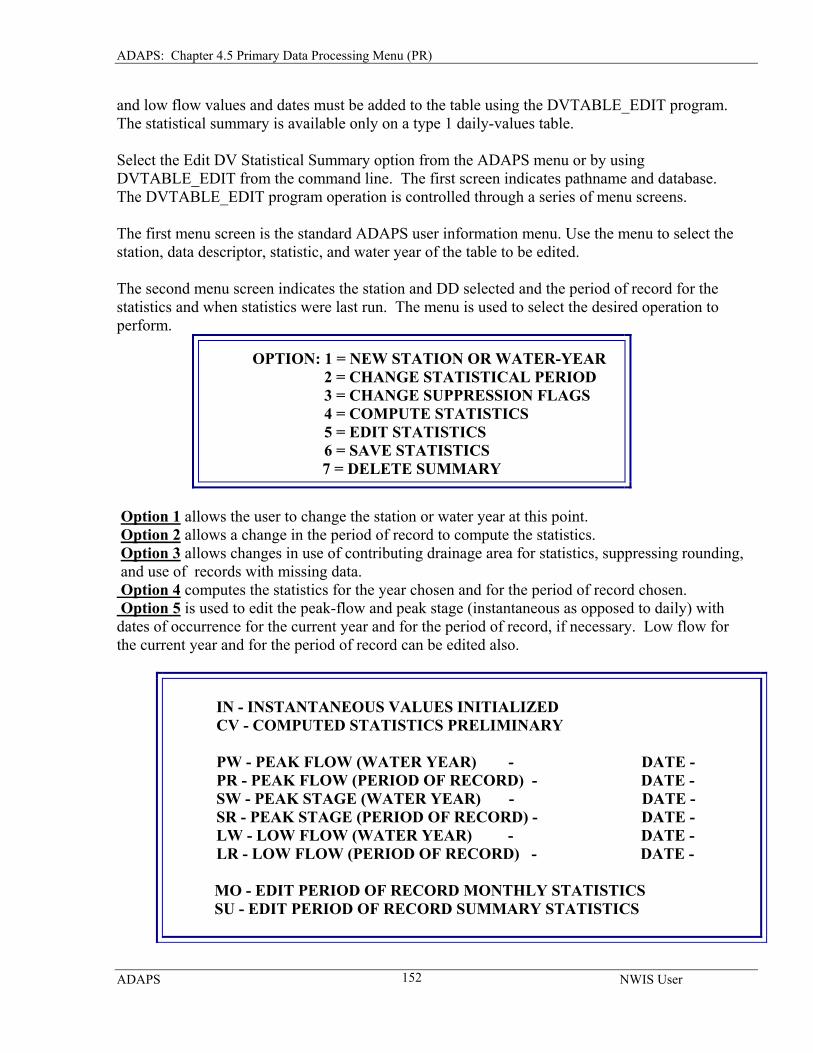
ADAPS: Chapter 4.5 Primary Data Processing Menu (PR)
and low flow values and dates must be added to the table using the DVTABLE_EDIT program. The statistical summary is available only on a type 1 daily-values table. Select the Edit DV Statistical Summary option from the ADAPS menu or by using DVTABLE_EDIT from the command line. The first screen indicates pathname and database. The DVTABLE_EDIT program operation is controlled through a series of menu screens. The first menu screen is the standard ADAPS user information menu. Use the menu to select the station, data descriptor, statistic, and water year of the table to be edited. The second menu screen indicates the station and DD selected and the period of record for the statistics and when statistics were last run. The menu is used to select the desired operation to perform.
OPTION: 1 = NEW STATION OR WATER-YEAR 2 = CHANGE STATISTICAL PERIOD 3 = CHANGE SUPPRESSION FLAGS 4 = COMPUTE STATISTICS 5 = EDIT STATISTICS 6 = SAVE STATISTICS
7 = DELETE SUMMARY
Option 1 allows the user to change the station or water year at this point. Option 2 allows a change in the period of record to compute the statistics. Option 3 allows changes in use of contributing drainage area for statistics, suppressing rounding, and use of records with missing data. Option 4 computes the statistics for the year chosen and for the period of record chosen. Option 5 is used to edit the peak-flow and peak stage (instantaneous as opposed to daily) with dates of occurrence for the current year and for the period of record, if necessary. Low flow for the current year and for the period of record can be edited also.
IN - INSTANTANEOUS VALUES INITIALIZED CV - COMPUTED STATISTICS PRELIMINARY PW - PEAK FLOW (WATER YEAR) - DATE - PR - PEAK FLOW (PERIOD OF RECORD) - DATE - SW - PEAK STAGE (WATER YEAR) - DATE - SR - PEAK STAGE (PERIOD OF RECORD) - DATE - LW - LOW FLOW (WATER YEAR) - DATE - LR - LOW FLOW (PERIOD OF RECORD) - DATE -
MO - EDIT PERIOD OF RECORD MONTHLY STATISTICS SU - EDIT PERIOD OF RECORD SUMMARY STATISTICS
ADAPS NWIS User
152
ADAPS: Chapter 4.5 Primary Data Processing Menu (PR)
This menu screen also allows access to edit the period of record monthly (MO) and summary (SU) statistics manually if desired, although these are updated automatically when the statistics are run. Options 6 and 7 are self explanatory. When the new statistics for the period of record are run and statistics are edited, a completed daily-values table can be printed (DV_TABLE) using the “statistical summary” option which will include monthly, annual, and instantaneous values for the period of record ready for publishing.
4.5.10 DV_MANIP, Daily-Values Manipulation The DV_MANIP program allows the user to manipulate daily-values data. Examples are copying daily-values from one data set to another, adding values for two stations together, subtracting one station from another, and lagging a station by a specified amount of time. Options available from DV_MANIP menu (0) Restore original ADAPS data -- The user has the opportunity to restore the original ADAPS data if an ADAPS data set has been modified during the current session by being the output of some manipulation. (1) Review (display) existing data -- Display existing daily-values data for a specified data set. A data set is defined as daily-values data for one site, data descriptor and statistic code for one water year or portion of a water year. (2) Copy DV data from one data set to another -- Y(i) = X(j). The subscripts (i) and (j) represent time periods of the output and input data sets as explained later. The existing data, including rounding and write-protect flags are copied without change. (3) Compute by evaluating the equation: Y = a + b(X+c)^d -- Create an output data set by evaluating the equation Y(i) = a + b*[X(j)+c]^d. where a, b, c and d are constants, * denotes multiplication and ^ denotes raising to a power. If b is specified as zero, no input data set, X is used and all values of the output data are set to the constant, a. (4) Combine two data sets: Y = X1 (operator) X2 -- Create an output data set by combining two data sets, Y(i) = X(j) @ X2(k), where @ is one of the arithmetic operators: + - * / ^ and the subscripts (i), (j), and (k) represent time periods. (5) Transform a data set: Y = (transformation) X -- Create an output data set by transforming the input data set, Y(i) = @[X(j)], where @ is one of the following transformations: log, inverse log, ln, or inverse ln, where log is logarithm to the base 10 and ln is natural logarithm (base e). (6) Enter daily-values, day-by-day -- Daily-values are entered on a day-by-day basis as each date for the period specified shows on the screen.
ADAPS NWIS User
153
ADAPS: Chapter 4.5 Primary Data Processing Menu (PR)
(7) Convert English (CFS) to metric (CMS) -- Convert English units of cubic feet per second (CFS) to metric units of cubic meters per second (CMS), Y(i) = .028317*X(j). Note that this is a special case of evaluating an equation. (8) Compute load from discharge and concentration -- Compute sediment load from water discharge and sediment concentration, Y(i) = .0027*[X(i)]*[Z(k)]. Note that this is a special case of combining (multiplying) two data sets, then evaluating an equation.
(9) Round to nearest .5 units -- Round data to nearest .5 units: Y(i) = [rounding-function][X(j)] and is usually used for temperature data.
Warning: Mean temperatures may have been rounded to the nearest 0.5 degree in the DV table. However, when a DV table of mean temperatures that includes monthly statistics is retrieved, the monthly mean on the output from running DVTABLE is not necessarily rounded to the nearest 0.5 degree. This is because a computation during the execution of DVTABLE computes the mean of the daily means for the month.
Note: The rounding of temperature data from a field recorder to the nearest 0.5 degrees is no longer necessary, as reporting temperature to the nearest 0.1 degree Celsius is acceptable.
(10) Set write-protect, rounding flags – The user has the option of setting write-protect and/or rounding flags on a data set.
Note: In the equations above, Y(i) represents one daily value in the output data set while X(j) and X2(k) represent values in the input data set(s). The subscript i varies as follows: output data set start-date, output data set start-date + 1, output data set start-date + 2, ... output data set end-date. The subscripts j and k vary similarly for the first input data set and the second input data set, respectively.
Note that the time periods for the output and input data set(s) need not be the same and, in fact,
need not even be of the same length. If the output data set is longer than the input data set, a missing value indicator will be supplied for the missing days. Values for the missing period in the output data set will depend upon the merge option discussed below. If the output data set is shorter than the input data set, the extra data in the input data set will be ignored. One reason for specifying differing time periods when combining data sets would be to cause “lagging” of data from one site with respect to another. Program Operation The following is the sequence of operations necessary to perform a daily-values manipulation:
• Begin • Specify output destination • Specify output data set • Specify data set output option • Specify daily-value manipulation option • Specify input data source
ADAPS NWIS User
154
ADAPS: Chapter 4.5 Primary Data Processing Menu (PR)
• Specify input data set • Acknowledge update of write/protection, rounding flags • Display input data set • Display, store or cancel program
After the DV_MANIP program is chosen from the ADAPS menu, the program begins each manipulation by displaying the current manipulation number -- BEGIN DAILY-VALUES MANIPULATION 1 Enter <CR> to continue (QU/EX to quit) ... The program then pauses until <CR> is entered. The user is then prompted to specify the output destination. Specify output destination (A/C/F/Tn,<CR>=A): Here the user is prompted to specify where the output data (the results of the manipulations) are to be stored. That is, the destination must be indicated for the daily-values data that will be computed under the manipulation selected. There are four options for storing the results: A The results are to be stored in an ADAPS daily-values record. The user is given an opportunity to specify the database, agency, site number, data descriptor number, statistics code and start/end date. C The results are to be written to a file of card images in the Watstore “2-3-cards” format. F The results are to be written to a file in a daily-values table format suitable for printing. Tn The results are to be written to a temporary file (T1,T2,..T5). Temporary files exist only during a DV_MANIP session and are typically used for storing the intermediate results of a complex set of manipulations. That is, the output data set in one manipulation could become the input data set for the next manipulation. Note that the output data set can contain data only within one water year. If the user, for example, enters “T1” at the prompt, as shown below, a temporary data set will be used. Specify output destination (A/C/F/Tn,<CR>=A: T1 Note that in this example, a temporary data set has been selected for the output. This means that the results of the manipulation will be retained temporarily but will not be stored in the ADAPS daily-values file. The data will be available for use as input to another manipulation during the current DV_MANIP session. The normal ADAPS startup then appears.
ADAPS NWIS User
155
ADAPS: Chapter 4.5 Primary Data Processing Menu (PR)
The description of the data set being specified is displayed on the second line of the startup display. For temporary data sets the user may only specify the date-span of the data set. If an ADAPS data set is selected for output, or if a card-image file is selected, the user may specify database, agency, site, data descriptor and statistic code as well as the date-span. Since no data yet exists for temporary file 1, the following is displayed: NO DATA EXISTS. BUILDING NEW RECORD. After specifying the output data set, the prompt to select the manipulation option is displayed: SPECIFY DAILY-VALUES MANIPULATION OPTION -- The options available in the ADAPS menu were described previously and are:
0. Restore original ADAPS data 1. Review (display) existing data 2. Copy DV data from one data set to another 3. Compute by evaluating the equation: Y = a + b(X+c)^d 4. Combine two data sets: Y = X1 (operator) X2 5. Transform a data set: Y = (transformation) X 6. Enter daily-values, day-by-day 7. Convert English (CFS) to metric (CMS) 8. Compute load from discharge and concentration 9. Round to nearest .5 units 10. Set write-protect, rounding flags
If Option 2 is selected, the following prompt is displayed: COPY DATA SET After specifying the output data set and selecting the manipulation option desired, the user is prompted to specify the input data set(s): Specify input data source (A/C,<CR>=A: This prompt is similar to the prompt for selecting the output data set. However, since no temporary data sets yet exist, that option (Tn) is not available. If the user enters a <CR> only, this indicates that an ADAPS data set is to be specified. The normal ADAPS startup display relative to the input data set is then displayed. The manipulation option and a description of the data set being specified appear on the second line of the ADAPS start-up display. If the date-span (DT) was selected to be modified, the following prompts appear:
ENTER STARTING DATE AS (MM DD YYYY): ENTER ENDING DATE AS (MM DD YYYY):
ADAPS NWIS User
156
ADAPS: Chapter 4.5 Primary Data Processing Menu (PR)
Note: The date-span selected for the input data set does not have to be the same as the date-span of the output data set. The characteristics of the data set are again displayed in the startup menu so that other parameters can be changed. If no other parameters are to be changed, the processing specified is performed and the following is displayed: Manipulation complete - ready to store Do you wish to Review, Store, or Cancel (R/S/C,<CR>=R): The results of the manipulation may be reviewed before actually storing the data. The following options are allowed:
R Review, the output data will be displayed at the terminal.
S Store, the output data are to be stored in the data set previously specified. C Cancel, the current manipulation is to be cancelled with the results not stored.
The result of the manipulation could have been displayed before storing.
At this time, the next manipulation process begins: BEGIN DAILY-VALUES MANIPULATION 2 Enter <CR> to continue (QU/EX to quit) ... Specify output destination (A/C/Tn,<CR>=A): T1 In this example, the selected output data set (temporary file 1) already exists. The user is warned and is prompted to specify how the new data are to be merged with the existing data (merge option). This also often occurs if an ADAPS data set is chosen for output. DATA EXISTS IN OUTPUT DATA SET - DO YOU WISH TO: D Display data. The existing data for the water year will be displayed and this set of options will again be provided. I Insert - Retain existing data if conflict. Any existing data will be preserved. New data will be inserted only for those days where the existing data are missing. M Merge - Use new data if conflict. Available new data will replace existing data on a day-by-day basis. This is the default. R Replace - Replace all existing with available new. All existing data in the output data set will be replaced by available new data. Days where new data are not available will be set to missing values.
ADAPS NWIS User
157
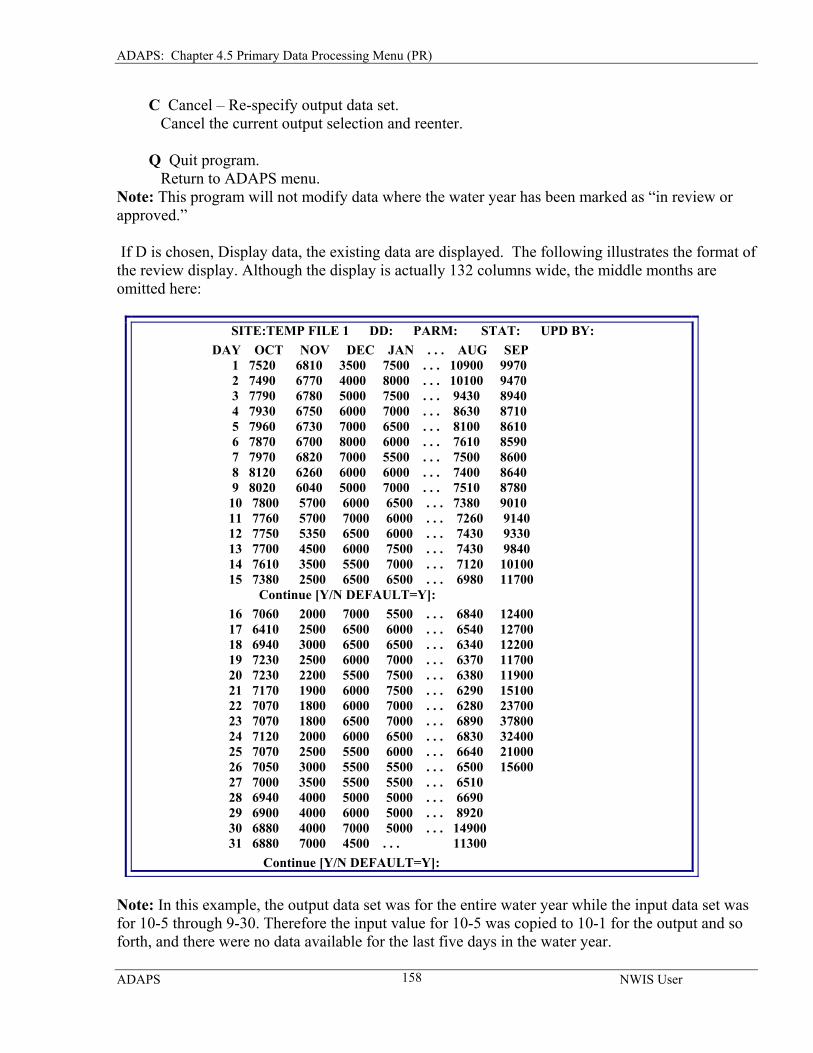
ADAPS: Chapter 4.5 Primary Data Processing Menu (PR)
C Cancel – Re-specify output data set. Cancel the current output selection and reenter. Q Quit program. Return to ADAPS menu. Note: This program will not modify data where the water year has been marked as “in review or approved.” If D is chosen, Display data, the existing data are displayed. The following illustrates the format of the review display. Although the display is actually 132 columns wide, the middle months are omitted here:
SITE:TEMP FILE 1 DD: PARM: STAT: UPD BY: DAY OCT NOV DEC JAN . . . AUG SEP 1 7520 6810 3500 7500 . . . 10900 9970 2 7490 6770 4000 8000 . . . 10100 9470 3 7790 6780 5000 7500 . . . 9430 8940 4 7930 6750 6000 7000 . . . 8630 8710 5 7960 6730 7000 6500 . . . 8100 8610 6 7870 6700 8000 6000 . . . 7610 8590 7 7970 6820 7000 5500 . . . 7500 8600 8 8120 6260 6000 6000 . . . 7400 8640 9 8020 6040 5000 7000 . . . 7510 8780 10 7800 5700 6000 6500 . . . 7380 9010 11 7760 5700 7000 6000 . . . 7260 9140 12 7750 5350 6500 6000 . . . 7430 9330 13 7700 4500 6000 7500 . . . 7430 9840 14 7610 3500 5500 7000 . . . 7120 10100 15 7380 2500 6500 6500 . . . 6980 11700 Continue [Y/N DEFAULT=Y]: 16 7060 2000 7000 5500 . . . 6840 12400 17 6410 2500 6500 6000 . . . 6540 12700 18 6940 3000 6500 6500 . . . 6340 12200 19 7230 2500 6000 7000 . . . 6370 11700 20 7230 2200 5500 7500 . . . 6380 11900 21 7170 1900 6000 7500 . . . 6290 15100 22 7070 1800 6000 7000 . . . 6280 23700 23 7070 1800 6500 7000 . . . 6890 37800 24 7120 2000 6000 6500 . . . 6830 32400 25 7070 2500 5500 6000 . . . 6640 21000 26 7050 3000 5500 5500 . . . 6500 15600 27 7000 3500 5500 5500 . . . 6510 28 6940 4000 5000 5000 . . . 6690 29 6900 4000 6000 5000 . . . 8920 30 6880 4000 7000 5000 . . . 14900 31 6880 7000 4500 . . . 11300
Continue [Y/N DEFAULT=Y]: Note: In this example, the output data set was for the entire water year while the input data set was for 10-5 through 9-30. Therefore the input value for 10-5 was copied to 10-1 for the output and so forth, and there were no data available for the last five days in the water year.
ADAPS NWIS User
158
ADAPS: Chapter 4.5 Primary Data Processing Menu (PR)
After the existing data are displayed, the user is again prompted on how the new data are to be merged with the existing data. At this point the output data only exist in the temporary data set. To retain the data, a manipulation option with output to an ADAPS data set or to a card-image file would have to be processed.
4.5.11 Print/Display Unit-Values Tables
For more information on Print/Display Unit-Values Tables see Section 4.7.2.
4.5.12 Daily-values Tables
For more information on Daily-Values Tables see Section 4.6.4.
4.5.13 EOYSUMM, End-of-Year Summary
The EOYSUMM, End-of-Year Summary program is used to obtain extremes of gage height and discharge generally during a particular water year and also to obtain a listing of peaks above a base discharge, if one has been defined, for entry into the peak-flow file. The EOYSUMM program allows the user to select the station number, data descriptors containing computed unit-values, the time period to be processed, and the destination of printed output at the user information screen. A <CR> at the user information screen starts the processing. Computed unit-values must be previously stored for the data descriptors selected. EOYSUMM currently is set up specifically to produce table summaries for discharge and gage height. The program produces a table that contains the discharge peaks, which are above the base discharge stored in the extreme event computation option in the Processor File, and based on the criteria given in the WRD Data Reports Preparation Guide (Novak, 1985, p. 93). The program also lists the maximum and minimum discharges and corresponding gage heights, as well as the maximum and minimum gage heights and corresponding discharges. Finally, a list of maximum and minimum daily-values for mean discharge is printed. Discharges are listed in both CFS and CMS and gage heights are listed in both feet and meters. It is the responsibility of the user to check the values obtained from the EOYSUMM program against the final record to verify that the computed unit-values of gage height and discharge are correct. The user has the option of sending the peak-flow data obtained through the EOYSUMM program directly to a peak-flow submission file that will be used to update the peak-flow database.
ADAPS NWIS User
159
ADAPS: Chapter 4.5 Primary Data Processing Menu (PR)
4.5.14 Peak-Flow Entry and Retrieval (PEAKFLOW) by David L. Kresch
To access the Peak-flow Entry and Retrieval program (PEAKFLOW), select the PR sub-menu from the main ADAPS menu, and then select the “Peak-Flow Entry and Retrieval” option. The resulting menu gives the user the option of either editing (option 1) or retrieving (option 3) data from the Peak-flow file. The Peak-flow file is edited (updated) by means of a card-image file that must already exist before entering PEAKFLOW. When option 1 is selected, the program prompts the user for the name of the file that contains the card images. These cards are similar to, and in most cases have the same format as the old WATSTORE cards. Descriptions of these cards are in the sections that follow.
An operating system command -- pkrtfq (PeaK ReTrieval and FreQuency) -- has been provided to automate the process of retrieving peak-flow data from the NWIS ADAPS subsystem and performing flood-frequency analysis with the HASS PEAKFQ program. This command is discussed in the Flood Frequency Analysis section near the end of this chapter.
Introduction The Peak-flow file contains a collection of instantaneous maximum (peak) stream discharges and associated gage heights (stages) at streams throughout the nation. The file is organized by agency, water-measurement site, and water year. The file contains, for each water year during the period of record at each site, one record for the annual peak discharge and one record for each partial duration peak discharge. A water year, the 12-month period from October through September, is named by the calendar year in which it ends. For example, the 1995 water year begins on October 1, 1994 and ends on September 30, 1995.
The Peak-Flow Entry and Retrieval Program is used to: • enter new records into the Peak-flow file • change or correct information in a currently existing record • delete one or more records • move a peak to a partial peak or a partial peak to a peak • list the contents of one or more records • correct the data identifiers
The Peak-flow file is always used in conjunction with the Site File, which contains fixed identification items for all sites represented in the NWIS data files. Data will not be stored in or retrieved from the Peak-flow file unless the Site File contains header entries for the stations to be processed. This restriction ensures that all data are associated with a properly identified site. In addition to the mandatory items, a base discharge value (necessary to enter partial duration peak discharge data) and gage datum should also be stored in the Site File.
For each type of data to be stored in the Peak-flow file, the agency code, station ID number, and date of peak-flow must be provided. The time of peak may also be provided. These four record identifiers are listed below:
• Agency Code
ADAPS NWIS User
160
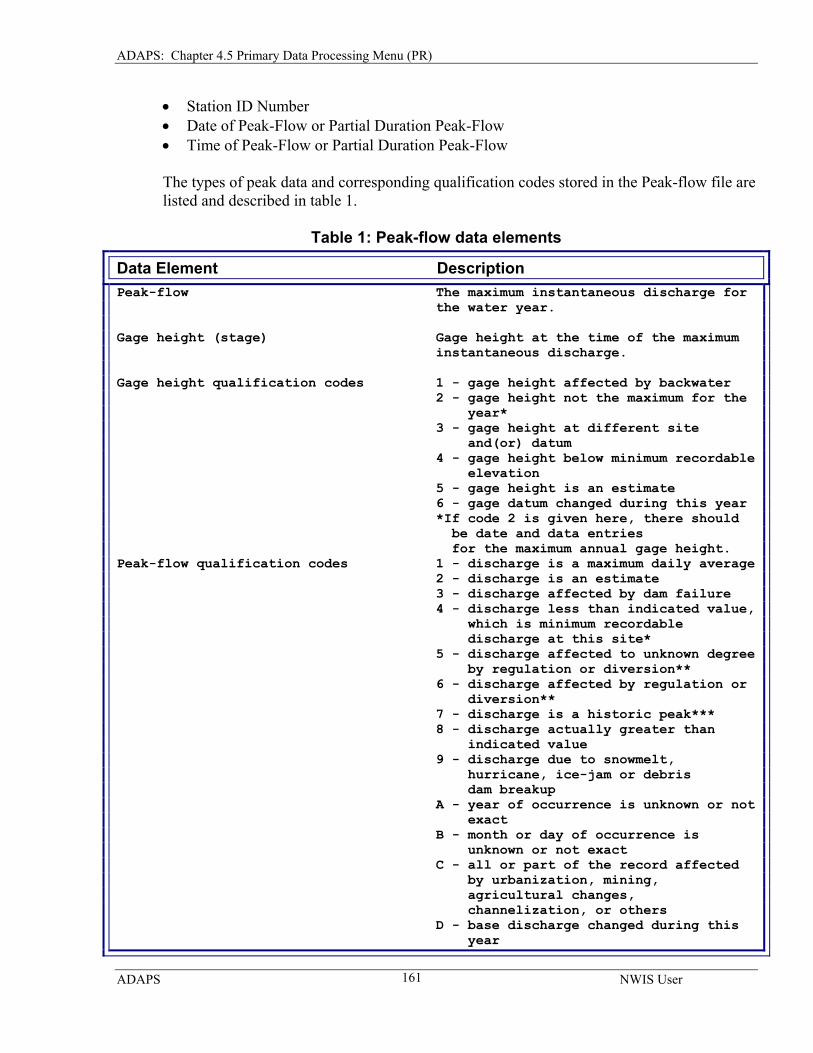
ADAPS: Chapter 4.5 Primary Data Processing Menu (PR)
• Station ID Number • Date of Peak-Flow or Partial Duration Peak-Flow • Time of Peak-Flow or Partial Duration Peak-Flow
The types of peak data and corresponding qualification codes stored in the Peak-flow file are listed and described in table 1.
Table 1: Peak-flow data elements
Data Element Description Peak-flow The maximum instantaneous discharge for the water year. Gage height (stage) Gage height at the time of the maximum instantaneous discharge. Gage height qualification codes 1 - gage height affected by backwater 2 - gage height not the maximum for the year* 3 - gage height at different site and(or) datum 4 - gage height below minimum recordable elevation 5 - gage height is an estimate 6 - gage datum changed during this year *If code 2 is given here, there should be date and data entries for the maximum annual gage height. Peak-flow qualification codes 1 - discharge is a maximum daily average 2 - discharge is an estimate 3 - discharge affected by dam failure 4 - discharge less than indicated value, which is minimum recordable discharge at this site* 5 - discharge affected to unknown degree by regulation or diversion** 6 - discharge affected by regulation or diversion** 7 - discharge is a historic peak*** 8 - discharge actually greater than indicated value 9 - discharge due to snowmelt, hurricane, ice-jam or debris dam breakup A - year of occurrence is unknown or not exact B - month or day of occurrence is unknown or not exact C - all or part of the record affected by urbanization, mining, agricultural changes, channelization, or others D - base discharge changed during this year
ADAPS NWIS User
161
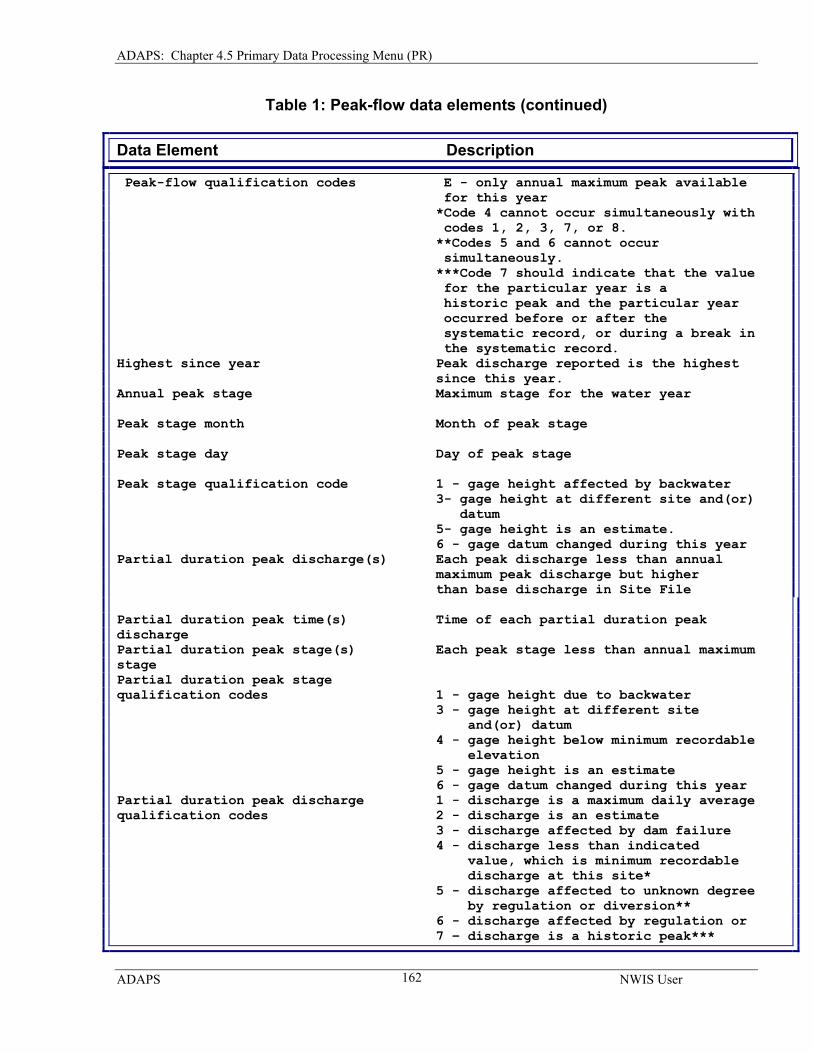
ADAPS: Chapter 4.5 Primary Data Processing Menu (PR)
Table 1: Peak-flow data elements (continued)
Data Element Description Peak-flow qualification codes E - only annual maximum peak available for this year *Code 4 cannot occur simultaneously with codes 1, 2, 3, 7, or 8. **Codes 5 and 6 cannot occur simultaneously. ***Code 7 should indicate that the value for the particular year is a historic peak and the particular year occurred before or after the systematic record, or during a break in the systematic record. Highest since year Peak discharge reported is the highest since this year. Annual peak stage Maximum stage for the water year Peak stage month Month of peak stage Peak stage day Day of peak stage Peak stage qualification code 1 - gage height affected by backwater 3- gage height at different site and(or) datum 5- gage height is an estimate. 6 - gage datum changed during this year Partial duration peak discharge(s) Each peak discharge less than annual maximum peak discharge but higher than base discharge in Site File Partial duration peak time(s) Time of each partial duration peak discharge Partial duration peak stage(s) Each peak stage less than annual maximum stage Partial duration peak stage qualification codes 1 - gage height due to backwater 3 - gage height at different site and(or) datum 4 - gage height below minimum recordable elevation 5 - gage height is an estimate 6 - gage datum changed during this year Partial duration peak discharge 1 - discharge is a maximum daily average qualification codes 2 - discharge is an estimate 3 - discharge affected by dam failure 4 - discharge less than indicated value, which is minimum recordable discharge at this site* 5 - discharge affected to unknown degree by regulation or diversion** 6 - discharge affected by regulation or 7 – discharge is a historic peak***
ADAPS NWIS User
162
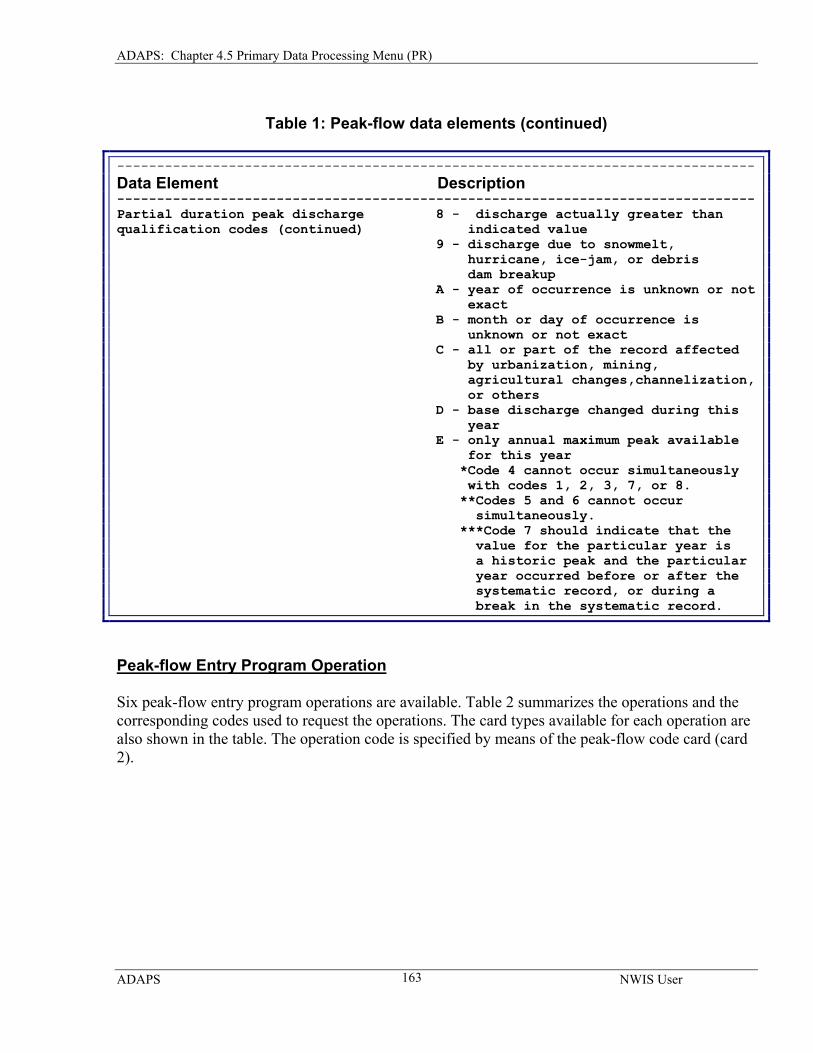
ADAPS: Chapter 4.5 Primary Data Processing Menu (PR)
Table 1: Peak-flow data elements (continued)
-------------------------------------------------------------------------------- Data Element Description -------------------------------------------------------------------------------- Partial duration peak discharge 8 - discharge actually greater than qualification codes (continued) indicated value 9 - discharge due to snowmelt, hurricane, ice-jam, or debris dam breakup A - year of occurrence is unknown or not exact B - month or day of occurrence is unknown or not exact C - all or part of the record affected by urbanization, mining, agricultural changes,channelization, or others D - base discharge changed during this year E - only annual maximum peak available for this year *Code 4 cannot occur simultaneously with codes 1, 2, 3, 7, or 8. **Codes 5 and 6 cannot occur simultaneously. ***Code 7 should indicate that the value for the particular year is a historic peak and the particular year occurred before or after the systematic record, or during a break in the systematic record.
Peak-flow Entry Program Operation Six peak-flow entry program operations are available. Table 2 summarizes the operations and the corresponding codes used to request the operations. The card types available for each operation are also shown in the table. The operation code is specified by means of the peak-flow code card (card 2).
ADAPS NWIS User
163
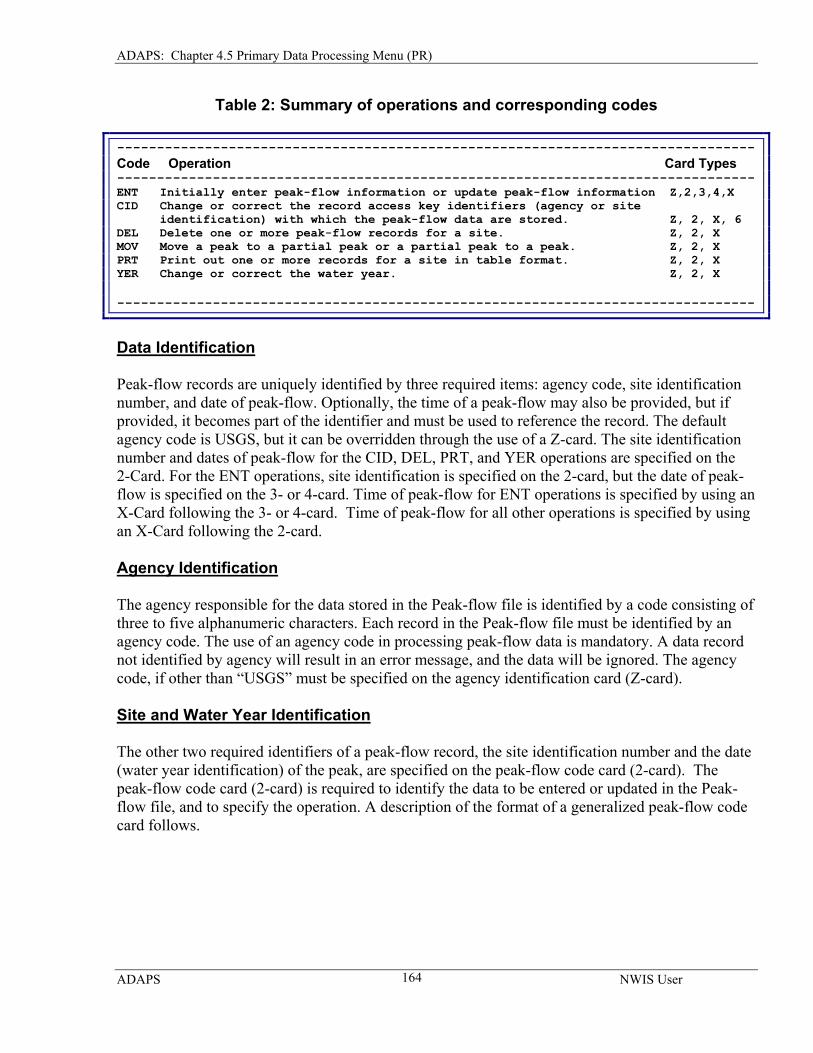
ADAPS: Chapter 4.5 Primary Data Processing Menu (PR)
Table 2: Summary of operations and corresponding codes -------------------------------------------------------------------------------- Code Operation Card Types --------------------------------------------------------------------------------ENT Initially enter peak-flow information or update peak-flow information Z,2,3,4,X CID Change or correct the record access key identifiers (agency or site identification) with which the peak-flow data are stored. Z, 2, X, 6 DEL Delete one or more peak-flow records for a site. Z, 2, X MOV Move a peak to a partial peak or a partial peak to a peak. Z, 2, X PRT Print out one or more records for a site in table format. Z, 2, X YER Change or correct the water year. Z, 2, X --------------------------------------------------------------------------------
Data Identification Peak-flow records are uniquely identified by three required items: agency code, site identification number, and date of peak-flow. Optionally, the time of a peak-flow may also be provided, but if provided, it becomes part of the identifier and must be used to reference the record. The default agency code is USGS, but it can be overridden through the use of a Z-card. The site identification number and dates of peak-flow for the CID, DEL, PRT, and YER operations are specified on the 2-Card. For the ENT operations, site identification is specified on the 2-card, but the date of peak-flow is specified on the 3- or 4-card. Time of peak-flow for ENT operations is specified by using an X-Card following the 3- or 4-card. Time of peak-flow for all other operations is specified by using an X-Card following the 2-card.
Agency Identification The agency responsible for the data stored in the Peak-flow file is identified by a code consisting of three to five alphanumeric characters. Each record in the Peak-flow file must be identified by an agency code. The use of an agency code in processing peak-flow data is mandatory. A data record not identified by agency will result in an error message, and the data will be ignored. The agency code, if other than “USGS” must be specified on the agency identification card (Z-card).
Site and Water Year Identification The other two required identifiers of a peak-flow record, the site identification number and the date (water year identification) of the peak, are specified on the peak-flow code card (2-card). The peak-flow code card (2-card) is required to identify the data to be entered or updated in the Peak-flow file, and to specify the operation. A description of the format of a generalized peak-flow code card follows.
ADAPS NWIS User
164
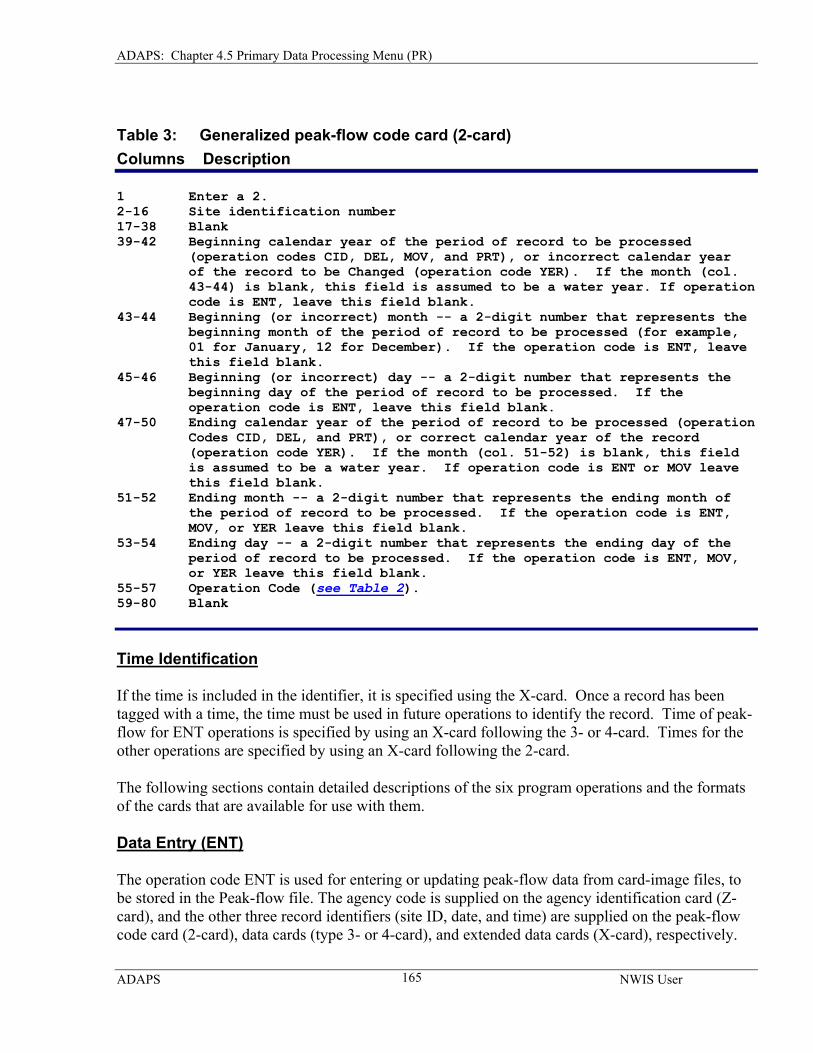
ADAPS: Chapter 4.5 Primary Data Processing Menu (PR)
Table 3: Generalized peak-flow code card (2-card) Columns Description 1 Enter a 2. 2-16 Site identification number 17-38 Blank 39-42 Beginning calendar year of the period of record to be processed (operation codes CID, DEL, MOV, and PRT), or incorrect calendar year of the record to be Changed (operation code YER). If the month (col. 43-44) is blank, this field is assumed to be a water year. If operation code is ENT, leave this field blank. 43-44 Beginning (or incorrect) month -- a 2-digit number that represents the beginning month of the period of record to be processed (for example, 01 for January, 12 for December). If the operation code is ENT, leave this field blank.
45-46 Beginning (or incorrect) day -- a 2-digit number that represents the beginning day of the period of record to be processed. If the operation code is ENT, leave this field blank.
47-50 Ending calendar year of the period of record to be processed (operation Codes CID, DEL, and PRT), or correct calendar year of the record (operation code YER). If the month (col. 51-52) is blank, this field is assumed to be a water year. If operation code is ENT or MOV leave this field blank.
51-52 Ending month -- a 2-digit number that represents the ending month of the period of record to be processed. If the operation code is ENT, MOV, or YER leave this field blank.
53-54 Ending day -- a 2-digit number that represents the ending day of the period of record to be processed. If the operation code is ENT, MOV, or YER leave this field blank. 55-57 Operation Code (see Table 2). 59-80 Blank
Time Identification If the time is included in the identifier, it is specified using the X-card. Once a record has been tagged with a time, the time must be used in future operations to identify the record. Time of peak-flow for ENT operations is specified by using an X-card following the 3- or 4-card. Times for the other operations are specified by using an X-card following the 2-card.
The following sections contain detailed descriptions of the six program operations and the formats of the cards that are available for use with them.
Data Entry (ENT) The operation code ENT is used for entering or updating peak-flow data from card-image files, to be stored in the Peak-flow file. The agency code is supplied on the agency identification card (Z-card), and the other three record identifiers (site ID, date, and time) are supplied on the peak-flow code card (2-card), data cards (type 3- or 4-card), and extended data cards (X-card), respectively.
ADAPS NWIS User
165
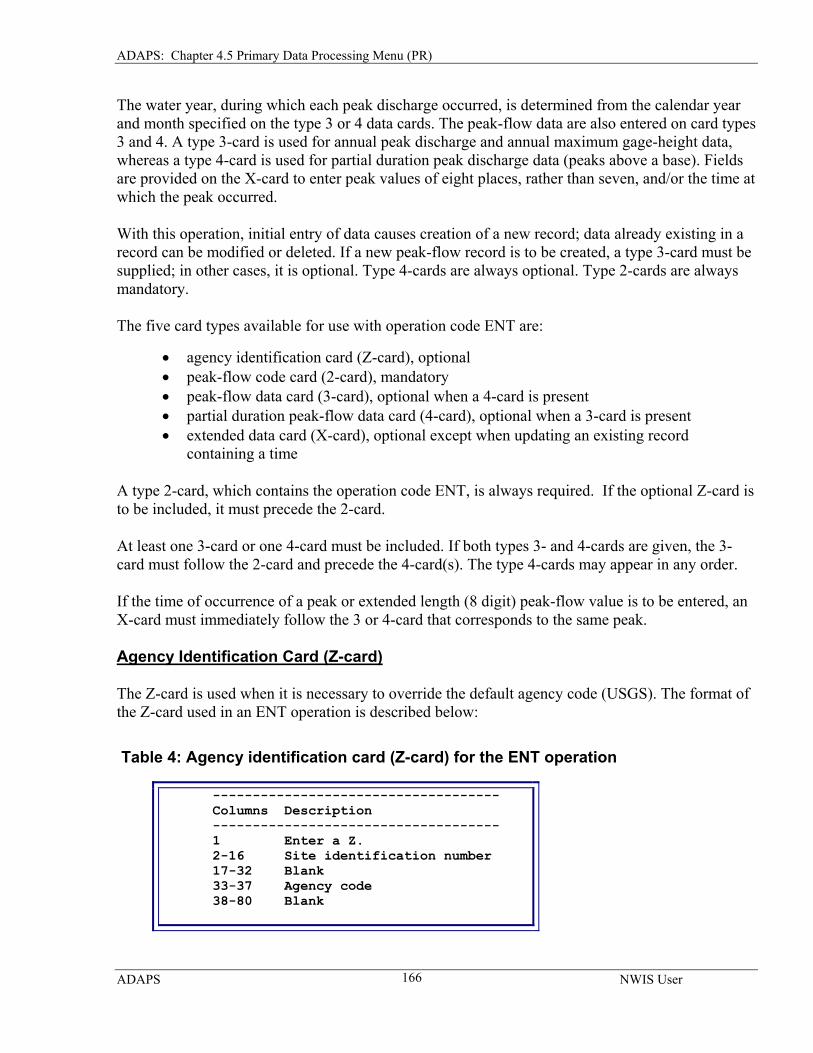
ADAPS: Chapter 4.5 Primary Data Processing Menu (PR)
The water year, during which each peak discharge occurred, is determined from the calendar year and month specified on the type 3 or 4 data cards. The peak-flow data are also entered on card types 3 and 4. A type 3-card is used for annual peak discharge and annual maximum gage-height data, whereas a type 4-card is used for partial duration peak discharge data (peaks above a base). Fields are provided on the X-card to enter peak values of eight places, rather than seven, and/or the time at which the peak occurred.
With this operation, initial entry of data causes creation of a new record; data already existing in a record can be modified or deleted. If a new peak-flow record is to be created, a type 3-card must be supplied; in other cases, it is optional. Type 4-cards are always optional. Type 2-cards are always mandatory.
The five card types available for use with operation code ENT are:
• agency identification card (Z-card), optional • peak-flow code card (2-card), mandatory • peak-flow data card (3-card), optional when a 4-card is present • partial duration peak-flow data card (4-card), optional when a 3-card is present • extended data card (X-card), optional except when updating an existing record
containing a time
A type 2-card, which contains the operation code ENT, is always required. If the optional Z-card is to be included, it must precede the 2-card.
At least one 3-card or one 4-card must be included. If both types 3- and 4-cards are given, the 3-card must follow the 2-card and precede the 4-card(s). The type 4-cards may appear in any order.
If the time of occurrence of a peak or extended length (8 digit) peak-flow value is to be entered, an X-card must immediately follow the 3 or 4-card that corresponds to the same peak.
Agency Identification Card (Z-card)
The Z-card is used when it is necessary to override the default agency code (USGS). The format of the Z-card used in an ENT operation is described below:
Table 4: Agency identification card (Z-card) for the ENT operation
------------------------------------ Columns Description ------------------------------------ 1 Enter a Z. 2-16 Site identification number 17-32 Blank 33-37 Agency code 38-80 Blank
ADAPS NWIS User
166
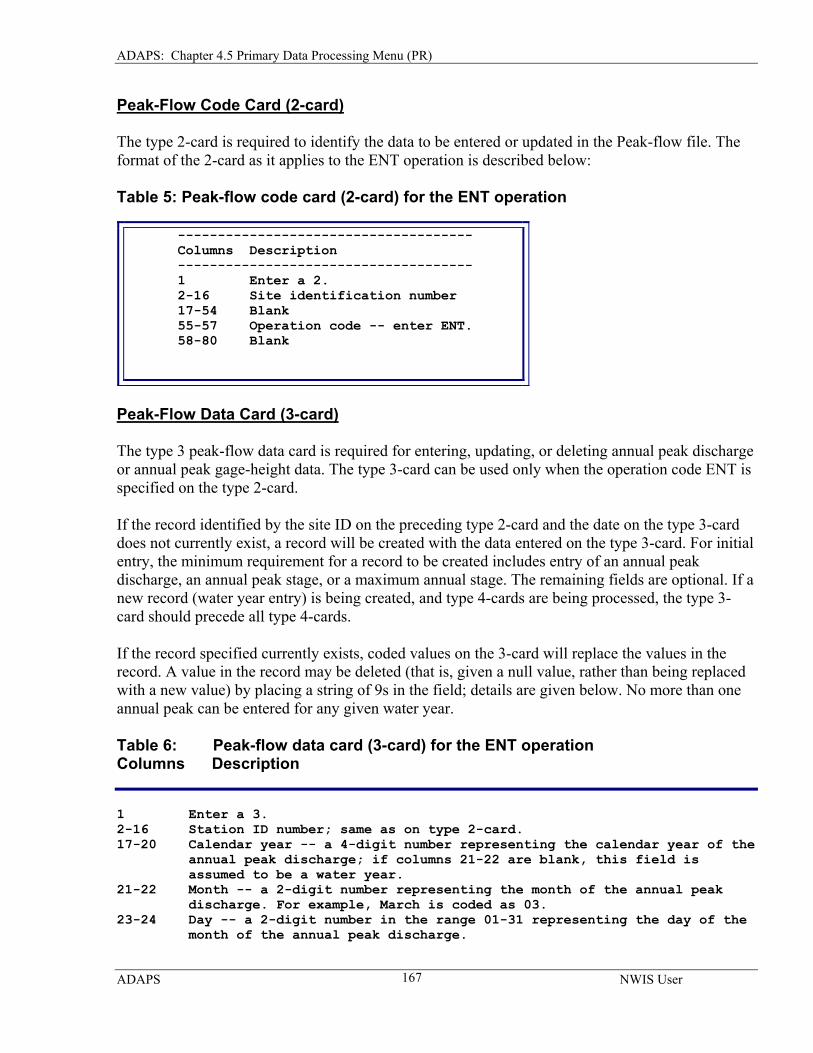
ADAPS: Chapter 4.5 Primary Data Processing Menu (PR)
Peak-Flow Code Card (2-card) The type 2-card is required to identify the data to be entered or updated in the Peak-flow file. The format of the 2-card as it applies to the ENT operation is described below:
Table 5: Peak-flow code card (2-card) for the ENT operation
------------------------------------- Columns Description ------------------------------------- 1 Enter a 2. 2-16 Site identification number 17-54 Blank 55-57 Operation code -- enter ENT. 58-80 Blank
Peak-Flow Data Card (3-card) The type 3 peak-flow data card is required for entering, updating, or deleting annual peak discharge or annual peak gage-height data. The type 3-card can be used only when the operation code ENT is specified on the type 2-card.
If the record identified by the site ID on the preceding type 2-card and the date on the type 3-card does not currently exist, a record will be created with the data entered on the type 3-card. For initial entry, the minimum requirement for a record to be created includes entry of an annual peak discharge, an annual peak stage, or a maximum annual stage. The remaining fields are optional. If a new record (water year entry) is being created, and type 4-cards are being processed, the type 3-card should precede all type 4-cards.
If the record specified currently exists, coded values on the 3-card will replace the values in the record. A value in the record may be deleted (that is, given a null value, rather than being replaced with a new value) by placing a string of 9s in the field; details are given below. No more than one annual peak can be entered for any given water year.
Table 6: Peak-flow data card (3-card) for the ENT operation Columns Description 1 Enter a 3. 2-16 Station ID number; same as on type 2-card. 17-20 Calendar year -- a 4-digit number representing the calendar year of the annual peak discharge; if columns 21-22 are blank, this field is assumed to be a water year. 21-22 Month -- a 2-digit number representing the month of the annual peak discharge. For example, March is coded as 03. 23-24 Day -- a 2-digit number in the range 01-31 representing the day of the month of the annual peak discharge.
ADAPS NWIS User
167
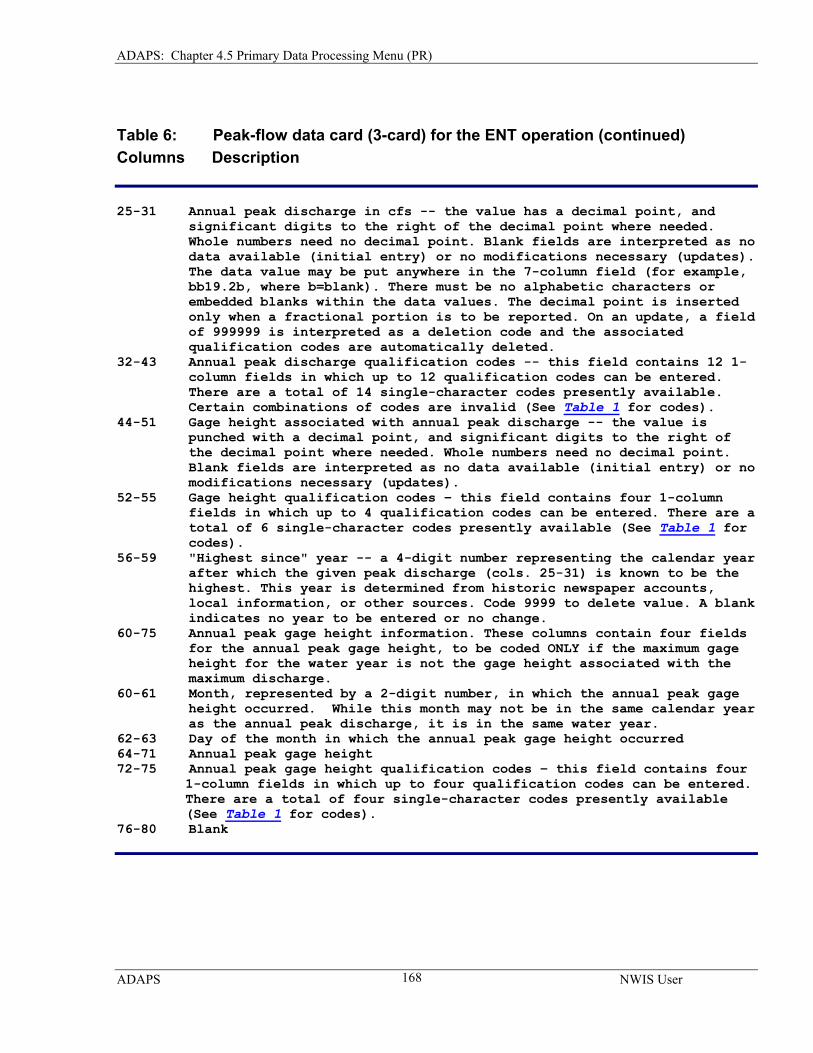
ADAPS: Chapter 4.5 Primary Data Processing Menu (PR)
Table 6: Peak-flow data card (3-card) for the ENT operation (continued) Columns Description 25-31 Annual peak discharge in cfs -- the value has a decimal point, and
significant digits to the right of the decimal point where needed. Whole numbers need no decimal point. Blank fields are interpreted as no data available (initial entry) or no modifications necessary (updates). The data value may be put anywhere in the 7-column field (for example, bb19.2b, where b=blank). There must be no alphabetic characters or embedded blanks within the data values. The decimal point is inserted only when a fractional portion is to be reported. On an update, a field of 999999 is interpreted as a deletion code and the associated qualification codes are automatically deleted.
32-43 Annual peak discharge qualification codes -- this field contains 12 1- column fields in which up to 12 qualification codes can be entered. There are a total of 14 single-character codes presently available. Certain combinations of codes are invalid (See Table 1 for codes). 44-51 Gage height associated with annual peak discharge -- the value is punched with a decimal point, and significant digits to the right of the decimal point where needed. Whole numbers need no decimal point. Blank fields are interpreted as no data available (initial entry) or no modifications necessary (updates). 52-55 Gage height qualification codes – this field contains four 1-column fields in which up to 4 qualification codes can be entered. There are a total of 6 single-character codes presently available (See Table 1 for codes). 56-59 "Highest since" year -- a 4-digit number representing the calendar year
after which the given peak discharge (cols. 25-31) is known to be the highest. This year is determined from historic newspaper accounts, local information, or other sources. Code 9999 to delete value. A blank indicates no year to be entered or no change.
60-75 Annual peak gage height information. These columns contain four fields for the annual peak gage height, to be coded ONLY if the maximum gage height for the water year is not the gage height associated with the maximum discharge. 60-61 Month, represented by a 2-digit number, in which the annual peak gage
height occurred. While this month may not be in the same calendar year as the annual peak discharge, it is in the same water year.
62-63 Day of the month in which the annual peak gage height occurred 64-71 Annual peak gage height 72-75 Annual peak gage height qualification codes – this field contains four
1-column fields in which up to four qualification codes can be entered. There are a total of four single-character codes presently available (See Table 1 for codes).
76-80 Blank
ADAPS NWIS User
168
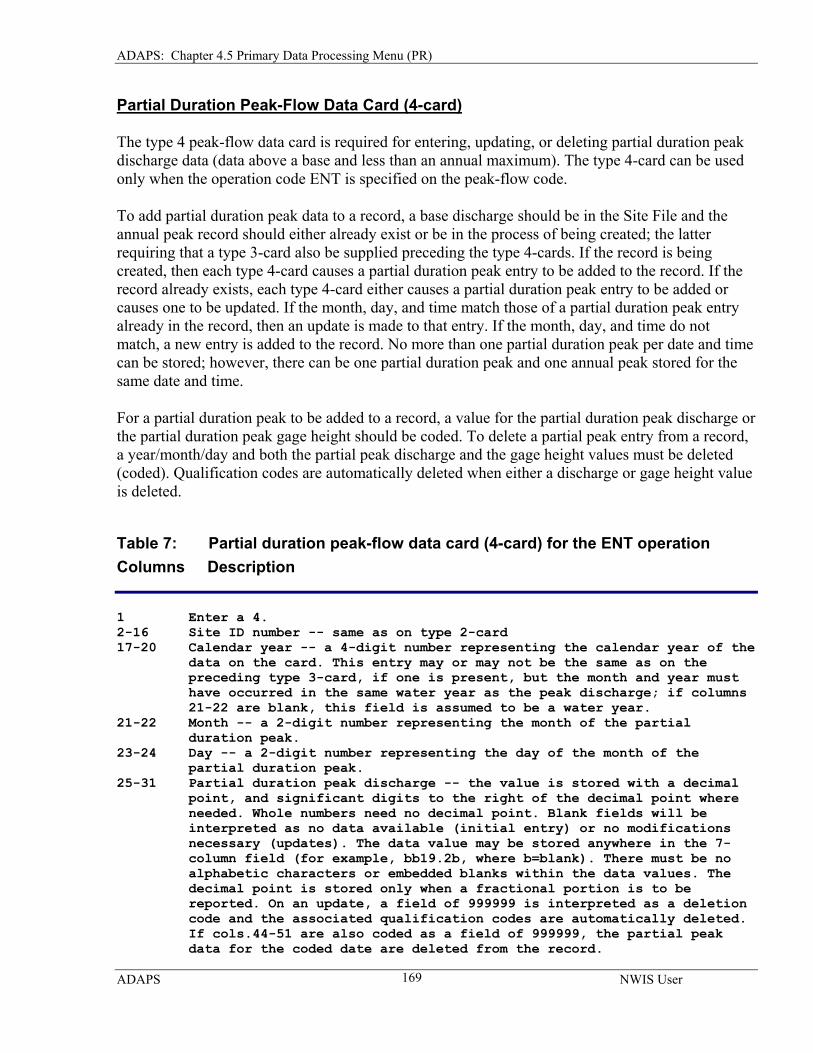
ADAPS: Chapter 4.5 Primary Data Processing Menu (PR)
Partial Duration Peak-Flow Data Card (4-card)
The type 4 peak-flow data card is required for entering, updating, or deleting partial duration peak discharge data (data above a base and less than an annual maximum). The type 4-card can be used only when the operation code ENT is specified on the peak-flow code.
To add partial duration peak data to a record, a base discharge should be in the Site File and the annual peak record should either already exist or be in the process of being created; the latter requiring that a type 3-card also be supplied preceding the type 4-cards. If the record is being created, then each type 4-card causes a partial duration peak entry to be added to the record. If the record already exists, each type 4-card either causes a partial duration peak entry to be added or causes one to be updated. If the month, day, and time match those of a partial duration peak entry already in the record, then an update is made to that entry. If the month, day, and time do not match, a new entry is added to the record. No more than one partial duration peak per date and time can be stored; however, there can be one partial duration peak and one annual peak stored for the same date and time.
For a partial duration peak to be added to a record, a value for the partial duration peak discharge or the partial duration peak gage height should be coded. To delete a partial peak entry from a record, a year/month/day and both the partial peak discharge and the gage height values must be deleted (coded). Qualification codes are automatically deleted when either a discharge or gage height value is deleted.
Table 7: Partial duration peak-flow data card (4-card) for the ENT operation Columns Description 1 Enter a 4. 2-16 Site ID number -- same as on type 2-card 17-20 Calendar year -- a 4-digit number representing the calendar year of the data on the card. This entry may or may not be the same as on the preceding type 3-card, if one is present, but the month and year must have occurred in the same water year as the peak discharge; if columns 21-22 are blank, this field is assumed to be a water year. 21-22 Month -- a 2-digit number representing the month of the partial duration peak. 23-24 Day -- a 2-digit number representing the day of the month of the
partial duration peak. 25-31 Partial duration peak discharge -- the value is stored with a decimal point, and significant digits to the right of the decimal point where needed. Whole numbers need no decimal point. Blank fields will be interpreted as no data available (initial entry) or no modifications necessary (updates). The data value may be stored anywhere in the 7- column field (for example, bb19.2b, where b=blank). There must be no alphabetic characters or embedded blanks within the data values. The decimal point is stored only when a fractional portion is to be reported. On an update, a field of 999999 is interpreted as a deletion code and the associated qualification codes are automatically deleted. If cols.44-51 are also coded as a field of 999999, the partial peak data for the coded date are deleted from the record.
ADAPS NWIS User
169
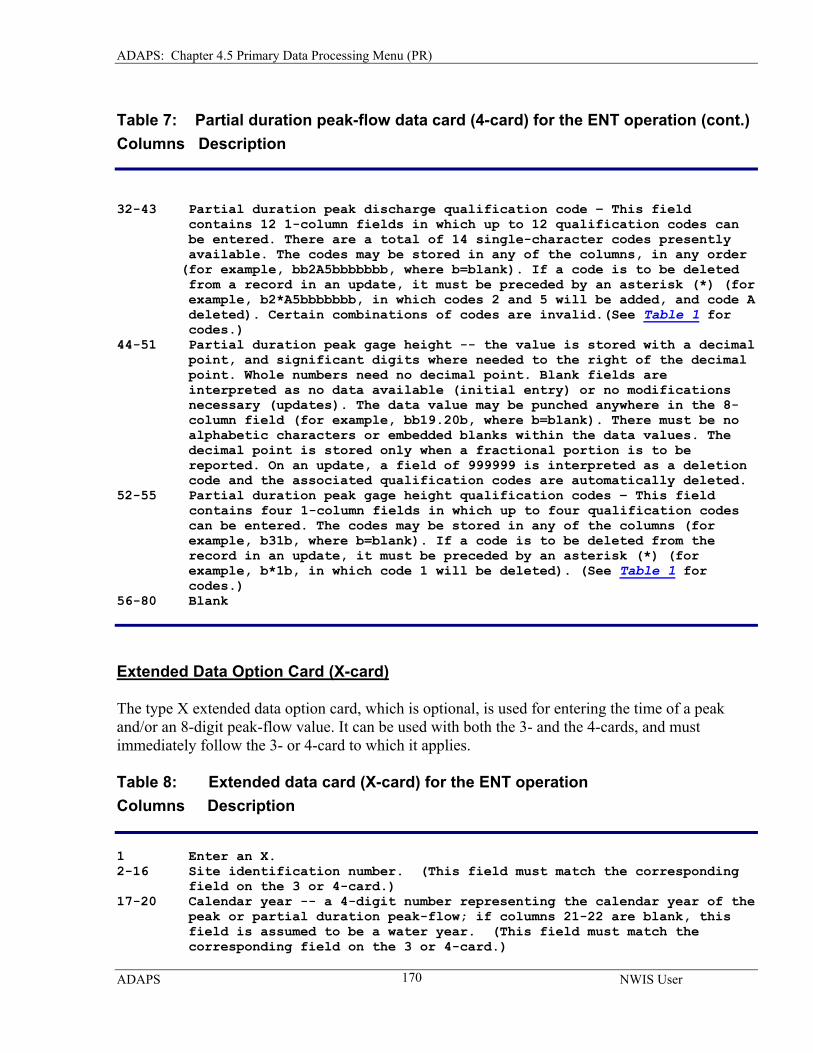
ADAPS: Chapter 4.5 Primary Data Processing Menu (PR)
Table 7: Partial duration peak-flow data card (4-card) for the ENT operation (cont.) Columns Description 32-43 Partial duration peak discharge qualification code – This field contains 12 1-column fields in which up to 12 qualification codes can be entered. There are a total of 14 single-character codes presently available. The codes may be stored in any of the columns, in any order (for example, bb2A5bbbbbbb, where b=blank). If a code is to be deleted from a record in an update, it must be preceded by an asterisk (*) (for example, b2*A5bbbbbbb, in which codes 2 and 5 will be added, and code A deleted). Certain combinations of codes are invalid.(See Table 1 for codes.) 44-51 Partial duration peak gage height -- the value is stored with a decimal point, and significant digits where needed to the right of the decimal point. Whole numbers need no decimal point. Blank fields are interpreted as no data available (initial entry) or no modifications necessary (updates). The data value may be punched anywhere in the 8- column field (for example, bb19.20b, where b=blank). There must be no alphabetic characters or embedded blanks within the data values. The decimal point is stored only when a fractional portion is to be reported. On an update, a field of 999999 is interpreted as a deletion code and the associated qualification codes are automatically deleted. 52-55 Partial duration peak gage height qualification codes – This field
contains four 1-column fields in which up to four qualification codes can be entered. The codes may be stored in any of the columns (for example, b31b, where b=blank). If a code is to be deleted from the record in an update, it must be preceded by an asterisk (*) (for example, b*1b, in which code 1 will be deleted). (See Table 1 for codes.)
56-80 Blank
Extended Data Option Card (X-card)
The type X extended data option card, which is optional, is used for entering the time of a peak and/or an 8-digit peak-flow value. It can be used with both the 3- and the 4-cards, and must immediately follow the 3- or 4-card to which it applies.
Table 8: Extended data card (X-card) for the ENT operation Columns Description 1 Enter an X. 2-16 Site identification number. (This field must match the corresponding field on the 3 or 4-card.) 17-20 Calendar year -- a 4-digit number representing the calendar year of the peak or partial duration peak-flow; if columns 21-22 are blank, this field is assumed to be a water year. (This field must match the corresponding field on the 3 or 4-card.)
ADAPS NWIS User
170
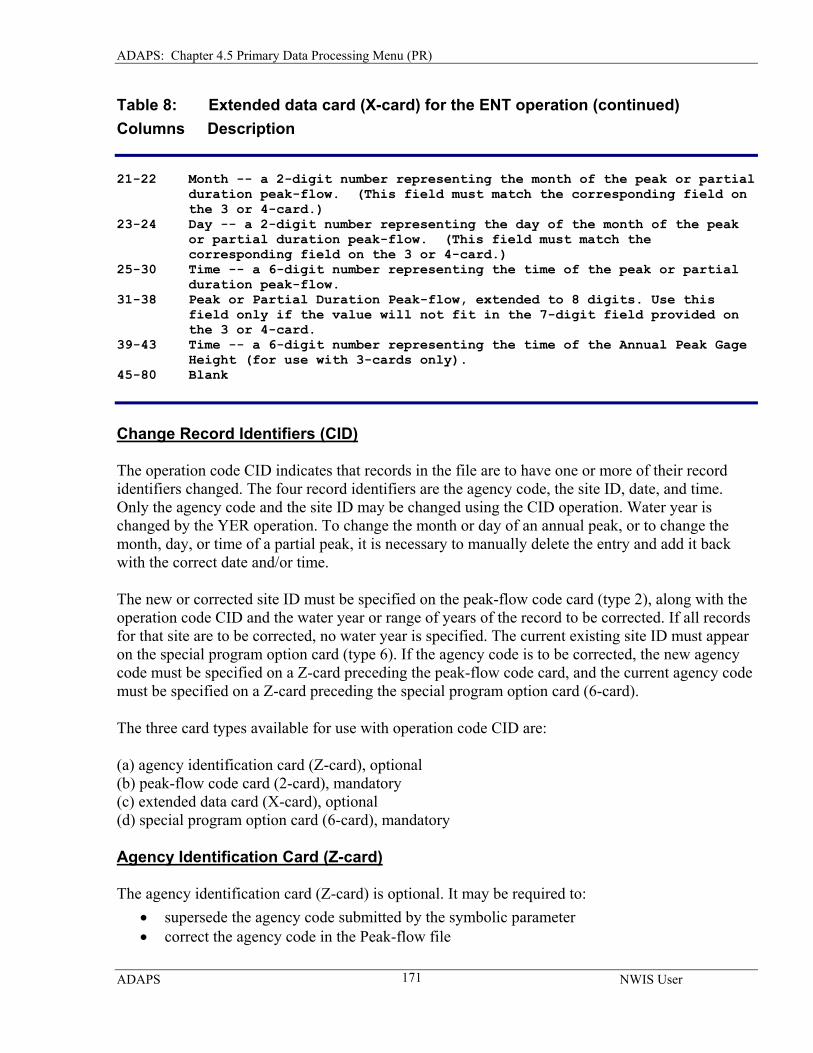
ADAPS: Chapter 4.5 Primary Data Processing Menu (PR)
Table 8: Extended data card (X-card) for the ENT operation (continued) Columns Description 21-22 Month -- a 2-digit number representing the month of the peak or partial
duration peak-flow. (This field must match the corresponding field on the 3 or 4-card.)
23-24 Day -- a 2-digit number representing the day of the month of the peak or partial duration peak-flow. (This field must match the corresponding field on the 3 or 4-card.) 25-30 Time -- a 6-digit number representing the time of the peak or partial
duration peak-flow. 31-38 Peak or Partial Duration Peak-flow, extended to 8 digits. Use this field only if the value will not fit in the 7-digit field provided on the 3 or 4-card. 39-43 Time -- a 6-digit number representing the time of the Annual Peak Gage
Height (for use with 3-cards only). 45-80 Blank
Change Record Identifiers (CID) The operation code CID indicates that records in the file are to have one or more of their record identifiers changed. The four record identifiers are the agency code, the site ID, date, and time. Only the agency code and the site ID may be changed using the CID operation. Water year is changed by the YER operation. To change the month or day of an annual peak, or to change the month, day, or time of a partial peak, it is necessary to manually delete the entry and add it back with the correct date and/or time.
The new or corrected site ID must be specified on the peak-flow code card (type 2), along with the operation code CID and the water year or range of years of the record to be corrected. If all records for that site are to be corrected, no water year is specified. The current existing site ID must appear on the special program option card (type 6). If the agency code is to be corrected, the new agency code must be specified on a Z-card preceding the peak-flow code card, and the current agency code must be specified on a Z-card preceding the special program option card (6-card).
The three card types available for use with operation code CID are:
(a) agency identification card (Z-card), optional (b) peak-flow code card (2-card), mandatory (c) extended data card (X-card), optional (d) special program option card (6-card), mandatory
Agency Identification Card (Z-card) The agency identification card (Z-card) is optional. It may be required to:
• supersede the agency code submitted by the symbolic parameter • correct the agency code in the Peak-flow file
ADAPS NWIS User
171
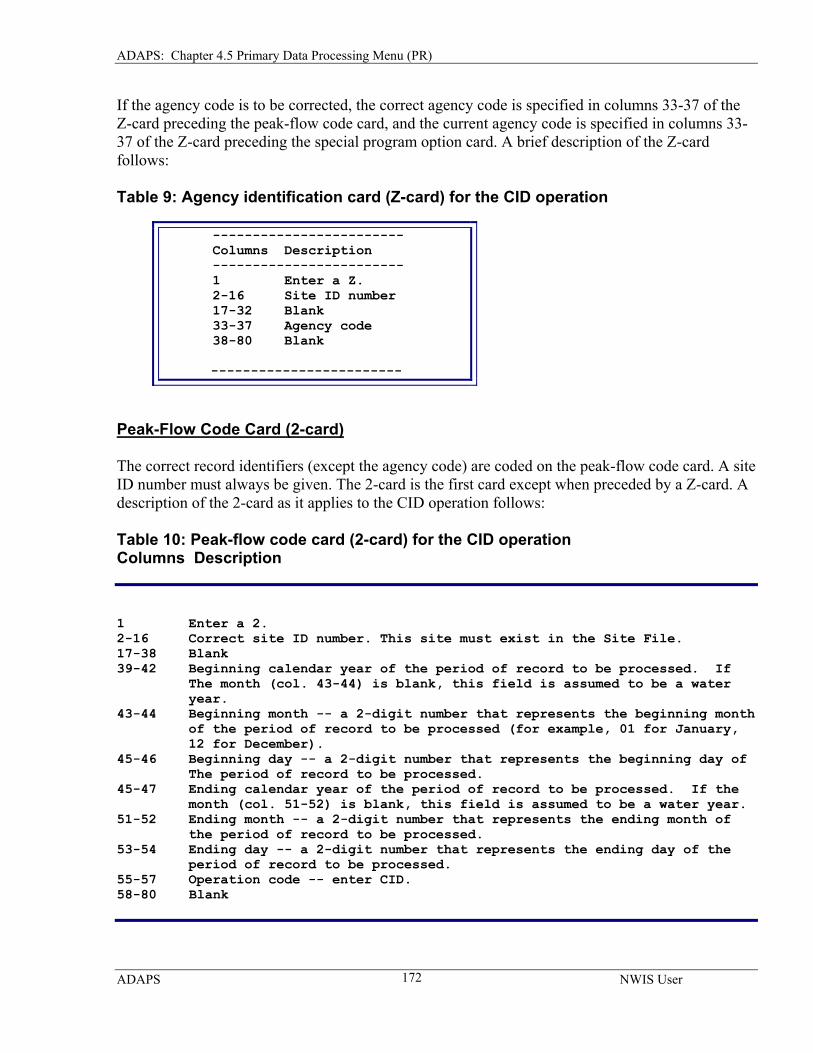
ADAPS: Chapter 4.5 Primary Data Processing Menu (PR)
If the agency code is to be corrected, the correct agency code is specified in columns 33-37 of the Z-card preceding the peak-flow code card, and the current agency code is specified in columns 33-37 of the Z-card preceding the special program option card. A brief description of the Z-card follows:
Table 9: Agency identification card (Z-card) for the CID operation
------------------------ Columns Description ------------------------ 1 Enter a Z. 2-16 Site ID number 17-32 Blank 33-37 Agency code 38-80 Blank
------------------------
Peak-Flow Code Card (2-card) The correct record identifiers (except the agency code) are coded on the peak-flow code card. A site ID number must always be given. The 2-card is the first card except when preceded by a Z-card. A description of the 2-card as it applies to the CID operation follows:
Table 10: Peak-flow code card (2-card) for the CID operation Columns Description 1 Enter a 2. 2-16 Correct site ID number. This site must exist in the Site File. 17-38 Blank 39-42 Beginning calendar year of the period of record to be processed. If
The month (col. 43-44) is blank, this field is assumed to be a water year.
43-44 Beginning month -- a 2-digit number that represents the beginning month of the period of record to be processed (for example, 01 for January, 12 for December). 45-46 Beginning day -- a 2-digit number that represents the beginning day of
The period of record to be processed. 45-47 Ending calendar year of the period of record to be processed. If the
month (col. 51-52) is blank, this field is assumed to be a water year. 51-52 Ending month -- a 2-digit number that represents the ending month of the period of record to be processed. 53-54 Ending day -- a 2-digit number that represents the ending day of the period of record to be processed. 55-57 Operation code -- enter CID. 58-80 Blank
ADAPS NWIS User
172
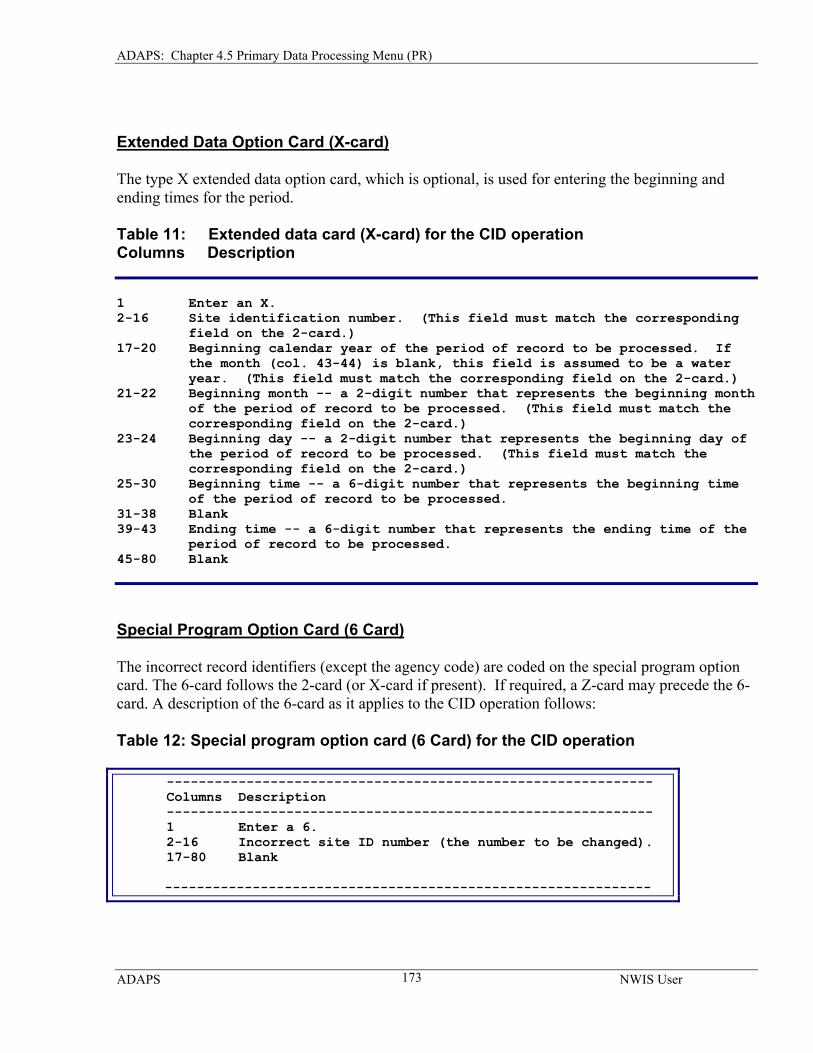
ADAPS: Chapter 4.5 Primary Data Processing Menu (PR)
Extended Data Option Card (X-card)
The type X extended data option card, which is optional, is used for entering the beginning and ending times for the period.
Table 11: Extended data card (X-card) for the CID operation Columns Description 1 Enter an X. 2-16 Site identification number. (This field must match the corresponding field on the 2-card.) 17-20 Beginning calendar year of the period of record to be processed. If
the month (col. 43-44) is blank, this field is assumed to be a water year. (This field must match the corresponding field on the 2-card.)
21-22 Beginning month -- a 2-digit number that represents the beginning month of the period of record to be processed. (This field must match the corresponding field on the 2-card.) 23-24 Beginning day -- a 2-digit number that represents the beginning day of
the period of record to be processed. (This field must match the corresponding field on the 2-card.)
25-30 Beginning time -- a 6-digit number that represents the beginning time of the period of record to be processed. 31-38 Blank 39-43 Ending time -- a 6-digit number that represents the ending time of the period of record to be processed. 45-80 Blank
Special Program Option Card (6 Card)
The incorrect record identifiers (except the agency code) are coded on the special program option card. The 6-card follows the 2-card (or X-card if present). If required, a Z-card may precede the 6- card. A description of the 6-card as it applies to the CID operation follows:
Table 12: Special program option card (6 Card) for the CID operation
------------------------------------------------------------- Columns Description ------------------------------------------------------------- 1 Enter a 6. 2-16 Incorrect site ID number (the number to be changed). 17-80 Blank
-------------------------------------------------------------
ADAPS NWIS User
173
ADAPS: Chapter 4.5 Primary Data Processing Menu (PR)
Options
The change to be executed by the CID operation is controlled by the content of the input cards. The two possible options are to change agency code or site ID number. Generally, the five control cards are submitted in the following order:
• Z-card (mandatory only for agency code change) • 2-card (mandatory for all options) • X-card (used only when including times with the dates) • Z-card (mandatory only for agency code change) • 6-card (mandatory for all options)
The Z-card (agency identification card) is required for the agency change option and in all other cases where the agency is not the default of USGS. The site ID contained on the 2-card and preceding Z-card must correspond to an entry in the Site File. The site ID contained on the 6-card and preceding Z-card need not correspond to an existing entry in the Site File. The two change options are described below.
Change of Agency Code
There must be an entry in the Site File that corresponds to the new agency code and current site ID number. Four cards are needed to change the agency code:
• a Z-card, containing the new or corrected agency code • a peak-flow code card (2-card) containing the operation code CID and the site ID number • a second Z-card, containing the agency code currently used to identify the record • a special-program option card (6-card) containing the current site ID number
The second card, the peak-flow code card (2-card), may optionally contain one or two water year entries. If only one water year is given, the agency code will be changed only in the record for that water year. If two water year entries are given, the agency code will be changed in the records for all years within the range defined by the two water years, inclusive. If no water year entries are made on the peak-flow code card, then the agency code will be changed in all records for the site. There need not be an entry in the Site File for the site identified by the second Z-card.
Change of Site ID Number
There must be an entry in the Site File that corresponds to the current agency code and the new site ID number. If the agency code is the default of USGS, only two cards are needed to change a site ID number:
• a peak-flow code card (2-card) containing the operation code CID and the new or corrected site ID number
• a special program option card (6-card) containing the site ID number currently in the record
ADAPS NWIS User
174
ADAPS: Chapter 4.5 Primary Data Processing Menu (PR)
The first card, the peak-flow code card, may optionally contain one or two water year entries. If only one water year is given, the site ID number will be changed only in the record for that water year. If two water year entries are given, the site ID number will be changed in the records for all years within the range defined by the two water years, inclusive. If no water year entries are made on the peak-flow code card, then the site ID number will be changed in the records for all water years.
There need not be an entry in the Site File for the site identified by the special program option card (6-card). If the site ID number is changed using the CID operation and that number (new number) is not present in the Site File, an entry must be made in the Site File before the station data can be changed.
Record Deletion (DEL)
The operation code DEL indicates that one or more records (water year) for a site are to be deleted from the peak-flow file. The peak-flow code card (2-card) is required for this operation, and the extended data card (X-card) is also required if the record to be deleted includes a time identifier. The agency identification card is optional.
The site ID number and the operation code DEL are specified on the peak-flow code card. Optionally, one or a range of years may be specified on the peak-flow code card. If only a begin date or end date is specified, only the record for that date is deleted. If two dates are specified, all records within the range defined by the two dates will be deleted. If a single record is being deleted (blank begin or end date) the time of the peak, if any, must also be indicated. Times can also be included when deleting a range of peak records. The time(s) of the peaks to be deleted are specified on extended data cards (X-cards).
The three card types available for use with operation code DEL are:
• agency identification card (Z-card), optional • peak-flow code card (2-card), mandatory • extended data card (X-card), optional except when deleting a single value that includes a
time identifier
Agency Identification Card (Z-card)
The agency identification card must precede the peak-flow code card, if needed, to supersede the default agency. A brief description of the Z-card follows:
ADAPS NWIS User
175
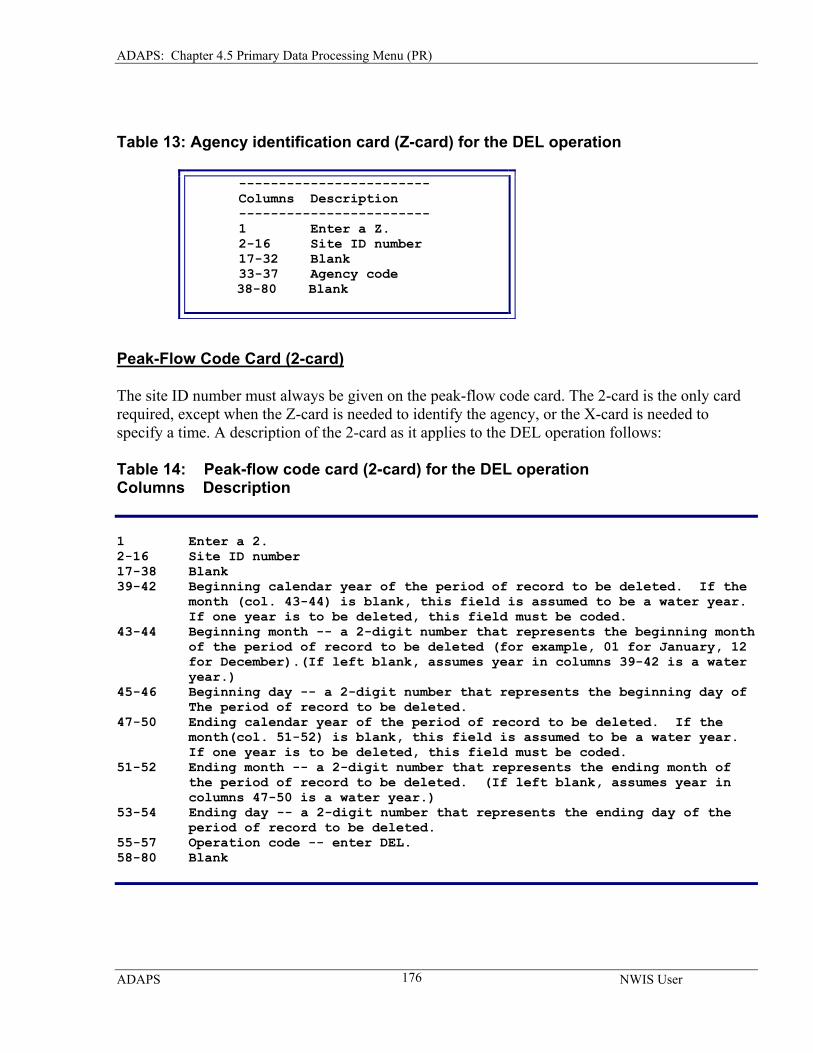
ADAPS: Chapter 4.5 Primary Data Processing Menu (PR)
Table 13: Agency identification card (Z-card) for the DEL operation
------------------------ Columns Description ------------------------ 1 Enter a Z. 2-16 Site ID number 17-32 Blank 33-37 Agency code 38-80 Blank
Peak-Flow Code Card (2-card)
The site ID number must always be given on the peak-flow code card. The 2-card is the only card required, except when the Z-card is needed to identify the agency, or the X-card is needed to specify a time. A description of the 2-card as it applies to the DEL operation follows:
Table 14: Peak-flow code card (2-card) for the DEL operation Columns Description 1 Enter a 2. 2-16 Site ID number 17-38 Blank 39-42 Beginning calendar year of the period of record to be deleted. If the month (col. 43-44) is blank, this field is assumed to be a water year. If one year is to be deleted, this field must be coded. 43-44 Beginning month -- a 2-digit number that represents the beginning month of the period of record to be deleted (for example, 01 for January, 12 for December).(If left blank, assumes year in columns 39-42 is a water year.) 45-46 Beginning day -- a 2-digit number that represents the beginning day of
The period of record to be deleted. 47-50 Ending calendar year of the period of record to be deleted. If the
month(col. 51-52) is blank, this field is assumed to be a water year. If one year is to be deleted, this field must be coded.
51-52 Ending month -- a 2-digit number that represents the ending month of the period of record to be deleted. (If left blank, assumes year in columns 47-50 is a water year.) 53-54 Ending day -- a 2-digit number that represents the ending day of the
period of record to be deleted. 55-57 Operation code -- enter DEL. 58-80 Blank
ADAPS NWIS User
176
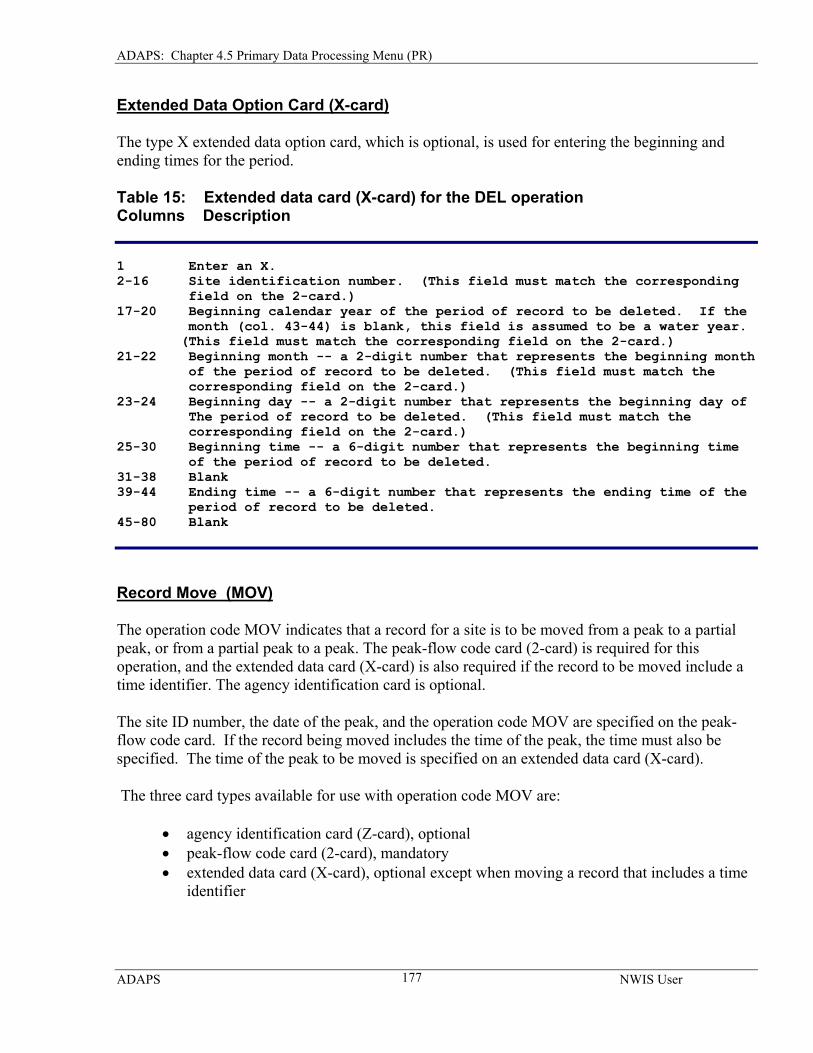
ADAPS: Chapter 4.5 Primary Data Processing Menu (PR)
Extended Data Option Card (X-card)
The type X extended data option card, which is optional, is used for entering the beginning and ending times for the period.
Table 15: Extended data card (X-card) for the DEL operation Columns Description 1 Enter an X. 2-16 Site identification number. (This field must match the corresponding field on the 2-card.) 17-20 Beginning calendar year of the period of record to be deleted. If the month (col. 43-44) is blank, this field is assumed to be a water year. (This field must match the corresponding field on the 2-card.) 21-22 Beginning month -- a 2-digit number that represents the beginning month of the period of record to be deleted. (This field must match the corresponding field on the 2-card.) 23-24 Beginning day -- a 2-digit number that represents the beginning day of
The period of record to be deleted. (This field must match the corresponding field on the 2-card.)
25-30 Beginning time -- a 6-digit number that represents the beginning time of the period of record to be deleted. 31-38 Blank 39-44 Ending time -- a 6-digit number that represents the ending time of the period of record to be deleted. 45-80 Blank
Record Move (MOV)
The operation code MOV indicates that a record for a site is to be moved from a peak to a partial peak, or from a partial peak to a peak. The peak-flow code card (2-card) is required for this operation, and the extended data card (X-card) is also required if the record to be moved include a time identifier. The agency identification card is optional.
The site ID number, the date of the peak, and the operation code MOV are specified on the peak-flow code card. If the record being moved includes the time of the peak, the time must also be specified. The time of the peak to be moved is specified on an extended data card (X-card).
The three card types available for use with operation code MOV are:
• agency identification card (Z-card), optional • peak-flow code card (2-card), mandatory • extended data card (X-card), optional except when moving a record that includes a time
identifier
ADAPS NWIS User
177
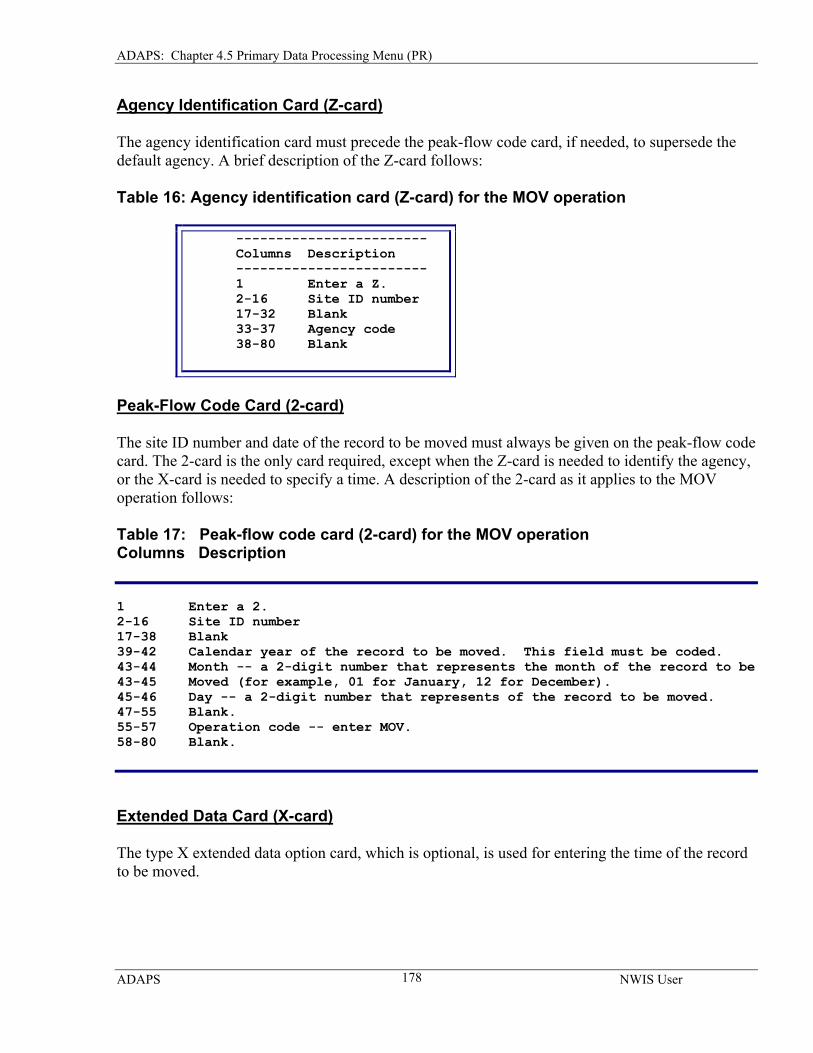
ADAPS: Chapter 4.5 Primary Data Processing Menu (PR)
Agency Identification Card (Z-card)
The agency identification card must precede the peak-flow code card, if needed, to supersede the default agency. A brief description of the Z-card follows:
Table 16: Agency identification card (Z-card) for the MOV operation
------------------------ Columns Description ------------------------ 1 Enter a Z. 2-16 Site ID number 17-32 Blank 33-37 Agency code 38-80 Blank
Peak-Flow Code Card (2-card)
The site ID number and date of the record to be moved must always be given on the peak-flow code card. The 2-card is the only card required, except when the Z-card is needed to identify the agency, or the X-card is needed to specify a time. A description of the 2-card as it applies to the MOV operation follows:
Table 17: Peak-flow code card (2-card) for the MOV operation Columns Description 1 Enter a 2. 2-16 Site ID number 17-38 Blank 39-42 Calendar year of the record to be moved. This field must be coded. 43-44 Month -- a 2-digit number that represents the month of the record to be 43-45 Moved (for example, 01 for January, 12 for December). 45-46 Day -- a 2-digit number that represents of the record to be moved. 47-55 Blank. 55-57 Operation code -- enter MOV. 58-80 Blank.
Extended Data Card (X-card)
The type X extended data option card, which is optional, is used for entering the time of the record to be moved.
ADAPS NWIS User
178
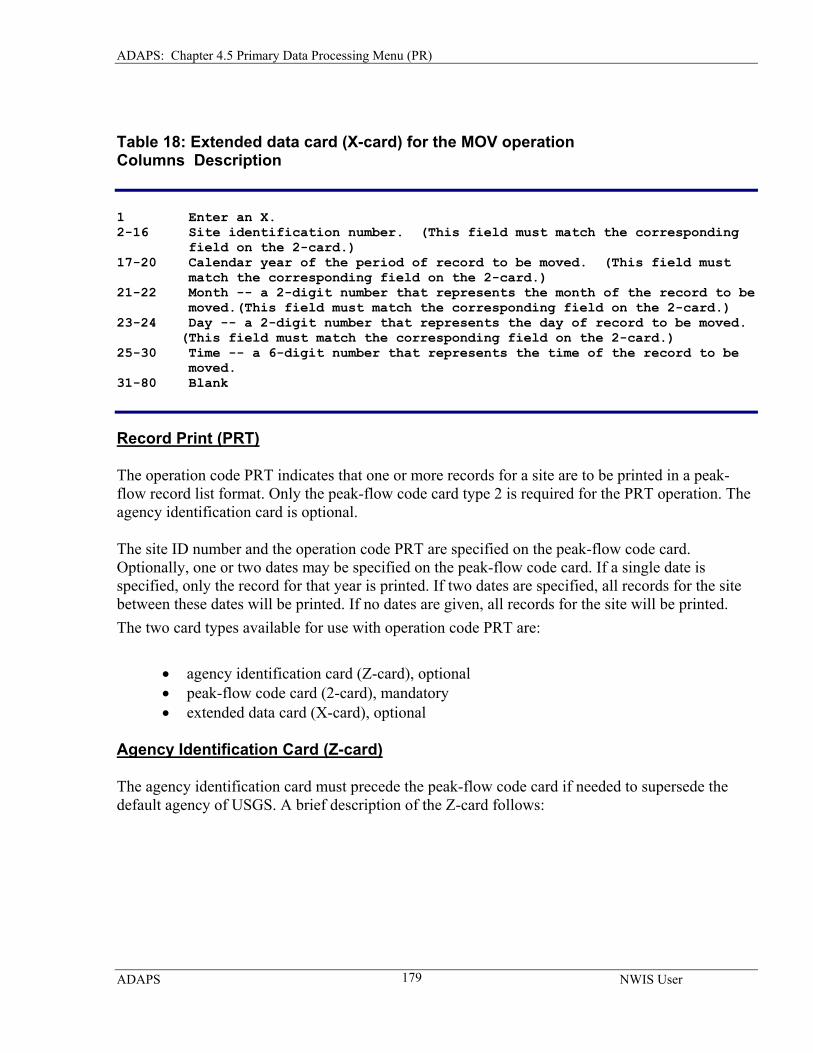
ADAPS: Chapter 4.5 Primary Data Processing Menu (PR)
Table 18: Extended data card (X-card) for the MOV operation Columns Description 1 Enter an X. 2-16 Site identification number. (This field must match the corresponding field on the 2-card.) 17-20 Calendar year of the period of record to be moved. (This field must match the corresponding field on the 2-card.) 21-22 Month -- a 2-digit number that represents the month of the record to be moved.(This field must match the corresponding field on the 2-card.) 23-24 Day -- a 2-digit number that represents the day of record to be moved. (This field must match the corresponding field on the 2-card.) 25-30 Time -- a 6-digit number that represents the time of the record to be moved. 31-80 Blank Record Print (PRT)
The operation code PRT indicates that one or more records for a site are to be printed in a peak-flow record list format. Only the peak-flow code card type 2 is required for the PRT operation. The agency identification card is optional.
The site ID number and the operation code PRT are specified on the peak-flow code card. Optionally, one or two dates may be specified on the peak-flow code card. If a single date is specified, only the record for that year is printed. If two dates are specified, all records for the site between these dates will be printed. If no dates are given, all records for the site will be printed. The two card types available for use with operation code PRT are:
• agency identification card (Z-card), optional • peak-flow code card (2-card), mandatory • extended data card (X-card), optional
Agency Identification Card (Z-card)
The agency identification card must precede the peak-flow code card if needed to supersede the default agency of USGS. A brief description of the Z-card follows:
ADAPS NWIS User
179
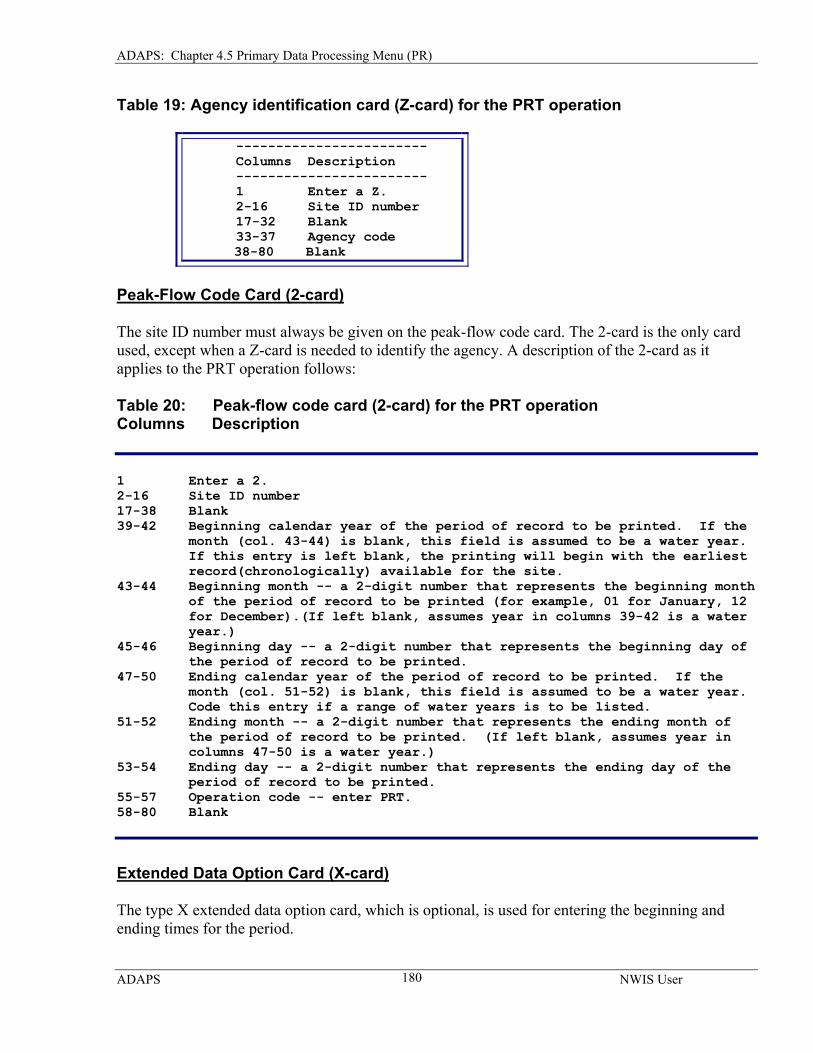
ADAPS: Chapter 4.5 Primary Data Processing Menu (PR)
Table 19: Agency identification card (Z-card) for the PRT operation
------------------------ Columns Description ------------------------ 1 Enter a Z. 2-16 Site ID number 17-32 Blank 33-37 Agency code
38-80 Blank
Peak-Flow Code Card (2-card)
The site ID number must always be given on the peak-flow code card. The 2-card is the only card used, except when a Z-card is needed to identify the agency. A description of the 2-card as it applies to the PRT operation follows:
Table 20: Peak-flow code card (2-card) for the PRT operation Columns Description 1 Enter a 2. 2-16 Site ID number 17-38 Blank 39-42 Beginning calendar year of the period of record to be printed. If the month (col. 43-44) is blank, this field is assumed to be a water year. If this entry is left blank, the printing will begin with the earliest record(chronologically) available for the site. 43-44 Beginning month -- a 2-digit number that represents the beginning month of the period of record to be printed (for example, 01 for January, 12 for December).(If left blank, assumes year in columns 39-42 is a water year.) 45-46 Beginning day -- a 2-digit number that represents the beginning day of the period of record to be printed. 47-50 Ending calendar year of the period of record to be printed. If the month (col. 51-52) is blank, this field is assumed to be a water year. Code this entry if a range of water years is to be listed. 51-52 Ending month -- a 2-digit number that represents the ending month of the period of record to be printed. (If left blank, assumes year in columns 47-50 is a water year.) 53-54 Ending day -- a 2-digit number that represents the ending day of the period of record to be printed. 55-57 Operation code -- enter PRT. 58-80 Blank
Extended Data Option Card (X-card)
The type X extended data option card, which is optional, is used for entering the beginning and ending times for the period.
ADAPS NWIS User
180
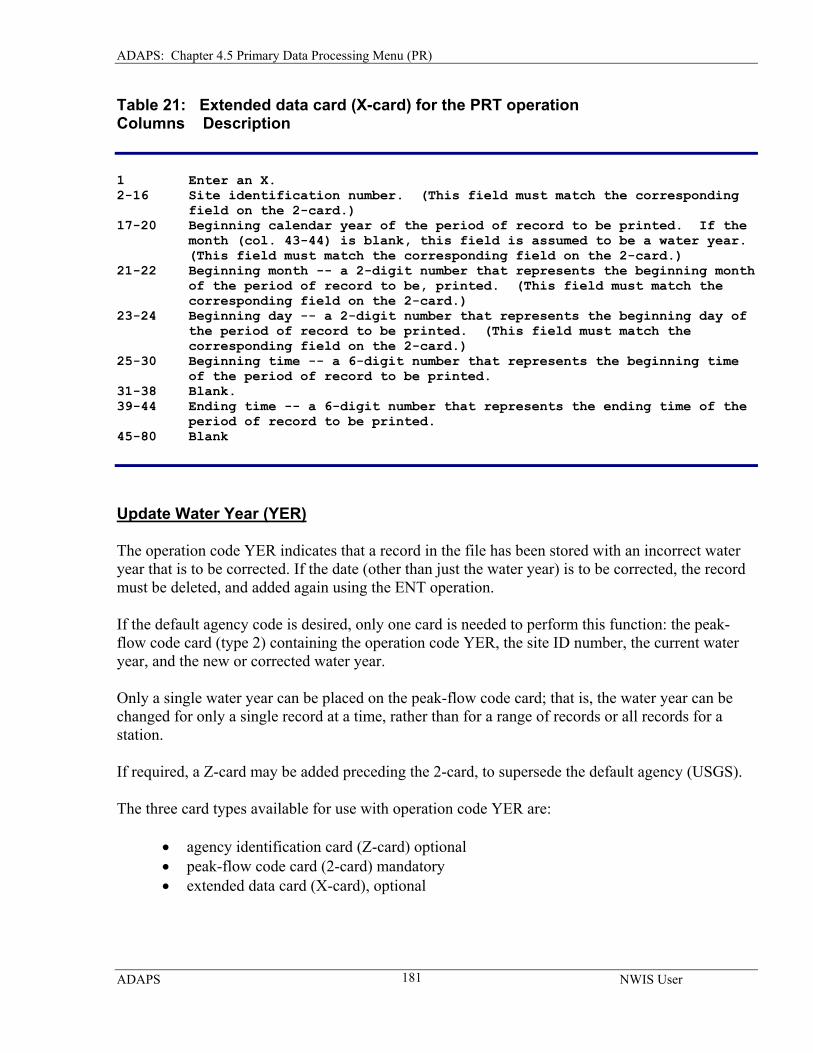
ADAPS: Chapter 4.5 Primary Data Processing Menu (PR)
Table 21: Extended data card (X-card) for the PRT operation Columns Description 1 Enter an X. 2-16 Site identification number. (This field must match the corresponding field on the 2-card.) 17-20 Beginning calendar year of the period of record to be printed. If the month (col. 43-44) is blank, this field is assumed to be a water year. (This field must match the corresponding field on the 2-card.) 21-22 Beginning month -- a 2-digit number that represents the beginning month of the period of record to be, printed. (This field must match the corresponding field on the 2-card.) 23-24 Beginning day -- a 2-digit number that represents the beginning day of the period of record to be printed. (This field must match the corresponding field on the 2-card.) 25-30 Beginning time -- a 6-digit number that represents the beginning time of the period of record to be printed. 31-38 Blank. 39-44 Ending time -- a 6-digit number that represents the ending time of the period of record to be printed. 45-80 Blank
Update Water Year (YER)
The operation code YER indicates that a record in the file has been stored with an incorrect water year that is to be corrected. If the date (other than just the water year) is to be corrected, the record must be deleted, and added again using the ENT operation.
If the default agency code is desired, only one card is needed to perform this function: the peak-flow code card (type 2) containing the operation code YER, the site ID number, the current water year, and the new or corrected water year.
Only a single water year can be placed on the peak-flow code card; that is, the water year can be changed for only a single record at a time, rather than for a range of records or all records for a station.
If required, a Z-card may be added preceding the 2-card, to supersede the default agency (USGS).
The three card types available for use with operation code YER are:
• agency identification card (Z-card) optional • peak-flow code card (2-card) mandatory • extended data card (X-card), optional
ADAPS NWIS User
181
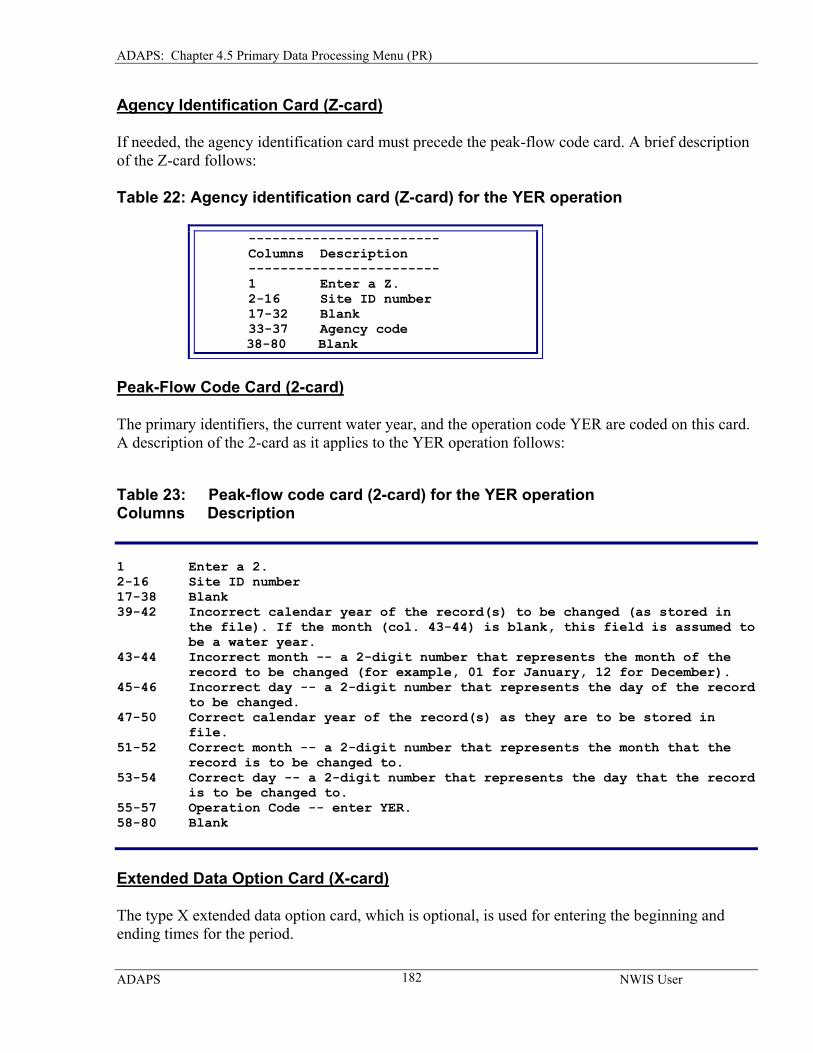
ADAPS: Chapter 4.5 Primary Data Processing Menu (PR)
Agency Identification Card (Z-card)
If needed, the agency identification card must precede the peak-flow code card. A brief description of the Z-card follows:
Table 22: Agency identification card (Z-card) for the YER operation
------------------------ Columns Description ------------------------ 1 Enter a Z. 2-16 Site ID number 17-32 Blank 33-37 Agency code
38-80 Blank
Peak-Flow Code Card (2-card)
The primary identifiers, the current water year, and the operation code YER are coded on this card. A description of the 2-card as it applies to the YER operation follows:
Table 23: Peak-flow code card (2-card) for the YER operation Columns Description 1 Enter a 2. 2-16 Site ID number 17-38 Blank
39-42 Incorrect calendar year of the record(s) to be changed (as stored in the file). If the month (col. 43-44) is blank, this field is assumed to be a water year.
43-44 Incorrect month -- a 2-digit number that represents the month of the record to be changed (for example, 01 for January, 12 for December). 45-46 Incorrect day -- a 2-digit number that represents the day of the record to be changed. 47-50 Correct calendar year of the record(s) as they are to be stored in file. 51-52 Correct month -- a 2-digit number that represents the month that the record is to be changed to. 53-54 Correct day -- a 2-digit number that represents the day that the record is to be changed to. 55-57 Operation Code -- enter YER. 58-80 Blank
Extended Data Option Card (X-card)
The type X extended data option card, which is optional, is used for entering the beginning and ending times for the period.
ADAPS NWIS User
182
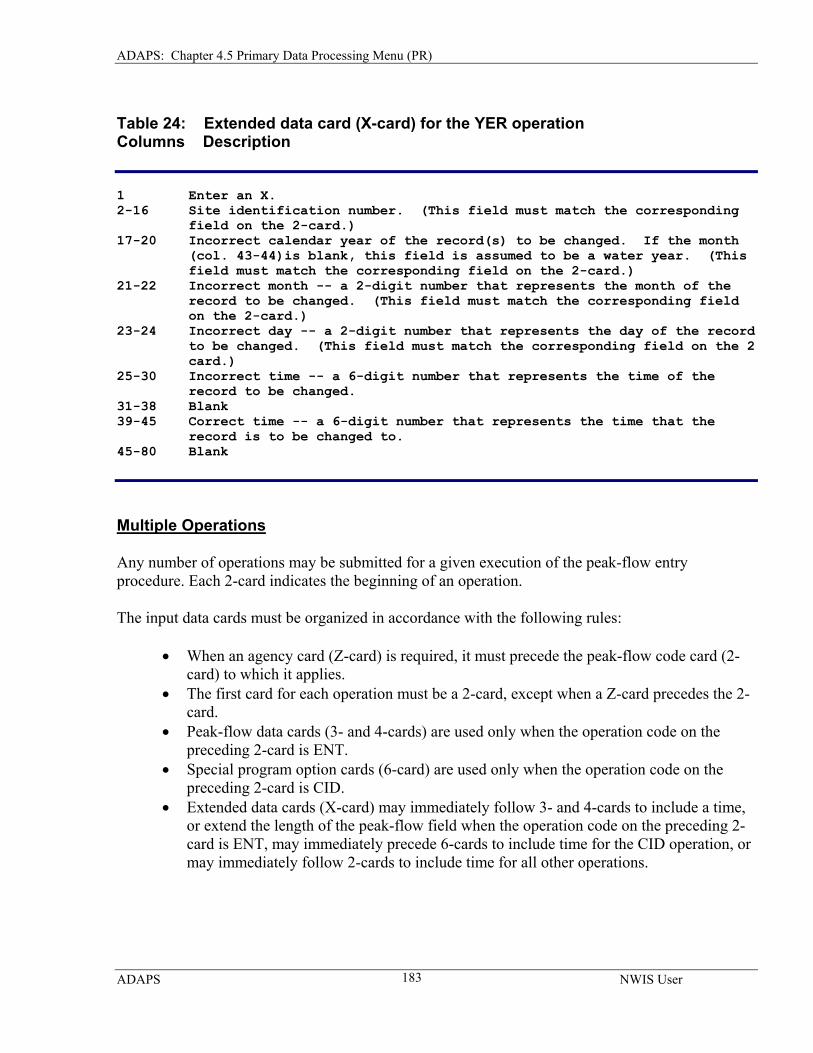
ADAPS: Chapter 4.5 Primary Data Processing Menu (PR)
Table 24: Extended data card (X-card) for the YER operation Columns Description 1 Enter an X. 2-16 Site identification number. (This field must match the corresponding field on the 2-card.) 17-20 Incorrect calendar year of the record(s) to be changed. If the month (col. 43-44)is blank, this field is assumed to be a water year. (This field must match the corresponding field on the 2-card.) 21-22 Incorrect month -- a 2-digit number that represents the month of the record to be changed. (This field must match the corresponding field on the 2-card.) 23-24 Incorrect day -- a 2-digit number that represents the day of the record to be changed. (This field must match the corresponding field on the 2 card.) 25-30 Incorrect time -- a 6-digit number that represents the time of the record to be changed. 31-38 Blank 39-45 Correct time -- a 6-digit number that represents the time that the record is to be changed to. 45-80 Blank
Multiple Operations
Any number of operations may be submitted for a given execution of the peak-flow entry procedure. Each 2-card indicates the beginning of an operation.
The input data cards must be organized in accordance with the following rules:
• When an agency card (Z-card) is required, it must precede the peak-flow code card (2-card) to which it applies.
• The first card for each operation must be a 2-card, except when a Z-card precedes the 2-card.
• Peak-flow data cards (3- and 4-cards) are used only when the operation code on the preceding 2-card is ENT.
• Special program option cards (6-card) are used only when the operation code on the preceding 2-card is CID.
• Extended data cards (X-card) may immediately follow 3- and 4-cards to include a time, or extend the length of the peak-flow field when the operation code on the preceding 2-card is ENT, may immediately precede 6-cards to include time for the CID operation, or may immediately follow 2-cards to include time for all other operations.
ADAPS NWIS User
183
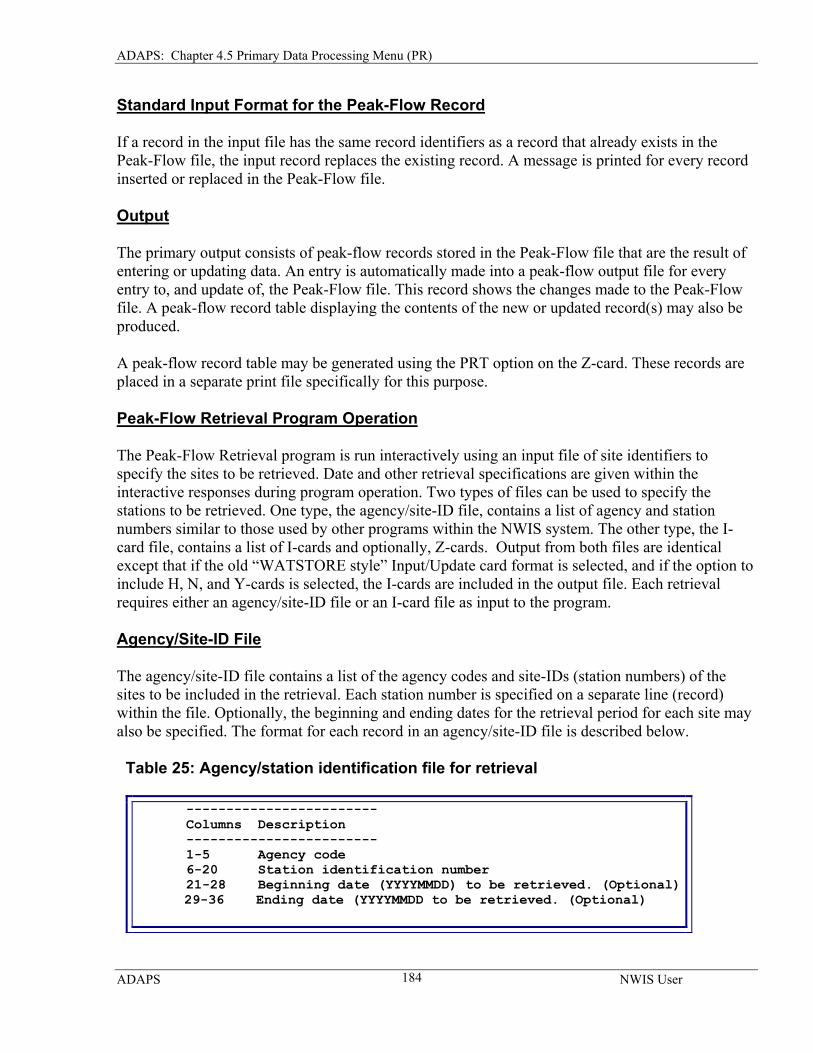
ADAPS: Chapter 4.5 Primary Data Processing Menu (PR)
Standard Input Format for the Peak-Flow Record
If a record in the input file has the same record identifiers as a record that already exists in the Peak-Flow file, the input record replaces the existing record. A message is printed for every record inserted or replaced in the Peak-Flow file.
Output
The primary output consists of peak-flow records stored in the Peak-Flow file that are the result of entering or updating data. An entry is automatically made into a peak-flow output file for every entry to, and update of, the Peak-Flow file. This record shows the changes made to the Peak-Flow file. A peak-flow record table displaying the contents of the new or updated record(s) may also be produced.
A peak-flow record table may be generated using the PRT option on the Z-card. These records are placed in a separate print file specifically for this purpose.
Peak-Flow Retrieval Program Operation
The Peak-Flow Retrieval program is run interactively using an input file of site identifiers to specify the sites to be retrieved. Date and other retrieval specifications are given within the interactive responses during program operation. Two types of files can be used to specify the stations to be retrieved. One type, the agency/site-ID file, contains a list of agency and station numbers similar to those used by other programs within the NWIS system. The other type, the I- card file, contains a list of I-cards and optionally, Z-cards. Output from both files are identical except that if the old “WATSTORE style” Input/Update card format is selected, and if the option to include H, N, and Y-cards is selected, the I-cards are included in the output file. Each retrieval requires either an agency/site-ID file or an I-card file as input to the program.
Agency/Site-ID File
The agency/site-ID file contains a list of the agency codes and site-IDs (station numbers) of the sites to be included in the retrieval. Each station number is specified on a separate line (record) within the file. Optionally, the beginning and ending dates for the retrieval period for each site may also be specified. The format for each record in an agency/site-ID file is described below.
Table 25: Agency/station identification file for retrieval
------------------------ Columns Description ------------------------ 1-5 Agency code 6-20 Station identification number 21-28 Beginning date (YYYYMMDD) to be retrieved. (Optional) 29-36 Ending date (YYYYMMDD to be retrieved. (Optional)
ADAPS NWIS User
184
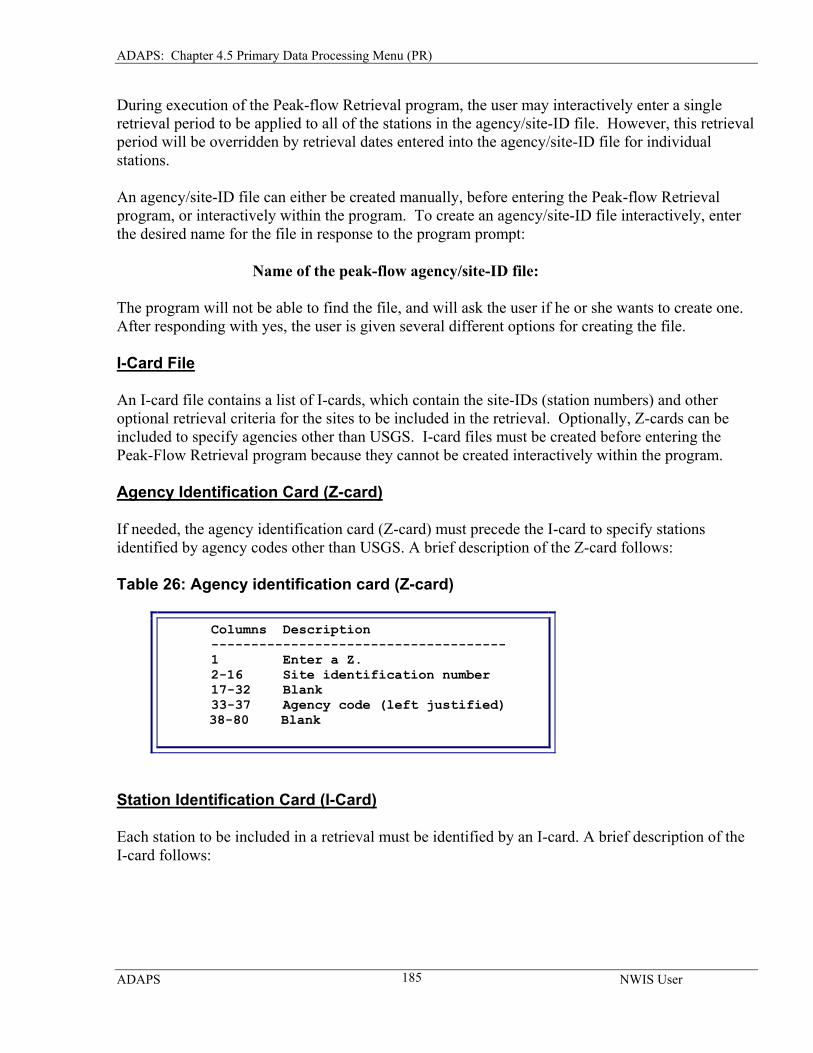
ADAPS: Chapter 4.5 Primary Data Processing Menu (PR)
During execution of the Peak-flow Retrieval program, the user may interactively enter a single retrieval period to be applied to all of the stations in the agency/site-ID file. However, this retrieval period will be overridden by retrieval dates entered into the agency/site-ID file for individual stations.
An agency/site-ID file can either be created manually, before entering the Peak-flow Retrieval program, or interactively within the program. To create an agency/site-ID file interactively, enter the desired name for the file in response to the program prompt:
Name of the peak-flow agency/site-ID file:
The program will not be able to find the file, and will ask the user if he or she wants to create one. After responding with yes, the user is given several different options for creating the file.
I-Card File
An I-card file contains a list of I-cards, which contain the site-IDs (station numbers) and other optional retrieval criteria for the sites to be included in the retrieval. Optionally, Z-cards can be included to specify agencies other than USGS. I-card files must be created before entering the Peak-Flow Retrieval program because they cannot be created interactively within the program.
Agency Identification Card (Z-card)
If needed, the agency identification card (Z-card) must precede the I-card to specify stations identified by agency codes other than USGS. A brief description of the Z-card follows:
Table 26: Agency identification card (Z-card)
Columns Description ------------------------------------- 1 Enter a Z. 2-16 Site identification number 17-32 Blank 33-37 Agency code (left justified) 38-80 Blank
Station Identification Card (I-Card)
Each station to be included in a retrieval must be identified by an I-card. A brief description of the I-card follows:
ADAPS NWIS User
185
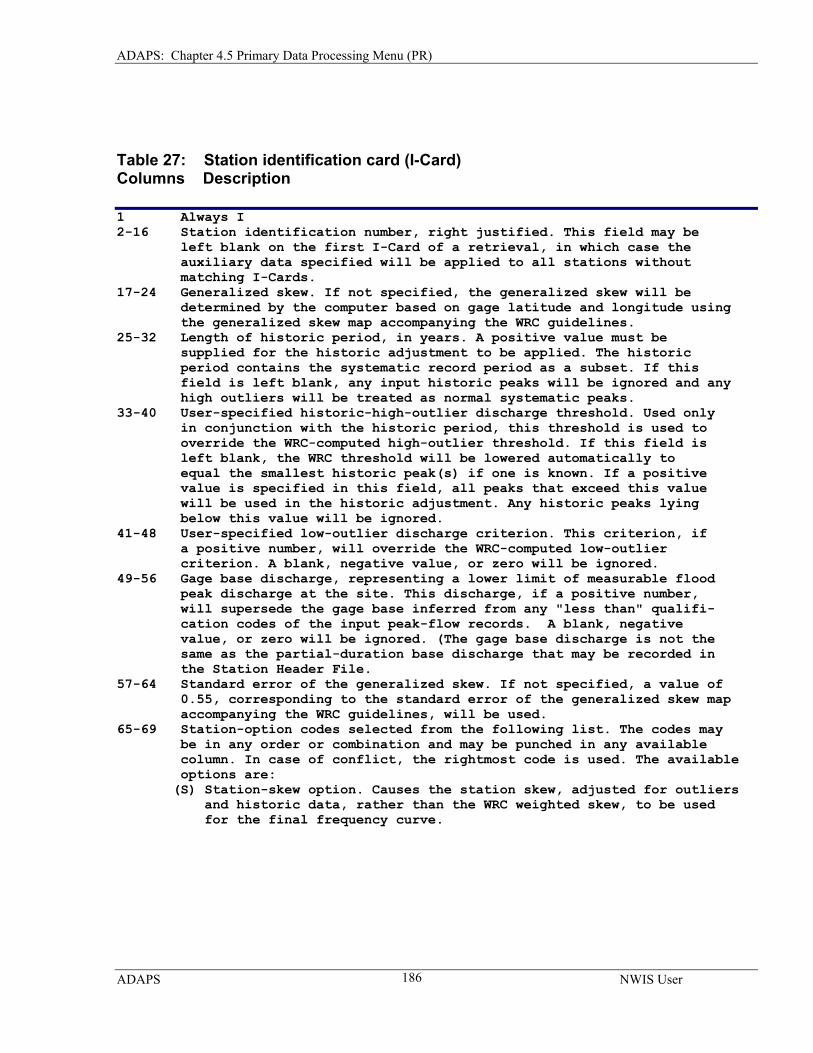
ADAPS: Chapter 4.5 Primary Data Processing Menu (PR)
Table 27: Station identification card (I-Card) Columns Description 1 Always I 2-16 Station identification number, right justified. This field may be left blank on the first I-Card of a retrieval, in which case the auxiliary data specified will be applied to all stations without matching I-Cards. 17-24 Generalized skew. If not specified, the generalized skew will be determined by the computer based on gage latitude and longitude using the generalized skew map accompanying the WRC guidelines. 25-32 Length of historic period, in years. A positive value must be supplied for the historic adjustment to be applied. The historic period contains the systematic record period as a subset. If this field is left blank, any input historic peaks will be ignored and any high outliers will be treated as normal systematic peaks. 33-40 User-specified historic-high-outlier discharge threshold. Used only in conjunction with the historic period, this threshold is used to override the WRC-computed high-outlier threshold. If this field is left blank, the WRC threshold will be lowered automatically to equal the smallest historic peak(s) if one is known. If a positive value is specified in this field, all peaks that exceed this value will be used in the historic adjustment. Any historic peaks lying below this value will be ignored. 41-48 User-specified low-outlier discharge criterion. This criterion, if a positive number, will override the WRC-computed low-outlier criterion. A blank, negative value, or zero will be ignored. 49-56 Gage base discharge, representing a lower limit of measurable flood peak discharge at the site. This discharge, if a positive number, will supersede the gage base inferred from any "less than" qualifi- cation codes of the input peak-flow records. A blank, negative value, or zero will be ignored. (The gage base discharge is not the same as the partial-duration base discharge that may be recorded in the Station Header File. 57-64 Standard error of the generalized skew. If not specified, a value of 0.55, corresponding to the standard error of the generalized skew map accompanying the WRC guidelines, will be used. 65-69 Station-option codes selected from the following list. The codes may be in any order or combination and may be punched in any available column. In case of conflict, the rightmost code is used. The available options are: (S) Station-skew option. Causes the station skew, adjusted for outliers and historic data, rather than the WRC weighted skew, to be used for the final frequency curve.
ADAPS NWIS User
186
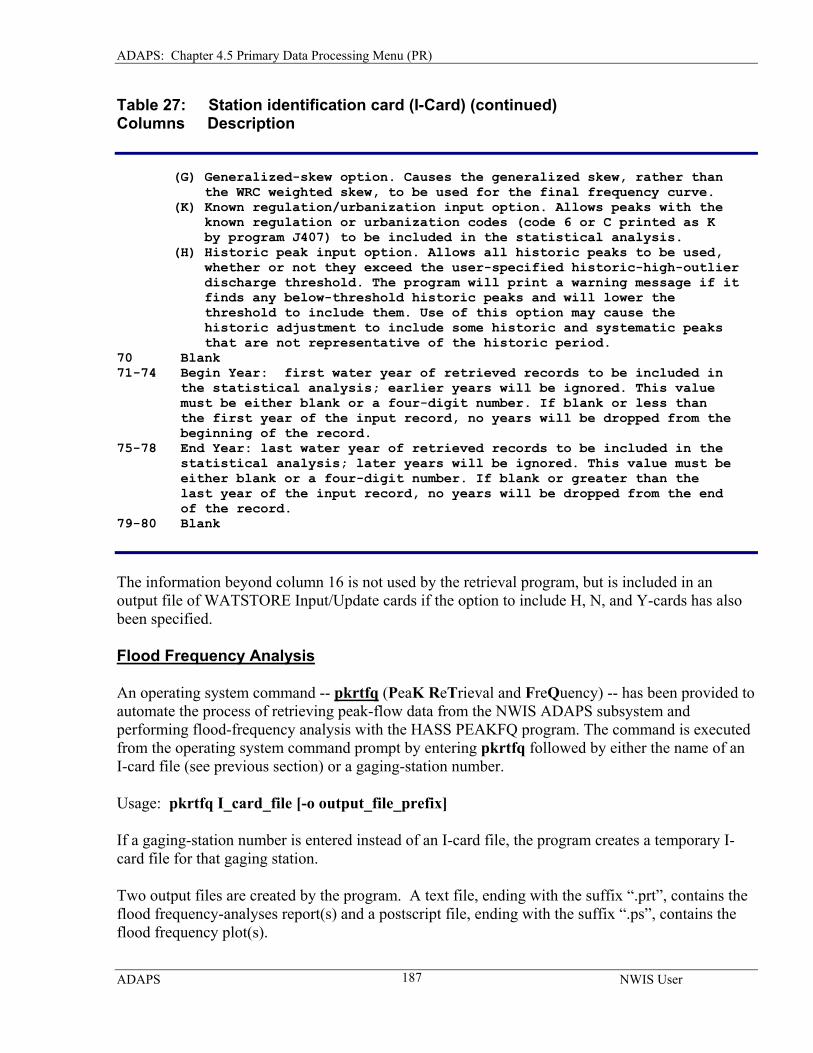
ADAPS: Chapter 4.5 Primary Data Processing Menu (PR)
Table 27: Station identification card (I-Card) (continued) Columns Description (G) Generalized-skew option. Causes the generalized skew, rather than the WRC weighted skew, to be used for the final frequency curve. (K) Known regulation/urbanization input option. Allows peaks with the known regulation or urbanization codes (code 6 or C printed as K by program J407) to be included in the statistical analysis. (H) Historic peak input option. Allows all historic peaks to be used, whether or not they exceed the user-specified historic-high-outlier discharge threshold. The program will print a warning message if it finds any below-threshold historic peaks and will lower the threshold to include them. Use of this option may cause the historic adjustment to include some historic and systematic peaks that are not representative of the historic period. 70 Blank 71-74 Begin Year: first water year of retrieved records to be included in the statistical analysis; earlier years will be ignored. This value must be either blank or a four-digit number. If blank or less than the first year of the input record, no years will be dropped from the beginning of the record. 75-78 End Year: last water year of retrieved records to be included in the statistical analysis; later years will be ignored. This value must be either blank or a four-digit number. If blank or greater than the last year of the input record, no years will be dropped from the end of the record. 79-80 Blank The information beyond column 16 is not used by the retrieval program, but is included in an output file of WATSTORE Input/Update cards if the option to include H, N, and Y-cards has also been specified.
Flood Frequency Analysis
An operating system command -- pkrtfq (PeaK ReTrieval and FreQuency) -- has been provided to automate the process of retrieving peak-flow data from the NWIS ADAPS subsystem and performing flood-frequency analysis with the HASS PEAKFQ program. The command is executed from the operating system command prompt by entering pkrtfq followed by either the name of an I-card file (see previous section) or a gaging-station number.
Usage: pkrtfq I_card_file [-o output_file_prefix]
If a gaging-station number is entered instead of an I-card file, the program creates a temporary I-card file for that gaging station.
Two output files are created by the program. A text file, ending with the suffix “.prt”, contains the flood frequency-analyses report(s) and a postscript file, ending with the suffix “.ps”, contains the flood frequency plot(s).
ADAPS NWIS User
187
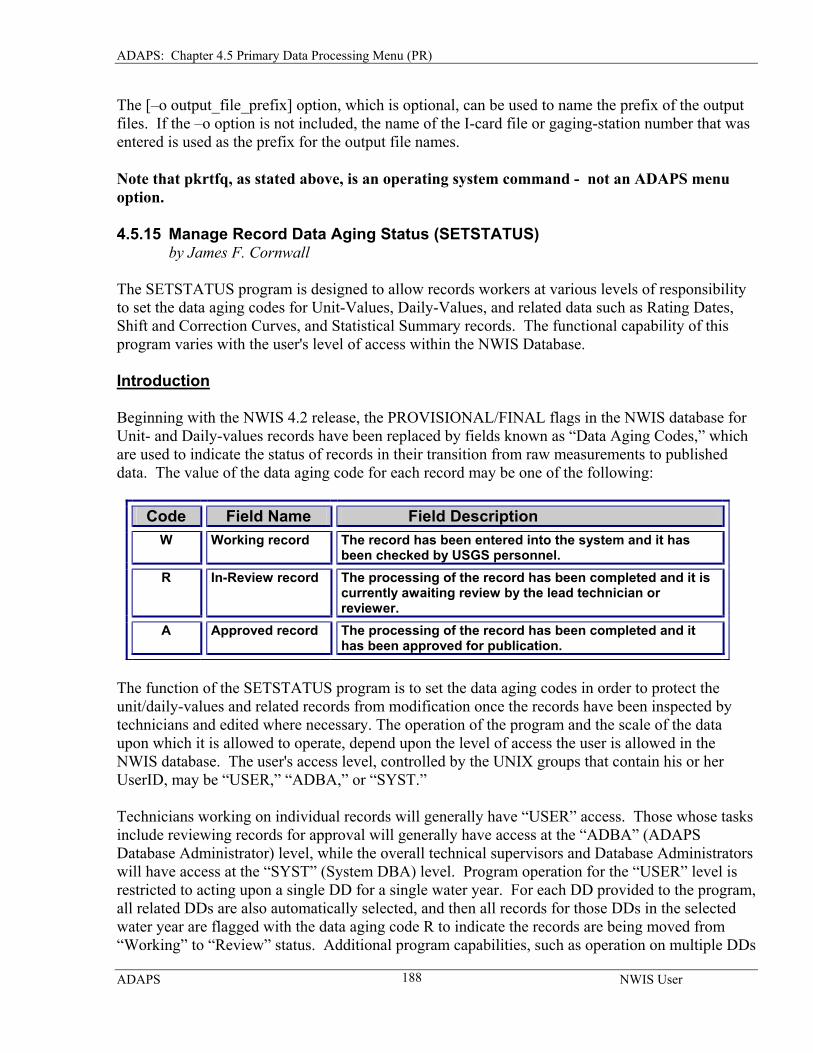
ADAPS: Chapter 4.5 Primary Data Processing Menu (PR)
The [–o output_file_prefix] option, which is optional, can be used to name the prefix of the output files. If the –o option is not included, the name of the I-card file or gaging-station number that was entered is used as the prefix for the output file names.
Note that pkrtfq, as stated above, is an operating system command - not an ADAPS menu option.
4.5.15 Manage Record Data Aging Status (SETSTATUS) by James F. Cornwall
The SETSTATUS program is designed to allow records workers at various levels of responsibility to set the data aging codes for Unit-Values, Daily-Values, and related data such as Rating Dates, Shift and Correction Curves, and Statistical Summary records. The functional capability of this program varies with the user's level of access within the NWIS Database. Introduction Beginning with the NWIS 4.2 release, the PROVISIONAL/FINAL flags in the NWIS database for Unit- and Daily-values records have been replaced by fields known as “Data Aging Codes,” which are used to indicate the status of records in their transition from raw measurements to published data. The value of the data aging code for each record may be one of the following:
Code Field Name Field Description W Working record The record has been entered into the system and it has
been checked by USGS personnel. R In-Review record The processing of the record has been completed and it is
currently awaiting review by the lead technician or reviewer.
A Approved record The processing of the record has been completed and it has been approved for publication.
The function of the SETSTATUS program is to set the data aging codes in order to protect the unit/daily-values and related records from modification once the records have been inspected by technicians and edited where necessary. The operation of the program and the scale of the data upon which it is allowed to operate, depend upon the level of access the user is allowed in the NWIS database. The user's access level, controlled by the UNIX groups that contain his or her UserID, may be “USER,” “ADBA,” or “SYST.” Technicians working on individual records will generally have “USER” access. Those whose tasks include reviewing records for approval will generally have access at the “ADBA” (ADAPS Database Administrator) level, while the overall technical supervisors and Database Administrators will have access at the “SYST” (System DBA) level. Program operation for the “USER” level is restricted to acting upon a single DD for a single water year. For each DD provided to the program, all related DDs are also automatically selected, and then all records for those DDs in the selected water year are flagged with the data aging code R to indicate the records are being moved from “Working” to “Review” status. Additional program capabilities, such as operation on multiple DDs
ADAPS NWIS User
188
ADAPS: Chapter 4.5 Primary Data Processing Menu (PR)
using ADAPS Groups and specifying time spans other than a single water year, are allowed at the “SYST” access level, as described in following sections. An example of “related DDs” is the Stage DD from which a Discharge DD is computed, or the Velocity DD used in velocity-type computations. In a velocity-computation setup, when any one of the DDs is specified for stage, velocity, or discharge, the other two DDs will be automatically selected as well. Data aging codes will be set for all related records in the affected database tables. The SETSTATUS program is also designed to perform database consistency checks before updating the records for the selected DDs. There are two checks performed, which are designed to prevent the movement of data into “Approved” status without making certain everything has been computed and stored in the correct sequence and using approved rating curves. The first check is performed on all data, regardless of the update operation. This check is a verification that any Rating Curves for the affected stations have an “Approved” status. The code will check each DD for Ratings, and if any are found which do not have a data aging code of A, the program will inform the user and stop execution so the problem can be corrected. The second consistency check is performed only when moving data from “Working” status into “Review” status. All the data for the selected DDs are scanned for modification date/times. The date/times for derived data (that which has been computed from other data -- for example, Daily-Values which are computed from the “computed” Unit-Values) are compared against the date/times for the appropriate source data. If any source data are found which are newer than the derived data, an error message is generated and the program will not perform any updates to the aging codes. This check ensures that if source data (Unit-Values, Shift Curves, etc.) are edited or altered in some way, the end products (Daily-Values) will not be set to “Approved” without having been updated to reflect the revised source data. NOTE: This second consistency check has been temporarily disabled in the SETSTATUS code in order to prevent problems encountered during cleanup of data transferred from NWIS 4_1. The checking will be reinstated once these cleanup issues have been resolved, and will be performed upon future aging-status updates. Program Operation To display properly, the user should have the terminal window set wide enough to show at least 132 columns. Use of a narrow window setting will produce badly formatted displays.
ADAPS NWIS User
189
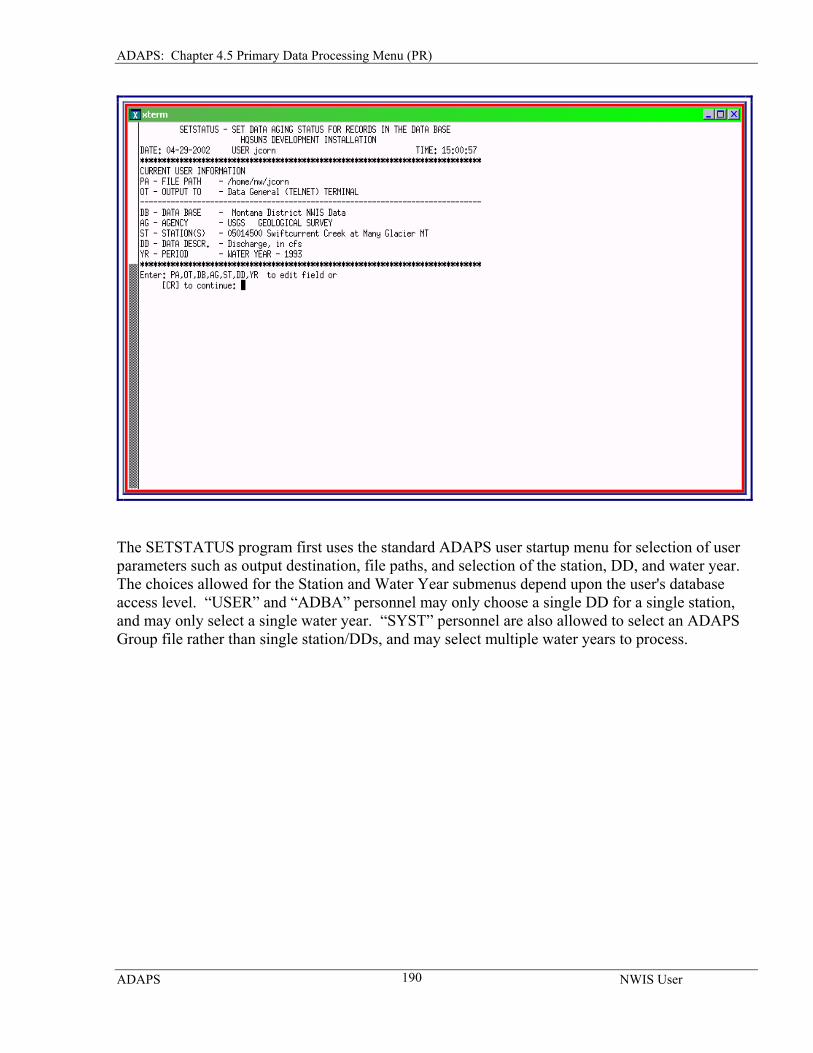
ADAPS: Chapter 4.5 Primary Data Processing Menu (PR)
The SETSTATUS program first uses the standard ADAPS user startup menu for selection of user parameters such as output destination, file paths, and selection of the station, DD, and water year. The choices allowed for the Station and Water Year submenus depend upon the user's database access level. “USER” and “ADBA” personnel may only choose a single DD for a single station, and may only select a single water year. “SYST” personnel are also allowed to select an ADAPS Group file rather than single station/DDs, and may select multiple water years to process.
ADAPS NWIS User
190
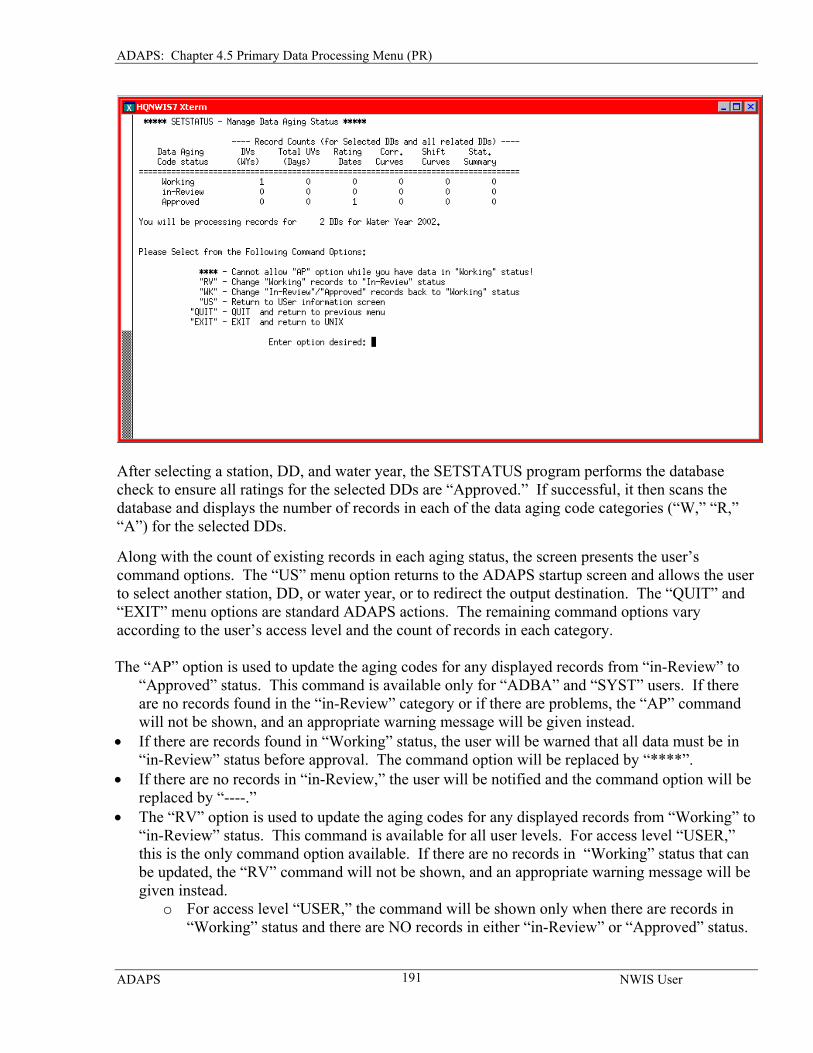
ADAPS: Chapter 4.5 Primary Data Processing Menu (PR)
After selecting a station, DD, and water year, the SETSTATUS program performs the database check to ensure all ratings for the selected DDs are “Approved.” If successful, it then scans the database and displays the number of records in each of the data aging code categories (“W,” “R,” “A”) for the selected DDs. Along with the count of existing records in each aging status, the screen presents the user’s command options. The “US” menu option returns to the ADAPS startup screen and allows the user to select another station, DD, or water year, or to redirect the output destination. The “QUIT” and “EXIT” menu options are standard ADAPS actions. The remaining command options vary according to the user’s access level and the count of records in each category. The “AP” option is used to update the aging codes for any displayed records from “in-Review” to
“Approved” status. This command is available only for “ADBA” and “SYST” users. If there are no records found in the “in-Review” category or if there are problems, the “AP” command will not be shown, and an appropriate warning message will be given instead.
• If there are records found in “Working” status, the user will be warned that all data must be in “in-Review” status before approval. The command option will be replaced by “****”.
• If there are no records in “in-Review,” the user will be notified and the command option will be replaced by “----.”
• The “RV” option is used to update the aging codes for any displayed records from “Working” to “in-Review” status. This command is available for all user levels. For access level “USER,” this is the only command option available. If there are no records in “Working” status that can be updated, the “RV” command will not be shown, and an appropriate warning message will be given instead.
o For access level “USER,” the command will be shown only when there are records in “Working” status and there are NO records in either “in-Review” or “Approved” status.
ADAPS NWIS User
191
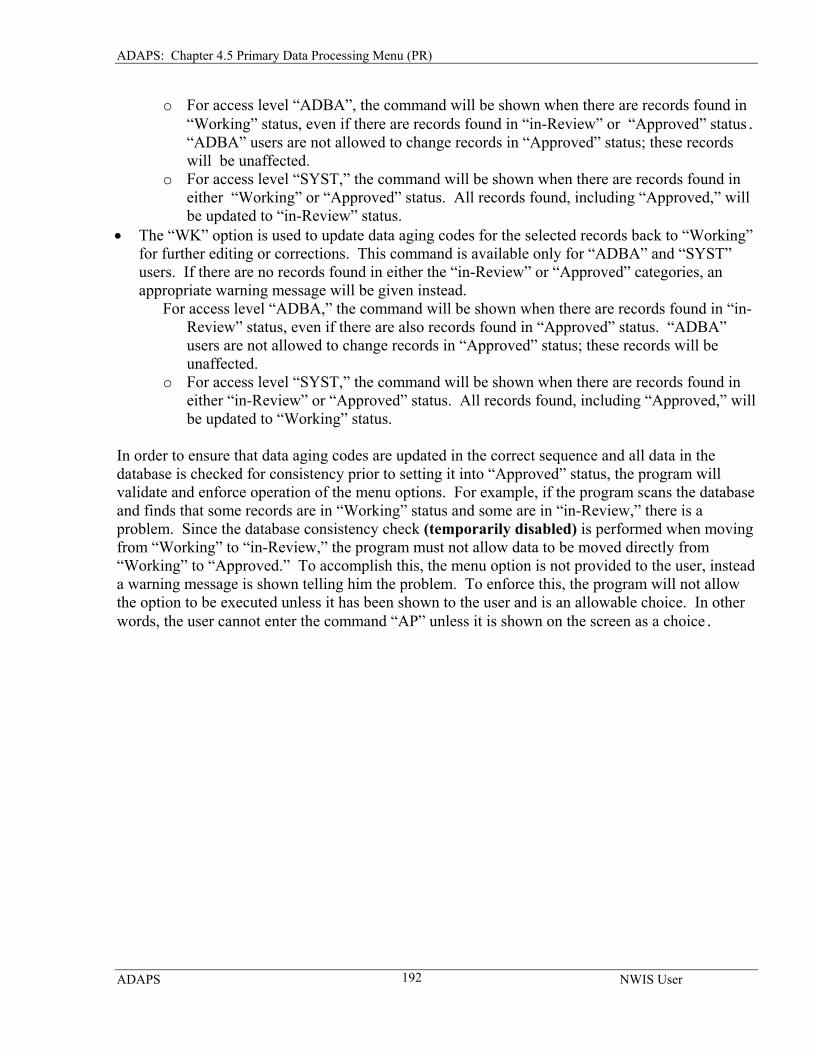
ADAPS: Chapter 4.5 Primary Data Processing Menu (PR)
o For access level “ADBA”, the command will be shown when there are records found in “Working” status, even if there are records found in “in-Review” or “Approved” status. “ADBA” users are not allowed to change records in “Approved” status; these records will be unaffected.
o For access level “SYST,” the command will be shown when there are records found in either “Working” or “Approved” status. All records found, including “Approved,” will be updated to “in-Review” status.
• The “WK” option is used to update data aging codes for the selected records back to “Working” for further editing or corrections. This command is available only for “ADBA” and “SYST” users. If there are no records found in either the “in-Review” or “Approved” categories, an appropriate warning message will be given instead.
For access level “ADBA,” the command will be shown when there are records found in “in-Review” status, even if there are also records found in “Approved” status. “ADBA” users are not allowed to change records in “Approved” status; these records will be unaffected.
o For access level “SYST,” the command will be shown when there are records found in either “in-Review” or “Approved” status. All records found, including “Approved,” will be updated to “Working” status.
In order to ensure that data aging codes are updated in the correct sequence and all data in the database is checked for consistency prior to setting it into “Approved” status, the program will validate and enforce operation of the menu options. For example, if the program scans the database and finds that some records are in “Working” status and some are in “in-Review,” there is a problem. Since the database consistency check (temporarily disabled) is performed when moving from “Working” to “in-Review,” the program must not allow data to be moved directly from “Working” to “Approved.” To accomplish this, the menu option is not provided to the user, instead a warning message is shown telling him the problem. To enforce this, the program will not allow the option to be executed unless it has been shown to the user and is an allowable choice. In other words, the user cannot enter the command “AP” unless it is shown on the screen as a choice.
ADAPS NWIS User
192
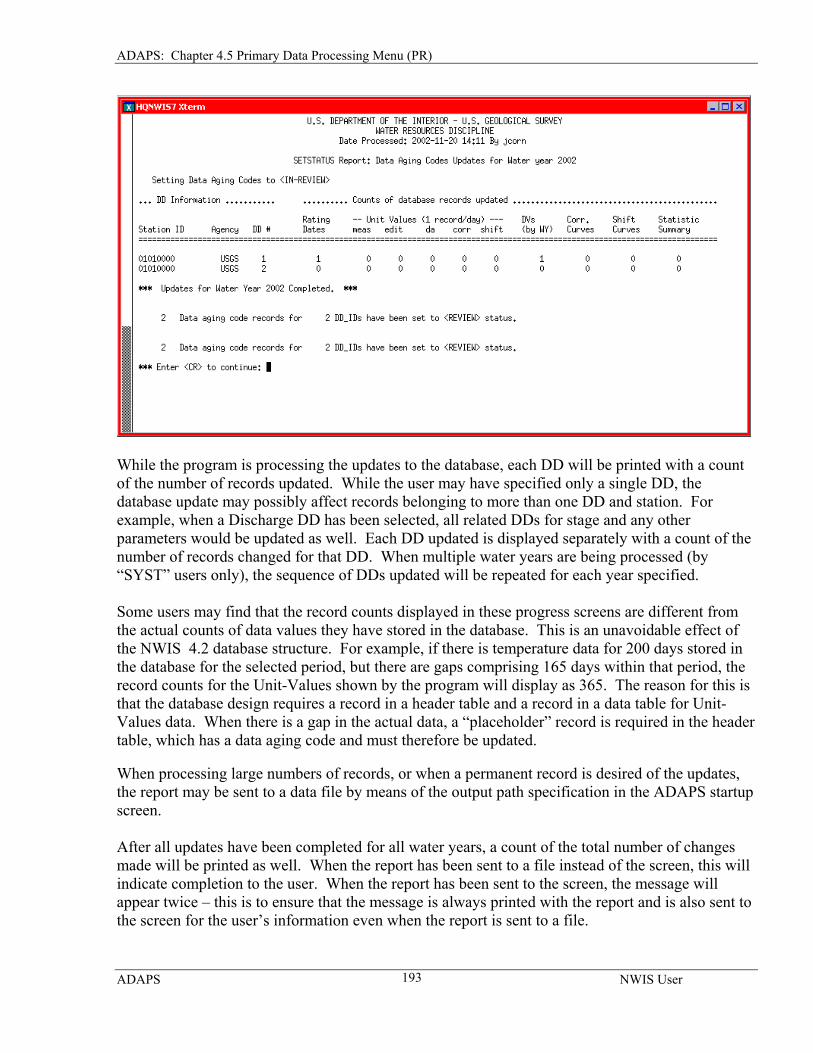
ADAPS: Chapter 4.5 Primary Data Processing Menu (PR)
While the program is processing the updates to the database, each DD will be printed with a count of the number of records updated. While the user may have specified only a single DD, the database update may possibly affect records belonging to more than one DD and station. For example, when a Discharge DD has been selected, all related DDs for stage and any other parameters would be updated as well. Each DD updated is displayed separately with a count of the number of records changed for that DD. When multiple water years are being processed (by “SYST” users only), the sequence of DDs updated will be repeated for each year specified. Some users may find that the record counts displayed in these progress screens are different from the actual counts of data values they have stored in the database. This is an unavoidable effect of the NWIS 4.2 database structure. For example, if there is temperature data for 200 days stored in the database for the selected period, but there are gaps comprising 165 days within that period, the record counts for the Unit-Values shown by the program will display as 365. The reason for this is that the database design requires a record in a header table and a record in a data table for Unit- Values data. When there is a gap in the actual data, a “placeholder” record is required in the header table, which has a data aging code and must therefore be updated. When processing large numbers of records, or when a permanent record is desired of the updates, the report may be sent to a data file by means of the output path specification in the ADAPS startup screen. After all updates have been completed for all water years, a count of the total number of changes made will be printed as well. When the report has been sent to a file instead of the screen, this will indicate completion to the user. When the report has been sent to the screen, the message will appear twice – this is to ensure that the message is always printed with the report and is also sent to the screen for the user’s information even when the report is sent to a file.
ADAPS NWIS User
193
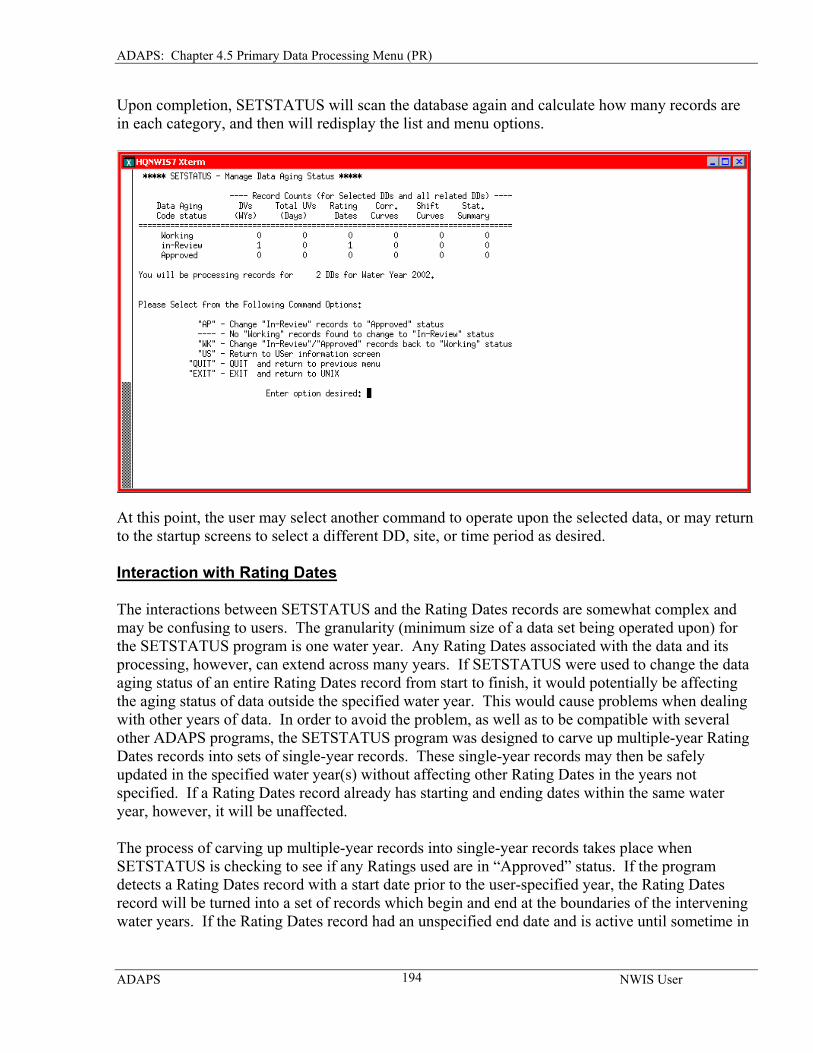
ADAPS: Chapter 4.5 Primary Data Processing Menu (PR)
Upon completion, SETSTATUS will scan the database again and calculate how many records are in each category, and then will redisplay the list and menu options.
At this point, the user may select another command to operate upon the selected data, or may return to the startup screens to select a different DD, site, or time period as desired. Interaction with Rating Dates The interactions between SETSTATUS and the Rating Dates records are somewhat complex and may be confusing to users. The granularity (minimum size of a data set being operated upon) for the SETSTATUS program is one water year. Any Rating Dates associated with the data and its processing, however, can extend across many years. If SETSTATUS were used to change the data aging status of an entire Rating Dates record from start to finish, it would potentially be affecting the aging status of data outside the specified water year. This would cause problems when dealing with other years of data. In order to avoid the problem, as well as to be compatible with several other ADAPS programs, the SETSTATUS program was designed to carve up multiple-year Rating Dates records into sets of single-year records. These single-year records may then be safely updated in the specified water year(s) without affecting other Rating Dates in the years not specified. If a Rating Dates record already has starting and ending dates within the same water year, however, it will be unaffected. The process of carving up multiple-year records into single-year records takes place when SETSTATUS is checking to see if any Ratings used are in “Approved” status. If the program detects a Rating Dates record with a start date prior to the user-specified year, the Rating Dates record will be turned into a set of records which begin and end at the boundaries of the intervening water years. If the Rating Dates record had an unspecified end date and is active until sometime in
ADAPS NWIS User
194
ADAPS: Chapter 4.5 Primary Data Processing Menu (PR)
the future, a record will also be created with a start date in the next water year from the one specified, and an end date in the year 2382. For example, if a technician is updating data for WY 2002, and there is a Rating applied to the data with a Rating Dates start date of 01 January 1999, time 12:00:00, and no end date, the program will take the single Rating Date record and create the following Rating Dates records:
• (WY 99) A record starting at 01/01/1999 12:00:00 and ending at 09/30/1999 23:59:59 • (WY 00) A record starting at 10/01/1999 00:00:00 and ending at 09/30/2000 23:59:59 • (WY 01) A record starting at 10/01/2000 00:00:00 and ending at 09/30/2001 23:59:59 • (WY 02) A record starting at 10/01/2001 00:00:00 and ending at 09/30/2002 23:59:59 • (WY 03+) A record starting at 10/01/2002 00:00:00 and ending at 12/31/2382 00:00:00
Records created from the original record will have the same data aging status as the original. If the original record was in “Approved” status, the newly created records will also be “Approved.” The record for WY 2002 will then be updated by SETSTATUS along with any other data. The data aging status of the final record extending into the future, however, will always be set to “Working” status. This is necessary to allow other programs to process, edit, and manipulate data as it comes into the system. The segmentation of multiple-year records into sets of single-year records will only be done the first time such a record is encountered by SETSTATUS. Any subsequent checks will find only the segmented records, and nothing will be done to any records outside the specified water year. 4.5.16 Plot Time-Series Data
For more information on Plot Time-Series Data see Section 4.7.4.
4.5.17 Show Site Information by Colleen A. Babcock
The Primary Processing Menu Option “Show Site Information,” runs the routine showsite, which produces a list of the contents of the Site File for selected sites. If the output is selected to go to a file, the program asks for the output file name; if no file name is entered, the output will be put into a file named SITE_FILE. The output can also be directed to the screen. The user is then asked if station numbers will be entered from the terminal. A maximum of 400 station numbers are accepted; if more than 400 are submitted, only the first 400 will be used. If the station numbers are entered from the terminal, a blank line is displayed. Enter the five-character agency code (a blank space will follow if a four-character agency code is entered) and the station number. Depending on the agency code and length of station number, the input would look like the following example: USGS 01123456 USEPA01123457 USGS 390000110200001
ADAPS NWIS User
195
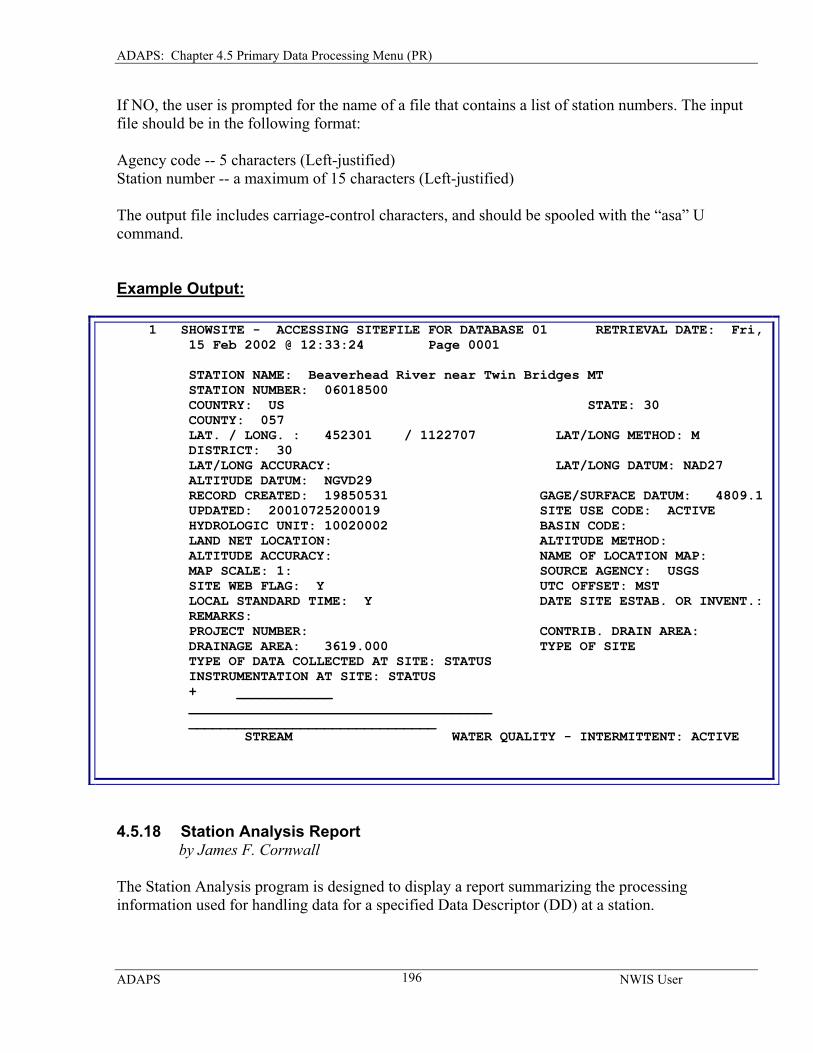
ADAPS: Chapter 4.5 Primary Data Processing Menu (PR)
If NO, the user is prompted for the name of a file that contains a list of station numbers. The input file should be in the following format: Agency code -- 5 characters (Left-justified) Station number -- a maximum of 15 characters (Left-justified) The output file includes carriage-control characters, and should be spooled with the “asa” U command. Example Output:
1 SHOWSITE - ACCESSING SITEFILE FOR DATABASE 01 RETRIEVAL DATE: Fri, 15 Feb 2002 @ 12:33:24 Page 0001 STATION NAME: Beaverhead River near Twin Bridges MT STATION NUMBER: 06018500 COUNTRY: US STATE: 30 COUNTY: 057 LAT. / LONG. : 452301 / 1122707 LAT/LONG METHOD: M DISTRICT: 30 LAT/LONG ACCURACY: LAT/LONG DATUM: NAD27 ALTITUDE DATUM: NGVD29 RECORD CREATED: 19850531 GAGE/SURFACE DATUM: 4809.1 UPDATED: 20010725200019 SITE USE CODE: ACTIVE HYDROLOGIC UNIT: 10020002 BASIN CODE: LAND NET LOCATION: ALTITUDE METHOD: ALTITUDE ACCURACY: NAME OF LOCATION MAP: MAP SCALE: 1: SOURCE AGENCY: USGS SITE WEB FLAG: Y UTC OFFSET: MST LOCAL STANDARD TIME: Y DATE SITE ESTAB. OR INVENT.: REMARKS: PROJECT NUMBER: CONTRIB. DRAIN AREA: DRAINAGE AREA: 3619.000 TYPE OF SITE TYPE OF DATA COLLECTED AT SITE: STATUS INSTRUMENTATION AT SITE: STATUS + ____________ ______________________________________ _______________________________ STREAM WATER QUALITY - INTERMITTENT: ACTIVE
4.5.18 Station Analysis Report by James F. Cornwall
The Station Analysis program is designed to display a report summarizing the processing information used for handling data for a specified Data Descriptor (DD) at a station.
ADAPS NWIS User
196
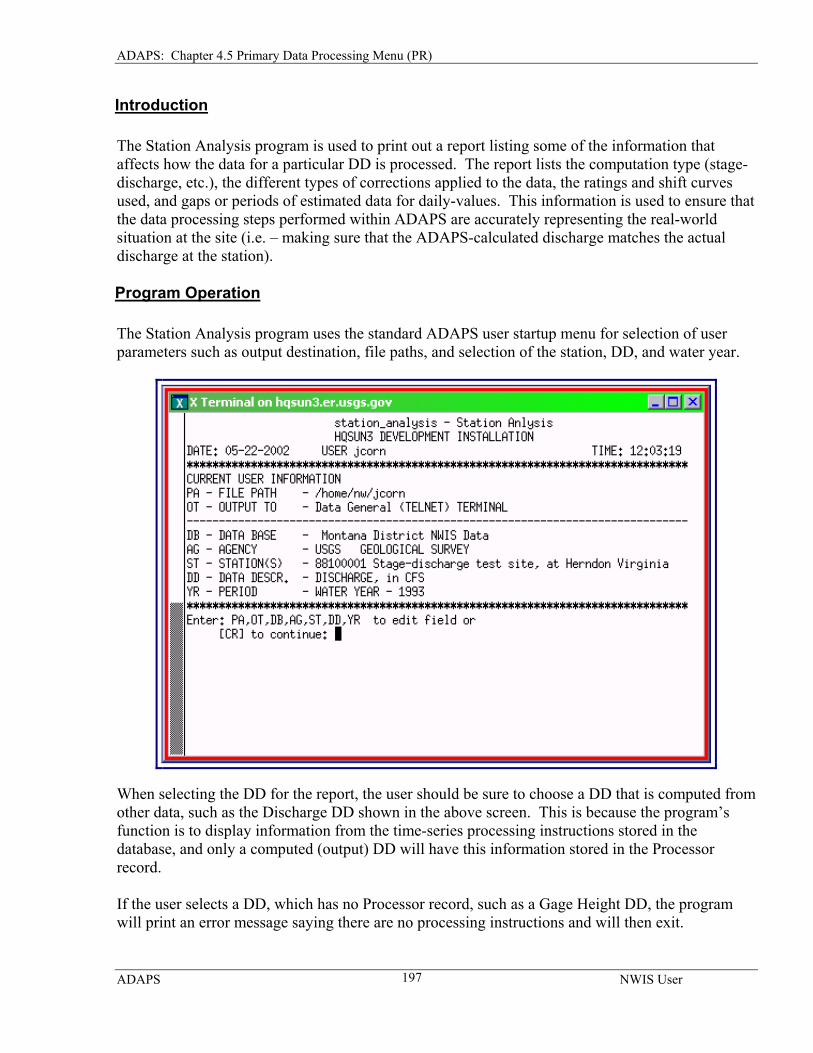
ADAPS: Chapter 4.5 Primary Data Processing Menu (PR)
Introduction The Station Analysis program is used to print out a report listing some of the information that affects how the data for a particular DD is processed. The report lists the computation type (stage-discharge, etc.), the different types of corrections applied to the data, the ratings and shift curves used, and gaps or periods of estimated data for daily-values. This information is used to ensure that the data processing steps performed within ADAPS are accurately representing the real-world situation at the site (i.e. – making sure that the ADAPS-calculated discharge matches the actual discharge at the station).
Program Operation The Station Analysis program uses the standard ADAPS user startup menu for selection of user parameters such as output destination, file paths, and selection of the station, DD, and water year.
When selecting the DD for the report, the user should be sure to choose a DD that is computed from other data, such as the Discharge DD shown in the above screen. This is because the program’s function is to display information from the time-series processing instructions stored in the database, and only a computed (output) DD will have this information stored in the Processor record. If the user selects a DD, which has no Processor record, such as a Gage Height DD, the program will print an error message saying there are no processing instructions and will then exit.
ADAPS NWIS User
197
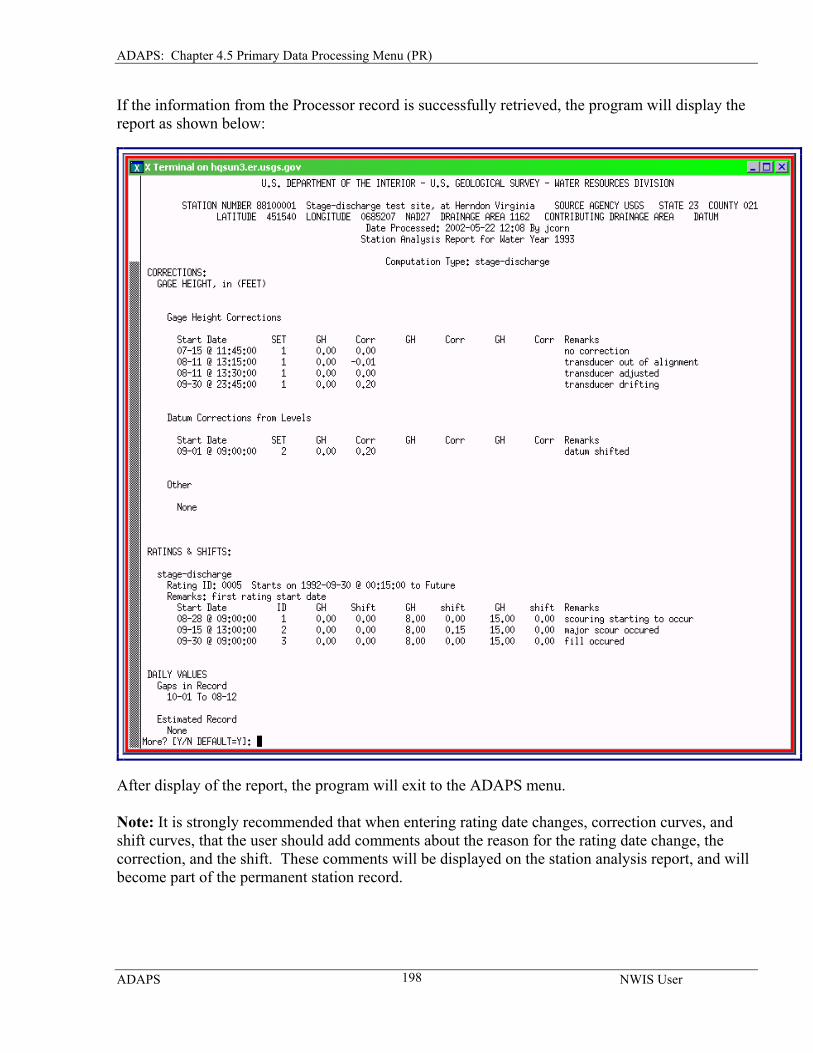
ADAPS: Chapter 4.5 Primary Data Processing Menu (PR)
If the information from the Processor record is successfully retrieved, the program will display the report as shown below:
After display of the report, the program will exit to the ADAPS menu. Note: It is strongly recommended that when entering rating date changes, correction curves, and shift curves, that the user should add comments about the reason for the rating date change, the correction, and the shift. These comments will be displayed on the station analysis report, and will become part of the permanent station record.
ADAPS NWIS User
198