42L84NE8251 2.14898 METCALFE LAKE 010 REPORT ON ...
19
\ e/ 1 . EM: 42L84NE8251 2.14898 METCALFE LAKE 010 REPORT ON GEOPHYSICAL SURVEYS IN THE METCALFE LAKE AREA by F EB O 4 1993 Walter Yzerdraat ^^ ^ ^^ THE CLAIMS covered by these surveys lie approximately midway between a zone of gold showings on the northerly claim TB 1005015 and the southwesterly claims TB 759638 et al, where auriferous samples were collected in 1986 and following years. The aim of the work is to ascertain whether the drift-cohered area between these two zones contains strata or horizons which may indicate a stratigraphic connection. LOCATION AND ACCESS THE METCALFE LAKE area is approximately seven kilometres south of the CNR Transcontinental Line through Nakina and Armstrong, and 80 km north of the northern route of the Trans-Canada Highway, locally represented by King's Highway number 11. From the latter highway, at a point 7 km east of Jellicoe, the Kinghorn Road leads north to a system of interconnected hauling roads that has seen heavy traffic in all seasons over the past ten years. This system, now collectively known as 'The Kinghorn', provides con venient vehicle access to the Metcalfe Lake property, through which the hauling road crosses over a distance of almost six kilometres. Although the road distance from Highway 11 is about 80 km, the air distance is only 58 km, from Roland Lake near Jellicoe to Metcalfe Lake in the eastern part of the Metcalfe-McDonough property. Bush planes can also be chartered from Cordingley Lake near Nakina, from where the air distance to Metcalfe Lake is 72 km in a westerly direc tion. As the hauling road system now extends north to Tashota on the CNR line, combined road-rail access is also possible.
Transcript of 42L84NE8251 2.14898 METCALFE LAKE 010 REPORT ON ...
\
e/1 .EM:
42L84NE8251 2.14898 METCALFE LAKE 010
REPORT ON GEOPHYSICAL SURVEYS IN THE
METCALFE LAKE AREA
by F EB O 4 1993
Walter Yzerdraat ^^
THE CLAIMS covered by these surveys lie approximately midway between
a zone of gold showings on the northerly claim TB 1005015 and the
southwesterly claims TB 759638 et al, where auriferous samples were
collected in 1986 and following years.
The aim of the work is to ascertain whether the drift-cohered
area between these two zones contains strata or horizons which may
indicate a stratigraphic connection.
LOCATION AND ACCESS
THE METCALFE LAKE area is approximately seven kilometres south of
the CNR Transcontinental Line through Nakina and Armstrong, and 80
km north of the northern route of the Trans-Canada Highway, locally
represented by King's Highway number 11.
From the latter highway, at a point 7 km east of Jellicoe, the
Kinghorn Road leads north to a system of interconnected hauling roads
that has seen heavy traffic in all seasons over the past ten years.
This system, now collectively known as 'The Kinghorn', provides con
venient vehicle access to the Metcalfe Lake property, through which
the hauling road crosses over a distance of almost six kilometres.
Although the road distance from Highway 11 is about 80 km, the
air distance is only 58 km, from Roland Lake near Jellicoe to Metcalfe
Lake in the eastern part of the Metcalfe-McDonough property. Bush
planes can also be chartered from Cordingley Lake near Nakina, from
where the air distance to Metcalfe Lake is 72 km in a westerly direc
tion.
As the hauling road system now extends north to Tashota on the
CNR line, combined road-rail access is also possible.

GENERAL GEOLOGY
SINCE THE PUBLICATION of the Hopkins reports in the OEM Annual Re
port of 1917, several provincial geologists have elucidated the
regional geology of the Beardmore-Tashota Greenstone Belt which is
the north-south link connecting two parallel strands of the eastern
Wabigoon metavolcanic-metasedimentary belt. The report by T.L. Gled
hill appeared in the ODM Annual Report of 1925 and that by L.F.
Kindle in the ODM Annual Reports of 1931. More recently the S.E.
Amukun paper was published in the OGS Series under Number 167 (1977).
Various views of the nature of the belt have been advanced. The
present author considers it to be similar to the South-African 'mobile
belts' which connect the stable cratonic areas which once were inde
pendent small lithospheric plates or 'microcontinents' that accreted
to form the present continents.
The Beardmore-Tashota Belt is flanked by older granitic areas
and pierced by granitic plutons of younger age, as well as cut by
diabase dikes of at least two generations, as seen in the Metcalfe
Lake Area. Metasedimentary units are mainly derived from the older
mafic volcanics; in many cases they host iron formation horizons and
larger units, but the latter are mainly confined to the east-west
northerly portion of the Wabigoon, generally known as the Tashota-
0'Sullivan Lake belt. However, a major arm of the Paska-Suni Iron
Range extends southward into the Metcalfe Lake area; this may be an
indication that the same hydrothermal processes were active in both
areas - as they should be expected to be if the microcontinent hypo
thesis is a valid one.
ECONOMIC GEOLOGY
When the Metcalfe Lake Area first became accessible in the period
1909-1913, when the Transcontinental Railroad was built through the
Tashota region, the first gold discoveries were not far behind.
After the cutting of a government meridian from the townships in
the Beardmore-Geraldton Belt to the townships in the Tashota-Nakina
area (1916), more prospectors arrived along this line, which cuts
through the most easterly bays of Metcalfe Lake. This led to more
discoveries, not only in the areas north and south of the railway
}racks, but east and west of the Phillips and Benner meridian as well.
Only a few of the finds, were developed into mines, such as the
Wascanna east of Tashota, and the Onaman-Tashota on the Onaman River.
Base metals never played a manor role in the economic activity, al
though the ore deposits at both mines have yielded some copper or lead.
Apparently, the depositional conditions in this belt have not been
conducive to the formation of massive sulphide deposits, and so far
gold has accounted for well over ninety percent of the dollar value
of all the ore extracted here.
Interest in gold virtually died in the late forties, and the town
of Tashota went into a decline that ended with its total abandonment
around 1976 when the last permanent resident died. Meanwhile, the
exploration activity in the Beardmore-Tashota belt picked up con
siderably, stimulated by the prospect of better returns on the money "
invested in gold ventures. Various companies, among which Phelps-
Dodge, Hollinger-Argus, Amax, Noranda and Teck, returned to the area
south of Tashota, or took an active interest in it, at various times
since the early seventies. Due to the present economic malaise and
the listless gold market, the major participants have pulled out; only
some individuals and junior companies are still active. Despite this,
however, the present author considers the Beardmore-Tashota belt, and
more particularly the Metcalfe Lake Area, a good bet, and expects the
exploration activity to rebound once the current depression is over.
PREVIOUS WORK
THE AUTHOR STAKED HIS first two claims on McDonough Lake, west of
Metcalfe Lake, in 1968. The property has since been expanded to cover
much ground to the north, east and south of McDonough, so as to safe
guard control of the localities from which the first gold-bearing
samples were taken during the following years. In 1983-84, the 38
claims of which the property then consisted were transferred to an
Ontario company established by the author; subsequently, a similar
number of new claims have been staked and are now held individually.
The first systematic survey on a grid system was done in February
of 1976 on Metcalfe Lake, where the structural trend justified a base
line striking 54 degrees east of north; this work was reported to the

.Ministry as the grid was being extended on land and more geophysical,
'geological and geochemical surveys were conducted over the following
years.
By the time the Metcalfe Lake grid was completed, it had become
clear that a separate baseline, with a trend considerably closer to
the north-south direction, would be appropriate for the western half
of the claim group, but the limited availability of financing and
conflicts with logging interests resulted in this work being postponed
until the late summer of 1990.
Meanwhile the claim group had been expanded to well over sixty
claims, half of which were held by the author individually, the
other half having been transferred to Callisto Minerals in 1984.
In 1987 it briefly appeared as if the corporate approach was going to
bring results, when an agreement was struck with a Vancouver-based
company for more advanced exploration. The stock market collapse of
late 1987, following on the heels of the break-up of the option agree
ment, dashed all hopes for an accelerated development.
In the course of the intervening years, manual, mechanical, ana
lytical and petrographic work has been performed, and in July of '87
an airborne survey with magnetic and electromagnetic instruments was
flown over the property. Reports on these activities are in the
assessment files of the Ministry.
THE GRID
WORK ON THE new (or 'Northern') baseline was started in August, 1990.
This line was set up in such a way that its extension southward would
result in an intercept with the old Auxiliary Baseline 800 m NW at
the point where old Line 80 intersects that ABL. That point was
reached in early June, 1992, and later on, the same year, the new
baseline (called NBL) was extended southward and eventually, in
October, reached the old Main Baseline (MBL) at the point where old
Line 124 crosses the MBL. Wing lines were set up at 100-metre inter
vals at such points that Line SON will cross the NBL at the same point
where old Line 80 intersects the old ABL 800 NW. A number of these
wing lines have now been cut to varying lengths (ranging from 250 to
1500 metres).
The azimuth of the new baseline is 018; hence the traverse lines,

at a right angle to the NBL, strike 72 degrees west of north; this is the ideal direction in the northern part and in the westerly
zone of the property. A further southerly extension of the baseline, now 4 km long, would bring it into an area where the lines of the old
grid are quite satisfactory, and therefore no such development is
considered necessary.
The numbering of the traverse lines of the new grid links it with
the old grid in such a manner that the coordinates of a point in
terms of the new grid can be converted into coordinates in terms of
the old grid by applying a simple formula: if the entire new grid were rotated over 36O degrees in the clockwise sense, around the point
where the new baseline intersects the old ABL 800 NW at station 80 on old Line 80, then the NBL would coincide with ABL 800 NW. Under
standably, the traverse line to be set up and cut at a right angle to the NBL at that centre of rotation has been designated as Line SON, and the point on that line where it intersects ABL 800 NW is also numbered 'station 80'.
The station interval in both systems is 25 metres, and the distance
of 25 metres has been adopted as the 'grid unit 1 in both systems. In
simple terms, this means that the station numbers increase by l, going
in a northwesterly direction, and the line numbers increase by 4, going in a southwesterly direction along the baseline, because the wing
lines are spaced 4 times 25 metres apart.
Although grid lines may be cut on backsight for the last half of their intended length, all initial work is done under theodolite con
trol in order to minimize the chance of developing large discrepan
cies between the actual and the theoretical position of any station on a line. The result, over the years, has been that most lines end up.within a metre of their intended termination point, and that dis crepancies in excess of two metres are extremely rare.
THE EM SURVEY
AN ELECTROMAGNETIC survey which utilizes the signal of one or more of the three still-operating US naval VLF transmitters, which are located
in the states of Maine, Maryland and Washington, is of limited use-
fulness in terrain with structural/stratigraphic trends deviating by
more than 45O from the geographical azimuth of any of these trans
mitters. If these azimuths were spread evenly around the compass,
that one could always chose a transmitter/would make an angle of 30O or less with local strikes, but unfortunately, for most of central
Canada, and especially the part of that region south of latitude 50O , there is little or no difference between the transmitter in Maine
(NAA near Cutler) and the one in Washington (NLK near Seattle), as their azimuths fall on almost the same line (although there is a diffe rence of some 180 degrees between the direction in which the instru ment 'sees' the two transmitters, there is no practical significance to that difference in the way the instrument responds to the signals).
Under those circumstances, there is only a choice between NSS near Annapolis in Maryland on the one hand, and either NAA or NLK on the -
other.
The Metcalfe Lake Area is one of the localities where neither choice is a very good one. And as long as there is no government or
cooperative initiative to provide an appropriate signal direction by
means of a mobile transmitter, the less-than-affluent private prospec
tor is at a disadvantage versus the large, profitable corporation which can afford the rental or purchase of the required equipment.
All this having been said, the VLF-EM survey performed in October of 1992 on the western claims of the Metcalfe Lake property serves to
illustrate the fact that limited usefulness is not necessarily syno nymous with uselessness.
The instrument used in this survey, an EM16 unit made by GEONICS, is capable of providing four types of data, of which, in most routine surveys, only two are recorded and utilized. The other two are not easy to obtain: the instrument is not equipped with an alidade, nor with a signal strengti monitor. The function of the alidade would be to measure the angle between the apparent transmitter azimuth (which is found when, in preparation for the next measurement, the instrument
is held horizontal and slowly swung around to determine the attitude in which the audio signal reaches a minimum) and the direction of the
grid line on which the measurements are being made. This angle fluc
tuates considerably as the observer approaches a conductor; the obser
vable variation is due to the effect of current channeling by the con
ductor. The other variable, namely, the signal strength, is more
difficult to monitor without electronic devices, and this is not the

to elaborate on its causes and its significance.
In addition to the recording of the apparent azimuth with respect
to the traverse line (it can be done by simply inscribing a set of
radiating lines on the housing of the instrument) , there is another
technique which may throw light on the location of conductors outside
the scope of the grid lines traversed.
In the survey itself, no direct evidence of such an 'outside'
conductor may show up on any particular traverse line, but there may
be a similarity in the profiles of the tilt (inclination angle) .
along several lines. In cases where an outside conductor is suspected
to be the cause, it may pay to link the tilt readings on two or more
lines across the intervening space .. and, if there
is a trend in those readings similar to the one seen in conventional
situations when approaching, or moving away from, a conductor encoun-r
tered on a single grid line, then there is a probability that the sus
pected conductor may be found by moving in the direction of increasing
positive (or decreasingly negative) inclination figures.
Contouring of the Fraser- filter values can be of great help, but
in the case of 'poor coupling 1 - i.e. where the traverse lines do not
run at a right angle to the transmitter azimuth, or where the local
structural trend does not lend itself very well to analysis with the
help of the available signal directions - such contour plots make
little sense: no clear-cut pattern seems to emerge, or worse, one
does but is utterly misleading. No decision to drill should be taken
on the strength of 'promising EM indications' alone.
CONCLUSIONS AND RECOMMENDATIONS - EM
IN THE SURVEY HEREBY reported, the measurements of tilt and quadrature
along the lines are bland and monotonous, and the attempts to contour
the Fraser derivatives of the tilt do not result in a clear pattern.
A somewhat more sophisticated approach indicates the possibility that
a major conductor is present to the southwest of the area surveyed,
and that there may also be minor conductors in small areas between
lines 112N and 116N, as well as at a short distance south of line 116M.
The presence of a fairly strong conductor beyond the present western
termination of Line 108N can be suspected by inspection of the profile
along that line alone.

These possibilities are all the more interesting from an economic point of view in light of the finding that, with minor exceptions, the tilt values on all lines are negative, whereas the quadrature figures are invariably positive. This combination of opposites usually indicates that the conductivity is due to the presence of a body in which electric charges can move in the form of free electrons, rather
than being transported by ions. Examples of this machanism are gra phite, many sulphides, and certain oxides. As gold occurrences else
where on the property, in localities considered to be 'on strike 1 with the area of the present survey, appear to be associated with horizons
of magnetite-rich iron formation, and as, moreover, an aim of the
present survey is to ascertain whether or not the showings on the
northerly claims are stratigraphically related to those on the south western claims, the development of additional new grid lines and the ?
continuation of the VLF-EM survey (and other surveys) are highly ad visable.
A combined program of EM and magnetic methods may enable us to establish whether the marker zone of iron deposition does, or does not, continue beneath the deep overburden of the westerly claims. Furthermore, the integration of magnetic and radiometric methods may be helpful in identifying localities where bedrock is relatively close to the present land surface.
If both goals seem to be met, then ways should be considered to
sample, or expose, the underlying rock formations.
THE MAGNETOMETER SURVEY
PERUSAL OF MAP M12-ML reveals no striking features other than a small,
modest high on Line 116N just east of the NBL. The steep gradient on
either flank of this anomaly is of some significance for evaluation of the overburden depth.
If we disregard the way this anomaly is contoured as a feature
restricted to the line on which it occurs, leaving open the possibility of a southerly continuation, and look, instead in a northerly direction,
we note that modest highs occur on the baseline and on Line 112N just
east of the baseline , while the readings on Line 108N just west of the baseline are the highest encountered on the latter line, although they

|are far from impressive. We should, however, take into account the
fact that the terrain level rises steeply between 116N and 112N, and
that the altitude difference of more than ten metres (see Outcrop Map
R12-ML) is probably due to greater overburden thickness alone. This
extra thickness may account for the weaker expression of the magnetic attraction that causes the maxima just discussed.
Their narrow widths indicate the possible presence of a thin tabu
lar body such as an iron formation horizon, but their relatively weak intensity is more suggestive of a diabase dikelet only a few metres
wide.
Further work on lines 120N and 104N may shed more light on the
nature of this anomaly. This work is therefore recommended. In addi
tion to the development of the lines mentioned, the existing wing lines, and in particular Line 108N (see recommendations in the prece-? ding EM section of this report) should be extended at least to the west boundaries of the claims concerned.
THE RADIOMETRIC SURVEY
THIS TYPE OF SURVEY, in an area where potassium is virtually the only source of ionizing radiation, is more timeconsuming in the field than
either the magnetic or the electromagnetic survey. On an analog in strument like the McPHAR TV-1A, the meter needle oscillates in a highly
irregular fashion between the low and the high extreme, even when the instrument control is set to the long time constant mode, and just as
the observer thinks that he or she can now determine a reasonably true
mean value, the needle suddenly starts moving in a significantly lower or higher range, and only more patience can lead to a fair estimate.
In the type of terrain present on the claims traversed, the radio
activity is probably entirely due to felsic clasts in the overburden, and not representative of bedrock which is, in all probability, buried beneath more than two metres of glacial drift in every locality visited.
The overall picture is bland: the highest and lowest readings are
1050 cpm and 650 cpm respectively, so only the 800 and the 1000 cpm contour lines appear on map R12-ML. Whether it is realistic to try
and connect the relative highs and lows across the space between the
survey lines, is debatable: detailed investigation may well reveal that we are dealing with isolated, irregularly spaced local bumps and
- 10 -

- 10 -
Considering the time required for such an investigation, and
the relatively minor amount of significant information to be gained by doing this type of detailed survey, an initiative in this direction
does not appear to be justified.
It is nevertheless recommended that the grid lines, as long as
they are available, be taken advantage of for the type of general radiometric work as done in the present survey. The fact that outcrop
has been observed only a few hundred metres to the southeast is a strong indication that thin overburden may be encountered where least expected. The overburden is of such a nature that it probably dis plays a far higher intensity of gamma-ray emission than the underlying
bedrock, which may have a far lower potassium content.
ATHENS (On), 1993 01 15

Ontario42L84N68251 2.14898 METCALFE LAKE 900
Mining Lands Branch Geoscience Approvals SectionMinistry of Ministere du WWBWiWMVW n
Northern Development Developpement du Nord 93 3"Ramsey LakeWRoad and Mines et des Mines 6th Floor
Sudbury, Ontario P3E 6B5
Telephone: Fax:
(705) 670-5853 (705) 670-5863
February 17, 1993 Our File: 2. 14898Transaction #W9340. 007
Mining RecorderMinistry of Northern Developmentand Mines435 James StreetSuite BOOSThunder Bay, OntarioP7E 6E3
Dear Sir/Madam:
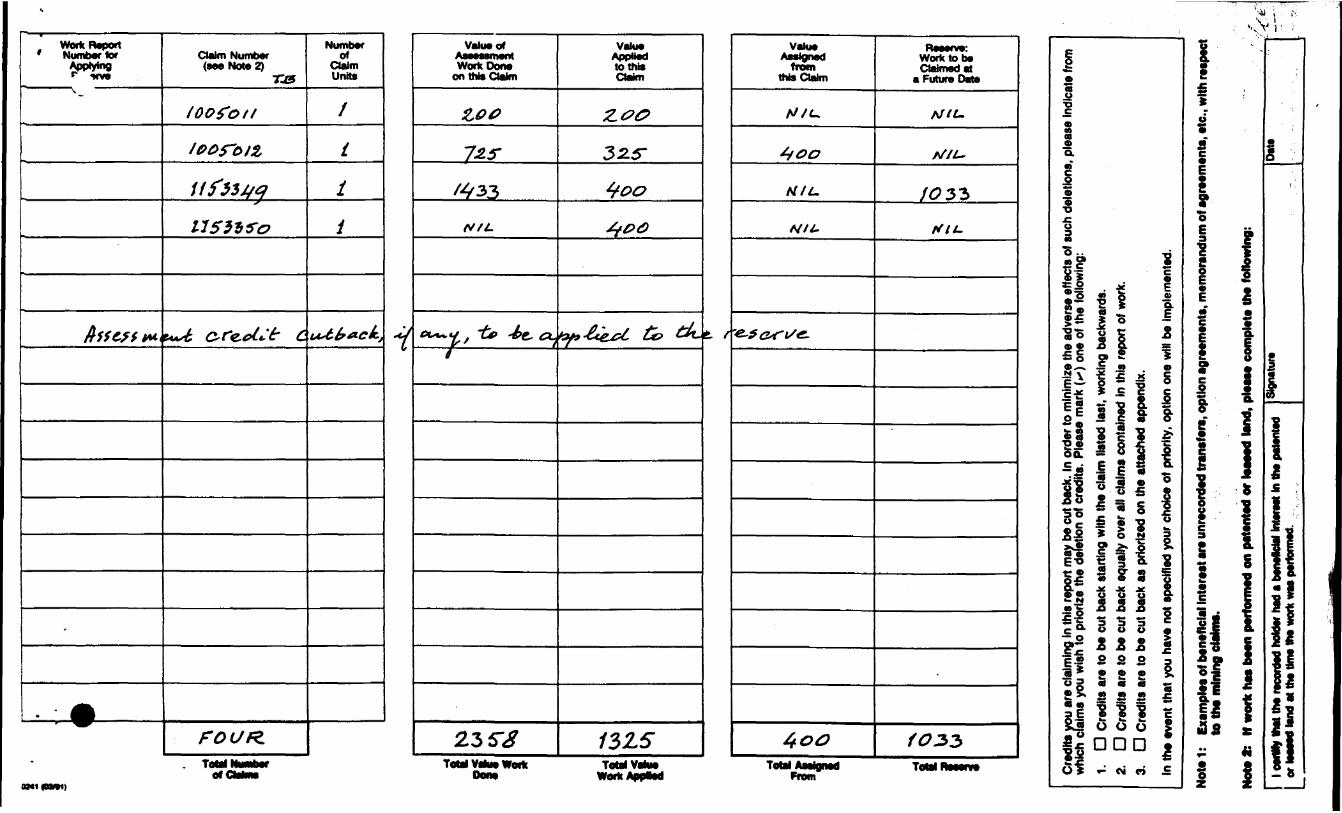
Subject: APPROVAL OF ASSESSMENT WORK CREDITS ON MINING CLAIMS TB. 1005011 ET AL. IN METCALFE LAKE AREA
The assessment work credits for the Geophysical surveys filed under Section 14 of the Mining Act Regulations have been approved as originally filed.
The approval date is February 16, 1993.
If you have any questions regarding this correspondence, please contact Lucille Jerome at (705) 670-5855.
Yours sincerely,
Mark Hall(Acting) Senior Manager, Mining LaivMines and Minerals Division
Enclosures:
cc: Resident GeologistThunder Bay, Ontario
isessment Files Library Toronto, Ontario
Ontark
Ministry ofNorthern Development
Mines
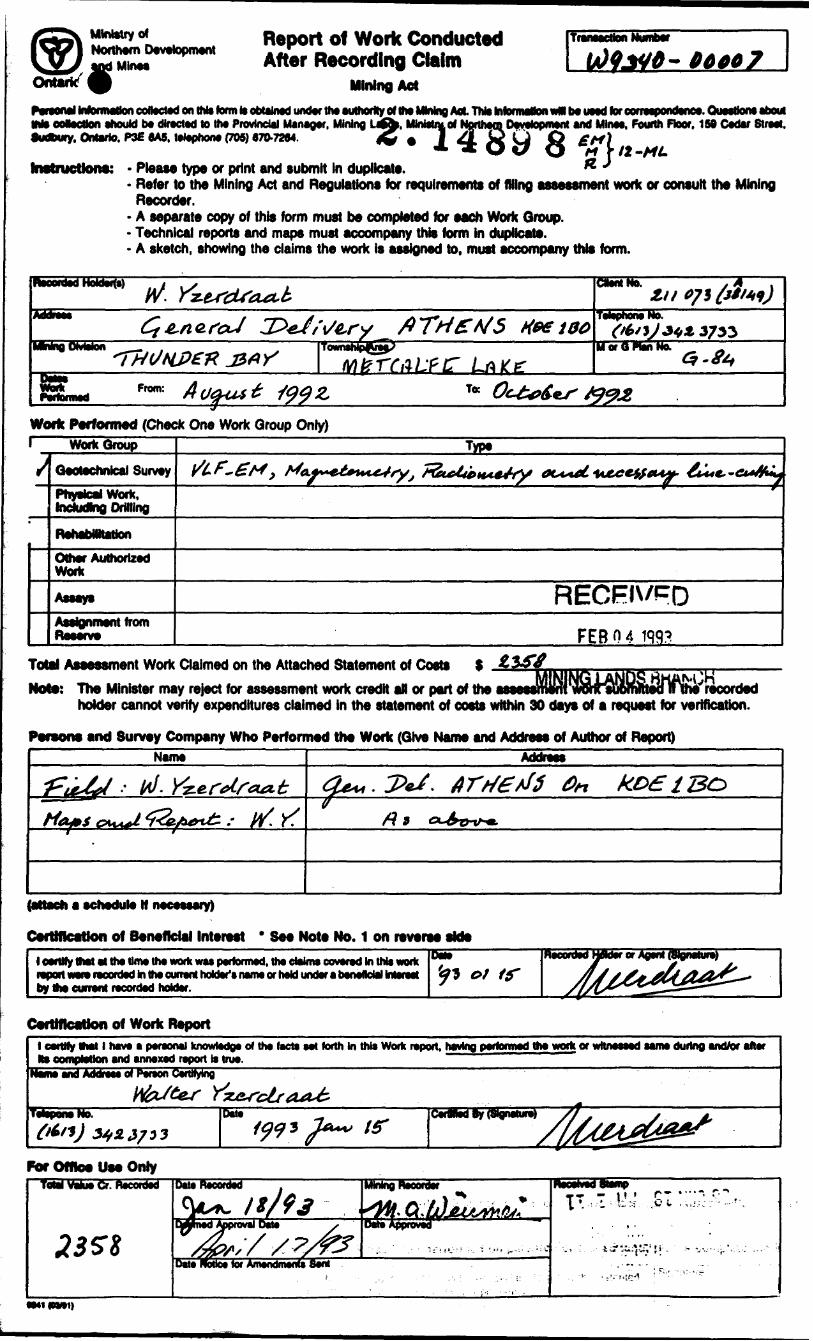
Report of Work Conducted After Recording Claim
Mining Act- 06*07
collected on (Ms tan to obtained i^ thto eotoctton should b* directed to Ins Provincial Manager. Mining Laffc. MlnMntof Northern Oavstopmsnt and Mines. Fourth Floor, 159 Cadar Straat.Sudbury, Ontario. P3E 6AS, talaphona (705) 670-7264.
Laffc. MlnMntof Northern Oavs*V e J 4 X Q* * W v \-ML
Instruction*: - Please type or print and submit In duplicate.- Refer to the Mining Act and Regulations for requirements of Wing assessment work or consult the Mining
Recorder.- A separate copy of this form must be completed for each Work Group.- Technical reports and maps must accompany this form in duplicate.- A sketch, showing the claims the work is assigned to, must accompany this form.
dMfX WO*
Zit
Hee 100 TOWpnOnO NO*
MMng Division TownsMpfVeSy' M or G Plan No.
From:i: Au^u.^ 199 Z T* Oc&t&^s te^jzWork Performed (Check One Work Group Only)
WorkGroup TypeGeotachnfcaJ Survey
Physlcsj Work, Inckidlnc1Q Drilling
Other Authorized Work
Assays
Assignment from Reserve FEB04199?
Total Assessment Work Claimed on the Attached Statement of CostsMJH . . "-"recordedNot*: The Minister may reject for assessment work credit aR or part of the
holder cannot verify expendttures claimed in the statement of costs witNn 30 days of a request for verification
Persons and Survey Company Who Performed the Work (Give Name and Address of Author of Report)Name Address
ft 9
(attach a aclwdula H nacaaaary)
Certification of Beneficial Interest * See Note No. 1 on reverse sMel certify that at the time the work was performed, the claims covered In this work report were recorded in the current holder's name or held under a beneficial Interest by the current recorded holder.
or Agent (Signature)
Certification of Work Reportl certify that l have a personal knowledge of the facts set forth In this Work report, having performed the work or witnessed same during and/or after Ra completion and annexed report Is true.
Name and Address of Person Certifying
TsUpons No. Dste CerWed By (agnsture)
For Office Use Only
M1IOM1)
i -
1
- ;i
'11i r
-
* IE r i i v* r*
!- t-*.
S u ^
| K^
f
(
^ f ^
^
(
5| ri ?z
2ig
a.1
d f
-4:
1 ir i I i { iNi
04 ^ 1
Vr t V | S*
J*-
V tS t
s U
e 1
i mi* s
^s U
^ f
^ x r*
^ ^ U
* * i
^ r r
ijij lift iT999R
t9*Work
to
bs
Claime
d at
a Future
Date
Cre
dits
you
are
cla
imin
g in
this
repo
rt m
ay b
e cu
t bac
k. In
ord
er to
min
imiz
e th
e ad
vers
e ef
fect
s of
suc
h de
letio
ns, p
leas
e In
dica
te fr
om
whi
ch c
laim
s yo
u w
ish
to p
riorlz
e th
e de
letio
n of
cre
dits
. Pl
ease
mar
k (^
) on
e of
the
follo
win
g:
1.
D C
redi
ts a
re t
o be
cut
bac
k st
artin
g w
ith t
he c
laim
list
ed la
st,
wor
king
bac
kwar
ds.
2.
O C
redi
ts a
re to
be
cut b
ack
equa
lly o
ver a
ll cl
aim
s co
ntai
ned
In th
is r
epor
t of w
ork.
3.
D C
redi
ts a
re to
be
cut
back
as
prio
rized
on
the
atta
ched
app
endi
x.
In th
e ev
ent
that
you
hav
e no
t spe
cifie
d yo
ur c
hoic
e of
prio
rity,
opt
ion
one
will
be im
plem
ente
d.
Not
e l:
Ex
ampl
es o
f ben
efic
ial I
nter
est a
re u
nrec
orde
d tra
nsfe
rs, o
ptio
n ag
reem
ents
, mem
oran
dum
of a
gree
men
ts, e
tc.,
wtth
resp
ect
to th
e m
inin
g de
bits
.
Not
e 2:
M
wor
k ha
* be
en p
erfo
rmed
on
pate
nted
or
leae
ed la
nd, p
leas
e co
mpl
ete
the
follo
win
g:
,
l lc
ert
1 or
leiMy
that
the
reco
rded
hoW
er h
ad a
ben
efici
al In
tere
st h
i the
pat
ente
d is
ed la
nd a
t the
tim
e th
e wo
rk w
as p
erfo
rmed
.Si
gnat
ure
Dat
e
Ontario
Ministry ofNorthern Development nd Mines
t?OevekMere du
eloppement du Nord t des mines
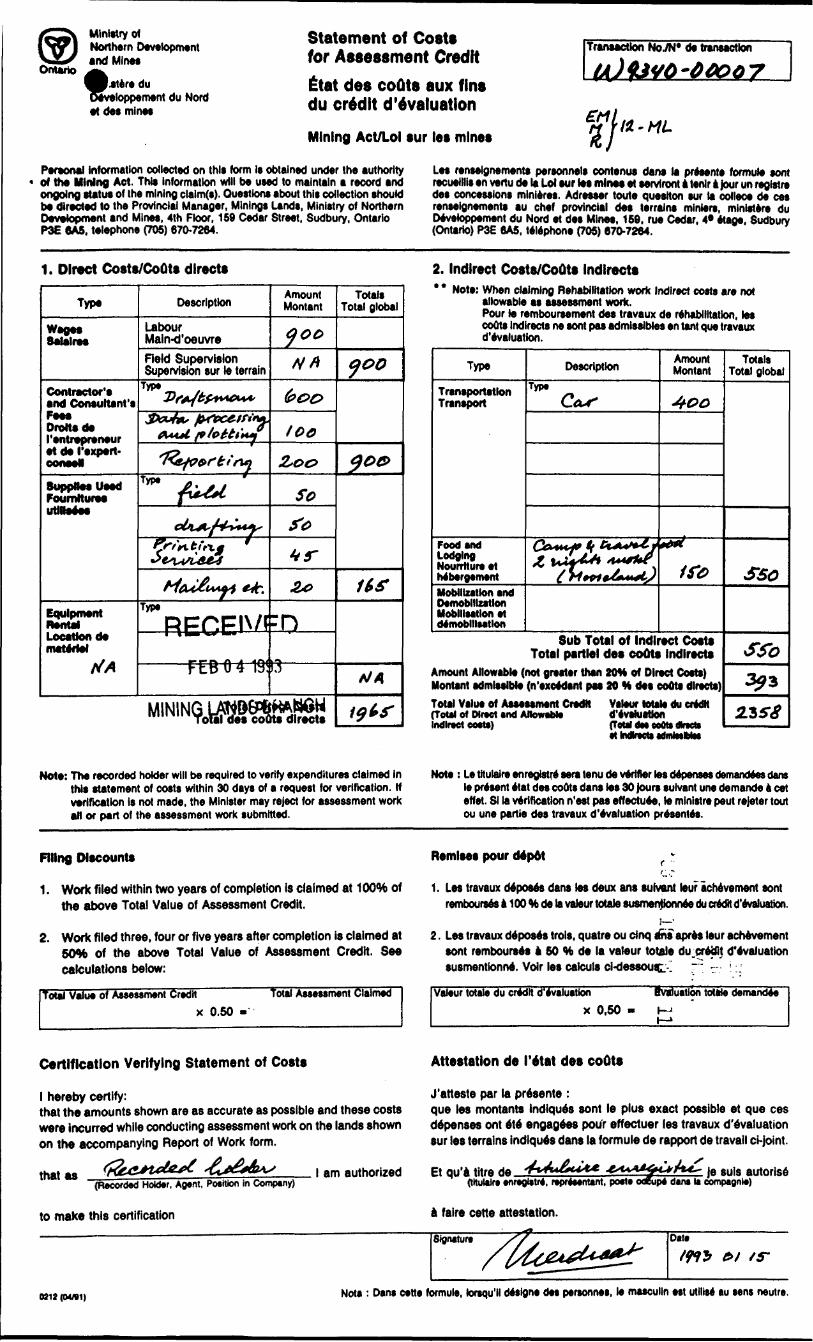
Statement of Costs for Assessment Creditttat des codts aux fins du credit devaluation
Mining Act/Loi tur le* mines
Transaction NoJN* de transaction
U) 431/6-00007
It-HL
Personal Information collected on this form Is obtained under the authority of the Mining Act. This information will be used to maintain a record and ongoing status of the mining clalm(s). Questions about this collection should b* directed to the Provincial Manager, Minings Lands, Ministry of Northern Development and Mines, 4th Floor, 169 Cedar Street, Sudbury, Ontario P3E 6A5. telephone (705) 670-7264.
Les renselgnements personnels contenus dan* la presente formule sont recuelllis en vertu de la Lot sur les mint* et ervlront a tertr 4 jour un registr* des concessions mlnleres. Adresser toute question sur la colleoe de ces renseignements au chef provincial des terrains minlers, minister* du Devetoppement du Nord et des Mines, 159, rue Cedar, 4* etaoe. Sudbury (Ontario) P3E 6AS, telephone (70S) 670-7284.
1. Direct Costs/Couts directs
Type
Wage* Satalre*
Contractor'* and Coneultant'* Fees Droned* ('entrepreneur et de ('expert.
8uppH**U*ed FoumNuree
Ei|ulpfi)ent Rental Location d* nurtvriw
Description
Labour Main-d'oeuvre
Field Supervision Supervision sur to terrain
Type Df+Jbf+iACm'
3?cufa, psvce-iF***. A*ut fvlotti**)
1Zw*rbf**Type -
,^y,,.fn^^-jV 7"
325!8utA/jK-ctviA-^ *Jr.
Type
RECEIW *
FEB04 19!
Amount Montant
yooNA
boo
loo
2,00
So
to**s-
Zo
:n
ft
MINING |JWB8*KAHs3Wmim"To!aTde* coots direct*
Totals Total global
yeo
900
1IS
*SA
iflS
2. Indirect Costs/Couts Indirect** * Not*: When claiming Rehabilitation work Indirect costs are not
allowable as assessment work. Pour 1* remboursement de* travaux de rehabilitation, le* coOt* tndirects ne sont pas admissible* en tant que travaux devaluation.
Type
Transportation Transport
Food and
Nourrtture et MbergementMobilization and Demobilization Mobilisation et demobilisation
Description
Type
t^ftZZZj
Amount Montant
400
6ft
tto
Sub Total of Indirect Costs Total partial des coot* Indirect*
Amount Allowable (not greater than 20H of Direct Costs) Montant admissible (n'exotdant pas 20 H des coOts direct*)Total Value of Assessment Credit Valeur total* du crMM (Total of Direct and Allowable devaluation Indirect costs) (Total del eotts dbtcto
Totals Total global
sso
Sfo
373235-*?
Not*: The recorded holder will be required to verify expenditures claimed in this statement of costs within 30 days of a request for verification. H verification is not made, the Minister may reject for assessment work all or part of the assessment work submitted.
Note : Le titulaire enregistre sera tenu de verifier les depenses demandfes dans le present etat des coOts dans les 30 jours sulvant un* demand* a eel effet. SI la verification n'est pas effectuee, le mlnistre peut rejeter tout ou une partie des travaux devaluation presenters.
Filing Discounts
1. Work filed within two years of completion is claimed at lOO'to of the above Total Value of Assessment Credit.
2. Work filed three, four or five years after completion is claimed at 50*6 of the above Total Value of Assessment Credit. See calculations below:
Total Value of Assessment Credit Total Assessment Claimed
x 0.50 -
Remises pour dtpot f -f ,-
1. Les travaux deposes dans tot deux ans suivant tour achevement sont rembourses a 100 to de la vateur totato susmertfonnee du crMit devaluation.
i -2. Les travaux deposes trols, quatre ou dnq ans apres ieur achevement
sont rembourses a 50 to de la valeur totals du.crettt devaluation susmentionne. Voir les calculs ci-dessouc. - ~"~ r '::
Valeur totals du credit devaluationx 0,50 -
evaluation toltfe demand**
Certification Verifying Statement of Costs
l hereby certify:that the amounts shown are as accurate as possible and these costs were Incurred while conducting assessment work on the lands shown on the accompanying Report of Work form.
that as(Recorded Holder, Agent, Position In Company)
to make this certification
Attestation de I'etat des coOts
J'atteste par la presente :que les montants indiques sont le plus exact possible et que ces depenses ont ete engagees pour effectuer les travaux devaluation sur les terrains indiques dans la formule de rapport de travail ci-joint.
l am authorized Et qu'a titre de(tltulalra enregbtni, representant, poete
faire cotte attestation.^
u-ant* odEupt d
je suls autorisedans te ebmpagnl*)
Signature Date
0212 ((M/81) Nota : Dans cette formule. ktrsqu'll d*slgne des personnes, l* masculln est utills* au sens neutre.

REFERENCES
TH
E
INF
OR
MA
TIO
N
TH
AT
A
PP
EA
RS
O
N
TH
IS
MA
P
H*S
B
EE
N
CO
MP
ILE
D
FR
OM
VA
RIO
US
SO
UR
CE
S,
AN
D
AC
CU
RA
CY
IS
N
OT
G
UA
RA
NT
EE
D.
TH
OS
E
WIS
HIN
G
TO
S
TA
KE
M
IN
ING
CL
AW
S S
HO
UL
D C
ON
- S
UIT
W
ITH
T
HE
M
ININ
G
RE
CO
RD
ER
, M
INIS
TR
Y
OF
N
OR
TH
ER
N
DE
VE
LO
P
ME
NT
AN
D M
tNE
t.,
FO
R A
D
DIT
ION
AL
IN
FO
RM
AT
ION
O
N
TH
E
STA
TUS
O
F
TH
E
LA
ND
S S
HO
WN
HE
RE
ON
.
W'L
LE
T
L \r
^E G
-15
6
GZ
OW
SK
IF
OR
S
TA
TU
S
RE
FE
R
TO
G
'182
LET
Res
erve
, Fil
e n 5
92
qM
OB
OS
HK
EG
AN
^•"
" S
TA
TU
S
RE
FE
R
TO
Q
-17
^4
40
V
l W
TO
W
, B
I70S
*-—
- —
i-
T -'
- -
^'
\ \
*
t t
. C
32
31
47
^1
1
1
1 t
30
e i
-— 5
0 I
S
R
E
T O
P O
G R
LA
KE
S
RIV
ER
S.
UT
INV
EN
TO
RY
S
HE
ET
F
f. R
EN
CE
S
j
A P
H Y
C..
-RO
V
FO
RE
ST
.ItS
OU
RC
ES
No
50287 J
L 5
0 0
73o
'
L A;
j A
'-••i-
E..
*i.
SU
RV
EY
S
C.N
.R.
BY
W
.J.M
OO
RE
O.L
.S..
AP
3IL
1S
T,W
16-
PL
AN
NO
-M2
-27
A
ND
M
-2-^
3.
BA
SE
L
INE
B
Y
SP
EIG
HT
A
ND
^
AN
N
OS
TR
AN
D
O.L
.S.
1925.
BO
OK
N
O.2
564
ME
RID
IAN
LI
NE
S
UR
VE
YE
D
BY
P
HIL
LIP
S
AN
D
BE
NN
ER
O
.L.S
.I9
I6.
BO
OK
N
O. 2
47
4
CO
NT
RO
L
TR
AV
ER
SE
B
Y
R.S
. K
IRK
UP
O
.L .
S.
1942.
PL
AN
N
O.
P 15-1
8.
Swc.
36 W
/D O
ntar
**7
NC
R M
JLO
. S
.. C
ritol
ro P
m4n
t F
it*
r T
ie-
Rf-
s^r'"
Loca
tion?
'J^*
O
re-
; ^-
51-,*
LEG
END
HIG
HW
AY
AN
D R
OU
TE
N
o '
O^H
ER
RO
AD
S
:
TR
AIL
S
SU
RV
EY
ED
L
INE
ST
OW
NS
HIP
S.
BA
SE
LI
NE
S,
ETC
LOT
S,
MIN
ING
CLA
iVS
P
AR
CE
LS,
ETC
UN
S'J
RV
EY
ED
L
iNE
S-
LO
'L'N
ES
P
AR
CE
L B
OU
ND
AR
Y
MlN
SN
o C
LA
'Vi
ET
C.
RAIL
WAY
AND
RiG
^T O
F W
AY
UTI
LITY
LIN
ES
N'ON
--PER
ENNi
AL S
TREA
M
FLOO
DING
OR
FLOO
DING
RIG
HTS
SUBD
IVIS
ION
OR C
OMPO
SITE
PLA
N RE
SERV
ATIO
NS
ORI
GIN
AL S
HORE
LINE
W
ARSH
OR
MUS
KEG
VIN
ES
TR
AV
ER
SE
MO
NU
ME
NT
•
^ *
i E ;
'
FT 2™
i.
t
' '
i I
- r'
f*
! \
^ i
i K w
' -
.jr t
w t
11, i
b v
t u
k
. t i
* w
^'
i
TY
PE
OF
DO
CU
ME
MT
, SUR
FACE
S M
ININ
" R
IGH
TS—
—...
....
..,
.SUR
FACE
RSC
iHTS
ON
LY..^
......
._,.
..., M
ININ
G RI
GHT
SONL
V ._
_—
—...........
LEAS
E, S
URFA
CE S
MIN
ING
R IC
-HTS
— —
..-..
....™
" , S
URFA
CE R
IGH
TSO
NLV
.,....
......
,,,.
......
...
^"
. MIN
ING
RIG
HTS
ON^V
.— —
. .
.-...
......
—..
LIC
EN
CE
OP
OC
CU
PA
TIO
N
. .... ..,
,..
——
— ...^ ....^.
m
RE
SE
RV
AT
ION
^.....^
..._
_.....
.......
....
....
.^ 0
CA
NC
ELLE
D
___—
..,.,,^
..
.^...
. ..,......^
....
...
®
SA
ND
S G
RA
VE
L._
_..
....
.. .,.
....
. .,
....
^^..
....
..
. (^
.L
AN
D U
SE
PE
RM
ITS
FO
R C
OM
ME
RC
IAL
TO
UR
ISM
.OU
TP
OS
T C
AM
PS
' i
N'O
TE,
MIN
ING
R
IGH
TS I
N P
AR
CE
LS F
i.-E
*.T
tDP
KiG
P T
C M
AY
e1.3
12,
VE
ST
ED
t S
O
RiG
INA
- P
AT
fcN
TE
E
BV
T
HE
P
UB
LIC
L
^N
DS
A
CT
. R
-S
O
1970.
O A
* 3
80
, S
?C
63.
SC
ALE
: l
INC
H ^
40
CH
AIN
S
o t O
OD
?DCO
80
OO
O 20
0 M
ET
RE
S
AT E
A ML
rE LA
KE
M.N
.R.
AO
MIM
ST
RA
TIV
E
DIS
TR
ICT
MIM
KG
D
IVIS
ION
8A
YLA
ND
RE
GIS
TR
Y
DIV
ISIO
N
BA
Y
'.an
d
Bra
nch
A
en
t
Oat
'* u
ni b
11
INT
0 S
ER
VIC
E M
AR
CH
'9/9
0-8
4
03
l iO "1
r"
n "T m
TR
IM
TO
TH
I'j
LIN
E A
: L
AR
Oi
ND
—
-SL.
, ^
K*
.Wi
42
L0
4N
E8
25
1

V
SCALE 1:2000METRES
IE100 200
Topographical Baseline - Azimuth 090
1Jp3 01 14
\F
e\v 0
v\V^
^s-
V•o-d-v
OUTCROP MAP RI 2-MLMetcalfe Lake Area — G-84
THUNDER BAY MINING DIVISION
Recorded Holder: Walter Yzerdraat 3 claims as underlined in Group Sketch
759638
BASE MAP 5 — West CentralPlan and Report: W. Yzerdraat, January 1993
BASE MAP 5 — West Central

SCALE 1:2000
V•fto (S)
cPcP
\METRES 814072
100 200 300 400
Topographical Baseline - Azimuth 090
817030TBL
1153350817029
\
MAGNETOMETER
SURVEY PLAN M12-MLMetcalfe Lake Area — G-84
THUNDER BAY MINING DIVISION
Recorded Holder: Walter Yzerdraat ^ 3 claims as underlined in Group Sketch
Field Work: W. Yzerdraat - August-October 1992Line Spacing; 100 m. Standard station interval: 25 m
Readings taken at 12.5 m or at 6.25 m intervals
Total traverse: 1400 metres -- 122 observations
Instrument: SCINTREX MF-2 vertical-force fluxgate magnetometer
Sensitivity: 5 r.anoTeslas (nT) at 1000 nT full-scale setting
Settings used: 1000 nT and 3000 nT full scale
Magnetic datum (z-component) : 56,785 nT
Mac contour interval: 500 nT
BASE MAP 5 — West Central
Plan and Report: W. Yzerdraat, January 1993 A
Client Number 211073, Licence A 38149
\
\
W H S \
tt?' V x rffffff/o"**- *S'o
1153349bn
l
f s^r-^. w-0 * **Tv^* o ** /fcv*1**" -? /T\t ^-^ *)
# ,W) (P ~"*^^ ^
" # (?^^^ H*\ITS^* f
*oo"
l M
OJ^ Jp^ /JB*:
1005011
* t?^ /g,
/ /
ii
1005012
3 o^ ^ *'
j? tr
^ i 3:L* y
O O r- OS P *?
* 5 * h-
rro
Q#
814069^
59636
li 12LK4NE8251 2.14893 METCALFE LAKE
\BASE MAP 5 — West Central

SCALE 1:2000
Topographical Baseline - Azimuth 090
^~ oELECTROMAGNETIC
SURVEY PLANEMl2-ML
Metcalfe Lake Area — G-84
THUNDER BAY MINING DIVISION
Recorded Holder: Walter Yzerdraat3 claims as underlined in Group Sketch
Field Work: W. Yzerdraat — August-October 1992 Line Spacing: 100 m. Standard station interval: 25 ir.
Measurements done at 12.5 m intervals; observer faces NE Total traverse: 1200 m — 98 sets of observationsInstrument: GEONICS EM16. Parameters: Tilt and Quadrature
(Tilt in tangent percent of inclination angle ; Quadrature as percentage of primary field strength)
Profile scale: 1mm is l unit of tilt; positive is North Fraser filter values are underlinedNumbers south of traverse lines are tilt and quadrature, in
that order. Transmitter: NSS, Annapolis Md, 21.4 kHz, azimuth 144
BASE MAP 5 — West Central
Plan and Report: W. Yzerdraat, January 1993
Client Number 211073 — Licence A 38149
Group sketch
59636
BASE MAP 5 — West Central

SCALE 1:2000
Topographical Baseline - Azimuth 090
RADIOMETRIC
SURVEY PLANRI 2 -MLMetcalfe Lake Area — G-84
THUNDER BAY MINING DIVISION
Recorded Holder: Walter Yzerdraat3 claims as underlined in Group Sketch
Field Work: W. Yzerdraat -- August-October 1922
Line spacing: 100 m. Standard station interval: 25 m
Readings taken at 12.5 m intervals
Total traverse 1400 metres — 107 observations
Instrument: HcPHAR TV-1A
Sensitivity threshold: 200 keV on the broadband setting
Readings expressed as counts per minute (cpm)
Settings used in survey: 1000 and 3000 cpm full scale
Radiometric background intensity: 100 cpm (Broadband)
Map contour interval: 200 cprn
BASE MAP 5 — West Central
Plan and Report: W. Yzerdraat, January 1993
Client Number 211073 -- Licence A 38149
•"ft
BASE MAP 5 — West Central