4.2 Consolidated financial statements - Groupe Renault · Page 2 4.2 Consolidated financial...
78
Page 1 Consolidated financial statements 2011
Transcript of 4.2 Consolidated financial statements - Groupe Renault · Page 2 4.2 Consolidated financial...

Page 1
Consolidated financial statements 2011

Page 2
4.2 Consolidated financial statements 4.2.1 Consolidated income statement
(€ million) 2011 2010
Sales of goods and services 41,192 37,654
Sales financing revenues 1,436 1,317
Revenues (note 4) 42,628 38,971
Cost of goods and services sold (33,848) (30,620)
Cost of sales financing (note 5) (911) (813)
Research and development expenses (note 12-A) (2,027) (1,834)
Selling, general and administrative expenses (4,751) (4,605)
Operating margin (note 6) 1,091 1,099
Other operating income and expenses (note 7) 153 (464)
Other operating income 384 197
Other operating expenses (231) (661)
Operating income 1,244 635
Net interest income (expenses) (219) (354)
Interest income 193 146
Interest expenses (412) (500)
Other financial income and expenses 98 (22)
Financial income (note 8) (121) (376)
Gain on sale of AB Volvo Series B shares - 2,000
Share in net income (loss) of associates 1,524 1,289
Nissan (note 14) 1,332 1,084
Other associates (note 15) 192 205
Pre-tax income 2,647 3,548
Current and deferred taxes (note 9) (508) (58)
Net income 2,139 3,490
Net income – non-controlling interests’ share 47 70
Net income – parent-company shareholders’ share 2,092 3,420
Earnings per share (1) in € (note 10) 7.68 12.70
Diluted earnings per share (1) in € (note 10) 7.68 12.70
Number of shares outstanding (in thousands) (note 10)
For earnings per share 272,381 269,292
For diluted earnings per share 272,381 269,292
(1) Net income – parent-company shareholders’ share divided by number of shares stated.

Page 3
4.2.2 Consolidated comprehensive income
Other components of comprehensive income are reported net of tax effects, which are presented in note 11-B.
(€ million) 2011 2010
NET INCOME 2,139 3,490
Actuarial gains and losses on defined-benefit pension plans (23) (14)
Translation adjustments on foreign activities (107) 258
Partial hedge of the investment in Nissan (142) (242)
Fair value adjustments on cash flow hedging instruments (13) 80
Fair value adjustments on available-for-sale financial assets (257) 232
Total other components of comprehensive income excl uding associates (A) (542) 314
Actuarial gains and losses on defined-benefit pension plans (107) 59
Translation adjustments on foreign activities 645 2,019
Fair value adjustments on cash flow hedging instruments (14) 8
Fair value adjustments on available-for-sale financial assets (80) 24
Associates’ share of other components of comprehens ive income (B) 444 2,110
Other components of comprehensive income (A) + (B) (98) 2,424
COMPREHENSIVE INCOME 2,041 5,914
Parent-company shareholders’ share 1,996 5,826
Non-controlling interests’ share 45 88

Page 4
4.2.3 Consolidated financial position
(€ million) December 31, 2011
December 31, 2010
ASSETS
Non-current assets
Intangible assets (note 12-A) 3,718 3,677
Property, plant and equipment (note 12-B) 11,357 11,504
Investments in associates 15,991 14,199
Nissan (note 14) 14,931 13,345
Other associates (note15) 1,060 854
Non-current financial assets (note 23) 1,068 1,728
Deferred tax assets (note 9) 566 705
Other non-current assets (note 19) 580 435
Total non-current assets 33,280 32,248
Current assets
Inventories (note 16) 4,429 4,567
Sales financing receivables (note 17) 21,900 19,276
Automotive receivables (note 18) 1,275 1,329
Current financial assets (note 23) 1,244 799
Current tax assets 66 178
Other current assets (note 19) 2,068 1,685
Cash and cash equivalents (note 23) 8,672 10,025
Total current assets 39,654 37,859
TOTAL ASSETS 72,934 70,107

Page 5
(€ million) December 31, 2011
December 31, 2010
SHAREHOLDERS’ EQUITY AND LIABILITIES
Shareholders’ equity
Share capital 1,127 1,127
Share premium 3,785 3,785
Treasury shares (201) (145)
Revaluation of financial instruments (129) 235
Translation adjustment (155) (554)
Reserves 17,567 14,367
Net income – parent-company shareholders’ share 2,092 3,420
Shareholders’ equity – parent-company shareholders’ share 24,086 22,235
Shareholders’ equity – non-controlling interests’ share 481 522
Total shareholders’ equity (note 20) 24,567 22,757
Non-current liabilities
Deferred tax liabilities (note 9) 135 125
Provisions – long-term (note 21) 2,227 2,243
Non-current financial liabilities (note 24) 6,327 7,096
Other non-current liabilities (note 22) 724 734
Total non-current liabilities 9,413 10,198
Current liabilities
Provisions – short-term (note 21) 866 965
Current financial liabilities (note 24) 3,230 4,546
Sales financing debts (note 24) 21,996 19,366
Trade payables 6,202 6,348
Current tax liabilities 126 106
Other current liabilities (note 22) 6,534 5,821
Total current liabilities 38,954 37,152
TOTAL SHAREHOLDERS’ EQUITY AND LIABILITIES 72,934 7 0,107

Page 6
4.2.4 Changes in shareholders’ equity (€ million) Number of
shares (thousand)
Share capital
Share premium
Treasury shares
Revaluation of financial instruments
Translation adjustment
Reserves Net income (parent-
company shareholders’
share)
Shareholders’ equity (parent-
company shareholders’
share)
Shareholders’ equity (non-controlling
entities’ share)
Total shareholders’
equity
Balance at December 31, 2009
284,937 1,086 3,453 (229) (109) (2,568) 17,474 (3,125) 15,982 490 16,472
2010 net income 3,420 3,420 70 3,490
Other components of comprehensive income (1)
344 2,014 48 2,406 18 2,424
2010 comprehensive income
344 2,014 48 3,420 5,826 88 5,914
Allocation of 2009 net income (3,125) 3,125
Dividends (40) (40)
Cost of stock-option plans 7 7 7
(Acquisitions) / disposals of treasury shares and impact of capital increases
10,785 41 332 84 (24) 433 433
Impact of changes in the scope of consolidation with no loss of control (2)
(3) (3) (16) (19)
Other changes (10) (10) (10)
Balance at December 31,
2010 295,722 1,127 3,785 (145) 235 (554) 14,367 3,420 22,235 522 22,757
2011 net income 2,092 2,092 47 2,139
Other components of comprehensive income (1)
(364) 399 (131) (96) (2) (98)
2011 comprehensive income
(364) 399 (131) 2,092 1,996 45 2,041
Allocation of 2010 net income 3,420 (3,420)
Dividends (82) (82) (74) (156)
Cost of stock-option plans 6 6 6
(Acquisitions) / disposals of treasury shares and impact of capital increases
(56) (56) 3 (53)
Impact of changes in the scope of consolidation with no loss of control (2)
(13) (13) (15) (28)
Other changes
Balance at December 31, 2011
295,722 1,127 3,785 (201) (129) (155) 17,567 2,092 24,086 481 24,567
(1) The change in reserves reflects actuarial gains and losses on defined-benefit pension plans recorded during the period (€48 million in 2010 and €(131) million in 2011). (2) The impact of changes in the scope of consolidation results from the treatment applied to acquisitions of non-controlling interests and put options for buyouts of non-controlling entities (note 2-J).
Details of changes in consolidated shareholders’ equity in 2011 are given in note 20.

Page 7
4.2.5 Consolidated cash flows
(€ million) 2011 2010
NET INCOME 2,139 3,490
Cancellation of dividends received from unconsolidated listed investments (1) (22)
Cancellation of income and expenses with no impact on cash
- Depreciation, amortization and impairment 2,831 3,069
- Share in net (income) loss of associates (1,524) (1,289)
- Other income and expenses with no impact on cash (note 27-A) (360) (2,087)
- Dividends received from unlisted associates 5
Cash flow (2) 3,069 3,183
Dividends received from listed companies (3) 335 88
Net change in financing for final customers (1,206) (448)
Net change in renewable dealer financing (1,449) (146)
Decrease (increase) in sales financing receivables (2,655) (594)
Bond issuance by the Sales Financing segment (note 24-A) 5,160 3,929
Bond redemption by the Sales Financing segment (note 24-A) (2,528) (2,308)
Net change in other Sales financing debts (149) (2,354)
Net change in other securities and loans of the Sales Financing segment 107 (129)
Net change in Sales financing financial assets and debts 2,590 (862)
Change in capitalized leased vehicles (192) (109)
Decrease (increase) in working capital (note 27-B) 206 264
CASH FLOWS FROM OPERATING ACTIVITIES 3,353 1,970
Capital expenditure (note 27-C) (2,455) (1,867)
Disposals of property, plant and equipment and intangibles 239 219
Acquisitions of investments with gain of control, net of cash acquired - -
Acquisitions of other investments, net of cash acquired (156) (39)
Disposals of investments with loss of control, net of cash transferred - 7
Disposals of other investments, net of cash transferred and other (4) - 3,114
Net decrease (increase) in other securities and loans of the Automotive segment
38 (30)
CASH FLOWS FROM INVESTING ACTIVITIES (2,334) 1,404
Transactions with non-controlling interests (5) - -
Dividends paid to parent-company shareholders (note 20-D) (88) -
Dividends paid to non-controlling interests (66) (77)
(Purchases) sales of treasury shares (56) 60
Cash flows with shareholders (210) (17)
Bond issuance by the Automotive segment (note 24-A) 712 1,696
Bond redemption by the Automotive segment (note 24-A) (941) (1,164)
Net increase (decrease) in other financial liabilities of the Automotive segment (1,911) (1,982)
Net change in financial liabilities of the Automot ive segment (2,140) (1,450)
CASH FLOWS FROM FINANCING ACTIVITIES (2,350) (1,467)
INCREASE (DECREASE) IN CASH AND CASH EQUIVALENTS (1 ,331) 1,907 (1) Dividends received from Daimler in 2011 (none were received in 2010). (2) Cash flow does not include dividends received from listed companies. (3) Dividends from Daimler (€22 million), AB Volvo (€38 million) and Nissan (€275 million) in 2011. (4) Including the sales of AB Volvo Series B shares for €3,006 million in 2010. (5) Via capital increases or capital reductions and acquisitions of additional investments in controlled companies (note 2-J).

Page 8
(€ million) 2011 2010
Cash and cash equivalents: opening balance 10,025 8,023
Increase (decrease) in cash and cash equivalents (1,331) 1,907
Effect of changes in exchange rate and other changes (22) 95
Cash and cash equivalents: closing balance 8,672 10,025
Details of interest received and paid by the Automotive segment are given in note 27-D.
Current taxes paid by the Group are reported in note 9-A.

Page 9
4.2.6 Segment reporting A – Information by operating segment
A1 – CONSOLIDATED INCOME STATEMENT BY OPERATING SEGMENT
(€ million) Automotive Sales financing Intersegment transactions
Consolidated total
2011
Sales of goods and services 40,679 513 - 41,192
Sales financing revenues - 1,436 - 1,436
External sales (note 4) 40,679 1,949 - 42,628
Intersegment sales (290) 409 (119) -
Sales by segment 40,389 2,358 (119) 42,628
Operating margin (1) 328 761 2 1,091
Operating income 478 764 2 1,244
Financial income (2) 230 - (351) (121)
Share in net income (loss) of associates 1,519 5 - 1,524
Pre-tax income 2,227 769 (349) 2,647
Current and deferred taxes (252) (254) (2) (508)
Net income 1,975 515 (351) 2,139
2010
Sales of goods and services 37,172 482 - 37,654
Sales financing revenues - 1,317 - 1,317
External sales (note 4) 37,172 1,799 - 38,971
Intersegment sales (283) 376 (93) -
Sales by segment 36,889 2,175 (93) 38,971
Operating margin (1) 381 703 15 1,099
Operating income (78) 698 15 635
Financial income (2) 26 - (402) (376)
Gain on sale of AB Volvo Series B shares 2,000 - - 2,000
Share in net income (loss) of associates 1,287 2 - 1,289
Pre-tax income 3,235 700 (387) 3,548
Current and deferred taxes 157 (211) (4) (58)
Net income 3,392 489 (391) 3,490
(1) Details of amortization and depreciation are provided in the consolidated cash flow statements by operating segment.
(2) Sales financing dividends are included in the Automotive segment's financial income and eliminated as an intersegment transaction.

Page 10
A2 – CONSOLIDATED FINANCIAL POSITION BY OPERATING SEGMENT
December 31, 2011 (€ million)
Automotive Sales financing Intersegment transactions
Consolidated total
Non-current assets
Property, plant and equipment and intangible assets 14,956 129 (10) 15,075
Investments in associates 15,955 36 - 15,991
Non-current financial assets – investments in non-controlled entities
3,237 - (2,538) 699
Non-current financial assets – other securities, loans and derivatives on financing operations of the Automotive segment
497 - (128) 369
Deferred tax assets and other non-current assets 1,007 189 (50) 1,146
Total non-current assets 35,652 354 (2,726) 33,280
Current assets
Inventories 4,409 25 (5) 4,429
Customer receivables 1,354 22,220 (399) 23,175
Current financial assets 1,441 451 (648) 1,244
Other current assets and current tax assets 1,605 2,849 (2,320) 2,134
Cash and cash equivalents 7,618 1,171 (117) 8,672
Total current assets 16,427 26,716 (3,489) 39,654
TOTAL ASSETS 52,079 27,070 (6,215) 72,934
Shareholders’ equity 24,450 2,540 (2,423) 24,567
Non-current liabilities
Deferred tax liabilities and long-term provisions 2,058 169 - 2,227
Non-current financial liabilities 6,066 261 - 6,327
Other non-current liabilities 340 519 - 859
Total non-current liabilities 8,464 949 9,413
Current liabilities
Short-term provisions 833 33 - 866
Current financial liabilities 3,789 - (559) 3,230
Trade payables and sales financing debts 6,402 22,774 (978) 28,198
Other current liabilities and current tax liabilities 8,141 774 (2,255) 6,660
Total current liabilities 19,165 23,581 (3,792) 38,954
TOTAL SHAREHOLDERS’ EQUITY AND LIABILITIES 52,079 2 7,070 (6,215) 72,934

Page 11
December 31, 2010 (€ million)
Automotive Sales financing Intersegment transactions
Consolidated total
Non-current assets
Property, plant and equipment and intangible assets 15,003 188 (10) 15,181
Investments in associates 14,165 34 - 14,199
Non-current financial assets – investments in non-controlled entities
3,359 - (2,431) 928
Non-current financial assets – other securities, loans and derivatives on financing operations of the Automotive segment
800 - - 800
Deferred tax assets and other non-current assets 1,044 145 (49) 1,140
Total non-current assets 34,371 367 (2,490) 32,248
Current assets
Inventories 4,563 4 - 4,567
Customer receivables 1,414 19,642 (451) 20,605
Current financial assets 910 520 (631) 799
Other current assets and current tax assets 1,587 2,222 (1,946) 1,863
Cash and cash equivalents 8,814 1,342 (131) 10,025
Total current assets 17,288 23,730 (3,159) 37,859
TOTAL ASSETS 51,659 24,097 (5,649) 70,107
Shareholders’ equity 22,638 2,435 (2,316) 22,757
Non-current liabilities
Long-term provisions 2,127 116 - 2,243
Non-current financial liabilities 6,835 261 - 7,096
Other non-current liabilities and deferred tax liabilities 394 465 - 859
Total non-current liabilities 9,356 842 - 10,198
Current liabilities
Short-term provisions 921 44 - 965
Current financial liabilities 5,124 - (578) 4,546
Trade payables and sales financing debts 6,407 20,058 (751) 25,714
Other current liabilities and current tax liabilities 7,213 718 (2,004) 5,927
Total current liabilities 19,665 20,820 (3,333) 37,152
TOTAL SHAREHOLDERS’ EQUITY AND LIABILITIES 51,659 2 4,097 (5,649) 70,107

Page 12
A3 – CONSOLIDATED CASH FLOWS BY OPERATING SEGMENT
(€ million) Automotive Sales financing
Intersegment transactions
Consolidated total
2011
Net income 1,975 515 (351) 2,139 Cancellation of dividends received from unconsolidated listed investments (1) (22) - - (22)
Cancellation of income and expenses with no impact on cash
- Depreciation, amortization and impairment 2,820 11 - 2,831
- Share in net (income) loss of associates (1,518) (6) - (1,524)
- Other income and expenses with no impact on cash (350) (10) - (360)
Dividends received from unlisted associates 5 - - 5
Cash flow (2) 2,910 510 (351) 3,069
Dividends received from listed companies (3) 335 - - 335
Decrease (increase) in Sales financing receivables - (2,610) (45) (2,655)
Net change in financial assets and Sales Financing debts - 2,681 (91) 2,590
Change in capitalized leased vehicles (241) 49 - (192)
Decrease (increase) in working capital 627 (413) (8) 206
CASH FLOWS FROM OPERATING ACTIVITIES 3,631 217 (495 ) 3,353
Purchases of intangible assets (887) (1) - (888)
Purchases of property, plant and equipment (1,564) (3) - (1,567)
Disposals of property, plant and equipment and intangibles 239 - - 239
Acquisitions and disposals of investments involving gain or loss of control, net of cash acquired/transferred
- - - -
Acquisitions and disposals of other investments and other assets
(156) - - (156)
Net decrease (increase) in other securities and loans of the Automotive segment
(88) - 126 38
CASH FLOWS FROM INVESTING ACTIVITIES (2,456) (4) 12 6 (2,334)
Cash flows with shareholders (201) (360) 351 (210)
Net change in financial liabilities of the Automotive segment (2,164) - 24 (2,140)
CASH FLOWS FROM FINANCING ACTIVITIES (2,365) (360) 375 (2,350)
INCREASE (DECREASE) IN CASH AND CASH EQUIVALENTS
(1,190) (147) 6 (1,331)
(1) Dividends received from Daimler. (2) Cash flow does not include dividends received from listed companies. (3) Dividends from Daimler (€22 million), AB Volvo (€38 million) and Nissan (€275 million).

Page 13
(€ million) Automotive Sales financing
Intersegment transactions
Consolidated total
2010
Net income 3,392 489 (391) 3,490
Cancellation of dividends received from unconsolidated listed investments
- - - -
Cancellation of income and expenses with no impact on cash
- Depreciation, amortization and impairment 3,045 24 - 3,069
- Share in net (income) loss of associates (1,287) (2) - (1,289)
- Other income and expenses with no impact on cash (2,076) (14) 3 (2,087)
Cash flow (1) 3,074 497 (388) 3,183
Dividends received from listed companies 88 - - 88
Decrease (increase) in sales financing receivables - (563) (31) (594)
Net change in financial assets and Sales Financing debts - (867) 5 (862)
Change in capitalized leased vehicles (155) 48 (2) (109)
Decrease (increase) in working capital 395 (105) (26) 264
CASH FLOWS FROM OPERATING ACTIVITIES 3,402 (990) (4 42) 1,970
Purchases of intangible assets (733) (1) - (734)
Purchases of property, plant and equipment (1,130) (3) - (1,133)
Disposals of property, plant and equipment and intangibles 219 - - 219
Acquisitions and disposals of investments involving gain or loss of control, net of cash acquired/transferred
7 - - 7
Acquisitions and disposals of other investments and other assets (2)
3,075 - - 3,075
Net decrease (increase) in other securities and loans of the Automotive segment
(30) - - (30)
CASH FLOWS FROM INVESTING ACTIVITIES 1,408 (4) - 1, 404
Cash flows with shareholders (12) (407) 402 (17)
Net change in financial liabilities of the Automotive segment (1,493) - 43 (1,450)
CASH FLOWS FROM FINANCING ACTIVITIES (1,505) (407) 445 (1,467)
INCREASE (DECREASE) IN CASH AND CASH EQUIVALENTS
3,305 (1,401) 3 1,907
(1) Cash flow does not include dividends received from listed companies. (2) Including the sales of AB Volvo Series B shares for €3,006 million in the second half of 2010.

Page 14
B – Information by Region
(€ million) Europe (1) Euromed Eurasia Asia-Africa Americas Consolidated total
2011
Revenues 27,408 3,270 1,680 5,060 5,210 42,628
Property, plant and equipment and intangibles
11,192 2,073 469 712 629 15,075
2010
Revenues 27,171 2,996 1,044 3,869 3,891 38,971
Property, plant and equipment and intangibles
11,612 1,644 431 810 684 15,181
(1) Including France:
(€ million) 2011 2010
Revenues 12,119 12,697
Property, plant and equipment and intangibles 9,643 9,918
The Regions presented correspond to the geographic sectors of the Group’s structure.
Consolidated revenues are presented by location of customers.
Property, plant and equipment and intangibles are presented by location of subsidiaries and joint ventures.
.

Page 15
4.2.7 Notes to the consolidated financial statement s 4.2.7.1 Accounting policies and scope of consolidation .................................................................................................. 16 1 – Approval of the financial statements ........................................................................................................................................................ 16 2 – Accounting policies................................................................................................................................................................................... 16 3 – Changes in the scope of consolidation .................................................................................................................................................... 26
4.2.7.2 Income statement and comprehensive income............................................................................................... 27 4 – Revenues ................................................................................................................................................................................................. 27 5 – Cost of sales financing ............................................................................................................................................................................. 27 6 – Operating margin: details of income and expenses by nature ................................................................................................................ 28 7 – Other operating income and expenses .................................................................................................................................................... 28 8 – Financial income ...................................................................................................................................................................................... 29 9 – Current and deferred taxes ...................................................................................................................................................................... 29 10 – Basic and diluted earnings per share..................................................................................................................................................... 32 11 – Other components of comprehensive income ....................................................................................................................................... 33
4.2.7.3 Operating assets and liabilities, shareholders’ equity.......................................................................................... 34 12 – Intangible assets and property, plant and equipment............................................................................................................................ 34 13 – Impairment tests on fixed assets (other than leased vehicles).............................................................................................................. 37 14 – Investment in Nissan .............................................................................................................................................................................. 38 15 – Investments in other associates............................................................................................................................................................. 42 16 – Inventories .............................................................................................................................................................................................. 44 17 – Sales financing receivables.................................................................................................................................................................... 44 18 – Automotive receivables .......................................................................................................................................................................... 46 19 – Other current and non current assets .................................................................................................................................................... 47 20 – Shareholders' Equity .............................................................................................................................................................................. 47 21 – Provisions ............................................................................................................................................................................................... 51 22 – Other current and non current liabilities ................................................................................................................................................. 54
4.2.7.4 Financial assets and liabilities, fair value and management of financial risks...................................................... 55 23 – Financial assets – cash and cash equivalents....................................................................................................................................... 55 24 – Financial liabilities and sales financing debts ........................................................................................................................................ 57 25 – Fair value of financial instruments and impact on net income............................................................................................................... 63 26 – Derivatives and management of financial risks ..................................................................................................................................... 65
4.2.7.5 Cash flows and other information ................................................................................................................... 70 27 – Cash flows .............................................................................................................................................................................................. 70 28 – Related parties ....................................................................................................................................................................................... 71 29 – Off- balance sheet commitments and contingent assets and liabilities ................................................................................................. 72 30 – Fees paid to statutory auditors and their network.................................................................................................................................. 74 31 – Subsequent events................................................................................................................................................................................. 74 32 – Consolidated companies........................................................................................................................................................................ 75

Page 16
4.2.7 Notes to the consolidated financial statement s 4.2.7.1 Accounting policies and scope of consolidat ion
1 – APPROVAL OF THE FINANCIAL STATEMENTS
The Renault group’s consolidated financial statements for 2011 were finalised at the Board of Directors’ meeting of February 15, 2012 and will be submitted for approval of the shareholders at the General Shareholders’ Meeting.
2 – ACCOUNTING POLICIES
In application of regulation 1606/2002 passed on July 19, 2002 by the European Parliament and the Council of Europe, Renault’s consolidated financial statements for 2011 are prepared under IFRS (International Financial Reporting Standards) as issued by the lASB (International Accounting Standards Board) at December 31, 2011 and adopted by the European Union at the year-end.
A - Changes in accounting policies
The following standards, interpretations and amendments were published in the Official Journal of the European Union at December 31, 2011 and were applied for the first time in 2011:
Standard / Interpretation
IAS 24 (revised) Related party disclosures
Various improvements 2010 annual improvements to IFRSs
Amendment to IAS 32 Financial instruments: presentation - Classification of rights issues
IFRIC 19 Extinguishing financial liabilities with equity instruments
Amendment to IFRIC 14 IAS 19 – The limit on a defined benefit asset, minimum funding requirements and their interaction - Prepayments of a minimum funding requirement
The first application of these standards, interpretations and amendments has no significant impact on the financial statements at December 31, 2011.
The Group has not undertaken early application of the amendment to IFRS 7, “Financial instruments: disclosures – transfers of financial assets” which was published in the Official Journal of the European Union at December 31, 2011 but will not be mandatory until January 1, 2013. The Group does not currently expect adoption of this amendment to have a significant impact on the consolidated financial statements. IFRS 10 “Consolidated financial statements” and IFRS 11 “Joint Arrangements” were released by the IASB in 2011. Since they had not been adopted by the European Union at December 31, 2011, early application of these standards was not possible at that date. The Group does not currently expect their application to have a significant impact.
B – Estimates and judgments
In preparing its financial statements, Renault has to make estimates and assumptions that affect the book value of certain assets and liabilities, income and expense items, and the information disclosed in certain notes. Renault regularly revises its estimates and assessments to take account of past experience and other factors deemed relevant in view of the economic circumstances. If changes in these assumptions or circumstances are not as anticipated, the figures reported in Renault’s future financial statements could differ from the estimates established at the time the financial statements were finalised.
The main items in the financial statements that are sensitive to estimates and judgments at December 31, 2011 are the following:
• Fixed assets (note 2-L and 13); • Property, plant and equipment related to leased vehicles or inventories related to used vehicles (notes 2-G,
12-B and 16); • Investments in associates (notes 2-L, 14 and 15); • Sales financing receivables (notes 2-G and 17); • Deferred taxes (notes 2-I and 9); • Provisions, particularly vehicle warranty provisions (note 2-G), provisions for pensions and other long-term
employee benefit obligations (note 21-C) and provisions for workforce adjustment measures (note 7-A).

Page 17
C – Consolidation principles
The consolidated financial statements include the financial statements of all companies controlled exclusively, directly or indirectly, by the Group (“subsidiaries”). Jointly controlled companies (“joint ventures”) are proportionately consolidated. Companies in which the Group exercises significant influence (“associates”) are included in the financial statements on an equity basis.
Significant intercompany transactions and unrealized internal profits are eliminated.
Non-consolidated companies, which fulfil these criteria, are recorded as other non-current assets.
None of these companies' individual contributions to consolidated figures exceeds the following:
• revenues €20 million • inventories €20 million
Their consolidation would have a negligible impact on the consolidated financial statements, since they are Group-financed entities whose losses, if any, are recognized via impairment losses, and which:
• acquire almost all their purchases from Group companies, most of these companies being dealership-type establishments; or
• carry out almost all their sales transactions with Group companies.
D – Presentation of the financial statements
Operating income and operating margin Operating income includes all revenues and costs directly related to the Group’s activities, whether recurrent or resulting from non-recurring decisions or operations, such as restructuring costs.
The operating margin corresponds to the operating income before other operating income and expenses, which cover:
• restructuring costs and costs relating to workforce adjustment; • gains or losses on partial or total disposal of businesses or operating entities, and other gains and losses relating
to changes in the scope of consolidation and direct acquisition costs; • gains or losses on disposal of property, plant and equipment or intangible assets (except vehicle sales); • unusual items, i.e. income and charges that are unusual in their frequency, nature or amount, particularly
impairment of fixed assets.
Reporting by operating segment
The operating segments used by Renault are:
• the Automotive segment, comprising the production, sales, and distribution subsidiaries for passenger and light commercial vehicles, automobile service subsidiaries, and the subsidiaries in charge of cash management for these companies;
• the Sales Financing segment, which the Group considers as an operating activity, carried out by RCI Banque and its subsidiaries for the distribution network and final customers.
The information by operating segment is based on internal reporting to the Group Executive Committee, identified as the “Chief Operating Decision-Maker”. This information is prepared under the IFRSs applicable to the consolidated financial statements. All Group financial data are assigned to the operating segments. The “Intersegment transactions” column is reserved for transactions between the two segments, which are carried out on near-market conditions. Dividends paid by the Sales Financing segment to the Automotive segment are included in the Automotive division’s financial income. The indicator used to evaluate segment performance is the operating margin.
Apart from taxes and the associates’ share in net income, income and expenses relating to sales financing are recorded as operating items. The tax effect inherent to the French consolidated taxation system is included in the tax expense of the Automotive segment.
Assets and liabilities are specific to each segment. Receivables assigned by the Automotive segment to the sales financing companies are treated as operating assets by the assignee when the risks and benefits are substantially transferred.
Vehicles for which the Automotive segment has a repurchase commitment are included in the segment’s assets. When these vehicles are financed by the Sales Financing segment, the Sales Financing segment recognises a receivable on the Automotive segment.
Current and non-current assets and liabilities
Sales financing receivables, other securities, derivatives, loans and financial liabilities of the Sales Financing segment (other than redeemable shares and subordinated loans) are considered as current assets and liabilities, as they are used in normal business cycle of this operating segment.
For the Automotive segment, in addition to items directly related to the business cycle, all assets and liabilities maturing within one year are classified as current.

Page 18
E – Translation of the financial statements of forei gn companies
The Group’s presentation currency is the Euro.
For foreign companies, the functional currency is generally the local currency. In cases where most transactions are carried out in a different currency, that is adopted as the functional currency.
To determine whether a country is in hyperinflation, the Group refers to the list published by the AICPA (American Institute of Certified Public Accountants) Task Force. In 2011, this list included none of the countries where Renault has significant business activity.
Foreign companies’ accounts are established in their functional currency, and subsequently translated into the Group’s presentation currency as follows:
• balance sheet items other than components of shareholders’ equity, which are stated at historical value, are translated at the closing rate of exchange;
• income statement items are translated at the average exchange rate for the period; • the translation adjustment is one of the other components of comprehensive income, and therefore has no impact
on net income.
Goodwill and valuation adjustments generated by a business combination with a foreign company are treated as an asset or liability of the entity acquired, as appropriate. They are therefore expressed in the relevant entity's functional currency, and translated into Euro at the closing rate.
When a foreign company is sold, the accumulated translation adjustments on its assets and liabilities are transferred to net income.
F – Translation of foreign currency transactions
Transactions undertaken in a currency other than the functional currency of the entity concerned are initially translated to and recorded in the functional currency, using the rate applicable at the transaction date.
For financial reporting purposes, monetary items in currencies other than the functional currency are translated at the closing rate. All resulting foreign exchange differences are recognized in the income statement, except for foreign exchange gains and losses on debts, receivables, and financial instruments designated as hedges of the net investment in a foreign entity (note 2-V).
The following impacts are therefore recorded in net income:
• translation adjustments related to financial operations by the Automotive segment are included in the net financial income;
• other translation adjustments are included in the operating margin.
Derivatives are measured and recorded as described in note 2-V.
G – Revenues and margin
Revenues comprise all proceeds from sales of the Group’s automobile products, services related to these sales, sales of automobile technologies, marketing rights and the various sales financing products marketed by the Group’s companies to their customers.
Sales of goods and services and margin recognition
• Sales and margin recognition
Sales of goods are recognized when vehicles are made available to the distribution network in the case of non-Group dealers, or upon delivery to the end-user in the case of direct sales. The margin on sales is recognized immediately for normal sales by the Automotive segment, including sales with associated financing contracts that can be considered as finance leases (long-term or with a purchase option). However, no sale is recognized when the vehicle is covered by an operating lease from a Group finance company or the Group has made a buy-back commitment with a high probability of application, when the term of the contract covers an insufficient portion of the vehicle’s useful life.
In such cases, the transactions are recorded as operating leases and included in sales of services. The difference between the price paid by the customer and the buy-back price is treated as rental income, and spread over the period the vehicle is at the customer’s disposal. The production cost for the new vehicle concerned is recorded in inventories for contracts of less than one year, or included in property, plant and equipment under vehicles leased to customers when the contracts exceed one year. The sale of the vehicle as second-hand at the end of the lease gives rise to recognition of sales revenue and the related margin. The forecast resale value takes account of recent known developments on the second-hand vehicle market but also future anticipated developments over the period in which the vehicles will be sold, which may be influenced by factors both external (economic situation, taxation) and internal (changes in the range, lower manufacturer prices). As soon as a loss is expected on the resale, a provision (if the vehicle is in inventories) or additional depreciation (if the vehicle is included in property, plant and equipment) is recognized to cover the loss. When the overall position of the lease contract (rental income and income on resale) shows a loss, an additional provision is also recorded immediately to cover the future loss.
Sales of automobile technologies and marketing rights are recognized when the associated risks and benefits are actually transferred. The timing of this transfer depends on the terms of the sale contracts, taking into consideration factors such as the period covered and the volumes concerned, and the recoverability or otherwise for the purchaser of the amounts paid.

Page 19
• Sales incentive programmes
When based on the volume or price of the products sold, the cost of these programmes is deducted from revenues when the corresponding sales are recorded. Otherwise, the cost is included in selling, general and administrative expenses. If programmes are approved after the sales, a provision is established when the decision is made.
The Group sometimes organizes promotional campaigns offering reduced-interest loans to end-users. The cost of these operations is recognized immediately when the rates offered cannot cover refinancing and administration costs, and charged to sales financing revenues over the duration of the loan otherwise.
• Warranty
The estimated or incurred costs relating to product or part warranties not covered by insurance are charged to expenses when the sales are recorded. In the event of product recalls relating to incidents that come to light after the vehicle has been put on the market, provisions are established to cover the costs involved as soon as the decision to undertake the recall campaign has been made. Amounts claimed from suppliers are deducted from the warranty expense when it is considered practically certain they will be recovered, and included in Automotive segment customer receivables in the consolidated balance sheet.
• Services related to sales of automobile products
Renault offers its customers extended warranty and maintenance contracts, the income and margin on which are recognized over the period covered by the contract.
Sales financing revenues and margin recognition
• Sales financing revenues
Sales financing revenues are generated by financing operations for sales of vehicles to dealers and end-users. These financing operations take the form of loans from the Sales Financing segment companies, and are carried in the balance sheet at amortized cost under the effective tax rate method, less any impairment. Income on these contracts is calculated so as to give a constant interest rate over the period, and is included in sales revenues.
• Sales financing costs
The costs of sales financing are considered as operating expenses and included in the operating margin. They mainly comprise interest incurred by sales financing companies to refinance their customer transactions, other costs and revenues directly related to administration of this type of refinancing (temporary investments, hedging and management of exchange and interest rate risks), and the cost of risks other than those relating to refinancing of receivables.
• Commissions payable to business intermediaries
Commissions are treated as external distribution costs, and therefore deferred as contract acquisition costs, so as to give a constant interest rate over the term of the financing contracts.
• Impaired receivables
Impairment for credit risk is recognized to cover the risk of non-recovery of receivables. When there is objective evidence of a loss of value (payments overdue, deterioration in the financial position, litigation procedures, etc) for an individual receivable, impairment is determined on an individual basis (using a statistical or case-by-case approach). Otherwise, a collectively based provision may be recorded (for example in the event of unfavorable developments in a macro-economic and/or segment indicator associated with otherwise sound receivables).
Impairment for country risk is determined based on assessment of the systemic credit risk to which debtors are exposed in the event of long-term continuous deterioration in the economic and general environment of the countries included in the base.
H – Financial income (expense)
Except for derivatives, interest income and expenses are recognized under the effective interest rate method, whereby interest and transaction costs are spread on an actuarial basis over the duration of the loan or borrowing.
Interest income and expenses include accrued interest on interest rate derivatives used in fair value and cash flow hedging (when this income or expense is transferred from equity). Changes in the fair value of interest rate derivatives, excluding accrued interest, are included in other financial income and expenses.
Other financial income and expenses also include changes in the fair value of Renault SA redeemable shares and dividends from companies that are neither controlled nor under significant influence, which are recognized in the year they are distributed.

Page 20
I – Income tax
The Group recognizes deferred taxes for all temporary differences between the tax and book values of assets and liabilities in the consolidated balance sheet. Deferred taxes are calculated at the latest tax rate enacted at the closing date applicable to the period when temporary differences are reversed. Each individual fiscal entity (legal entity, establishment or group of entities that pays tax to the tax administration) that is authorized to offset its current tax assets and liabilities reports deferred tax assets and liabilities net. Net deferred tax assets are recognized according to the probability of future recovery.
For fully consolidated companies, a deferred tax liability is recorded in respect of dividend distributions likely to be made by the Group.
For joint ventures and associates, a deferred tax liability on dividend distributions is booked for all differences between the book value and fiscal value of shares held.
Tax credits that can only be used against a taxable profit are recorded as a deduction from the income tax payable. Tax credits that are recoverable regardless of whether the company makes a taxable profit are set against the relevant nature of expense.
J – Intangible assets
Goodwill
Non-controlling interests (formerly called “minority interests”) are carried at fair value (the full goodwill method) or at their share in the fair value of assets acquired and liabilities transferred (the partial goodwill method). To date Renault has only recognized goodwill valued under the partial goodwill. The choice of which method to use will be made for each individual case.
Goodwill is not amortized, but impairment tests are carried out at least annually or whenever there is evidence of loss of value. After initial recognition, goodwill is stated at cost less accumulated impairment.
Goodwill relating to associates is included in the balance sheet line “investments in associates”. In the event of impairment, an impairment loss is booked and included in the consolidated income statement via the share in net income (loss) of associates.
Acquisitions of additional investments and put options on non-controlling interests in companies controlled by the Group are treated as equity transactions. The positive or negative difference between the cost of acquiring shares and the book value of the non-controlling interests acquired is recorded in shareholders’ equity. The non-controlling interests concerned by put options are stated at fair value and reclassified as liabilities in the balance sheet.
Research and development expenses
Development expenses incurred between the approval of the decision to begin development and implement production facilities for a new vehicle or part (e.g. engine or gearbox) and the subsequent approval of the design for mass production are capitalized as intangible assets. They are amortized on a straight-line basis from the date of approval for production, over the expected market life of the vehicle or part, up to a maximum period of seven years. Capitalized development expenses mainly comprise the cost of prototypes, the cost of studies invoiced by external firms, the cost of personnel assigned to the project and a share of overheads dedicated exclusively to development activities.
They also include financing costs for projects that began on or since January 1, 2009. The capitalization rate for borrowing costs is equal to the weighted average interest rate on non-dedicated borrowings of the year, with a limit such that capitalized borrowing costs do not exceed the total borrowing costs borne during the year. When a project is financed through a specific borrowing, the capitalization rate is equal to the interest rate on the borrowing.
Expenses incurred before the formal approval of product development are recorded as costs in the period they are incurred, in the same way as research expenses. Expenses incurred after the start of mass production are treated as production costs.
K – Property, plant and equipment
The gross value of property, plant and equipment corresponds to historical acquisition or production cost.
Design and preparation expenses are included in the asset’s production cost.
Production cost also includes financing costs borne during the construction phase of property, plant and equipment when construction began on or after January 1, 2009. The capitalization rate applied is the same as the rate used for intangible assets.
Investment subsidies received are deducted from the gross value of the assets concerned.
Subsequent expenses for property, plant and equipment, except those incurred to increase productivity or prolong the life of an asset, are charged to expenses as incurred.
Assets used by the Group under finance leases are treated as assets financed by credit.
Vehicles leased to customers are vehicles under lease from a Group finance company, for which the Group has a repurchase commitment, or vehicles sold under an agreement including a buy-back clause covering more than one year (note 2-G).

Page 21
Depreciation
Depreciation is calculated on a straight-line basis over the following estimated useful lives:
Buildings(1) 15 to 30 years
Specific tools 2 to 7 years
Machinery and other tools (other than press lines) 5 to 15 years
Press lines 20 to 30 years
Other tangible assets 4 to 6 years
(1) Buildings in use before 1987 are depreciated over a period of up to 40 years.
Useful lives are regularly reviewed, and accelerated depreciation is recorded when an asset's useful life becomes shorter than the initially expected period of use, particularly when it is decided to withdraw a vehicle or part from the market.
L – Impairment of assets
Impairment of fixed assets (other than leased vehic les)
Fixed assets are subjected to impairment tests as soon as there is any indication of a loss of value, such as significant adverse changes in the market in which the company operates, or changes affecting the circumstances and manner of use of the assets.
For the Automotive segment , impairment tests are carried out at two levels:
• At the level of vehicle-specific and component-specific assets
Vehicle-specific and component-specific assets are capitalized development expenses, specific tools and supplier tools. Impairment tests are carried out by comparing the net book value of the assets with the recoverable value, calculated based on discounted future cash flows related to the vehicle or component.
• At the level of cash-generating units A cash-generating unit is defined as the smallest identifiable group of assets that generates largely independent cash flows. Fixed assets related to cash-generating units include goodwill, specific assets and capacity assets. Impairment tests are carried out on cash-generating units by comparing the net book value with the recoverable value. Recoverable value is defined as the higher of value in use or fair value less selling costs. Value in use is the present value of estimated future cash flows expected to arise from the continuing use of an asset. Future cash flows derive from the business plan drawn up and validated by the Management, plus a terminal value based on discounted normative cash flows after application of a growth rate to infinity. They also include the dividends paid by the Sales Financing segment to the Automotive segment; these dividends represent, in cash form, the Sales Financing segment’s contribution as taken into consideration in internal assessments of project profitability. The assumptions underlying the business plan include estimates of market developments in countries in which the Group operates and its share of those markets, changes in the sale price of products and the prices of purchased components and commodities. The pre-tax discount rate used is the weighted average cost of capital as determined by the company. When the recoverable value is lower than the net book value, impairment equivalent to the difference is recorded against the assets concerned. For the Sales Financing segment , an impairment test is carried out at least once a year or whenever as there is an indication of loss of value, by comparing the book value and recoverable value of assets. Recoverable value is defined as the higher of fair value (less selling costs) and value in use. Value in use is the present value of future cash flows as determined in the most recent 5-year forecasts for each cash-generating unit, consisting of legal entities or groups of legal entities in a given country. The same discount rate is used for all cash-generating units tested: a risk-free 10-year rate increased by the average risk premium for the sector in which the cash-generating units operate.
Impairment of investments in associates
Impairment tests of the value of investments in associates are carried out as soon as there is any indication of a loss of value, essentially significant adverse changes in the markets in which the company operates, or a major or long-term decline in stock market value.
Impairment tests are carried out in compliance with IAS 28 and IAS 36, by comparing the book value of the investment in the associate with the share of the present value of future estimated cash flows expected from the associate.
When the recoverable value is lower than the book value, impairment equivalent to the difference is recorded against the relevant investment in an associate.

Page 22
M – Non-current assets or groups of assets held for sale
Assets held for sale are non-current assets or groups of assets that are available for sale (and do not require significant work to prepare them for sale) and very likely to be sold.
Non-current assets or groups of assets considered to be held for sale are measured and recorded at the lower of net book value or fair value less selling costs. No further impairment or amortization is recorded once an asset is classified as held for sale (or included in a group of assets held for sale). These assets are reported on a specific line of the balance sheet.
N – Inventories
Inventories are stated at the lower of cost or net realisable value. Cost corresponds to acquisition cost or production cost, which includes direct and indirect production expenses, and a share of manufacturing overheads based on a normal level of activity. The normal level of activity is assessed site by site, in order to determine the share of fixed costs to be excluded in the event of below-normal activity.
Inventories are valued under the FIFO (First In First Out) method.
When the net realisable value is lower than the balance sheet value, impairment equal to the difference is recorded.
O – Assignment of receivables
Receivables assigned to third parties (through securitization or discounting) are removed from Group assets when the associated risks and benefits are also substantially transferred to the third parties in question.
The same treatment applies to assignments between the Automotive and Sales Financing segments. The resulting receivables and liabilities are recorded as operating items.
P – Treasury shares
Treasury shares are shares held for the purposes of stock-option plans and free share plans awarded to Group managers and Executives. They are recorded at acquisition cost and deducted from Group shareholders’ equity until the date of sale.
When these shares are sold, the sale price is directly included in consolidated shareholders’ equity. Consequently, no gain or loss on treasury shares is included in the net income for the period.
Q – Stock-option plans / Free share attribution plan s
The Group awards stock-option plans (purchase and subscription options) and share attribution plans, all for Renault shares. The grant date is the date at which beneficiaries are informed of the decision to grant these options or shares, and the terms of the relevant plans. For plans subject to performance conditions, an estimate of achievement of those conditions is taken into account in determining the number of options or free shares attributed. This estimate is reviewed annually based on changes in the probability of performance condition achievement. The final fair value of services rendered in return for attribution of options or free shares is measured by reference to the fair value of those options or shares at their grant date, using a binomial mathematical model. Entitlements to attribution of free shares are valued based on the share value at grant date less dividends expected during the vesting period. Where relevant, a discount is applied to reflect the fact that the shares must be held for a certain period.
The fair value is spread on a straight-line basis over the vesting period for the relevant plan. The cost is included in personnel expenses, with a corresponding adjustment to consolidated reserves. When the option is exercised, the cash amount received by the Group in settlement of the exercise price is booked in cash and cash equivalents, with a corresponding adjustment to consolidated reserves.
In compliance with IFRS 2’s transitional measures, only plans beginning after November 7, 2002 concerning options unvested at January 1, 2005 have been valued and recorded as described above.

Page 23
R – Provisions
Pensions and other long-term employee benefit oblig ations
The Group’s payments for defined-contribution benefit plans are recorded as expenses for the relevant period.
For defined-benefit plans concerning post-employment benefits, the Group uses the Projected Unit Credit Method to determine the present value of its obligations. Under this method, benefits are attributed to periods of service according to the plan's benefit formula, principally on a straight-line basis over the years of service.
The future payments for employee benefits are measured on the basis of future salary increases, retirement age, mortality and length of employment with the company, and are discounted at a rate determined by reference to yields on long-term high quality corporate bonds of a duration corresponding to the estimated average duration of the benefit plan concerned.
The actuarial gains and losses resulting from revisions of the underlying assumptions and experience-based adjustments are included in other components of comprehensive income, as allowed under IAS 19.
The net expense for the year, corresponding to the sum of the current period service costs, the discount cost less the expected return on fund assets and a portion of deferred past service costs, is charged in full to the operating margin.
Restructuring measures / Termination benefits
The estimated cost of restructuring and the cost of workforce adjustment measures is recognized as soon as a detailed plan has been defined and is either announced or in progress.
S – Financial assets
The Group recognizes a financial asset when it becomes a party to the contractual provisions of the instrument.
Financial assets comprise investments in non-controlled companies in which Renault does not exercise significant influence, other securities i.e. short-term investments undertaken for management of cash surpluses, loans, and derivative assets related to financial transactions (note 2-V).
These instruments are presented as non-current assets, apart from those maturing within 12 months of the closing date, which are classified as current assets.
Investments in non-controlled companies in which Re nault does not have significant influence, and othe r securities
Investments in non-controlled companies in which Renault does not have significant influence are considered as “available-for-sale” assets. Other securities are analysed on a case-by-case basis: they are classified as “assets stated at fair value through profit and loss” if the Group intends to sell them in the short term, and as “available-for-sale assets” otherwise.
The fair values of financial assets are determined in priority by reference to the market price. If this is not possible, the Group uses a valuation method that is not based on market data.
Changes in the fair value of “available-for-sale” assets are included in other components of comprehensive income. If there is a significant or prolonged decrease in the fair value such that it falls below the acquisition price, impairment is recorded in the income statement.
Loans
Loans essentially include interbank loans for investment of cash surpluses.
They are initially recognized at fair value, plus directly attributable transaction costs.
Loans are valued at amortized cost. Impairment is recognized in the income statement when there is objective evidence of depreciation in value caused by an event that occurred after the initial recognition of the asset.
T – Cash and cash equivalents
Cash includes cash on hand and bank deposits, with the exception of bank overdrafts, which are included in financial liabilities. These instruments are stated at amortized cost.
Cash equivalents are investments held for the purpose of meeting short-term cash commitments. For an investment to qualify as a cash equivalent, it must be readily convertible for a known amount of cash and be subject to an insignificant risk of change in value. These instruments are stated at fair value.

Page 24
U – Financial liabilities and sales financing debts
The Group recognizes a financial liability (for the Automotive segment) or a sales financing debt when it becomes a party to the contractual provisions of the instrument.
Financial liabilities and sales financing debts comprise redeemable shares, bonds, other debts represented by a certificate, borrowings from credit institutions, other interest-bearing borrowings and derivative liabilities related to financial transactions (note 2-V).
Redeemable shares
In accordance with IAS 39, the Group considers that the variable interest on redeemable shares is an embedded derivative which cannot be valued separately. Consequently, the Group has stated all its redeemable shares at fair value. For these shares, fair value is equal to market value.
Changes in the fair value of Automotive segment redeemable shares are recorded in financial income and expenses, while changes in the fair value of Sales Financing segment redeemable shares are recorded in the operating margin.
Bonds, other debts represented by a certificate, bo rrowings from credit institutions and other interes t-bearing borrowings
Bonds, other debts represented by a certificate, borrowings from credit institutions and other interest-bearing borrowings are initially recorded at fair value, less any directly attributable transaction costs.
At each reporting date, apart from specific hedge accounting methods (note 2-V), these financial liabilities are generally restated at amortized cost using the effective interest rate method. The financial expense calculated in this way includes issuance expenses and issuance or redemption premiums, together with the impact of debt renegotiations when the old and new terms are not substantially different.
Renegotiations of the terms of borrowings and similar operations are recorded as an extinction of the former liability with recognition of a new liability only if there are substantial differences between the old and new terms. When this is the case, the costs borne for renegotiation are included in the financial expenses for the period during which the negotiation takes place.
V – Derivatives and hedge accounting
Measurement and presentation
Derivatives are initially recognized at fair value. This fair value is subsequently reviewed at each closing date.
• The fair value of forward exchange contracts is based on market conditions. The fair value of currency swaps is determined by discounting future cash flows, using closing-date market rates (exchange and interest rates).
• The fair value of interest rate derivatives is the amount the Group would receive (or pay) to settle outstanding contracts at the closing date, taking into account any unrealized gains or losses based on current interest rates and the quality of the counterparty to each contract at the closing date. This fair value includes accrued interest.
• The fair value of commodity derivatives is based on market conditions.
The Automotive segment’s derivatives are reported in the balance sheet as current if they mature within 12 months and non-current otherwise. All Sales Financing segment derivatives are reported in the balance sheet as current.
Hedge accounting
The treatment of derivatives designated as hedging instruments depends on the type of hedging relationship:
• fair value hedge; • cash flow hedge; • hedge of a net investment in a foreign operation.
The Group identifies the hedging instrument and the hedged item as soon as the hedge is set up, and documents the hedging relationship, stating the hedging strategy, the risk hedged and the method used to assess the hedge’s effectiveness. This documentation is subsequently updated, such that the effectiveness of the designated hedge can be demonstrated.
Hedge accounting uses specific measurement and recognition methods for each category of hedge.
• Fair value hedges: the hedged item is adjusted to fair value in view of the risk hedged and the hedging instrument is recorded at fair value. As changes in these items are recorded in the income statement simultaneously, only the ineffective portion of the hedge has an impact on net income. It is recorded in the same income statement item as changes in the fair value of the hedged item and the hedging instrument.
• Cash flow hedges: no adjustment is made to the value of the hedged item; only the hedging instrument is adjusted to fair value. Following this adjustment, the effective portion of the change in fair value attributable to the hedged risk is recorded, net of taxes, in other components of comprehensive income, while the ineffective portion is included in net income. The cumulative amount included in equity is transferred to the income statement when the hedged item has an impact on net income.

Page 25
• Hedge of a net investment in a foreign operation: the hedging instrument is adjusted to fair value. Following this
adjustment, the effective portion of the change in fair value attributable to the hedged exchange risk is recorded, net of taxes, in other components of comprehensive income, while the ineffective portion is included in net income. The cumulative amount included in equity is transferred to net income at the date of liquidation or sale of the investment. The interest rate component of financial instruments used to hedge the investment in Nissan (forward sales and fixed/fixed cross-currency swaps) is treated as an ineffective portion and consequently recorded directly in financial income and expenses.
Derivatives not designated as hedges
Changes in the fair value of derivatives not designated as hedges are recognized directly in financial income, except in the case of derivatives entered into exclusively for reasons closely related to business operations. In this case, changes in the fair value of derivatives are included in the operating margin.

Page 26
3 – CHANGES IN THE SCOPE OF CONSOLIDATION
Automotive Sales Financing Total
Number of companies consolidated at December 31, 20 10 129 38 167
Newly consolidated companies (acquisitions, formations, etc) 4 - 4
Deconsolidated companies (disposals, mergers, liquidations, etc) (4) (2) (6)
Number of companies consolidated at December 31, 20 11 129 36 165
The main changes in the scope of consolidation were as follows:
• 2011
The subsidiary Renault Beijing Automotive Company, which sells imported vehicles on Chinese territory, has been fully consolidated since January 1, 2011.
Fonderie de Bretagne has also been fully consolidated since January 1, 2011. This entity results from Renault’s takeover of SBFM under a receivership procedure.
• 2010
Renault F1 team was deconsolidated as of January 1, 2010. This deconsolidation had no impact on the 2010 financial statements since all the sale transactions were recorded by the end of 2009. Since 2008, through formation of the holding company Renault Environnement, the Group has worked with the SITA / Suez Environnement group to modernise end-of-life vehicle recycling operations in France. Renault Environnement and its subsidiaries Indra Investissements and Boone Comenor, both jointly-owned with SITA, are all included in the Group's scope of consolidation, since January 1, 2010. The Group made some changes during 2010 to the partnership initiated in 2005 with the Indian group Mahindra & Mahindra, which bought out Renault’s shares in the joint venture Mahindra Renault Ltd. The Group is continuing to do business in India through sale of a Logan licence and as the supplier of several components, and the Renault-Nissan Alliance also inaugurated the Chennai plant in March 2010. The joint venture Renault Nissan Automotive India Private Limited has been accounted for by the equity method since January 1, 2010. The Group deconsolidated Renault Venezuela from July 1, 2010 as this subsidiary was not material.

Page 27
4.2.7.2 Income statement and comprehensive income
4 – REVENUES
A – 2010 revenues applying 2011 Group structure and methods
(€ million) Automotive Sales Financing Total
2010 revenues 37,172 1,799 38,971
Changes in the scope of consolidation and other (10) - (10)
2010 revenues applying 2011 Group structure and methods
37,162 1,799 38,961
2011 revenues 40,679 1,949 42,628
B – Breakdown of revenues
(€ million) 2011 2010
Sales of goods 38,697 35,528
Sales of services (1) 2,495 2,126
Sales of goods and services 41,192 37,654
Income on customer financing 981 895
Income on leasing and similar operations 455 422
Sales financing revenues 1,436 1,317
REVENUES 42,628 38,971
(1) including €513 million for Sales financing in 2011 (€482 million in 2010).
Rental income recorded by the Group in connection with vehicle sales with a repurchase commitment or vehicle rentals totalled €548 million in 2011 (€538 million in 2010). This income is included in sales of services.
5 – COST OF SALES FINANCING
(€ million) 2011 2010
Income on cash investments 196 180
Refinancing expenses (1,082) (944)
Net financing costs (886) (764)
Net credit losses (25) (49)
COST OF SALES FINANCING (911) (813)
Page 28
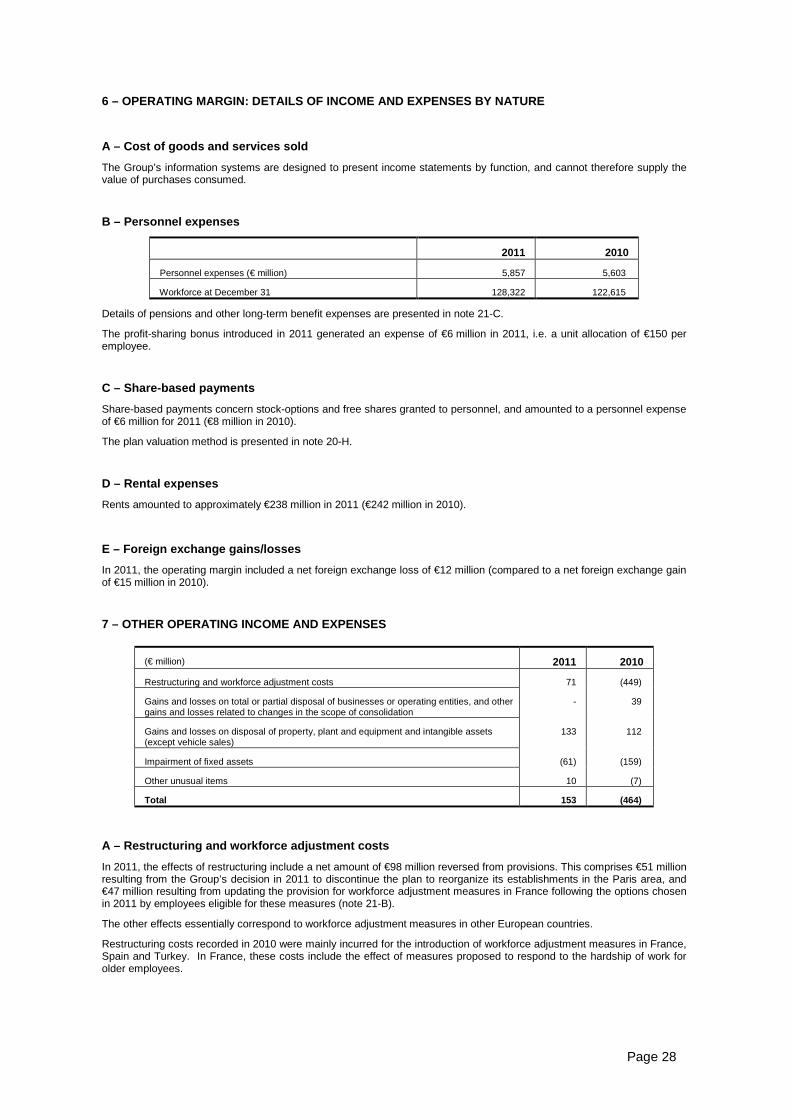
6 – OPERATING MARGIN: DETAILS OF INCOME AND EXPENSES BY NATURE
A – Cost of goods and services sold
The Group’s information systems are designed to present income statements by function, and cannot therefore supply the value of purchases consumed.
B – Personnel expenses
2011 2010
Personnel expenses (€ million) 5,857 5,603
Workforce at December 31 128,322 122,615
Details of pensions and other long-term benefit expenses are presented in note 21-C.
The profit-sharing bonus introduced in 2011 generated an expense of €6 million in 2011, i.e. a unit allocation of €150 per employee.
C – Share-based payments
Share-based payments concern stock-options and free shares granted to personnel, and amounted to a personnel expense of €6 million for 2011 (€8 million in 2010).
The plan valuation method is presented in note 20-H.
D – Rental expenses
Rents amounted to approximately €238 million in 2011 (€242 million in 2010).
E – Foreign exchange gains/losses
In 2011, the operating margin included a net foreign exchange loss of €12 million (compared to a net foreign exchange gain of €15 million in 2010).
7 – OTHER OPERATING INCOME AND EXPENSES
(€ million) 2011 2010
Restructuring and workforce adjustment costs 71 (449)
Gains and losses on total or partial disposal of businesses or operating entities, and other gains and losses related to changes in the scope of consolidation
- 39
Gains and losses on disposal of property, plant and equipment and intangible assets (except vehicle sales)
133 112
Impairment of fixed assets (61) (159)
Other unusual items 10 (7)
Total 153 (464)
A – Restructuring and workforce adjustment costs
In 2011, the effects of restructuring include a net amount of €98 million reversed from provisions. This comprises €51 million resulting from the Group’s decision in 2011 to discontinue the plan to reorganize its establishments in the Paris area, and €47 million resulting from updating the provision for workforce adjustment measures in France following the options chosen in 2011 by employees eligible for these measures (note 21-B).
The other effects essentially correspond to workforce adjustment measures in other European countries.
Restructuring costs recorded in 2010 were mainly incurred for the introduction of workforce adjustment measures in France, Spain and Turkey. In France, these costs include the effect of measures proposed to respond to the hardship of work for older employees.

Page 29
B – Gains and losses on total or partial disposal o f businesses or operating entities, and other gains and losses related to changes in the scope of conso lidation
The Group did not record any disposals of businesses or operating entities in 2011.
The net gain recorded in 2010 essentially reflected the profit on sale of Nissan shares as part of the cooperation agreement with the Daimler group.
C – Gains and losses on disposal of property, plant and equipment and intangible assets (except vehicle sales)
Most of the gain on disposal of property, plant and equipment and intangible assets (except vehicle sales) results from sales of land and buildings located in Europe in 2011 and 2010, and in Korea in 2010.
D – Impairment of fixed assets
In 2011, an amount of €88 million was reversed from impairment previously booked on intangible assets, to reflect the improved cash flow prospects for three vehicles in the range, and impairment of €149 million was recorded in respect of intangible and tangible assets associated with three other vehicles in the range (note 13-A).
In 2010, impairment of assets amounted to €159 million, essentially concerning capitalized development expenses for two vehicles and one powertrain component in the range.
8 – FINANCIAL INCOME
The net interest expense for 2011 amounting to €219 million (€354 million in 2010) includes interest on the loans received from the French government and the European Investment Bank during the first half of 2009.
Other financial income and expenses comprise:
(€ million) 2011 2010
Change in fair value of redeemable shares (note 24-A) 31 (31)
Other 67 9
Total 98 (22)
Other financial income includes dividends received from Daimler in 2011, at their gross value of €30 million.
Foreign exchange gains and losses included under “Other” represent a gain of €27 million in 2011 (compared to a gain of €5 million in 2010).
9 – CURRENT AND DEFERRED TAXES
As Renault SA elected to determine French income taxes under the domestic tax consolidation regime when it was formed, this is the regime applicable to the Group in which Renault SA is taxed in France.
The Renault group also applies other optional tax consolidation systems in Germany, Italy, Spain, and the UK.
A – Current and deferred tax expense
Breakdown of the tax charge
(€ million) 2011 2010
Current income taxes ((408) (340)
Deferred taxes revenue (expenses) (100) 282
Current and deferred taxes (508) (58)
In 2011, €350 million of current income taxes were generated by foreign entities (€274 million in 2010).
Current taxes paid by the Group during 2011 totalled €273 million (€186 million in 2010).

Page 30
B – Breakdown of the tax charge
(€ million) 2011 2010
Income before taxes and share in net income of asso ciates 1,123 2,259
Statutory income tax rate applicable in France 36.1% 34.43%
Theoretical tax income (charge) (405) (778)
Effect of differences between local rate and the French rate 114 102
Tax credits 31 33
Distribution taxes (61) (68)
Change in unrecognized deferred tax assets (215) (136)
Other impacts (1) 28 789
Current and deferred tax income (charge) (508) (58)
(1) Other impacts are primarily the following: permanent differences, income subject to reduced tax rates, the cost of tax reassessments, and prior year adjustments. In 2010 this amount includes the favorable €650 million effect of reduced-rate taxation of the gain on sale of AB Volvo Series B shares.
Until December 31, 2009, as there was no prospect of reporting taxable income, the Group did not recognize the net deferred tax assets of the French tax consolidation group.
Since 2010, the forecast results coming from the 2011/2016 Plan have led the Group to recognize partially the French tax group’s net deferred tax assets. Due to the combined effects of the new 2011 French Finance Law limiting yearly utilization of tax loss carryforwards, and the updated business plan, the amount of tax assets recognized has been reduced by €140 million, with an impact of €100 million in income and €40 million in shareholders’ equity. As a result, net recognized deferred tax assets amount to €215 million.
Restated of the partial recognition of French tax group deferred taxes, the Renault group’s effective tax rate (before the share in net income of associates) was 30% at December 31, 2011, largely thanks to favourable differences between local rates and the rates applicable in France.

Page 31
C – Breakdown of net deferred taxes
C1 – Change in deferred tax assets and liabilities
(€ million) 2011 2010
Deferred tax assets 705 279
Deferred tax liabilities (125) (114)
Net deferred tax assets (liabilities) at January 1 580 165
Deferred tax income (expense) for the period (100) 282
Deferred tax income (expense) included in equity (42) 122
Translation adjustments (10) 11
Change in scope of consolidation and other 3 -
Net deferred tax assets (liabilities) at December 3 1 431 580
- deferred tax assets 566 705
- deferred tax liabilities (135) (125)
C2 - Breakdown of net deferred tax assets by nature
(€ million) December 31, 2011 December 31, 2010
Deferred taxes on:
Investments in associates (1) (147) (116)
Fixed assets (1,844) (1,759)
Provisions and other expenses or valuation allowances deductible upon utilization
1,014 864
Loss carryforwards 3,744 3,590
Other 250 249
Net deferred tax assets (liabilities) 3,017 2,828
Unrecognized deferred tax assets (note 9-C3) (2,586) (2,248)
Net deferred tax assets (liabilities) reported 431 580
(1) Includng tax on future dividend distributions
The residual unrecognized net deferred tax assets of entities included in the French tax consolidation amounted to €1,888 million at December 31, 2011. €680 million of these unrecognized assets arose on items booked through equity (chiefly the effects of the partial hedge of the investment in Nissan, revaluation of financial instruments, and actuarial gains and losses), and €1,208 million on items affecting the income statement.
Outside France, unrecognized deferred tax assets totalled €698 million, essentially relating to tax loss carryforwards generated by the Group in South America.

Page 32
C3 - Breakdown of unrecognized net deferred tax ass ets, by expiry
(€ million) 2011 2010
Net deferred tax assets that can be carried forward indefinitely (1)
2,504 2,159
Other net deferred tax assets expiring in more than 5 years 71 23
Other net deferred tax assets expiring between 1 and 5 years 9 50
Other net deferred tax assets expiring within 1 year 2 16
Total unrecognized net deferred tax assets 2,586 2,248
(1) Including €1,888 million at December 31, 2011 (€1,549 million at December 31, 2010) corresponding to unrecognized net deferred tax assets of entities included in the French tax consolidation (note 9-C2), mainly corresponding to tax loss carryforwards.
10 – BASIC AND DILUTED EARNINGS PER SHARE
(In thousands of shares) 2011 2010
Shares in circulation 295,722 292,127
Treasury shares (3,914) (3,438)
Shares held by Nissan x Renault’s share in Nissan (19,427) (19,397)
Number of shares used to calculate basic earnings p er share 272,381 269,292
The number of shares used to calculate the basic earnings per share is the weighted average number of ordinary shares in circulation during the period, i.e. after neutralization of treasury shares and Renault shares held by Nissan.
(In thousands of shares) 2011 2010
Number of shares used to calculate basic earnings per share 272,381 269,292
Dilutive effect of stock-options and free share attribution rights - -
Number of shares used to calculate diluted earnings per share 272,381 269,292
The number of shares used to calculate the diluted earnings per share is the weighted average number of ordinary shares potentially in circulation during the period, i.e. the number of shares used to calculate the basic earnings per share plus the number of stock-options and rights to free share attribution, that have a dilutive effect and fulfil the performance conditions at the year-end when issuance is conditional.

Page 33
11 – OTHER COMPONENTS OF COMPREHENSIVE INCOME
A – Breakdown of other components of comprehensive income
(€ million) 2011 2010
Actuarial gains and losses on defined benefit pensi on plans (23) (14)
Translation adjustments on foreign activities
Gains / (losses) for the period (107) 234
Reclassification under net income - 24
Total translation adjustments on foreign activities (107) 258
Partial hedge of the investment in Nissan
Gains / (losses) for the period (142) (280)
Reclassification under net income - 38
Total Partial hedge of the investment in Nissan (142) (242)
Cash flow hedges
Gains / (losses) for the period (24) (28)
Reclassification under net income 11 108
Total cash flow hedges (13) 80
Available-for-sale financial assets
Gains / (losses) for the period (257) 232
Reclassification under net income - -
Total available-for-sale financial assets (257) 232
Associates’ share of other components of comprehens ive income 444 2,110
Other components of comprehensive income (98) 2,424
B – Tax effects of other components of comprehensiv e income
(€ million) Other components of comprehensive income
2011 2010
Before tax Tax
After tax
Before tax Tax
After tax
Actuarial gains and losses on defined benefit pension plans
(24) 1 (23) (19) 5 (14)
Translation adjustments on foreign activities
(107) - (107) 258 - 258
Partial hedge of the investment in Nissan
(84) (58) (142) (375) 133 (242)
Cash flow hedges (8) (5) (13) 73 7 80
Available-for-sale financial assets (274) 17 (257) 249 (17) 232
Associates’ share of other components of comprehensive income
441 3 444 2,116 (6) 2,110
Total (56) (42) (1) (98) 2,302 122 (1) 2,424
(1) Including an expense of €40 million in 2011 (income of €112 million in 2010) related to partial recognition of the French tax group’s net deferred tax assets (note 9-B).

Page 34
4.2.7.3 Operating assets and liabilities, sharehold ers’ equity
12 – INTANGIBLE ASSETS AND PROPERTY, PLANT AND EQUIPMENT
A - Intangible assets
A1 - Intangible assets at December 31
(€ million) December 31, 2011 December 31, 2010
Capitalized development expenses 7,800 7,099
Goodwill 246 250
Other intangible assets 437 443
Intangible assets, gross 8,483 7,792
Capitalized development expenses (4,466) (3,821)
Other intangible assets (299) (294)
Amortization and impairment (4,765) (4,115)
Intangible assets, net 3,718 3,677
Most goodwill are in Europe.
A2 - Changes during the year
(€ million) Gross value Amortization and impairment
Net value
Value at December 31, 2009 7,648 (3,755) 3,893
Acquisitions (note 27-C)/(amortization) 751 (987) (236)
(Disposals)/reversals (640) 639 (1)
Translation adjustment 30 (20) 10
Change in scope of consolidation and other 3 8 11
Value at December 31, 2010 7,792 (4,115) 3,677
Acquisitions (note 27-C)/(amortization) 874 (829) 45
(Disposals)/reversals (174) 174 -
Translation adjustment (8) 4 (4)
Change in scope of consolidation and other (1) 1 -
Value at December 31, 2011 8,483 (4,765) 3,718
Acquisitions of intangible assets in 2011 comprise €825 million of self-produced assets and €49 million of purchased assets (respectively €676 million and €75 million in 2010). They also include €16 million of capitalized borrowing costs. The capitalization rate for borrowing costs in 2011 is 2.47%.
Amortization and impairment in 2011 include cancellation of €88 million of impairment previously recorded on capitalized development expenses for three vehicles in the range, and €84 million of impairment recorded on one other vehicle (note 7-D).
In 2010, impairment on assets amounted to €144 million and essentially concerned capitalized development expenses for two vehicles and one component in the range.

Page 35
A3 - Research and development expenses included in income
(€ million) 2011 2010
Research and development expenses (2,064) (1,728)
Capitalized development expenses 808 666
Amortization of capitalized development expenses (771) (772)
TOTAL REPORTED IN INCOME STATEMENT (2,027) (1,834)
B – Property, plant and equipment
B1 - Property, plant and equipment at December 31
(€ million) December 31, 2011 December 31, 2010
Land 598 594
Buildings 5,942 5,877
Specific tools 12,569 12,109
Machinery and other tools 9,656 9,879
Vehicles leased to customers 2,139 2,123
Other tangibles 857 871
Construction in progress 1,545 793
Property, plant and equipment, gross 33,306 32,246
Land and buildings (3,090) (2,923)
Specific tools (10,319) (9,407)
Machinery and other tools (7,154) (7,055)
Vehicles leased to customers (608) (581)
Other tangibles (778) (776)
Depreciation and impairment (21,949) (20,742)
Property, plant and equipment, net 11,357 11,504
Depreciation and impairment in 2011 include impairment of €65 million on three vehicles in the range (note 7-D), compared to €13 million of impairment in 2010.

Page 36
B2 - Changes during the year
Changes during 2011 in property, plant and equipment were as follows:
(€ million) December 31, 2010
Acquisitions /
(depreciation and
impairment)
(Disposals)/ reversals
Translation adjustments
Change in scope of
consolidation and other
December 31, 2011
Land 594 20 (34) - 18 598
Buildings 5,877 231 (103) (32) (31) 5,942
Specific tools 12,109 399 (169) (60) 290 12,569
Machinery and other tools 9,879 335 (301) (63) (194) 9,656
Vehicles leased to customers 2,123 723 (716) 2 7 2,139
Other tangibles 871 57 (38) (6) (27) 857
Construction in progress (1) 793 845 - (7) (86) 1,545
Property, plant and equipment, gross (2)
32,246 2,610 (1,361) (166) (23) 33,306
Land - - - - - -
Buildings (2,923) (228) 51 12 (2) (3,090)
Specific tools (9,407) (962) 165 40 (155) (10,319)
Machinery and other tools (7,055) (575) 284 43 149 (7,154)
Vehicles leased to customers (3) (581) (196) 182 (1) (12) (608)
Other tangibles (776) (41) 34 4 1 (778)
Construction in progress - - - - - -
Depreciation and impairment (20,742) (2,002) 716 98 (19) (21,949)
Land 594 20 (34) - 18 598
Buildings 2,954 3 (52) (20) (33) 2,852
Specific tools 2,702 (563) (4) (20) 135 2,250
Machinery and other tools 2,824 (240) (17) (20) (45) 2,502
Vehicles leased to customers 1,542 527 (534) 1 (5) 1,531
Other tangibles 95 16 (4) (2) (26) 79
Construction in progress (1) 793 845 - (7) (86) 1,545
Property, plant and equipment, net
11,504 608 (645) (68) (42) 11,357
(1) Items classified as “construction in progress” are transferred to completed asset categories via the “acquisitions / (depreciation and impairment)” column.
(2) Acquisitions during 2011 include €26 million of borrowing costs capitalized over the year. The capitalization rate for borrowing costs in 2011 is 2.47%.
(3) Impairment of vehicles leased to customers amounts to €163 million at December 31, 2011 (€154 million at December 31, 2010).
Changes during 2010 in property, plant and equipment were as follows:
(€ million) Gross value Depreciation and
impairment
Net value
Value at December 31, 2009 31,463 (19,169) 12,294
Acquisitions/(depreciation and impairment) 1,825 (2,084) (259)
(Disposals)/reversals (1,418) 689 (729)
Translation adjustment 368 (183) 185
Change in scope of consolidation and other 8 5 13
Value at December 31, 2010 32,246 (20,742) 11,504

Page 37
13 – IMPAIRMENT TESTS ON FIXED ASSETS (OTHER THAN LEASED VEHICLES)
The Group carried out impairment tests on its fixed assets under the approach described in the accounting policies (note 2-L).
A – Impairment tests on vehicle-specific and compon ent-specific assets
Following impairment tests of assets dedicated to specific vehicles or components, impairment of €149 million was booked during 2011 (€159 million at December 31, 2010), in respect of three models in the range. This impairment is allocated in priority to capitalized development expenses. €88 million of impairment previously recognized on intangible assets was also cancelled, reflecting the improvement in cash flow prospects associated with three vehicles in the range.
Valuation of specific assets during impairment tests is sensitive to the assumptions applied concerning changes in volumes and margin levels. For vehicles presenting the greatest risk, a further 20-35% decrease in any of the assumptions used would bring the value in use to the same level as the book value.
B – Impairment tests on cash-generating units – Aut omotive segment
In 2011, only the Korea cash-generating unit was subjected to an impairment test, as there were no indications of impairment in the Group’s other geographically determined cash-generating units.
The recoverable value used for the purposes of the impairment tests for Korea is the value in use, determined under the discounted future cash flow method on the basis of the following assumptions:
Korea 2011 2010
Business plan duration 6 years N / A
Growth rate to infinity 2.7 % N / A
After-tax discount rate 8.5 % N / A
In 2011 as in 2010, no impairment was recognized on assets included in the cash-generating units subjected to impairment tests.
An impairment test was also carried out on the Automotive segment as a cash-generating unit, following the same procedure as for tests of other cash-generating units.
The assumptions used for the Automotive segment are as follows:
2011 2010
Business plan duration 6 years 6 years
Forecast sales volumes over the projected horizon (units)
3,350,000 3,052,000
Growth rate to infinity 1.8 % 1.5 %
After-tax discount rate 8.5 % 8.2 %
In 2011 as in 2010, no impairment was recognized on assets included in the Automotive segment as a result of the impairment tests.
Changes in the assumptions underlying the calculations show that to cover the assets, for each factor considered individually:
• The projected volume reduction must not exceed 300,000 units; • The after-tax discount rate must not exceed 11.8%.
With a growth rate to infinity close to zero, the conclusions of the test are unaffected.

Page 38
14 – INVESTMENT IN NISSAN
A – Nissan consolidation method
Renault and Nissan have chosen to develop a unique type of alliance between two distinct companies with common interests, uniting forces to achieve optimum performance. The Alliance is organized so as to preserve individual brand identities and respect each company’s corporate culture.
Consequently:
• Renault does not hold the majority of Nissan voting rights. • The terms of the Renault-Nissan agreements do not entitle Renault to appoint the majority of Nissan directors, nor
to hold the majority of voting rights at meetings of Nissan’s Board of Directors; at December 31, 2011 as in 2010, Renault supplied four of the total nine members of Nissan’s Board of Directors.
• Renault Nissan BV, owned 50% by Renault and 50% by Nissan, is the Alliance’s joint decision-making body for strategic issues concerning either group individually. Its decisions are applicable to both Renault and Nissan. This entity does not enable Renault to direct Nissan’s financial and operating strategies, and cannot therefore be considered to represent contractual control by Renault over Nissan. The matters examined by Renault Nissan BV since it was formed have remained strictly within this contractual framework, and are not an indication that Renault exercises control over Nissan.
• Renault can neither use nor influence the use of Nissan’s assets in the same way as its own assets. • Renault provides no guarantees in respect of Nissan’s debt.
In view of this situation, Renault is considered to exercise significant influence in Nissan, and therefore uses the equity method to include its investment in Nissan in the consolidation.
B – Nissan consolidated financial statements includ ed under the equity method in the Renault consolidation
The Nissan accounts included under the equity method in Renault’s financial statements are Nissan’s consolidated accounts published in compliance with Japanese accounting standards (as Nissan is listed on the Tokyo stock exchange), after adjustments for the requirements of the Renault consolidation.
Nissan publishes consolidated financial statements quarterly, and annually at March 31. For the purposes of the Renault consolidation, Nissan results are included in line with the Renault calendar (the results for the period January to December are consolidated in Renault’s annual financial statements).
Nissan held 1.15% of treasury shares at December 31, 2011 (0.9% at December 31, 2010). Consequently, Renault’s percentage interest in Nissan was 43.9% at December 31, 2011 (43.8% at December 31, 2010).
C – Changes in the investment in Nissan as shown in Renault’s balance sheet
Share in net assets Net goodwill Total
(€ million) Before neutralization
Neutralization proportional to
Nissan’s investment in
Renault (1)
Net
At December 31, 2010 13,442 (975) 12,467 878 13,345
2011 net income 1,332 1,332 1,332
Dividend distributed (275) (275) (275)
Translation adjustment 617 617 75 692
Other changes (2) (163) (163) (163)
At December 31, 2011 14,953 (975) 13,978 953 14,931
(1) Nissan has held 15% of Renault since the acquisition in 2002, excluding the subsequent impacts of Renault's purchases of its treasury shares.
(2) Other changes include Renault dividends received by Nissan, the change in actuarial gains and losses on pension obligations, the change in the financial instrument revaluation reserve and changes in Nissan treasury shares.

Page 39
D – Changes in Nissan equity restated for the purpo ses of the Renault consolidation
(in billions of yen) December 31, 2010
2011 net income
Dividends Translation adjustment
Other changes (1)
December 31, 2011
Shareholders' equity – Nissan share under Japanese GAAP
2,858 297 (63) (153) (30) 2,909
Restatements for Renault group requirements :
• Restatement of fixed assets 352 (4) 348
• Provision for pension and other long term employee benefit obligations (2)
(174) 37 3 (31) (165)
• Capitalization of development expenses
540 (14) 526
• Deferred taxes and other restatements(3)
(239) 18 (4) 10 9 (206)
Net assets restated for Renault group requirements
3,337 334 (67) (140) (52) 3,412
(€ million)
Net assets restated for Renault group requirements
30,704 3,042 (628) 1,410 (474) 34,054
Renault's percentage 43.8% 43,9%
Renault's share (before neutralization described below)
13,442 1,332 (275) 617 (163) 14,953
Neutralization proportional to Nissan’s investment in Renault (4)
(975) (975)
Renault's share in the net assets of Nissan
12,467 1,332 (275) 617 (163) 13,978
(1) Other changes mainly include the change in actuarial gains and losses on pension obligations, the change in the financial instrument revaluation reserve, and changes in Nissan treasury shares.
(2) Including actuarial gains and losses recognized in equity.
(3) Including elimination of Nissan’s investment in Renault, accounted by the equity method.
(4) Nissan has held 15% of Renault since the acquisition in 2002, excluding the subsequent impacts of Renault's purchases of treasury shares.
E – Nissan net income under Japanese GAAP
Since Nissan’s financial year ends at March 31, the Nissan net income included in the 2011 Renault consolidation is the sum of Nissan’s net income for the final quarter of its 2010 financial year and the first three quarters of its 2011 financial year.
January to March 2011
April to June 2011
July to September 2011
October to December 2011
January to December 2011
Fourth quarter of Nissan’s 2010 financial year
First quarter of Nissan’s 2011 financial year
Second quarter of Nissan’s 2011 financial year
Third quarter of Nissan’s 2011 financial year
Reference period for Renault’s 2011
consolidated financial statements
(in billions of yen)
(€ million)
(1)
(in billions of yen)
(€ million)
(1)
(in billions of yen)
(€ million)
(1)
(in billions of yen)
(€ million)
(1)
(in billions of yen)
(€ million) (1)
Net income – parent-company shareholders’ share
31 274 85 723 98 896 83 793 297 2,686
(1) Converted at the average 2011 exchange rate for each quarter.
F - Impacts of the Japanese earthquake and tsunami disaster on Nissan’s 2011 contribution
Nissan describes the impacts of the earthquake and tsunami in Japan in its official publications for the financial year ended March 31, 2011 and the first three quarters of its 2011/2012 financial year.

Page 40
G – Nissan financial information under IFRS
The table below presents Nissan financial information, restated for the purposes of the Renault consolidation, for the period January 1 – December 31, 2011. The restatements include adjustments for harmonization of accounting standards and the adjustments to fair value of assets and liabilities applied by Renault at the time of acquisitions in 1999 and 2002.
(in billions of yen)
(€ million) (1)
2011 revenues 8,962 80,724
2011 net income (2) 365 3,288
Shareholders’ equity at December 31, 2011
3,700 36,930
Balance sheet total at December 31, 2011 11,257 112,350
(1) Converted at the average exchange rate for 2011 i.e.111.0 JPY = 1 EUR for income statement items, and at the December 31, 2011 rate i.e. 100.2 JPY = 1 EUR for balance sheet items.
(2) The net income reported does not include Renault’s contribution to Nissan net income. It includes a favourable impact of 39 billion yen (€376 million) resulting from restatements for the purposes of the Renault consolidation during the final quarter of 2011, relating to pension plans and the reduction in the Japanese income tax rate.
H – Hedging of the investment in Nissan
The Group has partially hedged the Yen/Euro exchange risk on its investment in Nissan since 1999.
At December 31, 2011, the corresponding hedging operations totalled 95 billion yen (€952 million), comprising 20 billion yen (€200 million) of private placements on the EMTN market and 75 billion yen (€752 million) in bonds issued directly in yen on the Japanese Samurai bond market.
During 2011, these operations generated unfavourable foreign exchange differences of €84 million (€413 million in 2010). After deduction of deferred taxes, the net unfavourable effect of €(142) million was included in the Group’s consolidated reserves (note 20-E).
I – Valuation of Renault’s investment in Nissan at s tock market prices
Based on the quoted price at December 31, 2011 of JPY 692 per share, Renault’s investment in Nissan is valued at €13,550 million (€13,959 million at December 31, 2010 based on the price of JPY 773 per share).
J – Impairment test of the investment in Nissan
At December 31, 2011, the stock market value of the investment was 9% lower than its book value in Renault’s balance sheet. In view of this, an impairment test was carried out in application of the approach presented in the note on accounting policies (2-L).
As this investment is strategic , in compliance with IAS 36 the recoverable value was determined based on the higher of stock market value, representing “fair value”, and value in use, estimated on the basis of discounted cash flows defined in the business plan drawn up by Nissan management. An after-tax discount rate of 7% and a growth rate to infinity of 3% were used to calculate value in use. The terminal value was calculated under profitability assumptions consistent with Nissan’s past data and balanced medium-term prospects.
The test results did not lead to recognition of any impairment on the investment in Nissan in 2011.
A 1% increase in the discount rate associated with a 1% decrease in the growth rate to infinity or a 2% decrease in the operating margin would have no impact on the book value of the investment in Nissan.
K – Operations between the Renault group and the Ni ssan group
Renault and Nissan follow joint strategies for vehicle and part development, purchasing, and production and distribution resources.
The cooperation between the two groups in 2011 principally takes the following forms:
Joint investments
Renault and Nissan share development costs and investments for gearbox and engine production.
The two Groups have made joint investments since 2007 for production of Logan vehicles. This type of cooperation now also exists in South Africa, where the Nissan group has manufactured the Sandero since 2009.
In 2011, the Alliance’s Chennai plant in India began production of the “cross-badged” Renault Pulse, an adaptation of the Nissan Micra.
Page 41
Vehicle manufacturing
In Brazil, Renault supplies Nissan with assembly services for its Frontier pick-up and Livina models at the Curitiba plant. 32,600 vehicles were assembled during the year.
Renault Samsung Motors produced 43,800 Nissan-badged SM3 vehicles in 2011, purchased by Nissan for sale through its own network (mainly in Russia and the Middle East).
Since 2011, the Chennai plant has provided assembly services for the Fluence and Koleos vehicles sold on the Indian market by Renault dealers.
Concerning light commercial vehicles, Nissan produced 70,000 Trafic vans over the year at its Barcelona plant in Spain. 7.6% of these are sold through the Nissan network. Renault, meanwhile, produced 2,800 Interstars (Nissan-badged Masters), which are purchased by Nissan for sale through its own network. The increase in sales of this model to Nissan is explained by the launch in September 2011 of the new Master, which is manufactured at Batilly in France.
Part sales
In Europe, the Renault group produces engines common to the Alliance at its Cléon plant in France, for use by Nissan’s Japanese and UK plants in the Nissan Qashqai and X-Trail vehicles. In 2011 Nissan began assembly of the Alliance’s third engine (a 1.6 dCi diesel engine) for the Qashqai at its Sunderland plant in the UK.
Renault also supplies gearboxes and engines manufactured at the plants in Cacia in Portugal, Valladolid and Seville in Spain, Cléon in France and Pitesti in Romania to Nissan's plants in Sunderland in the UK, Barcelona in Spain, and Saint Petersburg in Russia. The Cléon plant also produces and supplies V6 3-litre diesel engines for Infiniti vehicles assembled by Nissan at its Tochigi plant in Japan.
In South America, Renault supplies gearboxes made by Cormecanica to Nissan plants located mostly in Mexico, South Africa and Brazil. These parts are used in Nissan's Micra, Note and Qashqai. Starting in 2011, Nissan’s Aguascalientes plant in Mexico is supplied with gearboxes produced by Cormecanica in Chile and engines produced by Renault do Brasil for assembly of the Nissan Micra.
In total Renault supplied 1,025,000 gearboxes and 348,000 engines during 2011.
In South Korea, Nissan supplies Renault Samsung Motors with parts used in production of the SM3 (Fluence), the SM5 (Latitude), the new SM7 and the Koleos.
Renault also uses Nissan's V6 3.5 litre petrol engine for the Laguna III, Nissan pinions for the Megane range, and automatic gearboxes, with continuous variable transmissions for the Megane and the Espace. Renault also uses a 2.0 litre engine developed jointly with Nissan for the Laguna and Clio. In 2011, Nissan began to supply rear axles for the Dacia Duster. Starting in 2011, batteries and battery components produced by the Nissan/NEC joint venture AESC in Japan are used to produce the zero-emission Fluence and Kangoo electric cars at Bursa in Turkey and Maubeuge in France.
Sales
In Europe, Renault also markets Nissan vehicles in Bulgaria, Croatia, Romania, Serbia and Slovenia. In South America, Renault markets Nissan vehicles in Argentina.
Conversely, Nissan markets Renault vehicles in Japan, Australia and the Gulf countries.
Finance
From trading rooms in Lausanne and Singapore, Renault Finance acts as the Nissan group’s counterparty in financial instruments trading to hedge foreign exchange, interest rate and commodity risks, in addition to its business for Renault. On the foreign exchange markets during 2011, Renault Finance undertook foreign exchange transactions totalling approximately €22.3 billion on behalf of Nissan. Foreign exchange, interest rate and commodity derivative transactions, undertaken for Nissan, are recorded at market price and included in the positions managed by Renault Finance.
Relations with the Sales Financing segment
The Sales Financing segment helps to attract customers and build loyalty to the Nissan brands through a range of financing products and services incorporated into its sales policy, principally in Europe. In 2011, the consolidated RCI subgroup recorded €122 million of income in the form of commission and interest received from Nissan.
Total figures for 2011
Total sales by Renault to Nissan and purchases by Renault from Nissan during 2011 amounted to an estimated €2,100 million and €1,800 million respectively.
The joint policies for purchasing and other administrative functions such as information systems departments are reflected directly in the Renault and Nissan financial statements, and therefore generate no financial exchanges between the two Groups.

Page 42
15 – INVESTMENTS IN OTHER ASSOCIATES
Details of investments in other associates are as follows:
• Balance sheet value: €1,060 million at December 31, 2011 (€854 million at December 31, 2010), • Renault’s share in the net income of other associates: €192 million for 2011 (€205 million for 2010).
Most of these amounts relate to the investments in AB Volvo and in AvtoVAZ, accounted under the equity method.
A – AB Volvo
AB Volvo’s financial year-end is December 31.
A1 – Changes in the value of Renault’s investment i n AB Volvo as shown in Renault’s balance sheet
(€ million) Share in net assets Net goodwill Total
At December 31, 2010 505 13 518
2011 net income 136 - 136
Dividend distributed (38) - (38)
Purchase of AB Volvo treasury shares - - -
Translation adjustment, actuarial gains and losses and revaluation of financial instruments
(33) 0 (33)
At December 31, 2011 570 13 583
AB Volvo’s share capital comprises two types of shares, Series A and Series B shares. Series B shares carry only one tenth of the voting rights. After the disposal of shares in October 2010, the Renault group now holds only Series A shares. At the request of certain shareholders, in 2011 AB Volvo converted 14,107,000 Series A shares into Series B shares. This had no material impact on the Group’s level of control in AB Volvo, which stands at 17.7% at December 31, 2011 compared to 17.5% at December 31, 2010. The Renault group is represented on AB Volvo’s Board of Directors by one person appointed for the purpose. Renault’s percentage interest in AB Volvo is 6.8%, unchanged from December 31, 2010. Based on AB Volvo’s stock market share price of SEK 76 per A share at December 31, 2011, Renault’s investment in AB Volvo is valued at €1,181 million.
A2 – Changes in AB Volvo equity restated for the pu rposes of the Renault consolidation
(€ million) December 31, 2010
Net income 2011
Dividends Other changes December 31, 2011
Shareholders’ equity – AB Volvo share
8,155 1,966 (558) (72) 9,491
Restatements for Renault group requirements
(770) 30 - (412) (1,152)
Net assets restated for Renault group requirements
7,385 1,996 (558) (484) 8,339
Renault’s share in the net assets of AB Volvo
505 136 (38) (33) 570
The restatements applied for Renault group requirements mainly concern cancellation of goodwill booked in AB Volvo’s accounts when AB Volvo was acquired by Renault and recognition of actuarial gains and losses in equity.
A3 – AB Volvo financial information under IFRS
AB Volvo financial information for 2011 established under IFRS, as published by AB Volvo, is summarized as follows:
(in millions of SEK) (€ million) (1)
2011 revenues 310,367 34,380
2011 net income 18,115 2,007
Shareholders’ equity at December 31 85,681 9,614
Balance sheet total at December 31, 2011 353,244 39,646
(1) Converted at the average exchange rate for 2011 i.e. SEK 9.03 = €1 for income statement items, and at the December 31, 2011 rate i.e. SEK 8.91 = €1 for balance sheet items.
A4 – Operations between the Renault group and the A B Volvo group
There were no significant joint operations by the Renault group and the AB Volvo group in 2011.

Page 43
B – AVTOVAZ
AvtoVAZ’s financial year-end is December 31. For the purposes of the Renault consolidation, given the existing time constraints for production of financial information, the accounts of AvtoVAZ are consolidated with a 3-months time-lag. Consequently, the AvtoVAZ net income included in Renault’s 2011 consolidated financial statements is the sum of AvtoVAZ’s net income for the final quarter of its 2010 financial year and the first three quarters of its 2011 financial year.
B1 – Changes in the value of Renault’s investment i n AvtoVAZ as shown in Renault’s balance sheet
(€ million) Share in net assets
At September 30, 2010 91
Net income for the period October 1, 2010 to September 30, 2011 49
Capital increases 109
Repurchase of AvtoVAZ treasury shares -
Translation adjustment, actuarial gains and losses and revaluation of financial instruments (19)
At September 30, 2011 230
In application of the restructuring and recapitalization agreement signed in July 2010 by the shareholders of AvtoVAZ (Renault, Russian Technologies and Troïka Dialog), Renault subscribed to a capital increase for the amount of €109 million. The capital increase was paid quarterly and is recorded in AvtoVAZ’s financial statements at December 31, 2011. After this operation, Renault retains its 25% investment plus one share in AvtoVAZ.
Although the accounts of AvtoVAZ are consolidated with a 3-months time-lag, to avoid any mismatch between the Renault group’s investments and the value of the AvtoVAZ group as reported in its accounts, the total value of this capital increase has been included in the Renault consolidation, including the last payment that took place during the final quarter of 2011 (€14 million). Renault’s contribution to the capital increase was fully allocated to financing the technical assistance supplied by Renault, and tangible assets of the B0 platform (for the Logan). This platform will be shared by AvtoVAZ and the Alliance, and is due to start operations in the first half of 2012.
In late October 2011 AvtoVAZ announced that it was to purchase 100% of the capital of OAG, which during the second half of 2011 purchased the assets of the Russian automaker IzhAvto. Details of this acquisition are still under finalization, and the Renault group does not expect it to have any material impact on AvtoVAZ’s future contributions.
Based on the stock market price of the AvtoVAZ share at December 31, 2011, Renault’s investment in AvtoVAZ is valued at €237 million, which is higher than the value of AvtoVAZ in Renault’s financial statements (€230 million).
B2 – Changes in AvtoVAZ equity restated for the pur poses of the Renault consolidation
(€ million) October 1, 2010
Net income for the period
October 1, 2010 –
September 30, 2011
Capital increase
Other changes
September 30, 2011
Shareholders’ equity – AvtoVAZ share 334 186 437 (73) 884
Restatements for Renault group requirements
30 9 - (2) 37
Net assets restated for Renault group requirements
364 195 437 (75) 921
Renault’s share in the net assets of AvtoVAZ
91 49 109 (19) 230
Restatements for Renault group requirements mainly concern valuation of intangibles (the Lada brand) and fair value measurement of financial liabilities.

Page 44
B3 – AvtoVAZ financial information under IFRS
AvtoVAZ’s published financial information under IFRS for 2010 (year ended December 31) and the first three quarters of the year 2011 are summarised below:
2010 (millions of roubles) (€ million) (1)
2010 revenues 137,630 3,372
2010 net income 3,567 87
Shareholders’ equity at December 31, 2010 15,244 378
Balance sheet total at December 31, 2010 120,046 2,980
(1) Converted at the average exchange rate for 2010 i.e. 40.82 RUB = 1 EUR for income statement items and the exchange rate at December 31, 2010 i.e 40.28 RUB = 1 EUR for balance sheet items.
January to September 2011 (millions of roubles) (€ million) (1)
Revenues, January – September 2011 128,174 3,166
Net income, January – September 2011 6,848 169
Shareholders’ equity at September 30, 2011 36,393 840
Balance sheet total at September 30, 2011 128,975 2,975
(1) Converted at the average exchange rate for January to September 2011, i.e. 40.48 RUB = 1 EUR for income statement items and the exchange rate at September 30, 2011, i.e 43.35 RUB = 1 EUR for balance sheet items
B4 – Operations between the Renault group and the A vtoVAZ group
In application of the agreement of July 2010, the Renault group began to provide technical assistance for assembly of the B0 platform shared by the Alliance and AvtoVAZ, and consulting services in areas such as purchases, quality and IT. During 2011 the Renault group invoiced €55 million to AvtoVAZ for these services.
16 – INVENTORIES
(€ million) December 31, 2011 December 31, 2010
Raw materials and supplies 1,132 1,058
Work-in-progress 261 263
Finished products 3,036 3,246
Inventories, net 4,429 4,567
Inventories, gross (1) 4,878 5,049
Impairment (2) (449) (482)
(1) Including gross value of used vehicles: €1,087 million at December 31, 2011 (€1,005 million at December 31, 2010).
(2) Including impairment of used vehicles: €122 million at December 31, 2011 (€143 million at December 31, 2010).
17 – SALES FINANCING RECEIVABLES
A – Sales financing receivables by nature
(€ million) December 31, 2011 December 31, 2010
Dealership receivables 5,934 4,535
Financing for end-customers 12,407 11,665
Leasing and similar operations 4,420 4,017
Gross value 22,761 20,217
Impairment (861) (941)
Net value 21,900 19,276
The Sales Financing segment undertook several securitization operations through special purpose vehicles (in France, Italy, Germany and the United Kingdom) involving receivables on the dealership network and loans to final customers. This did not lead to derecognition of the receivables assigned, as all risks were retained by the Group. Sales financing receivables in

Page 45
the balance sheet thus amounted to €8,739 million at December 31, 2011 (€7,247 million at December 31, 2010). A liability of €3,704 million was recognized at December 31, 2011 (€3,775 million at December 31, 2010) in other debts represented by a certificate, corresponding to issues resulting from the securitization operations. The difference between the receivables assigned and the amount of the liability corresponds to the higher credit necessary for these operations, and the share of securities retained by RCI Banque to form a liquidity reserve. The increase in credit concerns securities subscribed by subsidiaries which assign receivables in order to optimise the credit rating of the securities issued. Some securities subscribed by RCI Banque can be redeemed at the European Central Bank and therefore form a liquidity reserve. At December 31, 2011, RCI Banque had provided guarantees of €2,601 million (€2,832 million in 2010) to the European Central Bank: €2,429 million in the form of shares in securitization vehicles and €172 million in Sales financing receivables (€2,749 million and €83 million at December 31, 2010). RCI Banque had used €350 million of this liquidity reserve at December 31, 2011 (€450 million at December 31, 2010), classified as borrowings from credit institutions in Sales financing debts (note 24). At December 31, 2011, RCI Banque also provided guarantees to the Société de Financement de l’Economie Française (SFEF) in the form of receivables with book value of €1,225 million (€1,658 million at December 31, 2010), in return for financing of €785 million (€824 million at December 31, 2010) recorded in borrowings from credit institutions in debts of the Sales Financing segment (note 24). The fair value of sales financing receivables is €21,979 million at December 31, 2011 (€19,448 million at December 31, 2010). This value is estimated by discounting future cash flows at rates that would be applicable to similar loans (conditions, maturity and debtor quality) at the year-end.
B – Sales financing receivables by maturity
(€ million) December 31,
2011 December 31,
2010
- 1 year 12,851 11,052
1 to 5 years 8,987 8,190
+ 5 years 62 34
Total sales financing receivables, net 21,900 19,276
C – Breakdown of overdue sales financing receivable s (gross values)
(€ million) December 31, 2011
December 31, 2010
Receivables for which impairment has been recognize d (1): overdue by 643 702
- 0 to 30 days 12 21
- 30 to 90 days 53 52
- 90 to 180 days 54 56
- More than 180 days 524 573
Receivables for which no impairment has been recogn ized: overdue by 17 16
- 0 to 30 days 17 16
- 30 to 90 days - -
- 90 to 180 days - -
- More than 180 days - -
(1) This only includes sales financing receivables partly or totally written off through impairment on an individual basis.
The maximum exposure to credit risk for the sales financing activity is represented by the net book value of sales financing receivables plus the amount of financing commitments for customers reported under off-balance sheet commitments given (note 29-A).
This risk is reduced by guarantees provided by customers, as reported in off-balance sheet commitments received (note 29-B). In particular, guarantees held in connection with overdue or impaired sales financing receivables amounted to €537 million at December 31, 2011 (€462 million at December 31, 2010).
There is no indication at the year-end that the quality of sales financing receivables not yet due or unimpaired has been adversely affected, nor is there any significant concentration of risks within the sales financing customer base.

Page 46
D – Changes in impairment of sales financing receiv ables
(€ million)
Impairment at December 31, 2010 (941)
Impairment recorded during the year (302)
Reversals for application 241
Reversals of unused residual amounts 147
Translation adjustment and other (6)
Impairment at December 31, 2011 (861)
18 – AUTOMOTIVE RECEIVABLES
(€ million) December 31, 2011 December 31, 2010
Gross value 1,354 1,432
Impairment (79) (103)
Automotive receivables, net 1,275 1,329
These receivables do not include accounts receivable assigned to the Group's sales financing companies in France and certain other European countries when substantially all the risks and benefits associated with ownership of the receivables are transferred: such receivables are included in sales financing receivables. When substantially all the risks and benefits are not transferred, although receivables have been assigned from a legal point of view, they remain in Automotive receivables and a corresponding financial liability is recorded (in other interest-bearing borrowings). This rule also applies to receivables assigned outside the Group, for example through discounting or factoring. The amount of assigned Automotive receivables reported in the balance sheet is not significant for the periods presented.
There is no significant concentration of risks within the Automotive customer base, and no single non-Group customer accounts for more than 10% of the Group’s total sales revenues.
The fair value of Automotive receivables is equal to their net book value due to their short-term maturities.

Page 47
19 – OTHER CURRENT AND NON CURRENT ASSETS
(€ million) December 31, 2011 December 31, 2010
Non-
current Current Total Non-
current Current Total
Prepaid expenses 56 182 238 59 183 242
Tax receivables (excluding current taxes) 15 867 882 8 852 860
Other receivables 396 709 1,105 262 561 823
Investments in controlled unconsolidated entities 113 - 113 106 - 106
Derivatives on operating transactions of the Automotive segment
- - - - 8 8
Derivatives assets on financing transactions of the Sales Financing segment
- 310 310 - 81 81
TOTAL 580 2,068 2,648 435 1,685 2,120
Gross value 735 2,098 2,833 584 1,725 2,309
Impairment (155) (30) (185) (149) (40) (189)
20 – SHAREHOLDERS' EQUITY
A – Share capital
The total number of ordinary shares issued and fully paid-up at December 31, 2011 was 295,722 thousand, with par value of €3.81 per share (unchanged from December 31, 2010).
Treasury shares do not bear dividends. They accounted for 1.37% of Renault’s share capital at December 31, 2011 (0.98% at December 31, 2010).
The Nissan group holds 15% of Renault through its wholly-owned subsidiary Nissan Finance Co., Ltd (the voting rights attached to these shares cannot be exercised).
B – Capital management
In managing its capital, the Group’s objective is to guarantee continuity of business in order to provide returns for shareholders and benefits for other stakeholders, and to maintain optimum capital structure in order to optimise its cost.
The Group actively manages its capital structure, making adjustments in view of developments in economic conditions. To maintain or adjust the capital structure, the Group may adjust dividend payments to shareholders, redeem some of the capital or issue new shares. The management objectives, policies and procedures are unchanged from 2010.
The Group’s objectives are monitored in different ways in the different operating segments.
The Group manages the Automotive segment’s capital with reference to a ratio equal to the segment’s net indebtedness divided by the sum of shareholders’ equity (net indebtedness includes all non-operating interest-bearing financial liabilities and commitments less cash and cash equivalents and other non-operating financial assets such as marketable securities or the segment’s loans, shareholders’ equity is as reported in the Group’s balance sheet). This ratio stood at 1.2% at December 31, 2011 (6.3% at December 31, 2010).
The Sales Financing segment must comply with regulatory ratios specific to banking operations. The minimum solvency ratio (shareholders’ equity including subordinated loans to total risk-weighted assets) is 8%. RCI Banque’s overall solvency ratio was 11.23% at December 31, 2011 (11.86% at December 31, 2010).
The Group also partially hedges its investment in Nissan (note 14-H).

Page 48
C – Renault treasury shares
In accordance with decisions approved at General Shareholders’ Meetings, the Board of Directors decided to allocate all Renault treasury shares to current stock-option plans awarded to Group managers and executives.
December 31, 2011 December 31, 2010
Total value of treasury shares (€ million) 200 145
Total number of treasury shares 4,059,255 2,895,381
D – Distributions
At the General and Extraordinary Shareholders’ Meeting of April 29, 2011, it was decided to distribute a dividend of €0.30 per share or a total of €88 million (no dividends were distributed in 2010). This dividend was paid during May.
E – Translation adjustment
The change in translation adjustment over the year is as follows:
(€ million) 2011 2010
Change in translation adjustment on the value of the investment in Nissan 694 1,923
Impact, net of tax, of partial hedging of the investment in Nissan (note 14-H) (142) (242)
Total change in translation adjustment related to N issan 552 1,681
Other changes in translation adjustment (156) 354
Total change in translation adjustment 396 2,035
In 2011, other changes in the translation adjustment mostly resulted from movements in the Brazilian real, the Russian rouble and the Turkish lira against the Euro. In 2010, the main currencies concerned were the Swedish krona and the Korean won.
F – Financial instrument revaluation reserve
F1 – Change in the financial instrument revaluation reserve
The figures below are reported net of tax effects.
(€ million) Cash flow hedges
Available-for-sale financial
assets
Total
At December 31, 2010 (1) (51) 286 235
Changes in fair value recorded in shareholders’ equity (38) (335) (373)
Transfer from shareholders’ equity to the income statement (2) 11 (2) 9
At December 31, 2011 (1) (78) (51) (3) (129)
(1) For the schedule of transfers of amounts related to cash flow hedges transferred to shareholders’ equity, see note F-3 below.
(2) For a breakdown of the amounts related to cash flow hedges transferred to shareholders’ equity, see note F-2 below.
(3) The revaluation reserve partly relates to Daimler shares (note 23-A).

Page 49
F2 – Breakdown of the amounts related to cash flow hedges transferred from the financial instrument re valuation reserve to the income statement
(€ million) 2011 2010
Operating margin 12 108
Other operating income and expenses - -
Net financial income (expense) (1) -
Share in net income of associates - 25
Current and deferred taxes - -
Total transferred to the income statement for cash flow hedges 11 133
F3 – Schedule of amounts related to cash flow hedge s transferred from the financial instruments revalu ation reserve to the income statement
(€ million) December 31, 2011
December 31, 2010
Within one year 2 2
After one year (47) (36)
Revaluation reserve for cash flow hedges excluding associates (45) (34)
Revaluation reserve for cash flow hedges - associates (33) (17)
Total revaluation reserve for cash flow hedges (78) (51)
This schedule is based on contractual maturities of hedged cash flows.
G – Stock-option and free share attribution plans
Since October 1996, the Board of Directors has periodically granted stock-options to Group executives and managers, with prices and exercise periods specific to each plan.
Six new stock-option or free share plans were introduced in 2011. All plans introduced since 2006 include performance conditions which determine the number of options or shares granted to beneficiaries.
G1 – Changes in the number of stock-options held by personnel
2011 2010
Quantity Weighted average exercise price (€)
Weighted average share price at grant and exercise dates
(€)
Quantity Weighted average exercise price (€)
Weighted average share price at grant and exercise dates
(€)
Outstanding at January 1 10,387,702 68 10,977,350 67
Granted 766,000 37 - - -
Exercised - - - -
Expired (2,558,295) 52 N/A (589,648) 54 N/A
Outstanding at December 31 8,595,407 70 10,387,702 68

Page 50
G2 – Options and free share attribution rights yet to be exercised at December 31, 2011
Plan Type of plan Grant date Exercise price (€)
Outstanding Exercise period
Plan 8 Stock purchase options September 5, 2002 49.21 1,484,667 September 6, 2007 - September 4, 2012
Plan 10 Stock subscription options September 14, 2004 66.03 2,012,850 September 15, 2008 - September 13, 2012
Plan 11 Stock subscription options September 13, 2005 72.98 1,477,900 September 14, 2009 - September 12, 2013
Plan 12 Stock subscription options May 4, 2006
87.98 1,316,834 May 5, 2010 – May 5, 2014
Plan 14 Stock subscription options December 5, 2006 93.86 1,537,156 December 6, 2010 – December 4, 2014
Plan 17 Stock purchase options April 29, 2011 38.80 176,000 April 30, 2015 – April 28, 2019
Plan 17 bis Attribution of free shares April 29, 2011 502,500
41,800 April 30, 2013 – April 30, 2015
April 30, 2015
Plan 18 Stock purchase options April 29, 2011 38.80 490,000 April 30, 2015 – April 28, 2019
Plan 18 bis Attribution of free shares April 29, 2011 1,138,600
94,800
April 30, 2014 – April 30, 2016
April 30, 2015
Plan 19 Stock purchase options (1) December 8, 2011
26.87 300,000 December 9, 2015– December 7, 2019
Plan 19 bis Attribution of free shares (1) December 8, 2011 556,700
53,200 December 8, 2013 – December 8, 2015
December 8, 2015
(1) Beneficiaries of these plans decided in 2011 were informed of the allocation in early 2012, except for the Chairman and CEO who was allocated 100,000 stock-options on December 8, 2011.
H – Share-based payments
Share-based payments exclusively concern stock-options and free shares awarded to personnel.
Plan values
The options awarded under these plans only become vested after a period of five years for plan 8, and four years for plans 10 to 18. For stock-option plans, the exercise period then covers five years for plan 8 and four years for plans 10 to 18. Loss of the benefit of these options follows the applicable regulations: all options are forfeited in the event of resignation, and a decision is made for each individual case when an employee leaves at the company’s instigation.
The valuation method follows a suitable binomial mathematical model, with exercise of the options anticipated and spread over the exercise period on a straight-line basis. The volatility factor applied is implicit volatility at the grant date. The dividend used is determined by reference to the dividend payout schedule at the time each plan is valued.

Page 51
The plans have been valued as follows:
N° plan Initial value
(thousand of €)
Unit fair value
Expense for 2011
(€ million)
Expense for 2010
(€ million)
Share price at grant date (€)
Volatility Interest rate
Exercise price (€)
Duration of option
Dividend per share (€)
Plan 10 39,870 19.75 - - 69.05 27.0 % 3.71% 66.03 4-8 years 1.40
Plan 11 22,480 14.65 - - 72.45 23.5 % 2.68% 72.98 4-8 years 1.80
Plan 12 (1) 17,324 16.20 - (2) 87.05 28.1 % 3.90% 87.98 4-8 years 2.40 – 4.50
Plan 14 (1) 26,066 15.00 - (6) 92.65 26.7 % 3.88% 93.86 4-8 years 2.40 – 4.50
Plan 17 1,229 9.31 - - 36.70 37.28% 2.28% 38.80 4-8 years 0.30 – 1.16
Plan 17 bis 13,267 32.50 - - 36.70 N/A 2.28% N/A 2-4 years 0.30 – 1.16
Plan 18 3,422 9.31 (1) - 36.70 37.28% 2.28% 38.80 4-8 years 0.30 – 1.16
Plan 18 bis 28,711 31.04 (5) - 36.70 N/A 2.28% N/A 3-5 years 0.30 – 1.16
TOTAL 152,369 (6) (8)
(1) For these plans, options or free share attribution rights have been awarded at different dates within the stated period. The information reported may correspond to weighted averages based on quantities awarded per grant date.
21 – PROVISIONS
A – Provisions at December 31
(€ million) December 31, 2011
December 31, 2010
Provisions (other than provisions for pension and o ther long-term employee obligations)
1,743 1,962
- Provisions for restructuring and workforce adjustment costs 368 544
- Provisions for warranty costs 675 728
- Provisions for tax risks and litigation 284 311
- Other provisions 416 379
Provisions for pension and other long-term employee benefit obligations
1,350 1,246
Total provisions 3,093 3,208
Provisions – long-term 2,227 2,243
Provision – short-term 866 965
All known litigation in which Renault or Group companies are involved is examined at each closing. After seeking the opinion of legal advisors, any provisions deemed necessary are set aside to cover the estimated risk.

Page 52
B – Changes in provisions (other than provisions fo r pension and other long-term employee obligations)
(€ million) Restructuring provisions
Warranty provisions
Tax risks and litigation
provisions
Other provisions
Total
At December 31, 2010 544 728 311 379 1,962
Increases 26 410 64 126 626
Reversals of provisions for application (85) (363) (60) (37) (545)
Reversals of unused balance of provisions (117) (94) (22) (54) (287)
Changes in scope of consolidation - - - 2 2
Translation adjustments and other changes - (6) (9) - (15)
At December 31, 2011 368 675 284 416 1,743
In 2011, increases to restructuring provisions essentially comprise the effect of workforce adjustment measures in Europe (note 7-A).
Most of the reversals of unused provisions for restructuring reflect the discontinuation in 2011 of the Group’s plan to reorganize its establishments in the Paris area, and the updating of the provision for workforce adjustment measures in France, reflecting the options chosen in 2011 by employees eligible for these measures (note 7-A).
At December 31, 2011, other provisions included €35 million of provisions established in application of environmental regulations (€40 million at December 31, 2010). These provisions include environmental compliance costs for industrial land that the Group intends to sell (particularly on the Boulogne-Billancourt site) and expenses related to the EU directive on end-of-life vehicles (note 29-A2). They also include technical provisions established by the Sales Financing segment’s insurance companies, amounting to €105 million (€52 million at December 31, 2010).
As greenhouse gas emissions were lower than the Group’s allocated quotas, no associated provisions were booked at December 31, 2011.
C – Provisions for pensions and other long-term empl oyee benefit obligations
C1 – Pension and benefit plans
Pensions and other long-term employee benefit obligations essentially concern current employees. These benefits are covered either by contributions to defined-contribution plans or by defined-benefit plans.
• Defined-contribution plans
The Group makes earnings-related payments, in accordance with local custom, to the national organizations responsible for paying pensions and similar financial benefits. There is no actuarial liability concerning these pension arrangements.
The total expense for defined-contribution plans is approximately €576 million in 2011.
• Defined-benefit plans
Provisions are established for this type of plan, mainly concerning indemnities payable upon retirement, but also covering:
- other payments upon retirement and supplementary pensions; - other long-term benefits, chiefly long-service awards and flexible holiday entitlements; - healthcare expense coverage.
Defined-benefit plans are sometimes covered by funds which are valued annually based on market value. The value of fund assets, if any, is deducted from the corresponding liability. In view of the amounts involved, the Group's exposure to risk resulting from changes in these fund asset values is low (see note 21-C6).
C2 – Actuarial assumptions
The main actuarial assumptions used for the companies in France, the country accounting for most of the Group’s obligations, are the following:
Retirement age 60 to 65
Salary increase 3%
Discount rate (1) 4.3%
(1) The rate most frequently used to value the Group’s obligations in France is 4.3% (4.5% in 2010) However, the rate varies between companies depending on the maturities of obligations.
The weighted average rate of return expected for the Group's principal funds is 4.9% in 2011. In the UK, where a significant portion of the group’s pension funds are invested, the expected rate of return is 5.9%.
This return is determined based on past returns for each category of assets included in the portfolios.

Page 53
C3 – Net expense for the year
(€ million) 2011 2010
Current service cost 95 83
Amortization of past service cost (2) (2)
Interest cost 65 65
Expected return on fund assets (18) (18)
Effects of workforce adjustment measures - (1)
Net expense (income) for the year 140 127
C4 – Provisions at December 31
(€ million) December 31, 2011 December 31, 2010
French companies 1,131 1,039
Foreign companies 219 207
TOTAL 1,350 1,246
C5 – Changes in obligations, fund assets and provis ion
(€ million) Obligations Fund assets
Obligations net of fund
assets
Unrecorded past
service costs
Balance sheet
provision
Balance at December 31, 2010 1,632 (392) 1,240 6 1, 246
Net expense for the year 2011 (note 21-C3) 160 (18) 142 (2) 140
Benefits paid out (71) 18 (53) - (53)
Contributions to funds (10) (10) - (10)
Actuarial gains (losses) 22 1 23 - 23
Translation adjustments 8 (7) 1 - 1
Change in scope of consolidation and other 1 2 3 - 3
Balance at December 31, 2011 1,752 (406) 1,346 4 1, 350
C6 – Breakdown of fund assets
(€ million) December 31, 2011 December 31, 2010
Equities 90 92
Bonds 271 254
Other 45 46
Total fund assets 406 392
The weighted average real rate of return expected for the Group's principal funds is 3.7% in 2011. In the UK, where a significant portion of the Group’s pension funds are invested, the expected real rate of return for 2011 is 5.7%.
The current best estimate for contributions payable in 2012 is close to €10 million.

Page 54
C7 – Historical data
The cumulative actuarial net-of-tax gains and losses (excluding the associates’ share) included in Other components of comprehensive income is €(278) million at December 31, 2011 (€(255) million at December 31, 2010).
22 – OTHER CURRENT AND NON CURRENT LIABILITIES
(€ million) December 31, 2011 December 31, 2010
Non-
current Current Total Non-
current Current Total
Tax liabilities (excluding current taxes) 308 819 1,127 350 670 1,020
Social liabilities 15 1,599 1,614 13 1,543 1,556
Other liabilities 255 3,555 3,810 244 3,171 3,415
Deferred income 146 559 705 127 436 563
Derivatives on operating transactions of the Automotive segment
- 2 2 - 1 1
Total 724 6,534 7,258 734 5,821 6,555
Other liabilities mainly correspond to deferred income recorded in connection with sales contracts including a buy-back commitment.
(€ million) December 31, 2011
December 31, 2010
December 31, 2009
December 31, 2008
December 31, 2007
Obligations not covered by funds 1,206 1,119 1,045 977 1,130
Obligations covered by funds 546 513 447 376 450
Total obligations (A) 1,752 1,632 1,492 1,353 1,580
Value of fund assets (B) 406 392 347 307 388
Funding status (B) – (A) (1,346) (1,240) (1,145) (1,046) (1,192)
Actuarial gains and losses on obligations recorded in equity during the year (before tax)
(23) (38) (66) 44 (93)
Actuarial gains and losses on fund assets recorded in equity during the year (before tax)
(1) 19 12 (47) 10

Page 55
4.2.7.4 Financial assets and liabilities, fair valu e and management of financial risks
23 – FINANCIAL ASSETS – CASH AND CASH EQUIVALENTS
A – Current/non-current breakdown
(€ million) December 31, 2011 December 31, 2010
Non-current
Current Total Non-current
Current Total
Investments in non-controlled entities 699 - 699 928 - 928
Other securities - 88 88 - 56 56
Loans 89 329 418 89 485 574
Derivative assets on financing operations by the Automotive segment
280 827 1,107 711 258 969
Total financial assets 1,068 1,244 2,312 1,728 799 2,527
Gross value 1,069 1,257 2,326 1,729 811 2,540
Impairment (1) (13) (14) (1) (12) (13)
Cash equivalents - 118 118 - 96 96
Cash on hand and bank deposits - 8,554 8,554 - 9,929 9,929
Total cash and cash equivalents - 8,672 8,672 - 10, 025 10,025
Investments in non-controlled entities include €558 million (€834 million at December 31, 2010) for the Daimler shares purchased under the strategic partnership agreement. These shares are classified as available-for-sale financial assets and their fair value is determined by reference to the market price at December 31, 2011. The corresponding decline in value, amounting to €276 million for 2011, is recorded in other components of comprehensive income. Since the stock market price was close to the acquisition price at December 31, 2011, no loss has been recognized in the income statement.
Investments in non-controlled entities also include €103 million (€58 million at December 31, 2010) paid to the Modernization Fund for Automotive Equipment Manufacturers (Fonds de Modernisation des Equipementiers Automobiles - FMEA), as part of the support plan for these suppliers introduced by the French authorities and automakers. Renault has undertaken a commitment to pay a total of €200 million as funds are called.
The current portion of other securities corresponds to securities that cannot be classified as cash equivalents.
The Group has liquidities in countries where repatriation of funds can be complex for regulatory or political reasons. In most of these countries, such funds are used locally for industrial purposes. At December 31, 2011, repatriation difficulties linked to foreign exchange controls in Iran concern funds amounting to €196 million

Page 56
B – Breakdown by category of financial instruments and fair value
(€ million) Instruments Held for
trading (1)
Hedging derivatives
Available-for-sale
instruments
Total instruments
carried at fair value
Loans and receivables
Total
Investments in non-controlled entities - - 699 699 - 699
Other securities - - 88 88 - 88
Loans - - - - 418 418
Derivative assets on financing operations by the Automotive segment
991 116 - 1,107 - 1,107
Total financial assets at Dec ember 31, 2011
991 116 787 1,894 418 2,312
Cash equivalents 82 - 36 118 - 118
Cash on hand and bank deposits - - - - 8,554 8,554
Total cash and cash equivalents at December 31, 2011 82 - 36 118 8,554 8,672
Investments in non-controlled entities - - 928 928 - 928
Other securities 1 - 55 56 - 56
Loans - - - 574 574 Derivative assets on financing operations by the Automotive segment
882 87 - 969 - 969
Total financial assets at December 31, 2010 883 87 983 1,953 574 2,527
Cash equivalents 67 - 29 96 - 96
Cash on hand and bank deposits - - - - 9,929 9,929
Total cash and cash equivalents at December 31, 2010 67 - 29 96 9,929 10,025
(1) Including derivatives not designated as hedges for accounting purposes.
No financial assets were reclassified in 2011 (nor 2010).
The fair value of loans is €431 million at December 31, 2011 (€595 million at December 31, 2010). For loans with original maturity of less than three months and floating-rate loans, the value recorded in the balance sheet is considered to be the fair value. Other fixed-rate loans have been measured by discounting future cash flows using the rates offered to Renault at December 31, 2011 and December 31, 2010 for loans with similar conditions and maturities.
The fair value of cash on hand and bank deposits is equal to their net book value, due to their short-term maturity.

Page 57
24 – FINANCIAL LIABILITIES AND SALES FINANCING DEBTS
A – Current/non-current breakdown
December 31, 2011 December 31, 2010
(€ million) Non-current
Current Total Non-curren
t
Current Total
Renault SA redeemable shares 231 - 231 262 - 262
Bonds 3,895 1,131 5,026 4,180 968 5,148
Other debts represented by a certificate - 200 200 - 416 416
Borrowings from credit institutions (at amortized cost)
1,049 1,029 2,078 1,142 749 1,891
Borrowings from credit institutions (at fair value)
222 - 222 223 - 223
Other interest-bearing borrowings 512 72 584 425 2,165 2,590
Financial liabilities of the Automotive segment (excluding derivatives)
5,909 2,432 8,341 6,232 4,298 10,530
Derivative liabilities on financing operations of the Automotive segment
157 798 955 602 248 850
Total financial liabilities of the Automotive segment
6,066 3,230 9,296 6,834 4,546 11,380
DIAC redeemable shares 10 - 10 11 - 11
Bonds - 10,767 10,767 - 7,808 7,808
Other debts represented by a certificate 251 6,918 7,169 251 7,315 7,566
Borrowings from credit institutions - 4,133 4,133 - 4,007 4,007
Other interest-bearing borrowings - 87 87 - 99 99
Total financial liabilities and debts of the Sales Financing segment (excluding derivatives)
261 21,905 22,166 262 19,229 19,491
Derivative liabilities on financing operations of the Sales Financing segment
- 91 91 - 137 137
Financial liabilities and debts of the Sales Financing segment
261 21,996 22,257 262 19,366 19,628
TOTAL FINANCIAL LIABILITIES AND SALES FINANCING DEBTS
6,327 25,226 31,553 7,096 23,912 31,008
Redeemable shares
The redeemable shares issued in October 1983 and April 1984 by Renault SA are subordinated perpetual shares. They earn a minimum annual return of 9% comprising a fixed portion (6.75%) and a variable portion that depends on consolidated revenues and is calculated based on identical Group structure and methods. The return on redeemable shares, amounting to €17 million for 2011 (€14 million for 2010), is included in interest expenses. These shares are listed on the Paris Stock Exchange, and traded for €328 at December 31, 2010 and €290 at December 31, 2011 for par value of €153, leading to a corresponding €31 million adjustment to the fair value of redeemable shares recorded in other financial income (note 8).
The return on Diac redeemable shares issued in 1985 comprises a fixed portion equal to the Annual Monetary Rate, and a variable portion calculated by multiplying an amount equal to 40% of the Annual Monetary Rate by the rate of increase in net consolidated profit of the Diac sub-group compared to the prior year.
Changes in bonds
In 2011, Renault SA redeemed bonds issued between 2004 and 2008 for a total of €941 million, and undertook new bond issues totalling €712 million with maturities between 2013 and 2016.
RCI Banque also redeemed bonds for a total of €2,528 million in 2011, and issued new bonds totalling €5,160 million and maturing between 2012 and 2016.
€3 billion loan from the French government in 2009
In 2011 the Group undertook early repayment of €2 billion, thus completing repayment of the €3 billion loan received from the French government in April 2009.

Page 58
€400 million loan from the European Investment Bank
In 2009 the European Investment Bank approved a four year loan of €400 million to help the Group in the transition to cleaner technologies with lower fuel consumption. The applicable interest rate of 4.4% is lower than the rate the Group could have negotiated on the market, and the favourable differential is treated as a subsidy calculated at €35 million. In accordance with Renault group accounting policies, this subsidy is charged to intangible assets or deducted from the research and development expenses financed by the loan.
Credit lines
At December 31, 2011, Renault SA had confirmed credit lines opened with banks worth €3,810 million (€4,015 million at December 31, 2010). The short-term portion amounted to €880 million at December 31, 2011 (€755 million at December 31, 2010). These credit lines had not been used at December 31, 2011 (or in 2010).
Sales financing’s confirmed credit lines opened in several currencies with banks amounted to €4,589 million (€4,570 million at December 31, 2010). The short-term portion amounted to €507 million at December 31, 2011 (€1,377 million at December 31, 2010). These credit lines were unused at December 31, 2011 (they were used to the extent of €3 million at December 31, 2010).
The contractual documentation for financial liabilities and confirmed credit lines contains no clause that could affect the continued supply of credit in the event of any change in Renault’s credit rating or financial ratio compliance.

Page 59
B – Breakdown by category of financial instrument a nd fair value
(€ million)
Instruments stated at fair value Instruments stated at amortized cost (2)
Balance sheet value
December 31, 2011
Instruments held for
trading (1)
Hedging derivatives
Instruments designated from initial
recognition as at fair
value
Total instrume
nts stated at
fair value
Balance sheet value
Fair value
Renault SA redeemable shares - - 231 231 - - 231
Bonds - - - - 5,026 5,057 5,026
Other debts represented by a certificate - - - - 200 200 200
Borrowings from credit institutions - - 222 222 2,078 2,082 2,300
Other interest-bearing borrowings - - - - 584 584 584
Derivative liabilities on financing operations of the Automotive segment
950 5 - 955 - - 955
Total financial liabilities of the Automotive segment 950 5 453 1,408 7,888 7,923 9,296
Diac redeemable shares - - 10 10 - - 10
Bonds - - - - 10,767 10,600 10,767
Other debts represented by a certificate - - - - 7,169 7,197 7,169
Borrowings from credit institutions - - - - 4,133 4,112 4,133
Other interest-bearing borrowings - - - - 87 87 87
Derivative liabilities on financing operations of the Sales Financing segment
42 49 - 91 - - 91
Financial liabilities and debts of the Sales Financing segment 42 49 10 101 22,156 21,996 22,257
(1) Including derivatives not classified as hedges for accounting purposes.
(2) Including financial liabilities subject to fair value hedges.

Page 60
Instruments stated at fair value Instruments stated at
amortized cost (2)
Balance shee
t valu
e
(€ million)
December 31, 2010
Instruments held for
trading (1)
Hedging derivatives
Instruments designated from initial
recognition as at fair
value
Total instruments stated at fair value
Balance sheet value
Fair value
Renault SA redeemable shares - - 262 262 - - 262
Bonds - - - 5,148 5,318 5,148
Other debts represented by a certificate - - - 416 416 416
Borrowings from credit institutions - - 223 223 1,891 1,877 2,114
Other interest-bearing borrowings - - - 2,590 2,645 2,590
Derivative liabilities on financing operations of the Automotive segment
847 3 - 850 - - 850
Total financial liabilities of the Automotive segment 847 3 485 1,335 10,045 10,256 11,380
DIAC redeemable shares - - 11 11 - - 11
Bonds - - - - 7,808 8,178 7,808
Other debts represented by a certificate - - - - 7,566 7,553 7,566
Borrowings from credit institutions - - - - 4,007 3,966 4,007
Other interest-bearing borrowings - - - - 99 99 99
Derivative liabilities on financing operations of the Sales Financing segment
83 54 137 - - 137
Financial liabilities and debts of the Sales Financing segment
83 54 11 148 19,480 19,796 19,628
(1) Including derivatives not classified as hedges for accounting purposes.
(2) Including financial liabilities subject to fair value hedges
The fair value of financial liabilities and debts of the Sales Financing segment stated at amortized cost is essentially determined by discounting future cash flows at rates offered to Renault at December 31, 2011 and 2010 for loans with similar conditions and maturities.

Page 61
C – Breakdown by maturity
For financial liabilities including derivatives, contractual flows are similar to the expected flows and correspond to the amounts to be paid.
For floating-rate financial instruments, interest is calculated using interest rates as at December 31.
No contractual flows are reported for Renault and Diac redeemable shares as they have no fixed redemption date.
C1 – Financial liabilities of the Automotive segmen t
December 31, 2011 (€ million)
Balance sheet value
Total contractual
flows
- 1 yr 1 - 2 yrs 2 - 3 yrs 3 - 4 yrs 4 - 5 yrs + 5 yrs
Bonds issued by Renault SA (by issue date)
2003 41 41 - - 41 - - -
2005 100 100 100 - - - - -
2006 555 555 - 527 28 - - -
2007 610 610 541 - 59 - - 10
2008 420 420 - 420 - - - -
2009 750 750 - - 750 - - -
2010 1,764 1,764 449 170 - 645 - 500
2011 758 758 - 154 70 - 534 -
Accrued interest, expenses and premiums 28 50 50 - - - - -
Total bonds 5,026 5,048 1,140 1,271 948 645 534 510
Other debts represented by a certificate 200 200 200 - - - - -
Borrowings from credit institutions 2,300 2,313 1,029 854 262 92 19 57
Other interest-bearing borrowings 584 771 66 27 30 18 10 620
Total other financial liabilities 3,084 3,284 1,295 881 292 110 29 677
Future interest on bonds and other financial liabilities
- 813 146 177 136 80 41 233
Redeemable shares 231 - - - - - - -
Derivative liabilities on financing operations 955 955 798 104 13 10 30 -
Total financial liabilities of the Automotive segment
9,296 10,100 3,379 2,433 1,389 845 634 1,420
The portion of financial liabilities of the Automotive segment maturing within one year breaks down as follows:
December 31, 2011 (€ million)
Contractual flows
maturing within 1 year
- 1 month 1-3 months
3 months – 1 year
Bonds 1,140 3 35 1,102
Other financial liabilities 1,295 441 239 615
Future interest on bonds and other financial liabilities 146 - 19 127
Redeemable shares - - - -
Derivative liabilities on financing operations 798 203 355 240
Total financial liabilities maturing within 1 year 3,379 647 648 2,084

Page 62
C2 –Financial liabilities and debts of the Sales Fi nancing segment
December 31, 2011 (€ million)
Balance sheet value
Total contractual
flows
- 1 yr 1 - 2 yrs 2 - 3 yrs 3 - 4 yrs 4 – 5 yrs + 5 yrs
Bonds issued by RCI Banque (year of issue)
2005 33 33 23 - - 10 - -
2006 14 14 - - - 14 - -
2007 500 500 500 - - - - -
2009 756 756 756 - - - - -
2010 3,888 3,859 1,084 1,446 - 618 711 -
2011 5,385 5,261 269 628 2,515 603 1,246 -
Accrued interest, expenses and premiums 191 228 228 - - - - -
Total bonds 10,767 10,651 2,860 2,074 2,515 1,245 1,957 -
Other debts represented by a certificate 7,169 7,169 5,012 1,052 639 466 - -
Borrowings from credit institutions 4,133 4,126 2,899 343 610 204 60 10
Other interest-bearing borrowings 87 87 87 - - - - -
Total other financial liabilities 11,389 11,382 7,998 1,395 1,249 670 60 10
Future interest on bonds and other financial liabilities
- 1,365 403 395 298 191 69 9
Redeemable shares 10 - - - - - - -
Derivative liabilities on financing operations 91 394 169 124 53 37 11 -
Total Financial liabilities and debts of the Sales Financing segment 22,257 23,792 11,430 3,988 4,115 2,143 2,097 19
The portion of financial liabilities and debts of the Sales Financing segment maturing within one year breaks down as follows:
December 31, 2011 (€ million)
Contractual flows
maturing within 1
year
-1 month 1-3 months
3 months – 1 year
Bonds 2,860 604 33 2,223
Other financial liabilities 7,998 2,592 3,313 2,093
Future interest on bonds and other financial liabilities 403 11 29 363
Redeemable shares - - - -
Derivative liabilities on financing operations 169 23 32 114
Total financial liabilities maturing within 1 year 11,430 3,230 3,407 4,793

Page 63
25 – FAIR VALUE OF FINANCIAL INSTRUMENTS AND IMPACT ON NET INCOME
A – Fair value of financial instruments by level
The following breakdown by level is presented for financial instruments carried in the balance sheet at fair value:
• Level 1: instruments whose fair values are derived from a listed price in an active market • Level 2: instruments whose fair values are derived from observable market prices and are not included in
Level 1 • Level 3: instruments whose fair values are derived from data not observable on the market.
December 31, 2011 (€ million)
Fair value in balance
sheet
Level 1 Level 2 Level 3
Investments in non-controlled entities 699 558 - 141
Other securities 88 34 54 -
Derivative assets on financing operations by the Automotive segment
1,107 - 1,107 -
Derivative assets on transactions undertaken for operating purposes by the Automotive segment
- - - -
Derivative assets on financing operations by the Sales Financing segment
310 - 310 -
Cash equivalents 118 115 3 -
Financial instruments stated at fair value in the balance sheet assets
2,322 707 1,474 141
Renault SA redeemable shares 231 231 - -
Borrowings from credit institutions by the Automotive segment 222 - 222 -
Derivative liabilities on transactions undertaken for financing purposes by the Automotive segment
955 - 955 -
Derivative liabilities on transactions undertaken for operating purposes by the Automotive segment
2 - 2 -
DIAC redeemable shares 10 10 - -
Derivative liabilities on financing operations of the Sales Financing segment
91 - 91 -
Financial instruments stated at fair value in the balance sheet liabilities
1,511 241 1,270 -
Estimated fair values are based on information available on the markets and arrived at using valuation methods appropriate to the types of instrument in question. However, the methods and assumptions used are by nature theoretical, and judgment plays a major role in interpreting market data.
Fair values have been determined on the basis of information available at the end of the year and do not therefore take account of subsequent movements.
In general, the valuation methods for each level are as follows:
• Level 1: fair value is identical to the most recent listed price; • Level 2: fair value is generally determined by recognized valuation models that use observable market data; • Level 3: the fair value of investments in non-controlled companies is based on the share of net assets
In 2011 no financial instruments were transferred between Level 1 and Level 2, or into or out of Level 3.
B – Changes in Level 3 financial instruments
Level 3 financial instruments amounted to €141 million at December 31, 2011. They increased by €47 million over the year, essentially due to payments made in 2011 to the Modernization Fund for Automotive Equipment Manufacturers (Fonds de Modernisation des Equipementiers Automobiles - FMEA), as part of the support plan for these suppliers introduced by the French authorities and automakers.

Page 64
C – Impact of financial instrument on net income
(€ million) Financial assets
other than derivatives
Financial liabilities
other than derivatives
Derivatives Total impact on
net income
2011 Instruments
held for trading
Available-for-sale
instruments
Loans and receivables
Instruments designated
as at fair value
through profit and
loss
Instruments stated at amortized
cost (1)
Interest income 2 - 204 - - 29 235
Interest expenses - - - (16) (427) (11) (454)
Change in fair value - 1 (2) 32 1 26 58
Impairment - - 23 - - - 23
Dividends - 33 - - - - 33
Gains (losses) on sale - - - - - - -
Net foreign exchange gains and losses 18 - 97 - (100) - 15
Total impact on net income - Automotive segment
20 34 322 16 (526) 44 (90)
Including:
- operating margin - - 80 - (85) 13 8
- other operating income and expenses - - - - - - -
- net financial income (expense) 20 34 242 16 (441) 31 (98)
Interest income - 3 1,511 - - 118 1,632
Interest expenses - - - - (984) (104) (1,088)
Change in fair value - - - 3 (182) 247 68
Impairment - - (25) - - - (25)
Dividends - 4 - - - - 4
Gains (losses) on sale - - - - - - -
Net foreign exchange gains and losses - - - - (66) - (66)
Total impact on net income - Sales Financing segment
- 7 1,486 3 (1,232) 261 525
Including :
- operating margin - 7 1,486 3 (1,232) 261 525
- other operating income and expenses - - - - - - -
- net financial income (expense) - - - - - - -
TOTAL GAINS AND LOSSES WITH IMPACT ON NET INCOME
20 41 1,808 19 (1,758) 305 435
(1) Including financial liabilities subject to fair value hedges.
For the Automotive segment, the impact of financial instruments on net income mainly corresponds to foreign exchange gains and losses on operating transactions, and impairment of operating receivables.

Page 65
D – Fair value hedges
(€ million) 2011 2010
Change in fair value of the hedging instrument 212 (23)
Change in fair value of the hedged item (211) 29
Net impact on net income of fair value hedges 1 6
This net impact of fair value hedges on net income corresponds to the ineffective portion of hedges. Hedge accounting methods are described in note 2-V.
26 – DERIVATIVES AND MANAGEMENT OF FINANCIAL RISKS
A – Fair value of derivatives
The fair value of derivatives corresponds to their balance sheet value.
(€ million) Financial assets Other
assets
Financial liabilities and Sales
Financing debts
Other liabilities
December 31, 2011 Non-
current Current Current Non-
current Current Current
Cash flow hedges - - - - 1 2
Fair value hedges - 5 124 - (4) -
Hedge of the net investment in Nissan - - - - - - Derivatives not classified as hedges and derivatives held for trading - 426 26 - 489 -
Total foreign exchange risk - 431 150 - 486 2
Cash flow hedges 6 - 64 3 52 -
Fair value hedges 87 18 96 - 1 - Derivatives not classified as hedges and derivatives held for trading 187 378 - 154 350 -
Total interest rate risk 280 396 160 157 403 -
Cash flow hedges - - - - - -
Fair value hedges - - - - - - Derivatives not classified as hedges and derivatives held for trading - - - - - -
Total commodity risk - - - - - -
Total 280 827 310 157 889 2
(€ million) Financial assets Other
assets
Financial liabilities and Sales
Financing debts
Other liabilities
December 31, 2010 Non-
current Current Current Non-
current Current Current
Cash flow hedges - - 7 - - -
Fair value hedges - - 39 - - -
Hedge of the net investment in Nissan - - - - - - Derivatives not classified as hedges and derivatives held for trading - 115 2 - 195 1
Total foreign exchange risk - 115 48 - 195 1
Cash flow hedges 9 - 22 3 38 -
Fair value hedges 78 - 19 - 15 - Derivatives not classified as hedges and derivatives held for trading 624 143 - 599 137 -
Total interest rate risk 711 143 41 602 190 -
Cash flow hedges - - - - - -
Fair value hedges - - - - - - Derivatives not classified as hedges and derivatives held for trading - - - - - -
Total commodity risk - - - - - -
Total 711 258 89 602 385 1
Page 66
The Renault Group’s specialist subsidiary Renault Finance handles the Automotive segment’s short-term interbank investments. It is also Nissan’s counterparty in derivatives trading to hedge exchange, interest rate and commodity risks.
The fair values of derivatives reported in the Group’s consolidated balance sheet assets and liabilities mainly relate to Renault Finance’s business conducted on its own behalf and its transactions with Renault and Nissan subsidiaries.
B – Management of financial risks
The Group is exposed to the following financial risks:
• Liquidity risks • Market risks (foreign exchange, interest rate, equity and commodity risks) • Counterparty risks • Credit risks (notes 17 and 18)
B1 – Liquidity risk The Group is financed via the capital markets, through:
• long-term resources (bond issues, private placements, project financing, etc); • short-term bank loans or commercial paper issues; • securitization of receivables by RCI Banque.
The Automotive segment needs sufficient financial resources to finance its day-to-day business and the investments necessary for future growth. It therefore regularly borrows on the banking and capital markets to refinance its debt and guarantee liquidity for the Automotive segment, and this exposes it to liquidity risk in the event of market closures or tensions over credit availability. As part of its centralised cash management policy, Renault SA handles most refinancing for the Automotive segment through long-term resources via the capital markets (bond issues and private placements), short-term financing such as treasury notes, or project financing via the banking sector or semi-public bodies.
Medium-term refinancing for the Automotive segment in 2011 was mostly provided by a 5-year bond totalling €500 million issued as part of Renault SA’s EMTN programme. The contractual documentation for this financing contains no clause that could affect the continued supply of credit in the event of any change in Renault’s credit rating or financial ratio compliance.
In 2009 Renault received a 5-year €3 billion loan from the French government. After renegotiation with the government, Renault undertook early repayment of this loan in three instalments of €1 billion each, paid in September 2010, February 2011 and April 2011.
Renault also has confirmed credit lines opened with banks worth €3,810 million, maturing at various times up to 2016. None of these credit lines was used in 2011. These confirmed credit lines form a liquidity reserve for the Automotive segment, and act partly as backup lines of credit for short-term commercial paper issues.
The contractual documentation for these confirmed bank credit facilities contains no clause that might adversely affect credit availability or continuation as a result of a change in Renault’s credit rating or financial ratio compliance.
Given its available cash reserves (€7.6 billion) and confirmed credit lines unused at year-end (€3.8 billion), the Automotive segment has sufficient financial resources to cover its commitments over a 12-month horizon.
Confirmed credit lines open but unused are described in note 24-A
The Sales Financing segment’s business depends on reliable access to financial resources: any restriction on access to banking and financial markets would lead to downscaling of its financing activity and/or raise the cost of the financing negotiated. The liquidity risk is closely monitored on a regular basis. The static liquidity position, which has been constantly positive over the last few years, reflecting surplus long-term resources compared to applications, remains positive. RCI Banque therefore distributes loans from resources raised several months previously, enabling the segment to maintain a stable financial margin.
The markets saw greatly contrasting developments in 2011. In the first half-year, the significant involvement of bond investors led to a steady tightening in credit spreads. Anxieties over the national debt of southern European countries reappeared towards the end of the half-year, resulting in a high level of risk aversion during the summer that was visible in all asset classes. In contrast to the situation in 2008, the bond market nonetheless remained open to corporate debt.
In this difficult environment RCI Banque registered strong growth in its commercial business and issued its highest ever volume of financing. The group borrowed more than €7 billion repayable in more than one year, including €3.35 billion on the euro bond market and €1.8 billion in securitizations. RCI Banque stepped up its ongoing diversification strategy begun in 2010, issuing its first private placement in US dollars for an amount equivalent to €0.9 billion. RCI Banque also issued bonds on international markets (Argentina, Belgium, Brazil and Korea).
The amounts borrowed and the variety of sources of access to liquidity demonstrate that RCI Banque has stable, diversified access to financing.
These long-term resources, plus the €6.3 billion of available guarantees (consisting mainly of undrawn confirmed credit lines of €4.5 billion and €1.7 billion of available liquid receivables that can be redeemed at Central Banks), are sufficient to fund ongoing commercial business for 8 months in a “stress scenario” assuming a total lack of new resources.

Page 67
B2 – Foreign exchange risks
• Management of foreign exchange risks
The Automotive segment is exposed to foreign exchange risks in the course of its industrial and commercial business. These risks are monitored and centralised by Renault’s Cash and Financing department.
It is Renault’s general policy not to hedge operating future cash flows in foreign currencies. As a result, the Group’s operating margin is exposed to foreign exchange risks. The principal exception authorized by the General Management in 2011 concerned a foreign exchange hedge that partly hedges sales revenues in pounds sterling.
Subsidiaries’ financing and investing cash flows in foreign currencies are usually hedged in the same currencies.
Most financial liabilities and debts of Sales Financing are in Euros.
Equity investments are not hedged, apart from the investment in Nissan, totalling 95 billion yen at December 31, 2011 (note 14-H).
Renault Finance undertakes operations unrelated to operating cash flows on its own behalf. These operations are controlled daily and strict risk limits apply. They have no significant impact on Renault’s consolidated results.
The Sales Financing segment has low exposure to foreign exchange risks since its policy is to provide refinancing for subsidiaries in their own currencies. In exceptional cases, limits are assigned to certain countries (particularly Russia: €8 million and Romania: €2.5 million).
The Group made no major changes to its foreign exchange risk management policy in 2011.
• Analysis of the sensitivity of financial instruments to foreign exchange risks
This analysis concerns the sensitivity to foreign exchange risks of monetary assets and liabilities (including intercompany balances) and derivatives in a currency other than the currency of the entity that holds them. However, it does not take into account items covered by fair value hedges (hedged assets or liabilities and derivatives), for which changes in fair value of the hedged item and the hedging instrument almost totally offset each other in the income statement.
The Group has financial instruments denominated in Japanese yen, held for the purposes of the policy to partially hedge its investment in Nissan (note 14-H).
Impacts are estimated solely on the basis of instant conversion of the financial assets and liabilities concerned at year-end after application of the 1% variation in the Euro exchange rate.
The impact on equity concerns the 1 % variation in the Euro against other currencies applied to available-for-sale financial assets, cash flow hedges and the partial hedge of the investment in Nissan. All other impacts affect net income.
For the Automotive segment, the impact on shareholders’ equity (before taxes) of a 1% rise in the Euro against the principal currencies, applied to financial instruments exposed to foreign exchange risks, would have an unfavourable effect of €9 million at December 31, 2011, chiefly resulting from yen bond issues associated with the partial hedge of the investment in Nissan. This impact is offset by the opposite variation in the translation adjustment on the value of the investment in Nissan (note 20-E). The estimated impact on net income at December 31, 2011 is not significant.
• Currency derivatives
(€ million) December 31, 2011 December 31, 2010
Nominal - 1 yr 1 - 5 yrs
+ 5 yrs
Nominal - 1 yr 1 - 5 yrs + 5 yrs
Currency swaps – purchases 2,887 1,687 1,200 - 2,662 848 1,814 -
Currency swaps - sales 2,669 1,601 1,068 - 2,929 1,077 1,852 -
Forward purchases 20,771 20,771 - - 12,004 11,887 117 -
Forward sales 20,794 20,794 - - 12,026 11,909 117 -
Forward purchases – Future cash flows 100 100
- - 275 275 - -
Forward sales – Future cash 202 202 - - 268 268 - -

Page 68
B3 – Interest rate risk
• Interest rate risk management
The Renault group’s exposure to interest rate risk mainly concerns the sales financing business of RCI Banque and its subsidiaries. Customer loans are generally issued at fixed interest rates, for durations of between 12 and 72 months. Dealer credit is issued at floating rates for durations of less than 12 months.
Interest rate risk is monitored using a methodology common to the entire RCI group, to allow overall management of interest rate risks at consolidated group level. Exposure is assessed daily and hedging is systematic, using swaps to convert floating-rate liabilities to fixed-rate liabilities (cash flow hedges). The objective for each subsidiary is to hedge all risks in order to protect the sales margin.
The Automotive segment’s interest rate risk management policy applies two basic principles: long-term investments use fixed-rate financing, and investments for cash reserves use floating-rate financing. In addition, the financing in yen undertaken as part of the partial hedge of Nissan equity is fixed-rate.
Finally, Renault Finance carries out interest rate transactions on its own behalf, within strictly defined risk limits. This arbitrage activity has no significant impact on Renault’s consolidated net income.
The Group made no major changes to its interest rate risk management policy in 2011.
• Analysis of the sensitivity of financial instruments to interest rate risks
The Group is exposed to the following interest rate risks:
- variations in the interest flows on floating-rate financial instruments stated at amortized cost, and variations in the fair value of financial instruments stated at fair value (including fixed-rate instruments swapped to floating rate, and structured products);
- variations in the fair value of the fixed-rate financial instruments stated at fair value; - variations in the fair value of derivatives (hedging derivatives and other derivatives).
Impacts are estimated by applying this 100 base point rise in interest rates over a one-year period to financial instruments reported in the closing balance sheet.
The impact on equity corresponds to the change in fair value of available-for-sale fixed-rate financial assets and cash flow hedges after a 100 base point rise in interest rates. All other impacts affect net income
Calculation of the individual segments’ sensitivity to interest rates includes intersegment loans and borrowings.
For the Automotive segment, the impact on net income and shareholders’ equity (before taxes) of a 100 base point rise in interest rates applied to financial instruments exposed to interest rate risks would be €6 million and €3 million respectively at December 31, 2011.
For the Sales Financing segment, the impact on net income and equity (before taxes) of a 100 base point rise in interest rates applied to financial instruments exposed to interest rate risks would be €(53) million and €39 million respectively at December 31, 2011. The impact on equity results mainly from the change in the fair value of swaps undertaken to hedge future cash flows. The Sales Financing segment’s sensitivity to interest rate risks is stable in comparison to 2010.
• Fixed rate/floating rate breakdown of financial liabilities and sales financing debts, after the effect of
derivatives (excluding derivatives)
(€ million) December 31, 2011 December 31, 2010
Fixed rate 17,615 24,279
Floating rate 12,892 5,743
Total financial liabilities, sales financing debts (excluding derivatives )
30,507 30,022
• Interest rate derivatives
(€ million) December 31, 2011 December 31, 2010
Nominal - 1 yr 1-5 years
+ 5 yrs
Nominal - 1 yr 1-5 years
+ 5 yrs
Interest rate swaps 32,994 16,150 16,816 28 35,603 13,797 21,165 641
FRAs 1 1 - - 1,100 1,100
Other interest rate hedging instruments
10 - 10 - - - - -

Page 69
B4 – Equity risks • Management of equity risks
The Group’s exposure to equity risks essentially concerns the Daimler shares acquired in connection with the cooperation agreements, and marketable securities indexed to share prices. The Group does not use equity derivatives to hedge this risk.
The Group made no major changes to its equity risk management policy in 2011.
• Analysis of sensitivity of financial instruments to equity risks
The sensitivity to equity risks resulting from application of a 10% decrease in share prices to the financial assets concerned at year-end would have an unfavourable impact of €57 million on shareholders’ equity. The impact on net income is not significant at December 31, 2011.
B5 – Commodity risks
• Management of commodity risks
Renault’s Purchases department may hedge part of its commodity risks using financial instruments such as forward purchase contracts, purchase options and tunnel contracts. These hedges concern physical purchasing operations required by the factories, and are subject to volume and time constraints.
There were no commodity hedges outstanding at December 31, 2011 for the Automotive segment business.
B6 – Counterparty risk
The Group only does business on the financial and banking markets with quality counterparties, and is not subject to any significant risk concentration.
All Group entities use a fully-coordinated counterparty risk management procedure involving a scoring system, based principally on the counterparties’ long-term credit rating and equity level. For Group companies with significant exposure, compliance with authorized limits is monitored on a daily basis under strict internal control procedures.
Heightened vigilance over counterparty risk continued in 2011. No losses were recorded in 2011 due to default by a banking counterparty.
The Group has done business for several years with two partners in Iran, which is subject to international sanctions. Although the restrictions in force do not directly concern the automotive industry, the resulting international tensions can make operations in the country difficult. After analysis of payment flows with the Group’s partners, no impairment has been recognized in respect of receivables.

Page 70
4.2.7.5 Cash flows and other information
27 – CASH FLOWS
A – Other income and expenses with no impact on cas h
(€ million) 2011 2010
Net allocation to provisions (193) 420
Net effects of sales financing credit losses (86) (88)
Net (gain) loss on asset disposals (1) (136) (2,146)
Change in fair value of redeemable shares (32) 31
Change in fair value of other financial instruments (10) (29)
Deferred taxes 100 (282)
Other (3) 7
Other income and expenses with no impact on cash (3 60) (2,087)
(1) Including the €2,000 million gain on sale of the AB Volvo shares in 2010.
B – Change in working capital
(€ million) 2011 2010
Decrease (increase) in net inventories 152 (587)
Decrease (increase) in Automotive net receivables 22 (200)
Decrease (increase) in other assets (258) (21)
Increase (decrease) in trade payables (181) 344
Increase (decrease) in other liabilities 471 728
Increase (decrease) in working capital 206 264
C – Capital expenditure
(€ million) 2011 2010
Purchases of intangible assets (888) (734)
Purchases of property, plant and equipment (other than leased vehicles) (1,898) (1,134)
Total purchases for the period (2,786) (1,868)
Deferred payments 331 1
Total capital expenditure (2,455) (1,867)
D – Interest received and paid by the Automotive se gment
(€ million) 2011 2010
Interest received 193 125
Interest paid (501) (507)
Interest received and paid (308) (382)

Page 71
28 – RELATED PARTIES
A – Remuneration of Directors and Executives and Exec utive Committee members
A1 – Remuneration of Directors and Executives
The Board of Directors has combined the functions of Chairman of the Board of Directors and Chief Executive Officer. The Chairman and CEO receives no remuneration for his duties as Chairman of the Board.
The table below reports the remuneration paid, pro rata to the periods in which the functions were occupied:
(€ million) 2011 2010
Basic salary 1.2 1.2
Performance-related remuneration 1.6 -
Employer’s social security charges 1.0 0.4
Complementary pension 0.5 0.7
Total remuneration excluding stock-options 4.3 2.3
Stock-option plans 0.1 0.7
Stock-option plans – effect of cancellations - -
Total remuneration under stock-option plans 0.1 0.7
Other components of remuneration 0.1 -
Chairman and Chief Executive Officer 4.5 3.0
Directors’ fees amounted to €1,173,136 in 2011 (€599,311 in 2010), of which €48,000 were paid for the Chairman’s functions (€28,000 in 2010).
A2 – Remuneration of Executive Committee members (o ther than the Chairman and Chief Executive Officer) The consideration and related benefits of members of the Executive Committee (other than the Chairman and Chief Executive Officer), were recognized in expenses as follows:
(€ million) 2011 2010
Basic salary 3.8 3.2
Performance-related salary 1.2 1.0
Employer’s social security charges 2.4 1.8
Complementary pension 0.7 1.4
Other 0.2 0.7
Total remuneration excluding stock-options 8.3 8.1
Stock-option plans 0.8 0.5
Stock-option plans – effect of cancellations - -
Total remuneration under stock-option plans 0.8 0.5
Executive Committee members (other than the Chairman and CEO)
9.1 8.6
B – Renault’s investments in associates
Details of Renault’s investments in Nissan, AB Volvo and AvtoVaz are provided respectively in notes 14, 15-A and 15-B.

Page 72
29 – OFF- BALANCE SHEET COMMITMENTS AND CONTINGENT ASSETS AND LIABILITIES
Renault enters into a certain number of commitments in the course of its business. When these commitments qualify as liabilities, they are covered by provisions (e.g. retirement and other personnel benefits, litigations, etc…). Details of off-balance sheet commitments and contingencies are provided below (note 29-A).
Renault also receives commitments from customers (deposits, mortgages, etc…) and may benefit from credit lines with credit institutions (note 29-B).
A – Off-balance sheet commitments given and conting ent liabilities
A1 – Ordinary operations
The Group is committed for the following amounts:
(€ million) December 31, 2011
December 31, 2010
Other guarantees given (1) 220 317
Financing commitments in favor of customers (2) 1,627 2,004
Firm investment orders 784 610
Lease commitments 229 219
Assets pledged, provided as guarantees or mortgaged and other commitments (3)
126 136
(1) Including €40 million of financial guarantees at December 31, 2011 which could be called in immediately after the year-end.
(2) Confirmed credit lines opened for customers by the Sales Financing segment lead to a maximum payment of this amount within 12 months after the year-end.
(3) Assets pledged, provided as guarantees or mortgaged mainly concern guarantees of financial liabilities, provided by Renault Samsung Motors when it was acquired by Renault in 2000.
Lease commitments include rent from non-cancellable leases. The breakdown is as follows:
(€ million) December 31, 2011
December 31, 2010
Less than 1 year 42 46
Between 1 and 5 years 142 123
More than 5 years 45 50
Lease commitments 229 219

Page 73
A2 – Special operations
• End-of-life vehicles
Under EC Directive 2000/53/EC concerning end-of-life vehicles, published in September 2000, EU member states will be obliged to take measures to ensure that:
• vehicles at the end of their useful life can be transferred to an approved processing centre free of charge to the last owner;
• specific progressive targets are met concerning the re-use rate for vehicle components, with priority given to recycling, and the value of components that can be re-used.
Since January 1, 2007, this Directive has concerned all vehicles on the road.
The Group establishes provisions in relation to the corresponding cost on a country-by-country basis, as the Directive is incorporated into national laws and when the procedures for recycling operations are defined. These provisions are regularly reviewed to ensure they take account of changes in each country's situation.
For countries where the legislation is not yet complete, until the laws are in existence, it is impossible to accurately determine whether the Group will have to bear a residual cost
• Other commitments
Disposals of subsidiaries or businesses by the Group generally include representations and warranties in the buyer's favor. At December 31, 2011, Renault had not identified any significant risks in connection with these operations.
For five years from 2012, Renault has a unilateral option to sell its 18% investment in SNR (Société Nouvelle de Roulements). If this option is not exercised by the end of the five-year period, NTN will have a purchase option on the residual investment.
Group companies are periodically subject to tax inspections in the countries in which they operate. Tax adjustments are recorded as provisions in the financial statements. Contested tax adjustments are recognized on a case-by-case basis, taking into account the risk that the proceedings or appeal may be unsuccessful.
B – Off-balance sheet commitments received and cont ingent assets
(€ million) December 31, 2011
December 31, 2010
Other guarantees received (1) 3,016 2,782
Assets pledged or mortgaged (2) 2,127 1,361
Other commitments 57 136
(1) Including €1,656 million in 2011 for commitments received by the Sales Financing segment for sale to a third party of rental vehicles at the end of the rental contract.
(2) The Sales Financing segment receives guarantees from its customers in the course of sales financing for new or used vehicles. Guarantees received from customers amount to €2,078 million at December 31, 2011.
Off balance sheet commitments received concerning confirmed opened credit lines are presented in note 24-A.
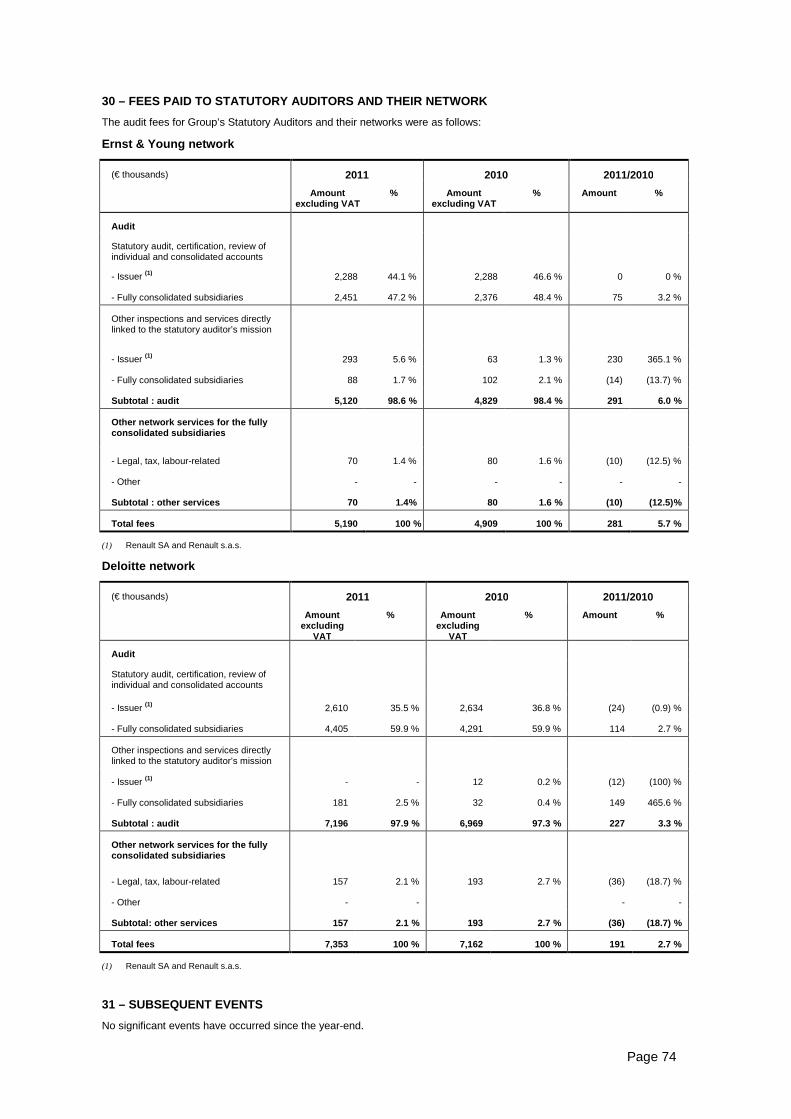
Page 74
30 – FEES PAID TO STATUTORY AUDITORS AND THEIR NETWORK
The audit fees for Group’s Statutory Auditors and their networks were as follows:
Ernst & Young network
(€ thousands) 2011 2010 2011/2010
Amount excluding VAT
% Amount excluding VAT
% Amount %
Audit
Statutory audit, certification, review of individual and consolidated accounts
- Issuer (1) 2,288 44.1 % 2,288 46.6 % 0 0 %
- Fully consolidated subsidiaries 2,451 47.2 % 2,376 48.4 % 75 3.2 %
Other inspections and services directly linked to the statutory auditor’s mission
- Issuer (1) 293 5.6 % 63 1.3 % 230 365.1 %
- Fully consolidated subsidiaries 88 1.7 % 102 2.1 % (14) (13.7) %
Subtotal : audit 5,120 98.6 % 4,829 98.4 % 291 6.0 %
Other network services for the fully consolidated subsidiaries
- Legal, tax, labour-related 70 1.4 % 80 1.6 % (10) (12.5) %
- Other - - - - - -
Subtotal : other services 70 1.4% 80 1.6 % (10) (12 .5)%
Total fees 5,190 100 % 4,909 100 % 281 5.7 %
(1) Renault SA and Renault s.a.s.
Deloitte network
(€ thousands) 2011 2010 2011/2010
Amount excluding
VAT
% Amount excluding
VAT
% Amount %
Audit
Statutory audit, certification, review of individual and consolidated accounts
- Issuer (1) 2,610 35.5 % 2,634 36.8 % (24) (0.9) %
- Fully consolidated subsidiaries 4,405 59.9 % 4,291 59.9 % 114 2.7 %
Other inspections and services directly linked to the statutory auditor’s mission
- Issuer (1) - - 12 0.2 % (12) (100) %
- Fully consolidated subsidiaries 181 2.5 % 32 0.4 % 149 465.6 %
Subtotal : audit 7,196 97.9 % 6,969 97.3 % 227 3.3 %
Other network services for the fully consolidated subsidiaries
- Legal, tax, labour-related 157 2.1 % 193 2.7 % (36) (18.7) %
- Other - - - -
Subtotal: other services 157 2.1 % 193 2.7 % (36) ( 18.7) %
Total fees 7,353 100 % 7,162 100 % 191 2.7 %
(1) Renault SA and Renault s.a.s.
31 – SUBSEQUENT EVENTS
No significant events have occurred since the year-end.

Page 75
32 – CONSOLIDATED COMPANIES
A – Fully consolidated companies (subsidiaries)
Renault Group’s interest (%) Country December 31, 2011 December 31, 2010
Renault SA France Consolidating company Consolidating company
AUTOMOTIVE
FRANCE
Renault s.a.s France 100 100
Arkanéo France 100 100
Auto Châssis International (ACI) Le Mans France 100 100
Auto Châssis International (ACI) Villeurbanne France 100 100
Fonderie de Normandie France - 100
Fonderie de Bretagne France 100 -
IDVU France 100 100
IDVE France 100 100
Maubeuge Construction Automobile (MCA) France 100 100
Renault Environnement France 100 100
Renault Développement Industriel et Commercial (RDIC)
France 100 100
Renault Retail Group SA and subsidiaries France 100 100
Renault Samara France 100 -
RDREAM France 100 100
SCI parc industriel du Mans France 100 100
SCI Plateau de Guyancourt France 100 100
SNC Renault Cléon France 100 100
SNC Renault Douai France 100 100
SNC Renault Flins France 100 100
SNC Renault Sandouville France 100 100
Société des automobiles Alpine Renault France 100 100
Sofrastock International France 100 100
Société de transmissions automatiques France 80 80
Société de véhicules automobiles de Batilly (SOVAB)
France 100 100
Société Immobilière de Construction Française pour l’Automobile et la Mécanique (SICOFRAM) and subsidiaries
France 100 100
Société Immobilière Renault Habitation (SIRHA)
France 100 100
Société Immobilière d’Epone France 100 100
Société Immobilière pour l’Automobile et la Mécanique (SIAM)
France 100 100
SODICAM 2 France 100 100
Technologie et Exploitation Informatique (TEI)
France 100 100
EUROPE
Renault Österreich and subsidiaries Austria 100 100
Renault Belgique Luxembourg and subsidiaries
Belgium 100 100
Renault Industrie Belgique (RIB) Belgium 100 100
Renault Croatia Croatia 100 100
Renault Ceska Republica and subsidiaries Czech Republic
100 100

Page 76
Renault Group’s interest (%) Country December 31, 2011 December 31, 2010
Renault Deutsche AG and subsidiaries Germany 100 100
Renault Hungaria and subsidiaries Hungary 100 100
Renault Irlande Ireland 100 100
Renault Italia and subsidiaries Italy 100 100
Motor Reinsurance Company Luxembourg 100 100
Renault Group b.v Nederland 100 100
Renault Nederland Nederland 100 100
Renault Polska Poland 100 100
Cacia Portugal 100 100
Renault Portuguesa and subsidiaries Portugal 100 100
Renault Slovakia Slovakia 100 100
Renault Nissan Slovenia d.o.o. Slovenia 100 100
Revoz Slovenia 100 100
Renault Espana Comercial SA (RECSA) and subsidiaries
Spain 100 100
Renault Espana SA and subsidiaries Spain 100 100
Renault Nordic Sweden 100 100
Renault Finance Switzerland 100 100
Renault Suisse SA and subsidiaries Switzerland 100 100
Grigny Ltd. United Kingdom
100 100
Renault Retail Group U.K. Ltd. United Kingdom
100 100
Renault U.K. United Kingdom
100 100
EUROMED
Renault Algérie Algeria 100 100
Renault Nissan Bulgarie Bulgaria 100 100
Renault Maroc Morocco 80 80
Renault Maroc Service Morocco 100 100
Renault Tanger Exploitation Morocco 100 100
Renault Tanger Méditerranée Morocco 100 100
Société marocaine de construction automobile (SOMACA)
Morocco 77 77
Dacia et ses fililales Romania 99 99
Renault Industrie Roumanie Romania 100 100
Renault Mécanique Roumanie Romania 100 100
Renault Nissan Roumanie Romania 100 100
Renault Technologie Roumanie Romania 100 100
Oyak-Renault Otomobil Fabrikalari Turkey 52 52
EURASIA
AFM Industrie Russia 100 100
Avtoframos Russia 94 94
Remosprom Russia 64 64
Renault Ukraine Ukraine 100 100
AMERICA
Groupe Renault Argentina Argentina 100 100
Renault do Brasil LTDA Brazil 100 100
Renault do Brasil SA Brazil 100 100

Page 77
Renault Group’s interest (%) Country December 31, 2011 December 31, 2010
Sociedad de Fabricacion de Automotores (SOFASA) and subsidiaries
Colombia 100 100
Renault Corporativo SA de C.V. Mexico 100 100
Renault Mexico Mexico 100 100
ASIA - AFRICA
Renault Beijing Automotive Company China 100 -
Renault Private Ltd India 100 100
Renault Pars Iran 51 51
Renault South Africa and subsidiaries South Africa 51 51
Renault Samsung Motors South Korea 80 80
SALES FINANCING
FRANCE
Compagnie de Gestion Rationnelle (COGERA)
France 100 100
Diac France 100 100
Diac Location France 100 100
RCI Banque and branches France 100 100
Société de Gestion, d’Exploitation de Services en Moyens Administratifs (SOGESMA)
France 100 100
Société Internationale de Gestion et de Maintenance Automobile (SIGMA)
France - 100
EUROPE
RCI Bank AG Austria - 100
RCI Financial Services Belgique Belgium 100 100
Renault Autofin SA Belgique Belgium 100 100
RCI Finance CZ sro Czech Republic
100 100
RCI Versicherungs Service GmbH Germany 100 100
RCI Zrt Hongrie Hungary 100 100
RCI Insurance Services Ltd Malta 100 100
RCI Life Ltd Malta 100 100
RCI Services Ltd Malta 100 100
RCI Financial Services BV Nederland 100 100
RCI Bank Polska Poland 100 100
Renault Credit Polska Poland 100 100
RCI Gest IFIC and subsidiary Portugal 100 100
RCI Gest Seguros Portugal 100 100
Overlease Espagne Spain 100 100
RCI Finance SA Switzerland 100 100

Page 78
Renault Group’s interest (%) Country December 31, 2011 December 31, 2010
RCI Financial Services Ltd United Kingdom
100 100
Renault Acceptance Ltd United Kingdom
100 100
EUROMED
RCI Finance Maroc Morocco 100 100
RCI Broker de Assigurare Romania 100 100
RCI Finantare Romania Romania 100 100
RCI Leasing Romania Romania 100 100
AMERICA
Courtage SA Argentina 100 100
ROMBO Compania Financiera Argentina 60 60
CAM RCI Brasil Brazil 60 60
CFI Renault do Brasil Brazil 60 60
Consorcio Renault do Brasil Brazil 100 100
Renault do Brasil S/A Corr. de Seguros Brazil 100 100
ASIA - AFRICA
RCI Korea South Korea 100 100
B – Proportionately consolidated companies (joint ve ntures)
Renault Group’s interest (%) Country December 31, 2011 December 31, 2010
AUTOMOTIVE
Française de Mécanique France 50 50
Indra Investissements France 50 50
Renault Nissan Technology and Business Centre India Private Limited (RNTBCI)
India 67 67
SALES FINANCING
Renault Credit Car Belgium 50 50
Renault Leasing CZ sro Czech Republic
50 50
C - Companies accounted for by the equity method (a ssociates)
Renault Group’s interest (%) Country December 31, 2011 December 31, 2010
AUTOMOTIVE
Boone Comenor France 24 12
Renault Nissan Automotive India Private Limited
India 30 30
Groupe Nissan Japan 43,9 43,8
Groupe AvtoVAZ Russia 25 25
Groupe AB Volvo Sweden 6,8 6,8
MAIS Turkey 49 49
SALES FINANCING
Nissan Renault Finance Mexico Mexico 15 15