4.2 BIOLOGICAL RESOURCES - slc.ca.gov · 13 4.2.1 ENVIRONMENTAL SETTING ... Oriental shrimp...
58
February 2014 4.2-1 Amorco Marine Oil Terminal Lease Consideration Project Final EIR 4.2 BIOLOGICAL RESOURCES 1 Section 4.2 presents the existing environment and impacts analysis of biological resource 2 issues associated with the granting of a new lease to the Amorco Marine Oil Terminal 3 (Amorco Terminal) to continue to operate in the southeastern Carquinez Strait. The 4 existing biological resources in the San Francisco Bay Estuary and in the Amorco Marine 5 Oil Terminal Lease Consideration Project (Project) study area (lower Suisun Bay and 6 upper Carquinez Strait) are described, as well as in the immediate vicinity of the Amorco 7 Terminal. Also included is a summary of laws and regulations that may affect biological 8 resources. This is followed by an analysis of the potential Project impacts. Routine 9 operations at the Amorco Terminal, or an accidental release of oil, present the potential 10 to impact nearby biological resources. An oil spill could have wide-ranging effects on 11 biological resources in the San Francisco Bay Estuary. 12 4.2.1 ENVIRONMENTAL SETTING 13 4.2.1.1 San Francisco Bay Estuary 14 Geographic and Hydrologic Characteristics of the San Francisco Bay Estuary 15 The San Francisco Bay Estuary is typically divided into five segments: The Sacramento- 16 San Joaquin River Delta (Delta), Suisun Bay, San Pablo Bay, Central Bay, and South 17 Bay (see Figure 4.2-1). 18 The Delta is the easternmost, or most upstream, segment. The Delta is a 1,150-square- 19 mile triangle-shaped region roughly bounded on the north by the city of Sacramento, on 20 the south by the city of Tracy, and on the west by Chipps Island. The Sacramento and 21 San Joaquin Rivers and their tributaries flowing into the Delta drain about half of the 22 surface area of California and establish the extent of brackish water habitat in Suisun 23 Bay. 24 Suisun Bay is a shallow estuarine bay bounded by Chipps Island on the east and the 25 Benicia-Martinez Bridge on the west. Suisun Marsh, the largest brackish water marsh in 26 the United States and the largest wetland in California, forms its northern boundary. 27 Suisun Bay has the lowest salinity levels in the San Francisco Bay system, with values 28 ranging from oligohaline (0.5 to 5.0 parts per thousand [ppt]) to mesohaline (5.0 to 18.0 29 ppt) depending on seasonal variations in tides, evaporation, and freshwater inflows from 30 the Delta. The southern shore of Suisun Bay is home to the Concord Naval Weapons 31 Station and the cities of Pittsburg, West Pittsburg, Avon, and Martinez. Suisun Bay is 32 connected to San Pablo Bay via the Carquinez Strait, a narrow, 12-mile-long band of 33 water that extends from between the Benicia-Martinez Bridge to Mare Island. 34
Transcript of 4.2 BIOLOGICAL RESOURCES - slc.ca.gov · 13 4.2.1 ENVIRONMENTAL SETTING ... Oriental shrimp...
February 2014 4.2-1 Amorco Marine Oil Terminal Lease Consideration Project Final EIR
4.2 BIOLOGICAL RESOURCES 1
Section 4.2 presents the existing environment and impacts analysis of biological resource 2
issues associated with the granting of a new lease to the Amorco Marine Oil Terminal 3
(Amorco Terminal) to continue to operate in the southeastern Carquinez Strait. The 4
existing biological resources in the San Francisco Bay Estuary and in the Amorco Marine 5
Oil Terminal Lease Consideration Project (Project) study area (lower Suisun Bay and 6
upper Carquinez Strait) are described, as well as in the immediate vicinity of the Amorco 7
Terminal. Also included is a summary of laws and regulations that may affect biological 8
resources. This is followed by an analysis of the potential Project impacts. Routine 9
operations at the Amorco Terminal, or an accidental release of oil, present the potential 10
to impact nearby biological resources. An oil spill could have wide-ranging effects on 11
biological resources in the San Francisco Bay Estuary. 12
4.2.1 ENVIRONMENTAL SETTING 13
4.2.1.1 San Francisco Bay Estuary 14
Geographic and Hydrologic Characteristics of the San Francisco Bay Estuary 15
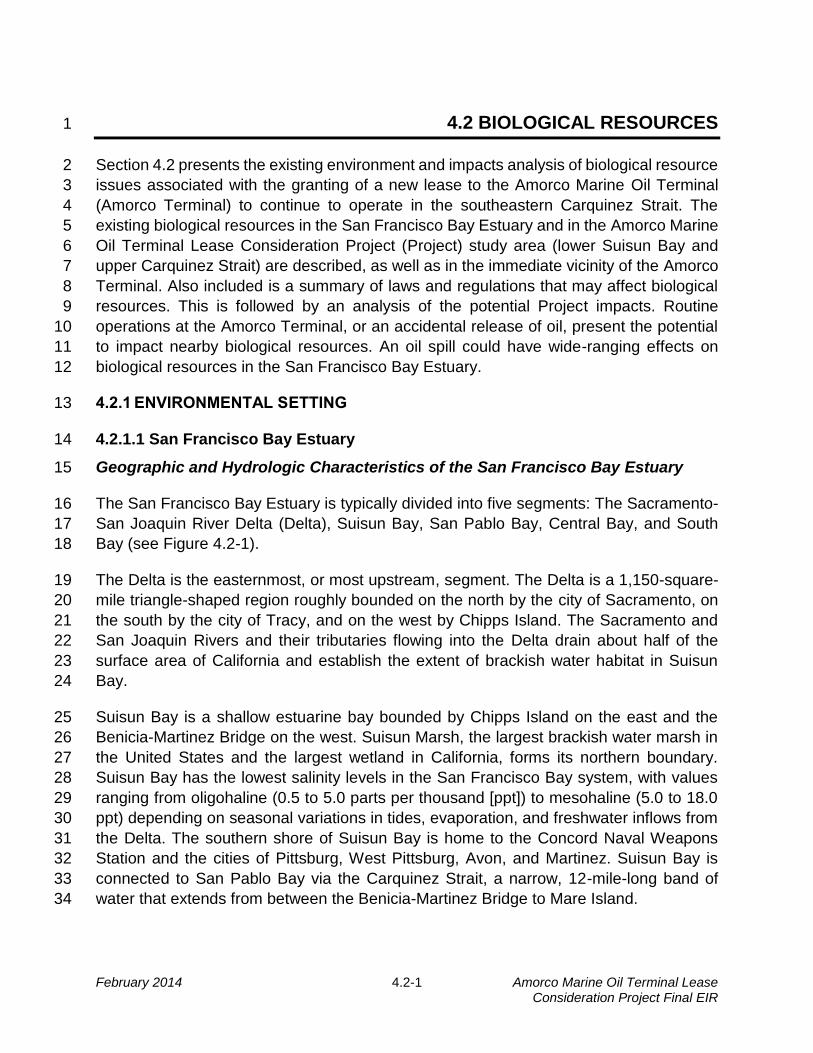
The San Francisco Bay Estuary is typically divided into five segments: The Sacramento-16
San Joaquin River Delta (Delta), Suisun Bay, San Pablo Bay, Central Bay, and South 17
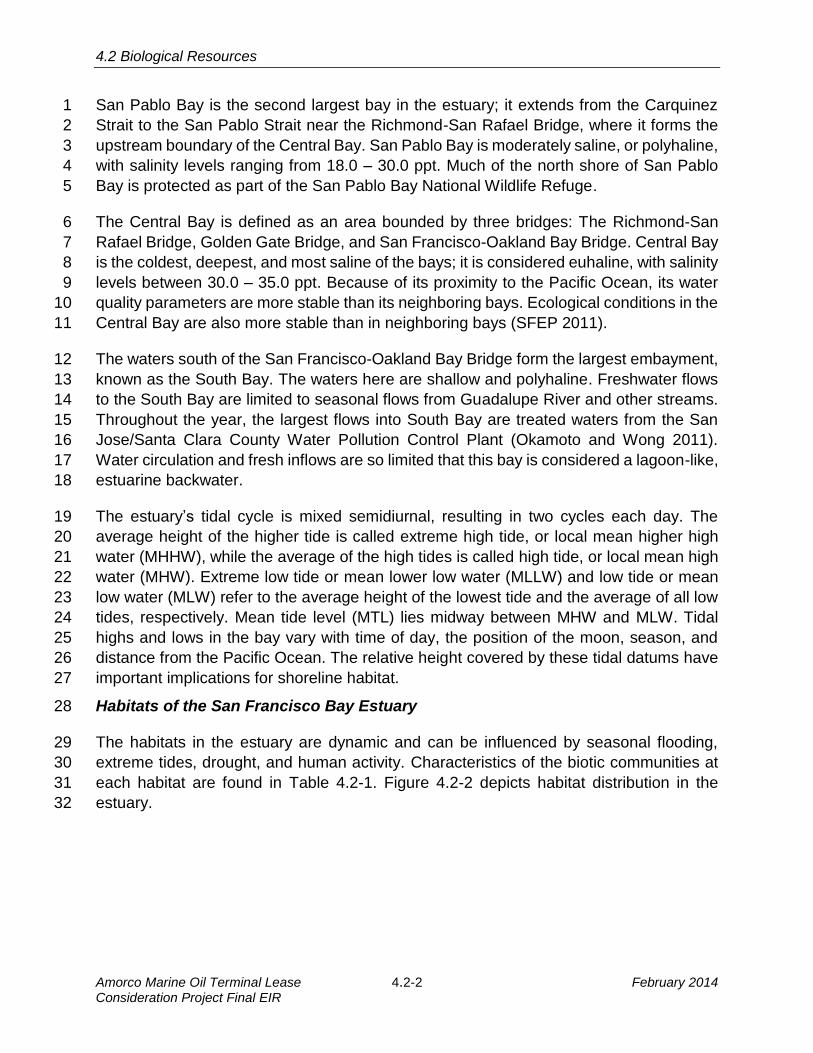
Bay (see Figure 4.2-1). 18
The Delta is the easternmost, or most upstream, segment. The Delta is a 1,150-square-19
mile triangle-shaped region roughly bounded on the north by the city of Sacramento, on 20
the south by the city of Tracy, and on the west by Chipps Island. The Sacramento and 21
San Joaquin Rivers and their tributaries flowing into the Delta drain about half of the 22
surface area of California and establish the extent of brackish water habitat in Suisun 23
Bay. 24
Suisun Bay is a shallow estuarine bay bounded by Chipps Island on the east and the 25
Benicia-Martinez Bridge on the west. Suisun Marsh, the largest brackish water marsh in 26
the United States and the largest wetland in California, forms its northern boundary. 27
Suisun Bay has the lowest salinity levels in the San Francisco Bay system, with values 28
ranging from oligohaline (0.5 to 5.0 parts per thousand [ppt]) to mesohaline (5.0 to 18.0 29
ppt) depending on seasonal variations in tides, evaporation, and freshwater inflows from 30
the Delta. The southern shore of Suisun Bay is home to the Concord Naval Weapons 31
Station and the cities of Pittsburg, West Pittsburg, Avon, and Martinez. Suisun Bay is 32
connected to San Pablo Bay via the Carquinez Strait, a narrow, 12-mile-long band of 33
water that extends from between the Benicia-Martinez Bridge to Mare Island. 34
4.2 Biological Resources
Amorco Marine Oil Terminal Lease 4.2-2 February 2014 Consideration Project Final EIR
San Pablo Bay is the second largest bay in the estuary; it extends from the Carquinez 1
Strait to the San Pablo Strait near the Richmond-San Rafael Bridge, where it forms the 2
upstream boundary of the Central Bay. San Pablo Bay is moderately saline, or polyhaline, 3
with salinity levels ranging from 18.0 – 30.0 ppt. Much of the north shore of San Pablo 4
Bay is protected as part of the San Pablo Bay National Wildlife Refuge. 5
The Central Bay is defined as an area bounded by three bridges: The Richmond-San 6
Rafael Bridge, Golden Gate Bridge, and San Francisco-Oakland Bay Bridge. Central Bay 7
is the coldest, deepest, and most saline of the bays; it is considered euhaline, with salinity 8
levels between 30.0 – 35.0 ppt. Because of its proximity to the Pacific Ocean, its water 9
quality parameters are more stable than its neighboring bays. Ecological conditions in the 10
Central Bay are also more stable than in neighboring bays (SFEP 2011). 11
The waters south of the San Francisco-Oakland Bay Bridge form the largest embayment, 12
known as the South Bay. The waters here are shallow and polyhaline. Freshwater flows 13
to the South Bay are limited to seasonal flows from Guadalupe River and other streams. 14
Throughout the year, the largest flows into South Bay are treated waters from the San 15
Jose/Santa Clara County Water Pollution Control Plant (Okamoto and Wong 2011). 16
Water circulation and fresh inflows are so limited that this bay is considered a lagoon-like, 17
estuarine backwater. 18
The estuary’s tidal cycle is mixed semidiurnal, resulting in two cycles each day. The 19
average height of the higher tide is called extreme high tide, or local mean higher high 20
water (MHHW), while the average of the high tides is called high tide, or local mean high 21
water (MHW). Extreme low tide or mean lower low water (MLLW) and low tide or mean 22
low water (MLW) refer to the average height of the lowest tide and the average of all low 23
tides, respectively. Mean tide level (MTL) lies midway between MHW and MLW. Tidal 24
highs and lows in the bay vary with time of day, the position of the moon, season, and 25
distance from the Pacific Ocean. The relative height covered by these tidal datums have 26
important implications for shoreline habitat. 27
Habitats of the San Francisco Bay Estuary 28
The habitats in the estuary are dynamic and can be influenced by seasonal flooding, 29
extreme tides, drought, and human activity. Characteristics of the biotic communities at 30
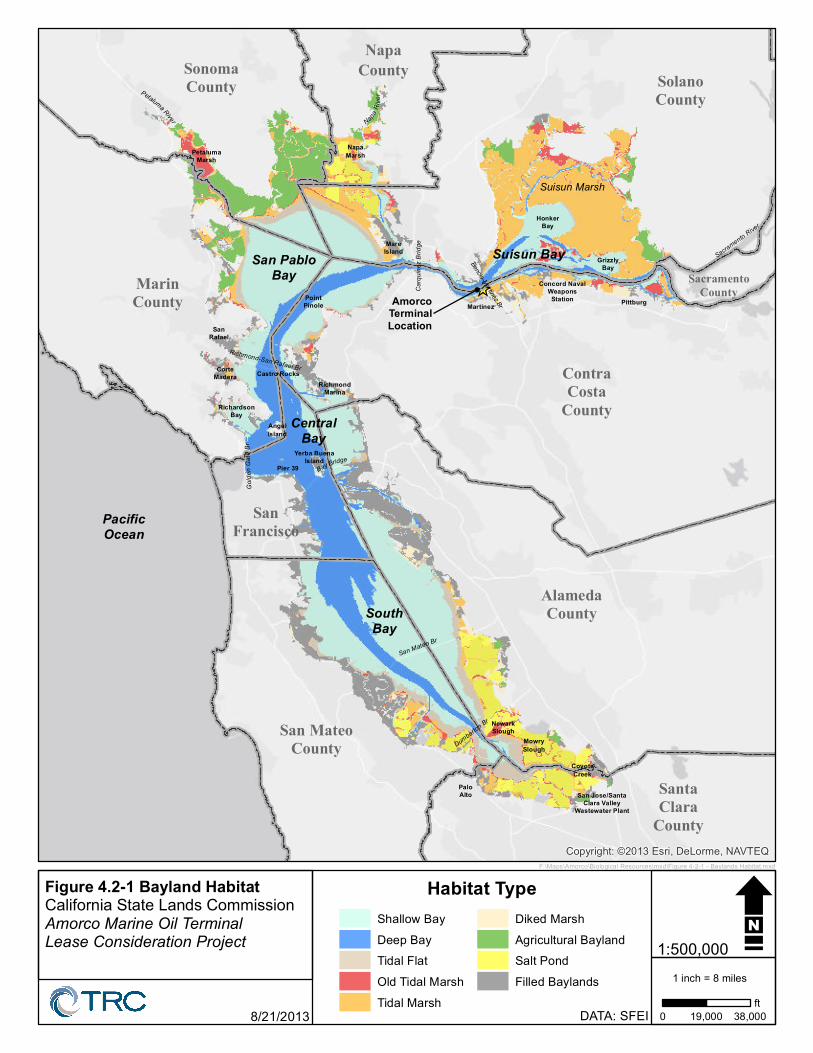
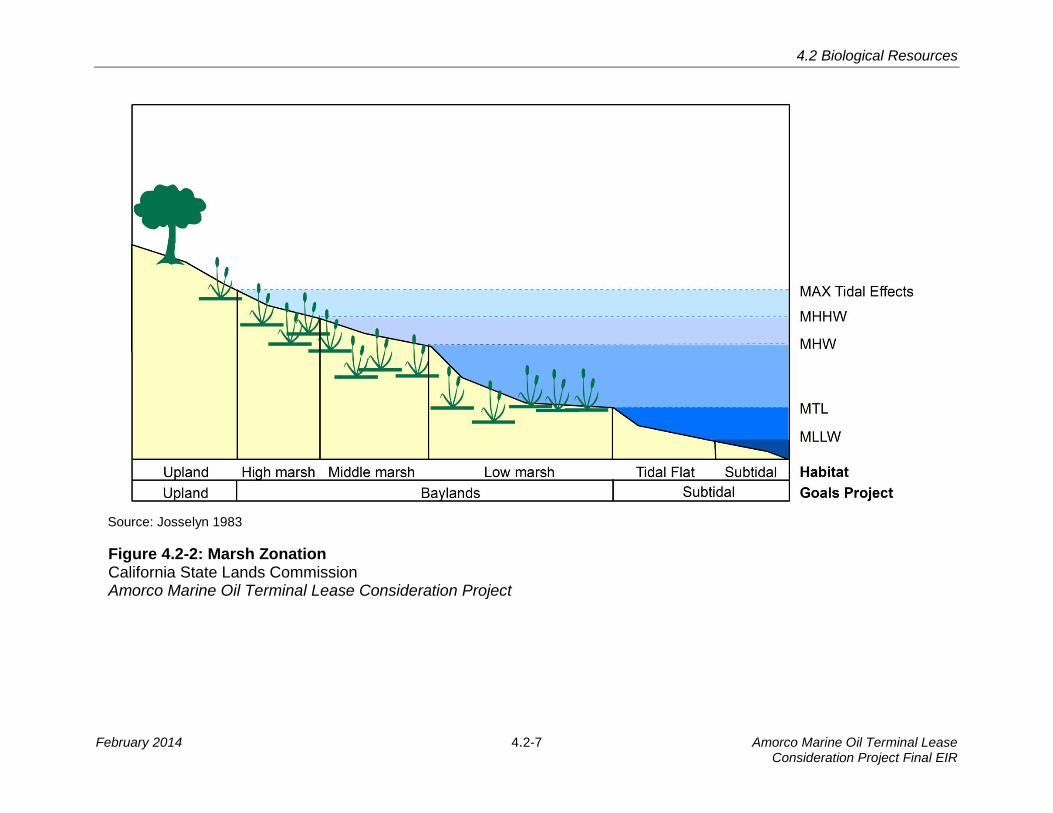
each habitat are found in Table 4.2-1. Figure 4.2-2 depicts habitat distribution in the 31
estuary. 32
PacificOcean
San PabloBay
Suisun Bay
CentralBay
SouthBay
Suisun Marsh
AmorcoTerminalLocation
SonomaCounty
NapaCounty
SacramentoCounty
SolanoCounty
MarinCounty
ContraCosta
County
SanFrancisco
AlamedaCounty
San MateoCounty
SantaClara
County
MareIsland
Concord NavalWeaponsStation
AngelIsland
Yerba BuenaIsland
RichardsonBay
PaloAlto
SanRafael
MowrySlough
San Jose/SantaClara Valley
Wastewater Plant
PointPinole
Pier 39
RichmondMarina
NewarkSlough
CoyoteCreek
PetalumaMarsh
NapaMarsh
CorteMadera Castro Rocks
PittburgMartinez
GrizzlyBay
HonkerBay
Carqu
inez B
ridge
Bencia-Martinez Br
Golde
n Gate
Br
Dumbarton Br
Richmond-San Rafael Br
NapaRi
ver
Sacramento River
Petaluma River
Bay Bridge
San Mateo Br
Copyright: ©2013 Esri, DeLorme, NAVTEQ
Figure 4.2-1 Bayland HabitatCalifornia State Lands CommissionAmorco Marine Oil TerminalLease Consideration Project
8/21/2013 0 38,00019,000ft
1 inch = 8 miles
F:\Maps\Amorco\Biological Resources\mxd\Figure 4-2-1 - Baylands Habitat.mxd
1:500,000
Habitat TypeShallow BayDeep BayTidal FlatOld Tidal MarshTidal Marsh
Diked MarshAgricultural BaylandSalt PondFilled Baylands
DATA: SFEI

THIS PAGE IS INTENDED TO BE LEFT BLANK
4.2 Biological Resources
February 2014 4.2-5 Amorco Marine Oil Terminal Lease Consideration Project Final EIR
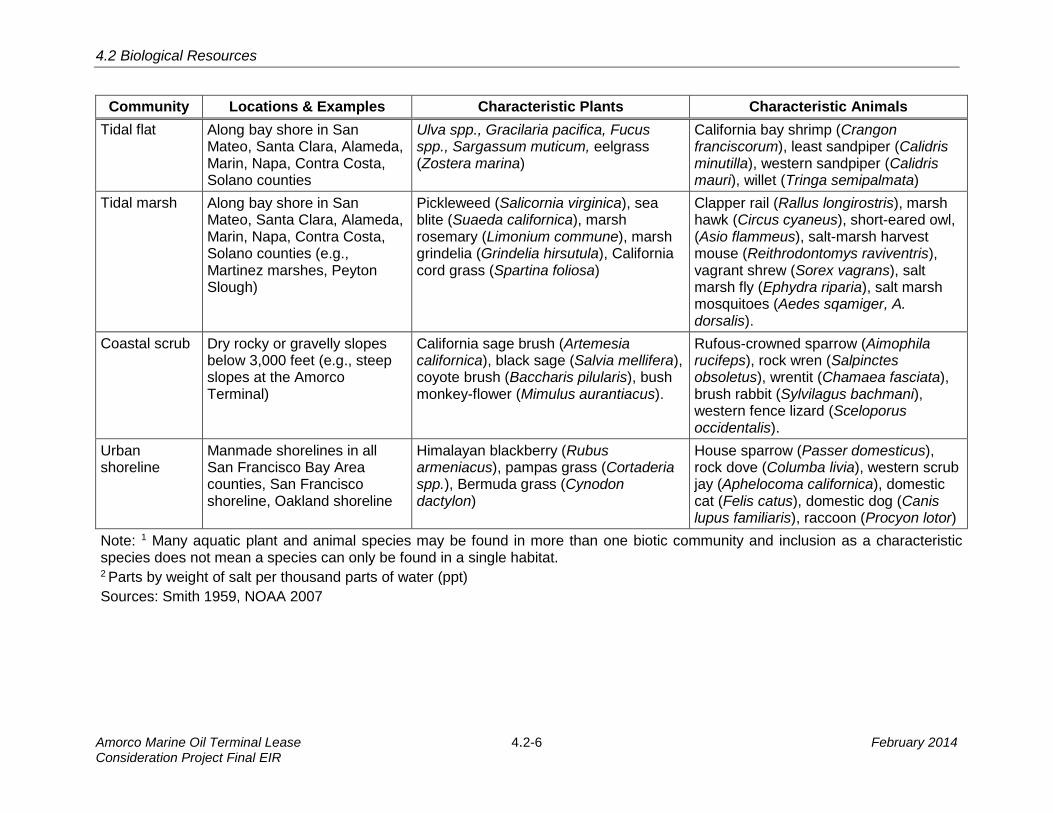
Table 4.2-1: Biotic Communities of the San Francisco Bay Estuary1 1
Community Locations & Examples Characteristic Plants Characteristic Animals
Diadromous Open waters of the San Francisco Bay Estuary, Sacramento and San Joaquin Rivers, Napa River
N/A Chinook salmon (Oncorhynchus tshawytscha), steelhead (Oncorhynchus mykiss), delta smelt (Hypomesus transpacificus), longfin smelt (Spirinchus thaleichthys), striped bass (Morone saxatilis)
Limnetic 0 – 0.5 ppt2 salinity. Sacramento River, San Joaquin River
Sago pondweed (Potomogeton pectinatus)
Asian clam (Corbicula fluminea)
Oligohaline 0.5 – 5.0 ppt salinity. Suisun Bay
Widgeon grass (Ruppia maritime) California bay shrimp (Crangon franciscorum)
Mesohaline 5.0 – 18.0 ppt salinity. Suisun Bay, Carquinez Strait
Widgeon grass (Ruppia maritime) Overbite clam (Corbula amurensis), Oriental shrimp (Palaemon macrodactylus, starry flounder (Platichthys stellatus)
Polyhaline 18.0 – 30.0 ppt salinity. Carquinez Strait, San Pablo Bay, South Bay
Ulva, Gracilaria pacifica, Fucus, Sargassum muticum, eelgrass (Zostera marina)
Blacktail bay shrimp (Crangon nigricauda), Dungeness crab (Metacarcinus magister), Pacific herring (Clupea pallasii), Pacific staghorn sculpin (Leptocottus armatus), English sole (Parophyrys vetulus)
Euhaline 30.0 – 35.0 ppt salinity. Central Bay
Ulva, Gracilaria pacifica, Fucus, Sargassum muticum, eelgrass (Zostera marina)
Blackspotted bay shrimp (Crangon nigromaculata), leopard shark (Triakis semifasciatai), bat ray (Myliobatis californica), Pacific sardine (Sardinops sagax), northern anchovy (Engraulis mordax), California halibut (Paralichthys californicus)
4.2 Biological Resources
Amorco Marine Oil Terminal Lease 4.2-6 February 2014 Consideration Project Final EIR
Community Locations & Examples Characteristic Plants Characteristic Animals
Tidal flat Along bay shore in San Mateo, Santa Clara, Alameda, Marin, Napa, Contra Costa, Solano counties
Ulva spp., Gracilaria pacifica, Fucus spp., Sargassum muticum, eelgrass (Zostera marina)
California bay shrimp (Crangon franciscorum), least sandpiper (Calidris minutilla), western sandpiper (Calidris mauri), willet (Tringa semipalmata)
Tidal marsh Along bay shore in San Mateo, Santa Clara, Alameda, Marin, Napa, Contra Costa, Solano counties (e.g., Martinez marshes, Peyton Slough)
Pickleweed (Salicornia virginica), sea blite (Suaeda californica), marsh rosemary (Limonium commune), marsh grindelia (Grindelia hirsutula), California cord grass (Spartina foliosa)
Clapper rail (Rallus longirostris), marsh hawk (Circus cyaneus), short-eared owl, (Asio flammeus), salt-marsh harvest mouse (Reithrodontomys raviventris), vagrant shrew (Sorex vagrans), salt marsh fly (Ephydra riparia), salt marsh mosquitoes (Aedes sqamiger, A. dorsalis).
Coastal scrub Dry rocky or gravelly slopes below 3,000 feet (e.g., steep slopes at the Amorco Terminal)
California sage brush (Artemesia californica), black sage (Salvia mellifera), coyote brush (Baccharis pilularis), bush monkey-flower (Mimulus aurantiacus).
Rufous-crowned sparrow (Aimophila rucifeps), rock wren (Salpinctes obsoletus), wrentit (Chamaea fasciata), brush rabbit (Sylvilagus bachmani), western fence lizard (Sceloporus occidentalis).
Urban shoreline
Manmade shorelines in all San Francisco Bay Area counties, San Francisco shoreline, Oakland shoreline
Himalayan blackberry (Rubus armeniacus), pampas grass (Cortaderia spp.), Bermuda grass (Cynodon dactylon)
House sparrow (Passer domesticus), rock dove (Columba livia), western scrub jay (Aphelocoma californica), domestic cat (Felis catus), domestic dog (Canis lupus familiaris), raccoon (Procyon lotor)
Note: 1 Many aquatic plant and animal species may be found in more than one biotic community and inclusion as a characteristic species does not mean a species can only be found in a single habitat. 2 Parts by weight of salt per thousand parts of water (ppt)
Sources: Smith 1959, NOAA 2007
4.2 Biological Resources
February 2014 4.2-7 Amorco Marine Oil Terminal Lease Consideration Project Final EIR
Source: Josselyn 1983
Figure 4.2-2: Marsh Zonation California State Lands Commission Amorco Marine Oil Terminal Lease Consideration Project
4.2 Biological Resources
Amorco Marine Oil Terminal Lease 4.2-8 February 2014 Consideration Project Final EIR
Subtidal 1
Open-water habitats are divided into two categories: Shallow bay and deep bay. Shallow 2
bays are subtidal areas less than 18 feet deep below extreme low tide; deep bay habitats 3
are deeper. The bay contains approximately 164,000 acres of shallow bay habitat and 4
81,000 acres of deep bay habitat (Monroe et al. 1999). Deep bay areas are found in the 5
Central Bay and South Bay, and along the main deep-water channel in the San Pablo 6
and Suisun Bays. All bays contain extensive areas of shallow bay habitat. 7
The open waters of the bay are primarily underlain by soft-bottom bay sediments, 8
although there are small and important areas where the substrate is either vegetated or 9
supports shellfish beds. Areas of eelgrass habitat are found along the urban coastlines 10
west of Richmond and Oakland. The southern shoreline of San Pablo Bay contains the 11
most extensive areas of eelgrass beds in the San Francisco Bay Estuary. Native oyster 12
beds are found in the same general areas as eelgrass habitats. Crushed shell substrate 13
is found in the South Bay (SFEP 2011). 14
Soft-bottom substrate consists of sedimentary particles such as clay, silt, and sand that 15
can be readily mobilized by tidal currents. This widespread substrate covers 90 percent 16
of the San Francisco Bay Estuary (SFEP 2011). The primary sources of sediment into the 17
San Francisco Estuary are the watersheds of the Sacramento and San Joaquin Rivers. 18
River currents carry sediment into the estuary and deposit it onto the channel bottom, 19
while tidal currents resuspend the fine sediment into the water column. The cyclical 20
deposition and resuspension of fine sediments leads to sorting by grain size, where larger 21
grain sediments are found in the channels and mud/silt/clay accretes into consolidated 22
mudflats near shore. Soft-bottom substrates are characterized by a lack of large, stable 23
surfaces for plant and animal attachment (National Oceanic and Atmospheric 24
Administration [NOAA] 2007). Because of the lack of hard surfaces for rooting, few plants 25
are associated with soft-bottom habitats. However, though mobile, the fine-grained 26
sediment is both stable and compact enough to support a diverse benthic assemblage. 27
The biotic assemblages in the subtidal habitats of the San Francisco Bay Estuary vary 28
with salinity. Species tolerant of high levels of salinity but less adaptable to variable 29
changes in salinity are found in Central and South Bays. San Pablo Bay and Suisun Bay 30
support brackish water and freshwater species that are more tolerant of the shifting 31
salinity levels. 32
Suisun Bay is also the site of the entrapment zone, an area where suspended materials 33
concentrate as a result of mixing by the outgoing freshwater flow from the Delta above 34
the heavier saltwater flow from San Francisco Bay. The entrapment zone contains 35
concentrations of suspended materials such as nutrients, plankton, and fine sediments 36
that are often many times higher than in areas upstream or downstream of the entrapment 37
zone (Levine-Fricke 2004). This trophically rich habitat is thought to be important for the 38
4.2 Biological Resources
February 2014 4.2-9 Amorco Marine Oil Terminal Lease Consideration Project Final EIR
rearing of many fish species. Its precise location between the lower Delta and Suisun Bay 1
varies according to the strength and phase of the tides, and the level of freshwater inflow 2
from the Sacramento and San Joaquin Rivers. High freshwater flows from the Delta push 3
the entrapment zone west toward Carquinez Strait; low flows put it closer to the mouth of 4
the Delta. 5
Tidal Flats 6
Tidal flat habitat is the strip of intertidal habitat located between MLLW and MTL. It is 7
exposed twice a day during low tide. During high tide, inundated tidal flats provide foraging 8
habitat for fish such as longfin smelt , starry flounder (Platichthys stellatus), and several 9
species of sculpin. During low tide, shorebirds feed on clams, shrimp, and worms found 10
in the exposed tidal flats. Extreme high and low tides occur between May and June and 11
in November and December, the latter period coinciding with the time that high numbers 12
of waterbirds migrate through the San Francisco Bay Area (Bay Area). 13
The most extensive areas of tidal flat are found in the South Bay and along the north 14
shore of San Pablo Bay. About half of the bay’s tidal flats are found in the South Bay, 15
making it the region’s most important area for shorebirds (Monroe et al. 1999). Tidal flats 16
in the Central Bay are limited by shoreline development. Suisun Bay has a more narrow 17
tidal range than the other bays and has correspondingly less tidal flat. 18
Tidal Marsh 19
Tidal marshes are defined as the vegetated habitat between MLW and extreme high 20
water (Josselyn 1983). Though not all tidal marshes are saline, they are sometimes also 21
called salt marshes or saline wetlands. These marshes intergrade on their bay side with 22
tidal flats and on their inland side with freshwater marshes. Tidal marshes are highly 23
productive biological systems. Though only a small number of vascular plant species are 24
capable of living in these areas, they support unique and diverse communities of plants 25
and animals. Vegetation in tidal marshes are nurseries for commercially important 26
species and endangered species; the tidal marshes are feeding and nesting areas for 27
birds. In recognition of the importance of the San Francisco Bay Estuary, the United 28
States named it as its 35th Wetland of International Importance (Ramsar Convention on 29
Wetlands 2013). 30
Birds that feed or roost in tidal marshes include herons, egrets, ducks, coots, rails, 31
swallows, wrens, and hawks. The majority of birds that use the tidal marshes of San 32
Francisco Bay are migratory. Shorebirds that breed in the marshes include American 33
avocet (Recurvirostra Americana), black-necked stilt (Himantopus mexicanus), and 34
snowy plover (Charadrius alexandrines). Mammals found in these areas include mice, 35
shrews, bats, and raccoons. Lizards and snakes are commonly found here, as are frogs 36
and toads. Tidal marshes provide nursery habitat for fish, offering protection, food, and 37
reduced osmoregulatory stress (Josselyn 1983). 38
4.2 Biological Resources
Amorco Marine Oil Terminal Lease 4.2-10 February 2014 Consideration Project Final EIR
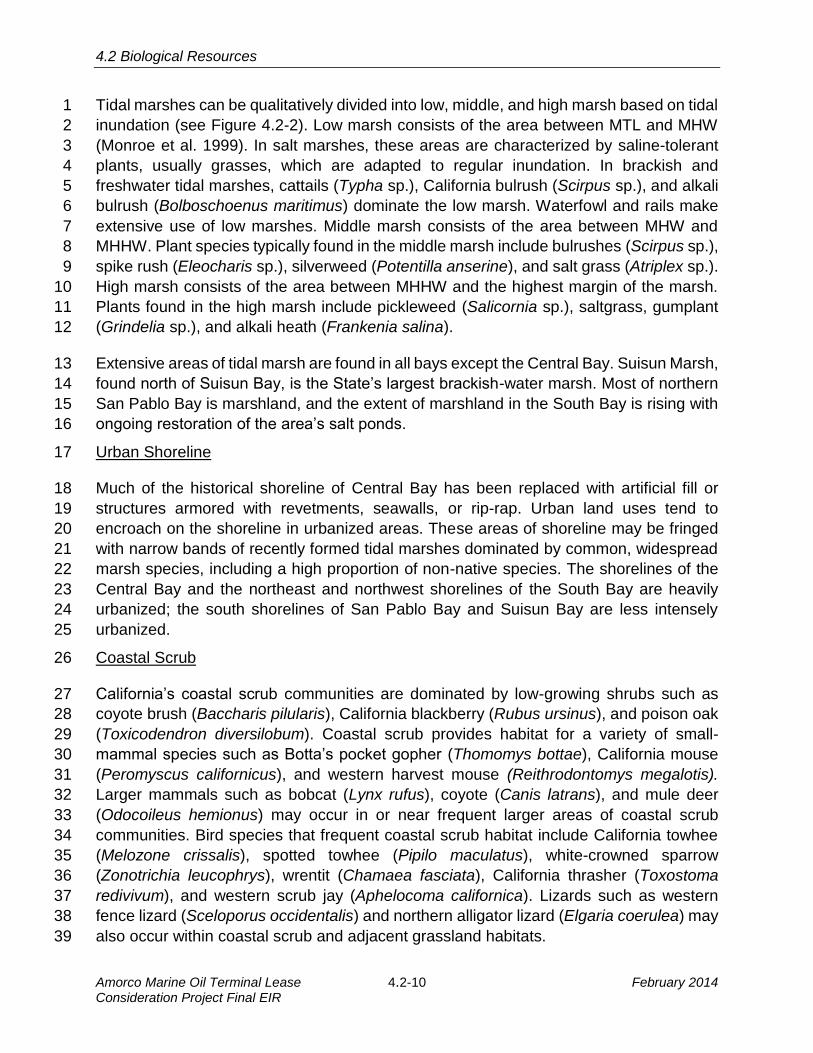
Tidal marshes can be qualitatively divided into low, middle, and high marsh based on tidal 1
inundation (see Figure 4.2-2). Low marsh consists of the area between MTL and MHW 2
(Monroe et al. 1999). In salt marshes, these areas are characterized by saline-tolerant 3
plants, usually grasses, which are adapted to regular inundation. In brackish and 4
freshwater tidal marshes, cattails (Typha sp.), California bulrush (Scirpus sp.), and alkali 5
bulrush (Bolboschoenus maritimus) dominate the low marsh. Waterfowl and rails make 6
extensive use of low marshes. Middle marsh consists of the area between MHW and 7
MHHW. Plant species typically found in the middle marsh include bulrushes (Scirpus sp.), 8
spike rush (Eleocharis sp.), silverweed (Potentilla anserine), and salt grass (Atriplex sp.). 9
High marsh consists of the area between MHHW and the highest margin of the marsh. 10
Plants found in the high marsh include pickleweed (Salicornia sp.), saltgrass, gumplant 11
(Grindelia sp.), and alkali heath (Frankenia salina). 12
Extensive areas of tidal marsh are found in all bays except the Central Bay. Suisun Marsh, 13
found north of Suisun Bay, is the State’s largest brackish-water marsh. Most of northern 14
San Pablo Bay is marshland, and the extent of marshland in the South Bay is rising with 15
ongoing restoration of the area’s salt ponds. 16
Urban Shoreline 17
Much of the historical shoreline of Central Bay has been replaced with artificial fill or 18
structures armored with revetments, seawalls, or rip-rap. Urban land uses tend to 19
encroach on the shoreline in urbanized areas. These areas of shoreline may be fringed 20
with narrow bands of recently formed tidal marshes dominated by common, widespread 21
marsh species, including a high proportion of non-native species. The shorelines of the 22
Central Bay and the northeast and northwest shorelines of the South Bay are heavily 23
urbanized; the south shorelines of San Pablo Bay and Suisun Bay are less intensely 24
urbanized. 25
Coastal Scrub 26
California’s coastal scrub communities are dominated by low-growing shrubs such as 27
coyote brush (Baccharis pilularis), California blackberry (Rubus ursinus), and poison oak 28
(Toxicodendron diversilobum). Coastal scrub provides habitat for a variety of small-29
mammal species such as Botta’s pocket gopher (Thomomys bottae), California mouse 30
(Peromyscus californicus), and western harvest mouse (Reithrodontomys megalotis). 31
Larger mammals such as bobcat (Lynx rufus), coyote (Canis latrans), and mule deer 32
(Odocoileus hemionus) may occur in or near frequent larger areas of coastal scrub 33
communities. Bird species that frequent coastal scrub habitat include California towhee 34
(Melozone crissalis), spotted towhee (Pipilo maculatus), white-crowned sparrow 35
(Zonotrichia leucophrys), wrentit (Chamaea fasciata), California thrasher (Toxostoma 36
redivivum), and western scrub jay (Aphelocoma californica). Lizards such as western 37
fence lizard (Sceloporus occidentalis) and northern alligator lizard (Elgaria coerulea) may 38
also occur within coastal scrub and adjacent grassland habitats. 39
4.2 Biological Resources
February 2014 4.2-11 Amorco Marine Oil Terminal Lease Consideration Project Final EIR
Biological Characteristics of the San Francisco Estuary 1
Plankton 2
Phytoplankton (e.g., diatoms, cyanobacteria, dinoflagellates) are photosynthesizing 3
microorganisms that inhabit water. Phytoplankton provide a source of organic carbon and 4
energy at the base of the food chain (Cloern 1979). Compared to other estuaries, 5
phytoplankton primary productivity in the San Francisco Bay Estuary is relatively low. The 6
population density of phytoplankton in the bay cycles throughout the year, with levels 7
higher during spring in San Pablo, Central, and South Bays, and during the summer in 8
Suisun Bay (Cloern 1979). In the northern bays, phytoplankton growth can be separated 9
into three seasons: A spring bloom period during which water-born nitrates are available 10
to phytoplankton; a low-productivity period in the summer when turbidity limits light 11
penetration into the water; and a second, smaller fall bloom based on ammonium uptake 12
(Wilkerson et al. 2006). High levels of phytoplankton (algal blooms) can cause 13
environmental stress, affecting concentrations of dissolved oxygen and carbon dioxide, 14
dissolved organic and inorganic substances, and pH. 15
Zooplankton are a diverse group that can range in size from microscopic (microplankton) 16
to those that can be seen by the naked eye (macroplankton). This heterogeneous group 17
includes mysid shrimp, clams, jellyfish, copepods, and crustaceans. They feed upon 18
phytoplankton, bacteria, organic detritus, and each other. 19
Nonnative jellyfish are found throughout the estuary, including three hydrozoan species 20
thought to be native to the Black Sea and one scyphozoan species thought to be 21
introduced from Tokyo Bay. The hydrozoan species are present among the plankton from 22
May through November, with peak abundances coinciding with warmer summer and fall 23
temperatures. It has been suggested that jellyfish are passively spread through all low-24
salinity areas of San Francisco Bay via attachment to boat bottoms (NOAA 2007). 25
Icthyoplankton consists of fish eggs and larvae found in near-surface waters, where they 26
float passively on water currents. Ichtyoplankton feed on microplankton and are in turn 27
fed on by larger animals. 28
Invertebrates 29
California bay shrimp (Crangon franciscorum) is the most common shrimp in San 30
Francisco Bay most years and supports a small commercial fishery. The blackspotted 31
shrimp (Crangon nigromaculata) is the second most common shrimp in the San Francisco 32
Bay overall and the most common shrimp in some years. 33
The San Francisco Bay Estuary is a nursery area for shrimp and crabs, and fish. The 34
highest densities of bay shrimp are found in Suisun Bay, where juveniles rear in shallow, 35
low saline waters (NOAA 2007). Dungeness crab (Metacarcinus magister) reproduce in 36
the ocean, and the small juvenile stages settle to the bottom of the ocean where they are 37
4.2 Biological Resources
Amorco Marine Oil Terminal Lease 4.2-12 February 2014 Consideration Project Final EIR
carried into the bay on tidal currents and spend the first year or two of their lives rearing 1
in San Pablo and South Bays (NOAA 2007). 2
Different species of shrimp tend to inhabit different regions of the bay, though species do 3
overlap in distribution. Shrimp species that live in the more saline environment of the bay 4
have grown in abundance over the past 15 years and expanded in range into the 5
upstream regions of the bay, particularly in dry years when saline levels increase 6
upstream. Low-salinity species such as the bay shrimp show no increase in abundance 7
over the past 15 years. Regionally, shrimp abundance increased in all parts of the bay 8
except in Suisun Bay (SFEP 2011). 9
The abundance of shrimp and crab in the South Bay during the last 15 years is largely in 10
response to increased nutrient availability in coastal waters. Because shrimp and crab 11
prey on large benthic invertebrates, particularly clams, the increased numbers have led 12
to a decline in the abundance of clams in the South Bay (Cloern 2011). 13
Fish 14
The health of the San Francisco Bay Estuary’s fish communities varies geographically. 15
The Central Bay fish population has been stable for 30 years, but the populations in the 16
other bays have seen declines in health over the same period. This decline has been 17
most dramatic for Suisun Bay, but is also apparent in San Pablo Bay and, increasingly, 18
in the South Bay. Fish abundance, diversity, and percentage of native species have 19
declined in all bays except the Central Bay (SFEP 2011). 20
Beginning in 2002, abundance indices of four pelagic fishes in the upper San Francisco 21
Estuary declined rapidly to record low levels from which they have not recovered. Since 22
2004, a consortium of federal and State agencies formed the Pelagic Organisms Decline 23
Management Team to focus attention on the causes of the decline for delta smelt, longfin 24
smelt, threadfin shad (Dorosoma petenense), and juvenile striped bass (Morone 25
saxatilis). The emerging conclusion from nearly a decade of research is that the decline 26
has its roots in multiple, interacting causes, including low original population abundance, 27
a decrease in suitable habitat, mortality from predation and entrainment into water 28
diversions, and a fundamental shift in the food web in the upper Delta from a 29
phytoplankton-based food web to a detritus-based food web (IEP 2010). 30
Birds 31
San Francisco Bay Estuary is a major stopover for birds migrating along the Pacific 32
Flyway, and many birds also nest along the San Francisco Bay. Nearly half of Pacific 33
Coast waterfowl and shorebirds depend upon the San Francisco Bay and its mudflats for 34
foraging during migration, with peak abundance occurring November through mid-March 35
(SFEP 2011). In recognition of its critical conservation importance for shorebirds, San 36
Francisco Bay Estuary is listed as an important shorebird migratory stopover in the 37
Western Hemisphere Shorebird Reserve Network (USFWS 2002). Migratory stopovers 38
4.2 Biological Resources
February 2014 4.2-13 Amorco Marine Oil Terminal Lease Consideration Project Final EIR
are wetlands and associated habitats that have high densities of food available at critical 1
times during waterfowl and shorebird migration. These migrations are energy intensive 2
and may include long-distance, non-stop flights of over 1,000 miles between stopover 3
areas. Migrating flocks are large and migrations may occur in a very tight window, 4
resulting in a large proportion of a species’ entire population visiting a single site over a 5
few weeks and requiring a vast quantity of available forage. 6
Waterbirds are typically classified based on habitat and foraging preference. Waterfowl 7
are those species that depend primarily on open-water habitat for foraging and roosting, 8
but breed in wetland and/or adjacent upland habitats. Ducks, geese, and grebes are all 9
waterfowl. Waterfowl are further divided into dabblers and divers. Dabbling ducks, which 10
feed at or below the surface of shallow water, have increased in Suisun and San Pablo 11
Bays, while populations have held steady in the Central and South Bays (Pitkin and Wood 12
2011). Diving ducks, which feed in deeper waters, have decreased in San Pablo Bay but 13
increased in Suisun Bay as populations of their primary prey, large invertebrates such as 14
clams, have changed. Overall, populations of dabbling ducks have increased and winter 15
populations of diving ducks have decreased. Seabirds such as gulls, terns, and 16
cormorants forage and nest in many of the habitats found around the San Francisco Bay. 17
Many species make use of human-created habitats such as piers, bridges, and the 18
structures found at Alcatraz Island (Pitkin and Wood 2011). 19
Shorebirds primarily use beach, tidal flats, salt ponds, and shallow open-water habitats 20
for foraging and roosting, and nest on beaches or adjacent upland areas. Sandpipers, 21
plovers, and dowitchers are all examples of shorebirds. The overall status of shorebirds 22
in tidal flats is stable. Population declines in the South Bay have been offset by population 23
increases in San Pablo Bay. The western sandpiper (Calidris mauri), one of the most 24
common species, has declined across the San Francisco Estuary, but populations of two 25
other common species, least sandpiper (Calidris minutilla) and willet (Tringa 26
semipalmata), have increased greatly (Pitkin and Wood 2011). 27
Marsh birds include species that depend on emergent marshes for foraging, nesting, and 28
roosting. California black rail (Laterallus jamaicensis coturniculus) and song sparrows are 29
examples of marsh birds. Tidal marsh bird abundance has increased in San Pablo Bay 30
and Suisun Bay, mainly driven by increases in common yellowthroat (Geothlypis trichas) 31
and California black rail populations, but has decreased in the Central and South Bays 32
(SFEP 2011). Reproductive success of tidal marsh birds has increased in Suisun Bay but 33
is decreasing in San Pablo Bay. In particular, San Pablo song sparrow and Suisun song 34
sparrow populations are below the level required to sustain their populations, and are 35
expected to exhibit long-term declines. The decrease in tidal marsh bird abundance is 36
attributed to predators and nest flooding (Pitkin and Wood 2011). 37
Wading birds use emergent marsh, marsh edge, and shallow open-water habitats to 38
forage and roost in upland areas. Locally, examples include the great blue heron, cattle 39
4.2 Biological Resources
Amorco Marine Oil Terminal Lease 4.2-14 February 2014 Consideration Project Final EIR
egret, and great egret. Heron and many egret populations are increasing in San Pablo 1
Bay, but there has been a decline in the nesting success for great egrets (SFEP 2011). 2
Mammals 3
San Francisco Bay Estuary’s mammals are found on the shore and in the water. The most 4
common terrestrial species found in coastal marshes include generalists such as Norway 5
rat (Rattus norvegicus), house mouse (Mus musculus), California vole (Microtus 6
californicus), and raccoon (Procyon lotor), which are adaptable to a wide range of 7
habitats. Terrestrial mammals that are obligate users of marsh habitat, such as saltmarsh 8
harvest mouse (Reithrodontomys raviventris), have seen drastic population declines as a 9
result of habitat loss, and many are now listed as Threatened or Endangered by the 10
federal and State governments. 11
Populations of beaver (Castor canadensis), river otter (Lontra canadensis), and sea otter 12
(Enhydra lutris) were extirpated from the San Francisco Estuary by over harvesting in the 13
19th century. Both river otter and beaver have recently recolonized the San Francisco 14
Estuary; river otter have been reported throughout the San Francisco Bay, including 15
Coyote Creek in the South Bay, the Richmond Marina in the Central Bay, Martinez Marina 16
on Carquinez Strait, and from wetlands in Suisun Bay (ROEP 2013). Beaver are now 17
found in the marshes in north San Pablo Bay and on the lower Alhambra Creek in 18
downtown Martinez. 19
The most common aquatic mammals in the San Francisco Estuary are California sea lion 20
(Zalophus californianus) and harbor seal (Phoca vitullina) (NOAA 2007). The California 21
sea lions are mainly males that migrate to the San Francisco Estuary to forage and 22
establish a dominance hierarchy; female California sea lions stay south of Santa Barbara. 23
California sea lion haul outs are found throughout the San Francisco Bay, most 24
prominently on San Francisco’s Pier 39. Harbor seals are resident breeders. Harbor seals 25
will haul out throughout the San Francisco Bay; major haul out and pupping sites are 26
located in the Central and South Bays at the Castro Rocks near the Richmond-San Rafael 27
Bridge, Yerba Buena Island by the San Francisco-Oakland Bay Bridge, Corte Madera, 28
and Mowry Slough in the South Bay. 29
Nonindigenous Aquatic Species 30
San Francisco Bay Estuary has been described as one of the most invaded ecosystems 31
in North America (Cohen and Carlton 1995). Nonindigenous aquatic species dominate 32
many parts of the San Francisco Bay, to the extent that in some locations only introduced 33
species can be found. In 2010, the California Department of Fish and Wildlife (CDFW) 34
collected 497 species from San Francisco Bay Estuary, of which 98 species were 35
classified as introduced, including three newly detected species to San Francisco Bay 36
Estuary that had likely been spread from other locations in California (OSPR 2011). The 37
4.2 Biological Resources
February 2014 4.2-15 Amorco Marine Oil Terminal Lease Consideration Project Final EIR
results indicate high numbers of introduced species are found in the South Bay, San 1
Pablo Bay, and Central Bay. Suisun Bay had the lowest number of introduced species. 2
Nonindigenous aquatic species have been introduced to the San Francisco Bay via a 3
number of vectors, including the deliberate introduction of species for recreational or 4
commercial purposes. The shipping industry has been identified as one of the major 5
vectors of nonindigenous aquatic species, and vessel biofouling and ballast water are 6
considered the largest contributors of nonindigenous species to the San Francisco Bay 7
(California State Lands Commission [CSLC] 2013e). Eighteen percent of established 8
nonindigenous aquatic species are tied to vessel biofouling as the primary likely vector 9
and 9 percent for ballast water; however, when considering established species with 10
multiple possible vectors, 60 percent could have been introduced via vessel biofouling as 11
one of several possible vectors, and 53 percent could have been introduced via ballast 12
water as one of several possible vectors (OSPR 2011). 13
Invasive species may compete directly with native species for food or space, or prey upon 14
native species. They can also change the food chain or physical environment to the 15
detriment of native species. Approximately 42 percent of the species on the federal 16
Threatened or Endangered species list are at risk primarily because of predation, 17
parasitism, and competition from nonindigenous invasive species (OSPR 2011). One 18
such currently pernicious invasive species is the overbite clam (Corbula amurensis), first 19
found in the San Francisco Bay Estuary in 1986. Thought to have been introduced into 20
the San Francisco Bay Estuary by ballast water discharge from a vessel, this planktivore 21
is now so abundant that the current population is capable of filtering the estuary’s water 22
column several times a day. In some portions of the Suisun Bay floor, the clam accounts 23
for the vast majority of biomass, and it has been implicated in the pelagic organism decline 24
by severely reducing the availability of phytoplankton in Suisun Bay (SFEP 2004, Greene 25
2011). 26
Rare, Threatened, and Endangered Species 27
Owing to the diversity of habitat between embayments, the distribution and abundance of 28
rare and sensitive species that depend on the estuarine habitat for some or all of their life 29
cycle vary throughout the region. Each habitat supports a distinct community of sensitive 30
species. To aid in the assessment of impacts, each category of sensitive species is 31
summarized by embayment. Appendix D includes Tables D-1 through D-5, which provide 32
further detailed information about each species that was considered under this 33
assessment and their potential to be present near the Project site and impacted by the 34
Project. 35
Sensitive Plants 36
Tidal habitats in the San Francisco Estuary support 12 plant species that are identified by 37
federal and/or State agencies as endangered, threatened, or rare, or are listed by the 38
4.2 Biological Resources
Amorco Marine Oil Terminal Lease 4.2-16 February 2014 Consideration Project Final EIR
California Native Plant Society as status 1B or higher. The distribution of sensitive plant 1
species varies geographically within the estuary. In general, the less urbanized the bay, 2
the more likely it is to retain a proportion of its historical marshland and to support rare or 3
sensitive plants (see Appendix D, Table D-1). 4
The Central Bay has not retained any historical tidal marsh remnants, which limits the 5
potential for rare plants with few exceptions. Naturally occurring populations of Point 6
Reye’s bird’s-beak (Cordylanthus maritimus ssp. palustris) are found along the shores of 7
Richardson Bay, and a population was reintroduced to the Crissy Field wetlands in the 8
Presidio. This species inhabits the high marsh or upper middle marsh zone. It is a 9
hemiparasitic plant, meaning that although it possesses chlorophyll and is capable of 10
limited photosynthesis, it must attach its root system to a host plant to extract water and 11
nutrients and to reproduce. Point Reye’s bird’s-beak is dependent upon plants that are 12
active in summer such as pickleweed (Salicornia sp.), saltgrass (Distichlis sp.), and fleshy 13
jaumea (Jaumea carnosa), all of which are abundant in Richardson Bay. One other 14
sensitive species is found in the Central Bay: California sea blite (Suaeda californica). 15
This species is restricted to the intertidal zone of salt marshes, and was extirpated from 16
the San Francisco Bay region in the 1960s. Since 2000, it has been successfully 17
reintroduced at four sites in the Central Bay: Heron’s Head Park at Pier 98, Pier 94, 18
Eastshore State Park north of Oakland, and Roberts Landing near San Leandro in South 19
Bay. 20
The South Bay retains fragments of historical tidal marshes at upper Newark Slough, 21
Dumbarton Marsh, and along the Palo Alto shoreline. However, no sensitive tidal marsh 22
or estuarine beach plants are known to remain in the South Bay. As mentioned above, 23
one population of California sea blite was re-introduced at Roberts Landing. 24
San Pablo Bay has retained more of its historic tidal marshes than any other bay, and as 25
a result supports naturally occurring populations of six rare species. Historical tidal 26
marshes are found along the north edge of San Pablo Bay, including China Camp in San 27
Rafael, Heerdt Marsh by Corte Madera, most of Petaluma Marsh, Whittell Marsh by Point 28
Pinole, and areas of Napa marsh, including Fagan’s Slough. The richest diversity of 29
sensitive plants is found in the marshes at the mouths of the Petaluma and Napa Rivers. 30
San Joaquin spearscale (Atriplex joaquinana) is a tall annual herb known mainly from 31
alkali grasslands and is only rarely known from tidal marsh edges where it may 32
opportunistically colonize the high-tide shorelines. Recent populations are reported from 33
along the lower Napa River. Saline marsh clover (Trifolium hydrophilum) is known to 34
occur in marshes as well as alkaline grasslands. One population is known from the Viansa 35
wetlands in northwest San Pablo Bay. The upper marsh zone of San Pablo Bay’s brackish 36
and freshwater marshes supports populations of endemic species known only to San 37
Francisco Bay Estuary: Suisun marsh aster (Symphyotrichum lentum), delta tule pea 38
(Lathyrus jepsonii var. jepsonii), and Mason’s lilaeopsis (Lilaeopsis masonii). Suisun 39
4.2 Biological Resources
February 2014 4.2-17 Amorco Marine Oil Terminal Lease Consideration Project Final EIR
marsh aster was once widely distributed in San Pablo Bay, but is reported now only from 1
the vicinity of Fagan Slough. The delta tule pea is a climbing species; individuals are 2
present in marshes along the Napa River. Mason’s lilaeopsis (Lilaeopsis masonii) is also 3
known from the Napa River corridor; it is a shade-sensitive, early successional colonizer 4
of newly deposited or exposed sediments. Two species of bird’s-beak are found in the 5
upper marsh zone in San Pablo Bay: Point Reye’s bird’s beak and the federally 6
endangered soft-bird’s beak (Cordylanthus mollis ssp. mollis). One population of Point 7
Reye’s bird’s-beak is known from the Petaluma River. Extant populations of soft bird’s-8
beak are found in the marshes along the mouth of the Napa River. 9
Most of the sensitive plants found in San Pablo Bay are also found in Suisun Bay, where 10
they are more widely distributed and abundant, particularly in the extensive brackish 11
waters of Suisun Marsh. In addition to the plants described above, Suisun Bay contains 12
populations of the federally endangered Suisun thistle (Cirsium hydrophilum var. 13
hydrophilum) in the northern reaches of Suisun Marsh in the vicinity of Rush Ranch. 14
Bolander’s water-hemlock (Cicuta maculata var. bolanderi) was once common in Suisun 15
Marsh. 16
Sensitive Fishes 17
The San Francisco Estuary provides habitat to seven species of sensitive fish. Most of 18
the sensitive fish species in the estuary either rely on brackish water habitat for their adult 19
habitat and/or travel upstream to spawn in freshwaters and have thus been affected by 20
degradation or removal of spawning habitats, entrainment by the State water projects, 21
drought, pollution, predation, disruption of the food web and direct competition for space 22
with and predation by non-indigenous aquatic species. The discussion below summarizes 23
the distribution of sensitive species in the estuary; Table D-2 in Appendix D provides more 24
detailed information for each species. Sensitive fish species are found mainly in the north 25
bays. All sensitive fish species of the San Francisco Estuary have the potential to be 26
impacted by a crude oil spill. Suisun Bay is home to two native species of “true” estuarine 27
fish, i.e. fish that spend all their lives in estuaries: delta smelt and Sacramento splittail 28
(Pogonichthys macrolepidotus). Both species are endemic to the Delta, and both travel 29
into fresh water to spawn. Delta smelt are found in greatest abundance in shallow, turbid 30
waters at the freshwater edge of the entrapment zone where they feed on plankton; 31
Sacramento splittail are found mainly along the benthos of small, shallow, turbid sloughs 32
lined with emergent vegetation, where they feed on macroinvertebrates and detritus. The 33
delta smelt population is listed as threatened at the federal level and endangered by the 34
State. As of 2010, populations of the splittail were considered stable by the United States 35
Fish and Wildlife Service (USFWS), which found its listing was not warranted, but the 36
species remains a CDFW species of special concern, and it is a targeted species of the 37
Delta Stewardship Council (USFWS 2010). 38
4.2 Biological Resources
Amorco Marine Oil Terminal Lease 4.2-18 February 2014 Consideration Project Final EIR
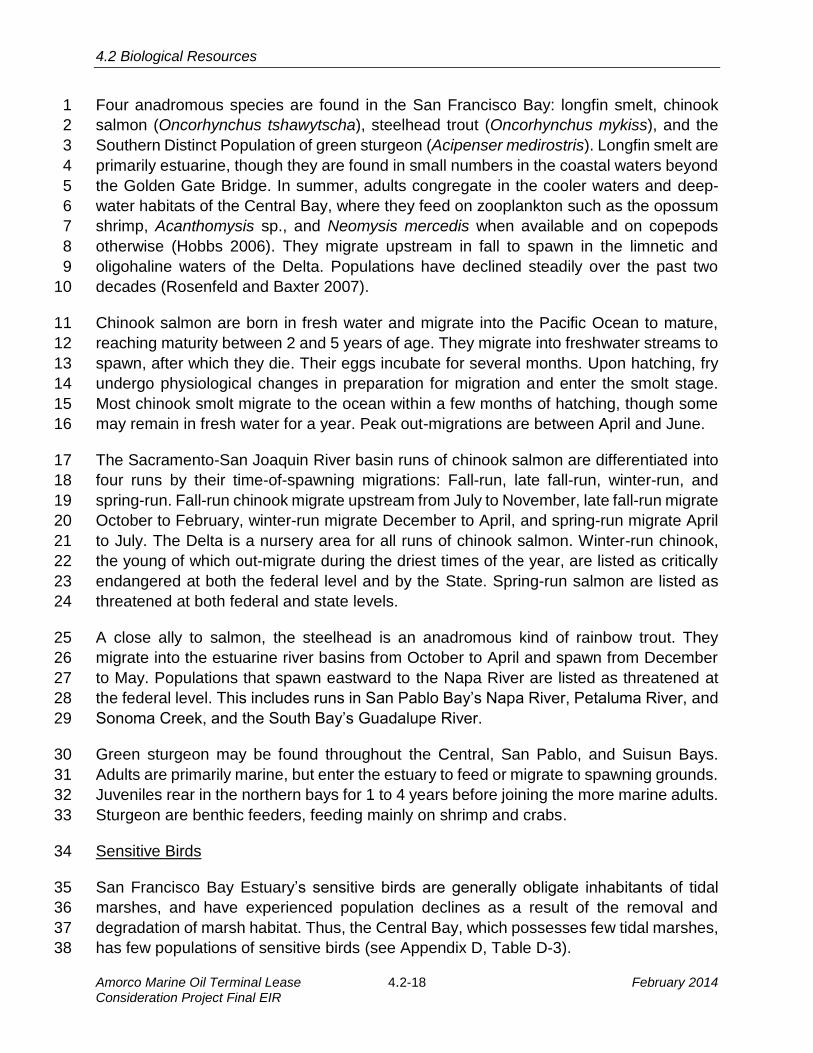
Four anadromous species are found in the San Francisco Bay: longfin smelt, chinook 1
salmon (Oncorhynchus tshawytscha), steelhead trout (Oncorhynchus mykiss), and the 2
Southern Distinct Population of green sturgeon (Acipenser medirostris). Longfin smelt are 3
primarily estuarine, though they are found in small numbers in the coastal waters beyond 4
the Golden Gate Bridge. In summer, adults congregate in the cooler waters and deep-5
water habitats of the Central Bay, where they feed on zooplankton such as the opossum 6
shrimp, Acanthomysis sp., and Neomysis mercedis when available and on copepods 7
otherwise (Hobbs 2006). They migrate upstream in fall to spawn in the limnetic and 8
oligohaline waters of the Delta. Populations have declined steadily over the past two 9
decades (Rosenfeld and Baxter 2007). 10
Chinook salmon are born in fresh water and migrate into the Pacific Ocean to mature, 11
reaching maturity between 2 and 5 years of age. They migrate into freshwater streams to 12
spawn, after which they die. Their eggs incubate for several months. Upon hatching, fry 13
undergo physiological changes in preparation for migration and enter the smolt stage. 14
Most chinook smolt migrate to the ocean within a few months of hatching, though some 15
may remain in fresh water for a year. Peak out-migrations are between April and June. 16
The Sacramento-San Joaquin River basin runs of chinook salmon are differentiated into 17
four runs by their time-of-spawning migrations: Fall-run, late fall-run, winter-run, and 18
spring-run. Fall-run chinook migrate upstream from July to November, late fall-run migrate 19
October to February, winter-run migrate December to April, and spring-run migrate April 20
to July. The Delta is a nursery area for all runs of chinook salmon. Winter-run chinook, 21
the young of which out-migrate during the driest times of the year, are listed as critically 22
endangered at both the federal level and by the State. Spring-run salmon are listed as 23
threatened at both federal and state levels. 24
A close ally to salmon, the steelhead is an anadromous kind of rainbow trout. They 25
migrate into the estuarine river basins from October to April and spawn from December 26
to May. Populations that spawn eastward to the Napa River are listed as threatened at 27
the federal level. This includes runs in San Pablo Bay’s Napa River, Petaluma River, and 28
Sonoma Creek, and the South Bay’s Guadalupe River. 29
Green sturgeon may be found throughout the Central, San Pablo, and Suisun Bays. 30
Adults are primarily marine, but enter the estuary to feed or migrate to spawning grounds. 31
Juveniles rear in the northern bays for 1 to 4 years before joining the more marine adults. 32
Sturgeon are benthic feeders, feeding mainly on shrimp and crabs. 33
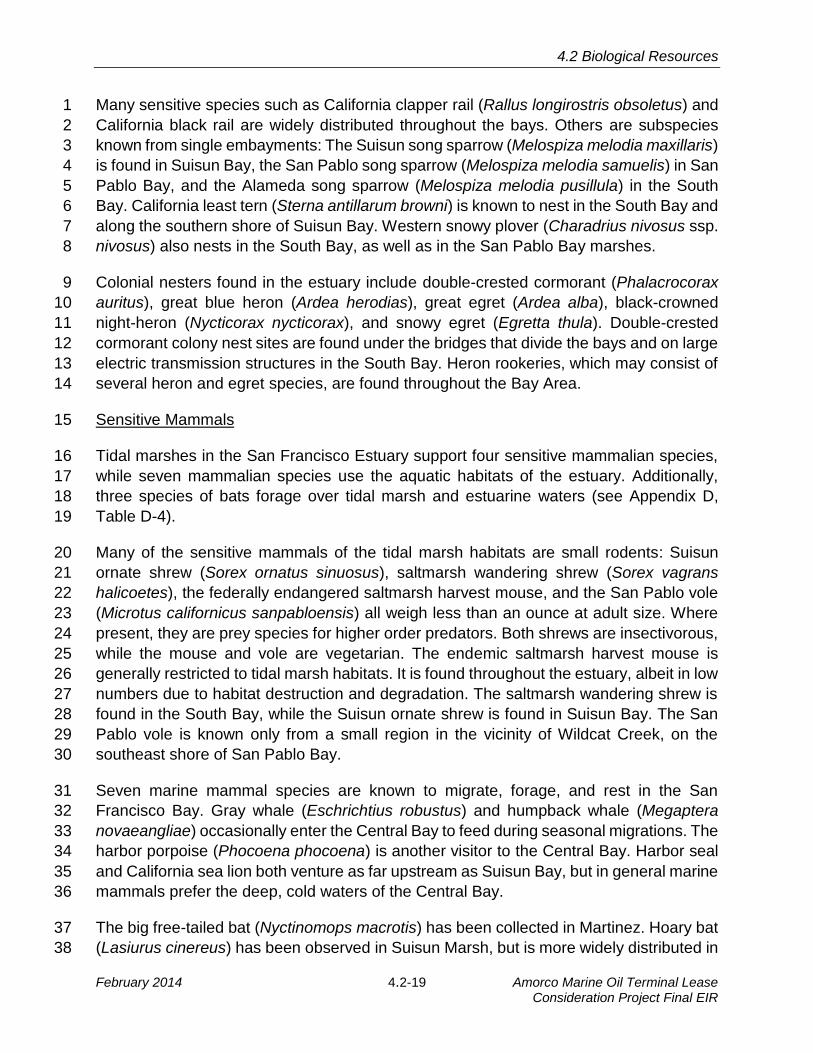
Sensitive Birds 34
San Francisco Bay Estuary’s sensitive birds are generally obligate inhabitants of tidal 35
marshes, and have experienced population declines as a result of the removal and 36
degradation of marsh habitat. Thus, the Central Bay, which possesses few tidal marshes, 37
has few populations of sensitive birds (see Appendix D, Table D-3). 38
4.2 Biological Resources
February 2014 4.2-19 Amorco Marine Oil Terminal Lease Consideration Project Final EIR
Many sensitive species such as California clapper rail (Rallus longirostris obsoletus) and 1
California black rail are widely distributed throughout the bays. Others are subspecies 2
known from single embayments: The Suisun song sparrow (Melospiza melodia maxillaris) 3
is found in Suisun Bay, the San Pablo song sparrow (Melospiza melodia samuelis) in San 4
Pablo Bay, and the Alameda song sparrow (Melospiza melodia pusillula) in the South 5
Bay. California least tern (Sterna antillarum browni) is known to nest in the South Bay and 6
along the southern shore of Suisun Bay. Western snowy plover (Charadrius nivosus ssp. 7
nivosus) also nests in the South Bay, as well as in the San Pablo Bay marshes. 8
Colonial nesters found in the estuary include double-crested cormorant (Phalacrocorax 9
auritus), great blue heron (Ardea herodias), great egret (Ardea alba), black-crowned 10
night-heron (Nycticorax nycticorax), and snowy egret (Egretta thula). Double-crested 11
cormorant colony nest sites are found under the bridges that divide the bays and on large 12
electric transmission structures in the South Bay. Heron rookeries, which may consist of 13
several heron and egret species, are found throughout the Bay Area. 14
Sensitive Mammals 15
Tidal marshes in the San Francisco Estuary support four sensitive mammalian species, 16
while seven mammalian species use the aquatic habitats of the estuary. Additionally, 17
three species of bats forage over tidal marsh and estuarine waters (see Appendix D, 18
Table D-4). 19
Many of the sensitive mammals of the tidal marsh habitats are small rodents: Suisun 20
ornate shrew (Sorex ornatus sinuosus), saltmarsh wandering shrew (Sorex vagrans 21
halicoetes), the federally endangered saltmarsh harvest mouse, and the San Pablo vole 22
(Microtus californicus sanpabloensis) all weigh less than an ounce at adult size. Where 23
present, they are prey species for higher order predators. Both shrews are insectivorous, 24
while the mouse and vole are vegetarian. The endemic saltmarsh harvest mouse is 25
generally restricted to tidal marsh habitats. It is found throughout the estuary, albeit in low 26
numbers due to habitat destruction and degradation. The saltmarsh wandering shrew is 27
found in the South Bay, while the Suisun ornate shrew is found in Suisun Bay. The San 28
Pablo vole is known only from a small region in the vicinity of Wildcat Creek, on the 29
southeast shore of San Pablo Bay. 30
Seven marine mammal species are known to migrate, forage, and rest in the San 31
Francisco Bay. Gray whale (Eschrichtius robustus) and humpback whale (Megaptera 32
novaeangliae) occasionally enter the Central Bay to feed during seasonal migrations. The 33
harbor porpoise (Phocoena phocoena) is another visitor to the Central Bay. Harbor seal 34
and California sea lion both venture as far upstream as Suisun Bay, but in general marine 35
mammals prefer the deep, cold waters of the Central Bay. 36
The big free-tailed bat (Nyctinomops macrotis) has been collected in Martinez. Hoary bat 37
(Lasiurus cinereus) has been observed in Suisun Marsh, but is more widely distributed in 38
4.2 Biological Resources
Amorco Marine Oil Terminal Lease 4.2-20 February 2014 Consideration Project Final EIR
the South Bay. The pallid bat (Antrozous pallidus) has been collected in the Central, 1
South, and San Pablo Bays. The distribution of these species and their use of estuarine 2
habitats has not been well described. 3
Sensitive Amphibians and Reptiles 4
The San Francisco Bay Estuary supports only a handful of sensitive amphibians and 5
reptiles (see Appendix D, Table D-5). Both California red-legged frog (Rana draytonii) and 6
western pond turtle (Actinemys marmorata) are distributed in low numbers throughout the 7
San Francisco Bay (CDFW 2013c). These species prefer freshwater ponds and streams, 8
but are tolerant of limited saltwater intrusion and are documented from brackish marshes 9
in San Pablo and Suisun Bays. California red-legged frogs appear to be eliminated from 10
the western lowland portions of Contra Costa and Alameda counties (west of Highway 80 11
and 880, particularly in urban areas). California tiger salamanders, which are found in 12
grasslands and vernal pools, are known only from the Don Edwards National Wildlife 13
Refuge in the South Bay (CDFW 2013c). 14
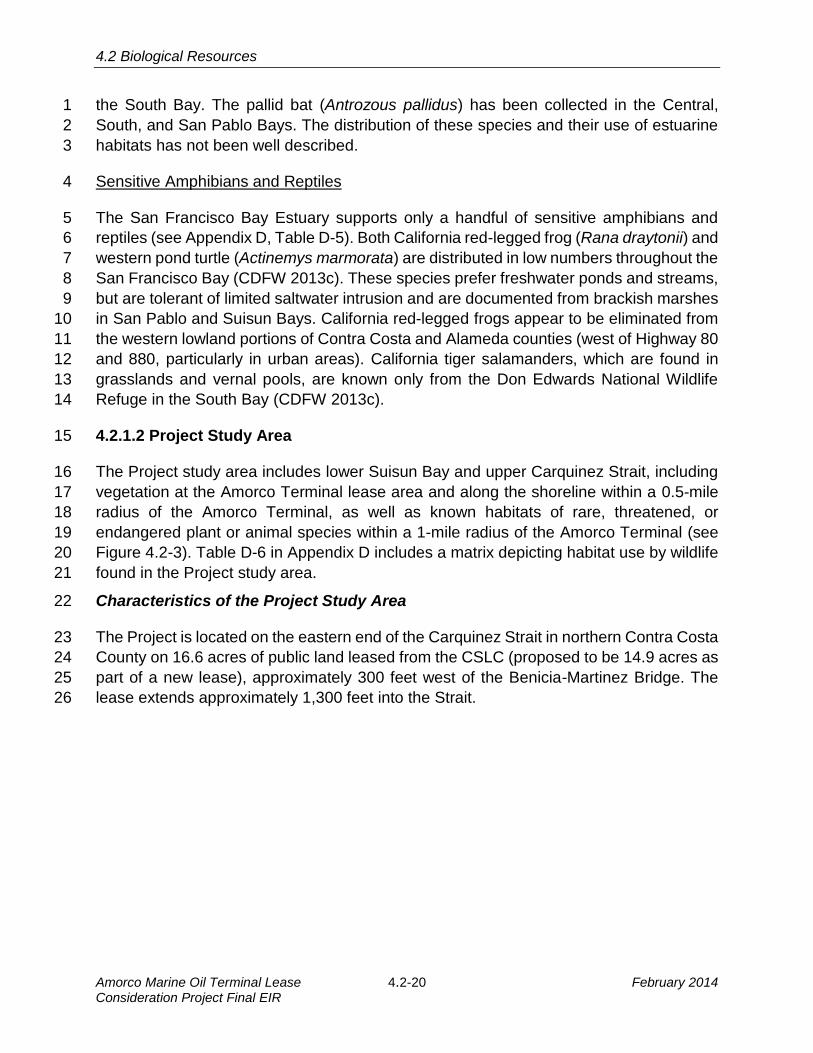
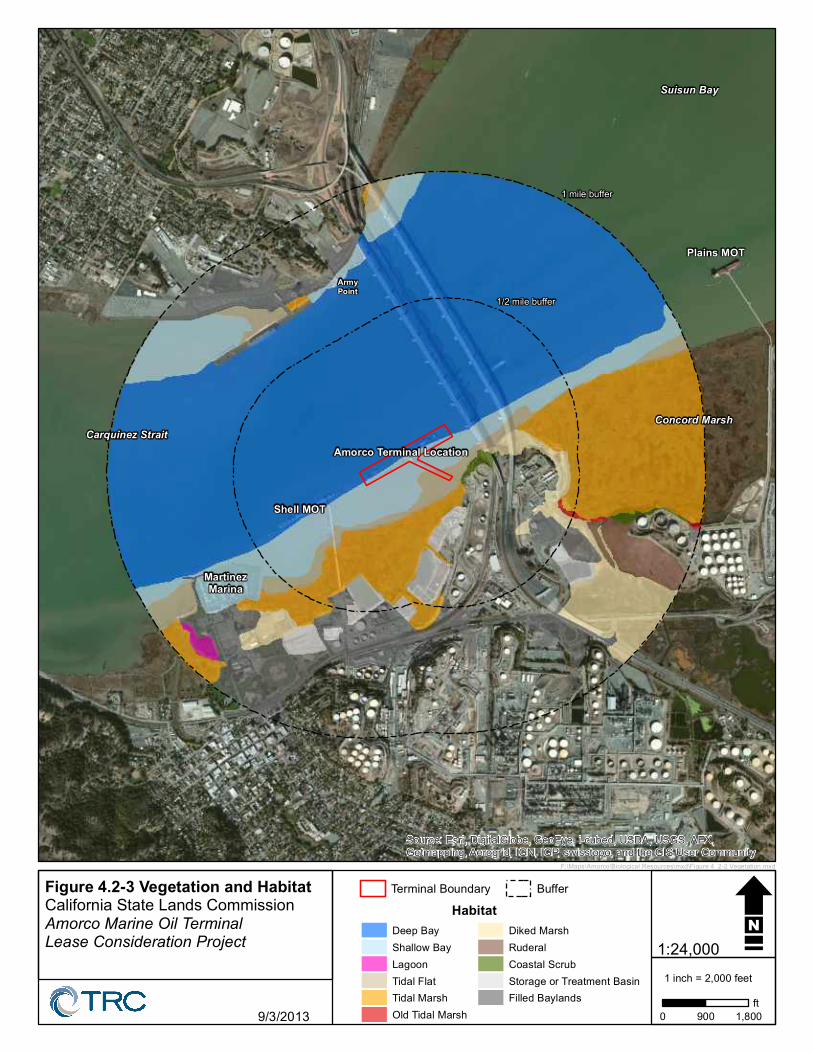
4.2.1.2 Project Study Area 15
The Project study area includes lower Suisun Bay and upper Carquinez Strait, including 16
vegetation at the Amorco Terminal lease area and along the shoreline within a 0.5-mile 17
radius of the Amorco Terminal, as well as known habitats of rare, threatened, or 18
endangered plant or animal species within a 1-mile radius of the Amorco Terminal (see 19
Figure 4.2-3). Table D-6 in Appendix D includes a matrix depicting habitat use by wildlife 20
found in the Project study area. 21
Characteristics of the Project Study Area 22
The Project is located on the eastern end of the Carquinez Strait in northern Contra Costa 23
County on 16.6 acres of public land leased from the CSLC (proposed to be 14.9 acres as 24
part of a new lease), approximately 300 feet west of the Benicia-Martinez Bridge. The 25
lease extends approximately 1,300 feet into the Strait. 26
Suisun Bay
Carquinez Strait
Shell MOT
Amorco Terminal Location
MartinezMarina
Plains MOT
Concord Marsh
ArmyPoint
1/2 mile buffer
1 mile buffer
Source: Esri, DigitalGlobe, GeoEye, i-cubed, USDA, USGS, AEX,Getmapping, Aerogrid, IGN, IGP, swisstopo, and the GIS User Community
Figure 4.2-3 Vegetation and HabitatCalifornia State Lands CommissionAmorco Marine Oil TerminalLease Consideration Project
9/3/2013 0 1,800900ft
1 inch = 2,000 feet
F:\Maps\Amorco\Biological Resources\mxd\Figure 4_2-2 Vegetation.mxd
1:24,000Deep BayShallow BayLagoonTidal FlatTidal MarshOld Tidal Marsh
Diked MarshRuderalCoastal ScrubStorage or Treatment BasinFilled Baylands
Terminal Boundary BufferHabitat
THIS PAGE IS INTENDED TO BE LEFT BLANK
4.2 Biological Resources
February 2014 4.2-23 Amorco Marine Oil Terminal Lease Consideration Project Final EIR
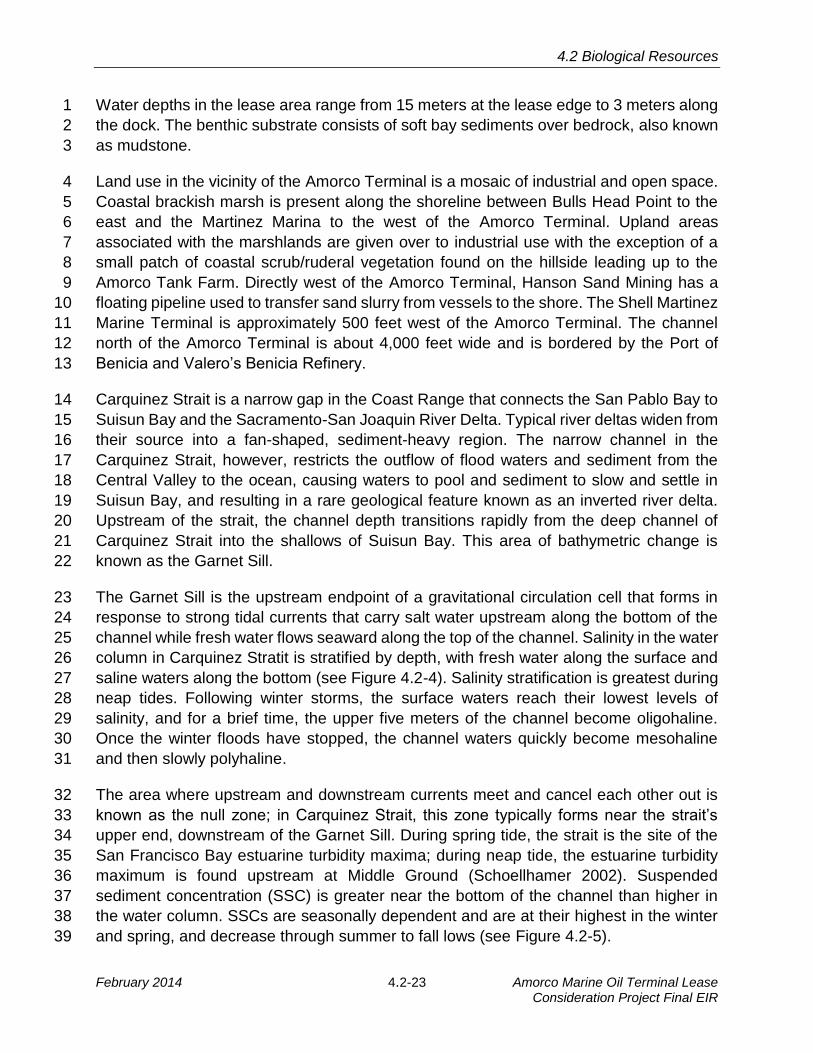
Water depths in the lease area range from 15 meters at the lease edge to 3 meters along 1
the dock. The benthic substrate consists of soft bay sediments over bedrock, also known 2
as mudstone. 3
Land use in the vicinity of the Amorco Terminal is a mosaic of industrial and open space. 4
Coastal brackish marsh is present along the shoreline between Bulls Head Point to the 5
east and the Martinez Marina to the west of the Amorco Terminal. Upland areas 6
associated with the marshlands are given over to industrial use with the exception of a 7
small patch of coastal scrub/ruderal vegetation found on the hillside leading up to the 8
Amorco Tank Farm. Directly west of the Amorco Terminal, Hanson Sand Mining has a 9
floating pipeline used to transfer sand slurry from vessels to the shore. The Shell Martinez 10
Marine Terminal is approximately 500 feet west of the Amorco Terminal. The channel 11
north of the Amorco Terminal is about 4,000 feet wide and is bordered by the Port of 12
Benicia and Valero’s Benicia Refinery. 13
Carquinez Strait is a narrow gap in the Coast Range that connects the San Pablo Bay to 14
Suisun Bay and the Sacramento-San Joaquin River Delta. Typical river deltas widen from 15
their source into a fan-shaped, sediment-heavy region. The narrow channel in the 16
Carquinez Strait, however, restricts the outflow of flood waters and sediment from the 17
Central Valley to the ocean, causing waters to pool and sediment to slow and settle in 18
Suisun Bay, and resulting in a rare geological feature known as an inverted river delta. 19
Upstream of the strait, the channel depth transitions rapidly from the deep channel of 20
Carquinez Strait into the shallows of Suisun Bay. This area of bathymetric change is 21
known as the Garnet Sill. 22
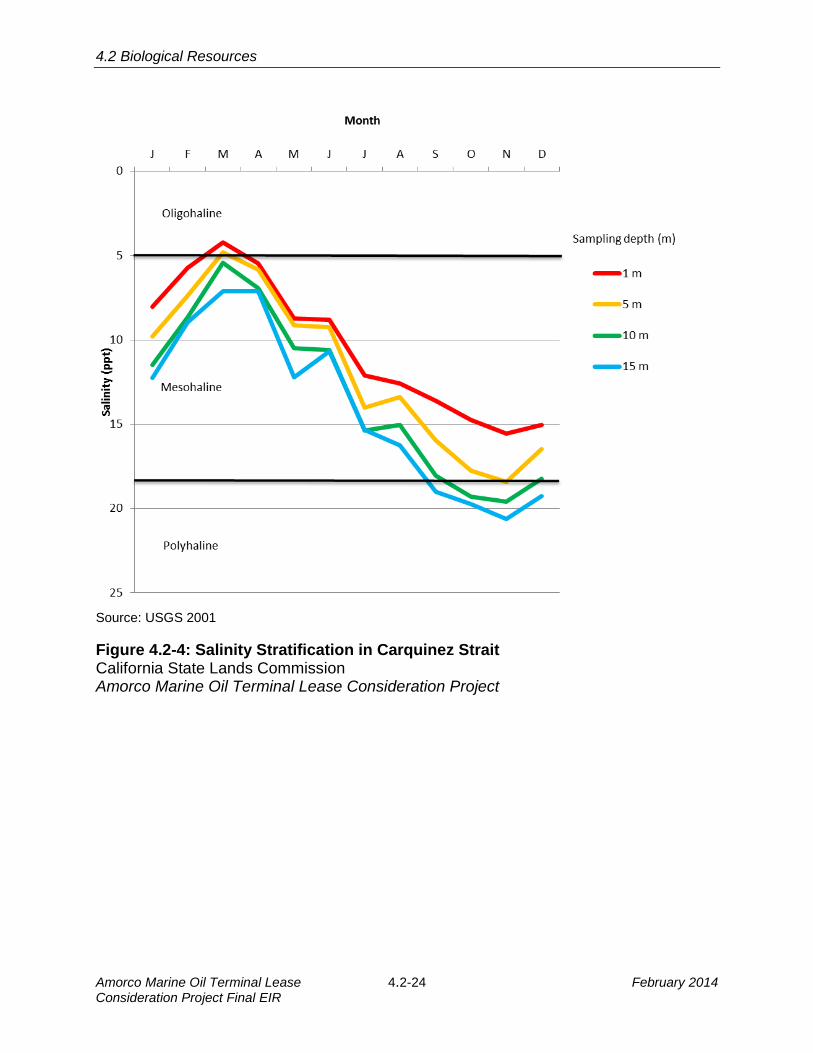
The Garnet Sill is the upstream endpoint of a gravitational circulation cell that forms in 23
response to strong tidal currents that carry salt water upstream along the bottom of the 24
channel while fresh water flows seaward along the top of the channel. Salinity in the water 25
column in Carquinez Stratit is stratified by depth, with fresh water along the surface and 26
saline waters along the bottom (see Figure 4.2-4). Salinity stratification is greatest during 27
neap tides. Following winter storms, the surface waters reach their lowest levels of 28
salinity, and for a brief time, the upper five meters of the channel become oligohaline. 29
Once the winter floods have stopped, the channel waters quickly become mesohaline 30
and then slowly polyhaline. 31
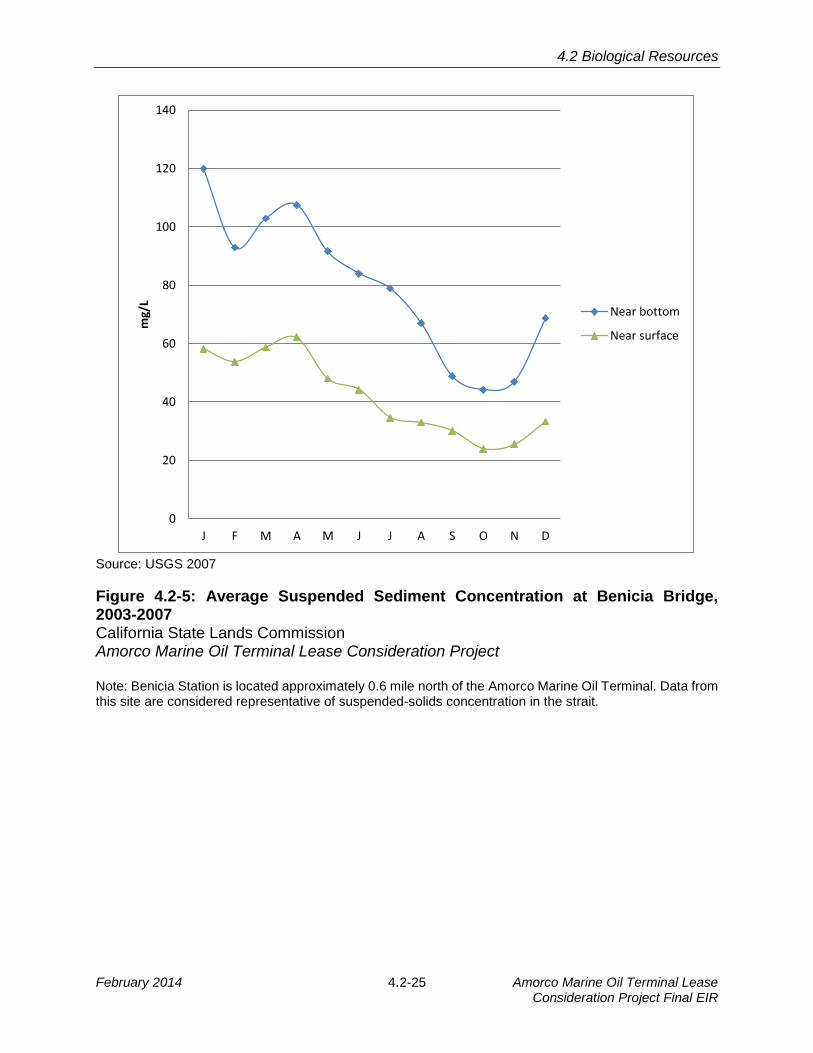
The area where upstream and downstream currents meet and cancel each other out is 32
known as the null zone; in Carquinez Strait, this zone typically forms near the strait’s 33
upper end, downstream of the Garnet Sill. During spring tide, the strait is the site of the 34
San Francisco Bay estuarine turbidity maxima; during neap tide, the estuarine turbidity 35
maximum is found upstream at Middle Ground (Schoellhamer 2002). Suspended 36
sediment concentration (SSC) is greater near the bottom of the channel than higher in 37
the water column. SSCs are seasonally dependent and are at their highest in the winter 38
and spring, and decrease through summer to fall lows (see Figure 4.2-5). 39
4.2 Biological Resources
Amorco Marine Oil Terminal Lease 4.2-24 February 2014 Consideration Project Final EIR
Source: USGS 2001
Figure 4.2-4: Salinity Stratification in Carquinez Strait California State Lands Commission Amorco Marine Oil Terminal Lease Consideration Project
4.2 Biological Resources
February 2014 4.2-25 Amorco Marine Oil Terminal Lease Consideration Project Final EIR
Source: USGS 2007
Figure 4.2-5: Average Suspended Sediment Concentration at Benicia Bridge, 2003-2007 California State Lands Commission Amorco Marine Oil Terminal Lease Consideration Project
Note: Benicia Station is located approximately 0.6 mile north of the Amorco Marine Oil Terminal. Data from this site are considered representative of suspended-solids concentration in the strait.
0
20
40
60
80
100
120
140
J F M A M J J A S O N D
mg/L
Near bottom
Near surface
4.2 Biological Resources
Amorco Marine Oil Terminal Lease 4.2-26 February 2014 Consideration Project Final EIR
Terminal Structures 1
The Amorco Terminal consists of a 1,130-foot-long wharf arm connected to the shore by 2
1,500 feet of approach trestle. The Amorco Terminal is constructed of wood, concrete, 3
and metal. The wharf has four small buildings on-site, including two buildings for 4
personnel, a pump house, and a tool shed. Lights are placed regularly along the wharf 5
arm and approach trestle, and there is one large light bank under the main loading arm. 6
The Amorco Terminal provides shade and refuge areas for fish, and resting spots and 7
foraging opportunities for fish, birds, and marine mammals. The Amorco Terminal also 8
provides nesting habitat for some bird species, including a pair of osprey (Pandion 9
haliaetus) that have successfully fledged offspring from a nest atop the main loading arm 10
since 2009 (Jim Herron pers. comm.). Support pilings provide attachment areas for 11
sessile invertebrates and a place for fish to spawn. 12
Subtidal 13
The water column consists of the area between the benthos and the water surface. The 14
water column contains both channels, which are areas with strong currents and a deep 15
rounded bottom, and shoals, or shallow weak-current areas. Channels provide a 16
connection between marine and freshwater ecosystems, while shoals function as 17
collection areas for sediment and detritus. In San Francisco Bay Estuary, areas of the 18
water column less than 18 feet deep are considered shallow bay; areas deeper than 18 19
feet are considered deep bay. Approximately 238 acres of shallow bay and 1,097 acres 20
of deep bay are found within 1 mile of the Amorco Terminal. The lease area includes 5.00 21
acres of shallow bay and 8.93 acres of deep bay. These habitats provide foraging areas 22
for invertebrates, fish, diving birds, and marine mammals, and nursery and spawning 23
habitat for invertebrates and fish. 24
Compared to other parts of the San Francisco Bay, the Carquinez Strait is not particularly 25
rich in phytoplankton (USGS 2013a). Phytoplankton productivity is generally calculated 26
from measurements of chlorophyll α. Chlorophyll α concentrations below about 10 27
micrograms per liter are known to cause food-limited declines in zooplankton 28
reproduction. Measurements of water quality in the Carquinez Strait from 2003 to 2013 29
show that chlorophyll α levels in the strait rarely exceed this threshold in either spring or 30
fall (USGS 2013). 31
The benthic substrate at the Project site consists of soft bay sediments over bedrock, also 32
known as mudstone. Because of the lack of hard surfaces for rooting, few plants are 33
associated with soft-bottom habitats. However, though mobile, the fine-grained sediment 34
is both stable and compact enough to support a diverse benthic assemblage. The biotic 35
assemblage associated with this habitat is known as the benthos. The benthos consists 36
of bacteria and animals that live in (infauna), on (epifauna), or near (demersal) the bottom 37
of the water channel. 38
4.2 Biological Resources
February 2014 4.2-27 Amorco Marine Oil Terminal Lease Consideration Project Final EIR
Salinity levels along the substrate are generally polyhaline in summer and fall and 1
mesohaline in the winter and spring, leading to fluxation on the benthic habitat and 2
community composition. 3
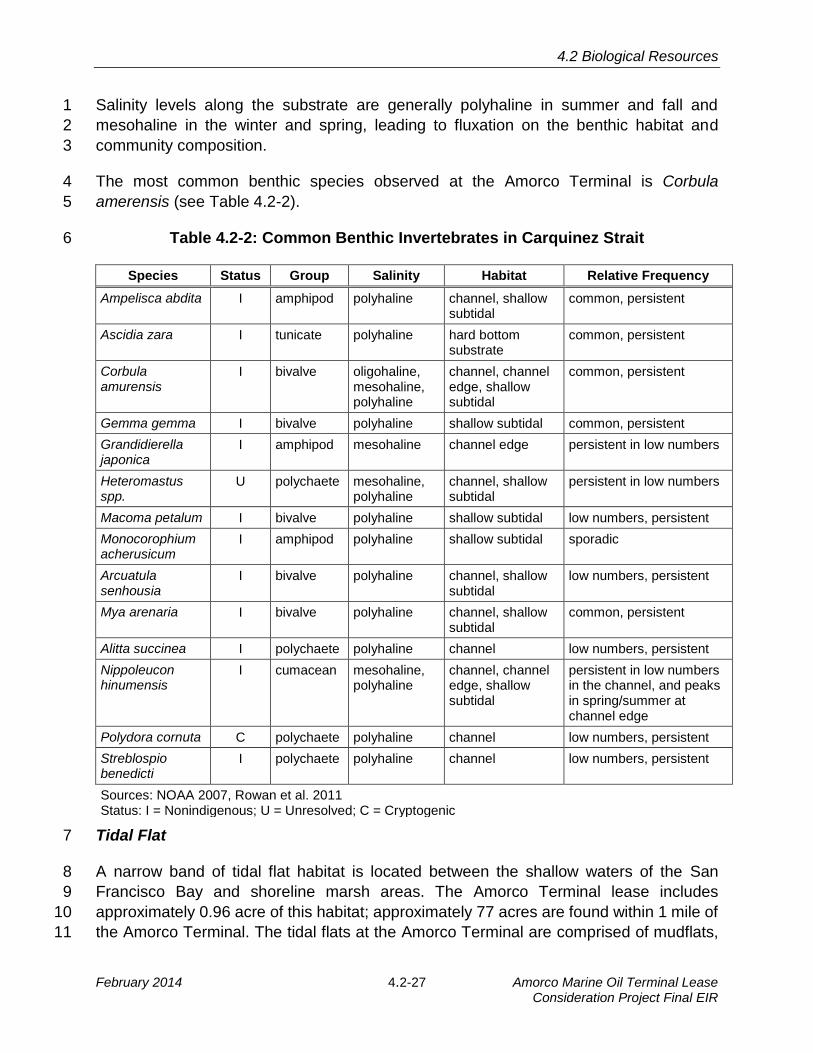
The most common benthic species observed at the Amorco Terminal is Corbula 4
amerensis (see Table 4.2-2). 5
Table 4.2-2: Common Benthic Invertebrates in Carquinez Strait 6
Species Status Group Salinity Habitat Relative Frequency
Ampelisca abdita I amphipod polyhaline channel, shallow subtidal
common, persistent
Ascidia zara I tunicate polyhaline hard bottom substrate
common, persistent
Corbula amurensis
I bivalve oligohaline, mesohaline, polyhaline
channel, channel edge, shallow subtidal
common, persistent
Gemma gemma I bivalve polyhaline shallow subtidal common, persistent
Grandidierella japonica
I amphipod mesohaline channel edge persistent in low numbers
Heteromastus spp.
U polychaete mesohaline, polyhaline
channel, shallow subtidal
persistent in low numbers
Macoma petalum I bivalve polyhaline shallow subtidal low numbers, persistent
Monocorophium acherusicum
I amphipod polyhaline shallow subtidal sporadic
Arcuatula senhousia
I bivalve polyhaline channel, shallow subtidal
low numbers, persistent
Mya arenaria I bivalve polyhaline channel, shallow subtidal
common, persistent
Alitta succinea I polychaete polyhaline channel low numbers, persistent
Nippoleucon hinumensis
I cumacean mesohaline, polyhaline
channel, channel edge, shallow subtidal
persistent in low numbers in the channel, and peaks in spring/summer at channel edge
Polydora cornuta C polychaete polyhaline channel low numbers, persistent
Streblospio benedicti
I polychaete polyhaline channel low numbers, persistent
Sources: NOAA 2007, Rowan et al. 2011 Status: I = Nonindigenous; U = Unresolved; C = Cryptogenic
Tidal Flat 7
A narrow band of tidal flat habitat is located between the shallow waters of the San 8
Francisco Bay and shoreline marsh areas. The Amorco Terminal lease includes 9
approximately 0.96 acre of this habitat; approximately 77 acres are found within 1 mile of 10
the Amorco Terminal. The tidal flats at the Amorco Terminal are comprised of mudflats, 11
4.2 Biological Resources
Amorco Marine Oil Terminal Lease 4.2-28 February 2014 Consideration Project Final EIR
which are formed of fine-grained silts and clays, and typically support a diverse 1
community of diatoms, worms, shellfish, and algal flora. These creatures are prey for a 2
wide variety of birds and fish. Wading birds known to use the tidal flats for forage during 3
low tide include western sandpiper, least sandpiper, willet, and dunlin (Calidris alpina ) 4
(eBird 2012). Harbor seals are also known to frequent tidal flats. Other species such as 5
white pelican (Pelecanus erythrorhynchos) rest on the tidal flats between fishing 6
expeditions. During high tide, the flats provide foraging areas for fish, including longfin 7
smelt. 8
Tidal Marsh 9
Approximately 432 acres of tidal marsh are found within 1 mile of the Amorco Terminal, 10
mainly along the southern shore of the Carquinez Strait where they are surrounded by 11
heavy industry. The marshes are composed primarily of low/middle tidal brackish marsh, 12
muted tidal brackish marsh, and diked brackish marsh. Small, discrete areas of high tidal 13
marsh occur along the north shore of Carquinez Strait and at the southern edge of the 14
Concord Marshes. 15
Tidal brackish marsh is found along the southern edge of the Carquinez Strait east of the 16
Benicia-Martinez Bridge and west of the Martinez Marina. East of the bridge, the 17
predominantly low/middle marsh plain extends up to 3,000 feet from the edge of the tidal 18
flat; west of Martinez Marina, the marsh plain is approximately 1,000 feet wide and abuts 19
an area of muted tidal brackish marsh. A narrow band of high marsh is found at its 20
southern edge. Muted tidal brackish marsh is found west of the Carquinez Bridge, where 21
the marsh plain varies in width between 300 and 1,500 feet. Both marsh plains are fairly 22
level. Their tidal channels are a combination of straight channels superimposed on the 23
marsh for drainage or mosquito control and linear dendritic in areas closest to shore. The 24
dominant species present are common reed (Phragmites australis), cattails, California 25
tule (Schoenoplectus californicus), broad-leaf pepperweed (Lepidium latifolium), 26
pickleweed (Salicornia pacifica), Baltic rush (Juncus balticus) and gumplant. 27
The muted tidal marsh adjacent to the Amorco Terminal provides habitat for a variety of 28
rare, threatened, and endangered species. California clapper rail was detected during a 29
2008 survey of the marsh but appeared to be foraging rather than breeding; California 30
black rail forage and breed in the marsh (WRA 2011). Based on habitat quality and survey 31
results from adjacent marshes, saltmarsh harvest mouse are presumed to inhabit this 32
marsh. Several rare plants have potential to be found in the marshes, including soft bird’s-33
beak, delta tule pea, Mason’s lilaeopsis (Lilaeopsis masonii), and Suisun thistle. 34
Diked brackish marsh is found adjacent to both the tidal brackish marsh and the muted 35
tidal marsh. Diked marshes may provide important habitat for a variety of wildlife, 36
especially waterfowl, shorebirds, and small mammals. They may provide high-tide refugia 37
for small mammals and roosting habitat for shorebirds. 38
4.2 Biological Resources
February 2014 4.2-29 Amorco Marine Oil Terminal Lease Consideration Project Final EIR
Lagoon 1
A 6-acre lagoon is located at the Martinez Marina approximately 0.75 mile from the 2
Amorco Terminal. Lagoons support the same species of aquatic invertebrates and fish 3
found in shallow bays and tidal channels, and provide feeding and resting areas for water 4
birds. They may also provide protected areas that facilitate early colonization by 5
nonindigenous aquatic species (Monroe et al. 1999). 6
Special-status Habitats 7
Critical Habitat 8
The Project is located within critical habitat for delta smelt (59 Federal Register 242), the 9
southern Distinct Population Segment (DPS) of green sturgeon (74 Federal Register 10
195), winter-run chinook salmon, Central Valley steelhead, and Central California coastal 11
steelhead (70 Federal Register 170). 12
Primary constituent elements (PCEs) for the delta smelt that are located within the vicinity 13
of the Project include the physical habitat, water, river flow, and salinity concentrations 14
required to maintain delta smelt habitat for (1) larval and juvenile transport, (2) rearing 15
habitat, and (3) adult migration. Because of the fluid nature of the Delta’s hydrology, the 16
quality of the PCEs for the delta smelt fluctuate within the designated area. The final ruling 17
on the critical habitat identifies marina construction as activities that, depending on the 18
season of construction and scale of the Project, might result in destruction or adverse 19
modification of critical habitat that could jeopardize the continuing existence of the delta 20
smelt and that would require consultation with the USFWS. 21
PCEs for the southern DPS of the green sturgeon in the estuary include food resources 22
for all life stages, water flows, water quality, migratory corridors, channel depths, and 23
sediment quality. Dredging, in-water construction, National Pollutant Discharge 24
Elimination System activities, commercial shipping, and habitat restoration are identified 25
in the final critical habitat rule as activities that may affect one or more PCEs through 26
alteration of the physical parameters of the estuary. 27
The Amorco Terminal is located in critical habitat for steelhead. Critical habitat for 28
steelhead includes the Sacramento River from Keswick Dam in Shasta County to Chipps 29
Island, and all waters downstream of Chipps Island and north of the San Francisco-30
Oakland Bay Bridge. 31
California Department of Fish and Wildlife Natural Communities 32
The California Natural Diversity Database shows two natural communities within and 33
adjacent to the lease area: Coastal Brackish Marsh and Northern Coastal Salt Marsh 34
(CDFW 2013c). Coastal Brackish Marsh is found along the shoreline at the Amorco 35
Terminal. The Coastal Brackish Marsh is dominated by perennial, emergent, herbaceous 36
4.2 Biological Resources
Amorco Marine Oil Terminal Lease 4.2-30 February 2014 Consideration Project Final EIR
monocots that create a dense cover up to 2 meters tall. The Amorco Terminal is located 1
approximately 0.3 mile east of Northern Coastal Salt Marsh. Due to the saline and semi-2
aquatic environment, plant species diversity in these types of marshes is typically low. 3
Plant species are stratified by salinity levels. Both marsh types support a diverse biotic 4
assemblage and provide nursery grounds for numerous organisms, including fish, 5
mammals, and birds (CERES 1996). 6
4.2.2 REGULATORY SETTING 7
Federal and State laws that may be relevant to the Project are identified in Table 4-1. 8
Regional and local laws, regulations, and policies are discussed below. 9
National Estuary Program, Comprehensive Conservation and Management Plan 10
The San Francisco Estuary Project is a federal-state-local partnership established in 1987 11
under the CWA Section 320: National Estuary Program. The 1993 plan was mandated 12
under a reauthorization of the CWA in 1987, and revised in 2007. This plan is 13
administered by the San Francisco Estuary Project Implementation Committee. 14
Contra Costa County 15
The Amorco Terminal abuts marshes along the shoreline between the Martinez waterfront 16
and the Concord Naval Weapons Station, an area that has been identified in the Contra 17
Costa County General Plan (2005) as a Significant Ecological Resource Area. The 18
general plan contains goals and policies to recognize and protect sensitive and significant 19
ecological resources. 20
4.2.3 IMPACT ANALYSIS 21
4.2.3.1 Significance Criteria 22
For the purposes of this analysis, an impact was considered to be significant and to 23
require mitigation if it would result in any of the following: 24
Substantially affect threatened or endangered species, or protected species 25
(including candidate, sensitive, or special-status species) 26
Alter or diminish critical habitat or a special biological habitat, including saltwater, 27
freshwater, or brackish marsh; major marine mammal haul out or breeding area; 28
eelgrass; major seabird rookery; or any Area of Special Biological Significance 29
Violate any environmental law or regulation designed to protect wildlife, plants, or 30
habitat areas 31
Isolate wildlife populations and/or disrupt wildlife migratory or movement corridors, 32
or use native wildlife nursery sites 33
4.2 Biological Resources
February 2014 4.2-31 Amorco Marine Oil Terminal Lease Consideration Project Final EIR
Conflict with any local policies or ordinances protecting biological resources or 1
provisions of an adopted Habitat Conservation Plan, Natural Community 2
Conservation Plan, or other approved local, regional, or State habitat conservation 3
plan 4
Re-suspend bottom material, causing turbidity during vessel maneuvering such 5
that suspended sediment concentrations are substantially increased above 6
background levels 7
Create underwater sound pressure levels (SPLs) during operation that exceed 8
National Oceanic and Atmospheric Administration Fisheries Service (NMFS) 9
guidelines for protection of marine mammals 10
Cause the introduction or substantial spread of nonindigenous species, either 11
aquatic or terrestrial. 12
Cause the loss of wetlands or other waters of the United States under the Clean 13
Water Act, 40 Code of Federal Regulations (CFR) 230, Section 404 14
Cause a substantial loss of population or habitat of any native fish, wildlife, or 15
vegetation, or an overall loss of biological diversity (Note: Substantial is defined as 16
any change that could be detected over natural variability) 17
4.2.3.2 Assessment Methodology 18
For the purposes of this Environmental Impact Report, potential impacts to biological 19
resources are evaluated based on available literature, previous biological assessments 20
for the Terminal wharf and adjacent wetlands, and publicly available documents that 21
provided information on species status, distribution, habitat, and sensitivity to impacts. A 22
biological site reconnaissance was conducted on June 11, 2013 by TRC Biologist Molly 23
Sandomire. Impacts that are considered substantial are those that would substantially 24
diminish or cause the loss of an important biological resource, or that would conflict with 25
local, State, or federal resource conservation plans, goals, or regulations. 26
4.2.3.3 Impacts Analysis and Mitigation Measures 27
The following subsections describe the Project’s potential impacts on biological 28
resources. Where impacts are determined to be significant, feasible mitigation measures 29
(MMs) are described that would reduce or avoid the impact. 30
4.2 Biological Resources
Amorco Marine Oil Terminal Lease 4.2-32 February 2014 Consideration Project Final EIR
Proposed Project 1
Impact Biological Resources (BIO)-1: Increase deposition or erosion of sensitive 2
habitats along the vessel path, including marshlands within and adjacent to the 3
lease area, resulting from the resuspension of sediments by calling vessels. (Less 4
than significant.) 5
Sediment plumes associated with ship traffic vary considerably depending on vessel type 6
and movement (Clarke et al. 2007). The largest, most prominent plumes are caused by 7
deep-draft vessels turning into the entrance of secondary berth access. Clarke et al. 8
observed that these vessel maneuvers increased total suspended solids (TSS) 9
concentrations above 90 milligrams per liter (mg/l), an effect that persisted at least 50 10
minutes in open water and tidal-washed channels, and indefinitely in secondary channels 11
that lacked current flow to disperse the plumes. A less pronounced but still prominent 12
effect was observed along the bottom of navigation channels, where TSS concentrations 13
increased 40 mg/l from residual plumes along the lower 2 meters of the water column for 14
over 1 hour following the passage of a deep-draft vessel. However, they found little 15
evidence that tug boats and draft barges caused sediment plumes along the channel 16
bottom. In a separate study, Connor et al. (2005) observed that a sediment plume caused 17
by the vessel propeller, movement of tug boats, and water displacement during vessel 18
berthing at Richmond Long Wharf was approximately 350 meters across tidal flow and 19
persisted over 75 minutes. 20
Vessel calls at the Amorco Terminal are typically fewer than two calls a week, with no 21
more than 90 anticipated per year. Sediment plumes would be generated by calling 22
vessels as they transit along the navigation channels and maneuver into and out of the 23
wharf. Once vessels are moored to the dock, all underwater propulsion is shut off. 24
Sediment lifting from the navigation channel substrate would contribute to the paucity of 25
infaunal abundance typically found in these channels. While sediment levels could 26
potentially be increased at the wharf for approximately 6 hours a week throughout the 27
year, the tidal currents at the wharf are considerable and sediment plumes are expected 28
to be quickly dispersed. In addition, the Amorco Terminal is located in the range of the 29
estuary’s maximum turbidity zone; thus the local biotic community is acclimated to 30
increased turbidity levels and unlikely to be affected by the temporary, intermittent 31
increases caused by vessel maneuvering. 32
Mitigation Measure: No mitigation required. 33
4.2 Biological Resources
February 2014 4.2-33 Amorco Marine Oil Terminal Lease Consideration Project Final EIR
Impact BIO-2: Cause substantial impact to special-status wildlife species, including 1
impact to behavior and the composition of biotic communities, in the vicinity of the 2
Amorco Terminal as a result of the use of bright lights during nighttime Amorco 3
Terminal operations. (Less than significant.) 4
Vessels may visit the Terminal any time of day or night. Lights at the Amorco Terminal 5
are regularly spaced along the wharf arms and dock. Additional lights are located onboard 6
visiting vessels. These lights are reflected in the water beneath the wharf and adjacent to 7
the ship, and cast a long light shadow on the surface of the water. Use of bright lights 8
during nighttime operations can affect the behavior of animals and the composition of the 9
biotic community in the vicinity of the Amorco Terminal. Artificial light may attract pelagic 10
fishes, including juvenile salmonids, larval crabs, and their predators (Hagan et al. 2008, 11
Porter et al. 2008), but repel phytoplankton and shrimp (Moore et al. 2000, Moore et al. 12
2006). Artificial lights may also put nocturnal migrating birds at risk of collision. Birds are 13
attracted to lights, and young birds are more vulnerable to collision with structures than 14
more experienced migrators. Many species of birds are nocturnal migrants, including 15
shorebirds, waterbirds, and passerines. 16
The Carquinez Strait is subject to industrial use and is well lit at night. Neighboring light 17
sources include the Shell Martinez Marine Terminal, Benicia Harbor, and Benicia-18
Martinez Bridge. Because the Amorco Terminal is located within an area that has been 19
historically lit at night, it is likely that the aquatic community and migrating birds have 20
acclimated to the presence of light in this area. No change in Amorco Terminal lighting is 21
proposed as part of this Project; therefore, there would not be any new or increased 22
impacts from night lighting at the Amorco Terminal. 23
Mitigation Measure: No mitigation required. 24
Impact BIO-3: Cause substantial direct and/or indirect impacts on aquatic biota 25
through the changing of physical and chemical environmental factors as a result 26
of maintenance dredging. (Less than significant.) 27
The Amorco Terminal is periodically dredged to maintain a depth of 48 feet below MLLW. 28
Dredging most recently occurred in 2005 and removed 500 cubic yards of material. 29
Turbidity and SSC can be much greater than ambient conditions in the immediate vicinity 30
of dredging activities. Increased turbidity increases light attenuation, which can reduce 31
phytoplankton productivity, reduce the feeding of some fish species, and change feeding 32
and migration patterns, while increased SSCs can bury the benthic community, reduce 33
the water-filtration rates of filter feeders adjacent to the dredge area, or increase fish gill 34
injury (NMFS 2004). Estimates of the amount of material that is resuspended during 35
dredging ranges from 0 to 5 percent (Suedel et al. 2008). Dredging at the Amorco 36
Terminal would potentially resuspend 25 cubic yards of sediment over the course of 37
4.2 Biological Resources
Amorco Marine Oil Terminal Lease 4.2-34 February 2014 Consideration Project Final EIR
dredging activity. The majority of sediment resuspended during dredging activities 1
resettles within 50 meters of the dredge site within 1 hour (Anchor Environmental 2003), 2
though plume effects can be observed as far downstream as 400 meters (Clarke et al. 3
2007). Densities of suspended sediment over ambient levels decrease with distance from 4
the dredge site and are more pronounced at the bottom of the water column than near 5
the surface (Clarke et al. 2007). However, sediment plumes are unlikely to have lasting 6
effects given the high background turbidity; in one study in San Pablo Bay, dredging 7
plumes were found to have only a localized effect (Schoellhamer 2002). Resuspended 8
sediments near the surface of the water column are expected to dissipate downstream, 9
where they would not increase sediment significantly above ambient levels. Therefore, 10
impacts from increased turbidity and increased SSC concentrations on pelagic species 11
would be less than significant. 12
Dredging would remove the existing infauna community and alter the substrate 13
composition and topography at the Amorco Terminal. Following the completion of 14
dredging, the benthic community is expected to undergo typical ecological succession 15
patterns. As previously described, the benthic community at any estuarine location is 16
dependent on salinity levels. Following salinity change events, it takes several months for 17
the initial group of benthic organisms to settle and grow. However, dredging at the site is 18
intermittent and minor. Therefore, this impact would be less than significant. 19
Indirect effects that are anticipated by dredging are the potential spread of nonindigenous 20
species as a result of disturbing the benthic habitat. Dredging would create newly 21
disturbed benthic habitat, making it attractive for settlement by opportunistic 22
nonindigenous species. However, maintenance dredging disturbs areas that are 23
continually disturbed due to maintenance dredging and vessel traffic. Maintenance 24
dredging at the Amorco Terminal is intermittent and minor. As such, it is expected that 25
further introduction of nonindigenous aquatic species to the San Francisco Bay Estuary 26
resulting from maintenance dredging at the Amorco Terminal may impact but is not likely 27
to significantly impact aquatic biota. 28
Scheduled maintenance dredging is known sufficiently in advance and Tesoro Refining 29
and Marketing Company, LLC (Tesoro) continues to comply with applicable permits to 30
ensure appropriate assessments are conducted prior to conducting maintenance-related 31
dredging. Dredged spoils are tested and managed according to permits issued by 32
jurisdictional agencies, including the CSLC, U.S. Army Corps of Engineers (USACE), San 33
Francisco Bay Conservation and Development Commission, and San Francisco Bay 34
Regional Water Quality Control Board. Because disturbance from dredging operations is 35
intermittent and impacts are temporary, impacts from routine maintenance dredging are 36
anticipated to be less than significant. 37
Mitigation Measure: No mitigation required. 38
4.2 Biological Resources
February 2014 4.2-35 Amorco Marine Oil Terminal Lease Consideration Project Final EIR
Impact BIO-4: Cause injury or behavioral interruptions to aquatic species as a 1
result of noise from vessels. (Less than significant.) 2
Ships are the dominant source of low-frequency noise in many highly trafficked coastal 3
zones (OSPAR 2009). Although the effect of increased noise on the underwater 4
environment is still under investigation, there is emerging concern that vessel noise may 5
cause substantial, adverse impacts to the underwater environment and sensitive aquatic 6
species. Much of the noise associated with a vessel is caused by propeller wash. As the 7
propellers spin underwater, small air bubbles form in nicks and gauges along the propeller 8
edge. The bursting of these bubbles is called cavitation. Other sources of noise include 9
mechanical motors and other onboard machinery. Crude oil tankers, which are among 10
the largest marine vessels, move slowly, tend to emit continuous, omnidirectional sounds 11
of around 40 hertz while in motion, and produce source levels at 1 meter between 179 to 12
182 decibel root mean square (dBRMS) at 1 micro Pascal (µPa; McKenna 2012). Noise 13
produced by vessels transiting the San Francisco Bay tends to be mitigated by the soft-14
bottom substrate and sediment-rich waters, which help to attenuate sound. Vessel calls 15
are typically fewer than two calls a week. Once inside the San Francisco Bay, it takes 16
each vessel approximately 3 hours to travel to the Amorco Terminal. Once moored, the 17
sound produced by the vessel drops significantly. 18
Direct impacts from increased sound exposure include masking, behavioral disturbance, 19
and physical damage. 20
Masking noise can be considered biologically significant if it coincides with the frequency 21
range of the communication or echolocation signals of aquatic organisms (OSPAR 2009). 22
Certain aquatic species that rely on sound to communicate such as whales, shrimp, crab, 23
and certain species of fish may no longer be able to hear each other when ambient noise 24
increases with a vessel’s passing. Over the long term, species may adapt the frequency 25
they use to communicate. Figure 4.2-6 shows the typical frequency bands of sounds 26
produced by marine organisms compared with the low-frequency sound associated with 27
crude oil tankers. 28
Vessels visiting the Amorco Terminal have the potential to cause masking of 29
communications for whales and fish, shrimp, pinnipeds, or birds. However, the typical 30
frequency bands of sound produced by crude oil tankers are lower than the typical 31
frequency bands of sounds produced by shrimp, pinnipeds, and birds and are, therefore, 32
not likely to interfere with their communications. Whales and some species of fish do 33
communicate in the frequency bands at which crude oil tankers emit sound, and thus the 34
noise from vessels visiting the Amorco Terminal may mask communication. However, 35
due to the low number of weekly vessel calls and the limited transit time in the San 36
Francisco Bay (approximately 12 hours per week), impacts to whales and fish from 37
masking caused by shipping noise are not expected to be significant. 38
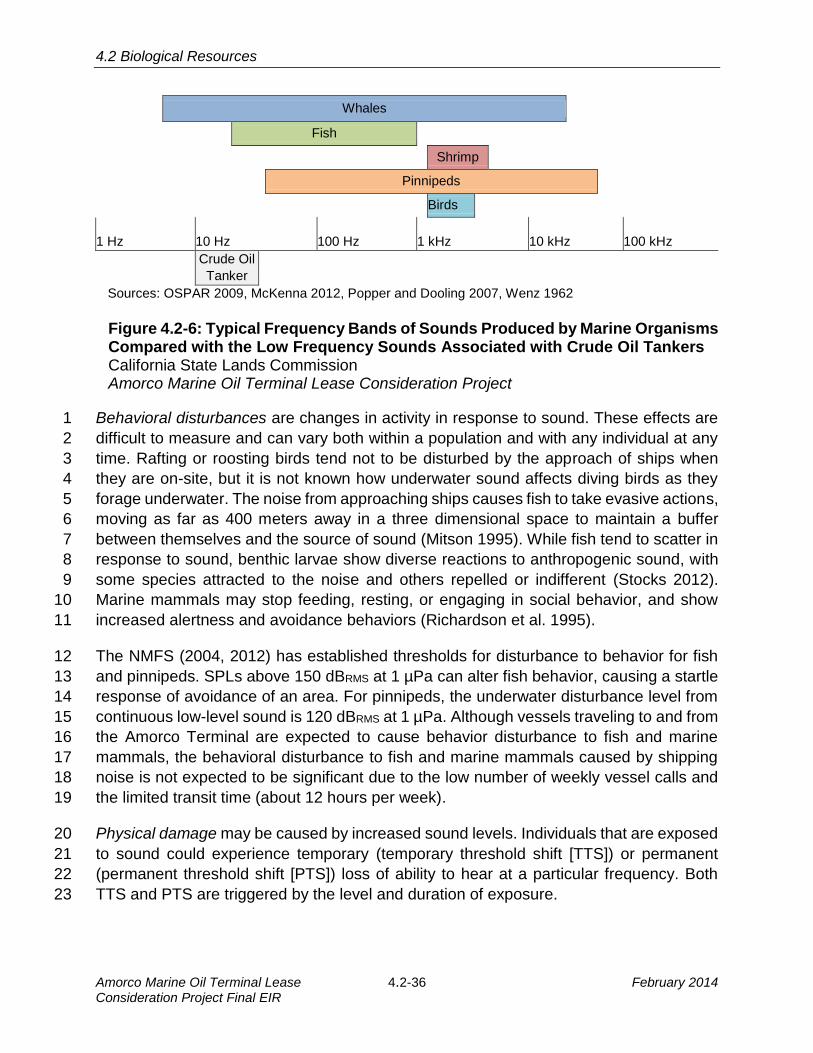
4.2 Biological Resources
Amorco Marine Oil Terminal Lease 4.2-36 February 2014 Consideration Project Final EIR
Whales
Fish
Shrimp
Pinnipeds
Birds
1 Hz 10 Hz 100 Hz 1 kHz 10 kHz 100 kHz
Crude Oil
Tanker
Sources: OSPAR 2009, McKenna 2012, Popper and Dooling 2007, Wenz 1962
Figure 4.2-6: Typical Frequency Bands of Sounds Produced by Marine Organisms Compared with the Low Frequency Sounds Associated with Crude Oil Tankers California State Lands Commission Amorco Marine Oil Terminal Lease Consideration Project
Behavioral disturbances are changes in activity in response to sound. These effects are 1
difficult to measure and can vary both within a population and with any individual at any 2
time. Rafting or roosting birds tend not to be disturbed by the approach of ships when 3
they are on-site, but it is not known how underwater sound affects diving birds as they 4
forage underwater. The noise from approaching ships causes fish to take evasive actions, 5
moving as far as 400 meters away in a three dimensional space to maintain a buffer 6
between themselves and the source of sound (Mitson 1995). While fish tend to scatter in 7
response to sound, benthic larvae show diverse reactions to anthropogenic sound, with 8
some species attracted to the noise and others repelled or indifferent (Stocks 2012). 9
Marine mammals may stop feeding, resting, or engaging in social behavior, and show 10
increased alertness and avoidance behaviors (Richardson et al. 1995). 11
The NMFS (2004, 2012) has established thresholds for disturbance to behavior for fish 12
and pinnipeds. SPLs above 150 dBRMS at 1 µPa can alter fish behavior, causing a startle 13
response of avoidance of an area. For pinnipeds, the underwater disturbance level from 14
continuous low-level sound is 120 dBRMS at 1 µPa. Although vessels traveling to and from 15
the Amorco Terminal are expected to cause behavior disturbance to fish and marine 16
mammals, the behavioral disturbance to fish and marine mammals caused by shipping 17
noise is not expected to be significant due to the low number of weekly vessel calls and 18
the limited transit time (about 12 hours per week). 19
Physical damage may be caused by increased sound levels. Individuals that are exposed 20
to sound could experience temporary (temporary threshold shift [TTS]) or permanent 21
(permanent threshold shift [PTS]) loss of ability to hear at a particular frequency. Both 22
TTS and PTS are triggered by the level and duration of exposure. 23
4.2 Biological Resources
February 2014 4.2-37 Amorco Marine Oil Terminal Lease Consideration Project Final EIR
Sound can damage non-auditory tissue such as swim-bladders and lateral lines in fish. It 1
may also cause increased levels of stress hormones to circulate in the blood of exposed 2
individuals (OSPAR 2009). The NMFS has established thresholds for harm to fish and 3
pinnipeds; the threshold for physical harm to fish from continuous sound occurs at 183 or 4
187 dBRMS at 1 µPa depending on size, and at 190 dBRMS at 1 µPa for pinnipeds. Because 5
the source level noise produced by crude oil tankers does not exceed these thresholds, 6
physical injury from shipping noise is not expected to occur. 7
Little is known about the indirect effects associated with increased underwater noise, 8
though it has been speculated that underwater noise can act as a stressor in marine 9
mammals with consequences to individual health and population viability (OSPAR 2009). 10
Noise that causes adverse effects to prey species could indirectly impact higher-order 11
predators by reducing prey abundance or availability. Because direct impacts to prey 12
species from vessels calling at the Amorco Terminal are expected to be less than 13
significant, no indirect impacts to higher-order predators are expected to occur. 14
Mitigation Measure: No mitigation required 15
Impact BIO-5: Cause impacts to the San Francisco Bay Estuary and associated 16
aquatic biota as a result of minor fuel, lubricant, and/or boat-related spills. (Less 17
than significant.) 18
With continuing operation, the Amorco Terminal would remain a potential point location 19
for minor fuel, lubricant, and other boat-related spills. Any material that is not captured by 20
various BMPs and enters the water would be dispersed around the Amorco Terminal, 21
degrading the quality of the water column and benthic habitat in the vicinity of the Amorco 22
Terminal. Though minor spills are not an occurrence of normal Project operations, and 23
BMPs are in place to prevent them, they are reasonably foreseeable as an occasional 24
result of the Project. 25
Examples of past minor spills from the Amorco Terminal include the release of small 26
amounts of diesel fuel from pipelines or transfer lines into the strait, discharge of 27
lubricating oil from docking vessels into the strait, and the accidental release of hydraulic 28
fluid from a boom during an oil spill drill (USCG 2013). In the State of California, any 29
release or threatened release of a hazardous material must be reported to the local 30
emergency response agency and to the California Emergency Management Agency. 31
There is no minimum reporting quantity. All reported releases from the Amorco Terminal 32
were minor, ranging from seven drops of hydraulic fluid to one gallon of diesel. Minor 33
spills are quickly cleaned up using vac trucks and absorbent pads to recover the material. 34
No significant adverse impacts are expected to aquatic life from minor spills associated 35
with the ongoing operation of the Amorco Terminal. Tesoro operators have a 36
demonstrated history of quick containment response and reporting for small spills. Any 37
4.2 Biological Resources
Amorco Marine Oil Terminal Lease 4.2-38 February 2014 Consideration Project Final EIR
minor amounts of contaminants that are released into the water would be quickly 1
dispersed by the swift currents in the strait such that concentrations of pollutants would 2
not achieve the levels at which harm to aquatic species is observed. 3
Tesoro’s operators use Consequences of Deviation Tables to monitor, compensate, and 4
correct for operating parameters that deviate due to equipment failure, routine 5
maintenance, feed variations, and other factors. The tables detail mechanical set-point 6
criteria, consequences of deviation from the set point, and operator response for 7
instrument Critical Operating Limits/Process Operating Limits (COL/POL). A COL/POL 8
database for current unit operating limits is maintained on the Golden Eagle Intranet. 9
Adherence to these operating ranges and consequences of deviation reduces the 10
potential for minor spills from transfer of crude oil. Although impacts from minor spills are 11
adverse, they are not expected to have a significant effect on biota at the Amorco 12
Terminal. 13
Mitigation Measure: No mitigation required. 14
Impact BIO-6: Cause impacts to the San Francisco Bay Estuary and associated 15
aquatic biota as a result of major fuel, lubricant, and/or boat-related spills. 16
(Significant and unavoidable.) 17
Impacts from spills would depend on the material and quantity spilled. Light oils such as 18
fuel oil are acutely toxic and cause the greatest impacts to species that live in the upper 19
water column such as juvenile fish. Medium oils such as most crude oils do not mix well 20
with water and can cause severe, long-term contamination to intertidal areas and cause 21
oiling of waterfowl and marine mammals. Heavy oils such as heavy crude and some fuel 22
oils weather slowly and may cause severe long-term contamination of intertidal areas and 23
sediments. These oils have severe impacts on waterfowl and marine mammals, and their 24
cleanup is usually difficult and long term. 25
Depending on the weight of the oil, spills may harden and wash up along the shoreline. 26
Crude oils contain a large proportion of highly persistent tar-like compounds. Volatile 27
components of crude oil stock disappear over a few days, but the heavier fractions form 28
an emulsion with sea water (called “mousse”) which allows greater dispersal of oil. Some 29
fraction of crude oil would aggregate into tarballs or mats. The more exposed to the 30
elements oil is, the more rapidly it weathers. The heaviest oils may sink in the water, 31
contaminating the water column and being forced by tidal waves into the substrate. Buried 32
oils are not weathered. 33
Short-term, direct impacts to marine biota from an accidental oil spill include physical 34
oiling, which may cause injury or death; toxic exposure to volatile gas; disturbance from 35
clean-up activities; and loss of habitat. Indirect impacts include disruption of predator-prey 36
relationships; introduced toxins in the food web, which may cause low-level health 37
4.2 Biological Resources
February 2014 4.2-39 Amorco Marine Oil Terminal Lease Consideration Project Final EIR
impacts to prey species that bioaccumulate in predator species; possible toxic effects on 1
embryos; and interruption or degradation of reproduction potential. Population recovery 2
from spills is dependent on generation time. Species that reproduce early and often are 3
quick to rebound after spills, while those with longer generation spans may see long-term 4
impacts to abundance. 5
Birds 6
Birds can be killed or injured from contact with oil spills. The degree to which a species is 7
susceptible to oil spills depends on its habitat use and behavioral characteristics. Diving 8
birds are particularly susceptible to injury from oil spills because they forage in open 9
waters, and oil slicks may make the water look calmer and more inviting. Seabirds, which 10
dive when disturbed, are also susceptible to injury. Birds that contact oil may get oil on 11
their feathers and lose the ability to stay warm, waterproof, and buoyant. Birds use their 12
beaks to clean their feathers, and thus may ingest oil while trying to remove oil. 13
The species impacted and the extent of the impact from an oil spill would depend on when 14
the spill occurred. The Amorco Terminal is located within the Pacific flyway, a major 15
migratory corridor for waterbirds. Migrating flocks are large and migrations may occur in 16
a very tight window, resulting in a large proportion of a species’ entire population visiting 17
a single site over a few weeks. Following the most recent large petroleum spill in San 18
Francisco Bay, the November 2007 Cosco Busan spill, which spilled 58,000 gallons of 19
fuel into the San Francisco Bay, two thousand bird carcasses representing 57 bird 20
species were recovered during clean up. Fatalities were highest among diving birds: surf 21
scoter (Melanitta perspicillata), western grebe (Aechmophorus occidentalis), common 22
murre (Uria aalge), Clarke’s grebe (Aechmophorus clarkia), Brant’s cormorant 23
(Phalacrocorax penicillatus), greater scaup (Aythya marila), and eared grebe (Podiceps 24
nigricollis). 25
Birds may also be impacted by the loss or degradation of breeding sites. Colony nest 26
sites for double-crested cormorants are found on the Benicia-Martinez Bridge, and for 27
great blue heron on Mare Island. 28
Fish and Invertebrates 29
Fish can be killed or injured from contact with oil spills. The susceptibility of fish to a spill 30
depends on its growth stage, feeding behavior, and the type of oil. Juvenile fish and fish 31
species that use shallow or near-surface waters such as longfin smelt and delta smelt are 32
susceptible to acute toxicity from lighter oils, while fish that swim lower in the water column 33
such as steelhead and salmon are less likely to come in direct contact with oil. Fish may 34
come into direct contact with oil, thus contaminating their gills; they may absorb toxic 35
components of oil through their skin; and they may suffer adverse effects from eating 36
contaminated food. 37
4.2 Biological Resources
Amorco Marine Oil Terminal Lease 4.2-40 February 2014 Consideration Project Final EIR
The number and type of species impacted by an oil spill depends on the season in which 1
the spill occurs. The Carquinez Strait is a migratory corridor for a number of threatened 2
and endangered fish species, including green sturgeon, longfin smelt, steelhead, and 3
chinook salmon. Delta smelt and Sacramento splittail are seasonally abundant in Suisun 4
Bay. 5
Mammals 6
The susceptibility of mammals to an oil spill is highly variable. Mammals that need clean 7
fur to stay warm such as river otters, beavers, sea otters, vagrant shrew, and salt-marsh 8
harvest mouse are injured by contact with oil. Harbor seal and sea lion have blubber for 9
insulation and do not groom or depend on fur to stay warm; this makes them less 10
susceptible to crude oil spill than mammals with dense fur, which lose the ability to stay 11
warm when their fur becomes matted with heavy oil. All mammals that come in contact 12
with oil spills are susceptible to the acute effects of light oils, which may cause injury to 13
eyes, nerve damage, behavioral abnormalities, and, if ingested, digestive tract bleeding 14
and liver and kidney damage (Harwell and Gentile 2006). 15
California sea lions are found in the estuary from August to mid-May. In June and July, 16
most of the sea lions have left for breeding grounds further south. Harbor seals are 17
resident breeders, and their haul out and pupping sites may be degraded by oil spills. 18
Saltmarsh harvest mouse individuals may be directly impacted by oil if the spill reaches 19
tidal marsh. All mammals may be disturbed by containment and clean-up activities. 20
Habitat 21
Low-energy marshy sites with high organic content are susceptible to widespread toxic 22
effects from intertidal sediment hydrocarbon exposure. Damage is caused both by the 23
spill and by the clean-up activities that follow. Oils and cleanup may remove massive 24
amounts of marsh vegetation, requiring years to recover. Oils that are buried in the 25
sediments and escape removal during cleanup can cause long-term low-level 26
degradation of the marsh environment, with detectable effect on benthic invertebrates. 27
Oil Spill Modeling 28
As presented in Section 4.1, Operational Safety/Risk of Accidents, the average most 29
probable and maximum most probable spills for crude oil shipped through the Amorco 30
Terminal were modeled. Results of these models indicate that while spills at or near the 31
Amorco Terminal have the potential to travel through Carquinez Strait into San Pablo Bay 32
and into Suisun Bay and its associated marshes, the highest probability of contact with 33
oil occurs within the direct vicinity of the Amorco Terminal. The trajectory of the spill and 34
the extent of its distribution vary seasonally. A spill in winter during the flooding season 35
would be carried by heavy Delta outflows into San Pablo Bay, oiling shorelines along the 36
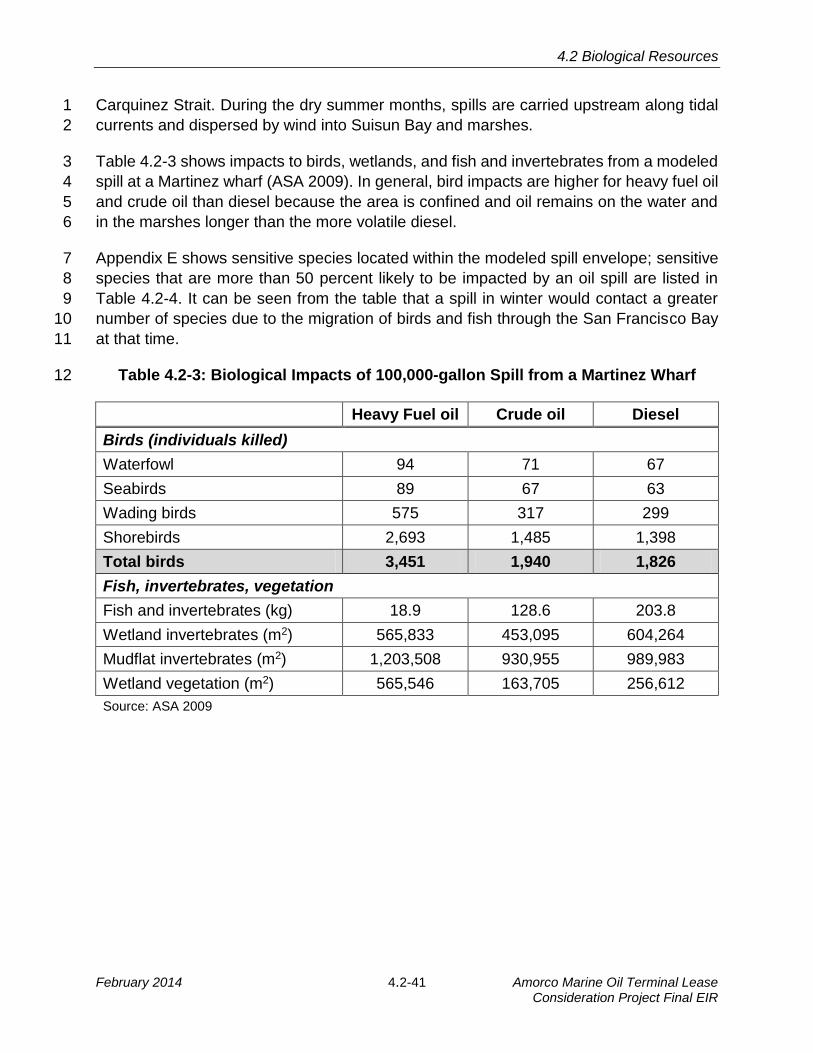
4.2 Biological Resources
February 2014 4.2-41 Amorco Marine Oil Terminal Lease Consideration Project Final EIR
Carquinez Strait. During the dry summer months, spills are carried upstream along tidal 1
currents and dispersed by wind into Suisun Bay and marshes. 2
Table 4.2-3 shows impacts to birds, wetlands, and fish and invertebrates from a modeled 3
spill at a Martinez wharf (ASA 2009). In general, bird impacts are higher for heavy fuel oil 4
and crude oil than diesel because the area is confined and oil remains on the water and 5
in the marshes longer than the more volatile diesel. 6
Appendix E shows sensitive species located within the modeled spill envelope; sensitive 7
species that are more than 50 percent likely to be impacted by an oil spill are listed in 8
Table 4.2-4. It can be seen from the table that a spill in winter would contact a greater 9
number of species due to the migration of birds and fish through the San Francisco Bay 10
at that time. 11
Table 4.2-3: Biological Impacts of 100,000-gallon Spill from a Martinez Wharf 12
Heavy Fuel oil Crude oil Diesel
Birds (individuals killed)
Waterfowl 94 71 67
Seabirds 89 67 63
Wading birds 575 317 299
Shorebirds 2,693 1,485 1,398
Total birds 3,451 1,940 1,826
Fish, invertebrates, vegetation
Fish and invertebrates (kg) 18.9 128.6 203.8
Wetland invertebrates (m2) 565,833 453,095 604,264
Mudflat invertebrates (m2) 1,203,508 930,955 989,983
Wetland vegetation (m2) 565,546 163,705 256,612
Source: ASA 2009
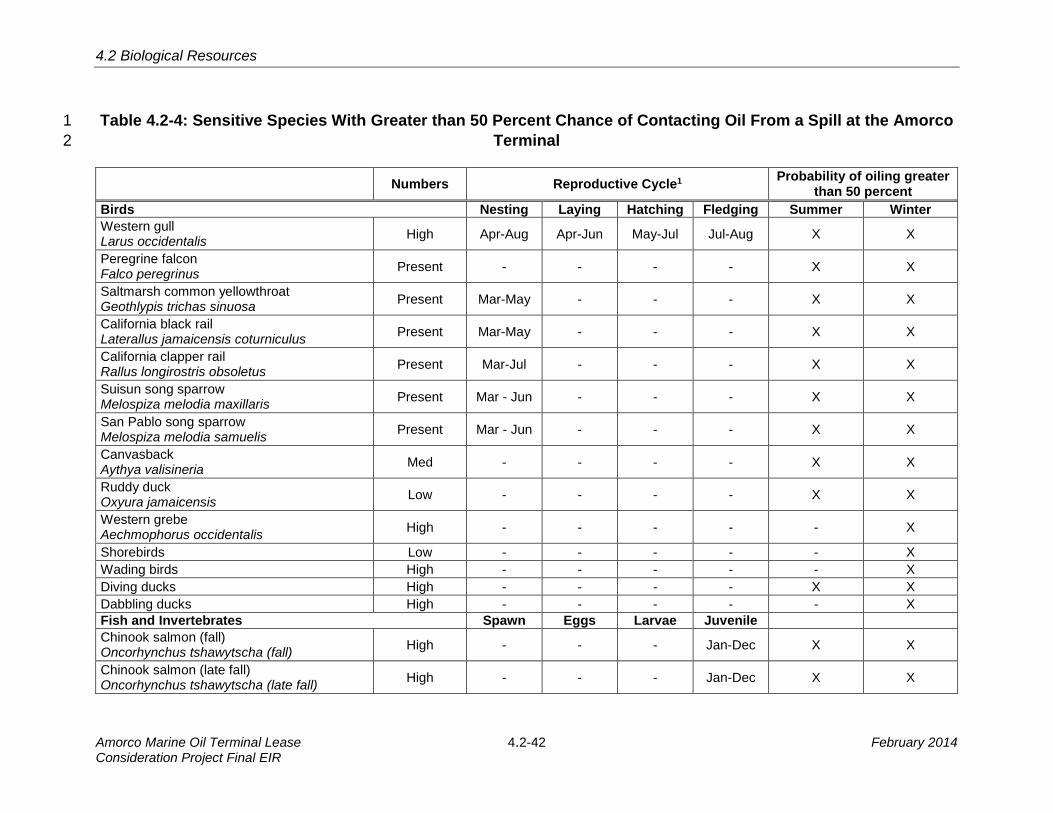
4.2 Biological Resources
Amorco Marine Oil Terminal Lease 4.2-42 February 2014 Consideration Project Final EIR
Table 4.2-4: Sensitive Species With Greater than 50 Percent Chance of Contacting Oil From a Spill at the Amorco 1
Terminal 2
Numbers Reproductive Cycle1 Probability of oiling greater than 50 percent
Birds Nesting Laying Hatching Fledging Summer Winter
Western gull Larus occidentalis
High Apr-Aug Apr-Jun May-Jul Jul-Aug X X
Peregrine falcon Falco peregrinus
Present - - - - X X
Saltmarsh common yellowthroat Geothlypis trichas sinuosa
Present Mar-May - - - X X
California black rail Laterallus jamaicensis coturniculus
Present Mar-May - - - X X
California clapper rail Rallus longirostris obsoletus
Present Mar-Jul - - - X X
Suisun song sparrow Melospiza melodia maxillaris
Present Mar - Jun - - - X X
San Pablo song sparrow Melospiza melodia samuelis
Present Mar - Jun - - - X X
Canvasback Aythya valisineria
Med - - - - X X
Ruddy duck Oxyura jamaicensis
Low - - - - X X
Western grebe Aechmophorus occidentalis
High - - - - - X
Shorebirds Low - - - - - X
Wading birds High - - - - - X
Diving ducks High - - - - X X
Dabbling ducks High - - - - - X
Fish and Invertebrates Spawn Eggs Larvae Juvenile
Chinook salmon (fall) Oncorhynchus tshawytscha (fall)
High - - - Jan-Dec X X
Chinook salmon (late fall) Oncorhynchus tshawytscha (late fall)
High - - - Jan-Dec X X
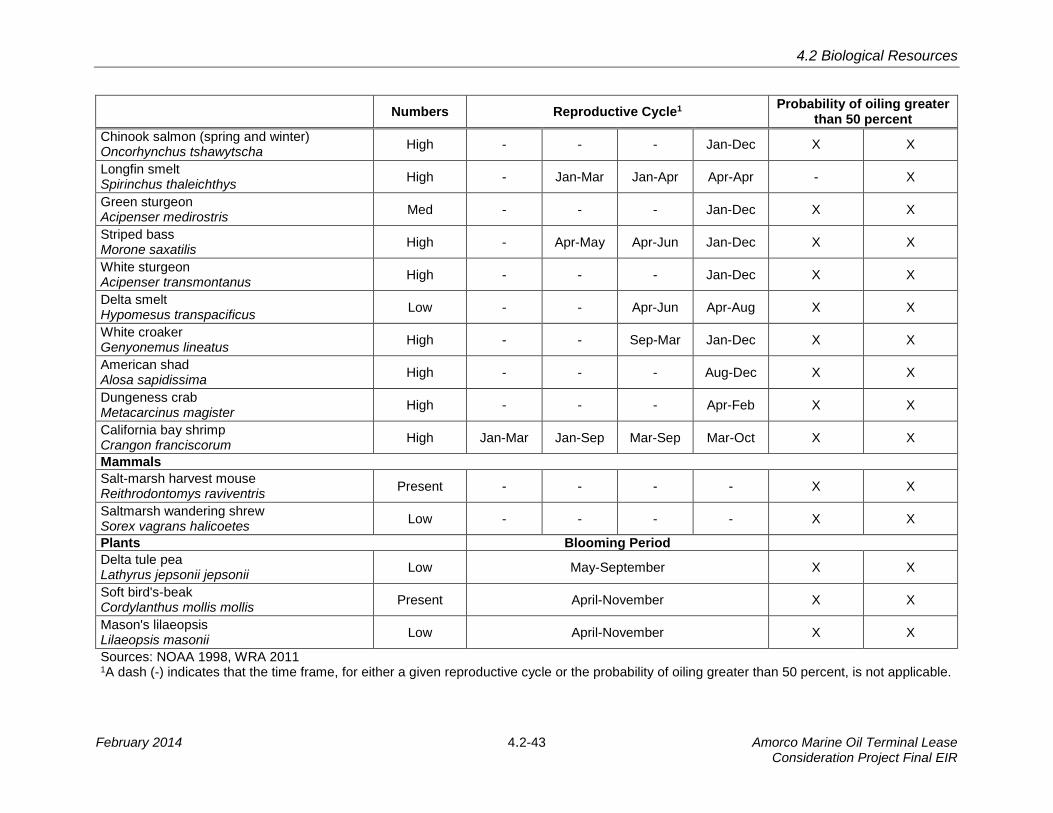
4.2 Biological Resources
February 2014 4.2-43 Amorco Marine Oil Terminal Lease Consideration Project Final EIR
Numbers Reproductive Cycle1 Probability of oiling greater than 50 percent
Chinook salmon (spring and winter) Oncorhynchus tshawytscha
High - - - Jan-Dec X X
Longfin smelt Spirinchus thaleichthys
High - Jan-Mar Jan-Apr Apr-Apr - X
Green sturgeon Acipenser medirostris
Med - - - Jan-Dec X X
Striped bass Morone saxatilis
High - Apr-May Apr-Jun Jan-Dec X X
White sturgeon Acipenser transmontanus
High - - - Jan-Dec X X
Delta smelt Hypomesus transpacificus
Low - - Apr-Jun Apr-Aug X X
White croaker Genyonemus lineatus
High - - Sep-Mar Jan-Dec X X
American shad Alosa sapidissima
High - - - Aug-Dec X X
Dungeness crab Metacarcinus magister
High - - - Apr-Feb X X
California bay shrimp Crangon franciscorum
High Jan-Mar Jan-Sep Mar-Sep Mar-Oct X X
Mammals
Salt-marsh harvest mouse Reithrodontomys raviventris
Present - - - - X X
Saltmarsh wandering shrew Sorex vagrans halicoetes
Low - - - - X X
Plants Blooming Period
Delta tule pea Lathyrus jepsonii jepsonii
Low May-September X X
Soft bird's-beak Cordylanthus mollis mollis
Present April-November X X
Mason's lilaeopsis Lilaeopsis masonii
Low April-November X X
Sources: NOAA 1998, WRA 2011 1A dash (-) indicates that the time frame, for either a given reproductive cycle or the probability of oiling greater than 50 percent, is not applicable.
4.2 Biological Resources
Amorco Marine Oil Terminal Lease 4.2-44 February 2014 Consideration Project Final EIR
In addition to the Biological Resources mitigation measures presented below, 1
implementation of Mitigation Measures OS-1, OS-4a, and OS-4b (refer to Section 4.1, 2
Operational Safety/Risk of Accidents) would reduce impacts to biological resources. 3
Mitigation Measures: 4
MM BIO-6a: Bird rescue personnel and rehabilitators. Tesoro shall ensure that 5
procedures are in place to bring bird rescue personnel and rehabilitators to the site 6
following a spill event that is not immediately contained at the Amorco Terminal. 7
This requires having contractual arrangements in place as part of the Golden Eagle 8
Refinery Oil Spill Contingency Plan so that bird rescue personnel and equipment 9
can be on-site within hours of the onset of an accidental release. 10
MM BIO-6b: Cleanup of oil from biological area. When a spill occurs, Tesoro 11
shall develop procedures for cleanup of any sensitive biological areas contacted 12
by oil in consultation with biologists from the California Department of Fish and 13
Wildlife, National Marine Fisheries Service, and U.S. Fish and Wildlife Service. 14
MM BIO-6c: Natural Resource Damage Assessment (NRDA) Team. Tesoro 15
shall coordinate to the maximum extent feasible with the NRDA Team to determine 16
the extent of damage and loss of resources, cleanup, restoration, and 17
compensation. Tesoro shall keep the CSLC staff informed of its participation in 18
such efforts by providing copies of memos, meeting agendas, emails, or other 19
appropriate documentation. Tesoro shall be responsible for cleanup, restoration, 20
and compensation of damages to resources if Tesoro is determined to be the 21
responsible party for a spill. 22
Impact BIO-7: Introduce invasive nonindigenous species to the San Francisco Bay 23
Estuary. (Significant and unavoidable.) 24
The San Francisco Bay and Sacramento-San Joaquin River Delta region is a highly 25
invaded ecosystem, among the most invaded aquatic ecosystems in North America; 26
Since 1970, the rate of invasion has been one new species every 24 weeks (Cohen 1995). 27
In some parts of the estuary, introduced species account for the majority of species 28
diversity, dominate the estuary’s food webs, and may result in profound structural 29
changes to habitat (Cohen 1995). 30
The rate of species introductions, and thus the risk of invasion by species with detrimental 31
impacts, has increased significantly during recent decades. In North America, and 32
particularly in California and the rest of the west coast, the rate of reported introductions 33
in marine and estuarine waters has increased exponentially over the last 200 years (Ruiz 34
2000a, 2011). Prior to the implementation of ballast water management regulations in 35
California, a new species was believed to become established every 14 weeks on 36
4.2 Biological Resources
February 2014 4.2-45 Amorco Marine Oil Terminal Lease Consideration Project Final EIR
average in the San Francisco Estuary (Cohen and Carlton 1998). One of the primary 1
factors leading to this increase has been the vast expansion of global trade during the 2
past 50 years, which in turn has led to significantly more ballast water, fouled hulls, and 3
associated organisms moving around the world. The increased speed of vessels involved 4
in global trade has allowed many more potentially invasive organisms entrained in ballast 5
tanks to survive under shorter transit times (Ruiz and Carlton 2003) and arrive in recipient 6
ports in better condition. Organisms that arrive “healthy” in recipient regions are more 7
likely to thrive and reproduce in their new habitats. 8
Once established, NIS can have severe ecological, economic, and human health impacts 9
in the receiving environment. The overbite clam (Corbula amurensis) is believed to be a 10
major contributor to the decline of several pelagic fish species in the Sacramento-San 11
Joaquin River Delta, including the threatened delta smelt, by reducing the planktonic food 12
base of the ecosystem (Feyrer 2003, Sommer 2007, MacNally 2010). In California, control 13
of zebra and quagga mussels, which can clog municipal water systems and electric 14
generating plans, has already cost over $14 million; these costs represent only a fraction 15
of the cumulative expenses related to NIS control over time, because control is an 16
unending process. The Japanese sea slug Haminoea japonica is a host for parasites that 17
cause cercarial dermatitis, or “swimmer’s itch,” in humans. Since 2005, cases of 18
swimmer’s itch at Robert Crown Memorial Beach in Alameda have occurred on an annual 19
basis and are associated with high densities of Haminoea japonica (Brant 2010). 20
The California Aquatic Invasive Species Management Plan identifies commercial 21
shipping as the most important vector for the introduction of aquatic invasive species 22
(OSPR 2008). Commercial ships can introduce nonindigenous aquatic species through 23
ballast water discharge or vessel biofouling. These vectors are addressed separately 24
below. 25
Ballast Water Discharge 26
As discussed in Section 2.0, Project Description, ballast is a material placed low in a 27
vessel to improve its stability. The amount of ballast a ship carries affects how high or low 28
a ship’s hull sits in the water; the vertical distance between the waterline and the bottom 29
of the hull is known as a ship’s draft. The draft determines the minimum depth of water a 30
ship can safely navigate. Ships commonly use water as ballast because it is freely 31
available and can be easily managed. Ballast water can be released to reduce draft, 32
allowing the boat to sit higher in the water, or it can be taken on to increase draft and 33
further submerge propellers or allow a ship to travel under a bridge or other structure. 34
Ballast tanks are typically filled with water after discharging cargo to improve vessel 35
stability, maneuverability, and propulsion. Tankers carry the highest volume of ballast 36
water of any vessel type in the merchant class: 31,643 MT metric tons (MT) on average. 37
By comparison, container vessels carry less than half this amount. 38
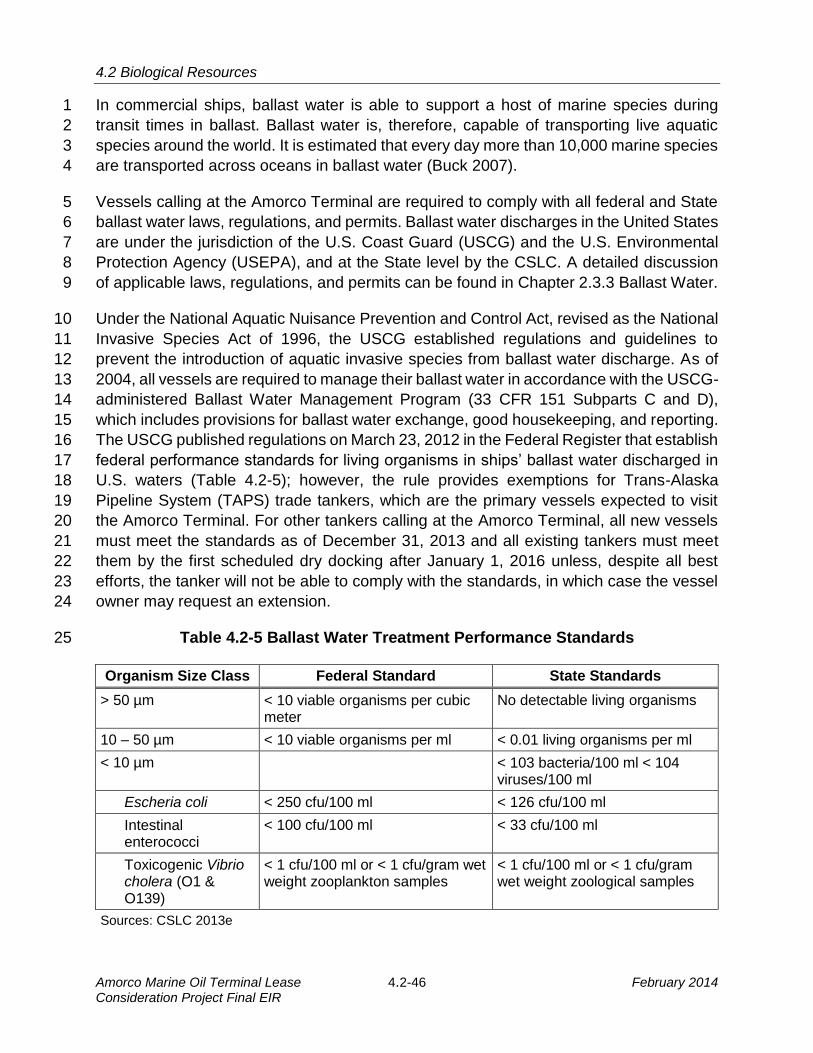
4.2 Biological Resources
Amorco Marine Oil Terminal Lease 4.2-46 February 2014 Consideration Project Final EIR
In commercial ships, ballast water is able to support a host of marine species during 1
transit times in ballast. Ballast water is, therefore, capable of transporting live aquatic 2
species around the world. It is estimated that every day more than 10,000 marine species 3
are transported across oceans in ballast water (Buck 2007). 4
Vessels calling at the Amorco Terminal are required to comply with all federal and State 5
ballast water laws, regulations, and permits. Ballast water discharges in the United States 6
are under the jurisdiction of the U.S. Coast Guard (USCG) and the U.S. Environmental 7
Protection Agency (USEPA), and at the State level by the CSLC. A detailed discussion 8
of applicable laws, regulations, and permits can be found in Chapter 2.3.3 Ballast Water. 9
Under the National Aquatic Nuisance Prevention and Control Act, revised as the National 10
Invasive Species Act of 1996, the USCG established regulations and guidelines to 11
prevent the introduction of aquatic invasive species from ballast water discharge. As of 12
2004, all vessels are required to manage their ballast water in accordance with the USCG-13
administered Ballast Water Management Program (33 CFR 151 Subparts C and D), 14
which includes provisions for ballast water exchange, good housekeeping, and reporting. 15
The USCG published regulations on March 23, 2012 in the Federal Register that establish 16
federal performance standards for living organisms in ships’ ballast water discharged in 17
U.S. waters (Table 4.2-5); however, the rule provides exemptions for Trans-Alaska 18
Pipeline System (TAPS) trade tankers, which are the primary vessels expected to visit 19
the Amorco Terminal. For other tankers calling at the Amorco Terminal, all new vessels 20
must meet the standards as of December 31, 2013 and all existing tankers must meet 21
them by the first scheduled dry docking after January 1, 2016 unless, despite all best 22
efforts, the tanker will not be able to comply with the standards, in which case the vessel 23
owner may request an extension. 24
Table 4.2-5 Ballast Water Treatment Performance Standards 25
Organism Size Class Federal Standard State Standards
> 50 µm < 10 viable organisms per cubic meter
No detectable living organisms
10 – 50 µm < 10 viable organisms per ml < 0.01 living organisms per ml
< 10 µm < 103 bacteria/100 ml < 104 viruses/100 ml
Escheria coli < 250 cfu/100 ml < 126 cfu/100 ml
Intestinal enterococci
< 100 cfu/100 ml < 33 cfu/100 ml
Toxicogenic Vibrio cholera (O1 & O139)
< 1 cfu/100 ml or < 1 cfu/gram wet weight zooplankton samples
< 1 cfu/100 ml or < 1 cfu/gram wet weight zoological samples
Sources: CSLC 2013e
4.2 Biological Resources
February 2014 4.2-47 Amorco Marine Oil Terminal Lease Consideration Project Final EIR
The USEPA regulates ballast water discharge under the Vessel General Permit for 1
Discharges Incidental the Normal Operation of Vessels (VGP). The 2013 VGP, which is 2
a 5-year permit, contains ballast water discharge performance standards consistent with 3
the USCG standards and ballast water management requirements for vessels traveling 4
along the Pacific Coast. Vessels arriving to California ports from outside the EEZ and 5
intending to discharge ballast in California waters are required by the State of California 6
to exchange ballast water in ballast tanks prior to travelling within 200 nautical miles (nm) 7
of land. Vessels transiting between Captain of the Port Zones along the Pacific Coast of 8
the U.S. are required to conduct ballast water exchange at least 50 nm from shore in 9
waters at least 200 nm deep. 10
At the state level, the CSLC is the lead implementing agency for the State’s Marine 11
Invasive Species Program. As directed by the 1999 Ballast Water Management for 12
Control of Nonindigenous Species Act, as revised and reauthorized by the Marine 13
Invasive Species Act of 2003 (Pub. Resources Code §§ 71200 to 71271), the CSLC 14
formulated recommendations to prevent or minimize the introduction of nonindigenous 15
species discharges for vessels 300 gross registered tons or greater, capable of carrying 16
ballast water, operating in State waters. California Code of Regulations Article 4.6 17
addresses ballast water management for vessels arriving at California ports from another 18
port or place within the Pacific Coast Region; California Public Resources Code section 19
71204.3 addresses requirements for vessels whose voyage originated outside of the 20
Pacific Coast Region (PCR), a shipping zone that encompasses coastal waters within 21
200 nautical miles (nm) of the Pacific Coast of North America from Cooks Inlet in Alaska 22
down through three-quarters of the Baja Peninsula. 23
Beginning in 2016, all tankers will be required to implement ballast water treatment 24
standards (Table 4.2-5). Until then, ballast water must be managed in compliance with 25
state regulations. California regulations (Cal. Code Regs., tit. 2, § 2280 et seq.) requires 26
that the master, operator, or person in charge of a vessel arriving to a California port or 27
place from another port or place within the PCR with ballast water sourced from within 28
the PCR, manage ballast water in at least one of the following ways: 29
Exchange the vessel’s PCR-sourced ballast water in near-coastal waters (more 30
than 50 nm from land and at least 200 m deep) before entering the waters of the 31
State. 32
Retain all ballast water on board the vessel. 33
Use an alternative, environmentally sound, Commission or USCG-approved 34
method of treatment. 35
Discharge the ballast water to an approved reception facility (Currently there are 36
no such facilities in California). 37
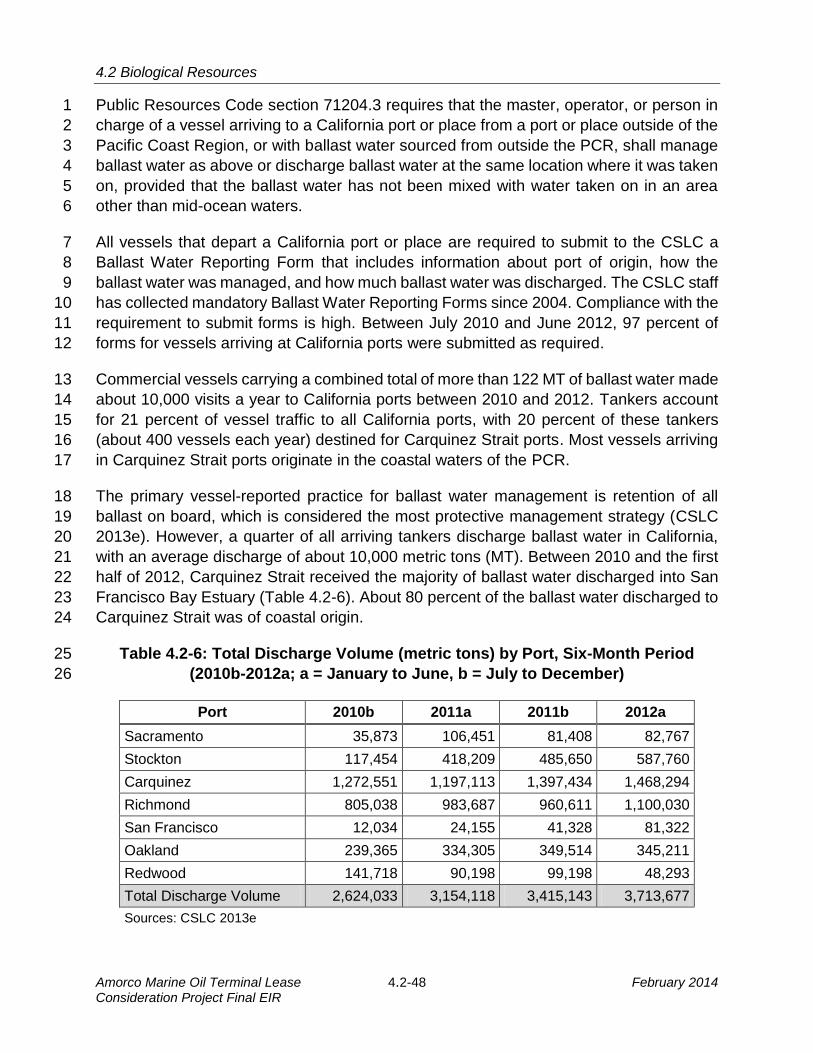
4.2 Biological Resources
Amorco Marine Oil Terminal Lease 4.2-48 February 2014 Consideration Project Final EIR
Public Resources Code section 71204.3 requires that the master, operator, or person in 1
charge of a vessel arriving to a California port or place from a port or place outside of the 2
Pacific Coast Region, or with ballast water sourced from outside the PCR, shall manage 3
ballast water as above or discharge ballast water at the same location where it was taken 4
on, provided that the ballast water has not been mixed with water taken on in an area 5
other than mid-ocean waters. 6
All vessels that depart a California port or place are required to submit to the CSLC a 7
Ballast Water Reporting Form that includes information about port of origin, how the 8
ballast water was managed, and how much ballast water was discharged. The CSLC staff 9
has collected mandatory Ballast Water Reporting Forms since 2004. Compliance with the 10
requirement to submit forms is high. Between July 2010 and June 2012, 97 percent of 11
forms for vessels arriving at California ports were submitted as required. 12
Commercial vessels carrying a combined total of more than 122 MT of ballast water made 13
about 10,000 visits a year to California ports between 2010 and 2012. Tankers account 14
for 21 percent of vessel traffic to all California ports, with 20 percent of these tankers 15
(about 400 vessels each year) destined for Carquinez Strait ports. Most vessels arriving 16
in Carquinez Strait ports originate in the coastal waters of the PCR. 17
The primary vessel-reported practice for ballast water management is retention of all 18
ballast on board, which is considered the most protective management strategy (CSLC 19
2013e). However, a quarter of all arriving tankers discharge ballast water in California, 20
with an average discharge of about 10,000 metric tons (MT). Between 2010 and the first 21
half of 2012, Carquinez Strait received the majority of ballast water discharged into San 22
Francisco Bay Estuary (Table 4.2-6). About 80 percent of the ballast water discharged to 23
Carquinez Strait was of coastal origin. 24
Table 4.2-6: Total Discharge Volume (metric tons) by Port, Six-Month Period 25
(2010b-2012a; a = January to June, b = July to December) 26
Port 2010b 2011a 2011b 2012a
Sacramento 35,873 106,451 81,408 82,767
Stockton 117,454 418,209 485,650 587,760
Carquinez 1,272,551 1,197,113 1,397,434 1,468,294
Richmond 805,038 983,687 960,611 1,100,030
San Francisco 12,034 24,155 41,328 81,322
Oakland 239,365 334,305 349,514 345,211
Redwood 141,718 90,198 99,198 48,293
Total Discharge Volume 2,624,033 3,154,118 3,415,143 3,713,677
Sources: CSLC 2013e
4.2 Biological Resources
February 2014 4.2-49 Amorco Marine Oil Terminal Lease Consideration Project Final EIR
Total managed ballast discharges have increased between 2006 and 2012. The majority 1
of ballast water discharged from all vessel types into California waters is in compliance 2
with ballast exchange regulations. Vessels primarily conduct two types of ballast water 3
exchange: flow-through (FT) and empty-refill (ER). In FT exchange, ocean water is 4
pumped continuously through a ballast tank to flush out coastal water from the ballast 5
source port. Empty-refill exchange is conducted by draining a ballast tank of coastal 6
source water as much as possible, and refilling it with open-ocean water. Between 2010 7
and 2012, 56 percent of managed and discharged ballast water, by volume, was 8
exchanged using ER compared to 44 percent using FT. While ballast water exchange, 9
when properly practiced, can remove 95 to 100 percent of the original source water (Hay 10
and Tanis 1998) and reduce the number of coastal species in ballast tanks, differences 11
in the effectiveness of the two management options (FT and ER) exist. Flow-through 12
exchange has been shown to be significantly less effective than ER in reducing the 13
amount of coastal species in exchanged ballast tanks (Cordell 2009). 14
The volume of noncompliant ballast water discharged as a percentage of total discharges 15
has decreased from 24 percent in 2006 to 10 percent in 2012. Between 2010 and 2012, 16
approximately 2.5 million MT of noncompliant ballast water was discharged to California 17
waters. The majority of noncompliant discharges (88%) between 2010 and 2012 18
consisted of water that was exchanged offshore, but in a location not acceptable under 19
California law. Approximately nine percent of discharged water was not exchanged at all. 20
Unexchanged ballast water discharge is considered a high-risk for invasive species. In 21
the period between 2010 and 2012, tankers accounted for about half of all noncompliant 22
discharges and one-fifth of high-risk ballast water discharge (CSLC 2013e). 23
Factors that influence invasion risk, in addition to the volume of ballast water released 24
and the type of exchange, include the age of the ballast water discharged (species often 25
survive better when held for a short period of time), the degree of repeated inoculation 26
(frequency with which ballast is discharged in a given area), and similarity between donor 27
and recipient regions (biological, chemical, and physical characteristics at each port) 28
(Carlton 1996, Ruiz and Carlton 2003). Recent studies have demonstrated that there is a 29
strong pattern of intraregional spread of nonindigenous aquatic species along the North 30
American Pacific coast (Ruiz et al. 2011). Because of the volume of ballast water 31
discharged by tankers to Carquinez Strait, the origin of the ballast water, and ongoing 32
noncompliance with ballast water management regulations, the risk of introduction of 33
further nonindigenous aquatic organisms to the San Francisco Bay Estuary as a result of 34
the Project is significant and unavoidable. 35
Vessel Biofouling 36
Many marine organisms that have a sessile or sedentary life stage in which they are 37
attached or associated with hard substrata can readily colonize ships’ hulls or niche 38
areas, such as sea chests, bow thrusters, propeller shafts, and inlet gratings, that are 39
4.2 Biological Resources
Amorco Marine Oil Terminal Lease 4.2-50 February 2014 Consideration Project Final EIR
inadequately protected by anti-fouling systems. The most common biofouling organisms 1
are barnacles, mussels, seaweed, anemones, and sea squirts (OSPR 2008). Mobile 2
organisms, such as shrimps, worms, and snails can reside in the crevices created by 3
colonies of barnacles and mussels. Biofouling organisms are then transported by vessels 4
into new environments where they may be transferred from the ship into the new 5
environment by spawning, detachment, or mechanical removal. 6
Thus vessel biofouling has been identified as one of the most important mechanism for 7
marine nonindigenous aquatic species introductions in several regions, including 8
Australia, North America, Hawaii, the North Sea, and California (Ruiz 2000b, 2011, 9
Eldredge and Carlton 2002, Gollasch 2002). The CSLC, which regulates vessel biofouling 10
under the Marine Invasive Species Act of 2003, states that all vessels pose some level of 11
risk from biofouling (CSLC 2013e). Since 2008, the CSLC has required vessels operating 12
in State waters to submit an annual Hull Husbandry Reporting Form. These data have 13
since been used in conjunction with results from CSLC-funded biological research to 14
develop management requirements that will reduce the risk of nonindigenous aquatic 15
species introductions through vessel biofouling. The CSLC is in the process of developing 16
regulations to amend California Code of Regulations Article 4.8 (Title 2, Division 3, 17
Chapter 1) that would establish management requirements for vessel biofouling, including 18
the use of a biofouling management plan specific to the vessel, biofouling logbook, and 19
use of antifouling systems or practices to deter or prevent species attachment. 20
Tesoro has no control over, ownership of, or authority to direct vessels that would dock 21
at its marine terminal; therefore, specific details of how vessels manage biofouling or 22
ballast water cannot be provided as part of the Project. The vessels would be governed 23
by the applicable CSLC requirements for biofouling management, which would reduce 24
the potential impact of aquatic species invasion from biofouling. Under Mitigation Measure 25
BIO-7a, Tesoro would ensure that vessels seeking to call at the Amorco Terminal are 26
advised of California’s Marine Invasive Species Act and are submitting forms as required 27
by the CSLC. However, the impact of introducing new non-native and invasive species 28
via ballast water and vessel biofouling in the San Francisco Bay and Sacramento-San 29
Joaquin River Delta could potentially be so devastating that even a reduced risk has the 30
potential to cause a significant and unavoidable adverse impact to special-status species 31
and habitats. 32
Mitigation Measures: 33
MM BIO-7a: Marine Invasive Species Act Reporting Forms. Following the 34
adoption of the Mitigation Monitoring Program for the Project, Tesoro shall advise 35
both agents and representatives of shipping companies having control over 36
vessels that have informed Tesoro of plans to call at the Amorco Terminal about 37
the California Marine Invasive Species Act and associated implementing 38
regulations. Tesoro shall satisfy itself that all vessels submit required reporting 39
4.2 Biological Resources
February 2014 4.2-51 Amorco Marine Oil Terminal Lease Consideration Project Final EIR
forms, as applicable for each vessel, to the California State Lands Commission 1
Marine Facilities Division, including, but not limited to, the Ballast Water Reporting 2
Form, Hull Husbandry Reporting Form, Ballast Water Treatment Technology 3
Reporting Form, and/or Ballast Water Treatment Supplemental Reporting Form. 4
MM BIO-7b: Invasive species action funding. Tesoro shall participate and assist 5
in funding ongoing and future actions related to nonindigenous aquatic species as 6
identified in the October 2005 Delta Smelt Action Plan (State of California 2005). 7
The funding support shall be provided to the Pelagic Organism Decline Account or 8
other account identified by the California Department of Water Resources (DWR) 9
and California Department of Fish and Wildlife (CDFW), the lead Action Plan 10
agencies. The level of funding shall be determined through a cooperative effort 11
between the California State Lands Commission, DWR, CDFW, and Tesoro, and 12
shall be based on criteria that establish Tesoro’s commensurate share of the plan’s 13
nonindigenous aquatic species actions costs. 14
Alternative 1: No Project 15
Impact BIO-8: Cause impacts to the San Francisco Bay Estuary and associated 16
biota resulting from the decommissioning and abandoning in place of existing 17
structures. (Significant and unavoidable.) 18
As described in Section 3.3, under the No Project Alternative, the Amorco Terminal lease 19
would not be renewed, and the Amorco Terminal would be decommissioned and either 20
abandoned in place or partially or completely removed. Decommissioning the Amorco 21
Terminal would have the potentially insignificant beneficial impact of locally reducing the 22
amount of sediment resuspension caused by vessels docking at the Amorco Terminal 23
and removing a potential point source for minor spills. 24
Crude oil vessel traffic would most likely be transitioned to the nearby Avon MOT, so there 25
would be little reduction in crude oil tanker traffic transiting the estuary. Thus, there would 26
be no overall reduction in shipping noise, and the risk of hazards from an oil spill and from 27
the introduction of nonindigenous aquatic species introduced via ballast water and vessel 28
biofouling would be shifted upstream rather than reduced, and the potential impact to the 29
San Francisco Bay Estuary and associated biota would be continue to be significant and 30
unavoidable. 31
4.2 Biological Resources
Amorco Marine Oil Terminal Lease 4.2-52 February 2014 Consideration Project Final EIR
Impact BIO-9: Cause impacts to the San Francisco Bay Estuary and associated 1
biota resulting from the partial or complete removal of Amorco Terminal structures. 2
(Potentially significant.) 3
Construction activities associated with partial or complete removal of the Amorco 4
Terminal would cause temporary disturbances to habitat and wildlife that inhabit the 5
Carquinez Strait. Removal of Amorco Terminal structures would result in physical harm 6
or injury fish and wildlife and increased levels of noise that could cause harm to fish and 7
wildlife. Depending on construction timing, noise levels could also impede fish migration. 8
Work that disturbs deeply buried sediments in the channel bottom could release 9
contaminated sediments from the channel floor with potential adverse effects to wildlife. 10
Removal of the structures would also remove an osprey nest site and a potential sea lion 11
haul out. Beneficially, removal of the Amorco Terminal structures would result in a small 12
but probably insignificant lessening of night lights along the Carquinez Strait. Mitigation 13
would be required to ensure that removal of the Amorco Terminal structures was 14
conducted to reduce adverse impacts to habitat and species. Appropriate mitigation 15
measures would include scheduling work to be conducted outside of crucial fish migratory 16
periods and the use of sound dampening measures for pile removal. Ultimately, any 17
Amorco Terminal removal projects would be subject to regulation under existing State 18
and federal regulations, at which point environmental review would be conducted and 19
mitigation measures developed to ensure that the project was in compliance with relevant 20
regulations. 21
Impact BIO-10: Cause impacts to the San Francisco Bay Region and associated 22
biota by decommissioning and removing the Amorco Terminal and shifting crude 23
oil imports to overland transport. (Significant and unavoidable.) 24
Under this alternative, the Amorco Terminal would not be in use, and crude oil would be 25
transported overland through a combination of rail, tanker, and/or pipeline to the Golden 26
Eagle Refinery. Decommissioning and removing the Amorco Terminal would result in the 27
same level of impacts as the No Project Alternative. In addition, the overall number of 28
vessels transiting the estuary would be reduced, though not significantly, with beneficial 29
reduction of shipping noise, sediment resuspension, and reduction in the potential for a 30
major oil spill or the introduction of nonindigenous aquatic species via ballast water or 31
vessel biofouling. 32
However, overland transportation of crude oil could result in potentially adverse 33
environmental impacts, including potential loss of habitat, impacts to riparian areas and 34
wetlands, and additional impacts to upland species. These impacts would be addressed 35
in a separate environmental review of the Project; however, while potentially subject to 36
National Environmental Policy Act review by the USACE and USFWS, development of 37
additional rail track would not be subject to CEQA review. 38
4.2 Biological Resources
February 2014 4.2-53 Amorco Marine Oil Terminal Lease Consideration Project Final EIR
Alternative 2: Restricted Lease Taking Amorco Out of Service for Oil Transport 1
Impact BIO-11: Cause impacts to the San Francisco Bay Region and associated 2
biota by shifting crude oil imports to overland transport. (Significant and 3
unavoidable.) 4
Refer to Impact BIO-10. 5
Cumulative Impact Analysis 6
The geographic context for analysis of cumulative impacts to biological resources 7
includes the San Francisco-San Pablo Bay region, Carquinez Strait, and the outer coast 8
of California. Impacts to biological resources from the Project that are less than significant 9
may become significant when combined with impacts from related projects in the region. 10
This analysis identifies cumulative impacts and evaluates whether the incremental 11
contribution of the Project to a cumulative impact would be considerable. 12
Impact CUM-BIO-1: Cause cumulative adverse impacts to special-status species, 13
biotic communities, and habitat through vessel resuspension of sediment, use of 14
bright night time lights, routine dredging, shipping noise, and potential minor oil 15
spills as a result of Amorco Terminal operations. (Less than significant.) 16
Sediment Resuspension. Large vessels traveling inside San Francisco Bay are slowly 17
guided along the navigation channels by tug boat. Because they move at speeds around 18
10 knots or less, these vessels do not typically create waves strong enough to cause 19
erosion along the shoreline. Although large vessels do resuspend sediments in the water 20
column, the waters of the San Francisco Bay Estuary tend to be turbid; therefore, the 21
incremental impact is expected not to be cumulatively considerable. 22
Light. The Project does not add additional lights to the San Francisco Bay Area. Ambient 23
night conditions in the Bay Area are already very bright, and animals and the composition 24
of the biotic community in urban settings may be habituated to bright nighttime conditions. 25
The impact from the Project is, therefore, not expected to be cumulatively considerable. 26
Dredging. Dredging could potentially contribute to cumulative impacts to special-status 27
species and habitat conversion. Every year, an average of 3 to 6 million cubic yards of 28
sediments are dredged to maintain safe navigation in and around San Francisco Bay. 29
Maintenance dredging can disturb special-status species and degrade habitat by 30
temporarily increasing turbidity, resuspending sediments, and increasing noise in the 31
dredging area. This impact would contribute cumulatively to the disturbance of sensitive 32
species in the estuary. Tesoro would conduct dredging under the provisions of the 2001 33
LTMS Management Plan, which identifies work windows during which disturbance of 34
special-status species is expected to be less than significant (USACE 2001). Therefore, 35
intermittent maintenance dredging would not contribute to a cumulatively significant 36
4.2 Biological Resources
Amorco Marine Oil Terminal Lease 4.2-54 February 2014 Consideration Project Final EIR
impact to special-status species. Dredging would cause temporary conversion of benthic 1
habitat through removal of benthic species. However, the amount of material removed 2
during each maintenance event is relatively minor. The most recent dredging event 3
occurred in 2005 and removed 500 cubic yards of material. Therefore, the contribution of 4
the Project to this impact would not be cumulatively considerable. 5
Shipping Noise. Ships are the dominant source of low-frequency noise in many highly-6
trafficked coastal zones. Although the vessel calls to the Amorco Terminal represent a 7
small fraction of the total number of vessel trips within the San Francisco Bay, the 8
temporary disturbance to aquatic habitat from increased noise has the potential to cause 9
cumulatively considerable impacts to aquatic species and habitat. However, the impacts 10
to aquatic species from the global increase in underwater sound are not well understood, 11
and there is a great deal of uncertainty regarding the risks to marine mammals and marine 12
ecosystems from underwater sound (MMC 2007). Scientific understanding of the impacts 13
of underwater sound from increased shipping is still in its infancy. The cumulative impact 14
from sound is too speculative for evaluation, and therefore this discussion is excluded, 15
per State CEQA Guidelines 15145. 16
Mitigation Measure: No mitigation required. 17
Impact CUM-BIO-2: Cause cumulative impacts to San Francisco Bay Estuary and 18
associated biota from oil spills from all marine oil terminals combined, or from all 19
tankering combined. (Significant and unavoidable.) 20
A major oil spill at the Amorco Terminal or from vessels visiting the Amorco Terminal 21
would potentially affect a wide range of marine and terrestrial biological resources. As 22
discussed in Section 4.1, Operation Safety/Risk of Accidents, operations associated with 23
the Amorco Terminal contribute incrementally to the cumulative risk of an oil spill. Vessel 24
traffic associated with the Amorco Terminal is approximately 4.7 percent of the total 25
probability of a spill from tanker and tank barge traffic in the San Francisco Bay. Among 26
the facilities with potential to contribute to the accidental release of petroleum products 27
are the Chevron Richmond Refinery Long Wharf Terminal, Tesoro Avon Marine Terminal, 28
and the Plains All American Martinez Marine Terminal. As discussed in Impact BIO-6, 29
major spills of fuel, crude oil, or other materials can be expected to have serious adverse 30
effects on species and habitat. Migration of special-status species could be halted and 31
spawning grounds degraded, and critical habitat for listed species would be adversely 32
affected and degraded. Two major spills into the San Francisco Bay Estuary from different 33
sources within the same season would cause even greater adverse impacts to the biota 34
and habitats. Mitigation Measures BIO-6a through BIO-6c collectively aid in the 35
prevention and cleanup of accidental releases of oil spills; however, a major spill could 36
have a residual impact following spill response and cleanup. Therefore, the impact would 37
be cumulatively considerable and significant cumulative impacts would occur from 38
implementation of the Project. 39
4.2 Biological Resources
February 2014 4.2-55 Amorco Marine Oil Terminal Lease Consideration Project Final EIR
Mitigation Measure: No additional mitigation measures available. 1
Impact CUM-BIO-3: Cause cumulative impacts by increasing the risk of 2
introduction of nonindigenous aquatic species from vessel traffic to San Francisco 3
Bay. (Significant and unavoidable). 4
The California Ballast Water Management for Control of Nonindigenous Species Act of 5
1999, as revised and reauthorized by the Marine Invasive Species Act of 2003 (Pub. 6
Resources Code §§ 71200 to 71271) specify required ballast water and vessel biofouling 7
management practices. These laws and associated regulations were developed to 8
prevent future introductions of nonindigenous species to California waters. Prior to the 9
introduction of these management practices, however, a considerable number of 10
nonindigenous species have been introduced in to the San Francisco Bay Estuary, 11
resulting in a realignment of the biotic communities in the bay. All commercial vessel 12
traffic to the San Francisco Bay has the potential to introduce nonindigenous aquatic 13
species. Although vessels that call at the Terminal are required to comply with federal 14
and State provisions, compliance with the current regulations is not enough to ensure full 15
mitigation of this impact. Thus significant cumulative impacts would occur even with 16
implementation of mitigation measures BIO-7a and BIO-7b. 17
Mitigation Measure: No additional mitigation measures available. 18
Impact CUM-BIO-4: Cause cumulative impacts to the biota of the San Francisco 19
Bay Estuary resulting from degradation of water quality from vessels visiting the 20
Amorco Terminal that are coated with antifouling paints. (Less than significant.) 21
Ships that travel through marine environments are subject to a natural process known as 22
biofouling. Biofouling causes drag, which reduces ship speed and increases fuel 23
expenditure. To inhibit fouling, most vessels visiting the San Francisco Bay use biocidal 24
antifouling coatings that may release copper from the vessel’s surface into the 25
surrounding water. Levels of the biocide are higher next to the hull and decrease rapidly 26
with distance from the vessel. By design, small organisms are directly affected by the 27
biocides contained in antifouling coatings. Larger organisms are less susceptible to injury 28
from the small amount of direct exposure to biocides, but may be affected through the 29
bioaccumulation of biocides in their trophic environment. 30
The greatest contributor of copper to the San Francisco Bay Estuary is from Central Valley 31
rivers, local watershed sources, and erosion of buried sediment (see Table 4.2-7; Looker 32
2007). Ninety percent of biocide-based coatings on oil tankers entering California’s water 33
are copper-based and approximately 8 percent use biocide-free coatings (CSLC 2009). 34
Between 2000 and 2004, antifouling marine coatings loaded approximately 25 kilograms 35
of copper into the San Francisco Bay each day, about 2 percent of the daily load (Looker 36
2007). The Amorco Terminal receives approximately 90 vessel visits a year, which is a 37
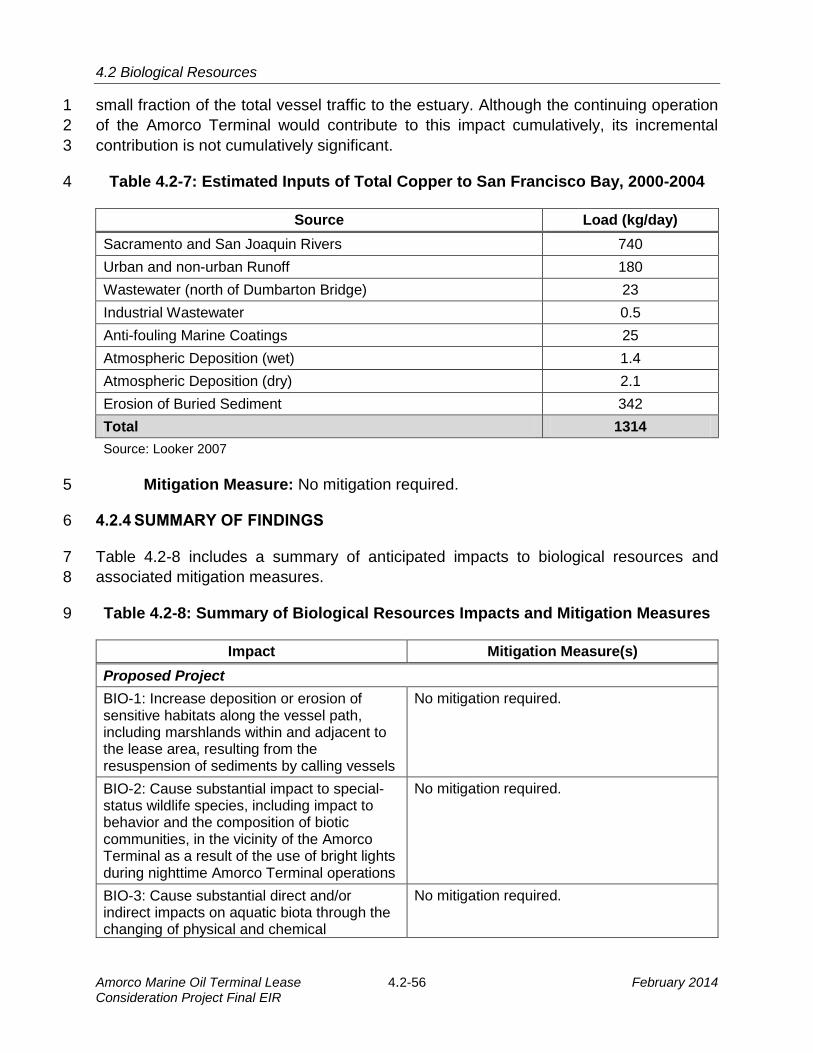
4.2 Biological Resources
Amorco Marine Oil Terminal Lease 4.2-56 February 2014 Consideration Project Final EIR
small fraction of the total vessel traffic to the estuary. Although the continuing operation 1
of the Amorco Terminal would contribute to this impact cumulatively, its incremental 2
contribution is not cumulatively significant. 3
Table 4.2-7: Estimated Inputs of Total Copper to San Francisco Bay, 2000-2004 4
Source Load (kg/day)
Sacramento and San Joaquin Rivers 740
Urban and non-urban Runoff 180
Wastewater (north of Dumbarton Bridge) 23
Industrial Wastewater 0.5
Anti-fouling Marine Coatings 25
Atmospheric Deposition (wet) 1.4
Atmospheric Deposition (dry) 2.1
Erosion of Buried Sediment 342
Total 1314
Source: Looker 2007
Mitigation Measure: No mitigation required. 5
4.2.4 SUMMARY OF FINDINGS 6
Table 4.2-8 includes a summary of anticipated impacts to biological resources and 7
associated mitigation measures. 8
Table 4.2-8: Summary of Biological Resources Impacts and Mitigation Measures 9
Impact Mitigation Measure(s)
Proposed Project
BIO-1: Increase deposition or erosion of sensitive habitats along the vessel path, including marshlands within and adjacent to the lease area, resulting from the resuspension of sediments by calling vessels
No mitigation required.
BIO-2: Cause substantial impact to special-status wildlife species, including impact to behavior and the composition of biotic communities, in the vicinity of the Amorco Terminal as a result of the use of bright lights during nighttime Amorco Terminal operations
No mitigation required.
BIO-3: Cause substantial direct and/or indirect impacts on aquatic biota through the changing of physical and chemical
No mitigation required.
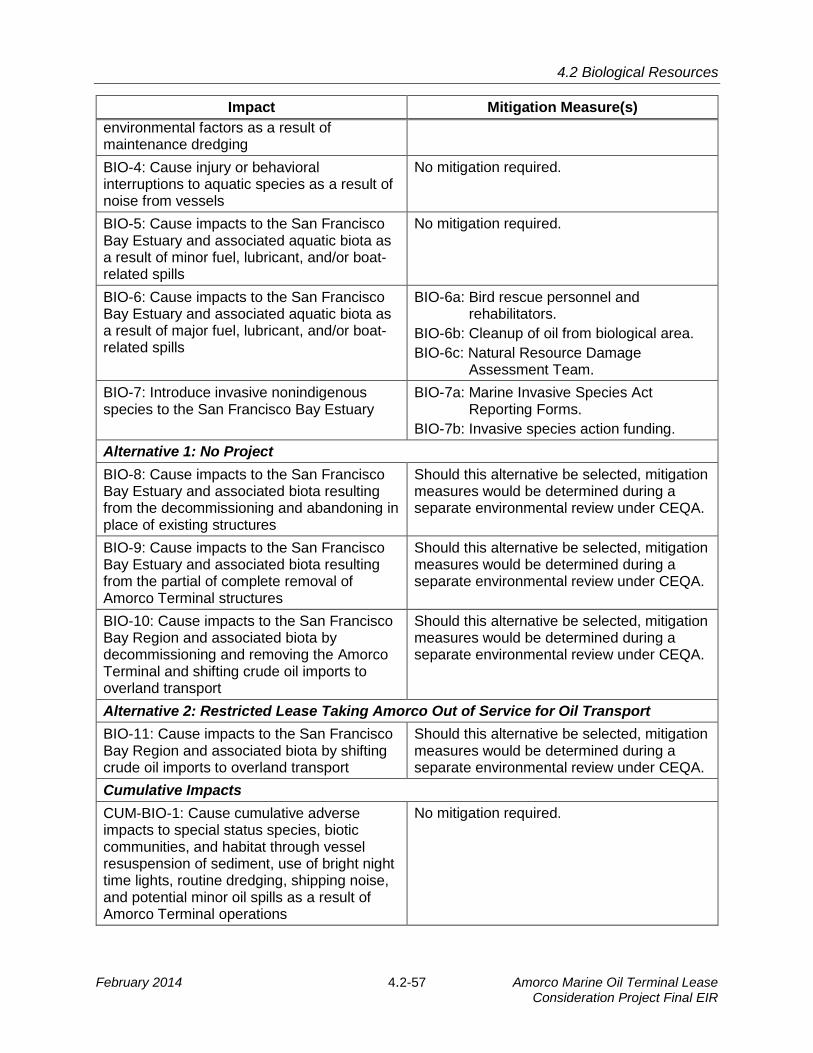
4.2 Biological Resources
February 2014 4.2-57 Amorco Marine Oil Terminal Lease Consideration Project Final EIR
Impact Mitigation Measure(s)
environmental factors as a result of maintenance dredging
BIO-4: Cause injury or behavioral interruptions to aquatic species as a result of noise from vessels
No mitigation required.
BIO-5: Cause impacts to the San Francisco Bay Estuary and associated aquatic biota as a result of minor fuel, lubricant, and/or boat-related spills
No mitigation required.
BIO-6: Cause impacts to the San Francisco Bay Estuary and associated aquatic biota as a result of major fuel, lubricant, and/or boat-related spills
BIO-6a: Bird rescue personnel and rehabilitators.
BIO-6b: Cleanup of oil from biological area.
BIO-6c: Natural Resource Damage Assessment Team.
BIO-7: Introduce invasive nonindigenous species to the San Francisco Bay Estuary
BIO-7a: Marine Invasive Species Act Reporting Forms.
BIO-7b: Invasive species action funding.
Alternative 1: No Project
BIO-8: Cause impacts to the San Francisco Bay Estuary and associated biota resulting from the decommissioning and abandoning in place of existing structures
Should this alternative be selected, mitigation measures would be determined during a separate environmental review under CEQA.
BIO-9: Cause impacts to the San Francisco Bay Estuary and associated biota resulting from the partial of complete removal of Amorco Terminal structures
Should this alternative be selected, mitigation measures would be determined during a separate environmental review under CEQA.
BIO-10: Cause impacts to the San Francisco Bay Region and associated biota by decommissioning and removing the Amorco Terminal and shifting crude oil imports to overland transport
Should this alternative be selected, mitigation measures would be determined during a separate environmental review under CEQA.
Alternative 2: Restricted Lease Taking Amorco Out of Service for Oil Transport
BIO-11: Cause impacts to the San Francisco Bay Region and associated biota by shifting crude oil imports to overland transport
Should this alternative be selected, mitigation measures would be determined during a separate environmental review under CEQA.
Cumulative Impacts
CUM-BIO-1: Cause cumulative adverse impacts to special status species, biotic communities, and habitat through vessel resuspension of sediment, use of bright night time lights, routine dredging, shipping noise, and potential minor oil spills as a result of Amorco Terminal operations
No mitigation required.
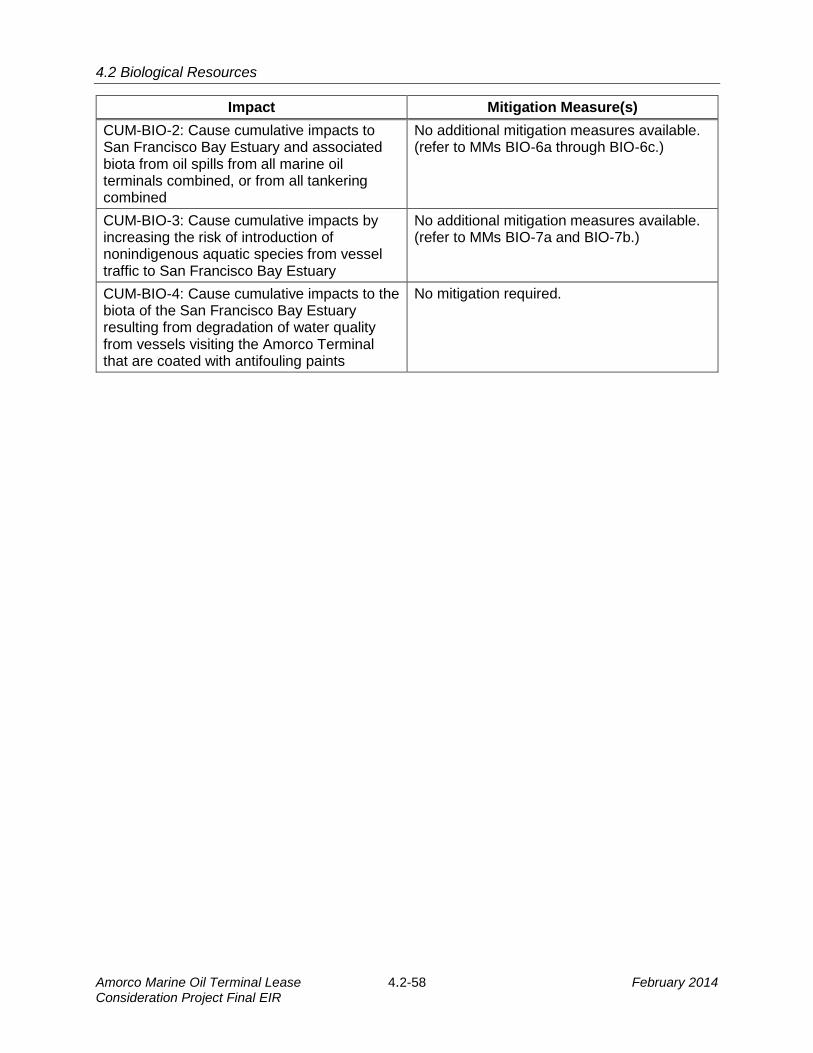
4.2 Biological Resources
Amorco Marine Oil Terminal Lease 4.2-58 February 2014 Consideration Project Final EIR
Impact Mitigation Measure(s)
CUM-BIO-2: Cause cumulative impacts to San Francisco Bay Estuary and associated biota from oil spills from all marine oil terminals combined, or from all tankering combined
No additional mitigation measures available. (refer to MMs BIO-6a through BIO-6c.)
CUM-BIO-3: Cause cumulative impacts by increasing the risk of introduction of nonindigenous aquatic species from vessel traffic to San Francisco Bay Estuary
No additional mitigation measures available. (refer to MMs BIO-7a and BIO-7b.)
CUM-BIO-4: Cause cumulative impacts to the biota of the San Francisco Bay Estuary resulting from degradation of water quality from vessels visiting the Amorco Terminal that are coated with antifouling paints
No mitigation required.