4.10 Cost - Sacramento/media/Corporate/Files/Public-W… · October 2004) the Project Team outlined...
17
City of Sacramento Sacramento Intermodal Transportation Facility TR #9 SITF Alternatives SMWM/Arup and Associated Consultants September 29, 2004 Page 174 4.10 Cost Introduction This section presents the preliminary conceptual construction cost estimates of the four alternatives for the development of the Sacramento Intermodal Transit Facility. The costs for each alternative includes the renovation and seismic upgrade of the existing Historic Depot, additional terminal facilities, new bus and LRT facilities, and relocation of the existing mainline rails and platforms, together with necessary revision to roads and utilities. Allowance for temporary facilities during the phasing of the project is also included, as well as allowances for development of the scope, pre-construction soft costs, and construction stage soft costs. It should be noted that costs for all alternatives are developed for comparative purposes only, to an order of magnitude level, that cost differentials between the alternatives approach the margin of error for this study, and are not total project costs. See Section 4.11 discussion of total project costs. Cost Estimate Assumptions In calculating the capital costs, the Project Team used the following assumptions and qualifications: • The estimates are based on preliminary drawings for the four alternatives, indicating the required permanent and temporary work for each alternative. • The cost of the seismic upgrade work to the existing Depot building is based on a previous seismic upgrade study. Base isolation is not included in the cost estimates for any of the alternatives. • Cost escalation is based on preliminary schedules indicating start of work on site in January 2008. • Joint Development parcels will be let as separate projects, and are not included. • Streets required by the SITF Terminal have been costed, including an allowance for typical street utilities. Streets required for Joint Development parcels only are not included. • The 6th Street underpass beneath the proposed heavy rail alignment is included for Overland Limited and Valley Flyer, however these underpasses are not costed beyond the boundary of the heavy rail ROW. • Sunset Limited and Sacramento Northern alternatives do not include the 6th Street overpass. • Utility relocations have not been calculated explicitly for each alternative; however relocation allowances have been made based on historical cost data from similar site development projects. • The cost of land acquisition is not included. • The reconfiguration of the I-5 interchange is not included. Figure 4.10.1: Illustrates the extent of the project area included in the conceptual cost estimates. Preliminary Order of Magnitude Project Costs The estimated cost of the four alternatives is presented below in Table 4.10.1. It should be noted that Phase 5 incorporates the I-5 interchange reconfiguration, which is not included in the cost estimate. A sub-alternative for Sacramento Northern without the underground parking component is included for comparison. This sub-alternative would include approximately 300 parking spaces above the intercity bus facility.
Transcript of 4.10 Cost - Sacramento/media/Corporate/Files/Public-W… · October 2004) the Project Team outlined...

City of Sacramento Sacramento Intermodal Transportation Facility TR #9
SITF Alternatives
SMWM/Arup and Associated Consultants
September 29, 2004Page 174
4.10 Cost
Introduction This section presents the preliminary conceptual construction cost estimates of the four alternatives for the development of the Sacramento Intermodal Transit Facility. The costs for each alternative includes the renovation and seismic upgrade of the existing Historic Depot, additional terminal facilities, new bus and LRT facilities, and relocation of the existing mainline rails and platforms, together with necessary revision to roads and utilities. Allowance for temporary facilities during the phasing of the project is also included, as well as allowances for development of the scope, pre-construction soft costs, and construction stage soft costs. It should be noted that costs for all alternatives are developed for comparative purposes only, to an order of magnitude level, that cost differentials between the alternatives approach the margin of error for this study, and are not total project costs. See Section 4.11 discussion of total project costs.
Cost Estimate Assumptions In calculating the capital costs, the Project Team used the following assumptions and qualifications:
• The estimates are based on preliminary drawings for the four alternatives, indicating the required permanent and temporary work for each alternative.
• The cost of the seismic upgrade work to the existing Depot building is based on a previous seismic upgrade study. Base isolation is not included in the cost estimates for any of the alternatives.
• Cost escalation is based on preliminary schedules indicating start of work on site in January 2008.
• Joint Development parcels will be let as separate projects, and are not included.
• Streets required by the SITF Terminal have been costed, including an allowance for typical street utilities. Streets required for Joint Development parcels only are not included.
• The 6th Street underpass beneath the proposed heavy rail alignment is included for Overland Limited and Valley Flyer, however these underpasses are not costed beyond the boundary of the heavy rail ROW.
• Sunset Limited and Sacramento Northern alternatives do not include the 6th Street overpass.
• Utility relocations have not been calculated explicitly for each alternative; however relocation allowances have been made based on historical cost data from similar site development projects.
• The cost of land acquisition is not included.
• The reconfiguration of the I-5 interchange is not included.
Figure 4.10.1: Illustrates the extent of the project area included in the conceptual cost estimates.
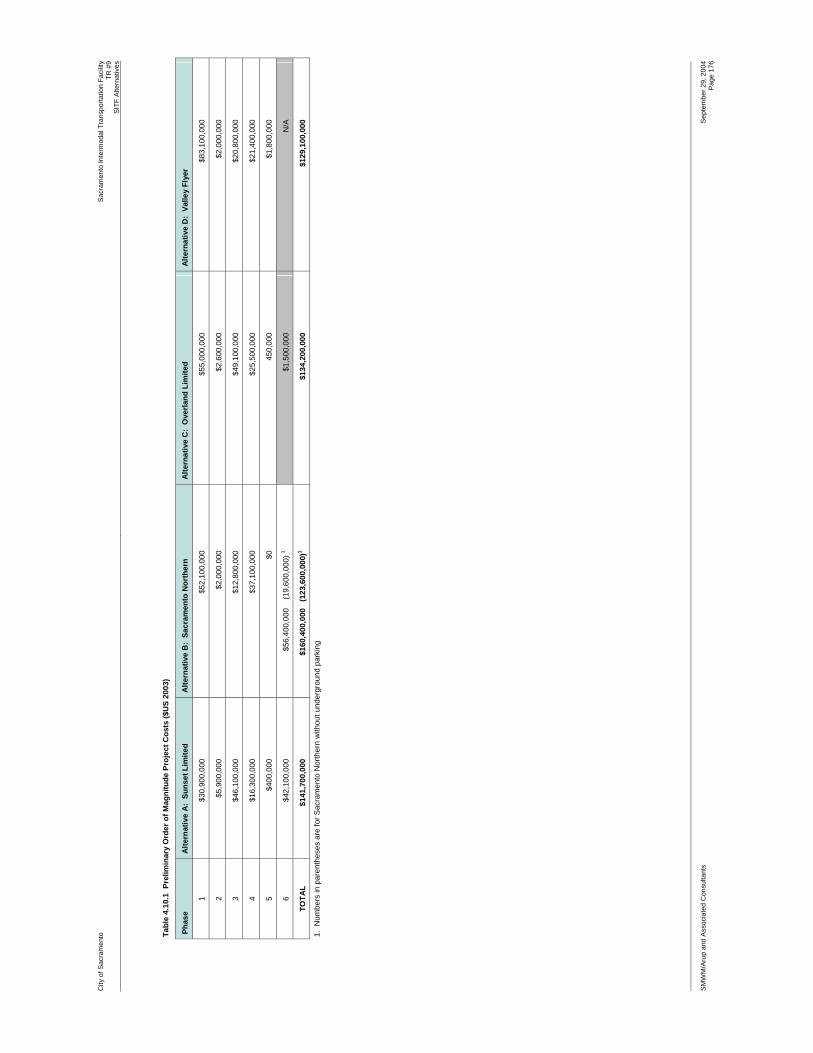
Preliminary Order of Magnitude Project Costs The estimated cost of the four alternatives is presented below in Table 4.10.1. It should be noted that Phase 5 incorporates the I-5 interchange reconfiguration, which is not included in the cost estimate.
A sub-alternative for Sacramento Northern without the underground parking component is included for comparison. This sub-alternative would include approximately 300 parking spaces above the intercity bus facility.
City of Sacramento Sacramento Intermodal Transportation Facility TR #9
SITF Alternatives
SMWM/Arup and Associated Consultants
September 29, 2004Page 175
The costing analysis shows that the alternatives have capital costs of the same order of magnitude, within approximately 25% of each other.
City
of S
acra
men
to
Sacr
amen
to In
term
odal
Tra
nspo
rtatio
n Fa
cilit
y
TR #
9SI
TF A
ltern
ativ
es S
MW
M/A
rup
and
Ass
ocia
ted
Con
sulta
nts
Sept
embe
r 29,
200
4Pa
ge 1
76
Tabl
e 4.
10.1
Pre
limin
ary
Ord
er o
f Mag
nitu
de P
roje
ct C
osts
($U
S 20
03)
Phas
e A
ltern
ativ
e A
: Su
nset
Lim
ited
Alte
rnat
ive
B:
Sacr
amen
to N
orth
ern
Alte
rnat
ive
C:
Ove
rland
Lim
ited
Alte
rnat
ive
D:
Valle
y Fl
yer
1 $3
0,90
0,00
0 $5
2,10
0,00
0 $5
5,00
0,00
0 $8
3,10
0,00
0
2 $5
,900
,000
$2
,000
,000
$2
,600
,000
$2
,000
,000
3 $4
6,10
0,00
0 $1
2,80
0,00
0 $4
9,10
0,00
0 $2
0,80
0,00
0
4 $1
6,30
0,00
0 $3
7,10
0,00
0 $2
5,50
0,00
0 $2
1,40
0,00
0
5 $4
00,0
00
$0
450,
000
$1,8
00,0
00
6 $4
2,10
0,00
0 $5
6,40
0,00
0
(19,
600,
000)
1 $1
,500
,000
N
/A
TOTA
L $1
41,7
00,0
00
$160
,400
,000
(1
23,6
00,0
00)1
$134
,200
,000
$1
29,1
00,0
00
1. N
umbe
rs in
par
enth
eses
are
for S
acra
men
to N
orth
ern
with
out u
nder
grou
nd p
arki
ng

arch
itec
ture
inte
rio
rsp
lan
nin
gg
rap
hic
des
ign
SACRAMENTO INTERMODAL TRANSPORTATION FACILITY
Alternative A-D Cost Boundaries
Figure 4.10.18 October 2004
Clie
nt
City
of
Sacr
amen
to
Co
nsu
ltan
t Te
am
SMW
M /
Aru
p
Aca
nthu
s
CH
S C
onsu
lting
Gro
up
CH
2MH
ill
Han
scom
b Fa
ithfu
l & G
ould
The
Hoy
t C
ompa
ny
Jone
s La
ng L
asal
le
LTK
Eng
inee
ring
Serv
ices
Nel
son/
Nyg
aard
Sim
pson
Gum
pert
z &
Heg
er, I
nc.
GS
TR
EE
T
IS
TR
EE
T
HS
TR
EE
T
6THSTREET
3RDSTREET
7THSTREET
PA
RK
DE
VE
LOP
ME
NT
DE
VE
LOP
ME
NT
RA
ILR
OA
DT
EC
HN
OLO
GY
MU
SE
UM
NE
WR
AM
PS
PEDCROSS
FE
DE
RA
LB
UIL
DIN
G
RE
AB
LDG
.
FE
DE
RA
LB
UIL
DIN
G
RA
ILR
OA
DT
EC
HN
OLO
GY
MU
SE
UM
NE
WR
AM
PS
RE
AB
LDG
.
6THSTREETUNDERPASS
G
FS
TR
EE
T
GS
TR
EE
T
IS
TR
EE
T
HS
TR
EE
T
6THSTREET
7THSTREET
3RDSTREET
RE
AB
LDG
.
FE
DE
RA
LB
UIL
DIN
G
RA
ILR
OA
DTE
CH
NO
LOG
YM
USE
UM
DE
VE
LOP
ME
NT
GS
TR
EE
T
HS
TR
EE
T
IS
TR
EE
T
DE
VE
LOP
ME
NT
DE
VE
LOP
ME
NT
DE
VE
LOP
ME
NT
5THSTREET
6THSTREET
7THSTREET
8THSTREET
SA
CR
AM
EN
TO
RIV
ER
RA
MP
SU
PT
OP
LAT
FO
RM
S
6THSTREET
7THSTREET
4THSTREETPEDCROSSING
3RDSTREET
IS
TR
EE
T
DE
VE
LOP
ME
NT
DE
VE
LOP
ME
NT
DE
VE
LOP
ME
NT
RA
ILR
OA
DTE
CH
NO
LOG
YM
USE
UM
GS
TR
EE
T
HS
TR
EE
T
5THSTREETR
EA
BLD
G.
FE
DE
RA
LB
UIL
DIN
GN
EW
RA
MP
S
ONLYS
TA
IRS
+E
SC
ALA
TO
RS
FS
TR
EE
T
5THSTREET
R
HEA
VYRA
ILR.O
.W.
/D
EV
ELO
PM
EN
T
DE
VE
LOP
ME
NT
CO
NC
OU
RS
EA
BO
VE
EL E
VA
TO
RS
TO
PLA
TF
OR
MS
NG
ST
AIR
S+
ES
CA
LAT
O
BUSONLY
ONLY
K/
D
IIN
HE
AV
YR
AIL
R.O
.W.
RT
BU
S
CR O SSINN
LRT
PLA
TFO
RM
S
SSTT
AIR
S+
ES
CA
LAT
OR
S
CO
AB
N G
Par
kin
g-
13
5S
pac
es
pe
rfl
oo
r
EA
VY
RA
ILR
.O.W
.
JOIN
TD
EV
ELO
PM
EN
T
LLLRRRTTTPPPLLLAAATTTFFFOOORRRMMMSSS
FS
TR
EEEEE
TTT
4THSTREET
3RDSTREET
EEAAAA
VVVVVYYYY
RRRRAAAA
IILL
3RDSTREET
PA
SSE
X
FS
TR
EEE
T
BU
SA
ND
LRT
ON
LY
PA
RK
ING
BU
BBU
G
3RDSTREET
D
BUSONL
0
100'
200'
300'
400'
Sca
le
0
100'
200'
300'
400'
Sca
le
0
100'
200'
300'
400'
Sca
le
0
100'
200'
300'
400'
Sca
le
SSA
CR
AM
EN
TO
NO
RT
HE
RN
-2
9A
CR
ES
SU
NS
ET
LIM
ITE
D-2
8A
CR
ES
VA
LLE
YF
LYE
R-
35
AC
RE
SO
VE
RLA
ND
LIM
ITE
D-
35
AC
RE
S
N NNN
City of Sacramento Sacramento Intermodal Transportation Facility TR #9
SITF Alternatives
SMWM/Arup and Associated Consultants
September 29, 2004
Page 178
4.11 Funding and Revenue Opportunities
In Technical Report #6, Chapters 6 and 7 “Joint Development Issues and Opportunities” (dated 08 October 2004) the Project Team outlined the advantages of joint development. These advantages include increased ridership on transit, additional sources of revenues from rents, parking, advertising and special events. Community benefits include immediate and safe access to transit for tenants and residents of the district, additional services for transit users, and additional mixed-use projects in the area that will complement adjacent land uses.
For the purposes of comparing the alternative designs, the joint development opportunities are segmented between those within the terminal building versus those on separate sites or within the Railyards development area. For those opportunities within the terminal building, the likely revenue streams and capital costs are evaluated in detail. For those on separate sites, the direct economic benefit to the SITF will be realized by capturing Transportation Impact Fees (TIF) from the development and Tax Increments (TI) from the increases in property values. As a result, those joint development opportunities are considered in conjunction with the Railyards development and modeled for their contributions of TIF and TI funds to support debt service for the SITF.
Examples of joint development within the terminal building include the following:
• Public meeting/Museum
• Chamber of Commerce Offices
• Coffee bar
• Bookstore/Convenience Shops
• Restaurant
• Food Court
• Commercial office
Examples of joint development opportunities on the remaining project site and in the Railyards include the following:
• Office building
• Residential development
• Hotel development
• Mixed use development with various combinations of retail, housing, and commercial space
The Project Team evaluated the capital costs, operating costs and joint development revenues for each alternative. The following section 4.11.1 provides an overview of the revenue, capital and operating costs for each alternative and discusses the assumptions and risks of each.
4.11.1 Spreadsheet Cost Model A comprehensive spreadsheet model was created for each of the four alternative designs, with the details to be provided separately. The model consists of the following primary components:
• Summary of Operating Cash Flows including Debt Service
• Operating Assumptions including Lease Revenue and Operating Costs
• Sources of Funds including potential Grants, Bonds and Loans
• Tax Increments and Transportation Impact Fees anticipated
City of Sacramento Sacramento Intermodal Transportation Facility TR #9
SITF Alternatives
SMWM/Arup and Associated Consultants
September 29, 2004
Page 179
• Detailed Program Summary
• Detailed Cost Estimate and Cash Flow Projections
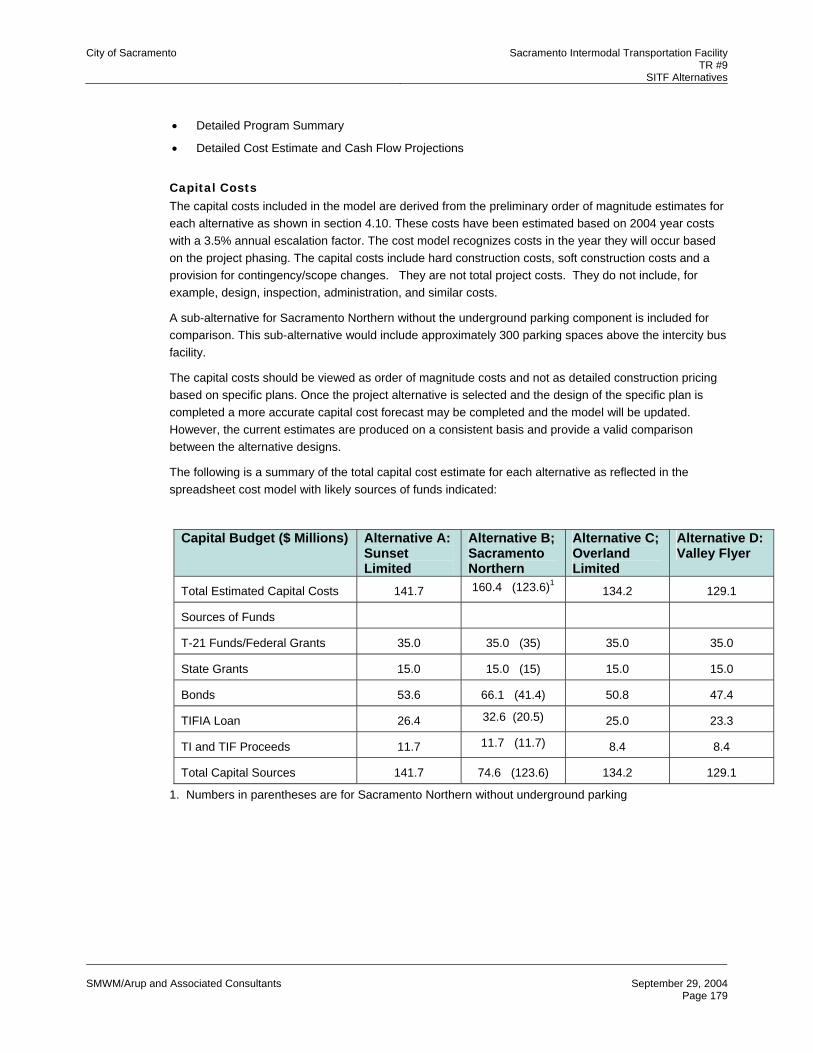
Capital Costs The capital costs included in the model are derived from the preliminary order of magnitude estimates for each alternative as shown in section 4.10. These costs have been estimated based on 2004 year costs with a 3.5% annual escalation factor. The cost model recognizes costs in the year they will occur based on the project phasing. The capital costs include hard construction costs, soft construction costs and a provision for contingency/scope changes. They are not total project costs. They do not include, for example, design, inspection, administration, and similar costs.
A sub-alternative for Sacramento Northern without the underground parking component is included for comparison. This sub-alternative would include approximately 300 parking spaces above the intercity bus facility.
The capital costs should be viewed as order of magnitude costs and not as detailed construction pricing based on specific plans. Once the project alternative is selected and the design of the specific plan is completed a more accurate capital cost forecast may be completed and the model will be updated. However, the current estimates are produced on a consistent basis and provide a valid comparison between the alternative designs.
The following is a summary of the total capital cost estimate for each alternative as reflected in the spreadsheet cost model with likely sources of funds indicated:
Capital Budget ($ Millions) Alternative A: Sunset Limited
Alternative B; Sacramento Northern
Alternative C; Overland Limited
Alternative D: Valley Flyer
Total Estimated Capital Costs 141.7 160.4 (123.6)1 134.2 129.1
Sources of Funds
T-21 Funds/Federal Grants 35.0 35.0 (35) 35.0 35.0
State Grants 15.0 15.0 (15) 15.0 15.0
Bonds 53.6 66.1 (41.4) 50.8 47.4
TIFIA Loan 26.4 32.6 (20.5) 25.0 23.3
TI and TIF Proceeds 11.7 11.7 (11.7) 8.4 8.4
Total Capital Sources 141.7 74.6 (123.6) 134.2 129.1
1. Numbers in parentheses are for Sacramento Northern without underground parking

City of Sacramento Sacramento Intermodal Transportation Facility TR #9
SITF Alternatives
SMWM/Arup and Associated Consultants
September 29, 2004
Page 180
Operating Costs
The operating costs have been developed based on the proposed use of the facility and the project team’s experience in managing and operating similar facilities. The operating costs have been adjusted to reflect local market costs for a facility subject to intense public use. The terminal building is planned to house terminal operator functions, food service, convenience retail and commercial office uses. It is assumed the terminal building will be operational approximately 18 hrs per day. Operating costs have been estimated in 2004 dollars and an escalation factor of 3% has been built into the cost model. This escalation factor is slightly lower than the inflation projected for the capital expenditures noted above, as operating costs tend to be less volatile than capital expenditures over the projected time periods. The operating revenues in the model are projected to year 2038, which assumes initial construction completion to allow substantial operation of the facility in 2009. The model could be adjusted for differing assumptions for initial operations, but these adjustments would not impact the relative costs for the various alternatives.
The areas for each major program element (in square feet) for the terminal building and a projection of revenues and operating costs for a typical stabilized year (2016 for this purpose) are reflected in the following table:
Item Alternative A: Sunset Limited
Alternative B; Sacramento Northern
Alternative C; Overland Limited
Alternative D: Valley Flyer
Transit Program 64,240 58,470 63,675 63,707
Joint Development - Retail 15,000 15,000 15,000 15,000
Joint Development – Office/Public 91,260 20,679 4,087 4,087
Total Building (Rentable) 170,500 94,149 82,762 82,794
Revenues ($Millions)
Joint Development Leases 4.9 1.8 (1.8)1 1.0 1.0
Transit Leases 3.9 3.6 (3.6) 3.4 3.6
Parking 2.1 2.3 (0.7) 2.6 2.8
Advertising 0.1 0.1 (0.1) 0.1 0.1
Less Vacancies -0.6 -0.4 (-0.4) -0.4 -0.4
Total Revenue 10.4 188,300.6 (5.9) 6.7 7.1
Operating Expenses ($ Millions) -4.4 -3.2 (-2.3) -2.7 -2.9
Net Operating Income ($Millions) 6.0 4.2 (3.6) 4.0 4.2
Debt Service Requirements ($Millions)
7.8 10.1 (6.7) 8.4 8.3
1. Numbers in parentheses are for Sacramento Northern without underground parking

City of Sacramento Sacramento Intermodal Transportation Facility TR #9
SITF Alternatives
SMWM/Arup and Associated Consultants
September 29, 2004
Page 181
Joint Development Revenues The joint development revenues within the terminal buildings have been based on market rate rents for each use based on 2004 dollars. Periodic lease rate adjustments are based on cost increases of 3% per year. It is assumed that the terminal operators will pay market rents based on their allocated space in the terminal building and, where dedicated site facilities are required for transit operators, a nominal rental rate for “site use” such as platforms and baggage handling areas has been included. Specific lease rates for transit functions should be reviewed carefully with City staff to ensure consistency with any existing policies.
Parking revenues have been estimated based on market parking rates for monthly and daily parking. For the purposes of the model, the majority of the space has been allocated as “daily” parking with “monthly” parking limited to spaces to service office functions. A fifteen percent vacancy factor has been estimated, and the daily parking accounts for only 5 days per week, with weekend parking revenues helping to offset potential higher vacancies.
One of the major risks associated with the cost model is the ability to negotiate market rental agreements with the transit operators. It is understood that existing rental agreements will not be binding on the City once the City takes ownership of the Terminal building. Currently some operators pay virtually no rent or below market rates for their facilities. To the extent that the city would negotiate less than market rental rates for operators or agree to subsidize operator rents, the net operating income will be less and the funds available to service debt will be further reduced.
It is assumed that Regional Transit Light Rail and Amtrak Passenger rail will not pay rent for rail space and will be solely responsible for the operation and maintenance of these areas.
Finally, as indicated in the table above for each alternative, the net operating revenues are insufficient to support the debt service and must be supplemented with public funds. The Transportation Impact Fees and the Tax Increment generated from the Joint Development on other parcels and in the Railyards area will be utilized to provide this additional support. The degree to which each alternative relies on these sources is a key measure of the financial viability of each option, and a comparison of the alternatives on this basis is presented in a subsequent paragraph.
Potential Public and Private Funding Sources Capital funding for the SITF will come from a variety of sources, including federal, state, and local funds, and fees and taxes generated by development in and around the Railyards, and from operating income generated by the SITF itself. This analysis estimates the magnitude of funds that may be available from a variety of funding sources. At this stage in the analysis, the exact timing and amount of any source of funding is difficult to estimate, but this analysis provides a starting point in the effort to devise a reasonable funding scenario for a complex project that will be implemented over a period of many years.
Locally Generated Funds – Assumptions Development of the Railyards and adjacent areas will help fund the capital costs of the SITF through the generation of transportation impact fees and tax increment. For this analysis, it is assumed that funds generated within an area defined by the Railyards, the Richards Boulevard Redevelopment Area and the Downtown Redevelopment Area will all be available to help fund the construction of the SITF.
Two development scenarios were created, one in which the Millennia project begins in 2008, and a second in which the development of the Railyards is delayed for four years, starting in 2013. The same development program is assumed for each.
The construction and absorption of office, residential, retail, and hotel space estimated for the 30 year period (2008-2038) for the area was estimated based on the following assumptions:
City of Sacramento Sacramento Intermodal Transportation Facility TR #9
SITF Alternatives
SMWM/Arup and Associated Consultants
September 29, 2004
Page 182
1. The Millennia project in the Railyards area will be constructed and absorbed by the market between 2008 and 2026, and will produce a total of 4.95 million square feet of office (2 million of which is public-sector office) and 5,040 housing units, along with smaller amounts of retail, hotel, and institutional development. The absorption schedule follows that assumed by Keyser Marston Associates in the Analysis of a Sacramento Sports and Entertainment District (Oct 03).
2. The amount of office, residential, retail, and hotel space projected in the Richards Boulevard Redevelopment Area is in accord with the 1997 Finance Plan for the redevelopment area, and generally follows the phasing schedule projected by that plan. An absorption schedule allows near project completion by 2038.
3. For the purpose of this analysis only, downtown is assumed built-out, with the exception of some remaining development of office space.
4. Total private office space absorption is constrained by a ceiling of 225,000 square feet per year through 2010, 250,000 square feet through 2025, and 300,000 square feet per year thereafter. (This absorption schedule is based on the KMA SED study referenced above). Office space is projected to be absorbed first in the Railyards, with any excess split between the Downtown Redevelopment Area and Richards Boulevard Redevelopment area. No office development projected for the “Downtown” market area is assumed for areas outside these three sub markets. Even at the end of 30 years, the office supply of the Richards Redevelopment plan area will not be completely built out.
5. Nearly 9000 residential units are projected in the Railyards and Richards Boulevard Redevelopment Area plans. This analysis assumes they will all be absorbed within the 30-year projection period. At an average rate of 300 per year, this is well in excess of current SACOG projections for the area of about 50 units per year between now and 2025.
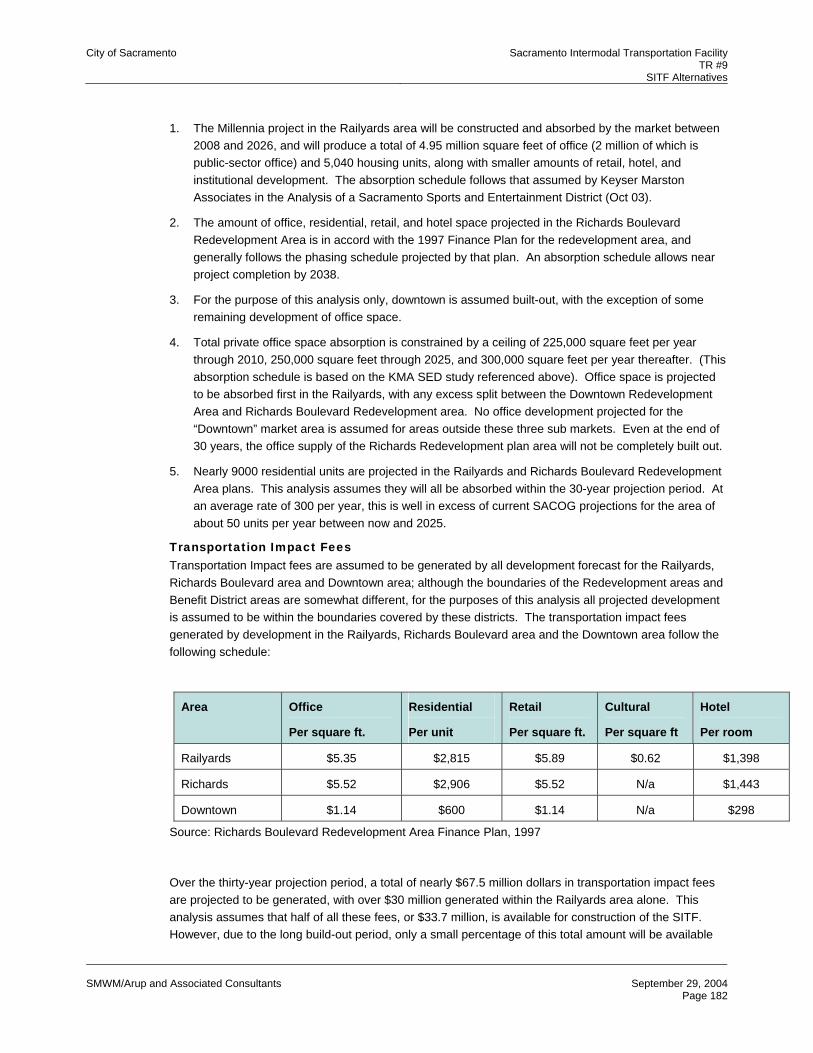
Transportation Impact Fees Transportation Impact fees are assumed to be generated by all development forecast for the Railyards, Richards Boulevard area and Downtown area; although the boundaries of the Redevelopment areas and Benefit District areas are somewhat different, for the purposes of this analysis all projected development is assumed to be within the boundaries covered by these districts. The transportation impact fees generated by development in the Railyards, Richards Boulevard area and the Downtown area follow the following schedule:
Area Office
Per square ft.
Residential
Per unit
Retail
Per square ft.
Cultural
Per square ft
Hotel
Per room
Railyards $5.35 $2,815 $5.89 $0.62 $1,398
Richards $5.52 $2,906 $5.52 N/a $1,443
Downtown $1.14 $600 $1.14 N/a $298
Source: Richards Boulevard Redevelopment Area Finance Plan, 1997
Over the thirty-year projection period, a total of nearly $67.5 million dollars in transportation impact fees are projected to be generated, with over $30 million generated within the Railyards area alone. This analysis assumes that half of all these fees, or $33.7 million, is available for construction of the SITF. However, due to the long build-out period, only a small percentage of this total amount will be available
City of Sacramento Sacramento Intermodal Transportation Facility TR #9
SITF Alternatives
SMWM/Arup and Associated Consultants
September 29, 2004
Page 183
prior to or during construction of the SITF. Between 2008 and 2012, transportation impact fees will generate only $9.6 million if the Millennia development proceeds on schedule, and nothing during this period if the Railyards development is delayed.
Redevelopment Tax Increment Redevelopment Tax Increment will be generated by new development and by the increasing assessed value of existing development in the collected the Railyards, as well as the Richards Boulevard and Downtown Redevelopment Areas. For the purposes of this analysis, the tax increment generated by new development, and its subsequent increase in assessed valuation, is estimated for the thirty-year projection period. The existing resources of the Richards Boulevard and Downtown redevelopment areas are not assessed.
During the projection period, the addition of nearly 7 million square feet of office space, almost 9000 new residential units, more than a half a million square feet of retail, and 800 hotel rooms will add over $4.3 billion (in 2004 dollars) of assessed valuation to the area. This increase in real estate values, coupled with a conservative projected increase in assessed valuation of 3% per year, will generate over $1 billion in total tax increment payments over the 30-year projection period. It is assumed in this analysis that after deducting 30% of the tax increment for low/moderate income housing set aside, administration, and other costs, half of the remainder will be available to the SITF. Over the 30-year projection period, this amount totals nearly $452 million dollars. However, as with the Transportation Impact Fee revenue, only a small portion of this funding will come in the early years and be directly available for project funding. Between 2008 and 2012, approximately $14.1 million will be available from this source if development of the Railyards proceeds on schedule, and only $9.1 million if the Millennia project is delayed by 4 years.
Other Funding Sources In addition to Tax Increment and Transportation Impact Fees (TIFs), there are federal and state funding sources that are assumed to be available for the SITF.
The SITF is not anticipated to be constructed solely by the City of Sacramento, but by the City and a number of other transit agency partners.
Federal Funds Congress is in the process of reauthorizing the Transportation Equity Act of the 21st Century (TEA-21). In October, the Administration introduced a bill for a six-year reauthorization proposal known as SAFETEA (Safe, Accountable, Flexible, and Efficient Transportation Equity Act) of 2003. In November, the Senate and the House each proposed different versions of the bill, although they are both modeled after the principles in the Administration’s bill. Both proposals are more robust from a funding perspective than the Administration’s proposal. Each version is committed to many of the same principles as the original legislation by providing flexibility in funds and allowing states and local officials to make decisions about funding priorities. Many of the provisions are still being worked through and the funding levels are not yet finalized. It is assumed that the federal funding programs listed below will be a part of the final legislation when it is signed into law in 2004.
Federal Transit Administration (FTA) Section 5309 (Federal Earmark) These funds are fully discretionary and are usually earmarked and appropriated by Congress. They are distributed directly from FTA to support capital transit needs including vehicle acquisition, capital equipment and other transit facility needs. FTA Section 5309 funds are an excellent source to pay for large-scale capital projects. These grants provide 80% of the capital funds and require a 20% local match. The City of Sacramento has already received $1 million in Federal discretionary funds and has submitted a request for a $2.5 million in funds for planning and design of the SITF. These funds can be difficult to acquire. Section 5309 discretionary funds are usually earmarked and appropriated by
City of Sacramento Sacramento Intermodal Transportation Facility TR #9
SITF Alternatives
SMWM/Arup and Associated Consultants
September 29, 2004
Page 184
Congress. The City may be well positioned to secure additional discretionary funds, particularly because the SITF is a top priority regional project with a high profile. Other strategies for securing these federal funds are to provide an “overmatch” (above the 20% requirement) of the federal dollars. Obtaining a Congressional earmark depends on the “clout” of the local delegation and the ability of the City and other SITF stakeholders to communicate the need for these funds. The cost and revenue model assumes that the SITF will receive $20 million from this federal source over the life of the project, or about 15% of the total project cost.
Congestion Mitigation and Air Quality (CMAQ) Program The federal CMAQ program provides funds for projects that contribute to the attainment or maintenance of federal air quality standards. These funds are distributed by the Sacramento Association of Governments (SACOG). SACOG evaluates projects requesting CMAQ funds based on a series of criteria including but not limited to emissions reduction, level of service improvement, reduction in vehicle miles traveled, local share contribution and funding distribution, regional importance, multimodal features, local agency participation, and right-of-way requirements. To date, the SITF has received $3 million in CMAQ demonstration funds. An additional $10 million in CMAQ funds are assumed to be available for the SITF.
Other Small Scale Federal Grants Under TEA-21, there are several small-scale federal funding programs that will likely remain intact under the reauthorized TEA-21 legislation. These include a program called Transportation Enhancement Activities (TEA), Transportation Community and System Preservation funds (TCSP), and Transportation for Livable Communities (TLC). These programs are administered by SACOG and provide funding for capital projects. While they are quite competitive, the SITF could be successful in securing funds from some or all of these programs. This plan assumes that $5.0 million will be available over the life of the project.
State Funds State funds are programmed through the State Transportation Improvement Program, which is fully subscribed in the next two years. In subsequent years, the State may be positioned to help fund the SITF through funds provided through the Interregional Improvement Program (IIP). Although these funds are highly competitive, the SITF is an interregional project of statewide significance. This may position the project to receive funding over other competing projects. The cost and revenue model assumes that $15 million will be available to pay for station or track improvements.
Bonding It will be necessary to finance the project with bonds given the significant upfront capital costs. The Transportation Infrastructure Finance and Innovation Act of 1998 (TIFIA), enacted as part of the TEA-21, established a program that provides credit assistance to major transportation projects of national or regional significance. The goal of TIFIA is to leverage limited Federal resources and stimulate transportation capital investments by providing credit rather than grants to projects of critical importance. Any type of transit capital projects is eligible for TIFIA. The amount of Federal credit assistance may not exceed 33 percent of total project costs. TIFIA project sponsors may be public or private entities, including state and local governments, special purpose authorities, transportation improvement districts, and private firms. The project must also be supported in whole or part by user charges or other non-Federal dedicated funding sources and included in the state's Transportation Plan. There are other eligibility requirements that the City or project sponsor would need to meet.
Comparison of Financial Performance

City of Sacramento Sacramento Intermodal Transportation Facility TR #9
SITF Alternatives
SMWM/Arup and Associated Consultants
September 29, 2004
Page 185
The ultimate comparison of the alternatives on a financial basis can be summarized in terms of three key measures for each alternative:
• Initial Capital Cost
• Net Operating Income over a 30 year life (NOI)
• Public Funds required to subsidize the facility
The following table and chart summarize these three measures for each alternative. The public funds consist of three components: Transportation Impact Fees, Tax Increments and Other Subsidies. In each case, we assume a consistent level of grant funding from state and federal sources, so this component is disregarded for these purposes.
Item ($Millions) Alternative A: Sunset Limited
Alternative B; Sacramento Northern
Alternative C; Overland Limited
Alternative D: Valley Flyer
Capital Cost 141.7 160.4 (123.6)1 134.2 129.1
30 Year NOI 227.2 159.6 (135.4) 157.5 166.7
Public Funds Required
41.3 153.3 (74) 104.5 89.6
1. Numbers in parentheses are for Sacramento Northern without underground parking
This summary suggests the Sunset Limited alternative may be the most attractive by virtue of its limited reliance on public funds. However, this observation highlights the need for careful analysis of the underlying assumptions. The revenue for the Sunset Limited alternative is driven heavily by the Joint Development space that has been included in the program. The Sacramento Northern alternative also
City of Sacramento Sacramento Intermodal Transportation Facility TR #9
SITF Alternatives
SMWM/Arup and Associated Consultants
September 29, 2004
Page 186
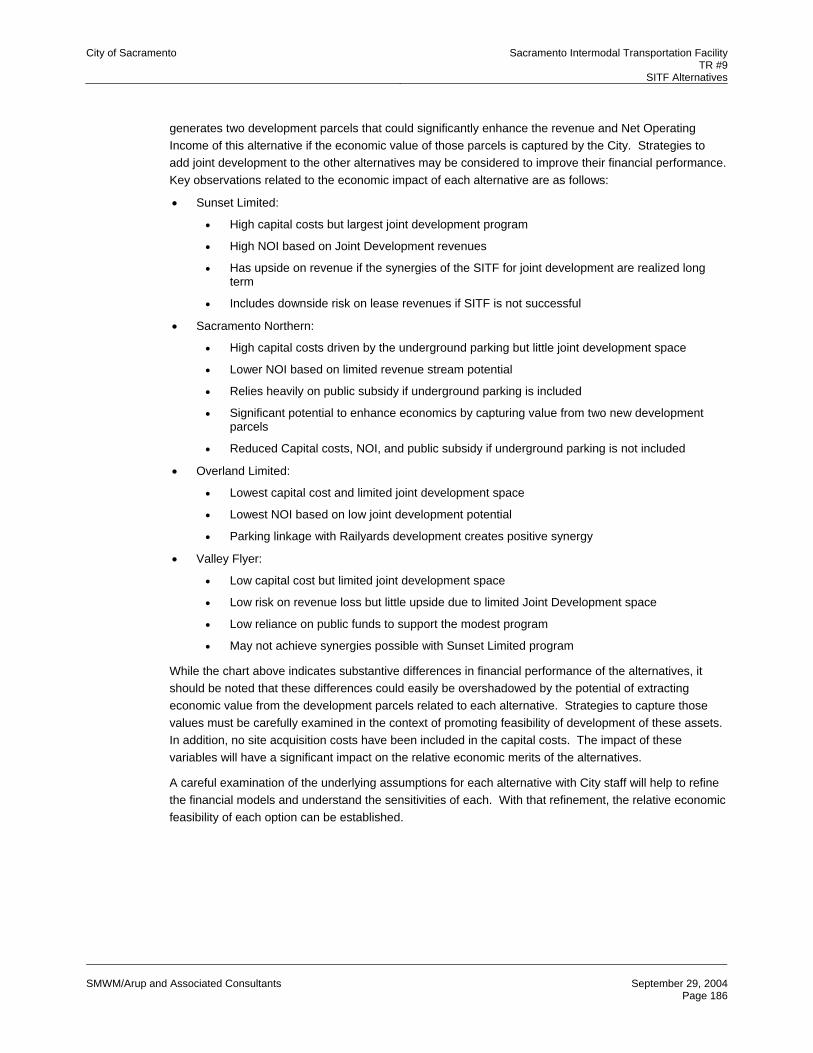
generates two development parcels that could significantly enhance the revenue and Net Operating Income of this alternative if the economic value of those parcels is captured by the City. Strategies to add joint development to the other alternatives may be considered to improve their financial performance. Key observations related to the economic impact of each alternative are as follows:
• Sunset Limited:
• High capital costs but largest joint development program
• High NOI based on Joint Development revenues
• Has upside on revenue if the synergies of the SITF for joint development are realized long term
• Includes downside risk on lease revenues if SITF is not successful
• Sacramento Northern:
• High capital costs driven by the underground parking but little joint development space
• Lower NOI based on limited revenue stream potential
• Relies heavily on public subsidy if underground parking is included
• Significant potential to enhance economics by capturing value from two new development parcels
• Reduced Capital costs, NOI, and public subsidy if underground parking is not included
• Overland Limited:
• Lowest capital cost and limited joint development space
• Lowest NOI based on low joint development potential
• Parking linkage with Railyards development creates positive synergy
• Valley Flyer:
• Low capital cost but limited joint development space
• Low risk on revenue loss but little upside due to limited Joint Development space
• Low reliance on public funds to support the modest program
• May not achieve synergies possible with Sunset Limited program
While the chart above indicates substantive differences in financial performance of the alternatives, it should be noted that these differences could easily be overshadowed by the potential of extracting economic value from the development parcels related to each alternative. Strategies to capture those values must be carefully examined in the context of promoting feasibility of development of these assets. In addition, no site acquisition costs have been included in the capital costs. The impact of these variables will have a significant impact on the relative economic merits of the alternatives.
A careful examination of the underlying assumptions for each alternative with City staff will help to refine the financial models and understand the sensitivities of each. With that refinement, the relative economic feasibility of each option can be established.
City of Sacramento Sacramento Intermodal Transportation Facility TR #9
SITF Alternatives
SMWM/Arup and Associated Consultants
September 29, 2004
Page 187
4.11.2 Operational Scenarios
Issues to be resolved
Every major project involving transit infrastructure raises a number of issues of project delivery, ownership and governance. For example, at the outset, the sponsors of the project must identify:
• Who are or should be the owner(s) of the project?
• Who are the principal stakeholders in the project (which may be in addition to the owners) and to what extent are their interests aligned or divergent?
• What are the potential sources of capital and financing for the project?
• What is the implementation strategy, in terms of legislative authority, consultant and contractor selection process, stakeholder oversight, project management, required staffing, etc.?
• Who will be the long-term operator of the project (which may be different than the owner), and what operational issues must be considered (transit operations, public amenities, retail leasing, etc.)?
• What are the opportunities for utilizing joint development as a source of capital and revenue?
Every project also presents a number of challenges that must be addressed in order to insure a successful project. Examples of these include:
• How to involve the stakeholders in the planning and implementation of the project, including how to reconcile any divergent interests or disagreements that may arise among the stakeholders?
• How to segregate policy level decisions which require stakeholder input from day to day design and construction decisions that should be handled by the implementation team?
• How to manage the project so that project milestones are met and cost and schedule goals are achieved?
• How to assemble the necessary staff and expertise to implement a major project that is outside the normal scope of stakeholder activities?
• How to minimize the capital cost of the project and yet maximize the revenue sources that can offset operating expenses and debt service on project financing?
Typically these issues are resolved as the result of consultation and negotiations among the stakeholders, with input from staff and specialized consultants. The result is an ownership, governance and project delivery strategy that is unique to the particular project, but which includes elements that are common to many other comparable projects. Typically these elements provide:
• A forum for stakeholder input and decisions
• A reservation of key decisions to the stakeholders and a delegation of project decisions to the implementation team
• A provision for appropriate oversight by the stakeholders
• Mechanisms for cost and schedule control
• Incentives to minimize cost and maximize revenues
In order to identify these elements, and to understand how they have been used in a variety of recent projects, Jones Lang LaSalle has undertaken a review of eight recent projects, which involve the development of a major transit facility. From these eight projects, we have abstracted the common elements and techniques that have been utilized to address the issues outlined above. Key lessons that can be drawn from these case studies are also identified.
City of Sacramento Sacramento Intermodal Transportation Facility TR #9
SITF Alternatives
SMWM/Arup and Associated Consultants
September 29, 2004
Page 188
Case Studies To explore potential structures for ownership, governance and project delivery of the project, eight recent transit-related projects in North America were researched. The eight case studies are as follows:
• Grand Central Terminal, New York
• JFK International Airport, Terminal 4, New York
• Lester B. Pearson International Airport, Toronto, Ontario
• Penn Station-Farley Post Office, New York
• San Francisco International Airport, San Francisco
• South Station, Boston
• Union Station, Los Angeles
• Union Station, Washington, D.C.
While each of these projects was structured to respond to specific locational, political and financial requirements, there are identifiable models common among them. Some of these models relate to the manner in which the projects are owned and governed by the various public and private stakeholders in the project. Other models relate to the manner in which the ownership group related to the project delivery team consisting of developers, designers and contractors. From the eight case studies, three ownership and governance models and four project-delivery models were identified. These models are presented below.
Ownership and Governance Models These models represent the ownership structure of the primary stakeholder(s), as well as the relationship between the project’s owner and the project’s tenants, both transit operators and non-transit tenants.
The models reviewed illustrate varied approaches to ownership and governance of a major terminal project. Most projects have multiple stakeholders, who often have interests that are not totally in alignment, and therefore these various interests must be reconciled in the management of the project. One means of reconciling interests is to provide the principal stakeholders with representation on a board of directors of the entity that owns the terminal, or alternatively, on the board of a special purpose entity created to implement or manage the project. Alternatively, instead of board representation, interim memoranda of understanding (“MOU’s”) can be executed to define the relationship between stakeholders, including roles and responsibilities, especially during the design and construction phase. In addition, one ownership and governance structure could be established for a certain element or phase of the project (e.g. terminal design) and a different structure could be established for a different or subsequent element of the project (e.g. terminal construction, leasing and operations).
Many of the projects studied utilized the resources and expertise of the private sector in both project ownership and project delivery. Typically, the goal has been to draw upon private sector expertise in the areas of finance, project management, facility management and joint development. This expertise is particularly important when joint development revenues are considered a major source of project capital or operating revenues. Other goals of private sector involvement may include providing professional staff resources on a short-term basis, access to particular relationships with adjacent property owners or key tenants, and creating incentives for maximizing revenues and controlling cost and schedule. Private sector participants are typically selected by means of a competitive process, although the nature of that process varies depending on local legal and regulatory environments. The structure of these public/private relationships is of equal importance to the relationship among public stakeholders, and it must be determined how a developer is included in the ownership structure of the terminal, if at all.
City of Sacramento Sacramento Intermodal Transportation Facility TR #9
SITF Alternatives
SMWM/Arup and Associated Consultants
September 29, 2004
Page 189
Various techniques have been utilized to accomplish this, including joint ventures, ground leases and operating agreements between the public sector project sponsors and the private sector developers or managers of the project. Typically, the greater role that joint development plays in the overall scope of the project, the more central the role of the private developer in the management of the project.
Direct Ownership Model
The first ownership model is the simplest one in which the owner has direct leases with the transit operators and any non-transit tenants. This direct ownership model is used at Grand Central Terminal, Lester B. Pearson International Airport and San Francisco International Airport. To illustrate, at Grand Central Terminal the Metropolitan Transit Authority (“MTA”) owns the terminal. An MTA agency, Metro North Railroad, operates the transit, which utilizes the terminal. Non-transit leases are with both MTA and Metro North and are managed with the assistance of a private sector management entity, currently Jones Lang LaSalle. A variation on this first model is the use of a MOU between the terminal owner and one or more of the transit operators. The MOU can document certain agreements (e.g. agreements regarding terminal design), which have applicability only during the early phases of the project. Once that phase is completed, the MOU's expire since the long-term relationship between the terminal owner and the transit operator is governed by the lease. This approach is being used successfully at Penn Station – Farley Post Office in New York.
Indirect Ownership Model
The second ownership model is an indirect ownership model in which either a developer or a single purpose authority (typically a nonprofit corporation) has a master lease with the terminal owner. The developer or authority then subleases space or use rights to the non-transit tenants. The developer or authority may or may not sublease space or use rights to the transit operators. This indirect ownership model is used at both JFK International Airport and South Station. To illustrate, at South Station the Massachusetts Bay Transportation Authority (“MBTA”) owns the station. MBTA has a long-term ground lease with the developer, Beacon Properties. Beacon Properties leases directly with the non-transit tenants. The transit operators have operating agreements with MBTA.
Tiered Ownership
The third ownership model is a tiered ownership structure. This is the model at Penn Station-Farley Post Office, Union Station in Los Angeles, and Union Station in Washington, D.C. The terminal owner has a master lease with a single purpose authority (a nonprofit corporation), which has a sublease with a private sector developer. The non-profit corporation provides a forum for the resolution of issues among the stakeholders. The developer implements these policy decisions and subleases space or use rights to the transit operators and non-transit tenants.
At Union Station in Washington, D.C., the station is owned by the Department of Transportation (“DOT”). The Union Station Redevelopment Corporation (“USRC”) was created as a nonprofit authority to manage the redevelopment of the station. Representatives of the various stakeholders are represented on the board of directors of USRC, including the Secretary of the DOT, the President of Amtrak, the Mayor of D.C., the President of Federal City Council, and the Federal Railroad Administrator. USRC has a long-term lease for the station from DOT, the owner of the terminal. USRC has a long-term sublease relationship with the developer, who in turn has a long-term sublease with Amtrak (the primary transit operator) and the non-transit tenants.
4.11.5 Project Delivery Models Four project delivery models were identified in the analysis of the transit-related case studies. They are the arrangement by which each of the projects was designed, constructed, operated and managed. In

City of Sacramento Sacramento Intermodal Transportation Facility TR #9
SITF Alternatives
SMWM/Arup and Associated Consultants
September 29, 2004
Page 190
discussion of these models, the ownership structure in each can be any one of the three ownership models discussed above.
Fee Developer/Contractor
The first project delivery model is the fee developer/contractor model. In this model the terminal owner retains the most control. The owner oversees both the design and the ongoing operation and management of the station but hires a fee developer or contractor to complete the construction, often on a design-build basis. This model is used at San Francisco International Airport (“SFO”), Lester B. Pearson International Airport, and Grand Central Terminal. At SFO, the airport authority has in-house architects and engineers in their Building Design and Construction Department. They oversee the design and construction but hire outside contractors to complete the work on a fee basis. Ongoing operation and management of the airport are the responsibility of the airport authority.
Contractor/Operator
The second project delivery model is the contractor-operator model. In this model the terminal owner is responsible for managing the design and the contractor-operator is responsible for completing construction and the managing the ongoing operations. This model is used at South Station in Boston where MBTA, as owner, selected the design team and oversaw the design of the project. Beacon Properties was hired to develop the retail fit-out of the project and to manage the retail leasing and the non-transit station operations and maintenance.
Developer/Operator
The third project delivery model is the developer-operator model. This model is distinguished from the contractor-operator model by the design process becoming the responsibility of the developer. The terminal owner hires the developer-operator, who through a long-term agreement is responsible for the design, construction and ongoing operation of the project. This model is used at JFK International Airport, Penn Station-Farley Post Office, and Union Station in Washington, D.C. At JFK International Airport (Terminal 4), the Port Authority, which owns the facility, awarded the contract for construction, management and operation to JFK-IAT. JFK-IAT is a private, for-profit consortium, which was responsible for design, construction, financing, terminal operations, retail leasing and management.
Joint Venture
The final project delivery model is the joint venture model in which the owner and developer form a joint venture partnership, which oversees the entire development process. This model was used at Union Station in Los Angeles. The owner, Los Angeles County Metropolitan Transportation Authority (“LACMTA”) and the developer, Catellus Development Corporation, formed a new nonprofit joint venture for the development of the transit center and new headquarters building for LACMTA. LACMTA and Catellus have equal representation on the board of the joint venture. The joint venture hired Catellus with a fixed fee contract as the design-build-operate team.