4.10 Air Quality - sfcta.org · Quality Impact Report (TAHA, 2010). ... of CARB under AB 32 include...
84
Van Ness Avenue Bus Rapid Transit Project Chapter 4: Affected Environment, Chapter 4: Affected Environment, Chapter 4: Affected Environment, Chapter 4: Affected Environment, Draft Environmental Impact Statement/ Environmental Consequences, and Environmental Consequences, and Environmental Consequences, and Environmental Consequences, and Environmental Impact Report Avoidance, Minimization, and/or Mitigation Measures Avoidance, Minimization, and/or Mitigation Measures Avoidance, Minimization, and/or Mitigation Measures Avoidance, Minimization, and/or Mitigation Measures San Francisco County Transportation Authority October 2011 4.10-1 4.10 Air Quality This section summarizes the air quality regulatory setting; affected environment; environmental consequences; and measures to avoid, mitigate, or compensate for long-term, permanent impacts to the air quality as a result of the proposed Van Ness Avenue BRT Project. Construction-phase impacts and avoidance measures are presented in Section 4.15.10. Documents prepared in support of this section include the Van Ness BRT Project Air Quality Impact Report (TAHA, 2010). 4.10.1Regulatory Setting An overview of the federal, state, and local regulations and polices relevant to air quality impacts of proposed project operation follows. 4.10.1.1 FEDERAL, STATE, AND LOCAL GOVERNING BODIES AND REGULATIONS Air quality in the United States is governed by the federal Clean Air Act (CAA). In addition to being subject to the requirements of the CAA, air quality in California is also governed by more stringent regulations under the California Clean Air Act (CCAA). At the federal level, the CAA is administered by EPA. In California, the CCAA is administered by the California Air Resources Board (CARB) at the state level and by Air Quality Management Districts at the regional and local levels. The proposed project is located within the Bay Area Air Quality Management District (BAAQMD). EPA is responsible for establishing the National Ambient Air Quality Standards (NAAQS), which are required under the 1977 CAA and subsequent amendments. EPA regulates emission sources that are under the exclusive authority of the federal government and establishes various emission standards, including those for vehicles sold in states other than California. Automobiles sold in California must meet the stricter emission standards established by CARB. CARB, which became part of the California Environmental Protection Agency (CalEPA) in 1991, is responsible for meeting the state requirements of the federal CAA, administering the CCAA, and establishing the California Ambient Air Quality Standards (CAAQS). The CCAA requires all air districts in the state to endeavor to achieve and maintain the CAAQS, which are generally more stringent than the corresponding federal standards. The BAAQMD is primarily responsible for assuring that the national and state ambient air quality standards are attained in the San Francisco Bay Area. The BAAQMD has jurisdiction over an approximately 5,600-square-mile area, commonly referred to as the Bay Area Air Basin (BAAB). The District’s boundary encompasses most of the nine Bay Area counties: Alameda County, Contra Costa County, Marin County, San Francisco County, San Mateo County, Santa Clara County, Napa County, southwestern Solano County, and southern Sonoma County. The discussion of project air quality setting and effects refers primarily to conditions within the BAAB, which from both the federal and state regulatory perspectives is considered one geographic entity. 4.10.1.2 TOXIC AIR CONTAMINANT REGULATIONS Toxic air contaminants (TACs), or in federal parlance under the federal CAA, hazardous air pollutants (HAPs), are pollutants that result in an increase in mortality, a serious illness, or pose a present or potential hazard to human health. It is important to understand that TACs are not considered criteria air pollutants; thus, they are not specifically addressed through the setting of ambient air quality standards. Instead, EPA and CARB regulate HAPs and TACs, respectively, through statutes and regulations that generally require the use of the maximum or DEFINITION TOXIC AIR CONTAMINANTS (TACs): Pollutants that result in an increase in mortality, a serious illness, or pose a present or potential hazard to human health. Air quality in the United States Air quality in the United States Air quality in the United States Air quality in the United States is governed by the federal Clean is governed by the federal Clean is governed by the federal Clean is governed by the federal Clean Air Act (CAA). Air Act (CAA). Air Act (CAA). Air Act (CAA). Air quality in ir quality in ir quality in ir quality in California is also governed by California is also governed by California is also governed by California is also governed by more more more more stringent regulations stringent regulations stringent regulations stringent regulations under the under the under the under the California Clean Air California Clean Air California Clean Air California Clean Air Act (CCAA). Act (CCAA). Act (CCAA). Act (CCAA).
Transcript of 4.10 Air Quality - sfcta.org · Quality Impact Report (TAHA, 2010). ... of CARB under AB 32 include...

Van Ness Avenue Bus Rapid Transit Project Chapter 4: Affected Environment,Chapter 4: Affected Environment,Chapter 4: Affected Environment,Chapter 4: Affected Environment, Draft Environmental Impact Statement/ Environmental Consequences, andEnvironmental Consequences, andEnvironmental Consequences, andEnvironmental Consequences, and Environmental Impact Report Avoidance, Minimization, and/or Mitigation Measures Avoidance, Minimization, and/or Mitigation Measures Avoidance, Minimization, and/or Mitigation Measures Avoidance, Minimization, and/or Mitigation Measures
San Francisco County Transportation Authority October 2011 4.10-1
4.10 Air Quality 10This section summarizes the air quality regulatory setting; affected environment; environmental consequences; and measures to avoid, mitigate, or compensate for long-term, permanent impacts to the air quality as a result of the proposed Van Ness Avenue BRT Project. Construction-phase impacts and avoidance measures are presented in Section 4.15.10. Documents prepared in support of this section include the Van Ness BRT Project Air Quality Impact Report (TAHA, 2010).
4.10.1Regulatory Setting
An overview of the federal, state, and local regulations and polices relevant to air quality impacts of proposed project operation follows.
4.10.1.1FEDERAL, STATE, AND LOCAL GOVERNING BODIES AND REGULATIONS
Air quality in the United States is governed by the federal Clean Air Act (CAA). In addition to being subject to the requirements of the CAA, air quality in California is also governed by more stringent regulations under the California Clean Air Act (CCAA). At the federal level, the CAA is administered by EPA. In California, the CCAA is administered by the California Air Resources Board (CARB) at the state level and by Air Quality Management Districts at the regional and local levels. The proposed project is located within the Bay Area Air Quality Management District (BAAQMD).
EPA is responsible for establishing the National Ambient Air Quality Standards (NAAQS), which are required under the 1977 CAA and subsequent amendments. EPA regulates emission sources that are under the exclusive authority of the federal government and establishes various emission standards, including those for vehicles sold in states other than California. Automobiles sold in California must meet the stricter emission standards established by CARB.
CARB, which became part of the California Environmental Protection Agency (CalEPA) in 1991, is responsible for meeting the state requirements of the federal CAA, administering the CCAA, and establishing the California Ambient Air Quality Standards (CAAQS). The CCAA requires all air districts in the state to endeavor to achieve and maintain the CAAQS, which are generally more stringent than the corresponding federal standards.
The BAAQMD is primarily responsible for assuring that the national and state ambient air quality standards are attained in the San Francisco Bay Area. The BAAQMD has jurisdiction over an approximately 5,600-square-mile area, commonly referred to as the Bay Area Air Basin (BAAB). The District’s boundary encompasses most of the nine Bay Area counties: Alameda County, Contra Costa County, Marin County, San Francisco County, San Mateo County, Santa Clara County, Napa County, southwestern Solano County, and southern Sonoma County. The discussion of project air quality setting and effects refers primarily to conditions within the BAAB, which from both the federal and state regulatory perspectives is considered one geographic entity.
4.10.1.2TOXIC AIR CONTAMINANT REGULATIONS
Toxic air contaminants (TACs), or in federal parlance under the federal CAA, hazardous air pollutants (HAPs), are pollutants that result in an increase in mortality, a serious illness, or pose a present or potential hazard to human health. It is important to understand that TACs are not considered criteria air pollutants; thus, they are not specifically addressed through the setting of ambient air quality standards. Instead, EPA and CARB regulate HAPs and TACs, respectively, through statutes and regulations that generally require the use of the maximum or
D E F I N I T I O N
TOXIC AIR CONTAMINANTS (TACs): Pollutants that result in an increase in mortality, a serious illness, or pose a present or potential hazard to human health.
Air quality in the United States Air quality in the United States Air quality in the United States Air quality in the United States is governed by the federal Clean is governed by the federal Clean is governed by the federal Clean is governed by the federal Clean Air Act (CAA).Air Act (CAA).Air Act (CAA).Air Act (CAA). AAAAir quality in ir quality in ir quality in ir quality in California is also governed by California is also governed by California is also governed by California is also governed by moremoremoremore stringent regulations stringent regulations stringent regulations stringent regulations under the under the under the under the California Clean Air California Clean Air California Clean Air California Clean Air Act (CCAA).Act (CCAA).Act (CCAA).Act (CCAA).

Chapter 4: Affected Environment,Chapter 4: Affected Environment,Chapter 4: Affected Environment,Chapter 4: Affected Environment, Van Ness Avenue Bus Rapid Transit Project Environmental Consequences, andEnvironmental Consequences, andEnvironmental Consequences, andEnvironmental Consequences, and Draft Environmental Impact Statement/ Avoidance, Minimization, and/orAvoidance, Minimization, and/orAvoidance, Minimization, and/orAvoidance, Minimization, and/or Mitigation MeasuresMitigation MeasuresMitigation MeasuresMitigation Measures Environmental Impact Report
4.10-2 San Francisco County Transportation Authority October 2011
best available control technology (MACT and BACT) to limit emissions. These, in conjunction with additional rules set forth by BAAQMD, establish the regulatory framework for TACs.
Federal Hazardous Air Pollutant Program. Title III of the federal Clean Air Act Amendments (CAAAs) requires EPA to promulgate national emissions standards for hazardous air pollutants (NESHAPs). The NESHAP may differ for major sources compared to area sources of HAPs (major sources are defined as stationary sources with potential to emit more than 10 tons per year [TPY] of any HAP or more than 25 TPY of any combination of HAPs; all other sources are considered area sources).
Mobile Source Air Toxics (MSAT). EPA issued a Final Rule on Controlling Emissions of HAPs from Mobile Sources (66 Federal Register [FR] 17229, March 29, 2001). This rule was issued under the authority in Section 202 of the CAA. In its rule, EPA examined the impacts of existing and newly promulgated mobile source control programs, including the following EPA standards and programs: reformulated gasoline program; national low-emission vehicle standards; Tier 2 motor vehicle emissions standards and gasoline sulfur control requirements; proposed heavy-duty engine and vehicle standards; and on-highway diesel fuel sulfur control requirements.
EPA concluded that no further motor vehicle emissions standards or fuel standards were necessary to further control MSATs. The agency is preparing another rule under authority of CAA Section 202(l) that will address these issues and could make adjustments to the full 21 and the primary 6 MSATs. FHWA published project-level MSAT assessment guidance in February 2006 as an air quality analysis tool for transportation projects.
State Toxic Air Contaminant Programs. California regulates TACs primarily through the Tanner Air Toxics Act (Assembly Bill [AB] 1807) and the Air Toxics Hot Spots Information and Assessment Act of 1987 (AB 2588). The Tanner Act sets forth a formal procedure for CARB to designate substances as TACs. This includes research, public participation, and scientific peer review before CARB can designate a substance as a TAC. To date, CARB has identified more than 21 TACs, and adopted EPA’s list of HAPs as TACs. Most recently, diesel exhaust particulate was added to the CARB list of TACs. Once a TAC is identified, CARB then adopts an Airborne Toxics Control Measure for sources that emit that particular TAC. If there is a safe threshold for a substance at which there is no toxic effect, the control measure must reduce exposure below that threshold. If there is no safe threshold, the measure must incorporate toxic best available control technology (TBACT) to minimize emissions. None of the TACs identified by CARB have a safe threshold.
Bay Area Air Quality Management District. The BAAQMD has regulated TACs since the 1980s. At the local level, air pollution control or management districts may adopt and enforce CARB’s control measures. Under BAAQMD Regulation 2-1 (General Permit Requirements), Regulation 2-2 (New Source Review), and Regulation 2-5 (New Source Review), all nonexempt sources that possess the potential to emit TACs are required to obtain permits from BAAQMD. Permits may be granted to these operations if they are constructed and operated in accordance with applicable regulations, including new source review standards and air toxics control measures. The BAAQMD limits emissions and public exposure to TACs through many programs. The BAAQMD prioritizes TAC-emitting stationary sources based on the quantity and toxicity of the TAC emissions and the proximity of the facilities to sensitive receptors. Naturally occurring asbestos (NOA) was identified as a TAC in 1986 by CARB. BAAQMD’s NOA program requires that the applicable notification forms from the Air District’s website be submitted by qualifying operations in accordance with the procedures detailed in the Air Toxics Control Measures (ATCM) Inspection Guidelines Policies and Procedures. The Lead Agency shall reference BAAQMD’s ATCM Policies and Procedures to determine which NOA Notification Form is applicable to the proposed project (NOA Notification Forms). The ATCM requires regulated operations engaged in road construction and maintenance activities, construction and grading operations, and quarrying and surface mining operations in areas where NOA is

Van Ness Avenue Bus Rapid Transit Project Chapter 4: Affected Environment,Chapter 4: Affected Environment,Chapter 4: Affected Environment,Chapter 4: Affected Environment, Draft Environmental Impact Statement/ Environmental Consequences, andEnvironmental Consequences, andEnvironmental Consequences, andEnvironmental Consequences, and Environmental Impact Report Avoidance, Minimization, and/or Mitigation Measures Avoidance, Minimization, and/or Mitigation Measures Avoidance, Minimization, and/or Mitigation Measures Avoidance, Minimization, and/or Mitigation Measures
San Francisco County Transportation Authority October 2011 4.10-3
likely to be found, to employ the best available dust mitigation measures to reduce and control dust emissions.
In addition, the BAAQMD has adopted Regulation 11, Rule 2, which addresses asbestos demolition, renovation, manufacturing, and standards for asbestos containing serpentine. The purpose of Regulation 11, Rule 2, is to control emissions of asbestos to the atmosphere during demolition, renovation, milling, and manufacturing and establish appropriate waste disposal procedures.
4.10.1.3FEDERAL GREENHOUSE GAS REGULATIONS
As the federal agency responsible for implementing the CAA, EPA also has responsibility for regulating GHG emissions.
Mandatory Greenhouse Gas Reporting Rule. On September 22, 2009, EPA issued a final rule for mandatory reporting of GHGs from large GHG emissions sources in the United States. In general, this national reporting requirement will provide EPA with accurate and timely GHG emissions data from facilities that emit 25,000 metric tons or more of carbon dioxide (CO2) per year.
Proposed Endangerment and Cause or Contribute Findings for Greenhouse Gases under the Clean
Air Act. On April 23, 2009, EPA published their Proposed Endangerment and Cause or Contribute Findings for Greenhouse Gases under the CAA (Endangerment Finding) in the Federal Register. The Endangerment Finding is based on Section 202(a) of the CAA, which states that the Administrator (of EPA) should regulate and develop standards for “emission[s] of air pollution from any class of classes of new motor vehicles or new motor vehicle engines, which in [its] judgment cause, or contribute to, air pollution which may reasonably be anticipated to endanger public health or welfare.”
4.10.1.4STATE GREENHOUSE GAS REGULATIONS
AB 1493 (2002). In 2002, then-Governor Gray Davis signed AB 1493. AB 1493 requires that CARB develop and adopt, by January 1, 2005, regulations that achieve “the maximum feasible reduction of GHGs emitted by passenger vehicles and light-duty trucks and other vehicles determined by CARB to be vehicles whose primary use is noncommercial personal transportation in the State.” To meet the requirements of AB 1493, in 2004 CARB approved amendments to the CCR adding GHG emissions standards to California’s existing standards for motor vehicle emissions. Amendments to CCR Title 13, Sections 1900 and 1961 (13 CCR 1900, 1961), and adoption of Section 1961.1 (13 CCR 1961.1) require automobile manufacturers to meet fleet-average GHG emissions limits for all passenger cars, light-duty trucks within various weight criteria, and medium-duty passenger vehicle weight classes (i.e., any medium-duty vehicle with a gross vehicle weight rating less than 10,000 pounds that is designed primarily for the transportation of persons), beginning with the 2009 model year.
AB 32 (2006), California Global Warming Solutions Act. In September 2006, Governor Arnold Schwarzenegger signed AB 32 (Chapter 488, Statutes of 2006), the California Global Warming Solutions Act of 2006, which enacted Sections 38500–38599 of the California Health and Safety Code. AB 32 requires the reduction of statewide GHG emissions to 1990 levels by 2020. The required reduction will be accomplished through an enforceable statewide cap on GHG emissions beginning in 2012. To effectively implement the statewide cap on GHG emissions, AB 32 directs CARB to develop and implement regulations that reduce statewide GHG emissions generated by stationary sources. Specific actions required of CARB under AB 32 include adoption of a quantified cap on GHG emissions that represent 1990 emissions levels along with disclosing how the cap was quantified, institution of a schedule to meet the emissions cap, and development of tracking, reporting, and enforcement mechanisms to ensure that the State achieves the reductions in GHG emissions needed to meet the cap. In addition, AB 32 states that if any regulations established under
D E F I N I T I O N
GREENHOUSE GASES (GHGs): These gases, produced by motor vehicle emissions (among other sources), allow visible and ultraviolet light from the sun to pass through the atmosphere, but prevent heat from escaping back out into space. This contributes to an increase in the temperature of the earth’s atmosphere, or global warming. The principal GHGs are carbon dioxide (CO2), methane (CH4), nitrous oxide (N2O), and fluorinated compounds.

Chapter 4: Affected Environment,Chapter 4: Affected Environment,Chapter 4: Affected Environment,Chapter 4: Affected Environment, Van Ness Avenue Bus Rapid Transit Project Environmental Consequences, andEnvironmental Consequences, andEnvironmental Consequences, andEnvironmental Consequences, and Draft Environmental Impact Statement/ Avoidance, Minimization, and/orAvoidance, Minimization, and/orAvoidance, Minimization, and/orAvoidance, Minimization, and/or Mitigation MeasuresMitigation MeasuresMitigation MeasuresMitigation Measures Environmental Impact Report
4.10-4 San Francisco County Transportation Authority October 2011
AB 1493 (2002) cannot be implemented, then CARB is required to develop additional, new regulations to control GHG emissions from vehicles as part of AB 32.
AB 32 Climate Change Scoping Plan. In December 2008, CARB adopted its Climate Change Scoping Plan, which contains the main strategies California will implement to achieve reduction of approximately 169 million metric tons (MMT) of carbon dioxide equivalent (CO2e), or approximately 30 percent from the State’s projected 2020 emission level of 596 MMT of CO2e under a business-as-usual scenario (this is a reduction of 42 MMT CO2e, or almost 10 percent, from 2002 to 2004 average emissions). The Scoping Plan also includes CARB-recommended GHG reductions for each emissions sector of the State’s GHG inventory.
Senate Bills (SB) 1078 and 107 and E.O. S-14-08. SB 1078 (Chapter 516, Statutes of 2002) requires retail sellers of electricity, including investor-owned utilities and community choice aggregators, to provide at least 20 percent of their supply from renewable sources by 2017. SB 107 (Chapter 464, Statutes of 2006) changed the target date to 2010. In November 2008, Governor Schwarzenegger signed E.O. S-14-08, which expands the State’s Renewable Energy Standard to 33 percent renewable power by 2020. Governor Schwarzenegger plans to propose legislative language that will codify the new higher standard.
SB 1368 (2006). SB 1368 is the companion bill of AB 32 and was signed by Governor Schwarzenegger in September 2006. SB 1368 requires the California Public Utilities Commission (CPUC) to establish a GHG emission performance standard for baseload generation from investor-owned utilities by February 1, 2007. The California Energy Commission (CEC) must establish a similar standard for local publicly owned utilities by June 30, 2007. These standards cannot exceed the GHG emission rate from a baseload combined-cycle natural gas fired plant. The legislation further requires that all electricity provided to California, including imported electricity, must be generated from plants that meet the standards set by CPUC and CEC.
SB 97 (2007). SB 97, signed by Governor Schwarzenegger in August 2007 (Chapter 185, Statutes of 2007; PRC, Sections 21083.05 and 21097), acknowledges climate change is a prominent environmental issue that requires analysis under CEQA. This bill directed the Governor’s Office of Planning and Research (OPR) to prepare, develop, and transmit to the California Resources Agency (CRA) by July 1, 2009, guidelines for mitigating GHG emissions or the effects of GHG emissions, as required by CEQA. This bill also removes any claim of inadequate CEQA analysis of effects of GHG emissions associated with environmental review for projects funded by the Highway Safety, Traffic Reduction, Air Quality and Port Security Bond Act of 2006 (Proposition 1B) or the Disaster Preparedness and Flood Protection Bond Act of 2006 (Proposition 1E).
SB 375 (2008). SB 375, signed in September 2008, aligns regional transportation planning efforts, regional GHG reduction targets, and land use and housing allocation. As part of the alignment, SB 375 requires MPOs to adopt a Sustainable Communities Strategy (SCS) or Alternative Planning Strategy (APS) that prescribes land use allocation in that MPO’s RTP. The CARB, in consultation with MPOs, is required to provide each affected region with reduction targets for GHGs emitted by passenger cars and light trucks in the region for the years 2020 and 2035. These reduction targets will be updated every 8 years, but they can be updated every 4 years if advancements in emissions technologies affect the reduction strategies to achieve the targets. The CARB is also charged with reviewing each MPO’s SCS or APS for consistency with its assigned GHG emission reduction targets. If MPOs do not meet the GHG reduction targets, transportation projects located in the MPO boundaries would not be eligible for funding programmed after January 1, 2012. This bill also extends the minimum time period for the Regional Housing Needs Allocation (RHNA) cycle from 5 years to 8 years for local governments located in an MPO that meets certain requirements.
E.O. S-3-05 (2005). Governor Schwarzenegger signed E.O. S-3-05 on June 1, 2005, which proclaimed that California is vulnerable to the impacts of climate change. The executive order declared increased temperatures could reduce snowpack in the Sierra Nevada

Van Ness Avenue Bus Rapid Transit Project Chapter 4: Affected Environment,Chapter 4: Affected Environment,Chapter 4: Affected Environment,Chapter 4: Affected Environment, Draft Environmental Impact Statement/ Environmental Consequences, andEnvironmental Consequences, andEnvironmental Consequences, andEnvironmental Consequences, and Environmental Impact Report Avoidance, Minimization, and/or Mitigation Measures Avoidance, Minimization, and/or Mitigation Measures Avoidance, Minimization, and/or Mitigation Measures Avoidance, Minimization, and/or Mitigation Measures
San Francisco County Transportation Authority October 2011 4.10-5
Mountains, further exacerbate California’s air quality problems, and potentially cause a rise in sea levels. To combat those concerns, the executive order established targets for total GHG emissions that include reducing GHG emissions to the 2000 level by 2010, to the 1990 level by 2020, and to 80 percent below the 1990 level by 2050. The executive order also directed the secretary of CalEPA to coordinate a multiagency effort to reduce GHG emissions to the target levels.
E.O. S-13-08. Governor Schwarzenegger signed E.O. S-13-08 on November 14, 2008, which directs California to develop methods for adapting to climate change through preparation of a statewide plan. The executive order directs OPR, in cooperation with the CRA, to provide land use planning guidance related to sea level rise and other climate change impacts by May 30, 2009. The order also directs the CRA to develop a State Climate Adaptation Strategy by June 30, 2009, and to convene an independent panel to complete the first California Sea Level Rise Assessment Report.
E.O. S-1-07. Governor Schwarzenegger signed E.O. S-1-07 in 2007, which proclaimed the transportation sector as the main source of GHG emissions in California. The executive order proclaims the transportation sector accounts for more than 40 percent of statewide GHG emissions. The executive order also establishes a goal to reduce the carbon intensity of transportation fuels sold in California by a minimum of 10 percent by 2020. In particular, the executive order established a Low-Carbon Fuel Standard (LCFS) and directed the Secretary for Environmental Protection to coordinate the actions of the CEC, the CARB, the University of California, and other agencies to develop and propose protocols for measuring the “life-cycle carbon intensity” of transportation fuels.
4.10.1.5LOCAL GREENHOUSE GAS REGULATIONS
BAAQMD Climate Protection Program. The BAAQMD established a climate protection program to reduce pollutants that contribute to global climate change and affect air quality in the BAAB. The climate protection program includes measures that promote energy efficiency, reduce vehicle miles traveled (VMT), and develop alternative sources of energy, all of which assist in reducing emissions of GHG and in reducing air pollutants that affect the health of residents. BAAQMD also seeks to support current climate protection programs in the region and to stimulate additional efforts through public education and outreach, technical assistance to local governments and other interested parties, and promotion of collaborative efforts among stakeholders.
4.10.1.6NATIONAL AND STATE AMBIENT AIR QUALITY STANDARDS
State and federal standards for major air pollutants are summarized in Table 4.10-1. Primary standards were established to protect the public health. Secondary standards are intended to protect the nation’s welfare and account for air pollutant effects on soil, water, visibility, materials, vegetation, and other aspects of the general welfare. Because the CAAQS are more stringent than the NAAQS, the CAAQS are used as the standard in the air quality analysis for the Van Ness Avenue BRT Project.
Attainment Status. Under CAA and CCAA requirements, areas are designated as either attainment or nonattainment for each criterion pollutant based on whether the NAAQS or CAAQS have been achieved. Areas are designated as nonattainment for a pollutant if air quality data show that a state or federal standard for the pollutant was violated at least once during the previous 3 calendar years. Exceedances that are affected by highly irregular or infrequent events are not considered violations of a state standard and are not used as a basis for designating areas as nonattainment. Under the CCAA, the San Francisco County portion of the BAAB is designated as a nonattainment area for ozone (O3), particulate matter less than 10 microns in diameter (PM10), and particulate matter less than 2.5 microns in diameter (PM2.5). Under the CAA, the San Francisco County portion of the BAAB is designated as a nonattainment area for O3.
Primary air quality standards for major air pollutants were established to protect the public health. Secondary standards are intended to protect the nation’s welfare and account for air pollutant effects on soil, water, visibility, materials, vegetation, and other aspects of the general welfare.
The transportation sector is the The transportation sector is the The transportation sector is the The transportation sector is the main source of GHGmain source of GHGmain source of GHGmain source of GHG emissions emissions emissions emissions in California, accounting for in California, accounting for in California, accounting for in California, accounting for more than 40 percent of more than 40 percent of more than 40 percent of more than 40 percent of statewide emissions. Executive statewide emissions. Executive statewide emissions. Executive statewide emissions. Executive Order SOrder SOrder SOrder S----1111----07 establishes a goal 07 establishes a goal 07 establishes a goal 07 establishes a goal of reducing the carbon intensity of reducing the carbon intensity of reducing the carbon intensity of reducing the carbon intensity of transportation fuels sold in of transportation fuels sold in of transportation fuels sold in of transportation fuels sold in California by a minimum of California by a minimum of California by a minimum of California by a minimum of 10 percent by 2020.10 percent by 2020.10 percent by 2020.10 percent by 2020.

Chapter 4: Affected Environment,Chapter 4: Affected Environment,Chapter 4: Affected Environment,Chapter 4: Affected Environment, Van Ness Avenue Bus Rapid Transit Project Environmental Consequences, andEnvironmental Consequences, andEnvironmental Consequences, andEnvironmental Consequences, and Draft Environmental Impact Statement/ Avoidance, Minimization, and/orAvoidance, Minimization, and/orAvoidance, Minimization, and/orAvoidance, Minimization, and/or Mitigation MeasuresMitigation MeasuresMitigation MeasuresMitigation Measures Environmental Impact Report
4.10-6 San Francisco County Transportation Authority October 2011
Table 4.10-1: State and National Ambient Air Quality Standards and Attainment Status for the Bay Area Air Basin
POLLUTANT AVERAGING PERIOD
CALIFORNIA FEDERAL
STANDARDS ATTAINMENT STATUS STANDARDS ATTAINMENT STATUS
Ozone (O3)
1-hour 0.09 ppm (180 µg/m3)
Nonattainment -- --
8-hour 0.070 ppm (137 µg/m3)
Nonattainment 0.075 ppm (147 µg/m3)
Nonattainment
Respirable Particulate Matter (PM10)
24-hour 50 µg/m3 Nonattainment 150 µg/m3 Attainment/ Maintenance
Annual Arithmetic Mean
20 µg/m3 Nonattainment -- --
Fine Particulate Matter (PM2.5)
24-hour -- -- 35 µg/m3 Nonattainment
Annual Arithmetic Mean
12 µg/m3 Nonattainment 15 µg/m3 Attainment
Carbon Monoxide (CO)
8-hour 9.0 ppm (10 mg/m3)
Attainment 9 ppm (10 mg/m3)
Attainment/ Maintenance
1-hour 20 ppm (23 mg/m3)
Attainment 35 ppm (40 mg/m3)
Attainment/ Maintenance
Nitrogen Dioxide (NO2)
Annual Arithmetic Mean
0.030 ppm (57 µg/m3)
Attainment 53 ppb (100 µg/m3)1
Unclassified
1-hour 0.18 ppm (338 µg/m3)
Attainment 100 ppb (188 µg/m3)1
Unclassified
Sulfur Dioxide (SO2)
24-hour 0.04 ppm (105 µg/m3)
Attainment --
3-hour -- -- -- --
1-hour 0.25 ppm (655 µg/m3)
Attainment 75 ppb (196 µg/m3)
Attainment
Lead (Pb)
30-day average
1.5 µg/m3 Attainment -- --
Calendar Quarter
-- -- 1.5 µg/m3 Attainment
Rolling 3-Month Average
-- -- 0.15 µg/m3 --
Visibility Reducing Particles
8-hour
Extinction coefficient of 0.23 per kilometer
Attainment
No Federal Standards Sulfates 24-hour 25 µg/m3 Attainment
Hydrogen Sulfide
1-hour 0.03 ppm (42 µg/m3)
Attainment
Vinyl Chloride
24-hour 0.01 ppm (26 µg/m3)
Attainment
1 EPA strengthened the NO2 standard on January 22, 2010. EPA has not classified attainment status for the new standards; however, CARB anticipates that the BAAB will be designated as an attainment area for the new NO2 standards. EPA is expected to issue final designations by January 22, 2012.
n/a = not available; — = not applicable; µg/m3 = micrograms per cubic meter; ppb = parts per billion; ppm = parts per million
SOURCE: CARB, 2010a.

Van Ness Avenue Bus Rapid Transit Project Chapter 4: Affected Environment,Chapter 4: Affected Environment,Chapter 4: Affected Environment,Chapter 4: Affected Environment, Draft Environmental Impact Statement/ Environmental Consequences, andEnvironmental Consequences, andEnvironmental Consequences, andEnvironmental Consequences, and Environmental Impact Report Avoidance, Minimization, and/or Mitigation Measures Avoidance, Minimization, and/or Mitigation Measures Avoidance, Minimization, and/or Mitigation Measures Avoidance, Minimization, and/or Mitigation Measures
San Francisco County Transportation Authority October 2011 4.10-7
Carbon Monoxide (CO). CO, a colorless and odorless gas, interferes with the transfer of oxygen to the brain. It can cause dizziness and fatigue and can impair central nervous system functions. CO is emitted almost exclusively from the incomplete combustion of fossil fuels. Automobile exhausts release most of the CO in urban areas. CO dissipates relatively quickly, so ambient CO concentrations generally follow the spatial and temporal distributions of vehicular traffic. CO concentrations are influenced by local meteorological conditions, primarily wind speed, topography, and atmospheric stability. The BAAB is in attainment for CO at both the federal and state levels.
Ozone (O3). O3, a colorless toxic gas, is the chief component of urban smog. O3 enters the blood stream and interferes with the transfer of oxygen, depriving sensitive tissues in the heart and brain of oxygen. O3 also damages vegetation by inhibiting growth. O3 forms in the atmosphere through a chemical reaction between reactive organic gases (ROG) and nitrogen oxides (NOX) under sunlight. Motor vehicles are the major sources of ROG and NOX. O3 is present in relatively high concentrations within the BAAB. Automobiles are the single largest source of O3 precursors in the BAAB. Under the CAA and the CCAA, the San Francisco County portion of the BAAB is designated as a nonattainment area for O3.
Nitrogen Dioxide (NO2). NO2 is a reddish-brown gas that is a by-product of combustion processes. Automobiles and industrial operations are the main sources of NO2. Aside from being a major contributor to ozone formation, NO2 can increase the risk of acute and chronic respiratory disease. It is an eye and lung irritant, and high concentrations can cause difficulty breathing. Studies have linked short-term exposure to increased asthma symptoms, respiratory illness, more difficulty controlling asthma, and increased visits to emergency departments. In addition, NO2 may be visible as a coloring component of a reddish-brown cloud on high pollution days, especially in conjunction with high ozone levels.
Sulfur Dioxide (SO2). SO2 is a product of high-sulfur fuel combustion. The main sources of SO2 are coal and oil used in power stations, in industries, and for domestic heating. Industrial chemical manufacturing is another source of SO2. SO2 is an irritant gas that attacks the throat and lungs. SO2 concentrations have been reduced to levels well below the state and national standards, but further reductions in emissions are needed to attain compliance with standards for sulfates and PM10, of which SO2 is a contributor. The BAAB is in attainment for SO2 at both the federal and state levels.
Suspended Particulate Matter (PM10 and PM2.5). Particulate matter consists of very small liquid and solid particles floating in the air, which can include smoke, soot, dust, salts, acids, and metals. Respirable particulate matter (PM10) refers to particulate matter less than 10 microns in diameter, approximately one/seventh the thickness of a human hair. Fine particulate matter (PM2.5) refers to particulate matter that is 2.5 microns or less in diameter, roughly 1/28th the diameter of a human hair. PM10 and PM2.5 pose a greater health risk than larger-size particles. When inhaled, these tiny particles can penetrate the human respiratory system’s natural defenses and damage the respiratory tract. Major sources of PM10 include motor vehicles; wood-burning stoves and fireplaces; dust from construction, landfills, and agriculture; wildfires and brush/waste burning; industrial sources; windblown dust from open lands; and atmospheric chemical and photochemical reactions. PM2.5 results from fuel combustion (from motor vehicles, power generation, industrial facilities), residential fireplaces, and wood stoves. In addition, PM2.5 can be formed in the atmosphere from gases such as SO2, NOX, and volatile organic compounds. In the BAAB, most particulate matter is caused by combustion, factories, construction, grading, demolition, agricultural activities, and motor vehicles. Motor vehicles are currently responsible for approximately half of the particulates in the BAAB. The San Francisco County portion of the BAAB is a nonattainment area for PM10 and PM2.5 under the CCAA.
Lead (Pb). Prior to 1978, mobile emissions were the primary source of Pb in air. Between 1978 and 1987, the phase-out of leaded gasoline reduced the overall inventory of airborne Pb by nearly 95 percent. Currently, industrial sources are the primary source of airborne Pb.

Chapter 4: Affected Environment,Chapter 4: Affected Environment,Chapter 4: Affected Environment,Chapter 4: Affected Environment, Van Ness Avenue Bus Rapid Transit Project Environmental Consequences, andEnvironmental Consequences, andEnvironmental Consequences, andEnvironmental Consequences, and Draft Environmental Impact Statement/ Avoidance, Minimization, and/orAvoidance, Minimization, and/orAvoidance, Minimization, and/orAvoidance, Minimization, and/or Mitigation MeasuresMitigation MeasuresMitigation MeasuresMitigation Measures Environmental Impact Report
4.10-8 San Francisco County Transportation Authority October 2011
Because the proposed project does not contain an industrial component, lead emissions were not analyzed in the air quality assessment.
Toxic Air Contaminants. In addition to the criteria air pollutants listed above, another group of pollutants, commonly referred to as TACs or HAPs, can result in health effects that can be quite severe. Many TACs are confirmed or suspected carcinogens, or they are known or suspected to cause birth defects or neurological damage. In addition, many TACs can be toxic at very low concentrations. For some chemicals, such as carcinogens, there are no thresholds below which exposure can be considered risk-free. Industrial facilities and mobile sources are significant sources of TACs. The electronics industry, including semiconductor manufacturing, has the potential to contaminate air and water due to the highly toxic chlorinated solvents commonly used in semiconductor production processes. Sources of TACs go beyond industry. Various common urban facilities also produce TAC emissions, such as gasoline stations (benzene), hospitals (ethylene oxide), and dry cleaners (perchloroethylene). Automobile exhaust also contains TACs such as benzene and 1,3-butadiene. Most recently, diesel particulate matter (DPM) was identified as a TAC by the CARB. DPM differs from other TACs in that it is not a single substance but rather a complex mixture of hundreds of substances. BAAQMD research indicates that mobile source emissions of DPM, benzene, and 1,3-butadiene represent a substantial portion of the ambient background risk from TACs in the BAAB.
Greenhouse Gases. Unlike emissions of criteria and toxic air pollutants, which have local or regional impacts, emissions of GHGs that contribute to global warming or global climate change have a broader, global impact. Global warming is a process whereby GHGs accumulating in the atmosphere contribute to an increase in the temperature of the earth’s atmosphere. The principal GHGs contributing to global warming are CO2, methane (CH4), nitrous oxide (N2O), and fluorinated compounds. These gases allow visible and ultraviolet light from the sun to pass through the atmosphere, but they prevent heat from escaping back out into space. Among the potential implications of global warming are rising sea levels and adverse impacts to water supply, water quality, agriculture, forestry, and habitats. In addition, global warming may increase electricity demand for cooling, decrease the availability of hydroelectric power, and affect regional air quality and public health. Like most criteria and toxic air pollutants, much of the GHG production comes from motor vehicles. GHG emissions can be reduced to some degree by improved coordination of land use and transportation planning on the city, county, and subregional level, and other measures to reduce automobile use. Energy conservation measures also can contribute to reductions in GHG emissions.
4.10.2Affected Environment
4.10.2.1CLIMATE
The BAAB is characterized by complex terrain, consisting of coastal mountain ranges, inland valleys, and bays that distort normal wind flow patterns. The area is also characterized by moderately wet winters and dry summers. San Francisco lies at the northern end of the peninsula. Because most of San Francisco's topography is below 200 feet in elevation, marine air is able to flow easily across most of the city, making its climate cool and windy.
The annual average temperature in the proposed project area, as recorded at the San Francisco Mission Dolores Station, is approximately 57.3 degrees Fahrenheit (°F). The proposed project area experiences an average winter temperature of approximately 52.3°F and an average summer temperature of approximately 60.0°F. The frequency of hot, sunny days during the summer months in the BAAB is another important factor that affects air pollution potential. Because temperatures in many of the BAAB inland valleys are so much higher than near the coast, the inland areas are especially prone to photochemical air pollution.
The BThe BThe BThe Bay ay ay ay AAAArea rea rea rea AAAAir ir ir ir BBBBasinasinasinasin is is is is characterized by complex characterized by complex characterized by complex characterized by complex
terrain, consisting of coastal terrain, consisting of coastal terrain, consisting of coastal terrain, consisting of coastal mountain ranges, inland valleysmountain ranges, inland valleysmountain ranges, inland valleysmountain ranges, inland valleys,,,,
and baysand baysand baysand bays thatthatthatthat distort normal distort normal distort normal distort normal wind flow patterns.wind flow patterns.wind flow patterns.wind flow patterns.

Van Ness Avenue Bus Rapid Transit Project Chapter 4: Affected Environment,Chapter 4: Affected Environment,Chapter 4: Affected Environment,Chapter 4: Affected Environment, Draft Environmental Impact Statement/ Environmental Consequences, andEnvironmental Consequences, andEnvironmental Consequences, andEnvironmental Consequences, and Environmental Impact Report Avoidance, Minimization, and/or Mitigation Measures Avoidance, Minimization, and/or Mitigation Measures Avoidance, Minimization, and/or Mitigation Measures Avoidance, Minimization, and/or Mitigation Measures
San Francisco County Transportation Authority October 2011 4.10-9
The amount of annual precipitation can vary greatly from one part of the BAAB to another even within short distances. In general, total annual rainfall can reach 40 inches in the mountains, but it is often less than 16 inches in sheltered valleys. Total precipitation in the proposed project area averages approximately 21.1 inches annually. Precipitation occurs mostly during the winter and relatively infrequently during the summer.
Wind speeds may be strong locally in areas where air is channeled through a narrow opening, such as the Carquinez Strait, the Golden Gate, or the San Bruno gap. Annual average wind speeds range from 5 to 10 mph throughout the peninsula, with higher wind speeds usually found along the coast. At the northern end of the peninsula in San Francisco, pollutant emissions are high, especially from motor vehicle congestion; however, winds here are generally fast enough to carry the pollutants away before they can accumulate. The highest air pollutant concentrations in the Bay Area generally occur during one of the two common types of inversions, when temperature increases as altitude increases, thereby preventing air close to the ground from mixing with the air above it. As a result, air pollutants are trapped near the ground. In the winter, the BAAB frequently experiences stormy conditions with moderate to strong winds, as well as periods of stagnation with very light winds.
4.10.2.2AIR MONITORING DATA
The BAAQMD monitors air quality conditions at 23 locations throughout the BAAB. The closest air monitoring station to the project area is the San Francisco Arkansas Street Monitoring Station, which is approximately 1.2 miles from the intersection of Van Ness Avenue and Mission Street and 2.8 miles from the intersection of Van Ness Avenue and Lombard Street. Historical data from the San Francisco Arkansas Street monitoring station was used to characterize existing conditions within the vicinity of the proposed project area and to establish a baseline for estimating future conditions with and without the proposed Van Ness Avenue BRT project.
A summary of the data recorded at this monitoring station during the 2007 to 2009 period is shown in Table 4.10-2. The CAAQS and NAAQS for the criteria pollutants are also shown in the table. As Table 4.10-2 indicates, PM10 exceeded the state 24-hour standard on 12 days during the period.
The San Francisco Department of Public Health (SFDPH) has created a map that displays PM2.5 concentrations resulting from vehicle emissions on City streets.45 The map was created by SFDPH using CARB’s EMFAC2007 vehicle emissions model and the EPA-approved CAL3QHCR Line Source Dispersion Model. CAL3QHCR is a Gaussian dispersion model that estimates air pollution concentrations based on physical characteristics of emissions, meteorology, topography, and receptor horizontal and vertical location. The map shows potential roadway exposure zones, which means those areas within the City and County of San Francisco that, by virtue of their proximity to freeways and major roadways, may exhibit high PM2.5 concentrations attributable to local roadway traffic sources. Based on dispersion model analysis, the Van Ness Avenue corridor currently has a relatively greater level of road traffic air pollution and associated air pollution health risks.
45 City and County of San Francisco Department of Public Health Environmental Health Section,
Proportion of Streets with Annual Average Daily PM2.5 Emissions 0.2 µg/m3 or Greater, 2011.
A BAAQMD air monitoring A BAAQMD air monitoring A BAAQMD air monitoring A BAAQMD air monitoring station.station.station.station.

Chapter 4: Affected Environment,Chapter 4: Affected Environment,Chapter 4: Affected Environment,Chapter 4: Affected Environment, Van Ness Avenue Bus Rapid Transit Project Environmental Consequences, andEnvironmental Consequences, andEnvironmental Consequences, andEnvironmental Consequences, and Draft Environmental Impact Statement/ Avoidance, Minimization, and/orAvoidance, Minimization, and/orAvoidance, Minimization, and/orAvoidance, Minimization, and/or Mitigation MeasuresMitigation MeasuresMitigation MeasuresMitigation Measures Environmental Impact Report
4.10-10 San Francisco County Transportation Authority October 2011
Table 4.10-2: 2007-2009 Ambient Air Quality Data in Project Vicinity
POLLUTANT POLLUTANT CONCENTRATION AND STANDARDS
NUMBER OF DAYS ABOVE STATE STANDARD
2007 2008 2009
Ozone (O3)
Maximum 1-hr Concentration (ppm)
Days > 0.09 ppm (State 1-hr standard)
Maximum 8-hr Concentration (ppm)
Days > 0.07 ppm (State 8-hr standard)
Days > 0.075 ppm (Federal 8-hr standard)
0.06
0
0.05
0
0
0.08
0
0.07
0
0
0.07
0
0.06
0
0
Carbon Monoxide (CO)
Maximum 1-hr concentration (ppm)
Days > 20 ppm (State 1-hr standard)
Days > 35 ppm (Federal 1-hr standard)
Maximum 8-hr concentration (ppm)
Days > 9.0 ppm (State 8-hr standard)
Days > 9.0 ppm (Federal 8-hr standard)
4
0
0
1.6
0
0
4
0
0
2.3
0
0
3
0
0
2.9
0
0
Nitrogen Dioxide (NO2)
Maximum 1-hr Concentration (ppm)
Days > 0.18 ppm (State 1-hr standard)
Days > 0.100 (Federal 1-hr standard)
0.07
0
0
0.06
0
0
0.06
0
0
Respirable Particulate Matter (PM10)
Maximum 24-hr concentration (µg/m3)
Estimated Days > 50 µg/m3 (State 24-hr standard)
Estimated Days > 150 µg/m3 (Federal 24-hr standard)
69.8
12
0
41.3
0
0
36.0
0
0
Fine Particulate Matter (PM2.5)
Annual Arithmetic Mean (µg/m3)
Exceed State Standard (12 µg/m3)
Exceed State Standard (15 µg/m3)
8.9
No
No
11.7
No
No
*/a/
Sulfur Dioxide3
Maximum 24-hr Concentration (ppm)
Days > 0.04 ppm (State 24-hr standard)
Days > 0.14 ppm (Federal 24-hr standard)
0.01
0
0
<0.01
0
0
*/a/
*/a/ Insufficient data.
SOURCE: BAAQMD, 2010; CARB, 2010b.
4.10.2.3SENSITIVE RECEPTORS
The following categories of people, as identified by the CARB, are considered most sensitive to air pollution: children under 14, the elderly over 65, athletes, and people with cardiovascular and chronic respiratory diseases. Locations that may contain a high concentration of these sensitive population groups are called sensitive receptors and include residential areas, hospitals, child-care facilities, elder care facilities, elementary schools, athletic facilities, playgrounds, and parks. Sensitive receptors that were identified on and near the Van Ness Avenue corridor include residential areas, schools, parks, retirement homes, and religious institutions. Public health research has found that the proximity and amount of vehicle traffic are associated in a statistically significant way with several adverse respiratory health outcomes – particularly in the sensitive receptors described above – including impairment of lung function in children, lung cancer, and asthma incidence or prevalence.

Van Ness Avenue Bus Rapid Transit Project Chapter 4: Affected Environment,Chapter 4: Affected Environment,Chapter 4: Affected Environment,Chapter 4: Affected Environment, Draft Environmental Impact Statement/ Environmental Consequences, andEnvironmental Consequences, andEnvironmental Consequences, andEnvironmental Consequences, and Environmental Impact Report Avoidance, Minimization, and/or Mitigation Measures Avoidance, Minimization, and/or Mitigation Measures Avoidance, Minimization, and/or Mitigation Measures Avoidance, Minimization, and/or Mitigation Measures
San Francisco County Transportation Authority October 2011 4.10-11
4.10.3Environmental Consequences
4.10.3.1METHODOLOGY AND SIGNIFICANCE CRITERIA
Regional operational emissions were quantified based on the VMT calculated for the proposed project using transportation models. Automobile emissions were quantified using light-duty emission factors obtained from the CARB EMFAC2007 Motor Vehicle Emissions Inventory Model. The on-road mobile source calculations assumed a systemwide vehicle speed of 11 mph based on the average speed for the Van Ness Avenue corridor as provided by SFCTA. The same methodology was used to quantify GHG emissions from automobiles, and the CO2 emission rates were obtained from EMFAC2007.
Certain land uses and industrial operations are more likely to cause odor emissions; hence, the discussion of operational odor emissions is based on land uses and their estimated odor potential.
Regional transportation conformity was analyzed by conducting research to check if the proposed project was included in a conforming RTP or Transportation Improvement Plan (TIP) with substantially the same design concept and scope as that of the proposed project. Project-level conformity was analyzed by determining if the proposed project would cause localized exceedances of CO, PM2.5, and/or PM10 standards, or if it would interfere with “timely implementation” of Transportation Control Measures (TCMs) called out in the State Implementation Plan (SIP).
The significance criteria BAAQMD has established to determine operational impacts under CEQA are listed below. The operation of the proposed project would cause a significant impact if:
• Operations would cause a net increase in emissions; • Increased traffic would generate CO concentrations at study intersections that exceed
the State 1- and 8-hour standards shown in Table 4-10-1; • Operational activity would create an odor nuisance; • Project alternatives would not be consistent with the BAAQMD air quality plans; and/or • Operations would cause a net increase in GHG emissions.
NEPA Adverse Impact Criteria. According to the CEQ regulations (40 CFR §§ 1500-1508), the determination of a significant impact is a function of context and intensity. Context means that the significance of an action must be analyzed in several contexts, such as society as a whole (i.e., human, national), the affected region, the affected interests, and the locality. Both short- and long-term effects are relevant. Intensity refers to the severity of impact. To determine significance, the severity of the impact must be examined in terms of the type, quality, and sensitivity of the resource involved; the location of the proposed project; the duration of the effect (i.e., short- or long-term), and other considerations of context. Adverse impacts will vary with the setting of the proposed action and the surrounding area.
4.10.3.2CEQA OPERATIONAL PHASE IMPACTS
Regional Operational Emissions – 2035
Regional operational emissions were estimated using EMFAC2007 emission rates. The citywide average vehicle speed was assumed to be 20 mph. Table 4-10-3 shows the net change in emissions for each of the build alternatives compared to the 2035 No Build Alternative. In addition, each alternative, including the No Build Alternative, would replace current electric buses with new electric buses, and replace current diesel buses with lower-emitting diesel hybrid buses.

Chapter 4: Affected Environment,Chapter 4: Affected Environment,Chapter 4: Affected Environment,Chapter 4: Affected Environment, Van Ness Avenue Bus Rapid Transit Project Environmental Consequences, andEnvironmental Consequences, andEnvironmental Consequences, andEnvironmental Consequences, and Draft Environmental Impact Statement/ Avoidance, Minimization, and/orAvoidance, Minimization, and/orAvoidance, Minimization, and/orAvoidance, Minimization, and/or Mitigation MeasuresMitigation MeasuresMitigation MeasuresMitigation Measures Environmental Impact Report
4.10-12 San Francisco County Transportation Authority October 2011
Table 4-10-3: Estimated Net Operational Emissions – 2035
ROG NOX PM10 PM2.5
BUILD ALTERNATIVE 2 VS. NO BUILD ALTERNATIVE
Pounds Per Day (13) (46) (11) (8)
Net Emissions Increase? No No No No
Tons Per Year (2) (8) (2) (2)
Net Emissions Increase? No No No No
BUILD ALTERNATIVES 3 & 4 (WITHOUT DESIGN OPTION B) VS. NO BUILD ALTERNATIVE
Pounds Per Day (14) (49) (12) (9)
Net Emissions Increase? No No No No
Tons Per Year (2) (9) (2) (2)
Net Emissions Increase? No No No No
BUILD ALTERNATIVES 3 & 4 (WITH DESIGN OPTION B) VS. NO BUILD ALTERNATIVE
Pounds Per Day (2) (7) (2) (1)
Net Emissions Increase? No No No No
Tons Per Year (<1) (1) (<1) (<1)
Net Emissions Increase? No No No No
SOURCE: Terry A. Hayes Associates Inc., Van Ness BRT Project Air Quality Impact Report, 2011.
Alternative 1: No Build (Baseline Alternative). The No Build Alternative assumes no BRT service. This alternative considers projected demographic and land use characteristics in addition to proposed traffic signal infrastructure for real-time traffic management improvements expected to be implemented independent of the Van Ness Avenue BRT Project by the near-term horizon year 2015, or long-range horizon year 2035. It is important to note that the No Build Alternative would neither increase nor decrease bus service on Van Ness Avenue; however, the proposed bus engine technology changes would reduce emissions below existing conditions.
Build Alternative 2: Side-Lane BRT with Street Parking. Under this alternative, as shown in Table 4-10-3, regional operational emissions would be reduced in the air basin compared to the No Build Alternative; therefore, the alternative would result in a beneficial impact under CEQA.
Build Alternative 3: Center-Lane BRT with Right-Side Boarding and Dual Medians. Under this alternative (both with and without Design Option B), as shown in Table 4-10-3, regional operational emissions would be reduced in the air basin compared to the No Build Alternative; therefore, the alternative would result in a beneficial impact under CEQA.
Build Alternative 4: Center-Lane BRT with Left-Side Boarding and Single Median. Under this alternative (both with and without Design Option B), as shown in Table 4-10-3, regional operational emissions would be reduced in the air basin compared to the No Build Alternative; therefore, the alternative would result in a beneficial impact under CEQA.
Regional Operational Emissions – Existing Plus Project (2007)
Existing plus Project emissions were estimated using the same methodology employed for 2035 emissions. Emissions are presented for Existing plus Project Conditions, consistent with the traffic analysis prepared for this project in which the 2015 Build scenarios are compared with the existing condition (CHS Consulting Group, 2011). Table 4-10-4 shows the net change in emissions for each of the build alternatives compared to the 2007 Existing Conditions.
K E Y F I N D I N G S
Proposed bus engine technology changes would reduce emissions below existing conditions even under the No Build Alternative.
Emissions would be further reduced under any of the
build alternatives.
Localized CO concentrations would result in a less-than-
significant impact for each build alternative under CEQA.
There would not be an increase in TAC emissions under any of
the build alternatives when compared with the No Build Alternative; therefore, TAC
emissions would result in a less-than-significant impact for each build alternative under CEQA.

Van Ness Avenue Bus Rapid Transit Project Chapter 4: Affected Environment,Chapter 4: Affected Environment,Chapter 4: Affected Environment,Chapter 4: Affected Environment, Draft Environmental Impact Statement/ Environmental Consequences, andEnvironmental Consequences, andEnvironmental Consequences, andEnvironmental Consequences, and Environmental Impact Report Avoidance, Minimization, and/or Mitigation Measures Avoidance, Minimization, and/or Mitigation Measures Avoidance, Minimization, and/or Mitigation Measures Avoidance, Minimization, and/or Mitigation Measures
San Francisco County Transportation Authority October 2011 4.10-13
Table 4-10-4: Estimated Net Operational Emissions – 2007
ROG NOX PM10 PM2.5
BUILD ALTERNATIVE 2 VS. EXISTING CONDITIONS
Pounds Per Day (119) (529) (23) (21)
Net Emissions Increase? No No No No
Tons Per Year (22) (97) (4) (4)
Net Emissions Increase? No No No No
BUILD ALTERNATIVES 3 & 4 (WITHOUT DESIGN OPTION B) VS. EXISTING CONDITIONS
Pounds Per Day (119) (532) (23) (21)
Net Emissions Increase? No No No No
Tons Per Year (2) (9) (2) (2)
Net Emissions Increase? No No No No
BUILD ALTERNATIVES 3 & 4 (WITH DESIGN OPTION B) VS. EXISTING CONDITIONS
Pounds Per Day (100) (444) (19) (18)
Net Emissions Increase? No No No No
Tons Per Year (18) (81) (4) (3)
Net Emissions Increase? No No No No
SOURCE: Terry A. Hayes Associates Inc., Van Ness BRT Project Air Quality Impact Report, 2011.
Build Alternative 2: Side-Lane BRT with Street Parking. Under this alternative, as shown in Table 4-10-4, regional operational emissions would be reduced in the air basin compared to existing conditions; therefore, the alternative would result in a beneficial impact under CEQA.
Build Alternative 3: Center-Lane BRT with Right-Side Boarding and Dual Medians. Under this alternative (both with and without Design Option B), as shown in Table 4-10-4, regional operational emissions would be reduced in the air basin compared to existing conditions; therefore, the alternative would result in a beneficial impact under CEQA.
Build Alternative 4: Center-Lane BRT with Left-Side Boarding and Single Median. Under this alternative (both with and without Design Option B), as shown in Table 4-10-4, regional operational emissions would be reduced in the air basin compared to existing conditions; therefore, the alternative would result in a beneficial impact under CEQA.
Localized Carbon Monoxide Emissions
Emissions and ambient concentrations of CO have decreased dramatically in the BAAB with the introduction of the catalytic converter in 1975. There have been no exceedances of the State or federal standards for CO since 1991. The BAAB is currently designated as an attainment area for the CAAQS and NAAQS for CO; however, elevated localized concentrations of CO still require consideration in the environmental review process. Occurrences of localized CO concentrations, known as hotspots, are often associated with heavy traffic congestion, which most frequently occurs at signalized intersections of high-volume roadways.
Each build alternative lessens traffic volumes compared to the No Build Alternative. Furthermore, they are consistent with the SFCTA Congestion Management Program; therefore, the proposed project is exempt from further analysis. In addition, the proposed project would not increase traffic volumes at any intersections to more than 24,000 vehicles per hour (vph). Localized CO concentrations would result in a less-than-significant impact for each alternative under CEQA.

Chapter 4: Affected Environment,Chapter 4: Affected Environment,Chapter 4: Affected Environment,Chapter 4: Affected Environment, Van Ness Avenue Bus Rapid Transit Project Environmental Consequences, andEnvironmental Consequences, andEnvironmental Consequences, andEnvironmental Consequences, and Draft Environmental Impact Statement/ Avoidance, Minimization, and/orAvoidance, Minimization, and/orAvoidance, Minimization, and/orAvoidance, Minimization, and/or Mitigation MeasuresMitigation MeasuresMitigation MeasuresMitigation Measures Environmental Impact Report
4.10-14 San Francisco County Transportation Authority October 2011
Under the No Build Alternative, the same updates in the bus fleet would occur, and no changes to operating schedules would occur. Because of the cleaner running fleet, and no increases in use, this alternative would result in a less-than-significant impact under CEQA.
Toxic Air Contaminants
The BAAQMD prioritizes TAC-emitting stationary sources based on the quantity and toxicity of the TAC emissions and the proximity of the facilities to sensitive receptors. The purpose of the proposed project is to improve transit operations along Van Ness Avenue by constructing within the ROW to allow operation of BRT. Each alternative has been determined to generate minimal air quality impacts for CAAA criteria pollutants and has not been linked with any special TAC concerns. As such, no project build alternative would result in any increases in traffic volumes, vehicle mix, basic project location, or any other factor that would cause an increase in TAC emissions of the proposed project compared to that of the No Build Alternative. In addition, updating the vehicle fleet from diesel buses to diesel hybrid buses would further reduce DPM; hence, TAC emissions would result in a less-than-significant impact for each alternative under CEQA.
Odor Emissions
The proposed project would not include any land use or activity that typically generates adverse odors, and it would result in a less-than-significant odor impact for each alternative under CEQA.
4.10.3.3NEPA OPERATIONAL PHASE IMPACTS
Regional Operational Emissions
Regional operational emissions were estimated using EMFAC2007 emission rates. The citywide average vehicle speed was assumed to be 20 mph. Table 4-10-3 shows the net change in emissions for each of the build alternatives compared to the 2035 No Build Alternative. In addition, each alternative, including the No Build Alternative, would replace current electric buses with new electric buses, and replace current diesel buses with lower-emitting diesel hybrid buses.
Alternative 1: No Build (Baseline Alternative). This alternative would not include a BRT service and considers projected demographic and land use characteristics in addition to proposed traffic signal infrastructure for real-time traffic management improvements; however, the bus improvements associated with each alternative would still be implemented. These improvements include replacing the current electric buses with new electric buses, and replacing the current diesel buses with lower-emitting diesel hybrid buses.
Build Alternative 2: Side-Lane BRT with Street Parking. As indicated in Table 4-10-3, this alternative would reduce ROG, NOX, PM10, and PM2.5 emissions compared to the No Build Alternative. Due to the reduction in automobile VMT, and replacement of the bus fleet with cleaner vehicles, Build Alternative 2 would result in a beneficial impact under NEPA.
Build Alternative 3: Center-Lane BRT with Right-Side Boarding and Dual Medians. As indicated in Table 4-10-3, this alternative would reduce ROG, NOX, PM10, and PM2.5 emissions compared to the No Build Alternative. Under this alternative, the automobile VMT would be reduced, and the bus fleet would be replaced with cleaner vehicles. Build Alternative 3 (both with and without Design Option B) would result in a beneficial impact under NEPA.
Build Alternative 4: Center-Lane BRT with Left-Side Boarding and Single Median. As indicated in Table 4-10-3, this alternative would reduce ROG, NOX, PM10, and PM2.5 emissions compared to the No Build Alternative. Under this alternative, the automobile VMT would
K E Y F I N D I N G
All of the build alternatives would reduce ROG, NOX, PM10,
and PM2.5 emissions compared to the No Build Alternative.
Due to the reduction in automobile VMT and
replacement of the bus fleet with cleaner vehicles, each build alternative would result in a
beneficial impact under NEPA.

Van Ness Avenue Bus Rapid Transit Project Chapter 4: Affected Environment,Chapter 4: Affected Environment,Chapter 4: Affected Environment,Chapter 4: Affected Environment, Draft Environmental Impact Statement/ Environmental Consequences, andEnvironmental Consequences, andEnvironmental Consequences, andEnvironmental Consequences, and Environmental Impact Report Avoidance, Minimization, and/or Mitigation Measures Avoidance, Minimization, and/or Mitigation Measures Avoidance, Minimization, and/or Mitigation Measures Avoidance, Minimization, and/or Mitigation Measures
San Francisco County Transportation Authority October 2011 4.10-15
be reduced, and the bus fleet would be replaced with cleaner vehicles. Build Alternative 4 (both with and without Design Option B) would result in a beneficial impact under NEPA.
Localized Carbon Monoxide Emissions
The proposed project would replace each electric coach currently in the vehicle fleet with newer coaches and replace each diesel coach with a diesel hybrid coach. These diesel hybrid coaches have lower emissions when compared to their standard diesel counterparts. In addition, compared to the No Build Alternative, each build alternative for the proposed project would reduce VMT in San Francisco. Because of cleaner vehicles and lower overall VMT, the proposed project would not result in any increases in emissions, including CO and particulate matter; hence, none of the build alternatives would result in an adverse impact under NEPA.
Under the No Build Alternative, the same updates to the bus fleet would occur, and no changes to operating schedules would occur. Because of the cleaner running fleet and no increases in use, this alternative would not result in an adverse impact under NEPA.
Toxic Air Contaminants
The purpose of the proposed project is to improve transit operations along Van Ness Avenue by providing exclusive lanes for a BRT service. Each alternative has been determined to generate minimal air quality impacts for CAAA criteria pollutants and has not been linked with any special MSAT concerns. As such, no alternative would result in an increase in traffic volumes, vehicle mix, basic project location, or any other factor that would cause an increase in MSAT impacts of the proposed project compared to that of the No Build Alternative. In addition to this, changing the vehicle fleet from diesel buses to diesel hybrid buses would further reduce DPM.
Moreover, EPA regulations for vehicle engines and fuels will cause overall MSAT emissions to decline significantly over the next several decades. None of the alternatives would result in an adverse TAC impact under NEPA.
Odor Emissions
The proposed project would not include any land use or activity that typically generates adverse odors, and none of the alternatives would result in an adverse odor impact under NEPA.
4.10.4Avoidance, Minimization, and/or Mitigation Measures
No adverse impacts are anticipated; therefore, no minimization or mitigation measures are recommended.
4.10.5Transportation Conformity Impacts
Transportation conformity is required under CAA Section 176(c) (42 U.S.C. 7506(c)) to ensure that federally supported highway and transit project activities are consistent with the purpose of the SIP. Conformity to the purpose of the SIP means that transportation activities will not cause new air quality violations, worsen existing violations, or delay timely attainment of the relevant NAAQS. EPA’s transportation conformity rule (40 CFR 51.390 and Part 93) establishes the criteria and procedures for determining whether transportation
Because of similar vehicles to the No Build Alternative and lower VMT for autos, the build alternatives would not result in any increases in emissions, including CO and particulate matter. In addition, the build alternatives would lower overall VMT; hence, none of the alternatives would result in an adverse impact under NEPA.
K E Y F I N D I N G
None of the build alternatives would result in an adverse TAC impact under NEPA.
D E F I N I T I O N
Transportation conformity means that transportation activities will not cause new air quality violations, worsen existing violations, or delay timely attainment of the relevant National Ambient Air Quality Standards (NAAQS).

Chapter 4: Affected Environment,Chapter 4: Affected Environment,Chapter 4: Affected Environment,Chapter 4: Affected Environment, Van Ness Avenue Bus Rapid Transit Project Environmental Consequences, andEnvironmental Consequences, andEnvironmental Consequences, andEnvironmental Consequences, and Draft Environmental Impact Statement/ Avoidance, Minimization, and/orAvoidance, Minimization, and/orAvoidance, Minimization, and/orAvoidance, Minimization, and/or Mitigation MeasuresMitigation MeasuresMitigation MeasuresMitigation Measures Environmental Impact Report
4.10-16 San Francisco County Transportation Authority October 2011
activities conform to the SIP. Under the criteria, transportation projects must demonstrate conformity on regional and local levels.
The proposed project was included in the regional emissions analysis completed by MTC for the conforming Transportation 2035 Plan. The design concept and scope of the proposed project have not changed significantly from what was analyzed in the Transportation 2035 Plan. This analysis found that the plan and, therefore, the individual projects contained in the plan, are conforming projects, and will have air quality impacts consistent with those identified in the SIP for achieving the NAAQS. Furthermore, FHWA determined the Transportation 2035 Plan to conform to the SIP in May 2009.
The proposed project is also included in the federal 2009 TIP. FHWA/FTA determined the TIP to conform to the SIP on November 17, 2008. The proposed project is consistent with regional conformity guidelines.
The California Project-Level Carbon Monoxide Protocol (CO Protocol) was used to conduct a CO analysis for the proposed project. Part of the CO analysis includes the screening procedure found at Level 2 of the flow chart in Figure 3 in the CO Protocol. First, the proposed project would not significantly contribute to cold start percentages because no additional land uses are proposed that would add vehicle trips to the area. Second, the proposed project does not propose any additional land uses in the area and, as a result, would not generate any additional trips. The project would reduce regional VMT, especially vehicle trips located in and near the project corridor. Third, the proposed project would not impede the flow of traffic in the project area. The traffic study states that the average travel speed for most of the streets under the build alternatives would remain approximately the same (± 0.3-mph) as the No Build Alternative, and no segment would see the speed decrease by more than 0.9-mph). Fourth, the proposed project would not move traffic closer to any sensitive receptors in the region. Although Design Variation Center B does not add significantly enough additional traffic volumes on Franklin/Gough to be measurable from an emissions perspective, eliminating left turns could increase traffic volumes along certain roadway segments. As discussed in Section 4.10.3.2 (Localized Emissions), the project would not result in a localized CO hot spot based on BAAQMD guidance. The proposed project satisfies all of the conditions of Level 2 of the CO Protocol in order to be screened out; therefore, the proposed project would not have the potential for causing or worsening violation of the NAAQS for CO.
Qualitative particulate matter hotspot analysis is required under the EPA Transportation Conformity rule for Projects of Air Quality Concern (POAQC). Projects that are not POAQC are not required to complete a detailed particulate matter hotspot analysis. According to the EPA Transportation Conformity Guidance, the following types of projects are considered POAQC:
• New or expanded highway projects that have a significant number of or significant increase in diesel vehicles (defined as greater than 125,000 Annual Average Daily Traffic (AADT) and 8 percent or more of such AADT is diesel truck traffic);
• Projects affecting intersections that are at LOS D, E, or F, with a significant number of diesel vehicles, or that that will change to LOS D, E, or F because of increased traffic volumes from a significant number of diesel vehicles related to the project;
• New bus and rail terminals and transfer points that have a significant number of diesel vehicles congregating at a single location;
• Expanded bus and rail terminals and transfer points that significantly increase the number of diesel vehicles congregating at a single location; or
• Projects in or affecting locations, areas, or categories of sites that are identified in the PM2.5 or PM10 implementation plan or implementation plan submission, as appropriate, as sites of possible violation.
The proposed project is not considered a POAQC because it does not meet the definition of a POAQC as defined in EPA’s Transportation Conformity Guidance. The proposed project would not increase the percentage of diesel vehicles on the roadway, does not
K E Y F I N D I N G
The proposed project is consistent with regional conformity guidelines.

Van Ness Avenue Bus Rapid Transit Project Chapter 4: Affected Environment,Chapter 4: Affected Environment,Chapter 4: Affected Environment,Chapter 4: Affected Environment, Draft Environmental Impact Statement/ Environmental Consequences, andEnvironmental Consequences, andEnvironmental Consequences, andEnvironmental Consequences, and Environmental Impact Report Avoidance, Minimization, and/or Mitigation Measures Avoidance, Minimization, and/or Mitigation Measures Avoidance, Minimization, and/or Mitigation Measures Avoidance, Minimization, and/or Mitigation Measures
San Francisco County Transportation Authority October 2011 4.10-17
involve a bus or rail terminal that significantly increases diesel vehicles, and is not identified in the SIP as a possible PM2.5 or PM10 violation site. A particulate matter hotspot analysis is not required.
4.10.6Greenhouse Gas Emissions
4.10.6.1GREENHOUSE GAS EMISSIONS – 2035
The largest source of GHG emissions are from automobiles. Public transportation projects generally reduce the amount of cars driving on the road by providing the public with alternative means of transportation. Less cars on the road leads to less sources of pollution. Because of the higher capacity of buses and the updated fleet associated with the proposed project, buses are able to transport higher quantities of people while producing fewer emissions than the cars they are replacing. This results in a reduction in GHG emissions. Total gross GHG emissions are shown in Table 4.10-5. Table 4.10-6 shows the net difference in citywide VMT and CO2e for each alternative.
Table 4.10-5: Estimated Gross Citywide Greenhouse Gas Emissions – 2035
SCENARIO VMT CARBON DIOXIDE EQUIVALENT
(METRIC TONS PER YEAR)
2035 Baseline 11,965,507 3,467,095
Build Alternative 2 11,891,952 3,445,782
Build Alternatives 3 and 4 without Design Option B 11,887,251 3,444,419
Build Alternatives 3 and 4 with Design Option B 11,953,541 3,463,627
SOURCE: Terry A. Hayes Associates Inc., Van Ness BRT Project Air Quality Impact Report, 2011.
Table 4.10-6: Estimated Net Citywide Greenhouse Gas Emissions – 2035
SCENARIO NET INCREASE IN VMT
CARBON DIOXIDE EQUIVALENT
(METRIC TONS PER YEAR)
Baseline versus Build Alternative 2 (73,555) (21,313)
Net Increase in GHG Emissions? No
Baseline versus Build Alternatives 3 and 4 without Design Option B
(78,256) (22,675)
Net Increase in GHG Emissions? No
Baseline versus Build Alternatives 3 and 4 with Design Option B
(11,966) (3,467)
Net Increase in GHG Emissions? No
SOURCE: Terry A. Hayes Associates Inc., Van Ness BRT Project Air Quality Impact Report, 2011.
Alternative 1: No Build (Baseline Alternative)
The No-Build Alternative would not include a BRT service; however, the bus improvements associated with each alternative would still be implemented. These improvements include replacing the current electric buses with new electric buses and replacing the current diesel buses with lower-emitting diesel hybrid buses. Because of these improvements, GHG emissions would be reduced below existing conditions. This would result in a beneficial global warming impact.
K E Y F I N D I N G
Bus fleet improvements under all alternatives include replacing the current electric buses with new electric buses and replacing the current diesel buses with lower-emitting diesel hybrid buses. In addition, the build alternatives would lower overall VMT; hence, GHG emissions would be reduced below existing conditions, resulting in a beneficial global warming impact.

Chapter 4: Affected Environment,Chapter 4: Affected Environment,Chapter 4: Affected Environment,Chapter 4: Affected Environment, Van Ness Avenue Bus Rapid Transit Project Environmental Consequences, andEnvironmental Consequences, andEnvironmental Consequences, andEnvironmental Consequences, and Draft Environmental Impact Statement/ Avoidance, Minimization, and/orAvoidance, Minimization, and/orAvoidance, Minimization, and/orAvoidance, Minimization, and/or Mitigation MeasuresMitigation MeasuresMitigation MeasuresMitigation Measures Environmental Impact Report
4.10-18 San Francisco County Transportation Authority October 2011
Build Alternative 2: Side-Lane BRT with Street Parking
As shown in Table 4.10-6, Build Alternative 2 would decrease automobile VMT and associated GHG emissions compared to baseline conditions by 21,313 tons per year. Build Alternative 2 would result in less GHG emissions than baseline conditions, and it would cause a beneficial global warming impact.
Build Alternative 3: Center-Lane BRT with Right-Side Boarding and Dual Medians
As shown in Table 4.10-6, Build Alternative 3 would decrease automobile VMT and associated GHG emissions compared to baseline conditions by 22,675 tons per year. Build Alternative 3 would result in less GHG emissions than baseline conditions, and it would cause a beneficial global warming impact.
Center-Lane Alternative Design Option B. As shown in Table 4.10-6, Design Option B under Build Alternative 3 would decrease automobile VMT and associated GHG emissions compared to baseline conditions by 3,467 tons per year. Design Option B under Build Alternative 3 would result in less GHG emissions than baseline conditions, and it would cause a beneficial global warming impact.
Build Alternative 4: Center-Lane BRT with Left-Side Boarding and Single Median
As shown in Table 4.10-6, Build Alternative 4 would decrease automobile VMT and associated GHG emissions by the same amount as Build Alternative 3, causing a beneficial global warming impact.
Center-Lane Alternative Design Option B. As shown in Table 4.10-6, Build Alternative 4 with incorporation of Design Option B automobile VMT would be the same as for Build Alternative 3. GHG emissions, displayed in Table 4.10-6, would be reduced in the Air Basin. Design Option B under Build Alternative 4 would cause a beneficial global warming impact.
4.10.6.2GREENHOUSE GAS EMISSIONS – EXISTING PLUS PROJECT (2007)
Total gross GHG emissions for Existing plus Project conditions are shown in Table 4.10-7. Table 4.10-8 shows the net difference in citywide VMT and CO2e for each alternative.
Table 4.10-7: Estimated Gross Citywide Greenhouse Gas Emissions – 2007
SCENARIO VMT CARBON DIOXIDE EQUIVALENT
(METRIC TONS PER YEAR)
Existing Conditions 10,100,425 2,359,120
Build Alternative 2 9,940,405 2,321,745
Build Alternatives 3 and 4 without Design Option B 9,939,510 2,321,536
Build Alternatives 3 and 4 with Design Option B 9,965,954 2,327,712
SOURCE: Terry A. Hayes Associates Inc., Van Ness BRT Project Air Quality Impact Report, 2011.

Van Ness Avenue Bus Rapid Transit Project Chapter 4: Affected Environment,Chapter 4: Affected Environment,Chapter 4: Affected Environment,Chapter 4: Affected Environment, Draft Environmental Impact Statement/ Environmental Consequences, andEnvironmental Consequences, andEnvironmental Consequences, andEnvironmental Consequences, and Environmental Impact Report Avoidance, Minimization, and/or Mitigation Measures Avoidance, Minimization, and/or Mitigation Measures Avoidance, Minimization, and/or Mitigation Measures Avoidance, Minimization, and/or Mitigation Measures
San Francisco County Transportation Authority October 2011 4.10-19
Table 4.10-8: Estimated Net Citywide Greenhouse Gas Emissions – 2007
SCENARIO NET INCREASE IN VMT
CARBON DIOXIDE EQUIVALENT
(METRIC TONS PER YEAR)
Existing versus Build Alternative 2 (160,020) (37,375)
Net Increase in GHG Emissions? No
Existing versus Build Alternatives 3 and 4 without Design Option B
(160,915) (37,584)
Net Increase in GHG Emissions? No
Existing versus Build Alternatives 3 and 4 with Design Option B
(134,471) (31,408)
Net Increase in GHG Emissions? No
SOURCE: Terry A. Hayes Associates Inc., Van Ness BRT Project Air Quality Impact Report, 2011.
Build Alternative 2: Side-Lane BRT with Street Parking
As shown in Table 4.10-8, Build Alternative 2 would decrease automobile VMT and associated GHG emissions compared to baseline conditions by 37,375 tons per year. Build Alternative 2 would result in less GHG emissions than baseline conditions, and it would cause a beneficial global warming impact.
Build Alternative 3: Center-Lane BRT with Right-Side Boarding and Dual Medians
As shown in Table 4.10-8, Build Alternative 3 would decrease automobile VMT and associated GHG emissions compared to baseline conditions by 37,584 tons per year. Build Alternative 3 would result in less GHG emissions than baseline conditions, and it would cause a beneficial global warming impact.
Center-Lane Alternative Design Option B. As shown in Table 4.10-8, Design Option B under Build Alternative 3 would decrease automobile VMT and associated GHG emissions compared to baseline conditions by 31,408 tons per year. Design Option B under Build Alternative 3 would result in less GHG emissions than baseline conditions, and it would cause a beneficial global warming impact.
Build Alternative 4: Center-Lane BRT with Left-Side Boarding and Single Median
As shown in Table 4.10-8, Build Alternative 4 would decrease automobile VMT and associated GHG emissions by the same amount as Build Alternative 3, causing a beneficial global warming impact.
Center-Lane Alternative Design Option B. As shown in Table 4.10-8, Build Alternative 4 with incorporation of Design Option B automobile VMT would be the same as for Build Alternative 3. GHG emissions, displayed in Table 4.10-8, would be reduced in the Air Basin. Design Option B under Build Alternative 4 would cause a beneficial global warming impact.

Chapter 4: Affected Environment,Chapter 4: Affected Environment,Chapter 4: Affected Environment,Chapter 4: Affected Environment, Van Ness Avenue Bus Rapid Transit Project Environmental Consequences, andEnvironmental Consequences, andEnvironmental Consequences, andEnvironmental Consequences, and Draft Environmental Impact Statement/ Avoidance, Minimization, and/orAvoidance, Minimization, and/orAvoidance, Minimization, and/orAvoidance, Minimization, and/or Mitigation MeasuresMitigation MeasuresMitigation MeasuresMitigation Measures Environmental Impact Report
4.10-20 San Francisco County Transportation Authority October 2011
This page intentionally left blank.

Van Ness Avenue Bus Rapid Transit Project Chapter 4: Affected Environment,Chapter 4: Affected Environment,Chapter 4: Affected Environment,Chapter 4: Affected Environment, Draft Environmental Impact Statement/ Environmental Consequences, andEnvironmental Consequences, andEnvironmental Consequences, andEnvironmental Consequences, and Environmental Impact Report Avoidance, Minimization, and/or Mitigation Measures Avoidance, Minimization, and/or Mitigation Measures Avoidance, Minimization, and/or Mitigation Measures Avoidance, Minimization, and/or Mitigation Measures
San Francisco County Transportation Authority October 2011 4.11-1
D E F I N I T I O N S
DECIBEL (dB): The accepted standard unit for measuring the amplitude of sound.
SOUND PRESSURE LEVEL (Lp): The level of noise measured at a receiver at any moment in time.
A-WEIGHTED: Filtering a noise signal in a manner corresponding to the way that the human ear perceives sound.
EQUIVALENT CONTINUOUS NOISE LEVEL (Leq): The steady-state A-weighted sound pressure level normally used to describe community noise. Leq contains the same acoustical energy as the time-varying A-weighted sound pressure level during the same time interval, because community noise levels usually change continuously during the day.
DAY-NIGHT AVERAGE SOUND PRESSURE LEVEL (Ldn): A 24-hour average sound pressure level with a 10-dB time-of-day weighting added to sound pressure levels in 9 nighttime hours. This adjustment is an effort to account for the increased sensitivity to nighttime noise events.
MAXIMUM SOUND PRESSURE LEVEL (Lmax): The greatest instantaneous sound pressure level observed during a single noise measurement interval.
SOUND EXPOSURE LEVEL (SEL): A receiver’s cumulative noise exposure from a single noise event.
4.11 Noise and Vibration This section summarizes the noise and vibration regulatory setting, affected environment, environmental consequences, and measures to mitigate impacts as a result of the proposed Van Ness Avenue BRT project. Construction-phase impacts and avoidance measures are presented in Section 4.15-10. The No Build Alternative serves as the future baseline for considering net project noise impacts for the purposes of this analysis. Differences in noise impacts between Build Alternatives 3 and 4 are expected to be negligible. Accordingly, impacts along Van Ness Avenue are evaluated for Build Alternative 2 and Build Alternatives 3 and 4 combined. Noise impacts from traffic diverted onto adjacent streets are evaluated only for the worst-case build alternative and worst-case design variation, whichever condition would divert the most traffic to those streets.
4.11.1Terminology
Noise is usually defined as sound that is undesirable, because it interferes with speech communication and hearing, or is otherwise annoying (i.e., unwanted sound). Under certain conditions, noise may cause hearing loss, interfere with human activities, and in various ways may affect people’s health and well being, which is cause for an analysis of noise. Studies used by the San Francisco Department of Public Health have shown that exposure to high levels of noise, including road traffic in certain circumstances, has a causal influence on some negative health outcomes such as high blood pressure and ischemic heart disease.
Sound pressure level (Lp) can vary over an extremely large range of amplitude. Lp describes the level of noise measured at a receiver at any moment in time and is read directly from a sound-level meter. The decibel (dB) is the accepted standard unit for measuring the amplitude of sound. When describing sound and its effect on a human population, A-weighted (dBA) sound pressure levels are typically used to account for the response of the human ear. The term “A-weighted” refers to a filtering of the noise signal in a manner corresponding to the way that the human ear perceives sound. The A-weighted noise level has been found to correlate well with people’s judgments of the noisiness of different sounds, and it has been used for many years as a measure of community noise. Figure 4.11-1 illustrates typical A-weighted sound pressure levels for various noise sources.
Community noise levels usually change continuously during the day. The equivalent continuous A-weighted sound pressure level (Leq) is normally used to describe community noise. The Leq is the equivalent steady-state A-weighted sound pressure level that would contain the same acoustical energy as the time-varying A-weighted sound pressure level during the same time interval. The maximum sound pressure level (Lmax) is the greatest instantaneous sound pressure level observed during a single noise measurement interval. The sound exposure level (SEL) describes a receiver’s cumulative noise exposure from a single noise event. It is represented by the total A-weighted sound energy during the event, normalized to a 1-second interval.
Another descriptor, the day-night average sound pressure level (Ldn), was developed to evaluate the total daily community noise environment. The Ldn is a 24-hour average sound pressure level with a 10-dB time-of-day weighting added to sound pressure levels in the nine nighttime hours from 10:00 p.m. to 7:00 a.m. This nighttime 10-dB adjustment is an effort to account for the increased sensitivity to nighttime noise events. FTA uses Ldn and Leq to evaluate BRT noise impacts in surrounding communities.
Vibration is an oscillatory motion that can be described in terms of displacement, velocity, or acceleration. Displacement, in the case of a vibrating floor, is simply the distance that a point on the floor moves away from its static position. The velocity represents the instantaneous speed of the floor movement, and acceleration is the rate of change of the speed. The response

Chapter 4: Chapter 4: Chapter 4: Chapter 4: Affected Environment,Affected Environment,Affected Environment,Affected Environment, Van Ness Avenue Bus Rapid Transit Project Environmental Consequences, andEnvironmental Consequences, andEnvironmental Consequences, andEnvironmental Consequences, and Draft Environmental Impact Statement/ Avoidance, Minimization, and/or Mitigation MeasuresAvoidance, Minimization, and/or Mitigation MeasuresAvoidance, Minimization, and/or Mitigation MeasuresAvoidance, Minimization, and/or Mitigation Measures Environmental Impact Report
4.11-2 San Francisco County Transportation Authority October 2011
of humans, buildings, and equipment to vibration is normally described using velocity or acceleration. In this analysis, velocity will be used in describing ground-borne vibration.
Figure 4.11-1: Typical A-Weighted Sound Levels
Source: FTA, 2006.
Vibration amplitudes are usually expressed as either peak particle velocity (PPV) or the root mean square (RMS) velocity. The PPV is defined as the maximum instantaneous peak of the vibration signal. The RMS of a signal is the average of the squared amplitude of the signal. Although PPV is appropriate for evaluating the potential for building damage, it is not suitable for evaluating human response. Because it takes some time for the human body to respond to vibration signals, RMS amplitude is more appropriate to evaluate human response to vibration than PPV. For sources such as trucks or motor vehicles, peak vibration levels are typically 6 to 14 dB higher than RMS levels. FTA uses the abbreviation “VdB” for vibration decibels to reduce the potential for confusion with sound decibel.
The RMS VdB is used to describe human annoyance criteria and impacts and uses a reference quantity of 1 micro-inch per second. Decibel notation acts to compress the range of numbers required in measuring vibration. Figure 4.11-2 illustrates common vibration sources and the human and structural responses to ground-borne vibration. As shown in Figure 4.11-2, the threshold of perception for human response is approximately 65 VdB; however, human response to vibration is not usually significant unless the vibration exceeds 70 VdB. Vibration tolerance limits for sensitive instruments, such as magnetic resonance imaging (MRI) or electron microscopes, could be much lower than the human vibration perception threshold.
Similar to the noise descriptors, Leq and Lmax can be used to describe the average vibration and the maximum vibration level observed during a single vibration measurement interval.

Van Ness Avenue Bus Rapid Transit Project Chapter 4: Affected Environment,Chapter 4: Affected Environment,Chapter 4: Affected Environment,Chapter 4: Affected Environment, Draft Environmental Impact Statement/ Environmental Consequences, andEnvironmental Consequences, andEnvironmental Consequences, andEnvironmental Consequences, and Environmental Impact Report Avoidance, Minimization, and/or Mitigation Measures Avoidance, Minimization, and/or Mitigation Measures Avoidance, Minimization, and/or Mitigation Measures Avoidance, Minimization, and/or Mitigation Measures
San Francisco County Transportation Authority October 2011 4.11-3
The amount that transit projects are allowed to change the overall noise environment is reduced with increasing levels of existing noise.
Figure 4.11-2: Typical Levels of Ground-borne Vibration
Source: FTA, 2006.
4.11.2Regulatory Setting
This section presents the guidelines, criteria, and regulations used to assess noise and vibration impacts associated with the proposed project. Because SFCTA, the lead agency under CEQA, is developing the proposed project in cooperation with FTA, noise and vibration impact evaluation is conducted using the criteria set forth by FTA and the City of San Francisco.
4.11.2.1FTA NOISE IMPACT CRITERIA
The criteria and methodologies in the FTA Noise Impact Assessment Spreadsheet46 were used, consistent with the Transit Noise and Vibration Impact Assessment (FTA, 2006), to assess existing ambient noise levels and future noise impacts from BRT operations. They are founded on well-documented research on community reaction to noise and are based on change in noise exposure using a sliding scale. The amount that transit projects are allowed to change the overall noise environment is reduced with increasing levels of existing noise. The noise metrics applied by FTA to three categories of land use are summarized in Table 4.11-1.
46 http://www.fta.dot.gov/documents/Noise_Impact_Assessment_Spreadsheet.xls.

Chapter 4: Chapter 4: Chapter 4: Chapter 4: Affected Environment,Affected Environment,Affected Environment,Affected Environment, Van Ness Avenue Bus Rapid Transit Project Environmental Consequences, andEnvironmental Consequences, andEnvironmental Consequences, andEnvironmental Consequences, and Draft Environmental Impact Statement/ Avoidance, Minimization, and/or Mitigation MeasuresAvoidance, Minimization, and/or Mitigation MeasuresAvoidance, Minimization, and/or Mitigation MeasuresAvoidance, Minimization, and/or Mitigation Measures Environmental Impact Report
4.11-4 San Francisco County Transportation Authority October 2011
Table 4.11-1: Land Use Categories and Metrics for Transit Noise Impact Criteria
LAND USE CATEGORY
NOISE METRIC, DBA
DESCRIPTION OF LAND USE CATEGORY
1 Outdoor Leq(h)*
Tracts of land where quiet is an essential element in their intended purpose. This category includes lands set aside for serenity and quiet, and such land uses as outdoor amphitheaters and concert pavilions, as well as National Historic Landmarks with significant outdoor use. Also included are recording studios and concert halls.
2 Outdoor Ldn
Residences and buildings where people normally sleep. This category includes homes, hospitals, and hotels where a nighttime sensitivity to noise is assumed to be of utmost importance.
3 Outdoor Leq(h)*
Institutional land uses with primarily daytime and evening use. This category includes schools, libraries, theaters, and churches where it is important to avoid interference with such activities as speech, meditation, and concentration on reading material. Places for meditation or study associated with cemeteries, monuments, museums, campgrounds and recreational facilities can also be considered to be in this category. Certain historical sites and parks are also included.
Note: * Leq for the noisiest hour of transit-related activity during hours of noise sensitivity.
Source: FTA, 2006.
Ldn is used to characterize noise exposure for residential areas and hotels (Category 2). The maximum 1-hour Leq during the period that the facility is in use is used for other noise-sensitive land uses such as school buildings and parks (Categories 1 and 3). The noise impact criteria for human annoyance are based on a comparison of the existing outdoor noise levels and the future outdoor noise levels from a proposed transit project. They incorporate activity interference caused by the transit project alone and annoyance due to the change in the noise environment caused by the project. There are two levels of impact included in the FTA criteria, as shown in Figure 4.11-3. The interpretations of these two levels of impact are summarized as follows:
• Severe Impact. Project noise above the upper curve is considered to cause Severe Impact because a significant percentage of people would be highly annoyed by the new noise. This curve flattens out at 80 dB for Category 1 and 2 land use, a level associated with an unacceptable living environment.
• Moderate Impact. The change in the cumulative noise level is noticeable to most people, but it may not be sufficient to cause strong, adverse reactions from the community. In this transitional area, other project-specific factors must be considered to determine the magnitude of the impact and the need for mitigation, such as the existing level, predicted level of increase over existing noise levels, and the types and numbers of noise-sensitive land uses affected.
The horizontal axis in Figure 4.11-3 is the existing Ldn or Leq without any project-related noise. The vertical axis on the left side is the Ldn at residential land uses caused by a project, whereas the axis on the right side is the Leq at school, park, and recreational land use. Figure 4.11-3 illustrates that a project Ldn of 61 dBA at a Category 2 receiver would be considered as a “moderate impact” if the existing Ldn at a selected residence is 65 dBA. If the project noise level reaches an Ldn of 67 dBA, the project noise level would be considered as a “severe impact” to the Category 2 receiver.
For residential land use, the noise criteria are to be applied outside the building locations at noise-sensitive areas with frequent human use, including outdoor patios, decks, pools, and play areas. If no such areas exist, the criteria should be applied near building doors and windows. For parks and other significant outdoor use, the criteria are to be applied at the property lines; however, for locations where land use activities are solely indoors, noise impact may be less significant if the outdoor-to-indoor reduction is greater than for typical

Van Ness Avenue Bus Rapid Transit Project Chapter 4: Affected Environment,Chapter 4: Affected Environment,Chapter 4: Affected Environment,Chapter 4: Affected Environment, Draft Environmental Impact Statement/ Environmental Consequences, andEnvironmental Consequences, andEnvironmental Consequences, andEnvironmental Consequences, and Environmental Impact Report Avoidance, Minimization, and/or Mitigation Measures Avoidance, Minimization, and/or Mitigation Measures Avoidance, Minimization, and/or Mitigation Measures Avoidance, Minimization, and/or Mitigation Measures
San Francisco County Transportation Authority October 2011 4.11-5
D E F I N I T I O N S
HUMAN ANNOYANCE CRITERIA: Used to assess potential impacts associated with operational vibration.
BUILDING DAMAGE CRITERIA: Used to estimate vibration impacts due to construction activities.
buildings (approximately 25 dB with windows closed). Thus, if it can be demonstrated that there will only be indoor activities, mitigation may not be needed.
Figure 4.11-3: Noise Impact Criteria for Transit Projects
Source: FTA, 2006
4.11.2.2CITY NOISE IMPACT CRITERION
The generally accepted threshold for a clearly perceptible sound increase is 5 dB. “Section 2909. Noise Limits” from the City’s municipal code (San Francisco, 2008) includes a 5-dB increase threshold. Accordingly, an impact would occur if either project-generated noise along Van Ness Avenue or increased traffic volumes on parallel facilities such as Franklin and Gough Streets result in a 5-dB or greater noise increase.
4.11.2.3FTA VIBRATION IMPACT CRITERIA
The criteria in the Transit Noise and Vibration Impact Assessment (FTA, 2006) were used to evaluate vibration impacts from project construction and BRT operations. The evaluation of vibration impacts can be divided into two categories: (1) human annoyance, and (2) building damage. Generally, human annoyance criteria are used to assess potential impacts associated with operational vibration, whereas building damage criteria are used to estimate vibration impacts due to construction activities.
Human Annoyance Criteria
The ground-borne vibration impact criteria describe human response to vibration and potential interference related to the operation of vibration sensitive equipment. The criteria for acceptable ground-borne vibration are expressed in terms of RMS velocity levels in VdB and are based on the maximum levels for a single event (Lmax). Table 4.11-2 presents the criteria for various land use categories, as well as the frequency of events.
Sensitive receivers within the project boundary include residences, hotels, and schools. These fall under Category 2, places where people normally sleep, and Categories 1 and 3,

Chapter 4: Chapter 4: Chapter 4: Chapter 4: Affected Environment,Affected Environment,Affected Environment,Affected Environment, Van Ness Avenue Bus Rapid Transit Project Environmental Consequences, andEnvironmental Consequences, andEnvironmental Consequences, andEnvironmental Consequences, and Draft Environmental Impact Statement/ Avoidance, Minimization, and/or Mitigation MeasuresAvoidance, Minimization, and/or Mitigation MeasuresAvoidance, Minimization, and/or Mitigation MeasuresAvoidance, Minimization, and/or Mitigation Measures Environmental Impact Report
4.11-6 San Francisco County Transportation Authority October 2011
performance spaces and institutional land uses with primarily daytime use. Because the number of proposed operations is 215 per weekday, FTA classifies the proposed service under “Frequent Events.”
Table 4.11-2: Ground-Borne Vibration Impact Criteria for Human Annoyance
LAND USE CATEGORY GROUND-BORNE VIBRATION IMPACT LEVELS (VDB RE 1 MICRO-IN/SEC)
FREQUENT EVENTS1 OCCASIONAL EVENTS2
INFREQUENT EVENTS3
Category 1: Buildings where vibration would interfere with interior operations.
65 VdB4 65 VdB4 65 VdB4
Category 2: Residences and buildings where people normally sleep.
72 VdB 75 VdB 80 VdB
Category 3: Institutional land uses with primarily daytime use.
75 VdB 78 VdB 83 VdB
Notes:
1. “Frequent Events” is defined as more than 70 vibration events of the same source per day. Most rapid transit projects fall into this category.
2. “Occasional Events” is defined as between 30 and 70 vibration events of the same source per day. Most commuter trunk lines have this many operations.
3. “Infrequent Events” is defined as more than 30 vibration events of the same kind per day. This category includes most commuter rail branch lines.
4. This criterion limit is based on levels that are acceptable for most moderately sensitive equipment, such as optical microscopes. Vibration-sensitive manufacturing or research will require detailed evaluation to define the acceptable vibration levels. Ensuring lower vibration levels in a building often requires special design of the HVAC systems and stiffened floors.
Source: FTA, 2006.
Building Damage Criteria
Construction activities can result in varying degrees of ground vibration, depending on the equipment and method employed. The vibration associated with typical transit construction is not likely to damage building structures, but it could cause cosmetic building damage. Normally, vibration resulting from a BRT vehicle pass-by would not cause building damage.
Vibrations generated by surface transportation and construction activities are mainly in the form of surface or Raleigh waves. Studies have shown that the vertical component of transportation-generated vibrations is the strongest, and that PPV correlates best with building damage and complaints. Table 4.11-3 summarizes the construction vibration limits shown in FTA guidelines for structures located near the ROW of a transit project.
Table 4.11-3: Construction Vibration Damage Criteria
BUILDING CATEGORY PPV (IN/SEC) APPROXIMATE LV*
I. Reinforced-concrete, steel, or timber (no plaster) 0.5 102
II. Engineered concrete and masonry (no plaster) 0.3 98
III. Non-engineered timber and masonry buildings 0.2 94
IV. Buildings extremely susceptible to vibration damage 0.12 90
Note:
* RMS velocity in decibels (VdB) re: 1 micro-inch per second.
Source: FTA, 2006.
4.11.2.4CITY CONSTRUCTION NOISE ORDINANCES
Construction impacts to sensitive neighborhoods, although temporary in nature, can affect occupants of nearby buildings and/or compromise building structures. The City of San Francisco has jurisdiction over the construction noise of the proposed project, which lies within the limits of the city. Noise levels during construction are regulated under Article 29

Van Ness Avenue Bus Rapid Transit Project Chapter 4: Affected Environment,Chapter 4: Affected Environment,Chapter 4: Affected Environment,Chapter 4: Affected Environment, Draft Environmental Impact Statement/ Environmental Consequences, andEnvironmental Consequences, andEnvironmental Consequences, andEnvironmental Consequences, and Environmental Impact Report Avoidance, Minimization, and/or Mitigation Measures Avoidance, Minimization, and/or Mitigation Measures Avoidance, Minimization, and/or Mitigation Measures Avoidance, Minimization, and/or Mitigation Measures
San Francisco County Transportation Authority October 2011 4.11-7
Daytime construction activities are permitted provided that operation of any powered construction equipment does not emit noise at a level in excess of 80 dBA when measured at a distance of 100 feet.
Non-emergency nighttime construction activities are not permitted if the resulting noise level is more than 5 dB in excess of the ambient noise at the nearest property line.
of the San Francisco Municipal Code (San Francisco, 2008). These noise restrictions are summarized as follows:
• Daytime (7:00 a.m. to 8:00 p.m.). Construction activities are permitted provided that operation of any powered construction equipment, regardless of age or date of acquisition, does not emit noise at a level in excess of 80 dBA when measured at a distance of 100 feet. Impact tools and equipment are exempt from this restriction if they are equipped with intake and exhaust mufflers recommended by the manufacturers thereof, and approved by the Director of Public Works.
• Nighttime (8:00 p.m. to 7:00 a.m.). Non-emergency construction activities are not permitted during nighttime hours if the resulting noise level is more than 5 dB in excess of the ambient noise at the nearest property line unless express permission has been granted by the Director of Public Works.
4.11.3Affected Environment
The proposed BRT follows Van Ness Avenue through the core of the north-of-Market-Street area. Van Ness Avenue is a principal arterial that provides interstate, interregional, and intraregional travel and goods movement, and forms part of US 101. The proposed BRT would be implemented along an approximately 2-mile stretch of Van Ness Avenue (including a one-block portion of South Van Ness Avenue). Characteristics of neighborhoods shift from public and commercial uses in the southern portion of the proposed alignment, mixed residential-commercial in the middle portion, to multi-family residential in the northern portion. Most of these multi-family buildings have commercial uses, such as office space or various stores, on the ground level.
The noise environment in the vicinity of the Van Ness Avenue corridor is comprised of automobile, truck, and bus pass-by noise with intervals of motor vehicle horn noise, as well as clatter from street-level pedestrian and commercial activities. Noise-sensitive receivers along Van Ness Avenue that may be affected by the project include single- and multi-family residences (the latter often positioned above first-story street-side commercial uses), churches, and hotels. Along and between Franklin and Gough streets, a larger proportion of solely residential buildings are present, as well as schools, churches, hotels, and two small museums. In addition, there are several parks and playfields along Gough Street.
Noise monitoring was conducted at various sites along Van Ness Avenue to assess the existing noise conditions throughout noise-sensitive regions in the project area. These sites are shown in Figure 4.11-4. Noise measurements were taken within the project limits between August 4 and 6, 2008. The monitoring sites include noise-sensitive locations, such as residences, a concert hall, and a hotel. The primary objectives of the measurements are to evaluate the existing noise environment and determine the appropriate impact criteria per FTA guidelines.
Short-term noise measurements were conducted at 10 sites for a duration of 20 minutes each, and a long-term measurement was conducted at one location for a total of 49 hours. At each short-term site, at least two measurements were performed, each at a different time of day. Multiple measurements were performed at each short-term site because only one suitable and available long-term measurement site was identified; therefore, more than one set of short-term noise measurements were needed to determine the existing noise levels accurately. Ldn at the long-term measurement location was calculated by using hourly measured noise levels. At short-term locations, Ldn levels were estimated by comparing two to three separate short-term noise-level measurements to results obtained from the long-term measurement location that was in progress concurrently. Measured noise levels were typical for a dense urban environment, with short-term Leq values ranging from the mid 60s to mid 70s dBA. Ldn values measured at the long-term site and estimated at the short-term sites were in the 70s dBA.

Chapter 4: Chapter 4: Chapter 4: Chapter 4: Affected Environment,Affected Environment,Affected Environment,Affected Environment, Van Ness Avenue Bus Rapid Transit Project Environmental Consequences, andEnvironmental Consequences, andEnvironmental Consequences, andEnvironmental Consequences, and Draft Environmental Impact Statement/ Avoidance, Minimization, and/or Mitigation MeasuresAvoidance, Minimization, and/or Mitigation MeasuresAvoidance, Minimization, and/or Mitigation MeasuresAvoidance, Minimization, and/or Mitigation Measures Environmental Impact Report
4.11-8 San Francisco County Transportation Authority October 2011
No significant vibration sources exist along the project corridor.Typical automobile, truck, and
bus pass-bys along local roadways would be the only perceptible vibration source.
Figure 4.11-4: Noise Measurement Locations
No significant vibration sources exist along the project corridor. Typical automobile, truck, and bus pass-bys along local roadways would be the only perceptible vibration source.
4.11.4Environmental Consequences
Build Alternatives 2, 3, and 4 propose construction of a dedicated bus lane, whereas the No Build Alternative is the no-build baseline case. Build Alternative 2 would provide a dedicated bus lane in the rightmost travel lane of Van Ness Avenue in both the NB and SB directions.

Van Ness Avenue Bus Rapid Transit Project Chapter 4: Affected Environment,Chapter 4: Affected Environment,Chapter 4: Affected Environment,Chapter 4: Affected Environment, Draft Environmental Impact Statement/ Environmental Consequences, andEnvironmental Consequences, andEnvironmental Consequences, andEnvironmental Consequences, and Environmental Impact Report Avoidance, Minimization, and/or Mitigation Measures Avoidance, Minimization, and/or Mitigation Measures Avoidance, Minimization, and/or Mitigation Measures Avoidance, Minimization, and/or Mitigation Measures
San Francisco County Transportation Authority October 2011 4.11-9
Calculation results demonstrate no anticipated noise impacts along Van Ness Avenue from the proposed BRT service.
Along segments of Franklin and Gough streets, which are expected to attract more of the traffic redirected from Van Ness Avenue under the project alternatives, future traffic noise levels under the build alternatives are predicted to be zero to 1.5 dB higher than future no-project noise levels. Accordingly, no mitigation measures are required for operational noise impacts on Franklin and Gough streets.
Build Alternatives 3 and 4 would convert the existing landscaped median and portions of two inside traffic lanes for a dedicated bus lane.
4.11.4.1OPERATIONAL NOISE ALONG VAN NESS AVENUE
Along Van Ness Avenue, future BRT operations would represent a new category of noise source under the project build alternatives; however, the elimination of two mixed-flow lanes as part of the project would reduce general automobile traffic capacity along the project corridor, tending to redirect some traffic to alternative routes. In addition, the total number of motor vehicle trips in the area is expected to decrease under the project alternatives due to the enhanced transit offered as an alternative mode of transportation to the automobile. Consistent with FTA guidelines, only the additional noise from BRT operations was considered in the analysis; this approach produced conservative impact results.
According to the proposed service schedule for the BRT alternatives, there would be headways of 3.5 minutes during peak hours, 5 minutes during midday hours, and 10 to 20 minutes during evening and nighttime hours. Service would begin at 6:00 a.m. and end at midnight.
The proposed future BRT vehicle fleet is expected to include some combination of diesel hybrid and electric-powered vehicles; however, to assure a conservative analysis, noise modeling was performed using FTA’s diesel bus option because diesel buses would be the noisiest. Project buses were assumed to operate at the posted speed limit of 25 mph. In practice, the operating speed would vary in the vicinity of proposed passenger stations as the bus approaches and departs from a station; however, speeds would not be expected to exceed the speed limit. In addition, while BRT travel between stations would be enhanced by TSP and signal optimization, travel speeds for any given bus trip would still be affected at some intersections due to red lights.
BRT noise levels were calculated using the operation schedule, speed, and distance of the proposed project limits. Distances to the centerline of the nearest BRT lane were 17 to 122 feet (varying by receiver and alternative). The calculated noise levels were then compared to the “Moderate Impact” and “Severe Impact” criteria, established according to the ambient noise conditions. Tables 4.11-4 and 4.11-5 provide the results of the calculations at the sensitive receivers and the degree of impact. Noise impacts from Build Alternatives 3 and 4 would be same; therefore, they are presented in one table. Calculation results demonstrate no anticipated noise impacts along Van Ness Avenue from the proposed BRT service.
Predicted noise level increases were also compared with the City’s 5-dB increase threshold. The final columns of Tables 4.11-4 and 4.11-5 show that the predicted increases remain well below that criterion.
4.11.4.2OPERATIONAL NOISE ON PARALLEL STREETS
Some of the reduced traffic along Van Ness Avenue under the project alternatives would be redistributed to alternative routes. Franklin and Gough streets are expected to attract more of the traffic redirected from Van Ness Avenue under the project alternatives than any other routes. The worst-case traffic noise levels were calculated using traffic volumes representing LOS C conditions. When peak-hour volumes exceed LOS C volumes, LOS C traffic flow represents loudest hour conditions. As traffic volumes increase such that LOS deteriorates to levels below C, travel speeds tend to decrease sufficiently to lower traffic noise levels relative to LOS C conditions.
Along segments of these two roadways paralleling Van Ness Avenue, future traffic noise levels under the build alternatives are predicted to be zero to 1.5 dB higher than future no-project noise levels. Relative to existing traffic noise levels, future project traffic noise levels would increase by zero to 2.2 dB. Typically a noise level change of 3 dB or less is not noticeable. These predicted changes are independent of distance from the indicated roadways, although the noise levels themselves would vary with distance from the roadways.

Chapter 4: Chapter 4: Chapter 4: Chapter 4: Affected Environment,Affected Environment,Affected Environment,Affected Environment, Van Ness Avenue Bus Rapid Transit Project Environmental Consequences, andEnvironmental Consequences, andEnvironmental Consequences, andEnvironmental Consequences, and Draft Environmental Impact Statement/ Avoidance, Minimization, and/or Mitigation MeasuresAvoidance, Minimization, and/or Mitigation MeasuresAvoidance, Minimization, and/or Mitigation MeasuresAvoidance, Minimization, and/or Mitigation Measures Environmental Impact Report
4.11-10 San Francisco County Transportation Authority October 2011
Significant vibration impactsfrom rubber-tire-fitted vehicles are extremely rare. Potential
vibration impacts from rubber-tire-fitted vehicles, such as those
used in BRT projects, can be reasonably dismissed.
These levels are below the 5-dB threshold derived from the City Noise Ordinance. Accordingly, no mitigation measures are required for operational noise impacts on Franklin and Gough streets.
4.11.4.3OPERATION VIBRATION IMPACTS
Significant vibration impacts from rubber-tire-fitted vehicles are extremely rare. This is because rubber-tire-fitted vehicles are not as massive as railway vehicles. They are additionally typically well isolated by the vehicle suspension design and rubber tires, which act as a highly effective barrier to vibration transmission from the vibration-generating carriage and the main propagation medium for vibration excitation, the ground; therefore, potential vibration impact from rubber-tire-fitted vehicles, such as those used in BRT projects, can be reasonably dismissed (FTA, 2006).
4.11.5Avoidance, Minimization, and/or Mitigation Measures
The No Build Alternative and build alternatives are not expected to have adverse effects on noise and vibration. Vibration impact due to BRT operation is dismissed due to the typical operational characteristics and vehicle design of BRT vehicles; however, roadway surface defects, such as pot holes, would elevate BRT pass-by noise and vibration. Thus, it is recommended that the following improvement measure is implemented:
I-NO-1. Upkeep of roadway surface will be maintained throughout project operation to avoid increases in BRT noise and vibration levels.

Va
n N
ess
Ave
nu
e B
us
Ra
pid
Tra
nsi
t P
roje
ct
Ch
ap
ter
4:
Aff
ec
ted
En
vir
Ch
ap
ter
4:
Aff
ec
ted
En
vir
Ch
ap
ter
4:
Aff
ec
ted
En
vir
Ch
ap
ter
4:
Aff
ec
ted
En
vir
on
me
nt,
on
me
nt,
on
me
nt,
on
me
nt,
D
raft
En
viro
nm
en
tal
Imp
act
Sta
tem
en
t/
En
vir
on
me
nta
l C
on
se
qu
en
ce
s,
an
dE
nv
iro
nm
en
tal
Co
ns
eq
ue
nc
es
, a
nd
En
vir
on
me
nta
l C
on
se
qu
en
ce
s,
an
dE
nv
iro
nm
en
tal
Co
ns
eq
ue
nc
es
, a
nd
E
nvi
ron
me
nta
l Im
pa
ct R
ep
ort
A
vo
ida
nc
e,
Min
imiz
at
Av
oid
an
ce
, M
inim
iza
tA
vo
ida
nc
e,
Min
imiz
at
Av
oid
an
ce
, M
inim
iza
tio
n,
an
d/o
r M
itig
ati
on
Me
as
ure
sio
n,
an
d/o
r M
itig
ati
on
Me
as
ure
sio
n,
an
d/o
r M
itig
ati
on
Me
as
ure
sio
n,
an
d/o
r M
itig
ati
on
Me
as
ure
s
Sa
n F
ran
cisc
o C
ou
nty
Tra
nsp
ort
ati
on
Au
tho
rity
O
cto
be
r 2
011
4
.11-
11
Table 4.11-4: Operational Noise Levels for Build Alternative 2
RECEIVER
NUMBER
LAND USE
CATEGORY1
DISTANCE TO BUS
LANE NB/SB, FEET
EXISTING NOISE LEVEL
LDN (LEQ)2, DBA
CRITERIA, MODERATE /
SEVERE, DBA
PROJECT
NOISE LEVEL,
LDN (LEQ)2, DBA
CUMULATIVE NOISE,
LDN (LEQ)2, DBA
INCREASE IN
CUMULATIVE
NOISE, DB
NOISE IMPACT
FTA CRITERIA
NOISE IMPACT
CITY CRITERION
3
R2
2
17 /
82
75
6
6-7
3 /
>73
6
2
75
0
No
N
o
R3
1 11
0 /
45
(70
) 6
5-6
9 /
>6
9
(56
) (7
0)
0
No
N
o
R4
3
18 /
83
(70
) 70
-74
/ >
74
(62
) (7
1)
1 N
o
No
R5
1 15
4 /
88
(7
0)
65-
69
/ >
69
(5
2)
(70
) 0
N
o
No
R6
2
28 /
93
74
66
-72
/ >
72
59
74
0
No
N
o
R7
3 10
2 /
34
(69
) 6
9-7
4 /
>74
(5
7)
(69
) 0
N
o
No
R8
3
19 /
84
(6
9)
69
-74
/ >
74
(61)
(7
0)
1 N
o
No
R9
2
23 /
88
77
6
6-7
4 /
>74
6
0
77
0
No
N
o
R10
2
96
/ 3
0
76
66
-74
/ >
74
59
76
0
No
N
o
R11
1
89 /
33
(71)
6
6-7
0 /
>70
(5
8)
(71)
0
N
o
No
R12
2
21 /
84
76
6
6-7
4 /
>74
6
1 76
0
N
o
No
R13
2
113
/ 50
72
6
6-7
1 /
>71
56
72
0
N
o
No
R14
3
16 /
81
(70
) 70
-74
/ >
74
(62
) (7
1)
1 N
o
No
R15
2
94
/ 2
9
75
66
-73
/ >
73
59
75
0
No
N
o
R16
2
22 /
87
77
66
-74
/ >
74
60
77
0
N
o
No
R17
2
23 /
88
77
6
6-7
4 /
>74
6
0
77
0
No
N
o
R18
2
93
/ 2
8
77
66
-74
/ >
74
59
77
0
No
N
o
R19
3
24 /
90
(7
2)
71-7
6 /
>76
(6
0)
(72
) 0
N
o
No
R20
3
91
/ 26
(7
2)
71-7
6 /
>76
(5
9)
(72
) 0
N
o
No
R21
2
97
/ 32
72
6
6-7
1 /
>71
58
72
0
N
o
No
R22
2
28 /
94
72
6
6-7
1 /
>71
59
72
0
N
o
No
R23
3
96
/ 3
0
(67)
6
8-72
/ >
72
(58
) (6
8)
1 N
o
No
R2
4
2 23
/ 8
8
76
66
-74
/ >
74
60
76
0
N
o
No
R25
2
94
/ 2
7 76
6
6-7
4 /
>74
59
76
0
N
o
No
R26
3
103
/ 39
(7
1)
71-7
5 /
>75
(5
7)
(71)
0
N
o
No
R27
2
19 /
85
75
66
-73
/ >
73
61
75
0
No
N
o
R2
8
2 9
0 /
24
75
6
6-7
3 /
>73
6
0
75
0
No
N
o
R29
2
90
/ 2
4
75
66
-73
/ >
73
60
75
0
N
o
No
No
tes:
1.
Cat
ego
ry 1
– I
ncl
ud
es r
eco
rdin
g s
tud
ios
and
co
nce
rt h
alls
; C
ateg
ory
2 –
In
clu
des
res
iden
ces
and
ho
tels
; C
ateg
ory
3 –
In
clu
des
sch
oo
ls,
thea
tres
, an
d c
hu
rch
es.
2
. N
ois
e le
vels
sh
ow
n w
ith
in p
aren
thes
es r
epre
sen
t 1-
ho
ur
Leq
. L
eq i
s ap
plie
d r
ath
er t
han
Ld
n f
or
Cat
ego
ry 1
or
Cat
ego
ry 3
lan
d u
ses.
Th
e L
eq v
alu
es p
rovi
ded
her
e re
pre
sen
t 1-
ho
ur
per
iod
s co
rres
po
nd
ing
to
th
e ti
mes
of
futu
re p
eak
BR
T o
per
atio
ns.
3.
Th
e C
ity
crit
erio
n a
pp
licab
le t
o C
EQ
A a
nal
ysis
is
a 5-
dB
in
crea
se.

Ch
ap
ter
4:
Aff
ec
ted
En
vir
on
me
nt,
Ch
ap
ter
4:
Aff
ec
ted
En
vir
on
me
nt,
Ch
ap
ter
4:
Aff
ec
ted
En
vir
on
me
nt,
Ch
ap
ter
4:
Aff
ec
ted
En
vir
on
me
nt,
V
an
Ne
ss A
ven
ue
Bu
s R
ap
id T
ran
sit
Pro
ject
E
nv
iro
nm
en
tal
Co
ns
eq
ue
nc
es
, a
nd
En
vir
on
me
nta
l C
on
se
qu
en
ce
s,
an
dE
nv
iro
nm
en
tal
Co
ns
eq
ue
nc
es
, a
nd
En
vir
on
me
nta
l C
on
se
qu
en
ce
s,
an
d
Dra
ft E
nvi
ron
me
nta
l Im
pa
ct S
tate
me
nt/
A
vo
ida
nc
e,
Min
imiz
ati
on
, a
nd
/or
Mit
iga
tio
n M
ea
su
res
Av
oid
an
ce
, M
inim
iza
tio
n,
an
d/o
r M
itig
ati
on
Me
as
ure
sA
vo
ida
nc
e,
Min
imiz
ati
on
, a
nd
/or
Mit
iga
tio
n M
ea
su
res
Av
oid
an
ce
, M
inim
iza
tio
n,
an
d/o
r M
itig
ati
on
Me
as
ure
s
En
viro
nm
en
tal
Imp
act
Re
po
rt
4.1
1-12
S
an
Fra
nci
sco
Co
un
ty T
ran
spo
rta
tio
n A
uth
ori
ty
Oct
ob
er
20
11
Table 4.11-5: Operational Noise Levels for Build Alternatives 3 and 4
RECEIVER
NUMBER
LAND USE
CATEGORY1
DISTANCE TO BUS
CENTER LANE,
FEET
EXISTING NOISE LEVEL
LDN (LEQ)2, DBA
CRITERIA, MODERATE /
SEVERE, DBA
PROJECT
NOISE LEVEL,
LDN (LEQ)2, DBA
CUMULATIVE NOISE,
LDN (LEQ)2, DBA
INCREASE IN
CUMULATIVE
NOISE, DB
NOISE IMPACT
FTA CRITERIA
NOISE IMPACT
CITY CRITERION
3
R2
2
47
75
66
-73
/ >
73
58
75
0
No
N
o
R3
1 78
(7
0)
65-
69
/ >
69
(5
4)
(70
) 0
N
o
No
R4
3
50
(70
) 70
-74
/ >
74
(57)
(7
0)
0
No
N
o
R5
1 12
2
(70
) 6
5-6
9 /
>6
9
(51)
(7
0)
0
No
N
o
R6
2
61
74
66
-72
/ >
72
56
74
0
No
N
o
R7
3 6
0
(69
) 6
9-7
4 /
>74
(5
5)
(69
) 0
N
o
No
R8
3
58
(69
) 6
9-7
4 /
>74
(5
6)
(69
) 0
N
o
No
R9
2
59
77
66
-74
/ >
74
56
77
0
No
N
o
R10
2
64
76
6
6-7
4 /
>74
56
76
0
N
o
No
R11
1
63
(71)
6
6-7
0 /
>70
(5
6)
(71)
0
N
o
No
R12
2
55
76
66
-74
/ >
74
57
76
0
No
N
o
R13
2
79
72
66
-71
/ >
71
55
72
0
No
N
o
R14
3
51
(70
) 70
-74
/ >
74
(57)
(7
0)
0
No
N
o
R15
2
59
75
66
-73
/ >
73
56
75
0
No
N
o
R16
2
53
77
66
-74
/ >
74
57
77
0
No
N
o
R17
2
53
77
66
-74
/ >
74
57
77
0
No
N
o
R18
2
58
77
66
-74
/ >
74
57
77
0
No
N
o
R19
3
56
(72
) 71
-76
/ >
76
(56
) (7
2)
0
No
N
o
R20
3
59
(72
) 71
-76
/ >
76
(56
) (7
2)
0
No
N
o
R21
2
64
72
6
6-7
1 /
>71
56
72
0
N
o
No
R22
2
62
72
6
6-7
1 /
>71
56
72
0
N
o
No
R23
3
62
(6
7)
68-
72 /
>72
(5
6)
(67)
0
N
o
No
R2
4
2 56
76
6
6-7
4 /
>74
57
76
0
N
o
No
R25
2
59
76
66
-74
/ >
74
56
76
0
No
N
o
R26
3
69
(7
1)
71-7
5 /
>75
(5
5)
(71)
0
N
o
No
R27
2
53
75
66
-73
/ >
73
57
75
0
No
N
o
R2
8
2 55
75
6
6-7
3 /
>73
57
75
0
N
o
No
R29
2
62
75
6
6-7
3 /
>73
56
75
0
N
o
No
No
tes:
1.
C
ateg
ory
1 –
In
clu
des
rec
ord
ing
stu
dio
s an
d c
on
cert
hal
ls;
Cat
ego
ry 2
– I
ncl
ud
es r
esid
ence
s an
d h
ote
ls;
Cat
ego
ry 3
– I
ncl
ud
es s
cho
ols
, th
eatr
es,
and
ch
urc
hes
.
2.
No
ise
leve
ls s
ho
wn
wit
hin
par
enth
eses
rep
rese
nt
1-h
ou
r L
eq.
Leq
is
app
lied
rat
her
th
an L
dn f
or
Cat
ego
ry 1
or
Cat
ego
ry 3
lan
d u
ses.
Th
e L
eq v
alu
es p
rovi
ded
her
e re
pre
sen
t 1-
ho
ur
per
iod
s co
rres
po
nd
ing
to
th
e ti
mes
of
futu
re p
eak
BR
T o
per
atio
ns.
3.
T
he
Cit
y cr
iter
ion
ap
plic
able
to
CE
QA
an
alys
is i
s a
5-d
B i
ncr
ease
. 4
.
Op
erat
ion
al n
ois
e le
vels
un
der
Bu
ild A
lter
nat
ives
3 a
nd
4 w
ou
ld n
ot
chan
ge
wit
h o
r w
ith
ou
t in
corp
ora
tio
n o
f th
e C
ente
r B
Des
ign
Var
iati
on
(i.
e.,
elim
inat
ion
of
left
tu
rns)
.

Van Ness Avenue Bus Rapid Transit Project Chapter 4: Affected Environment,Chapter 4: Affected Environment,Chapter 4: Affected Environment,Chapter 4: Affected Environment, Draft Environmental Impact Statement/ Environmental Consequences, andEnvironmental Consequences, andEnvironmental Consequences, andEnvironmental Consequences, and Environmental Impact Report Avoidance, Minimization, and/or Mitigation Measures Avoidance, Minimization, and/or Mitigation Measures Avoidance, Minimization, and/or Mitigation Measures Avoidance, Minimization, and/or Mitigation Measures
San Francisco County Transportation Authority October 2011 4.12-1
D E F I N I T I O N S
INDIRECT ENERGY CONSUMPTION: Energy consumed in construction and maintenance.
DIRECT ENERGY CONSUMPTION: Fuel required to operate passenger vehicles, heavy trucks, and transit buses.
Most motor vehicles in the Van Ness Avenue corridor depend on gasoline and diesel fuel. The exception is transit vehicles: More than half of Muni’s transit fleet uses electrical power for operation.
4.12 Energy This section addresses the impact of the proposed project on transportation-related energy consumption. The energy analysis considers the long-term direct impacts related to energy consumption for the future horizon year 2035. Direct energy consumption includes the fuel required for passenger vehicles (i.e., automobiles, vans, and light trucks), heavy trucks (i.e., three or more axles), and transit buses.
4.12.1Regulatory Setting
This section provides an overview of the federal, state, and local regulations and polices relevant to energy usage and impact analysis associated with proposed project operation.
4.12.1.1NATIONAL ENVIRONMENTAL POLICY ACT [42 U.S.C. SECTION 4321 ET
SEQ.]
NEPA requires the consideration of potential environmental effects, including potential effects to public utilities and energy, in the evaluation of any proposed federal agency action. NEPA also obligates federal agencies to consider the environmental consequences and costs in their projects and programs as part of the planning process. General NEPA procedures are set forth in the CEQ regulations 23 CFR 771.
4.12.1.2CALIFORNIA ENVIRONMENTAL QUALITY ACT [SECTION 21000 ET SEQ.]
AND CEQA GUIDELINES [SECTION 15000 ET SEQ.]
CEQA requires state and local agencies to identify the significant environmental impacts of their actions, including potential significant impacts to public utilities and energy, and to avoid or mitigate those impacts, when feasible. CEQA Guidelines call for project sponsors to analyze whether a proposed project would “encourage activities which result in the use of large amounts of fuel, water, or energy; or use fuel, water, or energy in a wasteful manner,” as summarized in Chapter 6, in which case the project would be considered to have a significant energy impact.
4.12.1.3ENERGY MANAGEMENT FOR TRANSIT VEHICLES UNDER THE
SAN FRANCISCO GENERAL PLAN
Policy 12.1 of the San Francisco General Plan sets forth guidelines for incorporating energy management practices into building, facility, and fleet maintenance and operations. This policy provides de facto fleet energy management practices for operating and maintaining the vehicle fleet owned and operated by the City and County of San Francisco. The practices are intended to reduce unnecessary fuel usage. This project should follow those practices.
4.12.2Affected Environment
Existing transportation energy consumption in the Van Ness Avenue corridor includes the fuel required for passenger vehicles (i.e., automobiles, vans, and light trucks), heavy trucks (i.e., three or more axles), and transit buses.
A mix of natural gas, electricity, gasoline, and diesel fuel provide the energy source for transportation in the Van Ness Avenue corridor. Passenger vehicles primarily utilize gasoline as fuel, where heavy trucks primarily utilize diesel fuel. Natural gas can be used by motor vehicles (i.e., passenger and heavy truck), but it is commonly a fuel used in heating facilities

Chapter 4: Affected Environment,Chapter 4: Affected Environment,Chapter 4: Affected Environment,Chapter 4: Affected Environment, Van Ness Avenue Bus Rapid Transit Project Environmental Consequences, andEnvironmental Consequences, andEnvironmental Consequences, andEnvironmental Consequences, and Draft Environmental Impact Statement/ Avoidance, Minimization, and/or Mitigation MeasuresAvoidance, Minimization, and/or Mitigation MeasuresAvoidance, Minimization, and/or Mitigation MeasuresAvoidance, Minimization, and/or Mitigation Measures Environmental Impact Report
4.12-2 San Francisco County Transportation Authority October 2011
and manufacturing or processing. Electricity can also be used for motor vehicles; however, most motor vehicles in the Van Ness Avenue corridor depend on gasoline and diesel fuel. The exception is transit vehicles. Trolley buses, cable cars, streetcars, and light rail vehicles, which comprise more than half of Muni’s transit fleet, use electrical power for operation (FTA, 2008). Muni’s electric fleet operates with power that is generated at the SFPUC Hetch Hetchy hydroelectric facility in the Sierra foothills and is distributed via a long-distance transmission system to customers in San Francisco and the Peninsula. Under City agreements, Hetch Hetchy provides power to Muni, which is transmitted to the electric fleet through Muni’s traction power substations and OCS.
Existing transit service on Van Ness Avenue is provided by Muni bus lines 47 and 49, their corresponding Owl night bus services,47 and by Golden Gate Transit bus lines 70, 80, and 93. Line 47 is comprised of 40-foot-long diesel motor coaches. Line 49 is comprised of 60-foot-long electric trolleybuses. Both bus lines originate and terminate at Muni maintenance yards located within San Francisco. The Golden Gate Transit bus fleet in the corridor operates on diesel fuel.
Transit operating costs are affected by fuel prices. SFMTA is affected by market fluctuations in purchasing fuel. The petroleum fuel market is quite volatile, and it is not possible to accurately forecast fuel prices even a few months into the future. For example, diesel and gasoline fuel prices have fluctuated considerably over the past 10 years, peaking in 2008.48 As of August 2010, diesel and gasoline prices in California average approximately $3.19 and $3.17 per gallon, respectively. In 2010, a kilowatt-hour of electricity in California costs approximately 10.97 cents per kilowatt-hour.
4.12.3Environmental Consequences
The following section compares estimated energy use under the different alternatives to determine whether any of the alternatives could encourage activities that would use or waste large amounts of energy.
4.12.3.1INDIRECT VERSUS DIRECT ENERGY CONSUMPTION
The proposed build alternatives would require energy to construct, operate, and maintain. Energy consumed in construction and maintenance is referred to as indirect energy usage. Construction includes that energy used by construction equipment and other activities at the worksite, in addition to the energy used to manufacture the equipment, materials, and supplies and to transport them to the worksite. Energy for maintenance includes that for day-to-day upkeep of equipment and systems, as well as the energy embedded in any replacement equipment, materials, and supplies. Indirect energy needs for construction of the proposed project would not be substantial, and indirect energy needs for maintenance would not change from the existing conditions; therefore, none of the build alternatives would have a significant effect on indirect energy consumption.
Energy consumed in the operation of transportation systems is typically referred to as direct energy consumption. This includes energy used by vehicles transporting people or goods (i.e., propulsion energy), plus energy used to operate facilities such as stations and station amenities, maintenance shops, yards, and other system elements. Over the life of a transportation project, direct energy consumption is usually the largest component of the project’s total energy use. Vehicle propulsion energy can amount to 60 percent of the total energy consumption related to a transportation project (Caltrans, 1983). In the current energy environment, the ongoing energy requirements of new activities, including their long-term impacts on energy supplies, are of chief concern; therefore, from an energy
47 Late night 47 and 49 services are provided by the 90 Owl. 48 Diesel and gasoline fuel prices in California in 2000 were $1.99 and $1.79 per gallon, respectively. Peak price in the last 10 years (year 2008) was $4.90 and $4.40 per gallon, respectively.

Van Ness Avenue Bus Rapid Transit Project Chapter 4: Affected Environment,Chapter 4: Affected Environment,Chapter 4: Affected Environment,Chapter 4: Affected Environment, Draft Environmental Impact Statement/ Environmental Consequences, andEnvironmental Consequences, andEnvironmental Consequences, andEnvironmental Consequences, and Environmental Impact Report Avoidance, Minimization, and/or Mitigation Measures Avoidance, Minimization, and/or Mitigation Measures Avoidance, Minimization, and/or Mitigation Measures Avoidance, Minimization, and/or Mitigation Measures
San Francisco County Transportation Authority October 2011 4.12-3
conservation standpoint, direct energy impacts are of greater importance than indirect energy impacts. For these reasons, the energy analysis for this environmental document focuses on direct rather than indirect energy requirements because no changes to indirect energy consumption are expected with the project, whereas the project could potentially affect direct energy consumption from the transportation sector.
4.12.3.2ENERGY IMPACTS
By providing dedicated lanes for transit, the proposed BRT build alternatives would separate transit from auto traffic, thereby improving transit speeds and reliability. The frequency of existing transit service and hence transit VMT under all project build alternatives would remain the same as under the No Build Alternative; however, the improved transit performance (i.e., improved speed and reliability) and experience provided by the proposed BRT build alternatives would attract riders to the BRT service, resulting in mode shift for some drivers of motor vehicles to transit, thereby reducing the number of autos and auto VMT in San Francisco as presented in Table 4.12-1. These changes in travel behavior results in decreases in travel by less energy-efficient modes (i.e., autos) and greater travel by a more energy-efficient mode (i.e., BRT buses).
Table 4.12-1: Annual Year 2035 Countywide Energy Use for the Project Alternatives
ALTERNATIVE ANNUAL AUTO VEHICLE MILES
TRAVELED2
POWER CONSUMED (GALLONS OF GASOLINE)3
CHANGE IN FUEL CONSUMPTION (GALLONS OF
GASOLINE)
ENERGY EQUIVALENT IN BTUS (MILLIONS)4
No Build Alternative1 3,828,962,240 114,868,867 14,358,608
Build Alternative 2 3,805,424,640 114,162,739 (706,128) 14,270,342
Difference from No Build AlternativeDifference from No Build AlternativeDifference from No Build AlternativeDifference from No Build Alternative ----0.61%0.61%0.61%0.61%
Build Alternatives 3 & 4 3,803,920,320 114,117,610 (751,258) 14,264,701
Difference from No Build Alternative Difference from No Build Alternative Difference from No Build Alternative Difference from No Build Alternative ----0.65%0.65%0.65%0.65%
Build Alternatives 3 & 4 (Design Variation B)
3,825,133,120 114,753,994 (114,874) 14,344,249
Difference from No Build AlternativeDifference from No Build AlternativeDifference from No Build AlternativeDifference from No Build Alternative ----0.10%0.10%0.10%0.10%
BTUs = British Thermal Units
Notes:
1 No Build Alternative forms basis for comparison for other alternatives.
2 Transit (i.e., rail and bus) vehicle miles traveled (VMT) in the county assumed to be the same under the No Build Alternative and all of the build alternatives. Project impacts only automobile VMT.
3 Autos/small trucks use gasoline. Gallons of gasoline consumed per mile of travel equals 0.03 gallons per mile.
4 BTUs in one gallon of gasoline = 125,000.
Source: U.S. Department of Energy, 2008c.
In addition to the estimated annual VMT, Table 4.12-1 shows the annual power consumption of the project alternatives in 2035. Because the proposed build alternatives do not affect the transit VMT, they are anticipated to have little to no effect on transit energy supply and consumption (i.e., electricity and diesel fuel supply). The project would also have little to no effect on heavy-truck traffic; therefore, only automobile VMT and automobile power consumption are presented. Auto/light-truck fuel usage is expressed in terms of gallons of gasoline. Energy consumption is presented in gallons of gasoline and BTUs, or British thermal units. BTU is a standard measure of energy content. A gallon of gasoline is equivalent to approximately 125,000 BTUs (U.S. Department of Energy, 2008).
As shown in Table 4.12-1, each build alternative would result in a slight reduction in energy consumption compared with the No Build Alternative. Build Alternatives 3 and 4 with the Center B Design Variation would also lead to a similar reduction in energy consumption compared to the No Build Alternative.

Chapter 4: Affected Environment,Chapter 4: Affected Environment,Chapter 4: Affected Environment,Chapter 4: Affected Environment, Van Ness Avenue Bus Rapid Transit Project Environmental Consequences, andEnvironmental Consequences, andEnvironmental Consequences, andEnvironmental Consequences, and Draft Environmental Impact Statement/ Avoidance, Minimization, and/or Mitigation MeasuresAvoidance, Minimization, and/or Mitigation MeasuresAvoidance, Minimization, and/or Mitigation MeasuresAvoidance, Minimization, and/or Mitigation Measures Environmental Impact Report
4.12-4 San Francisco County Transportation Authority October 2011
K E Y F I N D I N G
Each build alternative would have a minor beneficial effect on
energy consumption. The potential benefit of the proposed project for energy would result from a decrease in automobile
VMT countywide. The proposed project would not have an effect
on electricity or diesel fuel supply.
Implementation of Build Alternative 2 would reduce gasoline consumption by 706,000 gallons, which translates to approximately 0.60 percent in energy savings compared to the No Build Alternative. Build Alternatives 3 and 4 are identical in terms of their effect on energy consumption and would save 751,000 gallons of gasoline annually (energy savings of 0.65 percent). Build Alternatives 3 and 4 under the Center B Design Variation would save 115,000 gallons of gasoline annually. This translates to a 0.1 percent reduction in energy consumption. Implementation of Build Alternatives 3 and 4 with the Center B Design Variation would involve removal of the existing left-turn pockets, which would lead to automobiles traveling more miles than under the other build scenarios, leading to slightly lesser energy savings.
In summary, each build alternative would have a minor beneficial effect on energy consumption. The potential benefit of the proposed project for energy would result from a decrease in automobile VMT countywide. The proposed project would not have an effect on electricity or diesel fuel supply.
4.12.4Avoidance, Minimization, and/or Mitigation Measures
The proposed project would have very slight beneficial impacts on regional energy consumption; therefore, no avoidance, minimization, or mitigation measures are required.
Van Ness Avenue Bus Rapid Transit Project Chapter 4: Affected Environment,Chapter 4: Affected Environment,Chapter 4: Affected Environment,Chapter 4: Affected Environment, Draft Environmental Impact Statement/ Environmental Consequences, andEnvironmental Consequences, andEnvironmental Consequences, andEnvironmental Consequences, and Environmental Impact Report Avoidance, Minimization, and/or Mitigation Measures Avoidance, Minimization, and/or Mitigation Measures Avoidance, Minimization, and/or Mitigation Measures Avoidance, Minimization, and/or Mitigation Measures
San Francisco County Transportation Authority October 2011 4.13-1
4.13 Biological Environment 02BThis section summarizes the regulatory setting; affected environment; environmental consequences; and measures to avoid, mitigate, or compensate for long-term, permanent impacts to biological resources as a result of the proposed project. Construction-phase impacts and avoidance measures are presented in Section 4.15.13, Construction Impacts. Documents reviewed in support of this study include the Van Ness Avenue Bus Rapid Transit Natural Resources Technical Memorandum (GANDA, 2009), and Director’s Bulletin No. 2006-01 Tree Protection Legislation (SFGov, 2006), and the Van Ness Area Plan (SFGOV, 2007).
Preparation of the Van Ness Avenue Bus Rapid Transit Natural Resources Technical Memorandum included review of the California Natural Diversity Database (CNDDB) San Francisco north 7.5-minute United States Geological Survey (USGS) topographic quadrangle map, which encompasses the project area, in addition to the United States Fish and Wildlife Service (USFWS) database of threatened and endangered species for San Francisco County (USFWS, 2008). Previous biological surveys conducted in the project vicinity were also reviewed, in addition to relevant literature searches (GANDA, 2009). Surveys of the project area by a qualified biologist were conducted on November 13, 2007, and June 10, 2009.
4.13.1Regulatory Setting
The following discussion summarizes environmental laws and regulations governing biological resources relevant to the proposed project.
4.13.1.1FEDERAL REGULATIONS
Clean Water Act Section 401
Section 401 of the federal CWA requires the issuance of a water quality certification or waiver thereof for all nationwide or individual permits issued by the United States Army Corps of Engineers (USACE) under Section 404 of the CWA. Issuance of water quality certification (or waiver) is considered a discretionary action, requiring review under the California Environmental Quality Act (CEQA). The RWQCB considers impacts on all waters of the U.S. and wetlands identified in the project area during the CEQA review process and issues water quality certification. Thus, Section 401 of the CWA is implemented by the San Francisco RWQCB, as discussed in Section 4.13.1.2.
Federal Endangered Species Act of 1973, as Amended (Public Law 93-295)
The Federal Endangered Species Act (FESA) of 1973 mandates as federal policy that all federal agencies should work towards conservation of species of fish, wildlife, and plants in danger of or threatened with extinction. USFWS has jurisdiction over plants, wildlife, and resident fish, while the National Oceanic and Atmospheric Administration (NOAA) Fisheries has jurisdiction over anadromous fish, marine fish, and marine mammals. Federal agencies that fund, authorize, or carry out actions that “may affect” a listed species and its habitat, must consult with USFWS and/or NOAA Fisheries according to the provisions in Section 7(a) of the FESA to ensure that the federal agencies’ actions do not jeopardize the continued existence of a listed species or adversely modify critical habitat for listed species. USFWS is authorized to permit the taking of listed species “if such taking is incidental to, and not the purpose of carrying out otherwise lawful activities” [16 U.S.C. 1539 and Section 10(a)(1)(B) of FESA]. For federal actions, an incidental take may be authorized pursuant to Section 7 consultation with the issuance of a Biological Opinion by USFWS and/or NOAA Fisheries. For non-federal (i.e., state and private) actions, Section 10 of the FESA requires
R E S O U R C E S
More information on federal and state environmental laws and regulations:
CLEAN WATER ACT SECTION 401 www.epa.gov/wetlands/regs/sec401.html
FEDERAL ENDANGERED SPECIES ACT OF 1973, as Amended (Public Law 93-295) www.fws.gov/Endangered/ESA/content.html
MIGRATORY BIRD TREATY ACT www.fws.gov/pacific/migratorybirds/mbta.htm
EXECUTIVE ORDER 13112 – INVASIVE SPECIES www.invasivespeciesinfo.gov/laws/execorder.shtml
CALIFORNIA ENDANGERED SPECIES ACT OF 1984 www.dfg.ca.gov/habcon/cesa
PORTER-COLOGNE ACT ceres.ca.gov/wetlands/agencies/swrcb.html
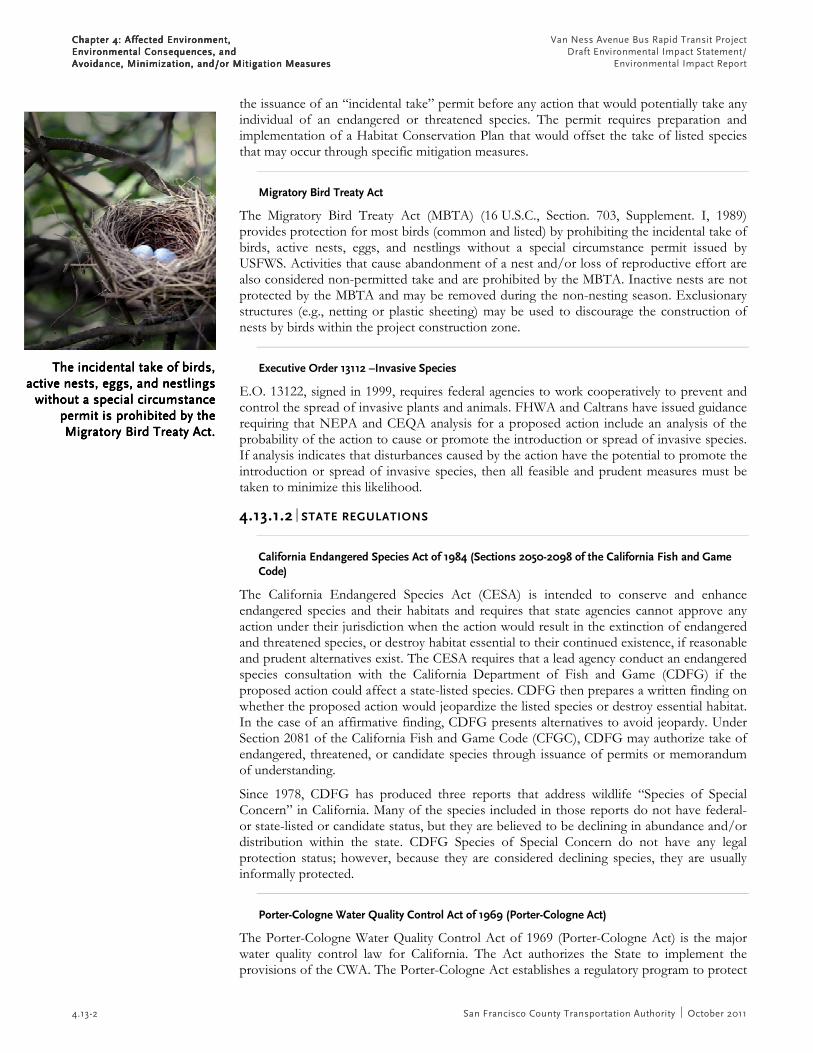
Chapter 4: Affected Environment,Chapter 4: Affected Environment,Chapter 4: Affected Environment,Chapter 4: Affected Environment, Van Ness Avenue Bus Rapid Transit Project Environmental Environmental Environmental Environmental Consequences, andConsequences, andConsequences, andConsequences, and Draft Environmental Impact Statement/ Avoidance, Minimization, and/or Mitigation MeasuresAvoidance, Minimization, and/or Mitigation MeasuresAvoidance, Minimization, and/or Mitigation MeasuresAvoidance, Minimization, and/or Mitigation Measures Environmental Impact Report
4.13-2 San Francisco County Transportation Authority October 2011
the issuance of an “incidental take” permit before any action that would potentially take any individual of an endangered or threatened species. The permit requires preparation and implementation of a Habitat Conservation Plan that would offset the take of listed species that may occur through specific mitigation measures.
Migratory Bird Treaty Act
The Migratory Bird Treaty Act (MBTA) (16 U.S.C., Section. 703, Supplement. I, 1989) provides protection for most birds (common and listed) by prohibiting the incidental take of birds, active nests, eggs, and nestlings without a special circumstance permit issued by USFWS. Activities that cause abandonment of a nest and/or loss of reproductive effort are also considered non-permitted take and are prohibited by the MBTA. Inactive nests are not protected by the MBTA and may be removed during the non-nesting season. Exclusionary structures (e.g., netting or plastic sheeting) may be used to discourage the construction of nests by birds within the project construction zone.
Executive Order 13112 –Invasive Species
E.O. 13122, signed in 1999, requires federal agencies to work cooperatively to prevent and control the spread of invasive plants and animals. FHWA and Caltrans have issued guidance requiring that NEPA and CEQA analysis for a proposed action include an analysis of the probability of the action to cause or promote the introduction or spread of invasive species. If analysis indicates that disturbances caused by the action have the potential to promote the introduction or spread of invasive species, then all feasible and prudent measures must be taken to minimize this likelihood.
4.13.1.2STATE REGULATIONS
California Endangered Species Act of 1984 (Sections 2050-2098 of the California Fish and Game Code)
The California Endangered Species Act (CESA) is intended to conserve and enhance endangered species and their habitats and requires that state agencies cannot approve any action under their jurisdiction when the action would result in the extinction of endangered and threatened species, or destroy habitat essential to their continued existence, if reasonable and prudent alternatives exist. The CESA requires that a lead agency conduct an endangered species consultation with the California Department of Fish and Game (CDFG) if the proposed action could affect a state-listed species. CDFG then prepares a written finding on whether the proposed action would jeopardize the listed species or destroy essential habitat. In the case of an affirmative finding, CDFG presents alternatives to avoid jeopardy. Under Section 2081 of the California Fish and Game Code (CFGC), CDFG may authorize take of endangered, threatened, or candidate species through issuance of permits or memorandum of understanding.
Since 1978, CDFG has produced three reports that address wildlife “Species of Special Concern” in California. Many of the species included in those reports do not have federal- or state-listed or candidate status, but they are believed to be declining in abundance and/or distribution within the state. CDFG Species of Special Concern do not have any legal protection status; however, because they are considered declining species, they are usually informally protected.
Porter-Cologne Water Quality Control Act of 1969 (Porter-Cologne Act)
The Porter-Cologne Water Quality Control Act of 1969 (Porter-Cologne Act) is the major water quality control law for California. The Act authorizes the State to implement the provisions of the CWA. The Porter-Cologne Act establishes a regulatory program to protect
TTTThe incidental take of birds, he incidental take of birds, he incidental take of birds, he incidental take of birds, active nests,active nests,active nests,active nests, eggs, andeggs, andeggs, andeggs, and nestlings nestlings nestlings nestlings
without a special circumstance without a special circumstance without a special circumstance without a special circumstance permitpermitpermitpermit is prohibited by the is prohibited by the is prohibited by the is prohibited by the Migratory Bird Treaty Act.Migratory Bird Treaty Act.Migratory Bird Treaty Act.Migratory Bird Treaty Act.

Van Ness Avenue Bus Rapid Transit Project Chapter 4: Affected Environment,Chapter 4: Affected Environment,Chapter 4: Affected Environment,Chapter 4: Affected Environment, Draft Environmental Impact Statement/ Environmental Consequences, andEnvironmental Consequences, andEnvironmental Consequences, andEnvironmental Consequences, and Environmental Impact Report Avoidance, Minimization, and/or Mitigation Measures Avoidance, Minimization, and/or Mitigation Measures Avoidance, Minimization, and/or Mitigation Measures Avoidance, Minimization, and/or Mitigation Measures
San Francisco County Transportation Authority October 2011 4.13-3
the water quality of the state and the beneficial uses of state waters. Under this act, the SWRCB provides policy guidance and review for the RWQCBs, and the RWQCBs implement and enforce the provisions of the Act. Section 401 of the CWA stipulates that any action that requires a federal license or permit and that may result in a discharge of pollutants into waters of the U.S. also requires water quality certification. Locally, this program is administered by the San Francisco RWQCB and is designed to ensure that the discharge will comply with applicable federal and state effluent limitations and water quality standards. Certification applies to both construction and operation.
4.13.1.3LOCAL REGULATIONS
Planning Department Tree Protection Legislation – Director’s Bulletin No. 2006-01
The San Francisco Planning Department issued Director’s Bulletin No. 2006-01 in 2006 to establish guidelines for implementation of City tree protection legislation set forth in Article 16 Urban Forestry Ordinance of the Public Works Code. The City considers “protected trees” as street trees, significant trees, and landmark trees. Removal of any of these requires a permit. Moreover, if any project activity is to occur within the tree drip line, then a Tree Protection Plan prepared by an International Society of Arborculture (ISA) certified arborist is to be submitted to the Planning Department for review and approval. Protected trees are defined as follows:
• Landmark Trees. Landmark Trees have the highest level of protection in the City. These trees meet criteria for age, size, shape, species, location, historical association, visual quality, or other contribution to the City’s character and have been found worthy of Landmark status after Urban Forestry Council and Board of Supervisors public hearings. Temporary landmark status is also afforded to nominated trees currently undergoing the public hearing process. The SFDPW maintains the official “Landmark Tree Book” with all designated Landmark Trees in San Francisco.
• Significant Trees. Significant Trees are located within 10 feet of the property edge of the sidewalk and are above 20 feet in height, or have a canopy greater than 15 feet in diameter, or have a trunk diameter greater than 12 inches at breast height.
• Street Trees. Street Trees are trees within the public ROW. Street Trees may be maintained by either the adjacent property owner or the City.
Removal of a protected tree requires a tree removal permit from SFDPW, which involves inspection and evaluation of the tree by an SFDPW representative. A tree removal notice is posted for up to 30 days. If objection to removal is received, then the removal is scheduled for public hearing. In addition, if SFDPW denies removal, then the applicant can request a public hearing. A hearing officer will make a recommendation to the SFDPW Director following a hearing, who will in turn issue a final decision. Following a SFDPW-issued tree removal permit, a Tree Disclosure Statement must be submitted to the Planning Department and Department of Building Inspection for review and approval prior to issuance of demolition, grading, or building permits.
4.13.2Affected Environment
The project corridor is wholly developed with little or no indigenous vegetation. There are no wetlands, seasonal or perennial watercourses, or riparian areas within the project area. The Van Ness Avenue corridor is considered a major storm water catch basin in San Francisco, which is discussed in Section 4.9, Hydrology and Water Quality. Existing vegetation in the corridor consists of predominately non-native ornamental trees and shrubs planted along the sidewalks and within the median strip. Most of these plantings feature ornamental species not native to California such as Eucalyptus trees, including Desert Gum (Eucalyptus rudis), Silver Dollar Gum (Eucalyptus polyanthemus), and Beautiful Leaf Eucalyptus (Eucalyptus calophylla). Other planted species include Linden (Tilia sp.) and London Plane
Existing vegetation consists of Existing vegetation consists of Existing vegetation consists of Existing vegetation consists of predominately nonpredominately nonpredominately nonpredominately non----native native native native ornamental trees and shrubs ornamental trees and shrubs ornamental trees and shrubs ornamental trees and shrubs planted along the sidewalks and planted along the sidewalks and planted along the sidewalks and planted along the sidewalks and within the median strip. within the median strip. within the median strip. within the median strip.

Chapter 4: Affected Environment,Chapter 4: Affected Environment,Chapter 4: Affected Environment,Chapter 4: Affected Environment, Van Ness Avenue Bus Rapid Transit Project Environmental Environmental Environmental Environmental Consequences, andConsequences, andConsequences, andConsequences, and Draft Environmental Impact Statement/ Avoidance, Minimization, and/or Mitigation MeasuresAvoidance, Minimization, and/or Mitigation MeasuresAvoidance, Minimization, and/or Mitigation MeasuresAvoidance, Minimization, and/or Mitigation Measures Environmental Impact Report
4.13-4 San Francisco County Transportation Authority October 2011
Tree (Platanus x acerifolia). Plantings along the median are mostly colorful, hearty plants, such as Lily of the Nile (Agapanthus sp.) and other ornamental varieties (SFGOV, 2007).
Planted trees and shrubs in landscaped areas can provide marginal suitable refuge for several bird species during seasonal nesting and migration periods. Several bird and raptor species are known to occur within San Francisco, including Anna’s hummingbird (Calypte anna), house finch (Carpodacus mexicanus), Brewer’s blackbird (Euphagus cyanocephalus), mourning dove (Zenaida macroura), American crow (Corvus branchyrhyncos), red-tailed hawk (Buteo jamaicensis), Cooper’s hawk (Accipiter cooperii), and peregrine falcon (Falco peregrinus). The peregrine falcon is a California state endangered species known to nest on buildings in urban settings, including San Francisco. Peregrine falcons have been regularly observed perched on the California State Automobile Association (CSAA) building located at 100 Van Ness Avenue, and they have been photographed at City Hall. There is no record or evidence that peregrine falcons or other raptors have nested on these or any other buildings along Van Ness Avenue (GANDA, 2009).
A search of the CNDDB database for the San Francisco north 7.5-minute quadrangle map provided a list of 12 special-status animals. None of the animals listed are known to occur within the project corridor. Of the 12 records reported, only 2 monarch butterfly (Danaus plexippus) overwintering sites are known to occur within 1-mile of the project. One site at Telegraph Hill and another near Fort Mason are the nearest occurrences, but they are outside the project area. Other special-status animal records reported by the CNDDB include California red-legged frog (Rana aurora draytonii), western pond turtle (Clemmys marmorata), and American badger (Taxidea taxus). All of these records are located in Golden Gate Park and are more than 1.5 miles from the project area.
4.13.3Environmental Consequences
The project corridor does not include wetlands, water bodies, or riparian habitat; therefore, the build alternatives would not affect Waters of the U.S. or require Section 401 Water Quality Certification. In addition to its own storm water management program, the City of San Francisco is required by federal, state, and local laws to implement programs that reduce the discharge of pollutants to the local storm drain system, as discussed in Section 4.9, Hydrology and Water Quality (SFPUC, 2007).
The project area has no special-status biological resources or protected habitats that could be impacted by the proposed build alternatives, and to a lesser extent the No Build Alternative. Thus, no native plant assemblage or biotic community would be disturbed during operation of the project or under the No Build Alternative. Nonetheless, median and sidewalk vegetation along Van Ness Avenue provides habitat for nesting birds, which are protected by the MBTA. Operation of the proposed build alternatives, including Design Option B, would not increase disturbance to migratory birds and active bird nests during the nesting season. Similarly, operation under the No Build Alternative would not increase disturbance to migratory birds and active bird nests. Potential disturbance to migratory birds during project construction is discussed in Section 4.15.11, Construction Impacts.
Although operation of the proposed BRT under all of the build alternatives would not increase disturbance to migratory birds, each build alternative would require removal of existing trees and shrubs. The impact from the removal of existing trees and shrubs would be alleviated under each build alternative with replacement planting. Each build alternative, including Design Option B, would marginally increase the landscaped area over the existing condition and No Build Alternative. The No Build Alternative would not include removal of existing trees and shrubs.
K E Y F I N D I N G S
� The build alternatives would not affect Waters of the U.S.
or require Section 401 Water Quality Certification.
� No native plant assemblage or biotic community would be disturbed during operation of the project or under the
No Build Alternative.
� The removal of existing trees and shrubs is not
significant because each build alternative would
include replacement planting.

Van Ness Avenue Bus Rapid Transit Project Chapter 4: Affected Environment,Chapter 4: Affected Environment,Chapter 4: Affected Environment,Chapter 4: Affected Environment, Draft Environmental Impact Statement/ Environmental Consequences, andEnvironmental Consequences, andEnvironmental Consequences, andEnvironmental Consequences, and Environmental Impact Report Avoidance, Minimization, and/or Mitigation Measures Avoidance, Minimization, and/or Mitigation Measures Avoidance, Minimization, and/or Mitigation Measures Avoidance, Minimization, and/or Mitigation Measures
San Francisco County Transportation Authority October 2011 4.13-5
4.13.4Avoidance, Minimization, and/or Mitigation Measures
Potential disturbance to migratory birds during project construction and tree removal permitting is discussed in Section 4.15.11, Construction Impacts. To minimize impacts from removal of existing trees and landscaping, the following improvement measures and permit requirements would be incorporated into project design for each build alternative, including Design Option B:
I-BI-1. In compliance with local tree protection policies, mature trees shall be preserved and incorporated into the project landscape plan as feasible. Planting of replacement trees and landscaping will be incorporated into the landscape plan as feasible.
I-BI-2. A preconstruction tree survey conducted by a certified arborist will be completed to identify protected trees that will be potentially impacted by the proposed project and to determine the need for tree removal permits and tree protection plans.
I-BI-3. In compliance with the Executive Order on Invasive Species, E.O. 13112, the landscaping included in the proposed project will not use species listed as noxious weeds.
A preconstruction tree survey conducted by a certified arborist will be completed to identify protected trees that will be potentially impacted by the proposed project and to determine the need for tree removal permits and tree protection plans.

Chapter 4: Affected Environment,Chapter 4: Affected Environment,Chapter 4: Affected Environment,Chapter 4: Affected Environment, Van Ness Avenue Bus Rapid Transit Project Environmental Environmental Environmental Environmental Consequences, andConsequences, andConsequences, andConsequences, and Draft Environmental Impact Statement/ Avoidance, Minimization, and/or Mitigation MeasuresAvoidance, Minimization, and/or Mitigation MeasuresAvoidance, Minimization, and/or Mitigation MeasuresAvoidance, Minimization, and/or Mitigation Measures Environmental Impact Report
4.13-6 San Francisco County Transportation Authority October 2011
This page intentionally left blank.

Van Ness Avenue Bus Rapid Transit Project Chapter 4: Affected Environment,Chapter 4: Affected Environment,Chapter 4: Affected Environment,Chapter 4: Affected Environment, Draft Environmental Impact Statement/ Environmental Consequences, andEnvironmental Consequences, andEnvironmental Consequences, andEnvironmental Consequences, and Environmental Impact Report Avoidance, MinimizatioAvoidance, MinimizatioAvoidance, MinimizatioAvoidance, Minimization, and/or Mitigation Measures n, and/or Mitigation Measures n, and/or Mitigation Measures n, and/or Mitigation Measures
San Francisco County Transportation Authority October 2011 4.14-1
4.14 Environmental Justice
4.14.1Regulatory Setting
In response to concerns over environmental impacts in minority and low-income populations, the Executive Office of the President of the United States established a formal federal policy on environmental justice in February 1994 with Executive Order (EO) 12898 (Federal Actions to Address Environmental Justice in Minority Populations and Low-Income Populations). This executive order calls on federal agencies to identify and address any disproportionately high and adverse human health or environmental effects of federal programs, policies, and activities on minority populations and low-income populations. The general principles under EO 12898 are as follows:
• Avoid, minimize, or mitigate disproportionately high and adverse human health and environmental effects, including social and economic effects, on minority and low-income populations.
• Ensure the full and fair participation of all potentially affected communities in the transportation decision-making process.
• Prevent the denial of, reduction in, or significant delay in the receipt of benefits by minority and low-income populations.
In April 1997, the U.S. Department of Transportation (DOT) issued an Order on Environmental Justice (DOT Order 5610.2), establishing procedures for its operating administrations, including FTA, to comply with EO 12898 and to promote environmental justice principles as part of its mission. Order 5610.2 stresses the importance of addressing environmental justice concerns early in the development of a program, policy, or activity. It requires where relevant, appropriate, and practical, that information be obtained on the population served and/or affected, including information on race, color, or national origin and income level and that steps be taken to guard against disproportionately high and adverse impacts on protected populations.
Beginning with the Van Ness Avenue BRT Feasibility Study undertaken in 2006, SFCTA involved and sought input from the general public to understand transit needs in the Van Ness Avenue corridor and identify alternative BRT improvements to meet those needs. That public involvement process, which will continue through completion of the EIS/EIR and design/construction, has been all-inclusive, based on outreach to all of the affected communities, which include people of diverse incomes, ethnicities, and languages in the study area.
Impacts and benefits of transportation projects to neighborhoods and the region result from the physical placement and operation of such transportation facilities. This environmental justice analysis examines whether adverse effects across all environmental resource areas are experienced disproportionately by, and are higher for, areas with a concentration of minority and/or low-income populations..
4.14.2Affected Environment
For purposes of EO 12898, the U.S. DOT Order addresses persons belonging to the following focused populations:
• Minority: People of the following Census-defined races or ethnicities: Black, Asian, American Indian and Alaskan Native, Native Hawaiian or Other Pacific Islander, and Hispanic.
D E F I N I T I O N S ( A S D E F I N E D B Y T H E
U . S . C E N S U S 2 0 0 0 )
MINORITY: People of the following Census-defined races or ethnicities: Black, Asian, American Indian and Alaskan Native, Native Hawaiian or Other Pacific Islander, and Hispanic.
LOW-INCOME: Households whose household income is at, or below, the U.S. Department of Health and Human Services (HHS) poverty guidelines. The HHS poverty guideline for the 2000 U.S. Census were $8,240 for a single-person household and $2,820 for each additional household occupant.

Chapter 4: Affected Environment,Chapter 4: Affected Environment,Chapter 4: Affected Environment,Chapter 4: Affected Environment, Van Ness Avenue Bus Rapid Transit Project Environmental Consequences, andEnvironmental Consequences, andEnvironmental Consequences, andEnvironmental Consequences, and Draft Environmental Impact Statement/ Avoidance, MinimizaAvoidance, MinimizaAvoidance, MinimizaAvoidance, Minimization, and/or Mitigation Measurestion, and/or Mitigation Measurestion, and/or Mitigation Measurestion, and/or Mitigation Measures Environmental Impact Report
4.14-2 San Francisco County Transportation Authority October 2011
• Low-income: Households whose household income is at, or below, the U.S. Department of Health and Human Services (HHS) poverty guidelines.
U.S. Census 2000 data were used to identify the location of minority populations and low-income populations within the Van Ness Avenue BRT study area.49 Information was collected at the Census Block Group level, which is an aggregate of Census Blocks. Census Block Groups data were used to identify the location of minority populations, as was done for determining income levels. Because the Census Bureau must protect the privacy of individuals, all household income data is released in units no smaller than the Block Group, rather than by Block, which is the smallest geographic unit used by the Census Bureau for collecting and reporting demographic data..
The study area has a population that is socioeconomically and ethnically diverse, as summarized in Section 4.2, Community Impacts, and presented in Table 4.14-1 (majority/minority populations are highlighted in grey for emphasis). Approximately 43 percent of all study area residents are members of minority populations (i.e., non-white), compared with an approximate 56 percent minority population in the City and County of San Francisco. Figure 4.14-2 on page 4.14-9 shows the location of these block groups.
Table 4.14-1: 2000 U.S. Census Block Group Analysis
STUDY AREA LOCATION POPULATION % MINORITY AVERAGE HOUSEHOLD
SIZE
MEDIAN HOUSEHOLD
INCOME
HHS POVERTY LINE
Census Tract 102, Block Group 1 1,316 16.4% 1.7 $99,252 $13,034
Census Tract 102, Block Group 2 1,929 14.0% 1.5 $86,639 $12,470
Census Tract 102, Block Group 3 1,043 20.6% 1.5 $61,150 $12,470
Census Tract 109, Block Group 1 1,081 26.8% 1.7 $90,711 $13,034
Census Tract 109, Block Group 2 1,754 34.4% 1.8 $66,959 $13,316
Census Tract 109, Block Group 3 1,671 27.6% 1.5 $49,214 $12,470
Census Tract 110, Block Group 1 868 48.6% 1.8 $46,875 $13,316
Census Tract 110, Block Group 2 2,095 70.0%70.0%70.0%70.0% 2.3 $34,081 $14,726
Census Tract 110, Block Group 3 2,066 59.1%59.1%59.1%59.1% 2.0 $49,063 $13,880
Census Tract 110, Block Group 1 2,241 54.4%54.4%54.4%54.4% 1.9 $39,792 $13,598
Census Tract 110, Block Group 2 2,280 51.4%51.4%51.4%51.4% 1.8 $30,148 $13,316
Census Tract 110, Block Group 3 1,038 47.1% 1.6 $44,191 $12,752
Census Tract 120, Block Group 1 1,965 44.7% 1.4 $25,696 $12,188
Census Tract 120, Block Group 2 2,007 52.3%52.3%52.3%52.3% 1.6 $25,524 $12,752
Census Tract 122, Block Group 1 2,641 56.5%56.5%56.5%56.5% 1.8 $31,674 $13,316
Census Tract 122, Block Group 2 2,082 70.0%70.0%70.0%70.0% 1.9 $24,811 $13,598
Census Tract 122, Block Group 3 2,312 58.2%58.2%58.2%58.2% 1.6 $30,426 $12,752
Census Tract 124, Block Group 1 1,867 65.3%65.3%65.3%65.3% 1.8 $22,303 $13,316
Census Tract 124, Block Group 2 2,785 75.3%75.3%75.3%75.3% 2.0 $21,937 $13,880
Census Tract 124, Block Group 3 1,220 50.7%50.7%50.7%50.7% 1.5 $16,098 $12,470
Census Tract 124, Block Group 4 749 37.1% 1.3 $37,875 $11,906
Census Tract 124, Block Group 5 1,567 53.2%53.2%53.2%53.2% 1.7 $13,252 $13,034
Census Tract 129, Block Group 1 1,308 17.1% 1.6 $66,360 $12,752
Census Tract 129, Block Group 2 1,253 22.6% 1.6 $74,313 $12,752
49 As of August 2011, the U.S. Census Bureau has not released its income data from the 2010 census at a Block Group level.
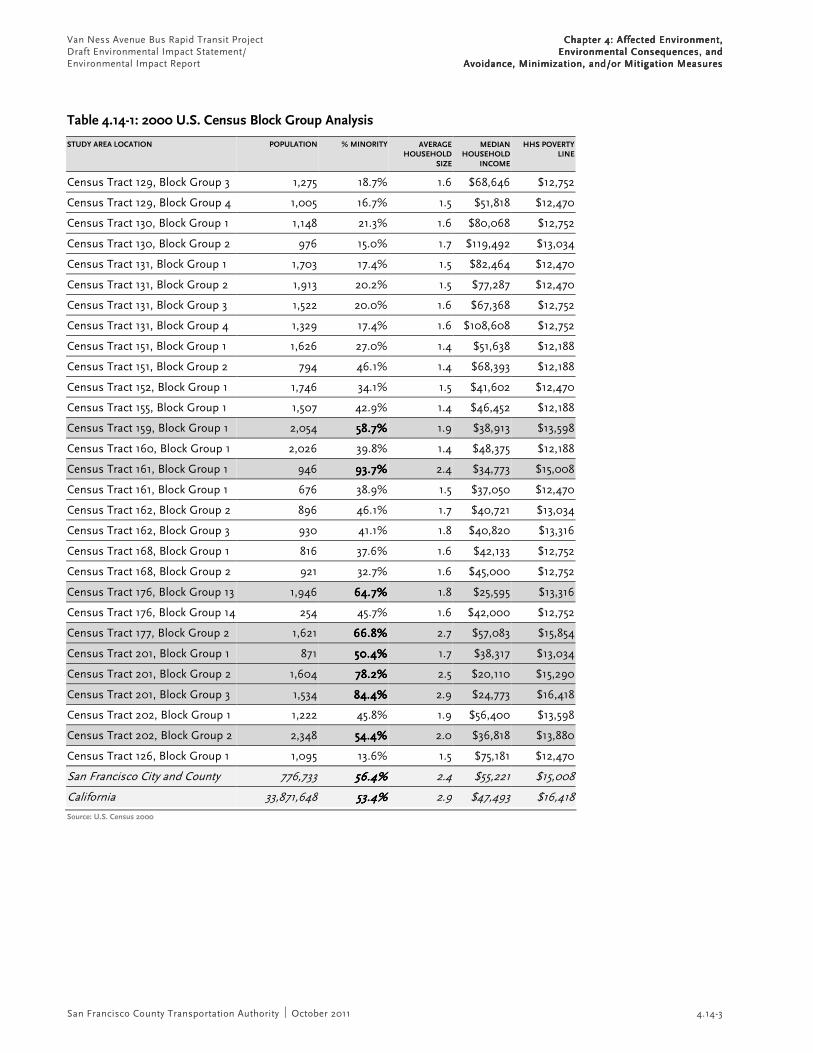
Van Ness Avenue Bus Rapid Transit Project Chapter 4: Affected Environment,Chapter 4: Affected Environment,Chapter 4: Affected Environment,Chapter 4: Affected Environment, Draft Environmental Impact Statement/ Environmental Consequences, andEnvironmental Consequences, andEnvironmental Consequences, andEnvironmental Consequences, and Environmental Impact Report Avoidance, MinimizatioAvoidance, MinimizatioAvoidance, MinimizatioAvoidance, Minimization, and/or Mitigation Measures n, and/or Mitigation Measures n, and/or Mitigation Measures n, and/or Mitigation Measures
San Francisco County Transportation Authority October 2011 4.14-3
Table 4.14-1: 2000 U.S. Census Block Group Analysis
STUDY AREA LOCATION POPULATION % MINORITY AVERAGE HOUSEHOLD
SIZE
MEDIAN HOUSEHOLD
INCOME
HHS POVERTY LINE
Census Tract 129, Block Group 3 1,275 18.7% 1.6 $68,646 $12,752
Census Tract 129, Block Group 4 1,005 16.7% 1.5 $51,818 $12,470
Census Tract 130, Block Group 1 1,148 21.3% 1.6 $80,068 $12,752
Census Tract 130, Block Group 2 976 15.0% 1.7 $119,492 $13,034
Census Tract 131, Block Group 1 1,703 17.4% 1.5 $82,464 $12,470
Census Tract 131, Block Group 2 1,913 20.2% 1.5 $77,287 $12,470
Census Tract 131, Block Group 3 1,522 20.0% 1.6 $67,368 $12,752
Census Tract 131, Block Group 4 1,329 17.4% 1.6 $108,608 $12,752
Census Tract 151, Block Group 1 1,626 27.0% 1.4 $51,638 $12,188
Census Tract 151, Block Group 2 794 46.1% 1.4 $68,393 $12,188
Census Tract 152, Block Group 1 1,746 34.1% 1.5 $41,602 $12,470
Census Tract 155, Block Group 1 1,507 42.9% 1.4 $46,452 $12,188
Census Tract 159, Block Group 1 2,054 58.7%58.7%58.7%58.7% 1.9 $38,913 $13,598
Census Tract 160, Block Group 1 2,026 39.8% 1.4 $48,375 $12,188
Census Tract 161, Block Group 1 946 93.7%93.7%93.7%93.7% 2.4 $34,773 $15,008
Census Tract 161, Block Group 1 676 38.9% 1.5 $37,050 $12,470
Census Tract 162, Block Group 2 896 46.1% 1.7 $40,721 $13,034
Census Tract 162, Block Group 3 930 41.1% 1.8 $40,820 $13,316
Census Tract 168, Block Group 1 816 37.6% 1.6 $42,133 $12,752
Census Tract 168, Block Group 2 921 32.7% 1.6 $45,000 $12,752
Census Tract 176, Block Group 13 1,946 64.7%64.7%64.7%64.7% 1.8 $25,595 $13,316
Census Tract 176, Block Group 14 254 45.7% 1.6 $42,000 $12,752
Census Tract 177, Block Group 2 1,621 66.8%66.8%66.8%66.8% 2.7 $57,083 $15,854
Census Tract 201, Block Group 1 871 50.4%50.4%50.4%50.4% 1.7 $38,317 $13,034
Census Tract 201, Block Group 2 1,604 78.2%78.2%78.2%78.2% 2.5 $20,110 $15,290
Census Tract 201, Block Group 3 1,534 84.4%84.4%84.4%84.4% 2.9 $24,773 $16,418
Census Tract 202, Block Group 1 1,222 45.8% 1.9 $56,400 $13,598
Census Tract 202, Block Group 2 2,348 54.4%54.4%54.4%54.4% 2.0 $36,818 $13,880
Census Tract 126, Block Group 1 1,095 13.6% 1.5 $75,181 $12,470
San Francisco City and County 776,733 56.4%56.4%56.4%56.4% 2.4 $55,221 $15,008
California 33,871,648 53.4%53.4%53.4%53.4% 2.9 $47,493 $16,418
Source: U.S. Census 2000

Chapter 4: Affected Environment,Chapter 4: Affected Environment,Chapter 4: Affected Environment,Chapter 4: Affected Environment, Van Ness Avenue Bus Rapid Transit Project Environmental Consequences, andEnvironmental Consequences, andEnvironmental Consequences, andEnvironmental Consequences, and Draft Environmental Impact Statement/ Avoidance, MinimizaAvoidance, MinimizaAvoidance, MinimizaAvoidance, Minimization, and/or Mitigation Measurestion, and/or Mitigation Measurestion, and/or Mitigation Measurestion, and/or Mitigation Measures Environmental Impact Report
4.14-4 San Francisco County Transportation Authority October 2011
The HHS poverty guidelines for the 2000 U.S. Census were $8,240 for a single-person household and $2,820 for each additional household occupant. Using the above federal guidance definitions, there are no Census Block Groups, as defined by the federal CEQ, 50 within the study area with a predominantly low-income population. Both San Francisco and the study area far exceed the HHS poverty threshold guidelines, with median incomes of $55,221 and $47,493, respectively. Though the median income of all the affected Block Groups exceeds the poverty level, field observations indicate a greater presence of homeless people in the southern portion of the corridor, namely near the Civic Center and Market Street vicinities (Parsons 2011). There are several government-funded and other community resource centers in this area serving low-income and mentally ill populations. In addition, using the 2000 U.S. Census poverty thresholds, a number of Census Block Groups were identified as having a meaningfully greater proportion (i.e., more than 10 percent greater) of households with incomes below the poverty threshold than the City of San Francisco as a whole. Figure 4.14-1 on page 4.14-8 shows these low-income groups using the 2000 U.S. Census poverty thresholds.
4.14.3Environmental Consequences
A proposed project would result in environmental justice impacts if project implementation would create disproportionately high or adverse human health or environmental effects on minority or low-income populations relative to the larger area/community of comparison. To determine whether the proposed project would result in environmental justice impacts, the project’s adverse effects on minority and low-income populations are compared to the proposed project’s adverse effects on non-minority and non-low-income populations to identify any disproportionate effects.
Analysis of each environmental factor presented in Sections 3.1 through 4.15 of this EIS/EIR includes detailed discussion of the affected environment, environmental consequences, and avoidance, minimization, and mitigation measures for each project alternative. All potentially significant, adverse effects – with the exception of impacts to traffic circulation – can be minimized or mitigated through implementation of measures identified in each section. A brief summary of the impacts associated with each environmental factor with respect to environmental justice is provided below.
4.14.3.1LAND USE
As explained in Sections 4.1 and 4.16, no changes or adverse effects to existing land uses or planned development would occur with construction or operation of any of the proposed build alternatives; therefore, no related, disproportionate, adverse effects on minority and low-income populations would result.
4.14.3.2COMMUNITY IMPACTS
As described in Section 4.2, the construction and operation of any of the build alternatives would not result in changes to community character or cohesiveness or affect the daily activities or participation levels of any minority or low-income population group. The displacement of colored, on-street parking could adversely affect adjacent commercial and residential properties. Overlaying this assessment on census tract information does not reveal, however, that these impacts would be experienced by low-income and minority
50 The federal Council on Environmental Quality (CEQ) provides policy guidance for implementation of NEPA. The CEQ Environmental Justice Guidance under NEPA (December 10, 1997) states that minority populations should be identified when either of two criteria exists: 1. The minority population of the affected area exceeds 50 percent, or 2. The population percentage of the affected area is meaningful greater than the minority population percentage
in the general population or other appropriate unit of geographical analysis. It has become acceptable in planning studies that “meaningful greater” is represented by 10 percent or greater. In the analysis conducted for the Van Ness Avenue BRT Project, Census Block Groups are compared against the San Francisco City and County-wide averages.

Van Ness Avenue Bus Rapid Transit Project Chapter 4: Affected Environment,Chapter 4: Affected Environment,Chapter 4: Affected Environment,Chapter 4: Affected Environment, Draft Environmental Impact Statement/ Environmental Consequences, andEnvironmental Consequences, andEnvironmental Consequences, andEnvironmental Consequences, and Environmental Impact Report Avoidance, MinimizatioAvoidance, MinimizatioAvoidance, MinimizatioAvoidance, Minimization, and/or Mitigation Measures n, and/or Mitigation Measures n, and/or Mitigation Measures n, and/or Mitigation Measures
San Francisco County Transportation Authority October 2011 4.14-5
groups in a disproportionately high and adverse manner. Construction planning would minimize nighttime construction in residential areas. Such considerations would be part of the public information procedures outlined in the TMP, which would include translation of all notices and announcements in Spanish and Chinese. Notices about construction would be mailed, as well as posted along the corridor, to maximize distribution of information to potentially affected people, including minority and low-income populations.
4.14.3.3GROWTH
As explained in Sections 4.3, none of the proposed project build alternatives are expected to result in unplanned growth in the corridor or larger region. Though the project is not expected to contribute to more growth scenario, current ABAG projections do forecast a 20 percent increase in the number of households to be formed in the City and County of San Francisco between 2000 and 2035. None of the project alternatives would change this forecast rate of growth. With or without the project, the same level of population growth, new housing, and commercial developments are anticipated to occur along the Van Ness Avenue corridor area over time. Because the project alternatives are not expected to alter the rate of growth in the corridor, they would not have growth-related, disproportionately high and adverse effects on minority or low-income areas of the corridor.
4.14.3.4AESTHETICS/VISUAL RESOURCES
As described in Section 4.4, the proposed build alternatives would not result in substantial impacts to the visual environment or to important visual resources in the Van Ness Avenue corridor. As described in Section 4.14.3, visual impacts during project construction would be temporary, and would be experienced by all resident populations and users to a proportionate and nonsubstantial degree. Visual impacts resulting from any of the proposed build alternatives would not disproportionately affect minority and low-income populations.
4.14.3.5CULTURAL RESOURCES
As described in Sections 4.5 and 4.16.4, no impacts to known prehistoric or historical archaeological resources are expected to occur under any of the proposed build alternatives. No adverse impacts to cultural resources would disproportionately affect minority and low-income populations.
4.14.3.6SECTION 4(F)
The Section 4(f) analysis presented in Section 4.15 concludes that there are no direct, temporary, or constructive uses of neither any of the 20 park and recreational facilities located in the vicinity of the project area nor any of the 7 historic properties located within the area of potential effect; therefore, no Section 4(f) impacts would disproportionately affect minority and low-income populations.
4.14.3.7UTILITIES
As described in Sections 4.6 and 4.16.5, construction and operation of any of the build alternatives would not result in changes to utility demand or capacity. Minority and low-income populations would not be disproportionately impacted by temporary utility service interruptions because construction work would be coordinated with the SFDPW-led CULCOP and the San Francisco Street Construction Coordination Center, and information about planned utility service interruptions would be communicated to residents and employees through the public information program implemented as part of the TMP. The public information program would involve translation of all notices and announcements in Spanish and Chinese. Notices about utility interruptions would be mailed, as well as posted along the corridor, to maximize distribution of information to potentially affected people, including minority and low-income populations. The potential for utility disruptions is evenly distributed throughout the project corridor, and it is not anticipated that minority and low-income populations would be disproportionately affected.

Chapter 4: Affected Environment,Chapter 4: Affected Environment,Chapter 4: Affected Environment,Chapter 4: Affected Environment, Van Ness Avenue Bus Rapid Transit Project Environmental Consequences, andEnvironmental Consequences, andEnvironmental Consequences, andEnvironmental Consequences, and Draft Environmental Impact Statement/ Avoidance, MinimizaAvoidance, MinimizaAvoidance, MinimizaAvoidance, Minimization, and/or Mitigation Measurestion, and/or Mitigation Measurestion, and/or Mitigation Measurestion, and/or Mitigation Measures Environmental Impact Report
4.14-6 San Francisco County Transportation Authority October 2011
4.14.3.8GEOLOGY AND SOILS
As described in Section 4.10, the results of the project geologic assessment indicate that there are no substantial geologic hazard impacts that would not be fully addressed by design specifications, and no mitigation measures are proposed. There would be no geologic or seismic project impacts to disproportionately affect minority and low-income populations.
4.14.3.9HAZARDOUS MATERIALS
As explained in Sections 4.8 and 4.16.7, project operation would not result in increased usage, transport, release, or exposure of hazardous materials to people in the project corridor. Potential exposure impacts from the release of hazardous materials during project construction would be avoided or mitigated through measures as described in Section 4.16. There would not be a potential for disproportionate exposure or other impacts on minority and low-income groups from hazardous materials as a result of the proposed project.
4.14.3.10HYDROLOGY AND WATER QUALITY
As described in Section 4.9, none of the build alternatives would substantially alter the existing drainage pattern of the area or create flooding. Each build alternative would result in a slight reduction in stormwater runoff, which is a beneficial effect. The project would not affect groundwater or drinking water. Neither the potential stormwater impacts anticipated during construction nor the water quality and hydrology impacts under any build alternative would be significant and, accordingly, would not have a disproportionately high and adverse affect on minority and low-income populations.
4.14.3.11AIR QUALITY
As described in Section 4.10, operation of any of the project build alternatives would decrease VMT and associated regional emissions resulting in air quality benefits. Project construction would result in localized emissions; however, these emissions would not exceed the State ambient air quality standards. Construction-related air quality impacts would be temporary and would not disproportionately impact minority and low-income groups.
4.14.3.12NOISE AND VIBRATION
As discussed in Section 4.11, operation of the proposed project would not result in new vibration and noise impacts in the Van Ness Avenue corridor. Project construction would result in temporary increases in noise and vibration; however, these exposure effects are expected to be minimal, and they would not disproportionately impact minority and low-income groups.
4.14.3.13BIOLOGICAL RESOURCES
As explained in Sections 4.13 and 4.16.11, the proposed project is located in a highly developed, urban area of San Francisco with no water bodies, wetlands, open space, protected habitats, or other special-status biological resources. Project implementation would result in increased vegetation and plantings in the Van Ness Avenue corridor, and construction would not result in significant impacts to biological resources that would in turn disproportionately affect minority and low-income populations.
4.14.3.14TRANSIT
Each of the proposed build alternatives would result in improved transit reliability and travel time savings that would benefit all communities in the study area and citywide, including minority and low-income groups. Implementation of the proposed project would improve transit service for the transit-dependent populations within the corridor. There would be no fare increase for BRT on Van Ness Avenue. Impacts to existing transit service during project construction would be temporary, and outreach as part of the TMP would include translation of all notices and announcements in Spanish and Chinese. Notices about construction would be mailed, as well as posted along the corridor, to maximize distribution

Van Ness Avenue Bus Rapid Transit Project Chapter 4: Affected Environment,Chapter 4: Affected Environment,Chapter 4: Affected Environment,Chapter 4: Affected Environment, Draft Environmental Impact Statement/ Environmental Consequences, andEnvironmental Consequences, andEnvironmental Consequences, andEnvironmental Consequences, and Environmental Impact Report Avoidance, MinimizatioAvoidance, MinimizatioAvoidance, MinimizatioAvoidance, Minimization, and/or Mitigation Measures n, and/or Mitigation Measures n, and/or Mitigation Measures n, and/or Mitigation Measures
San Francisco County Transportation Authority October 2011 4.14-7
of information to potentially affected people, including minority and low-income populations. Following project completion of any of the three build alternatives, transit benefits would be realized for all communities, including low-income and minority populations in the project study area, and for commuters residing outside the project study area.
4.14.3.15NONMOTORIZED TRANSPORTATION
As discussed in Section 3.4, the proposed build alternatives would change the design characteristics of Van Ness Avenue, including crossing distances, median widths, and provision of corner bulbs. For the most part, these design changes would improve the overall pedestrian environment of Van Ness Avenue, resulting in beneficial effects, and would not significantly affect bicycle conditions. Adverse impacts to the pedestrian environment could include an increase in pedestrian delay at some intersections, which is the average amount of time a pedestrian must wait for the traffic signals to change to allow crossing. This impact is not considered substantial when considered in the context of the numerous project benefits to the pedestrian environment that include shorter crossing distances and installation of count-down signals and APS at all intersections. The aforementioned benefits and impacts to nonmotorized transportation would occur throughout the Van Ness Avenue corridor and would not disproportionally affect low-income and minority communities. Impacts to nonmotorized transportation during project construction would be temporary and would not be substantial. Project construction would not involve closure of sidewalks or crosswalks. Detour signage and notifications for the general public would be part of the public information program implemented as part of the TMP.
4.14.3.16PARKING
Curbside parking on Van Ness Avenue would generally be preserved with the implementation of any of the build alternatives, although parking spaces would be reconfigured and entirely removed on select blocks, as described in Section 3.4. The City of San Francisco does not consider parking supply as part of the physical environment, and the displacement of existing parking spaces is not considered a significant impact in the City. Impacts from the removal of parking in the Van Ness Avenue corridor would not disproportionately affect low-income and minority communities.
4.14.3.17VEHICULAR TRAFFIC
Each of the proposed build alternatives is expected to result in potentially significant impacts to automobile traffic circulation, as explained in detail in Section 3.3, Vehicular Traffic. Vehicular traffic circulation impacts that would result from implementation of the proposed build alternatives would by nature not only affect people with cars who reside in the Van Ness Avenue corridor study area, but would also affect drivers who commute or otherwise pass through the study area.
Although the traffic technical study did not include a socioeconomic profile of drivers within the corridor, because such data is not typically collected, an analysis was conducted to compare the locations of forecasted traffic-impacted intersections to the minority population areas. As illustrated in Figures 4.14-1 and 4.14-2, none of the 14 potentially significant 2035 LOS-impacted intersections are located within low-income Block Groups (either using the HHS poverty guideline or the 2000 U.S. Census poverty thresholds) and only 4 of the 14 significant 2035 LOS-impacted intersections are located within minority Block Groups in the study area. Given that only 4 of 14 LOS-impacted intersections would affect environmental justice populations in the corridor, by either traffic diversion through minority neighborhoods or affecting minority residents who may drive personal automobiles, it can be concluded that the project overall would not disproportionately impact environmental justice populations in the project area relative to traffic circulation.

Chapter 4: Affected Environment,Chapter 4: Affected Environment,Chapter 4: Affected Environment,Chapter 4: Affected Environment, Van Ness Avenue Bus Rapid Transit Project Environmental Consequences, andEnvironmental Consequences, andEnvironmental Consequences, andEnvironmental Consequences, and Draft Environmental Impact Statement/ Avoidance, MinimizaAvoidance, MinimizaAvoidance, MinimizaAvoidance, Minimization, and/or Mitigation Measurestion, and/or Mitigation Measurestion, and/or Mitigation Measurestion, and/or Mitigation Measures Environmental Impact Report
4.14-8 San Francisco County Transportation Authority October 2011
Figure 4.14-1: Low-Income Block Groups within the Van Ness Avenue Corridor

Van Ness Avenue Bus Rapid Transit Project Chapter 4: Affected Environment,Chapter 4: Affected Environment,Chapter 4: Affected Environment,Chapter 4: Affected Environment, Draft Environmental Impact Statement/ Environmental Consequences, andEnvironmental Consequences, andEnvironmental Consequences, andEnvironmental Consequences, and Environmental Impact Report Avoidance, MinimizatioAvoidance, MinimizatioAvoidance, MinimizatioAvoidance, Minimization, and/or Mitigation Measures n, and/or Mitigation Measures n, and/or Mitigation Measures n, and/or Mitigation Measures
San Francisco County Transportation Authority October 2011 4.14-9
Figure 4.14-2: Minority Block Groups within the Van Ness Avenue Corridor
Regular commuters through the project study area and residents who own or use private vehicles within the project study area would be affected more than those who occasionally pass through the corridor. As indicted in Table 4.2-5 of this EIS/EIR, nearly half of all residents within the project study area do not own private vehicles, compared with approximately 30 percent of residents within the City and County of San Francisco. Therefore, there is a larger proportion of transit-dependent people living within the project study area compared with the City and County, and thus a larger proportion of transit-dependent people would reap the benefits of improved transit service in the Van Ness Avenue corridor. Although the project would negatively affect automobile traffic circulation, it would also enhance transit access, thereby benefiting minority groups in the corridor who do not own cars.
K E Y F I N D I N G
There would be no disproportionate environmental impacts on minority or low income communities under any of the areas of analysis.

Chapter 4: Affected Environment,Chapter 4: Affected Environment,Chapter 4: Affected Environment,Chapter 4: Affected Environment, Van Ness Avenue Bus Rapid Transit Project Environmental Consequences, andEnvironmental Consequences, andEnvironmental Consequences, andEnvironmental Consequences, and Draft Environmental Impact Statement/ Avoidance, MinimizaAvoidance, MinimizaAvoidance, MinimizaAvoidance, Minimization, and/or Mitigation Measurestion, and/or Mitigation Measurestion, and/or Mitigation Measurestion, and/or Mitigation Measures Environmental Impact Report
4.14-10 San Francisco County Transportation Authority October 2011
4.14.4Avoidance, Minimization, and/or Mitigation Measures
As described in Section 4.16.9, construction phase impacts would be mitigated to control noise and fugitive dust. These mitigation measures would serve to ensure that there would be no disproportionate adverse effects on minority and low-income residents. Moreover, public outreach as part of the TMP described in Section 4.16 would include translation of all notices and announcements in Spanish and Chinese. Notices about construction would be mailed, as well as posted along the corridor, to maximize distribution of information to potentially affected people, including minority and low-income populations. No other avoidance, minimization, or mitigation measures are required to address environmental justice impacts. Based on the analysis of the project, the improvements proposed under any of the alternatives would not cause disproportionately high and adverse effects on any minority or low-income populations as per EO 12898 regarding environmental justice.
As described in other sections of this EIS/EIR, implementation of any of the build alternatives would include many benefits to low-income and minority populations, as well as the community at large, including a safer, more reliable and improved transportation system, improved mobility across the corridor, improved accessibility to jobs, and aesthetic improvements. These benefits are expected to be shared across demographic groups.

Van Ness Avenue Bus Rapid Transit Project Chapter 4: Affected Environment,Chapter 4: Affected Environment,Chapter 4: Affected Environment,Chapter 4: Affected Environment, Draft Environmental Impact Statement/ Environmental Consequences, andEnvironmental Consequences, andEnvironmental Consequences, andEnvironmental Consequences, and Environmental Impact Report Avoidance, Minimization, and/orAvoidance, Minimization, and/orAvoidance, Minimization, and/orAvoidance, Minimization, and/or Mitigation Measures Mitigation Measures Mitigation Measures Mitigation Measures
San Francisco County Transportation Authority October 2011 4.15-1
4.15 Construction Impacts Temporary construction impacts associated with each of the build alternatives for the proposed Van Ness Avenue BRT Project are described in detail in this section. Section 4.15.1 presents the construction scenario for each build alternative and contains the anticipated construction stages, schedule, and work hours. The construction scenario is based on the PCP developed for the project (Arup, 2010a). The subsequent sections present the anticipated impacts and mitigation resulting from the construction scenario, including impacts of each build alternative where applicable.
Construction Plan
Construction of the proposed build alternatives would occur within the existing street ROW. Construction would include the following major activities along the length of the proposed project: pavement rehabilitation as needed along the transitway, pavement resurfacing of Van Ness Avenue from curb to curb, reconstruction of curb and gutters (including curb bulbs), reconfiguration of the median, construction of BRT stations, replacement of the OCS support poles/streetlights system, replacement of traffic signal infrastructure, and associated utility relocations. BRT station construction would involve installing components such as platforms, canopies, ticket vending equipment, railings, lighting, signage, and station furniture. The manner in which construction would take place would be similar for all of the build alternatives. Following mobilization and staging activities, construction of all three build alternatives (including Design Option B) would involve the major construction activities described in the following bullets.
• Remove Existing Curb Bulbs and Undertake Utility Work. Some existing curb bulbs would be removed to allow use of the curbside parking lane for mixed-flow traffic during construction. Where necessary, construction areas would be fenced at this point for public safety. During this phase, existing utilities that would interfere with construction would be removed and relocated as well (e.g., storm drains, laterals). Sewer pipeline replacement or relocation would be required for Build Alternatives 3 and 4, as discussed in Chapter 4.6, Utilities. Relocation or reconstruction of existing utilities would take into account services required at the BRT stations, reconstructed traffic signals, and replacement of the OCS support pole/streetlight network.
• Build BRT Station/Platform Foundations. Proposed BRT station locations would be cleared of obstructions, including demolition activities as needed, and rough-graded. Once the station areas are cleared, platform canopy foundations would be constructed, with 2.5-foot-diameter shafts drilled to approximately 5 feet bgs. Utility feeds would be installed and concrete platforms subsequently poured and finished. The above-platform features would be installed in a subsequent phase.
• Construct Transitway. Roadway work to construct the transitway would begin after the station foundations are complete and existing curb bulbs removed. The transitway would be paved, and the median curb and gutter work would be completed, including drainage facilities.
• Conduct Intersection/Corner Work and OCS Support Pole/Streetlight Replacement. Pedestrian corner bulbs would be constructed and new traffic signals installed during this phase, together with other elements proposed under the SFgo Program. The OCS pole replacement, trench work, and wiring would be undertaken at the same time as the intersection/corner work.
• Finish BRT Stations/Platforms. BRT station and platform elements and passenger amenities would be installed, including shelters, benches/seats, lighting, changeable

Chapter 4: Affected Environment,Chapter 4: Affected Environment,Chapter 4: Affected Environment,Chapter 4: Affected Environment, Van Ness Avenue Bus Rapid Transit Project Environmental Consequences, andEnvironmental Consequences, andEnvironmental Consequences, andEnvironmental Consequences, and Draft Environmental Impact Statement/ Avoidance, Minimization, and/oAvoidance, Minimization, and/oAvoidance, Minimization, and/oAvoidance, Minimization, and/or Mitigation Measuresr Mitigation Measuresr Mitigation Measuresr Mitigation Measures Environmental Impact Report
4.15-2 San Francisco County Transportation Authority October 2011
message signs (NextMuni), fixed signage, railings, trash receptacles, and TVMs. Electrical and communications systems would be completed during this phase.
• Curb-to-Curb Pavement Rehabilitation. Curb-to-curb pavement rehabilitation under the Caltrans SHOPP project would be undertaken during this phase, as well as pavement resurfacing proposed under the BRT project.
• Additional Infrastructure Elements. Other key infrastructural elements would be completed, including replacement of the landscaping, as well as pavement striping and delineation. The corridor would require restriping of travel lanes and intersection approaches to allow alterations in street lane geometry and pedestrian crosswalks. New signage would be added along the corridor for transit users, motorists, pedestrians, and bicyclists. Once Phases 1 through 7 are complete, the BRT operation would be tested prior to being opened for service, including the interactive traffic signal system, communications equipment, and station facilities and equipment.
Approximate areas and depths of anticipated construction activities requiring earthwork are provided in Table 4.15-1. As shown in Table 4.15-1, traffic signal poles would require the deepest excavation, up to 16 feet bgs in an approximate 3-foot-diameter area. Additional deep excavations would include removal and replacement of the existing OCS support poles/streetlights, sewer replacement/relocation, and station canopy foundations. The remaining work would occur within 3 feet bgs.
Table 4.15-1: Anticipated Construction Areas and Excavation Depths
CONSTRUCTION ITEM AREA DEPTH1
OCS Support Pole Replacement
3-foot-diameter excavation area, within sidewalk; located throughout project limits.
11.0 ft
OCS Conduit Trench 2-foot-wide trench, within sidewalk; located throughout project limits.
3.0 ft
Sewer Pipeline Relocation
6-foot-wide trench, within street; replace or relocate within the BRT lanes under Build Alternative 3; relocate outside of platform areas proposed under Build Alternative 4.
11.5 ft
Traffic Signal Poles 3-foot-diameter excavation area, located at intersections throughout project limits.
16.0 ft
Controller Cabinets 2.5-foot by 4-foot excavation area, located within the sidewalk at intersections throughout project limits.
3.0 ft
Curb Bulbs & Sidewalk Reconstruction
Approximately 30 feet of full-width sidewalk disturbance area, located at intersections throughout project limits (varies by project alternative).
1.5 ft
Pavement Rehabilitation
Curb-to-curb rehabilitation or resurfacing under each project alternative.
0.7 ft
Pavement Reconstruction
Spot improvements, as needed, to travel lanes and parking lanes to remedy failed pavement areas.
1.5 ft
New Pavement 22-foot-wide area within median throughout project limits, under Build Alternative 3.
1.5 ft
Station Platform 8-foot- to 14-foot-wide by 150-foot-long area at platforms, platform locations vary by project alternative.
1.0 ft
Station Canopy Foundation
2.5-foot-diameter excavation area at platforms, platform locations vary by project alternative.
5.0 ft
1 Depth below ground surface (bgs).

Van Ness Avenue Bus Rapid Transit Project Chapter 4: Affected Environment,Chapter 4: Affected Environment,Chapter 4: Affected Environment,Chapter 4: Affected Environment, Draft Environmental Impact Statement/ Environmental Consequences, andEnvironmental Consequences, andEnvironmental Consequences, andEnvironmental Consequences, and Environmental Impact Report Avoidance, Minimization, and/orAvoidance, Minimization, and/orAvoidance, Minimization, and/orAvoidance, Minimization, and/or Mitigation Measures Mitigation Measures Mitigation Measures Mitigation Measures
San Francisco County Transportation Authority October 2011 4.15-3
Construction Approach
Principles of the project construction approach to be implemented under each build alternative include the following:
• Maintain two mixed-flow traffic lanes, which would also carry transit vehicles, in each direction (NB and SB) during peak hours, and as feasible during non-peak hours on Van Ness Avenue during project construction;
• Assure 10-foot widths for all traffic lanes at a minimum; • Place a physical barrier between traffic lanes and the construction zone (typically to be
done by using a concrete k-rail barrier); • Provide an appropriate buffer width between the construction zones and the adjacent
traffic lanes, inclusive of the k-rail concrete barrier; • Reduce speeds through construction work areas; • Remove curbside parking as needed during construction of stations or the transitway;
and • Adhere to requirements and standards identified in the MUTCD and the San Francisco
Blue Book, which govern temporary work zone installations.
All construction work would be conducted in compliance with obtained permits and regulations set forth by the City and Caltrans, in accordance with the SFMTA Regulations for Working in San Francisco Streets (Blue Book), the MUTCD, San Francisco Municipal Code (Noise Ordinance, Sections 2907 and 2908), and SFPUC and SFDPW BSM work orders. A Transportation Management Plan (TMP) outlining methods and strategies to minimize construction activity-related traffic delay and accidents would be developed during the 30% project design phase after the LPA is selected, and would be coordinated with other major projects in the area (e.g., Doyle Drive/Presidio Parkway and CPMC projects). The TMP is described in more detail in a subsequent section below.
Most of the work could be done during daylight hours, but some nighttime work would be required to permit temporary closures of the second traffic lane for tasks that could interfere with traffic or create safety hazards, subject to City approval with respect to noise ordinance requirements. Specific construction staging requirements would be defined during the final design phase, based on the LPA selected. It is anticipated that construction of this project would take between 14 and 19 months to complete, depending on the build alternative selected as the LPA.
Closure of one mixed-flow traffic lane in each direction and some on-street parking would be necessary for construction of all of the build alternatives. Temporary conversion of parking lanes to mixed-flow traffic lanes would be implemented in some cases to maintain two traffic lanes in each direction and minimize traffic impacts. These two mixed-traffic lanes would also carry transit vehicles during the construction period. In all cases, two lanes of mixed-flow traffic would generally remain open in each direction during construction, although temporary closures of an additional mixed-flow traffic lane would be required during construction tasks that could interfere with traffic or create safety hazards such as utility relocations, placement of concrete barriers, or large equipment. These closures would be planned for nighttime or off-peak traffic hours as feasible, and as in conformance with approved noise requirements. Partial closure of the sidewalk would be required under all of the build alternatives for curb bulb construction work, replacement of the OCS support poles/streetlights and associated duct trenching, signal installation, and reconfiguration of underground utilities.
Construction Implementation Staging
Construction of each build alternative would occur on multiple blocks of Van Ness Avenue throughout the corridor at the same time to reduce the overall construction schedule. Thus, multiple construction crews would be working at different locations along the corridor at

Chapter 4: Affected Environment,Chapter 4: Affected Environment,Chapter 4: Affected Environment,Chapter 4: Affected Environment, Van Ness Avenue Bus Rapid Transit Project Environmental Consequences, andEnvironmental Consequences, andEnvironmental Consequences, andEnvironmental Consequences, and Draft Environmental Impact Statement/ Avoidance, Minimization, and/oAvoidance, Minimization, and/oAvoidance, Minimization, and/oAvoidance, Minimization, and/or Mitigation Measuresr Mitigation Measuresr Mitigation Measuresr Mitigation Measures Environmental Impact Report
4.15-4 San Francisco County Transportation Authority October 2011
one time. To minimize disruption to the traveling public, construction activities that require closure of the on-street parking lane and/or a second traffic lane in one direction would be staged on approximate three-block segments. Construction on three-block segments would occur simultaneously in the northern and southern ends of the corridor to stagger associated parking and traffic circulation disruption, followed by construction in the central segment. The three build alternatives have different street staging plans due to the nature of construction required for each, as summarized in the following paragraphs.
Build Alternative 2 Construction Staging
Build Alternative 2 would be constructed on one side of Van Ness Avenue at a time to accommodate open lanes of mixed-flow traffic in both NB and SB directions at all times. One traffic lane would remain open alongside the construction area, and three traffic lanes would remain open on the opposite side of the street, along with on-street parking. Under construction of Build Alternative 2, a contraflow system would likely be used during daytime construction to maintain two open traffic lanes in each direction. In other words, the direction of one of the three traffic lanes on the side of the street opposite construction activity would be reversed. Left turns along Van Ness Avenue would be eliminated in either direction within the blocks under construction as part of the contraflow system. Appropriate signage and temporary traffic signals would be used to guide drivers, augmented by flagmen as needed. The contraflow system would not be needed during nighttime construction when traffic volumes are lower. If and when a contraflow system is not in place, only one traffic lane (serving a single direction) would remain open on the same side of the street on which construction is taking place. If a contraflow system is not implemented, construction work would generally be required to be scheduled at night when traffic volumes are lower. Sidewalk closures would not be required, although partial closure of the sidewalk would be required for curb bulb construction work, replacement of the OCS support poles/ streetlights and associated duct trenching, signal installation, construction of the BRT stations, and reconfiguration of underground utilities.51 Construction of Build Alternative 2 is anticipated to last approximately 19 months, as shown in Table 4.15-2; however, construction duration could be extended if a contraflow system is not implemented and construction activities requiring closure of a second lane in one direction would be restricted to nighttime.
Build Alternatives 3 and 4 (including Design Option B) Construction Staging
Construction staging for Build Alternatives 3 and 4 would be similar. Construction of the BRT stations, transitway, and medians would take place in an approximate 43-foot-wide area in the center of the roadway. Two traffic lanes would generally remain open on either side of the construction area. The parking lane on both sides of the street would be closed during the construction work to maintain two open traffic lanes in each direction. Sidewalk closures would not be required, although partial closure of the sidewalk would be required for curb bulb construction work, replacement of the OCS support poles/streetlights and associated duct trenching, signal installation, and reconfiguration of underground utilities. The intersection corner work would be primarily performed during the night to minimize impacts to pedestrian and vehicular traffic.
Short-term closures of an additional traffic lane may be required at times for construction tasks that could interfere with traffic or create safety hazards, reducing the number of open lanes in one direction to one. These closures would be planned for nighttime or off-peak traffic hours as feasible to avoid or reduce traffic impacts, subject to stipulated noise restrictions.
Under this construction implementation scenario, construction for Build Alternative 3 is anticipated to require 21 months, whereas construction for Build Alternative 4 is anticipated
51 Partial closure of the sidewalk would be required under all of the build alternatives for curb bulb construction work,
replacement of the OCS support poles/streetlights and associated duct trenching, signal installation, and reconfiguration of underground utilities.
Under construction of Build Alternative 2, a contraflow
system would likely be used during daytime construction to maintain two open traffic lanes
in each direction. In other words, the direction of one of the three traffic lanes on the side of the street opposite construction activity would be reversed.
The construction approach for each build alternative would
involve the closure of one northbound and
one southbound traffic lane.

Van Ness Avenue Bus Rapid Transit Project Chapter 4: Affected Environment,Chapter 4: Affected Environment,Chapter 4: Affected Environment,Chapter 4: Affected Environment, Draft Environmental Impact Statement/ Environmental Consequences, andEnvironmental Consequences, andEnvironmental Consequences, andEnvironmental Consequences, and Environmental Impact Report Avoidance, Minimization, and/orAvoidance, Minimization, and/orAvoidance, Minimization, and/orAvoidance, Minimization, and/or Mitigation Measures Mitigation Measures Mitigation Measures Mitigation Measures
San Francisco County Transportation Authority October 2011 4.15-5
to require 14 months. Replacement of the aging sewer pipeline beneath the entire transitway alignment (see Chapter 4.6, Utilities) would be coordinated with construction of Build Alternative 3, which accounts for the longer construction duration compared to Build Alternative 4. Under Build Alternative 4, it is anticipated that the sewer pipeline would require replacement only beneath stations and not the transitway, resulting in shorter construction duration. Table 4.15-2 summarizes the construction approach and schedule for each build alternative. Incorporation of Design Option B under Build Alternative 3 or 4 would not affect the construction schedule for these alternatives.
Table 4.15-2: Construction Approach and Schedule
BUILD ALTERNATIVE CONSTRUCTION APPROACH DURATION
Alternative 2 Construction along a single side of the street on multiple segments, simultaneously.
19 months*
Alternative 3 Construction along both sides of the street in multiple segments, simultaneously.**
17 months
Alternative 4 Construction along both sides of the street in multiple segments, simultaneously.
14 months
* Construction duration for Build Alternative 2 could be extended if a contraflow system is not implemented and construction activities requiring closure of a second lane in one direction would be restricted to nighttime.
**The duration for Build Alternative 3 construction would be longer than Build Alternative 4 due primarily to replacement of the sewer pipeline throughout the BRT alignment. Design Option B would not affect the construction schedule.
Construction Equipment and Laydown
The nature of the BRT construction work is conventional. A list of anticipated construction equipment includes:
• 5 cubic yards (cy) and under rubber-tired loaders • 3 cy and under rubber-tired combination backhoe/excavator/loader • Rubber-tired excavator • Street-legal dump truck-style hauling units • Motor graders similar to “CAT” 120 series sized machines • Small “CAT” D-4 size and under dozers • Steel drum rubber-tired self-propelled compaction equipment • Portable air compressor, light plant, and generators sets • Track-mounted concrete and/or asphalt laydown equipment • Rubber-tired lifting equipment • Rollers • Small pneumatically driven hand tools, such as pavement breakers, and electrically
operated tools, such as blowers, “skill” saw, drills • Barrier movement machine
These tools and equipment can be rapidly mobilized by street-legal truck and transport vehicles. The project does not require extensive foundations; therefore, vibrations are limited to normal construction impacts, with the most significant being the application of vibration from earth-compacting rollers.
Along the Van Ness Avenue corridor, several storage or “laydown” areas would be necessary for construction-related equipment, materials, vehicles, and goods to be safely stored overnight for easy access during construction activities. These areas would also be used as the contractor’s staging and work areas. The selection of such sites is important strategically to reduce inefficient out-of-direction movements and to minimize time lost from transporting materials and workers from a storage area to the work area. Site access, size, security, and surrounding land uses play a role in the selection of appropriate siting locations. Construction laydown areas would be determined following final design. In the

Chapter 4: Affected Environment,Chapter 4: Affected Environment,Chapter 4: Affected Environment,Chapter 4: Affected Environment, Van Ness Avenue Bus Rapid Transit Project Environmental Consequences, andEnvironmental Consequences, andEnvironmental Consequences, andEnvironmental Consequences, and Draft Environmental Impact Statement/ Avoidance, Minimization, and/oAvoidance, Minimization, and/oAvoidance, Minimization, and/oAvoidance, Minimization, and/or Mitigation Measuresr Mitigation Measuresr Mitigation Measuresr Mitigation Measures Environmental Impact Report
4.15-6 San Francisco County Transportation Authority October 2011
meantime, the following areas have been identified as potential equipment laydown areas to be confirmed when the project nears construction and is obtaining requirement construction permits:
• The State-owned parking lot located at South Van Ness Avenue and US 101 could be used as a primary base of operations, as well as for material and vehicle storage for the southern end of the corridor.
• A pedestrian plaza/traffic triangle located at South Van Ness Avenue and 12th Street could be used for staging on the southern portion of the corridor.
• The southwest corner of Van Ness Avenue and Filbert Street is an abandoned gas station, and the lot across from it at the northwest corner is vacant. These properties may be used for overnight material and equipment storage for northern part of corridor.
Transportation Management Plan for Construction
A TMP would be implemented leading up to and during project construction under any of the proposed build alternatives to minimize delay and inconvenience to the traveling public. The TMP will identify specific lane closures and transit operational changes; needed detours and other travel changes for drivers, transit, bicyclists, and pedestrians; and specific strategies that will be implemented to achieve those detours and other travel changes. The TMP for the project would be developed and refined during the next phase of design, after the LPA has been selected, and will be approved by both Caltrans and SFMTA.
The proposed construction approach for each build alternative includes roadway work that would require lane closures and/or detouring. The need for lane closures and short-term detour routes would be identified and included in the TMP, along with specific physical and communications measures that will be implemented to guide detours and other travel changes. The TMP would include, but not be limited to, some of the measures shown in Table 4.15-3. The TMP would include measures to ensure coordination with transit operators, emergency service providers, and neighborhood and special interest groups; consideration of construction strategies and contract incentives to ensure that construction is completed on schedule and that planned TMP measures are implemented; California Highway Patrol (CHP) and local law enforcement involvement; and development of contingency plans for unforeseen events or incidents. Various TMP elements, such as portable Changeable Message Signs and a CHP Construction Zone Enhanced Enforcement Program (COZEEP), may be utilized to alleviate and minimize delay to the traveling public.
The TMP would include a public information program and briefing for local public officials to disseminate project information and notices of upcoming traffic lane closures and detours. The public information program component of the TMP would be the plan for providing advance notice to motorists, public transportation providers, and emergency service providers with information on construction activities and durations, detours, and access issues during each stage of construction. The TMP would identify services to facilitate safe implementation of the construction project, such as increased law enforcement presence during critical construction operations, and it would include outreach to local businesses and residents with information related to the construction activities and durations, temporary closures, and detours.
Table 4.15-3: Elements of Transportation Management Plan
ELEMENT DESCRIPTION
Public Information Program
Brochures, mailers, Internet, e-mails, and briefings to local public officials, transit operators, and emergency services alerting travelers, residents, businesses, and interested parties of project construction, lane closures, detours, alternative routes, and changes in locations of bus stops.
Traveler Information
Changeable message signs and ground-mounted signs to alert traffic to potential delays and to direct traffic to alternative routes.

Van Ness Avenue Bus Rapid Transit Project Chapter 4: Affected Environment,Chapter 4: Affected Environment,Chapter 4: Affected Environment,Chapter 4: Affected Environment, Draft Environmental Impact Statement/ Environmental Consequences, andEnvironmental Consequences, andEnvironmental Consequences, andEnvironmental Consequences, and Environmental Impact Report Avoidance, Minimization, and/orAvoidance, Minimization, and/orAvoidance, Minimization, and/orAvoidance, Minimization, and/or Mitigation Measures Mitigation Measures Mitigation Measures Mitigation Measures
San Francisco County Transportation Authority October 2011 4.15-7
Table 4.15-3: Elements of Transportation Management Plan
ELEMENT DESCRIPTION
Strategies
Transit Passenger Information Strategies
Public outreach measures described above, including notices on transit vehicles, shelters, and Web sites that inform passengers of changes in bus stop locations and alternative parallel routes, and facilitate wayfinding.
Incident Management
CHP and local law enforcement involvement and development of contingency plans in the event of an incident, unexpected construction activities such as a late lane opening or need for a second lane closure in one direction; Implementation of a Construction Zone Enhanced Enforcement Program (COZEEP) with CHP and local traffic control officer presence through the construction period.
Construction Strategies
� Use of approved lane closure charts governing acceptable periods for all planned lane closure activities
� Maintain two, open traffic lanes in each direction during peak hours
� Limit closures of a second mixed-flow traffic lane for nighttime or off-peak traffic hours as feasible
� Implement truck traffic restrictions
� Utilize parking restrictions within the construction zones
� Implement reduced speed zones in construction areas
� Consider transit operations in identifying construction segments
� Locate bus stops outside construction zones
� Reduce/consolidate bus stops in consideration of traffic impacts as appropriate
� Maintain curbside bus stops where buses are able to pull out of through traffic
� Designate additional parking removal to facilitate bus weaves to/from the travel lane
� Avoid sidewalk closures
� Maintain one east-west and north-south crosswalk leg open at all times at all intersections
� Install sufficient barricading, signage, and temporary walkways as needed to minimize impacts to pedestrians and bicyclist
Alternative Route Strategies
Temporary signage and parking restrictions to direct drivers to alternative routes.
Contingency Planning
Strategies for handling traffic congestion in the event of unexpected construction activities such as a second lane closure in one direction.
4.15.1Traffic and Transportation/Pedestrian and Bicycle Facilities
Impacts to traffic, transit, parking and the nonmotorized (i.e., pedestrians and bicyclists) transportation environment that could result during project construction are discussed in the following subsections.
4.15.1.1ENVIRONMENTAL CONSEQUENCES
Traffic
Traffic circulation would be impacted whenever a mixed-flow traffic lane is closed for construction activities. As described in Section 4.15.1, the construction approach for each build alternative would involve closure of one SB and one NB traffic lane. Because the proposed BRT project would convert one NB and SB mixed-flow traffic lane to dedicated

Chapter 4: Affected Environment,Chapter 4: Affected Environment,Chapter 4: Affected Environment,Chapter 4: Affected Environment, Van Ness Avenue Bus Rapid Transit Project Environmental Consequences, andEnvironmental Consequences, andEnvironmental Consequences, andEnvironmental Consequences, and Draft Environmental Impact Statement/ Avoidance, Minimization, and/oAvoidance, Minimization, and/oAvoidance, Minimization, and/oAvoidance, Minimization, and/or Mitigation Measuresr Mitigation Measuresr Mitigation Measuresr Mitigation Measures Environmental Impact Report
4.15-8 San Francisco County Transportation Authority October 2011
transit use under each build alternative, the lane closures during construction would be similar to the completed, operational project. However, unlike the completed project, buses would continue to operate in the mixed traffic lanes during the construction period, and there would be slower overall operations due to reduced speed zones. Thus, the traffic impacts described in Chapter 3.3, Vehicular Traffic, would occur during project construction, along with some additional congestion and reduced travel speed due to construction activities. The impact of transit operations on the remaining traffic lanes would be minimized by: (1) moving bus stops out of the three-block construction segments to prevent buses stopping in the lane of traffic to load/unload; or (2) ensuring that stops were located where the bus could pull out of the traffic lane. In addition, localized congestion would occur in advance of each construction segment, where the current three lanes would merge to two, lane shifts occur, or where contraflow operations are in effect. Furthermore, traffic lanes in one direction could be reduced to one lane during short-term closures (e.g., for equipment transport or construction vehicles pulling in/out of mixed-flow traffic), or if a contraflow operation is not undertaken for construction of Build Alternative 2. This would result in additional congestion in the corridor due to the inability to move around right-turning vehicles waiting for crossing pedestrians to clear; however, this scenario would only occur during off-peak times and would not result in substantial congestion impacts.
In addition, other temporary traffic impacts would occur during construction due to short-term detours and as a result of signage stipulating reduced speeds through construction zones and encouraging drivers to use parallel streets to reduce traffic flow through construction zones. Thus, some drivers would divert to parallel routes, such as Franklin or Gough streets, during the project construction period. Short-term detours and closure of a second travel lane in one direction may be required for construction tasks that could interfere with traffic or create safety hazards, such as certain utility relocations, placement of concrete barriers or large equipment, and pavement conforms. These closures would be planned for nighttime or off-peak traffic hours as feasible to avoid or reduce traffic impacts.
In summary, reduced road capacity and posted operating speeds would produce localized traffic congestion and slow average travel speeds on Van Ness Avenue during project construction. The impacts would be minimized to the extent practicable through implementation of the TMP. In addition, impact minimization measures described in Chapter 3.3, Vehicular Traffic, and in Section 4.15.2.2 would lessen these impacts.
Transit
Transit operational impacts would be similar to those for the general traffic. Whenever the travel lanes are reduced or shifted, throughput capacity and operating speeds would be impacted, affecting not only private automobiles but also buses that travel the same corridor. Closures of the second travel lane in one direction would be infrequent and short-term during construction of the build alternatives and would only occur during off-peak or nighttime (see Section 4.15.1.1) whenever possible. Thus, service provided by Muni bus Routes 47 and 49, and GGT would be affected. Transit operational impacts would be greatest when the number of travel lanes in one direction is reduced to one because buses would be delayed by right-turning vehicles waiting for crossing pedestrians to clear.
During project construction, existing Muni bus stops would need to be closed or relocated on the three-block segments where construction is taking place. This would impact transit patrons who are accustomed to the existing Muni stops and may need to walk longer distances to board, alight, or transfer to other transit routes as a result of consolidated stops. The impact to transit patrons from consolidated stops would be similar to the bus stop consolidation impacts described in Section 3.4.3.1, Pedestrian Impacts. During construction, like operation, the average distance between bus stations would likely increase from approximately 700 feet to 1,170 feet under each of the build alternatives. As a result, the average maximum distance from a location halfway between two stops would increase from 350 feet to 590 feet. The increased distance between stops may be difficult to traverse for
K E Y F I N D I N G
Reduced road capacity and posted operating speeds could
produce localized traffic congestion and slow average travel speeds (for all vehicles, including Muni buses) on Van Ness Avenue during project
construction. The impact minimization measures
described in Section 4.15.1.2 would be implemented to reduce
these impacts during project construction.

Van Ness Avenue Bus Rapid Transit Project Chapter 4: Affected Environment,Chapter 4: Affected Environment,Chapter 4: Affected Environment,Chapter 4: Affected Environment, Draft Environmental Impact Statement/ Environmental Consequences, andEnvironmental Consequences, andEnvironmental Consequences, andEnvironmental Consequences, and Environmental Impact Report Avoidance, Minimization, and/orAvoidance, Minimization, and/orAvoidance, Minimization, and/orAvoidance, Minimization, and/or Mitigation Measures Mitigation Measures Mitigation Measures Mitigation Measures
San Francisco County Transportation Authority October 2011 4.15-9
some passengers, and some passengers may initially be confused about where to locate bus stops during project construction. The stop spacing during construction, as well as with the BRT project, would remain within SFMTA standards for rapid stop spacing. The TMP described above would include a wayfinding and transit passenger information campaign to assist transit passengers in identifying stop locations during construction, as well as assist transit passengers in understanding the new with-project stop locations.
In summary, reduced road capacity and posted operating speeds would produce localized traffic congestion and slow average travel speeds of buses on Van Ness Avenue during project construction. Impact minimization measures described in Chapter 3.3, Vehicular Traffic, and in Section 4.15.2.2 would reduce these impacts. In addition, closure and consolidation of Muni stops where construction is taking place would impact transit service, potentially resulting in adverse impacts to transit patrons who could be confused by these changes and need to walk farther distances. Impact minimization measures described in Section 4.15.2.2 would reduce, and in some cases avoid, such impacts.
The reduction in capacity by taking travel lanes and reducing posted speeds during construction would ultimately be offset by improved transit speeds and reliability provided by the BRT.
Parking
During construction of each build alternative, temporary conversion of parking lanes to mixed-flow traffic lanes would be implemented, resulting in removal of on-street parking on both sides of Van Ness Avenue where construction is taking place. Additional curbside parking may be needed in some instances for construction equipment staging. Construction activities requiring closure of curbside parking would be staged on approximately three-block segments. Thus, as a worst-case scenario, parking would be temporarily removed from all three blocks at one time. The amount of curbside parking on Van Ness Avenue varies and averages approximately eight spaces per block. Thus, a three-block segment could average 24 spaces, which could all be temporarily unavailable at the same time. Signage would be provided to indicate parking restrictions. As part of the TMP, a public information program would be implemented to provide advance notice of construction activities and parking restrictions to local businesses and residents. Impacts from temporary removal of colored parking spaces during project construction is discussed in Section 4.15.2, Community Impacts.
Parking for construction workers would be addressed in the TMP.
Nonmotorized
For all of the build alternatives, pedestrian traffic would be disrupted by construction work noise, vibration, dust, and air emissions of construction vehicles. Construction of Build Alternative 2 would require temporary closure of part of the sidewalk, or narrowing of the sidewalk area, to accommodate construction of BRT stations. Partial closure of the sidewalk would be required under all of the build alternatives for curb bulb construction work, replacement of the OCS support poles/streetlights and associated duct trenching, signal installation, and reconfiguration of underground utilities. The intersection corner work would be primarily performed during the night to minimize impacts to pedestrian and vehicular traffic.
Pedestrian and bicycling crossing movements would also be impacted under all of the build alternatives when the median and BRT stations are under construction. For safety reasons, the intersection leg located adjacent to a median or BRT station under construction may be temporarily closed. One side of an intersection would be kept open for crossing at any given time; however, this would still burden elderly and disabled pedestrians who would have to walk farther distances to use the open crosswalk leg. In cases where parking is temporarily removed, pedestrians would no longer have a buffer of parked cars between the sidewalk
K E Y F I N D I N G
During construction of each build alternative, temporary conversion of parking lanes to mixed-flow traffic lanes would be implemented, resulting in removal of on-street parking on both sides of Van Ness Avenue where construction is taking place. The impact minimization measures described in Section 4.15.1.2 would be implemented to reduce these impacts during project construction.
K E Y F I N D I N G
For all of the build alternatives, pedestrian traffic could be disrupted by construction work noise, vibration, dust, and air emissions of construction vehicles. The impact minimization measures described in Section 4.15.1.2 would be implemented to reduce these impacts during project construction.

Chapter 4: Affected Environment,Chapter 4: Affected Environment,Chapter 4: Affected Environment,Chapter 4: Affected Environment, Van Ness Avenue Bus Rapid Transit Project Environmental Consequences, andEnvironmental Consequences, andEnvironmental Consequences, andEnvironmental Consequences, and Draft Environmental Impact Statement/ Avoidance, Minimization, and/oAvoidance, Minimization, and/oAvoidance, Minimization, and/oAvoidance, Minimization, and/or Mitigation Measuresr Mitigation Measuresr Mitigation Measuresr Mitigation Measures Environmental Impact Report
4.15-10 San Francisco County Transportation Authority October 2011
and travel lanes; however, other streetscape features would remain, and the sidewalks of Van Ness Avenue are wide, which alleviate this impact.
Impact minimization measures described in Section 4.15.2.2 would reduce identified impacts to pedestrians and cyclists during project construction.
4.15.1.2AVOIDANCE, MINIMIZATION, AND/OR MITIGATION MEASURES
All construction activity for the Van Ness Avenue BRT Project will be carried out in compliance and accordance with the California MUTCD and applicable regulations of the SFPUC and SFDPW BSM, and SFMTA Regulations for Working in San Francisco Streets Blue Book. The following additional measures will be implemented during project construction to minimize temporary impacts to traffic, transit, parking, and the nonmotorized (i.e., pedestrians and bicyclists) transportation environment:
M-TR-C1. Temporary conversion of parking lanes to mixed-flow traffic lanes will be implemented where feasible to generally maintain two open traffic lanes in each direction and minimize traffic impacts.
M-TR-C2. A contraflow system, including elimination of left turns in either direction along Van Ness Avenue, will be implemented during daytime construction under Build Alternative 2 to enable two lanes of mixed-flow traffic to generally remain open in each direction during construction and minimize traffic congestion on Van Ness Avenue. Appropriate signage and temporary traffic signals will be used to guide drivers, augmented by flagmen as needed.
M-TR-C3. Plan required closures of a second mixed-flow traffic lane and detours for nighttime or off-peak traffic hours as feasible, and as in conformance with approved noise requirements.
M-TR-C4. Maintain one east-west and north-south crosswalk leg open at all times at all intersections.
M-TR-C5. Install sufficient barricading, signage, and temporary walkways as needed to minimize impacts to pedestrians and bicyclist.
M-TR-C6. SFMTA will coordinate with GGT as part of the TMP to plan temporarily relocated transit stops as needed and minimize impacts to GGT service.
M-TR-C7. Implement a TMP to minimize delay and inconvenience to the traveling public, including a public information program and wayfinding to provide local businesses and residents with information related to the construction activities and durations, temporary traffic closures and detours, parking restrictions, and bus stop relocations.
4.15.2Community Impacts
This section assesses community impacts that could result from project construction and specifies avoidance, minimization, and/or mitigation measures to address these construction-related impacts.
4.15.2.1ENVIRONMENTAL CONSEQUENCES
As discussed in Section 4.2.4.2, non-white, non-Hispanic residents comprise 46 percent of the study area population; this is lower than the citywide percentage. Some adverse effects to area residents, businesses, and visitors could occur on a temporary basis along the street segments under construction. Construction of each of the build alternatives would result in impacts to traffic, circulation, parking, transit service, and the pedestrian and bicycle environment in the Van Ness Avenue corridor, as described above in Section 4.15.1. Impact minimization measures described in Section 4.15.2.2 would be implemented to reduce these impacts during project construction.
K E Y F I N D I N G
Temporary removal of colored parking spaces could adversely impact operations of adjacent land uses during construction.
The impact minimization measures described in Section 4.14.2.2 would be implemented to reduce these impacts during
project construction.

Van Ness Avenue Bus Rapid Transit Project Chapter 4: Affected Environment,Chapter 4: Affected Environment,Chapter 4: Affected Environment,Chapter 4: Affected Environment, Draft Environmental Impact Statement/ Environmental Consequences, andEnvironmental Consequences, andEnvironmental Consequences, andEnvironmental Consequences, and Environmental Impact Report Avoidance, Minimization, and/orAvoidance, Minimization, and/orAvoidance, Minimization, and/orAvoidance, Minimization, and/or Mitigation Measures Mitigation Measures Mitigation Measures Mitigation Measures
San Francisco County Transportation Authority October 2011 4.15-11
Temporary conversion of parking lanes to mixed-flow traffic lanes would be implemented during project construction, resulting in removal of on-street parking on both sides of Van Ness Avenue on the blocks where construction is taking place. This would also result in the temporary removal of colored parking spaces, including truck and passenger loading spaces. Temporary removal of colored parking spaces could adversely impact operations of adjacent land uses during construction. Similarly, partial closures of sidewalk areas during construction may result in short-term disruption to loading operations of adjacent land uses. It is not anticipated that access to businesses and other properties along Van Ness Avenue would be disrupted, although parking constraints and increased traffic would likely cause temporary inconvenience to businesses and residents.
Potential impacts from temporary disruption in utility services could result during replacement or relocation of utilities along Van Ness Avenue. Impacts from temporary disruption in utility service and associated avoidance measures are described in Section 4.15.5. Light and glare impacts to residential properties that could result from nighttime construction are addressed in Section 4.15.3.
The affected community would also be subject to noise, dust, vibration, and air emissions from construction equipment during project construction. Potential noise and vibration impacts during construction and associated mitigation measures are discussed in Section 4.15.10. Potential air quality impacts during construction and associated mitigation measures are discussed in Section 4.15.9. These impacts associated with typical construction projects can discourage or restrict pedestrian activity along the blocks under construction and reduce foot traffic, which could impact local businesses.
Land use characteristics differ along the length of the project corridor and may generally be described as civic and municipal uses in the south (Mission Street – Golden Gate Avenue), commercial/retail in the midsection (Golden Gate Avenue – Broadway Street), and primarily residential uses in the north (Broadway Street – North Point Street). To reduce construction-related impacts to the community, the unique characteristics of each area will be taken into consideration in construction planning and scheduling. Construction planning would minimize nighttime construction in residential areas and minimize daytime construction affecting retail and commercial areas. Construction scheduling and planning in the Civic Center area would take into consideration major civic and performing arts events. These considerations would be undertaken as part of the public information procedures outlined in the TMP.
4.15.2.2AVOIDANCE, MINIMIZATION, AND/OR MITIGATION MEASURES
Construction phase impacts will be mitigated with special provisions to control noise and fugitive dust, discussed in Sections 4.15.10.2 and 4.15.9.2, respectively. These measures will serve to ensure that there will be no adverse effects on the community, including minority and low-income residents. Moreover, the following mitigation measures will be implemented to reduce construction-related impacts to local businesses and residents:
M-CI-C1. A TMP that includes traffic rerouting, a detour plan, and public information procedures will be developed during the design phase with participation from local agencies, other major project proponents in the area (e.g., CPMC Cathedral Hill, Hayes Two-Way Conversion, and the Geary Corridor BRT projects), local communities, business associations, and affected drivers. Early and well-publicized announcements and other public information measures will be implemented prior to and during construction to minimize confusion, inconvenience, and traffic congestion.
M-CI-C2. As part of the TMP, construction planning will minimize nighttime construction in residential areas and minimize daytime construction impacts on retail and commercial areas.
M-CI-C3. As part of the TMP, construction scheduling and planning in the Civic Center area will take into consideration major civic and performing arts events.

Chapter 4: Affected Environment,Chapter 4: Affected Environment,Chapter 4: Affected Environment,Chapter 4: Affected Environment, Van Ness Avenue Bus Rapid Transit Project Environmental Consequences, andEnvironmental Consequences, andEnvironmental Consequences, andEnvironmental Consequences, and Draft Environmental Impact Statement/ Avoidance, Minimization, and/oAvoidance, Minimization, and/oAvoidance, Minimization, and/oAvoidance, Minimization, and/or Mitigation Measuresr Mitigation Measuresr Mitigation Measuresr Mitigation Measures Environmental Impact Report
4.15-12 San Francisco County Transportation Authority October 2011
M-CI-C4. As part of the TMP public information program, SFMTA will coordinate with adjacent properties along Van Ness Avenue to determine the need for colored parking spaces and work to identify locations for replacement spaces or plan construction activities to minimize impacts from the loss of these spaces.
M-CI-C5. As part of the TMP public information program, SFMTA will coordinate with adjacent properties along Van Ness Avenue to ensure that pedestrian access to these properties is maintained at all times.
4.15.3Visual/Aesthetics
This section presents construction phase impacts related to visual resources and aesthetics, and specifies avoidance, minimization, and/or mitigation measures required to address these construction impacts.
4.15.3.1ENVIRONMENTAL CONSEQUENCES
Construction of the proposed project would occur within and adjacent to the existing street ROW. Project construction activities would involve the use of a variety of equipment, stockpiling of materials, and other visual signs of construction.
Various TMP elements, such as portable Changeable Message Signs, detours, and other signage would be used during construction. While evidence of construction activity would be noticeable to area residents and viewer groups, such visual disruptions would be short term and are a common feature of the urban environment. Mitigation described in Section 4.15.4.2 would reduce aesthetic impacts from construction activities.
Some construction would be accomplished at night. Project specifications would require the project contractor to direct artificial lighting onto the worksite while working in residential areas at night to minimize “spill-over” light or glare effects. This would be a temporary degradation of the visual environment that would be restored at the completion of construction. Construction best practices described in Section 4.15.4.2 would minimize nighttime light and glare impacts.
4.15.3.2AVOIDANCE, MINIMIZATION, AND/OR MITIGATION MEASURES
Implementation of the following construction best practices during project construction are considered improvement measures that would minimize aesthetic/visual resource impacts:
I-AE-C1. During project construction, SFMTA will require the contractor to maintain the site in an orderly manner, removing trash and waste, and securing equipment at the close of each day’s operation.
I-AE-C2. To reduce glare and light used during nighttime construction activities, SFMTA will require the contractor to direct lighting onto the immediate area under construction only and to avoid shining lights toward residences, nighttime commercial properties, and traffic lanes.
4.15.4Cultural Resources
4.15.4.1ENVIRONMENTAL CONSEQUENCES
Though no prehistoric archaeological sites have been recorded within 0.25-mile of the project’s APE, construction of any of the Van Ness BRT build alternatives would involve some ground disturbance with the potential to unearth prehistoric sites that are heretofore unknown. As detailed in Section 4.5, Cultural Resources, of this EIS/EIR, the Archaeological and Native American Cultural Resources Sensitivity Assessment (ANACRSA) for the project described a few general locations that may be sensitive for the presence of prehistoric
Project specifications would require the project contractor to direct artificial lighting onto the
worksite while working in residential areas at night to
minimize “spill-over” light or glare effects.

Van Ness Avenue Bus Rapid Transit Project Chapter 4: Affected Environment,Chapter 4: Affected Environment,Chapter 4: Affected Environment,Chapter 4: Affected Environment, Draft Environmental Impact Statement/ Environmental Consequences, andEnvironmental Consequences, andEnvironmental Consequences, andEnvironmental Consequences, and Environmental Impact Report Avoidance, Minimization, and/orAvoidance, Minimization, and/orAvoidance, Minimization, and/orAvoidance, Minimization, and/or Mitigation Measures Mitigation Measures Mitigation Measures Mitigation Measures
San Francisco County Transportation Authority October 2011 4.15-13
archaeological resources, particularly in areas close to former freshwater courses and coastal bay resources, primarily in or adjacent to the northernmost areas of the APE.
Likewise, while construction of any of the build alternatives would not affect known historical archaeological resources, the ANACRSA identified several locations where there may exist a possibility of construction activities uncovering significant historic-era features or deposits. Despite the potential for some buried archaeological resources to be located within the project APE, it is not certain that such resources would be affected or where specifically this may occur. Engineering and other logistical concerns of a modern urban environment constrain preconstruction archaeological testing.
There are no plans that construction would involve directly or physically altering, demolishing, or relocating any character-defining features of any of the historic buildings or Civic Center Historic District. The Draft Noise and Vibration Study for this project did not identify any potentially significant adverse effects to historic properties during construction of the Van Ness Avenue BRT Project. Adverse visual effects during construction would be of temporary duration, and none would be considered a substantial adverse effect to the setting, feeling, or association of the historically significant properties in the APE.
4.15.4.2AVOIDANCE, MINIMIZATION, AND/OR MITIGATION MEASURES
Potential impacts to archaeological resources resulting from construction activities under the No Build Alternative and build alternatives will be mitigated by implementing the following measures during or prior to project construction:
M-CP-1. More-detailed archival investigations for those areas deemed sensitive for the presence of prehistoric and historic archaeological sites will be conducted as project design advances are made following selection of a preferred alternative. Depending on the results of that research, in concert with the City’s environmental officer, project avoidance areas or, more likely, areas requiring presence of an archaeological monitor to be present during construction will be identified.
M-CP-2. If buried cultural resources are encountered during construction activities, construction will be halted and the discovery area isolated and secured until a qualified archaeologist assesses the nature and significance of the find.
M-CP-3. If human remains are discovered, the County coroner will be notified as soon as is reasonably possible (CEQA Section 15064.5). There will be no further site disturbance where the remains were found. If the remains were determined to be Native American, then the coroner is responsible for contacting the California NAHC within 24 hours. The NAHC, pursuant to PRC Section 5097.98 will notify those persons it believes to be the MLD. Treatment of the remains will be dependent on the views of the MLD.
4.15.5Utilities/Service Systems
This section presents construction phase impacts related to utilities and specifies any avoidance, minimization, and/or mitigation measures required to address construction impacts.
4.15.5.1ENVIRONMENTAL CONSEQUENCES
The proposed project could result in adverse impacts to utilities during construction if it would result in the need for expanded or additional facilities by a utility provider, or if a utility provider determines that it has inadequate capacity to serve a project’s projected demand in addition to existing demand. Project demolition and construction waste would be accommodated by existing offsite landfills and recycling centers, and it would not affect landfill capacity. Construction activities would be accommodated by existing water and power facilities. Wastewater generation during construction would not exceed wastewater treatment requirements of the San Francisco RWQCB and would comply with batch
K E Y F I N D I N G
Adverse visual effects during construction would be of temporary duration, and none would be considered a substantial adverse effect to the setting, feeling, or association of the historically significant properties in the APE.

Chapter 4: Affected Environment,Chapter 4: Affected Environment,Chapter 4: Affected Environment,Chapter 4: Affected Environment, Van Ness Avenue Bus Rapid Transit Project Environmental Consequences, andEnvironmental Consequences, andEnvironmental Consequences, andEnvironmental Consequences, and Draft Environmental Impact Statement/ Avoidance, Minimization, and/oAvoidance, Minimization, and/oAvoidance, Minimization, and/oAvoidance, Minimization, and/or Mitigation Measuresr Mitigation Measuresr Mitigation Measuresr Mitigation Measures Environmental Impact Report
4.15-14 San Francisco County Transportation Authority October 2011
discharge permits from SFPUC, as described in Section 4.15.8.2, Hydrology and Water Quality.
The proposed project would have adverse impacts to utilities during project construction if it would damage facilities, or interfere with utility service to customers and public facilities. As discussed in Section 4.6.4, coordination with all utility providers and proponents of related projects in the project corridor would be initiated during the preliminary engineering phase of the project and carried through final design and construction phases. Coordination and planning efforts would be facilitated through the CULCOP, Street Construction Coordination Center, and Caltrans, with the focus on identifying potential conflicts and formulating strategies to avoid them, including planning utility relocations/reroutes, and other measures to avoid utility service interruptions. For example, it is known at this time that construction of the center lane transitway under Build Alternatives 3 and 4 (with or without incorporation of Design Option B) has the potential to damage portions of the existing sewer main pipeline that are in poor condition. The project team, together with SFDPW and SFPUC, has already begun to address this issue and ensure that this pipeline would not be damaged due to project construction (see Section 4.6, Utilities). Similarly, coordination with SFDPW, Caltrans, and utility providers would avoid or minimize utility service interruption by staging construction activities and taking appropriate precautions for the protection of any unforeseen utility lines discovered during project construction. This planning and coordination process would avoid and minimize impacts to utilities during construction.
4.15.5.2AVOIDANCE, MINIMIZATION, AND/OR MITIGATION MEASURES
Avoidance, minimization, and mitigation measures discussed in Section 4.6.4 will alleviate impacts to utilities during construction. In addition, the following typical standard specifications outline the procedures for locating, protecting, and relocating existing underground utilities and surface improvements. These specifications are included in the Van Ness Avenue BRT PCP (Arup, 2010a) and will be implemented to help ensure the proper operation of work to minimize the potential for damage to utilities, injury to construction workers, and proper completion of construction work.
I-UT-C1. Construction work involving utilities will be conducted in accordance with contract specifications, including the following requirements:
• Obtain authorization from utility provider before initiating work; • Contact Underground Service Alert in advance of excavation work to mark-out
underground utilities; • Conduct investigations, including exploratory borings if needed, to confirm the location
and type of underground utilities and service connections; • Prepare a support plan for each utility crossing detailing the intended support method; • Take appropriate precautions for the protection of unforeseen utility lines encountered
during construction; and • Restore or replace each utility as close as planned and work with providers to ensure its
location is as good or better than found prior to removal.
4.15.6Geology/Soils/Seismic/Topography
This section presents construction phase impacts related to geologic and seismic hazards, and specifies avoidance, minimization, and/or mitigation measures required to address these construction impacts.
4.15.6.1ENVIRONMENTAL CONSEQUENCES
As described in Section 4.7.1, the corridor may be susceptible to the following geologic and seismic hazards: very strong ground shaking, liquefaction, and settlement. Design of project features under each build alternative (including Design Option B) would address liquefaction
Coordination and planning efforts would be facilitated through the CULCOP, Street Construction Coordination
Center, and Caltrans, with thefocus on identifying potential
conflicts and formulating strategies to avoid them, including planning utility
relocations/reroutes, and other measures to avoid utility service interruptions.
Van Ness Avenue Bus Rapid Transit Project Chapter 4: Affected Environment,Chapter 4: Affected Environment,Chapter 4: Affected Environment,Chapter 4: Affected Environment, Draft Environmental Impact Statement/ Environmental Consequences, andEnvironmental Consequences, andEnvironmental Consequences, andEnvironmental Consequences, and Environmental Impact Report Avoidance, Minimization, and/orAvoidance, Minimization, and/orAvoidance, Minimization, and/orAvoidance, Minimization, and/or Mitigation Measures Mitigation Measures Mitigation Measures Mitigation Measures
San Francisco County Transportation Authority October 2011 4.15-15
and settlement impacts. In the event of an earthquake during project construction, very strong ground shaking could result in slope instability at excavated areas. As a result, mitigation for each build alternative to avoid potential slope instability impacts during project construction is specified in Section 4.15.6.2.
4.15.6.2AVOIDANCE, MINIMIZATION, AND/OR MITIGATION MEASURES
M-GE-C1. All cuts deeper than 5 feet must be shored (AGS, 2009a). Shoring design of open excavations must be completed in consideration of the surcharge load from nearby structures, including an examination of the potential for lateral movement of the excavation walls as a result. The following construction BMPs related to shoring and slope stability will be implemented:
• Heavy construction equipment, building materials, excavated soil, and vehicle traffic shall be kept away from the edge of excavations, generally a distance equal to or greater than the depth of the excavation.
• During wet weather, storm runoff shall be prevented from entering the excavation. Excavation sidewalls can be covered with plastic sheeting, and berms can be placed around the perimeter of the excavated areas.
• Sidewalks, slabs, pavement, and utilities adjacent to proposed excavations shall be adequately supported during construction.
4.15.7Hazardous Materials
4.15.7.1ENVIRONMENTAL CONSEQUENCES
There is a potential to encounter pre-existing hazardous materials during project construction proposed under each build alternative (including Design Option B). Construction activities that would occur under the No Build Alternative could also encounter pre-existing hazardous materials, as described in Section 4.8.2.
Known potential contaminants include petroleum hydrocarbons (from gasoline and diesel fuels), ADL in median soils, and LBP in streetscape structures. There is also the potential to encounter unknown sources of contamination that are sometimes found in areas of undocumented fill, which is a risk common to construction projects. Hazardous materials impacts would occur if construction workers or members of the public were exposed to hazardous materials during excavation, grading, and related construction earthwork activities; therefore, mitigation measures for each build alternative to be implemented during project construction are described below.
4.15.7.2AVOIDANCE, MINIMIZATION, AND/OR MITIGATION MEASURES
The following mitigation measures applicable to each build alternative will be implemented to avoid and minimize hazardous materials exposure during project construction:
M-HZ-C1. A Worker Site Health and Safety Plan will be created with the following components, in response to potential RECs identified in the Phase II review or other follow-up investigations, and results from preconstruction LBP and ADL surveys specified in Sections 4.8.3 and 4.8.4:
• A safety and health risk/hazards analysis for each site task and operation in the work plan;
• Employee training assignments; • Personal protective equipment requirements; • Medical surveillance requirements; • Air monitoring, environmental sampling techniques, and instrumentation; • Safe storage and disposal measures for encountered contaminated soil, groundwater, or
debris, including temporary storage locations, labeling, and containment procedures. • Emergency response plan; and
D E F I N I T I O N
SHORED: In the context of excavation, this usually involves creating wooden buttresses to support the soil walls formed through digging.
Hazardous materials impacts would occur if construction workers or members of the public were exposed to hazardous materials during excavation, grading, and related construction earthwork activities; therefore, mitigation measures for each build alternative are proposed for project construction.

Chapter 4: Affected Environment,Chapter 4: Affected Environment,Chapter 4: Affected Environment,Chapter 4: Affected Environment, Van Ness Avenue Bus Rapid Transit Project Environmental Consequences, andEnvironmental Consequences, andEnvironmental Consequences, andEnvironmental Consequences, and Draft Environmental Impact Statement/ Avoidance, Minimization, and/oAvoidance, Minimization, and/oAvoidance, Minimization, and/oAvoidance, Minimization, and/or Mitigation Measuresr Mitigation Measuresr Mitigation Measuresr Mitigation Measures Environmental Impact Report
4.15-16 San Francisco County Transportation Authority October 2011
• Spill containment program.
M-HZ-C2. Procedures will be included in the project SWPPP to contain any possible contamination, including protection of storm drains, and to prevent any contaminated runoff or leakage either into or onto exposed ground surfaces, as specified in Section 4.15.8, Hydrology and Water Quality Construction Impacts.
M-HZ-C3. Necessary public health and safety measures will be implemented during construction.
4.15.8Hydrology and Water Quality
As described in Section 4.9.1, the RWQCBs implement and enforce the NPDES program to protect water quality, as specified under the CWA. The control of pollutant discharges is established through NPDES permits issued by the RWQCBs, which contain effluent limitations and standards. The NPDES Permit requires that all owners of land within the state with construction activities resulting in more than 1-acre of soil disturbance (e.g., clearing, grubbing, grading, trenching, stockpile, utility relocation, temporary haul roads), comply with the California SWRCB General Construction Permit (General Permit). An NOI to construct must be filed with the RWQCB at least 30 days prior to any soil-disturbing activities. The purpose of the permit is to ensure that the landowners: (1) eliminate or reduce non-stormwater discharges to storm drains and receiving waters; (2) develop and implement an SWPPP; (3) inspect the water pollution controls specified in the SWPPP; and (4) monitor stormwater runoff from construction sites to ensure that the BMPs specified in the SWPPP are effective.
The SWPPP includes a site map(s) showing the construction site perimeter, existing and proposed buildings, lots, roadways, stormwater collection and discharge points, general topography before and after construction, and drainage patterns across the site. The SWPPP must also specify BMPs that will be used to protect stormwater runoff, as well as the placement of those BMPs; a visual monitoring program; a chemical monitoring program for nonvisible pollutants to be implemented if there is a failure of BMPs; and a sediment monitoring plan if the site discharges directly to a water body listed as an impaired water body for sediment. Measures for erosion and sediment control, construction waste handling and disposal, and post-construction erosion and sediment control must also be addressed, along with methods to eliminate or reduce non-stormwater discharges to receiving waters.
NPDES and construction wastewater discharge permits are issued from SFPUC. SFPUC has developed guidelines for water pollution prevention referred to as “Keep it on Site”52 (SFPUC, 2009), which provides information for construction within the city and provides important regulatory agency contact information for the contractor. It also describes requirements for SWPPP development and implementation to ensure NPDES compliance with the General Permit.
4.15.8.1ENVIRONMENTAL CONSEQUENCES
During construction of any of the build alternatives, earthwork activities would result in exposure of soil to storm runoff, potentially causing sediment to be carried offsite. In general, construction would include shallow ground disturbance, earthwork grading, and soil excavation within the existing roadway median and sidewalk areas. The DSA would be approximately 2.9 acres for Build Alternative 2; 8.1 acres for Build Alternative 3; 8.4 acres for Build Alternative 3 with Design Option B; 3.8 acres for Build Alternative 4; and 3.8 acres for Build Alternative 4 with Design Option B. The impacts related to such construction would be minimal because the proposed project would require nominal earthwork, and the area of soil to be disturbed would be limited.
The deepest excavation work would be the installation of OCS support poles/streetlights, involving excavation of up to 16 feet bgs in an area approximately 3 feet in diameter. Other
52 Visit www.sfwater.org and type “Keep it on Site” in the search box.
During construction, earthwork activities can result in exposure
of soil to storm runoff. If not properly managed, the runoff could increase the amount of
sediment in the combined sewer system. The minimization and
avoidance strategies recommended in Section 4.15.8.2 would reduce the potential for
this impact to occur.
R E S O U R C E
For more information on “Keep It on Site”, visit
www.sfwater.org and type “Keep it on Site” in the
search box.

Van Ness Avenue Bus Rapid Transit Project Chapter 4: Affected Environment,Chapter 4: Affected Environment,Chapter 4: Affected Environment,Chapter 4: Affected Environment, Draft Environmental Impact Statement/ Environmental Consequences, andEnvironmental Consequences, andEnvironmental Consequences, andEnvironmental Consequences, and Environmental Impact Report Avoidance, Minimization, and/orAvoidance, Minimization, and/orAvoidance, Minimization, and/orAvoidance, Minimization, and/or Mitigation Measures Mitigation Measures Mitigation Measures Mitigation Measures
San Francisco County Transportation Authority October 2011 4.15-17
deep excavation would include removal and replacement of the existing OCS support poles/streetlights, which would involve excavation of up to 13 feet bgs in an area approximately 3 feet in diameter and replacement/relocation of a sewer line located 11 feet bgs. Most excavation and other soil disturbance during project construction would occur within 5 feet bgs and would involve construction of station platforms, controller cabinets, streetlights, and signage, in addition to utility relocation and pavement work. Dewatering is not anticipated to be necessary for this project.
Offsite oil stockpiles and onsite excavations areas would be exposed to runoff and, if not managed properly, the runoff could increase the amount of sediment in the CSS. The accumulation of sediment could result in blockage of flows, potentially resulting in increased localized ponding or flooding.
In addition, the potential for chemical releases is common at construction sites. Once spilled or released, substances such as fuels, oils, paints, and solvents could be picked up by storm runoff and released into groundwater or carried into the combined sewer system. Section 4.15.8.2 describes avoidance and mitigation measures intended to reduce the release of pollutants and sediment into the CSS and prevent violation of water quality standards and degradation of groundwater resources. These mitigation measures would be required under each proposed build alternative (including Design Option B), and under the No Build Alternative. The No Build Alternative would involve substantially less earthwork comparatively, as discussed in Section 4.15.1.
4.15.8.2AVOIDANCE, MINIMIZATION, AND/OR MITIGATION MEASURES
All of the build alternatives have potential environmental consequences due to runoff during the construction phase. The following measures are required:
Construction-related stormwater impacts can be mitigated throughout the project site through: (1) use of stormwater BMPs, including inlet protection devices, temporary silt fencing, soil stabilization measures, street sweeping, stabilized construction entrances, and temporary check dams; (2) conducting drilling/piling operations in accordance with guidelines set forth by the City and County of San Francisco, including the San Francisco Department of Public Health Local Oversight Program, and Caltrans Construction Site BMP Manual; (3) lining storage areas; and (4) proper and expeditious disposal of items to be removed, such as landscaping, curb bulb waste, existing bus stop shelters, and demolished OCS and signal poles. In addition, completion of an SWPPP for the NPDES General Permit is required, which will also help to identify and implement construction BMPs to reduce impacts on water quality. SFPUC has developed guidelines for water pollution prevention referred to as “Keep it on Site” (SFPUC, 2009), which provides information for construction within the City and provides important regulatory agency contact information for the contractor. It also describes requirements for SWPPP development and implementation to ensure NPDES compliance with the California State Department of Water Resources General Construction Permit. The SWPPP will address water quality impacts associated with construction activities, including identification of all drainage facilities onsite, placement of appropriate stormwater and non-stormwater pollution controls, erosion and sediment control, spill response and containment plans, inspection scheduling, maintenance, and training of all construction personnel onsite. Coordination with SFPUC and conformity of construction activities with the “Keep it on Site” guide will be necessary.
All exposed soil material should be covered, and soil stockpiles generated during construction should be properly analyzed and characterized for possible contaminants before proceeding with offsite disposal and/or onsite reuse. All construction activities should prevent the creation of potential conduits that allow or facilitate direct vertical migration of any near-surface soil contaminants into the underlying groundwater zone or otherwise enhance lateral migration of residual contaminants in the project area. During wet weather, runoff water should be prevented from entering the excavation and collected and disposed of outside the construction limits. To prevent runoff from entering the excavation,
K E Y F I N D I N G S
All alternatives have potential environmental consequences due to runoff during the construction phase. The following measures are required:
� Preparation and implementation of a Stormwater Pollution Prevention Plan during project construction.
� Coordination with SFPUC and conformity of construction activities with “Keep it on Site” Guide.
� If groundwater is encountered during project excavation activities, the water will be pumped from the excavated area and contained and treated in accordance with all applicable State and federal regulations before being discharged to the existing local combined sewer system.

Chapter 4: Affected Environment,Chapter 4: Affected Environment,Chapter 4: Affected Environment,Chapter 4: Affected Environment, Van Ness Avenue Bus Rapid Transit Project Environmental Consequences, andEnvironmental Consequences, andEnvironmental Consequences, andEnvironmental Consequences, and Draft Environmental Impact Statement/ Avoidance, Minimization, and/oAvoidance, Minimization, and/oAvoidance, Minimization, and/oAvoidance, Minimization, and/or Mitigation Measuresr Mitigation Measuresr Mitigation Measuresr Mitigation Measures Environmental Impact Report
4.15-18 San Francisco County Transportation Authority October 2011
a perimeter berm may be constructed at the top of the excavated area. The sidewalls of the excavation may be covered by plastic sheeting to prevent saturation of the earth material.
If groundwater is encountered during project excavation activities, the water will be pumped from the excavated area and contained and treated in accordance with all applicable State and federal regulations before being discharged to the existing local CSS.
In summary, the following required procedures, identified as improvement measures, will be implemented to avoid adverse water quality impacts during construction:
I-HY-C1. Preparation and implementation of an SWPPP during project construction will minimize or avoid significant impacts to water quality. Completion of an SWPPP for the NPDES General Permit will be required for construction of each build alternative and for earthwork activities under the No Build Alternative, such as the OCS support pole/ streetlight replacement and repaving activities. The SWPPP will address water quality impacts associated with construction activities, including identification of all drainage facilities onsite, placement of appropriate stormwater and non-stormwater pollution controls, erosion and sediment control, spill response and containment plans, inspection scheduling, maintenance, and training of all construction personnel onsite.
The SWPPP will specify how construction-related stormwater impacts can be mitigated throughout the project site through:
• The appropriate treatment of overflow stormwater during construction, including inlet protection devices, temporary silt fencing, soil stabilization measures, street sweeping, stabilized construction entrances, and temporary check dams;
• Lining storage areas; and • Proper and expeditious disposal of items to be removed, such as landscaping, curb bulb
waste, existing bus stop shelters, and demolished OCS support poles/streetlights and signal poles.
I-HY-C2. Any construction work that impacts the CSS will require coordination with SFPUC, and construction-related activities shall conform to the “Keep it on Site” guide (SFPUC, 2009).
I-HY-C3. If groundwater is encountered during project excavation activities, the water will be pumped from the excavated area and contained and treated in accordance with all applicable State and federal regulations before being discharged to the existing local CSS. A batch discharge permit from SFPUC will be required prior to commencement of discharge to the CSS.
4.15.9Air Quality
The federal, state, and local governing bodies, regulations and polices relevant to air quality impacts of the proposed project are described in detail under Section 4.10.1. This also includes a description of relevant TAC and GHG regulations.
4.15.9.1ENVIRONMENTAL CONSEQUENCES
Methodology and Significance Criteria
Regional construction emissions were analyzed based on guidance provided in the BAAQMD CEQA Guidelines. Based on these guidelines, the Sacramento Metropolitan Air Quality Management District’s (SMAQMD) Road Construction Emissions Model (RoadMod) was utilized to quantify construction-related emissions. The assumptions and the model inputs were based on the construction details provided in the PCP. Regional construction emissions were then compared to the BAAQMD regional thresholds to determine project impact significance.

Van Ness Avenue Bus Rapid Transit Project Chapter 4: Affected Environment,Chapter 4: Affected Environment,Chapter 4: Affected Environment,Chapter 4: Affected Environment, Draft Environmental Impact Statement/ Environmental Consequences, andEnvironmental Consequences, andEnvironmental Consequences, andEnvironmental Consequences, and Environmental Impact Report Avoidance, Minimization, and/orAvoidance, Minimization, and/orAvoidance, Minimization, and/orAvoidance, Minimization, and/or Mitigation Measures Mitigation Measures Mitigation Measures Mitigation Measures
San Francisco County Transportation Authority October 2011 4.15-19
BAAQMD’s approach to the CEQA analysis of construction-related fugitive dust impacts is to emphasize the implementation of effective and comprehensive control measures rather than detailed quantification of emissions. PM10 is the pollutant of greatest concern with respect to construction activities. The BAAQMD CEQA Guidelines provide feasible control measures for construction emissions of PM10. If the appropriate construction controls are implemented, then fugitive dust emissions for construction activities would be considered less than significant. In addition, as shown in Table 4-.14-4, the BAAQMD has identified the following thresholds for construction equipment exhaust emissions.
Table 4.15-4: Construction Emissions Thresholds
CRITERIA POLLUTANT POUNDS PER DAY
Reactive Organic Gases (ROG) 54
Nitrogen Oxides (NOX) 54
Fine Particulate Matter (PM2.5) 54 (exhaust only)
Respirable Particulate Matter (PM10) 82 (exhaust only)
SOURCE: BAAQMD, 2010b.
According to the CEQ regulations (40 CFR §§ 1500-1508), the determination of a significant impact is a function of both context and intensity. Context means that the significance of an action must be analyzed in several contexts such as society as a whole (i.e., human, national), the affected region, the affected interests, and the locality. Both short- and long-term effects are relevant. Intensity refers to the severity of impact. To determine significance, the severity of the impact must be examined in terms of the type, quality, and sensitivity of the resource involved; the location of the proposed project; the duration of the effect (short- or long-term), and other considerations of context. Adverse impacts will vary with the setting of the proposed action and the surrounding area.
CEQA Construction Phase Impacts
During the construction phase of the proposed project, heavy-duty construction equipment and vehicle trips generated by construction workers traveling to and from the proposed project site may cause air quality impacts. The BAAQMD-required RoadMod estimating tool and associated model default values were used to estimate worker commute emissions. These emissions are minor compared to equipment and exhaust emissions. While fugitive dust emissions would primarily result from demolition and site preparation (e.g., grading) activities, NOX emissions would primarily result from the use of heavy-duty construction equipment. Each of these potential sources was taken into consideration to estimate construction air quality impacts. Construction emissions can vary substantially from day to day, depending on the level of activity, the specific type of operation, and the prevailing weather conditions.
At least one preferred approach was identified for each alternative. Because the preferred approaches are also the approaches with the shortest construction duration, these scenarios also represent the worst-case construction emissions because the same amount of work would be compressed into a shorter timeframe. Emissions from construction vehicles are summarized in Tables 4.15-5 and 4.15-6. All work was assumed to start in 2011 based on the PCP. Build Alternatives 2, 3, and 4 would result in lane closures and may affect vehicle speeds on Van Ness Avenue and parallel roadways. There is a direct correlation between decreased vehicle speeds and higher pollutant emissions at low vehicle speeds (e.g., 6 to 11 mph). The construction analysis for each of these alternatives conservatively assumed that average daily traffic along Van Ness Avenue would be reduced by 5 mph during construction activity. The increased emissions resulting from traffic delays were added into the emissions caused by general construction activity. The traffic analysis prepared for the

Chapter 4: Affected Environment,Chapter 4: Affected Environment,Chapter 4: Affected Environment,Chapter 4: Affected Environment, Van Ness Avenue Bus Rapid Transit Project Environmental Consequences, andEnvironmental Consequences, andEnvironmental Consequences, andEnvironmental Consequences, and Draft Environmental Impact Statement/ Avoidance, Minimization, and/oAvoidance, Minimization, and/oAvoidance, Minimization, and/oAvoidance, Minimization, and/or Mitigation Measuresr Mitigation Measuresr Mitigation Measuresr Mitigation Measures Environmental Impact Report
4.15-20 San Francisco County Transportation Authority October 2011
proposed project identified Van Ness Avenue between Market Street and Fell Street as having the highest average daily traffic along the corridor. To be conservative, this traffic volume was used to determine traffic delay emissions for the corridor during construction. For each alternative, it was assumed that traffic would be delayed for up to three blocks.
Tables 4.15-5 and 4.15-6 include onsite and offsite exhaust emissions. Onsite emissions are emissions generated by construction equipment located directly on the project site. Offsite emissions are generated by haul trucks and worker trips, both of which occur primarily away from the project site.
Alternative 1: No Build (Baseline Alternative). The No Build Alternative would include replacing the existing OCS and support poles/streetlights, traffic signal infrastructure improvements, new buses, sidewalk and street lighting improvements, pavement resurfacing, and various bus infrastructure improvements described above. These projects would undergo individual environmental review and construction emissions would be analyzed, as necessary. This alternative would have a less-than-significant impact under CEQA.
Build Alternative 2: Side-Lane BRT with Street Parking. As shown in Table 4.15-5 construction exhaust emissions would exceed the BAAQMD NOX significance threshold, and construction activity from Build Alternative 2 would result in a potentially significant impact under CEQA.
Table 4.15-5: Build Alternative 2 Estimated Daily Construction Emissions – Unmitigated
CONSTRUCTION YEAR
POUNDS PER DAY
ROG NOX PM10 PM2.5
Total Maximum Exhaust Emissions 10 55 3 3
Regional Significance ThresholdRegional Significance ThresholdRegional Significance ThresholdRegional Significance Threshold 54545454 54545454 82828282 54545454
Exceed Threshold? No Yes No No
/a/ Onsite emissions include construction equipment exhaust.
/b/ Offsite emissions include haul truck exhaust, and worker-trip exhaust.
SOURCE: TAHA, 2010 (Appendix C).
Build Alternative 3: Center-Lane BRET with Right-Side Boarding and Dual Medians. Under this alternative, as shown in Table 4.15-6, construction exhaust emissions would exceed the BAAQMD NOX significance threshold; therefore, construction activity from Build Alternative 3 would result in a potentially significant impact under CEQA.
Table 4.15-6: Build Alternative 3 Estimated Daily Construction Emissions – Unmitigated
CONSTRUCTION YEAR
POUNDS PER DAY
ROG NOX PM10 PM2.5
Total Maximum Exhaust Emissions 11 61 3 3
Regional Significance ThresholdRegional Significance ThresholdRegional Significance ThresholdRegional Significance Threshold 54545454 54545454 82828282 54545454
Exceed Threshold? No Yes No No
/a/ Onsite emissions include equipment exhaust.
/b/ Offsite emissions include truck exhaust.
SOURCE: TAHA, 2010 (Appendix C).
Build Alternative 4: Center-Lane BRT with Left-Side Boarding and Single Median. Construction activity under Build Alternative 4 would be similar to that described under Build Alternative 3; however, the two alternatives utilize different design features. Therefore, the construction period for Build Alternative 4 would be approximately 3 months shorter than for Build
K E Y F I N D I N G S
Under all build alternatives, construction exhaust emissions would exceed the BAAQMD NOX significance threshold; therefore,
construction activity would result in a potentially significant impact under CEQA for all build
alternatives.
Emissions of DPM would result in a less-than-significant impact for each alternative under CEQA.
FInally, demolition and renovation of asbestos-
containing materials (ACMs), NOA exposure, and odor
emissions would result in a less-than-significant impact for each
alternative under CEQA.
The avoidance, minimization, and mitigation measures
recommended in Section 4.15.9.2 would reduce the likelihood and
magnitude of these impacts.

Van Ness Avenue Bus Rapid Transit Project Chapter 4: Affected Environment,Chapter 4: Affected Environment,Chapter 4: Affected Environment,Chapter 4: Affected Environment, Draft Environmental Impact Statement/ Environmental Consequences, andEnvironmental Consequences, andEnvironmental Consequences, andEnvironmental Consequences, and Environmental Impact Report Avoidance, Minimization, and/orAvoidance, Minimization, and/orAvoidance, Minimization, and/orAvoidance, Minimization, and/or Mitigation Measures Mitigation Measures Mitigation Measures Mitigation Measures
San Francisco County Transportation Authority October 2011 4.15-21
Alternative 3, resulting in less mass regional construction emissions under Build Alternative 4 compared to Build Alternative 3. As shown in Table 4.15-6, construction exhaust emissions would exceed the BAAQMD NOX significance threshold; therefore, this alternative would result in a potentially significant impact under CEQA.
In addition to regional emissions discussed above, construction DPM emissions would result in a less-than-significant impact for each alternative under CEQA. Furthermore, demolition and renovation of asbestos-containing materials (ACMs), NOA exposure, and odor emissions would result in a less-than-significant impact for each alternative under CEQA.
NEPA Construction Phase Impacts
Alternative 1: No Build (Baseline Alternative). The No Build Alternative would include replacing the existing OCS and trolley/streetlight poles, traffic signal infrastructure improvements, new buses, sidewalk and street lighting improvements, pavement resurfacing, and various bus infrastructure improvements described above. These projects would undergo individual environmental review, and construction emissions would be analyzed, as necessary. This alternative would not result in adverse construction impacts under NEPA.
Build Alternative 2: Side-Lane BRT with Street Parking. Construction activity would generate regional emissions, TAC emissions, and odors. It would also increase localized pollutant concentrations; however, construction emissions from Build Alternative 2 would be temporary and are not considered adverse under NEPA.
Build Alternative 3: Center-Lane BRT with Right-Side Boarding and Dual Medians. Construction activity would generate regional emissions, TAC emissions, and odors. It would also increase localized pollutant concentrations; however, construction emissions from Build Alternative 3 would be temporary and are not considered adverse under NEPA.
Build Alternative 4: Center-Lane BRT with Left-Side Boarding and Single Median. Construction activity would generate regional emissions, TAC emissions, and odors. It would also increase localized pollutant concentrations; however, construction emissions from Build Alternative 4 would be temporary and are not considered adverse under NEPA.
4.15.9.2AVOIDANCE, MINIMIZATION, AND/OR MITIGATION MEASURES
Implementation of BAAQMD control measures would reduce impacts from construction emissions, including NOX emissions.
M-AQ-C1. Construction contractors shall implement the BAAQMD Basic Construction Mitigation Measures listed in Table 4.15-7 and the applicable measures in the Additional Construction Mitigation Measures. This includes Measure 10 in the Additional Construction Mitigation Measures.
Table 4.15-7: Feasible Control Measures for Construction Emissions
Basic Construction Mitigation MeasuresBasic Construction Mitigation MeasuresBasic Construction Mitigation MeasuresBasic Construction Mitigation Measures. The following controls should be implemented at all construction sites:
1. All exposed surfaces (e.g., parking areas, staging areas, soil piles, graded areas, and unpaved access roads) shall be watered two times per day.
2. All haul trucks transporting soil, sand, or other loose material offsite shall be covered.
3. All visible mud or dirt track-out onto adjacent public roads shall be removed using wet power vacuum street sweepers at least once per day. The use of dry power sweeping is prohibited.
4. All vehicle speeds on unpaved roads shall be limited to 15 mph.
5. All roadways, driveways, and sidewalks to be paved shall be completed as soon as possible. Building pads shall be laid as soon as possible after grading unless seeding or soil binders are used.

Chapter 4: Affected Environment,Chapter 4: Affected Environment,Chapter 4: Affected Environment,Chapter 4: Affected Environment, Van Ness Avenue Bus Rapid Transit Project Environmental Consequences, andEnvironmental Consequences, andEnvironmental Consequences, andEnvironmental Consequences, and Draft Environmental Impact Statement/ Avoidance, Minimization, and/oAvoidance, Minimization, and/oAvoidance, Minimization, and/oAvoidance, Minimization, and/or Mitigation Measuresr Mitigation Measuresr Mitigation Measuresr Mitigation Measures Environmental Impact Report
4.15-22 San Francisco County Transportation Authority October 2011
Table 4.15-7: Feasible Control Measures for Construction Emissions
6. Idling times shall be minimized either by shutting equipment off when not in use or reducing the maximum idling time to 5 minutes (as required by the California airborne toxics control measure Title 13, Section 2485 of ). Clear signage shall be provided for construction workers at all access points.
7. All construction equipment shall be maintained and properly tuned in accordance with manufacturer’s specifications. All equipment shall be checked by a certified mechanic and determined to be running in proper condition prior to operation.
8. Post a publicly visible sign with the telephone number and person to contact at the Lead Agency regarding dust complaints. This person shall respond and take corrective action within 48 hours. The Air District’s phone number shall also be visible to ensure compliance with applicable regulations.
Additional Construction Mitigation MeasurAdditional Construction Mitigation MeasurAdditional Construction Mitigation MeasurAdditional Construction Mitigation Measureseseses. The following measures are recommended for projects with construction emissions above the threshold:
1. All exposed surfaces shall be watered at a frequency adequate to maintain minimum soil moisture of 12 percent. Moisture content can be verified by lab samples or moisture probe.
2. All excavation, grading, and/or demolition activities shall be suspended when average wind speeds exceed 20 mph.
3. Wind breaks (e.g., trees, fences) shall be installed on the windward side(s) of actively disturbed areas of construction. Wind breaks should have at maximum 50 percent air porosity.
4. Vegetative ground cover (e.g., fast-germinating native grass seed) shall be planted in disturbed areas as soon as possible and watered appropriately until vegetation is established.
5. The simultaneous occurrence of excavation, grading, and ground-disturbing construction activities on the same area at any one time shall be limited. Activities shall be phased to reduce the amount of disturbed surfaces at any one time.
6. All trucks and equipment, including their tires, shall be washed off prior to leaving the site.
7. Site accesses to a distance of 100 feet from the paved road shall be treated with a 6- to 12-inch compacted layer of wood chips, mulch, or gravel.
8. Sandbags or other erosion control measures shall be installed to prevent silt runoff to public roadways from sites with a slope greater than 1 percent.
9. Minimize the idling time of diesel-powered construction equipment to 2 minutes.
10. The project shall develop a plan demonstrating that the off-road equipment (more than 50 horsepower) to be used in the construction project (i.e., owned, leased, and subcontractor vehicles) would achieve a projectwide fleet-average 20 percent NOX reduction and 45 percent PM reduction compared to typical construction equipment. Acceptable options for reducing emissions include the use of late model engines, low-emission diesel products, alternative fuels, engine retrofit technology, after-treatment products, add-on devices such as particulate filters, and/or other options as such become available.
11. Use low volatile organic compound (VOC) (i.e., ROG) coatings beyond the local requirements (i.e., Regulation 8, Rule 3: Architectural Coatings).
12. Require that all construction equipment, diesel trucks, and generators be equipped with BACT for emission reductions of NOX and PM.
13. Require all contractors to use equipment that meets CARB’s most recent certification standard for off-road heavy duty diesel engines.
SOURCE: BAAQMD, 2010b.
M-AQ-C2. Construction contractors shall comply with BAAQMD Regulation 11 (Hazardous Pollutants) Rule 2 (Asbestos Demolition, Renovation, and Manufacturing). The requirements for demolition activities include removal standards, reporting requirements, and mandatory monitoring and record keeping.
4.15.9.3IMPACTS AFTER MITIGATION
Build Alternative 2: Side-Lane BRT with Street Parking. Appropriate mitigation measures would reduce NOX emissions by 25 percent and PM2.5 and PM10 emissions by 45 percent. Table

Van Ness Avenue Bus Rapid Transit Project Chapter 4: Affected Environment,Chapter 4: Affected Environment,Chapter 4: Affected Environment,Chapter 4: Affected Environment, Draft Environmental Impact Statement/ Environmental Consequences, andEnvironmental Consequences, andEnvironmental Consequences, andEnvironmental Consequences, and Environmental Impact Report Avoidance, Minimization, and/orAvoidance, Minimization, and/orAvoidance, Minimization, and/orAvoidance, Minimization, and/or Mitigation Measures Mitigation Measures Mitigation Measures Mitigation Measures
San Francisco County Transportation Authority October 2011 4.15-23
4.15-8 compares construction emissions from mitigated vehicle exhaust to BAAQMD thresholds. As shown in the table, mitigated emissions would not exceed the NOX threshold; therefore, construction activity under Build Alternative 2 would result in a less-than-significant impact under CEQA.
Table 4.15-8: Build Alternative 2 Estimated Daily Construction Emissions – Mitigated
BUILD ALTERNATIVE 2
POUNDS PER DAY
ROG NOX PM10 PM2.5
Total Maximum Exhaust Emissions 10 42 2 2
Regional Significance ThresholdRegional Significance ThresholdRegional Significance ThresholdRegional Significance Threshold 54545454 54545454 82828282 54545454
Exceed Threshold? No No No No
Note: The BAAQMD recommends implementing Measure 10 from the Additional Construction Mitigation Measures for a 20 percent reduction in NOX, and a 45 percent reduction in PM10 and PM2.5. The BAAQD recommends that implementation of the Basic Construction Mitigation Measures reduces NOX an additional 5 percent (BAAQMD, 2010b).
SOURCE: TAHA, 2010 (Appendix C).
Build Alternative 3: Center-Lane BRT with Right-Side Boarding and Dual Medians. As shown in Table 4.15-9, mitigated NOX emissions would no longer exceed the BAAQMD threshold; therefore, construction activity under Build Alternative 3 would result in a less-than-significant impact under CEQA.
Table 4.15-9: Build Alternative 3 Estimated Daily Construction Emissions – Mitigated
BUILD ALTERNATIVE 3
POUNDS PER DAY
ROG NOX PM10 PM2.5
Total Maximum Exhaust Emissions 11 47 2 2
Regional Significance ThresholdRegional Significance ThresholdRegional Significance ThresholdRegional Significance Threshold 54545454 54545454 82828282 54545454
Exceed Threshold? No No No No
Note: The BAAQMD recommends implementing Measure 10 from the Additional Construction Mitigation Measures for a 20 percent reduction in NOX, and a 45 percent reduction in PM10 and PM2.5. The BAAQD recommends that implementation of the Basic Construction Mitigation Measures reduces NOX an additional 5 percent (BAAQMD, 2010b).
SOURCE: TAHA, 2010 (Appendix C).
Build Alternative 4: Center-Lane BRT with Left-Side Boarding and Single Median. Construction activity under Build Alternative 4 would be similar to that described under Build Alternative 3; however the construction period for Build Alternative 4 would be approximately 3 months shorter than for Build Alternative 3, resulting in less mass regional construction emissions in comparison to Build Alternative 3. Thus, mitigated construction emissions for Build Alternative 4 would also no longer exceed the BAAQMD threshold; therefore, construction activity under Build Alternative 4 would result in a less-than-significant impact under CEQA.
4.15.10Noise and Vibration
4.15.10.1ENVIRONMENTAL CONSEQUENCES
Construction Noise
The nature of the proposed Van Ness Avenue BRT construction work is conventional, principally modifications to the existing street/highway surfaces, new stations and

Chapter 4: Affected Environment,Chapter 4: Affected Environment,Chapter 4: Affected Environment,Chapter 4: Affected Environment, Van Ness Avenue Bus Rapid Transit Project Environmental Consequences, andEnvironmental Consequences, andEnvironmental Consequences, andEnvironmental Consequences, and Draft Environmental Impact Statement/ Avoidance, Minimization, and/oAvoidance, Minimization, and/oAvoidance, Minimization, and/oAvoidance, Minimization, and/or Mitigation Measuresr Mitigation Measuresr Mitigation Measuresr Mitigation Measures Environmental Impact Report
4.15-24 San Francisco County Transportation Authority October 2011
concrete/asphalt travel way, curbs and gutters, utility relocations, drainage, signs, striping, and signals. Construction noise varies greatly depending on the construction process, type and condition of the equipment used, and layout of the construction site. Many of these factors are subject to the contractor's discretion. Projections of potential construction noise levels may vary from actual noise experienced during construction due to these factors.
Overall, construction noise levels are governed primarily by the noisiest pieces of equipment. The engine, which is usually diesel, is the dominant noise source for most construction equipment. Table 4.15-10 presents reference noise levels for representative pieces of construction equipment that may be used for the proposed project.
Brief noise disturbances could also be caused by trucks transporting equipment and supplies to and from construction staging areas. The proposed staging areas are at Erie Street, Otis Street, and Filbert Street. Traffic noise from US 101 would tend to mask noise related to construction staging at the Erie Street location. Traffic near the busy intersection of Otis and Mission streets and Van Ness Avenue would tend to do the same for the Otis Street location. The proposed northern staging location is also near a major source of traffic noise – Van Ness Avenue; however, minor, intermittent noise disturbance could still occur at multi-family residences adjacent to the proposed staging site along Filbert Street.
Nighttime construction related to the proposed project would cause City noise ordinance limits to be exceeded from time to time (see Section 4.11.2, Regulatory Setting).
Table 4.15-10: Projected Construction Noise Emission Levels (dBA)
EQUIPMENT TYPICAL NOISE LEVEL
50 FEET FROM SOURCE TYPICAL NOISE LEVEL
100 FEET FROM SOURCE1
Backhoe 80 74
Rubber-tired Excavator 85 79
Forklift 85 79
Front Loader 85 79
Jack Hammer 88 82
Saw 76 70
Asphalt Milling Machine* 84 78
Roller 74 68
Paver 77 71
Grader 85 79
Dozer 85 79
Concrete Mixers 77 71
Dump Trucks 75 69
Notes: 1. Noise levels at 100 feet are calculated using spherical spreading from a point source. 2. Noise levels are measured in decibels (dBA) * The noise emission of an asphalt milling machine is not identified in the FTA manual; these data are from Parsons.
Source: FTA, 2006; Parsons, 2010.
Construction Vibration
Construction activity can result in varying degrees of ground vibration, depending on the equipment and methods used. The operation of construction equipment causes vibrations that spread through the ground and diminish in strength with traveled distance. Buildings in the vicinity of the construction site are affected by these vibrations, with resulting damage in the most severe cases.
Van Ness Avenue Bus Rapid Transit Project Chapter 4: Affected Environment,Chapter 4: Affected Environment,Chapter 4: Affected Environment,Chapter 4: Affected Environment, Draft Environmental Impact Statement/ Environmental Consequences, andEnvironmental Consequences, andEnvironmental Consequences, andEnvironmental Consequences, and Environmental Impact Report Avoidance, Minimization, and/orAvoidance, Minimization, and/orAvoidance, Minimization, and/orAvoidance, Minimization, and/or Mitigation Measures Mitigation Measures Mitigation Measures Mitigation Measures
San Francisco County Transportation Authority October 2011 4.15-25
Vibratory rollers would be the most dominant sources of overall construction vibration for this project. The vibration levels created by the normal movement of vehicles, including graders, front loaders, and backhoes, are comparable in order-of-magnitude to ground-borne vibrations created by heavy vehicles traveling on streets and highways.
Building damage can be cosmetic or structural. Fragile buildings, such as some historical structures, are generally more susceptible to damage from ground vibration. Normal buildings that are not particularly fragile would not experience any cosmetic damage (e.g., plaster cracks) at distances beyond 25 feet based on typical construction equipment vibration levels. This distance can vary substantially depending on the soil composition between vibration source and receiver.
FTA has specifically addressed four different types of buildings: Category One, reinforced-concrete, steel or timber (no plaster); Category Two, engineered concrete and masonry (no plaster); Category Three, non-engineered timber and masonry buildings; and Category Four, buildings extremely susceptible to vibration damage. Commercial type and multiple-storied structures are generally represented by Categories One and Two. Typical wood-framed residences fall under Category Three, while any structurally fragile buildings (i.e., more likely to be historical in nature) would fall under Category Four. There are buildings of historical significance within the project limits, but none have been identified as sufficiently sensitive to vibration impact to fall under Category Four.
Calculations were performed to determine the distances at which vibration impacts would occur according to the FTA criteria. Table 4.15-11 shows the results of those calculations classified per building category. Mitigation measures would be required if construction equipment were to operate within the distances shown in Table 4.15-11 from buildings located along the project alignment.
Table 4.15-11: Vibration Source Levels and Building Damage Impact Distances for Construction Equipment
EQUIPMENT PPV1 AT 25 FEET, INCHES PER
SECOND
APPROXIMATE
LV2 AT 25 FEET
IMPACT DISTANCE FOR BUILDING CATEGORY, FEET
I II III
Vibratory Roller 0.210 94 14 18 25
Loaded Trucks 0.076 86 7 10 14
Jackhammer 0.035 79 4 6 8
Small Bulldozer 0.003 58 1 1 2
Notes: 1 Peak Particle Velocity 2 RMS velocity in decibels (VdB), re: 1 micro-inch per second
Source: FTA, 2006.
It is expected that ground-borne vibration from construction activities would cause only intermittent, localized intrusion along the Van Ness Avenue BRT corridor. Processes, such as earth moving with bulldozers and the use of vibratory compaction rollers, can create annoying vibration. There could be a few instances where vibratory rollers would need to operate close to wood-frame buildings such that FTA vibration thresholds for cosmetic damage could be briefly and slightly exceeded at those buildings.
4.15.10.2AVOIDANCE, MINIMIZATION, AND/OR MITIGATION MEASURES
Construction impacts are of a temporary nature, and construction is a necessary part of any project. Project construction will comply with requirements in the City Noise Ordinance, Article 29 of the San Francisco Municipal Code (San Francisco, 2008); including obtaining permission from the Director of Public Works for nonemergency construction activities during nighttime hours if the resulting noise level is more than 5 dB in excess of the ambient noise at the nearest property line (see Section 4.11.2.5). To further reduce noise and
K E Y F I N D I N G S
Construction for all build alternatives would result in ground-borne vibration and other noise impacts. Minimization and mitigation measures recommended in Section 4.15.10.2 would reduce these impacts.

Chapter 4: Affected Environment,Chapter 4: Affected Environment,Chapter 4: Affected Environment,Chapter 4: Affected Environment, Van Ness Avenue Bus Rapid Transit Project Environmental Consequences, andEnvironmental Consequences, andEnvironmental Consequences, andEnvironmental Consequences, and Draft Environmental Impact Statement/ Avoidance, Minimization, and/oAvoidance, Minimization, and/oAvoidance, Minimization, and/oAvoidance, Minimization, and/or Mitigation Measuresr Mitigation Measuresr Mitigation Measuresr Mitigation Measures Environmental Impact Report
4.15-26 San Francisco County Transportation Authority October 2011
vibration impacts during construction, the following best practices, identified as improvement measures, will be implemented:
I-NO-1. Project construction will implement best practices in equipment noise and vibration control as feasible, including the following:
1. Use newer equipment with improved noise muffling and ensure that all equipment items have the manufacturers’ recommended noise abatement measures, such as mufflers, engine covers, and engine vibration isolators intact and operational. Newer equipment will generally be quieter in operation than older equipment. All construction equipment should be inspected at periodic intervals to ensure proper maintenance and presence of noise control devices (e.g., mufflers and shrouding).
2. Perform all construction in a manner that minimizes noise and vibration. Utilize construction methods or equipment that will provide the lowest level of noise and ground vibration impact.
3. Turn off idling equipment.
4. When possible, limit the use of construction equipment that creates high vibration levels, such as vibratory rollers and hammers. When such equipment must be used within 25 feet of any existing building, select equipment models that generate lower vibration levels.
5. Restrict the hours of vibration-intensive equipment or activities, such as vibratory rollers, so that annoyance to residents is minimal (e.g., limit to daytime hours as defined in the noise ordinance).
I-NO-2. Project construction will conduct truck loading, unloading, and hauling operations so that noise and vibration are kept to a minimum by carefully selecting routes to avoid passing through residential neighborhoods to the greatest possible extent.
I-NO-3. Perform independent noise and vibration monitoring in sensitive areas, as needed, to demonstrate compliance with applicable noise limits. Require contractors to modify and/or reschedule their construction activities if monitoring determines that maximum limits are exceeded at residential land uses per the City Noise Ordinance.
I-NO-4:.The construction contractor will be required by contract specification to comply with the City noise ordinances and obtain all necessary permits, particularly in relation to nighttime construction work.
4.15.11Biological Environment
This section presents construction phase impacts to biological resources in the project corridor and any avoidance, minimization, and/or mitigation measures required to address construction impacts. Section 4.13.2, Biological Environment, describes biological resources present along the Van Ness Avenue corridor.
4.15.11.1ENVIRONMENTAL CONSEQUENCES
The project area has no special-status biological resources or protected habitats that could be impacted by the proposed build alternatives or No Build Alternative. Nonetheless, median and sidewalk vegetation along Van Ness Avenue provides habitat for nesting birds, which are protected by the MBTA. Construction of the proposed build alternatives could disturb migratory birds and active bird nests during the nesting season, causing nest abandonment and death of young or loss of reproductive potential at active bird nests, resulting in adverse impacts. Mitigation described below in Section 4.15.11.2 is required to avoid or minimize disturbance to any active bird nests.
Mature trees shall be preserved and incorporated into the project landscape plan where space permits. Nonetheless, all of the build alternatives would require removal of mature

Van Ness Avenue Bus Rapid Transit Project Chapter 4: Affected Environment,Chapter 4: Affected Environment,Chapter 4: Affected Environment,Chapter 4: Affected Environment, Draft Environmental Impact Statement/ Environmental Consequences, andEnvironmental Consequences, andEnvironmental Consequences, andEnvironmental Consequences, and Environmental Impact Report Avoidance, Minimization, and/orAvoidance, Minimization, and/orAvoidance, Minimization, and/orAvoidance, Minimization, and/or Mitigation Measures Mitigation Measures Mitigation Measures Mitigation Measures
San Francisco County Transportation Authority October 2011 4.15-27
trees and potential work within tree drip lines. As described in Section 4.4.4, Visual/Aesthetics, a preconstruction tree survey would be required by a certified arborist to identify protected trees that would be potentially impacted by the proposed project and determine the need for tree removal permits and tree protection plans. Tree protection plans include BMPs to preserve the health of trees during project construction.
4.15.11.2AVOIDANCE, MINIMIZATION, AND/OR MITIGATION MEASURES
The following mitigation measures are proposed to offset potential biological resource impacts during construction resulting from the build alternatives:
M-BR-C1. BMPs identified in tree protection plans and tree removal permits resulting from the preconstruction tree survey will be implemented to preserve the health of trees during project construction.
M-BR-C2. Disturbance of protected bird nests during the breeding season will be avoided. Tree and shrub removal will be scheduled during the nonbreeding season (i.e., September 1 through January 31), as feasible. If tree and shrub removal are required to occur during the breeding season (i.e., February 1 through August 31), then the following measures will be implemented to avoid potential adverse effects to nesting birds:
• A qualified wildlife biologist will conduct preconstruction surveys of all potential nesting habitat within 500 feet of construction activities where access is available. Exclusionary structures (e.g., netting or plastic sheeting) may be used to discourage the construction of nests by birds within the project construction zone. A preconstruction survey of all accessible nesting habitat within 500 feet of construction activities is required to occur no more than 2 weeks prior to construction.
• If preconstruction surveys conducted no more than 2 weeks prior to construction identify that protected nests are inactive or potential habitat is unoccupied during the construction period, then no further mitigation is required. Trees and shrubs within the construction footprint that have been determined to be unoccupied by protected birds or that are located outside the no-disturbance buffer for active nests may be removed.
• If active protected nests are found during preconstruction surveys, then the project proponent will create a no-disturbance buffer (acceptable in size to CDFG) around active protected bird and/or raptor nests during the breeding season, or until it is determined that all young have fledged. Typical buffers include 500 feet for raptors and 50 feet for passerine nesting birds. The size of these buffer zones and types of construction activities restricted in these areas may be further modified during consultation with CDFG, and it will be based on existing noise and human disturbance levels at the project site. Nests initiated during construction are presumed to be unaffected, and no buffer will be necessary; however the “take” (e.g., mortality, severe disturbance to) of any individual protected birds will be prohibited. Monitoring of active nests when construction activities encroach upon established buffers may be required by CDFG.
Mature trees shall be preserved and incorporated into the project landscape plan where space permits.
Disturbance of protected bird nests during the breeding season will be avoided.

Chapter 4: Affected Environment,Chapter 4: Affected Environment,Chapter 4: Affected Environment,Chapter 4: Affected Environment, Van Ness Avenue Bus Rapid Transit Project Environmental Consequences, andEnvironmental Consequences, andEnvironmental Consequences, andEnvironmental Consequences, and Draft Environmental Impact Statement/ Avoidance, Minimization, and/oAvoidance, Minimization, and/oAvoidance, Minimization, and/oAvoidance, Minimization, and/or Mitigation Measuresr Mitigation Measuresr Mitigation Measuresr Mitigation Measures Environmental Impact Report
4.15-28 San Francisco County Transportation Authority October 2011
This page intentionally left blank.
Van Ness Avenue Bus Rapid Transit Project Chapter 4: Affected Environment,Chapter 4: Affected Environment,Chapter 4: Affected Environment,Chapter 4: Affected Environment, Draft Environmental Impact Statement/ Environmental Consequences, andEnvironmental Consequences, andEnvironmental Consequences, andEnvironmental Consequences, and Environmental Impact Report Avoidance, Minimization, and/or Mitigation Measures Avoidance, Minimization, and/or Mitigation Measures Avoidance, Minimization, and/or Mitigation Measures Avoidance, Minimization, and/or Mitigation Measures
San Francisco County Transportation Authority October 2011 4.16-1
4.16 Irreversible and Irretrievable Commitment of Resources
Uses of nonrenewable resources during the initial and continued phases of a project could be irreversible because of a commitment of resources that make removal or nonuse of the resource unlikely thereafter. Implementation of the Van Ness Avenue BRT Project would involve the use of some nonrenewable resources. Construction and operation of the proposed project would require consumption of fossil fuels, labor, and construction materials. These expenditures would be, for the most part, irrecoverable; however, they are not in short supply, and their use would not have an adverse effect upon continued availability of these resources. Moreover, the project would accommodate a greater number of transit trips into the future and provide more efficient use of fossil fuel than if these trips were to be taken in private automobiles. In addition, the project would upgrade the existing bus fleet from a mix of diesel motor coaches and electric trolleys to a mix of diesel hybrid motor coach and electric trolley BRT vehicles, which are more fuel efficient.
Any construction would also require a substantial one-time expenditure of federal and local funds. These funds have been planned and programmed, as explained in Chapter 9, Financial Analysis. The Van Ness Avenue BRT Project currently has identified between 73 percent (Build Alternatives 3 and 4) and 100 percent (Build Alternative 2) of the capital funding need for the project.

Chapter 4: Affected Environment,Chapter 4: Affected Environment,Chapter 4: Affected Environment,Chapter 4: Affected Environment, Van Ness Avenue Bus Rapid Transit Project Environmental Consequences, andEnvironmental Consequences, andEnvironmental Consequences, andEnvironmental Consequences, and Draft Environmental Impact Statement/ Avoidance, Minimization, and/or Mitigation MeAvoidance, Minimization, and/or Mitigation MeAvoidance, Minimization, and/or Mitigation MeAvoidance, Minimization, and/or Mitigation Measuresasuresasuresasures Environmental Impact Report
4.16-2 San Francisco County Transportation Authority October 2011
This page intentionally left blank.

Van Ness Avenue Bus Rapid Transit Project Chapter 4: Affected Environment,Chapter 4: Affected Environment,Chapter 4: Affected Environment,Chapter 4: Affected Environment, Draft Environmental Impact Statement/ Environmental Consequences, andEnvironmental Consequences, andEnvironmental Consequences, andEnvironmental Consequences, and Environmental Impact Report Avoidance, Minimization, and/or Mitigation Measures Avoidance, Minimization, and/or Mitigation Measures Avoidance, Minimization, and/or Mitigation Measures Avoidance, Minimization, and/or Mitigation Measures
San Francisco County Transportation Authority October 2011 4.17-1
4.17 Relationship between Local Short-Term Uses of the Environment and the Maintenance and Enhancement of Long-Term Productivity
The Van Ness Avenue BRT build alternatives would each involve short-term uses of the environment during the construction period through the use of fuel and construction materials, and temporary increases in noise levels and air pollutants. These short-term effects and uses of resources would result in long-term benefits, such as improved transit travel times within the Van Ness Avenue corridor and a corresponding increase in transit ridership. In addition, travel time savings projected from proposed BRT implementation under each build alternative would allow the same service frequencies to be provided using fewer buses and drivers, which would reduce existing operating costs for Muni Bus Routes 47 and 49.
Other long-term benefits to air quality, noise, and energy demand would result from an upgrade of the existing bus fleet from a mix of diesel motor coaches and electric trolleys to an approximate 50 percent split between diesel hybrid motor coach and electric trolley BRT vehicles. These improvements would contribute to the long-term livability and, therefore, productivity of the area.

Chapter 4: Affected Environment,Chapter 4: Affected Environment,Chapter 4: Affected Environment,Chapter 4: Affected Environment, Van Ness Avenue Bus Rapid Transit Project Environmental Consequences, andEnvironmental Consequences, andEnvironmental Consequences, andEnvironmental Consequences, and Draft Environmental Impact Statement/ Avoidance, Minimization, and/or Mitigation MeAvoidance, Minimization, and/or Mitigation MeAvoidance, Minimization, and/or Mitigation MeAvoidance, Minimization, and/or Mitigation Measuresasuresasuresasures Environmental Impact Report
4.17-2 San Francisco County Transportation Authority October 2011
This page intentionally left blank.