41 Piezoelectric anisotropy: Enhanced piezoelectric ... · anisotropy of dielectric, elastic and...
12
FRONTIERS OF FERROELECTRICITY JOURNAL OF MATERIALS SCIENCE 41 (2006)65–76 Piezoelectric anisotropy: Enhanced piezoelectric response along nonpolar directions in perovskite crystals D. DAMJANOVIC, M. BUDIMIR, M. DAVIS, N. SETTER Ceramics Laboratory, Materials Institute, Ecole Polytechnique F´ ed ´ erale de Lausanne—EPFL, 1015, Lausanne, Switzerland E-mail: dragan.damjanovic@epfl.ch This paper discusses the mechanisms that can contribute to the enhanced longitudinal piezoelectric effect along nonpolar directions in perovskite crystals, such as BaTiO 3 , PbTiO 3 , KNbO 3 , Pb(Mg 1/3 Nb 2/3 )O 3 -PbTiO 3 and Pb(Zn 1/2 Nb 2/3 )O 3 -PbTiO 3 . Piezoelectric anisotropy is discussed in relation to temperature induced phase transitions, compositional variation in solid solutions with morphotropic phase boundaries, applied electric fields, the domain wall structure and domain wall displacement. C 2006 Springer Science + Business Media, Inc. 1. Introduction The anisotropy of elastic, dielectric and piezoelectric properties plays an important role in the application of piezoelectric materials. Several types of the anisotropy have been discussed in the literature, including the ori- entation dependence of the material coefficients and the difference in the values of the longitudinal, transverse and shear coefficients. The two best known examples are the temperature stabilized cuts of quartz [1] and LiNbO 3 crystals [2] where the temperature dependences of differ- ent elastic compliances compensate, leading to low tem- perature coefficients of resonant frequencies and acous- tic velocities. Anisotropy of piezoelectric properties was intensively studied in the 1980s when unusually strong piezoelectric anisotropy was found in lead titanate ceram- ics with random grain orientation [3]. In these materials, for example, the longitudinal d 33 coefficient behaves in the expected way whereas the transverse coefficient d 31 , which in most perovskite materials is negative and 2–4 times smaller than d 33 , can be close to zero or can even exhibit a positive sign [4]. Another example is the strong anisotropy of dielectric, elastic and piezoelectric prop- erties in textured ceramics of bismuth based Aurvillius structures [5]. The anisotropy of the elastic and piezo- electric properties is exploited in piezoelectric–ceramic composites with 1–3 connectivity to reduce lateral cou- pling in transducers for underwater and medical imaging applications [6]. Interest in the electromechanical anisotropy of fer- roelectric materials has been spectacularly renewed in the last several years after the (re)discovery [7, 8] of the large electromechanical coupling coeffi- cient k 33 (>90%) and longitudinal piezoelectric co- efficient d 33 (>2000 pC/N) measured along non- polar directions in relaxor-ferroelectric solid solu- tions [e.g., Pb(Mg 1/3 Nb 2/3 )O 3 -PbTiO 3 or PMN-PT and Pb(Zn 1/3 Nb 2/3 )O 3 -PbTiO 3 or PZN-PT]. The reason why this result was surprising can probably be found in the fact that the most widely used piezoelectric material over the last 50 years has been ceramic Pb(Zr,Ti)O 3 . Poled ceramics exhibit conical symmetry and their largest lon- gitudinal, transverse and shear piezoelectric responses are measured along the axes of the orthogonal coordinate sys- tem whose x 3 axis lies parallel to the poling (polar) direc- tion [9]. A maximum of the longitudinal piezoelectric re- sponse along nonpolar directions, as observed in relaxor- ferroelectrics, was therefore unexpected. However, sub- sequent studies have found that such behavior is common and has been reported in many perovskite crystals, both in those having simple compositions (e.g., BaTiO 3 [10] and KNbO 3 [11]) and in other complex solid solutions (e.g., BiScO 3 -PbTiO 3 [12] and Pb(Yb 1/2 Nb 1/2 )O 3 -PbTiO 3 [13]). Similar anomalies have been observed for the trans- verse and shear coefficients. In contrast to poled ceramics, the transverse coefficient is found to be largest in a plane that is not perpendicular to the polar direction. The shear 0022-2461 C 2006 Springer Science + Business Media, Inc. DOI: 10.1007/s10853-005-5925-5 65
Transcript of 41 Piezoelectric anisotropy: Enhanced piezoelectric ... · anisotropy of dielectric, elastic and...

FRONTIERS OF FERROELECTRICITY
J O U R N A L O F M A T E R I A L S S C I E N C E 4 1 (2 0 0 6 ) 6 5 –7 6
Piezoelectric anisotropy: Enhanced piezoelectric
response along nonpolar directions in perovskite
crystals
D. DAMJANOVIC, M. BUDIMIR, M. DAVIS, N. SETTERCeramics Laboratory, Materials Institute, Ecole Polytechnique Federale de Lausanne—EPFL,1015, Lausanne, SwitzerlandE-mail: [email protected]
This paper discusses the mechanisms that can contribute to the enhanced longitudinalpiezoelectric effect along nonpolar directions in perovskite crystals, such as BaTiO3, PbTiO3,KNbO3, Pb(Mg1/3Nb2/3)O3-PbTiO3 and Pb(Zn1/2Nb2/3)O3-PbTiO3. Piezoelectric anisotropy isdiscussed in relation to temperature induced phase transitions, compositional variation in solidsolutions with morphotropic phase boundaries, applied electric fields, the domain wallstructure and domain wall displacement. C© 2006 Springer Science + Business Media, Inc.
1. IntroductionThe anisotropy of elastic, dielectric and piezoelectricproperties plays an important role in the application ofpiezoelectric materials. Several types of the anisotropyhave been discussed in the literature, including the ori-entation dependence of the material coefficients and thedifference in the values of the longitudinal, transverseand shear coefficients. The two best known examples arethe temperature stabilized cuts of quartz [1] and LiNbO3
crystals [2] where the temperature dependences of differ-ent elastic compliances compensate, leading to low tem-perature coefficients of resonant frequencies and acous-tic velocities. Anisotropy of piezoelectric properties wasintensively studied in the 1980s when unusually strongpiezoelectric anisotropy was found in lead titanate ceram-ics with random grain orientation [3]. In these materials,for example, the longitudinal d33 coefficient behaves inthe expected way whereas the transverse coefficient d31,which in most perovskite materials is negative and 2–4times smaller than d33, can be close to zero or can evenexhibit a positive sign [4]. Another example is the stronganisotropy of dielectric, elastic and piezoelectric prop-erties in textured ceramics of bismuth based Aurvilliusstructures [5]. The anisotropy of the elastic and piezo-electric properties is exploited in piezoelectric–ceramiccomposites with 1–3 connectivity to reduce lateral cou-pling in transducers for underwater and medical imagingapplications [6].
Interest in the electromechanical anisotropy of fer-roelectric materials has been spectacularly renewedin the last several years after the (re)discovery [7,8] of the large electromechanical coupling coeffi-cient k33 (>90%) and longitudinal piezoelectric co-efficient d33 (>2000 pC/N) measured along non-polar directions in relaxor-ferroelectric solid solu-tions [e.g., Pb(Mg1/3Nb2/3)O3-PbTiO3 or PMN-PT andPb(Zn1/3Nb2/3)O3-PbTiO3 or PZN-PT]. The reason whythis result was surprising can probably be found in thefact that the most widely used piezoelectric material overthe last 50 years has been ceramic Pb(Zr,Ti)O3. Poledceramics exhibit conical symmetry and their largest lon-gitudinal, transverse and shear piezoelectric responses aremeasured along the axes of the orthogonal coordinate sys-tem whose x3 axis lies parallel to the poling (polar) direc-tion [9]. A maximum of the longitudinal piezoelectric re-sponse along nonpolar directions, as observed in relaxor-ferroelectrics, was therefore unexpected. However, sub-sequent studies have found that such behavior is commonand has been reported in many perovskite crystals, both inthose having simple compositions (e.g., BaTiO3 [10] andKNbO3 [11]) and in other complex solid solutions (e.g.,BiScO3-PbTiO3 [12] and Pb(Yb1/2Nb1/2)O3 -PbTiO3
[13]). Similar anomalies have been observed for the trans-verse and shear coefficients. In contrast to poled ceramics,the transverse coefficient is found to be largest in a planethat is not perpendicular to the polar direction. The shear
0022-2461 C© 2006 Springer Science + Business Media, Inc.DOI: 10.1007/s10853-005-5925-5 65

FRONTIERS OF FERROELECTRICITY
effect behaves oppositely and is the highest when the fieldis applied and response measured along the correspondingaxes of the crystallographic coordinate system [14, 15].As we shall see later these results are nontrivial as someimportant perovskites, like PbTiO3 [16], behave similarlyto ceramics, exhibiting highest piezoelectric effects alongthe axes of the crystallographic coordinate system.
While the origin of the large piezoelectric activity incrystals of complex solid solutions (e.g., PMN PT, PZN-PT) is still not clear, the related research has led to un-precedented activity in the field of ferroelectric materials,directly or indirectly leading to the discovery of the mon-oclinic phase in Pb(Zr,Ti)O3 [17], to the development oftextured ceramics with enhanced piezoelectric properties
[18], and to the renewed interest in the role of engineereddomain states on the electromechanical properties of fer-roelectric crystals. Interpretation of experimental resultsobtained on single crystals has been further complicatedby the fact that virtually all experimental data have beenreported for multidomain samples, and the role of theintrinsic anisotropy and the presence of the engineereddomain structure have not been separated.
In this article we shall discuss selected aspects of thepiezoelectric anisotropy in perovskite crystals, focusingon mechanisms that may contribute to the enhancementof the longitudinal d33 piezoelectric coefficient when mea-sured along nonpolar directions. The text is structured inthe following way. First, basic relations defining the ori-entation dependence of piezoelectric coefficients in thetetragonal 4mm, orthorhombic mm2, and rhombohedral3m point groups are given and briefly discussed in Sec-tion 2. The piezoelectric anisotropy is then discussed inSection 3 in relation to the proximity of ferroelectric-ferroelectric phase transitions, in Section 4 in terms ofcomposition in materials exhibiting a morphotropic phaseboundary, in Section 5 as a function of external electricfields, and in Section 6 in terms of the domain wall struc-ture. Finally the effects of the extrinsic contributions onthe electromechanical response are briefly discussed inSection 7.
2. Orientation dependenceof the piezoelectric coefficients
The piezoelectric coefficient is a tensor of the third rankthat can be transformed between two coordinate systemsusing the relation [19]:
d∗i jk(ϕ, θ, ψ) = aila jmakndlmn (1)
where ϕ, θ , ψ are the Euler angles and aij are the elementsof the Euler matrix that describes the rotation defined bythe Euler angles. In this text d is the tensor of piezoelec-tric coefficients in the crystallographic coordinate systemwith axis x1, x2 and x3, while the asterisk denotes the ten-sor in the rotated system. A caution is necessary whencomparing data from different sources since Euler anglesare not uniquely defined in the literature. Here we followthe definition of Euler angles given in Refs. [2 , 20] whereϕ describes the first counterclockwise rotation around thex3 axis, θ the second counterclockwise rotation aroundthe new x1 axis and ψ the third counterclockwise rotationaround the new x3 axis. The corresponding rotation matrixis:
a =
cos ψ cos ϕ − cos θ sin ϕ sin ψ cos ψ sin ϕ + cos θ cos ϕ sin ψ sin ψ sin θ
− sin ψ cos ϕ − cos θ sin ϕ cos ψ − sin ψ sin ϕ + cos θ cos ϕ cos ψ cos ψ sin θ
sin θ sin ϕ − sin θ cos ϕ cos θ
(2)
If another definition of the Euler angles is used, theterms in equations given below may have different signs[21, 22] and numerical coefficients. Furthermore, thepiezoelectric tensor is usually given in the form of a ma-trix with reduced indices using Voigt notation [19]. Amistake sometimes made in the literature is to use for thepiezoelectric d coefficients the reduced matrix of the thirdrank electro-optical tensors or the piezoelectric stress ten-sor e [23]. The reduced matrices for these tensors maydiffer from the matrix for the d tensor in the relationshipbetween the coefficients. For example, in point group 3min the reduced notation d26 = −2d11 but e26 = −e11 [24].
In this article we shall discuss only the orientation de-pendence of the longitudinal d33 piezoelectric coefficient.This coefficient has the simplest form and is the easiestto analyze, yet allows a point to be made about the mainfeatures of anisotropy that will be discussed. In the mostcommon symmetries and for the chosen definition of theEuler angles, the Equation 1 has the following forms:
in crystals belonging to the tetragonal 4 mm group:
dt∗33 (θ) = cos θ
(dt
15 sin2 θ + dt31 sin2 θ + dt
33 cos2 θ)
(3)
in the orthorhombic mm2 group:
do∗33 (θ, φ) = cos θ
[(do
15 + do31
)sin2 θ sin2 φ + (
do24
+ do32
)sin2 θ cos2 φ + do
33 cos2 θ)]
(4)
and in the rhombohedral 3m group:
dr∗33 (θ, φ) = dr
15 cos θ sin2 θ − dr22 sin3 θ cos 3φ
+ dr31 sin2 θ cos θ + dr
33 cos3 θ (5)
66

FRONTIERS OF FERROELECTRICITY
Figure 1 Illustration of longitudinal, transverse and shear piezoelectriceffects in a tetragonal material and piezoelectric ceramic. The dark regionsat the sample edges represent electrodes.
Indices t, o and r refer to the crystal symmetries. Inthe rest of the text terms ‘tetragonal’, ‘orthorhombic’ and‘rhombohedral’ will refer to point groups 4mm, mm2, and3m. Definitions of the longitudinal, transverse and shearcoefficients are given in Fig. 1.
3. Piezoelectric anisotropy in the proximity oftemperature inducedferroelectric-ferroelectric phase transitions
Let us consider BaTiO3 mono domain single crys-tals. This material is of interest since it under-goes a series of phase transitions (cubic→tetragonal→orthorhombic→rhombohedral) as it is cooled from theparaelectric phase [25]. These crystal phases are typicalof perovskite ferroelectrics and this fact, together with itschemical simplicity, makes BaTiO3 convenient for model-ing purposes. The temperature dependences of piezoelec-tric coefficients of BaTiO3 are experimentally availableonly for the tetragonal phase [26], however, the coef-ficients of the Gibbs free energy expansion are knownso that piezoelectric coefficients can be predicted as afunction of temperature in all three phases, as shown in
Figure 2 Temperature dependence of piezoelectric coefficients in all threeferroelectric phases of BaTiO3 predicted by the LGD theory. Parameters ofthe LGD function were taken from Ref. [27].
Figure 3 Orientation dependence of dt∗33(θ ) in the tetragonal phase of
BaTiO3 at two temperatures, close to the tetragonal-orthorhombic (upperfigure) and the tetragonal-cubic (lower figure) phase transition temperature.Numbers on axes indicate values of dt∗
33(θ ). The coordinate system indicatescrystallographic axes.
Fig. 2. The orientation dependence of piezoelectric coef-ficients, d∗
33 (θ, ϕ), can be calculated at any temperatureusing Equations 3–5, as discussed in Ref. [16]. Behaviorof d∗
33 (θ, ϕ) in the tetragonal, Fig. 3, and the orthorhom-bic, Fig. 4, phases illustrates how orientation dependencechanges with temperature and as the phase transition tem-peratures are approached.
The evolution of the dt∗33 (θ) surface near the tetragonal-
orthorhombic and the orthorhombic-rhombohedral phasetransitions temperatures can be analyzed and understoodon several levels. The simplest approach is by inspectingthe Equations 3–4 and Fig. 2 and by analyzing the compet-ing influences of the shear (term with sinθ) and the longi-tudinal (term with cosθ) piezoelectric coefficients, whileneglecting for simplicity the influence of the small trans-verse coefficient dt
31. In the tetragonal phase the dt∗33 (θ)
67
FRONTIERS OF FERROELECTRICITY
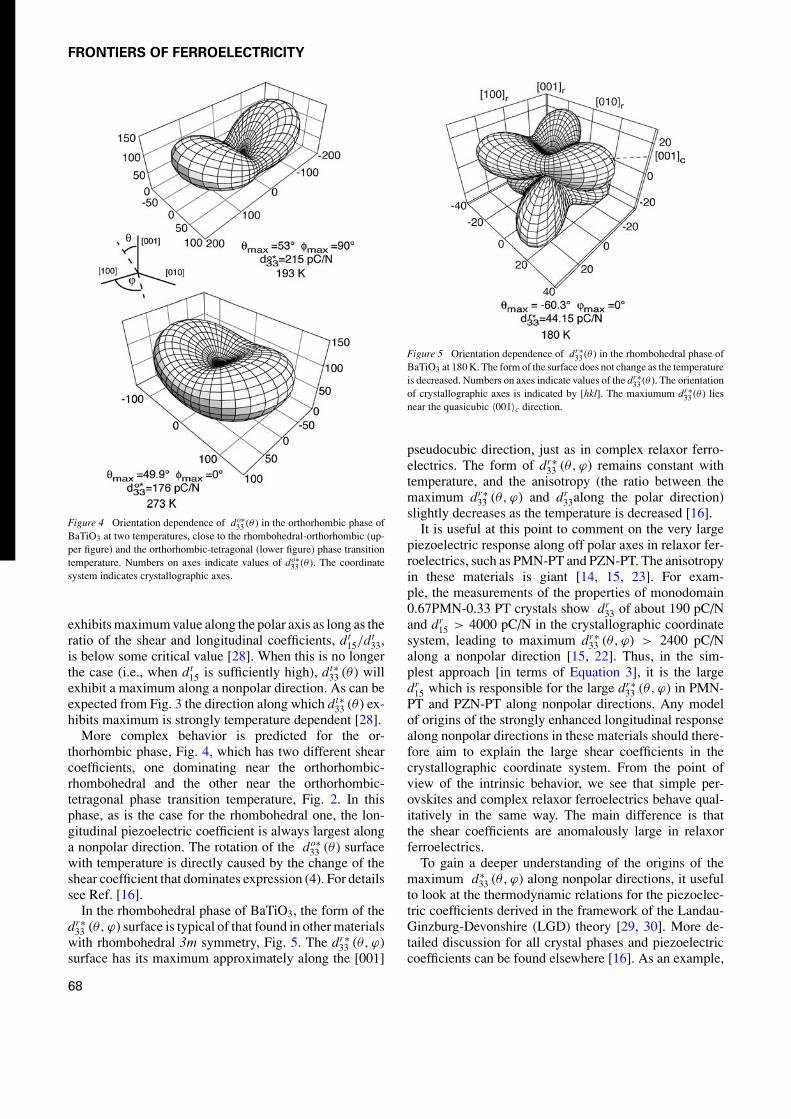
Figure 4 Orientation dependence of do∗33 (θ ) in the orthorhombic phase of
BaTiO3 at two temperatures, close to the rhombohedral-orthorhombic (up-per figure) and the orthorhombic-tetragonal (lower figure) phase transitiontemperature. Numbers on axes indicate values of do∗
33 (θ ). The coordinatesystem indicates crystallographic axes.
exhibits maximum value along the polar axis as long as theratio of the shear and longitudinal coefficients, dt
15/dt33,
is below some critical value [28]. When this is no longerthe case (i.e., when dt
15 is sufficiently high), dt∗33 (θ) will
exhibit a maximum along a nonpolar direction. As can beexpected from Fig. 3 the direction along which dt∗
33 (θ) ex-hibits maximum is strongly temperature dependent [28].
More complex behavior is predicted for the or-thorhombic phase, Fig. 4, which has two different shearcoefficients, one dominating near the orthorhombic-rhombohedral and the other near the orthorhombic-tetragonal phase transition temperature, Fig. 2. In thisphase, as is the case for the rhombohedral one, the lon-gitudinal piezoelectric coefficient is always largest alonga nonpolar direction. The rotation of the do∗
33 (θ) surfacewith temperature is directly caused by the change of theshear coefficient that dominates expression (4). For detailssee Ref. [16].
In the rhombohedral phase of BaTiO3, the form of thedr∗
33 (θ, ϕ) surface is typical of that found in other materialswith rhombohedral 3m symmetry, Fig. 5. The dr∗
33 (θ, ϕ)surface has its maximum approximately along the [001]
Figure 5 Orientation dependence of dr∗33 (θ ) in the rhombohedral phase of
BaTiO3 at 180 K. The form of the surface does not change as the temperatureis decreased. Numbers on axes indicate values of the dr∗
33 (θ ). The orientationof crystallographic axes is indicated by [hkl]. The maxiumum dr∗
33 (θ ) liesnear the quasicubic 〈001〉c direction.
pseudocubic direction, just as in complex relaxor ferro-electrics. The form of dr∗
33 (θ, ϕ) remains constant withtemperature, and the anisotropy (the ratio between themaximum dr∗
33 (θ, ϕ) and dr33along the polar direction)
slightly decreases as the temperature is decreased [16].It is useful at this point to comment on the very large
piezoelectric response along off polar axes in relaxor fer-roelectrics, such as PMN-PT and PZN-PT. The anisotropyin these materials is giant [14, 15, 23]. For exam-ple, the measurements of the properties of monodomain0.67PMN-0.33 PT crystals show dr
33 of about 190 pC/Nand dr
15 > 4000 pC/N in the crystallographic coordinatesystem, leading to maximum dr∗
33 (θ, ϕ) > 2400 pC/Nalong a nonpolar direction [15, 22]. Thus, in the sim-plest approach [in terms of Equation 3], it is the largedr
15 which is responsible for the large dr∗33 (θ, ϕ) in PMN-
PT and PZN-PT along nonpolar directions. Any modelof origins of the strongly enhanced longitudinal responsealong nonpolar directions in these materials should there-fore aim to explain the large shear coefficients in thecrystallographic coordinate system. From the point ofview of the intrinsic behavior, we see that simple per-ovskites and complex relaxor ferroelectrics behave qual-itatively in the same way. The main difference is thatthe shear coefficients are anomalously large in relaxorferroelectrics.
To gain a deeper understanding of the origins of themaximum d∗
33 (θ, ϕ) along nonpolar directions, it usefulto look at the thermodynamic relations for the piezoelec-tric coefficients derived in the framework of the Landau-Ginzburg-Devonshire (LGD) theory [29, 30]. More de-tailed discussion for all crystal phases and piezoelectriccoefficients can be found elsewhere [16]. As an example,
68

FRONTIERS OF FERROELECTRICITY
Figure 6 Predicted temperature dependence of dielectric susceptibilities inall three ferroelectric phases of BaTiO3.
only the tetragonal phase is considered here. The longitu-dinal and the shear coefficients can be expressed as:
dt15 = dt
24 = ε0ηt11 Q44 Pt
3 (6)
dt33 = ε0η
t33 Q11 Pt
3 (7)
where Q are the electrostrictive coefficients, P is the spon-taneous polarization and ε0 the permittivity of vacuum.The temperature dependences of the susceptibilities par-allel, ηt
33, and perpendicular, ηt11, to the polarization are
given in Fig. 6. The increase of the shear coefficient dt15 on
the tetragonal side of the tetragonal-orthorhombic phasetransition temperature is clearly caused by the anomalousbehavior of the ηt
11. In analogy to pretransitional behav-ior in the paraelectric phase where susceptibility followsthe Curie Weiss law and diverges as the cubic-tetragonalphase transition temperature is approached on cooling,the ηt
11 susceptibility in the tetragonal phase diverges asthe crystal is cooled toward the tetragonal-orthorhombicphase transition temperature. Note that it is the suscep-tibility ηt
11 and not ηt33 which is anomalous near the
tetragonal-orthorhombic phase transition temperature, an-ticipating the change in the polarization direction from the[001] axis in the tetragonal phase to the pseudocubic 〈011〉axes in the orthorhombic state. The large value of dt
15 andthe large dt
15/dt33 ratio, essential for having a maximum
of dt∗33(θ) along a nonpolar direction, then follow immedi-
ately from Equations 6, 7 and 3. Similar arguments can beinvoked for the orthorhombic and rhombohedral phases[16].
The association of the large dielectric susceptibilityperpendicular to the polarization with the large longitu-dinal response along nonpolar directions is in agreementwith the results of first principle calculations. These stud-ies interpret the enhanced piezoelectric coefficients alongoff-polar directions in perovskite materials by the largepolarization rotation induced by the strong external elec-tric fields [31, 32]. The above discussion shows that the
polarization rotation argument is valid in the weak fieldlimit as well: the large ηt
11 indicates enhanced polariza-tion rotation (dielectrically soft material), and the largepolarization rotation is indicative of the large shear piezo-electric coefficients [16] (see also Fig. 1). These resultsobtained by analyzing behavior of BaTiO3 are directly rel-evant to relaxor ferroelectrics, which exhibit huge shearcoefficients in the crystallographic coordinate system [14,15 , 22], and to Pb(Zr,Ti)O3 solid solution [33] (see Sec-tion 4).
In this context it is interesting to consider the be-havior of ferroelectric materials in the absence of anyferroelectric-ferroelectric phase transitions. In PbTiO3,which is believed to be tetragonal at all temperatures be-low the Curie temperature [34], the phenomenologicalcalculations and the experimental results [35, 36] showthat the anisotropy in ηt
11 and ηt33 is much weaker than in
the tetragonal BaTiO3 and that dt15 < dt
33 at all tempera-tures. The maximum d∗
33(θ) in this material appears thusalways along the polar direction [16 , 28]. Intriguingly,this is not the case for non-perovskite LiNbO3 that pos-sesses rhombohedral 3m symmetry below and 3m abovethe Curie temperature. At room temperature this crystalexhibits a d∗
33(θ, ϕ) surface characteristic of rhombohe-dral perovskites (similar to Fig. 5) with the maximumd∗
33(θ, ϕ) approximately along the [001] pseudocubic di-rection and not along the polar [111] pseudocubic axis. Incontrast to PbTiO3, the shear d15 coefficient in LiNbO3 ismuch larger than d33 [2]. This difference could be relatedto the crystal structure of LiNbO3 that can be consideredas a modified perovskite structure [37], but which maybe softer then the proper perovskite structure under shearfields. It would be interesting to see if there are any rhom-bohedral materials that exhibit the qualitative change ind∗
33(θ, ϕ) with temperature analogous to that predicted fortetragonal BaTiO3.
A further step in understanding the origins of the piezo-electric anisotropy in the framework of the phenomeno-logical thermodynamic theory is to analyze changes ofthe free energy function as the crystal is cooled throughthe successive phase transitions. The large longitudinalpiezoelectric effect along nonpolar directions can be re-lated to the flat Gibbs free energy G near the phase transi-tion temperatures, as shown in Fig. 7. In tetragonal phasepolarization is oriented along [001] axis, i.e., P3 �= 0, P1
= P2 = 0 while in the orthorhombic phase P3 = P2 �= 0,P1 = 0. In Fig. 7 the Gibbs energy is plotted as a functionof P2 for the same temperatures as in Fig. 3, and for P3
values corresponding to the minimum of G at each tem-perature and giving stable tetragonal phase. The free en-ergy becomes flatter as the tetragonal-orthorhombic phasetransition is approached on cooling, indicating incipientorthorhombic phase and onset of minima in G at P2 �=0 at lower temperatures. The flat G in the (100) planeindicates a large 1/ηi i = ∂2G
/∂ P2
i i.e., a large suscep-tibility η11 (=η22) along [100] and [010] axes (compare
69

FRONTIERS OF FERROELECTRICITY
Figure 7 Gibbs free energy for tetragonal BaTiO3 at T = 365 K and279 K (compare with Fig. 3). The energy is presented as a function ofpolarization P2 along [010] axis, with polarization P3 along [001] axisfixed at P3 = 0.267 C/m2 at T=279 K, and fixed at P3 = 0.242 C/m2
at T = 365 K. The minimum of G at P2 = 0 indicates stable tetragonalphase. The orthorhombic phase is obtained for P2 = P3. The flat energynear the orthorhombic-tetragonal phase transition temperature (T = 279 K)indicates large dielectric susceptibility ηt
11, (compare with Fig. 6) and easypolarization rotation in the P2-P3 plane.
with Fig. 6). As already discussed above, the large sus-ceptibility perpendicular to the polar direction signifiesenhanced polarization rotation and large shear piezoelec-tric coefficients (compare with Figs 2 and 6). A similarapproach can be also applied for the free energy evolu-tion as a function of the composition in solid solutions[38–42], and as a function of external fields [27]. An-other approach is to use first principle calculations, and toattempt to explain the dielectric, elastic and piezoelectricproperties of the perovskite structure in terms of ionic andelectronic contributions to polarization [31, 43–47].
4. Piezoelectric anisotropy-compositionrelationships in materials exhibiting amorphotropic phase boundary
The previous section discussed enhancement of the piezo-electric anisotropy as a function of the proximity of thephase transition temperatures. In analogy, one can expectto observe similar effects in the vicinity of the compo-sitionally driven phase changes in materials exhibiting amorphotropic phase boundary (MPB) [42]. Fig. 8 showsthe evolution of dt
33, dt31, and dt
15 piezoelectric coefficientsand ηt
11 and ηt33 dielectric susceptibilities in single crys-
tals of Pb(Zr,Ti)O3 (PZT) solid solution, as a function ofcomposition, on the tetragonal side of the MPB. In thisdiagram, which is derived using the LGD thermodynamicphenomenological theory, the MPB was chosen to appearat a 50:50 Ti/Zr ratio [48]. At compositions close to theMPB, where polarization changes direction from the [001]axis (tetragonal side) to the [111] quasicubic direction(rhombohedral side), dt
15 and ηt11 strongly increase, just
as in tetragonal BaTiO3 near the tetragonal-orthorhombicphase transition temperature (compare Fig. 8 with Figs 2and 6). Note that coefficients of the LGD function for PZT
Figure 8 Piezoelectric coefficients and dielectric susceptibilities inPb(Zr,Ti)O3 crystals calculated using the LGD theory as a function ofcomposition, for the tetragonal side of the morphotropic phase boundary.After [48].
are determined experimentally, that is, they are indepen-dent on the recent discovery of the monoclinic distortionin PZT, except in the region very close to the MPB whererhombohedral and tetragonal symmetries are assumed.Values of coefficients will change if measured more pre-cisely and if presence of the monoclinic phase was takeninto account, however, trends indicated in Figs 7 to 9should qualitatively remain the same, especially for com-positions not lying too close to the MPB.
While in the case of tetragonal PZT the dt15 fails to
reach a high enough value [28] to bring the maximumdt∗
33(θ) away from the [001] direction, the general tendencyis similar to that in the tetragonal BaTiO3, as illustratedin Fig. 9: as the Zr content increases and the crystal ap-proaches the MPB, the dt∗
33(θ) becomes flatter at the top,indicating tendency toward developing a local minimumalong the [001] axis and a maximum away from this di-rection. As mentioned above, it is very likely that thecoefficients of the Gibbs energy are not optimized in thecase of PZT and for this reason the maximum in the cal-culated dt∗
33(θ) is not obtained along a nonpolar directionat compositions very close to the MPB.
A similar tendency is calculated for the rhombohedralside of the MPB in PZT. Fig. 10 shows the dr∗
33 (θ, ϕ)surface and its cross section for two rhombohedal com-positions with Zr/Ti ratio 90/10 and 60/40, at room tem-perature. The composition 90/10, which lies well into therhombohedral side of the phase diagram, demonstrates areduced piezoelectric anisotropy with respect to the com-position 60/40 that is close to the MPB. Unfortunately,PZT crystals are not available and these theoretical pre-dictions cannot be verified experimentally. However, re-ports on the piezoelectric properties of highly texturedthin films do show a maximum in dr∗
33 (θ, ϕ) approximatelyalong the quasicubic [001] direction in 60/40 PZT com-position and not along the polar quasicubic [111] axis,as shown in Fig. 11 [49]. Note that the former orienta-tion also exhibits weaker nonlinearity with respect to the
70

FRONTIERS OF FERROELECTRICITY
Figure 9 On the left: orientation dependence of dt∗33(θ ) for Pb(Zr,Ti)O3 (PZT) at room temperature as a function of PbTiO3 (PT) concentration, on the
tetragonal side of the MPB. On the right: orientation dependence of dt∗33(θ ) for tetragonal BaTiO3 at different temperatures. Note similarities between dt∗
33(θ )at 60% PT in PZT and at 360 K in BaTiO3; and at 50% PT in PZT and at 332 K in BaTiO3. Data in both figures were calculated for mono domain singlecrystals using the LGD approach. LGD parameters for PZT were taken from Ref. [48].
Figure 10 Orientation dependence of dt∗33(θ, ϕ) for two rhombohedral compositions of PZT, one containing 90%PbZrO3 (PZ) and the other 60%PZ.
Cross section of the surfaces is shown in the bottom part of the figure. Note the reduced anisotropy in the composition with 90% PZ, which lies deep intorhombohedral part of the phase diagram. Dashed curve for this composition shows data magnified by factor three, for better comparison with the compositioncontaining 60% PZ. Data were calculated at room temperature, for mono domain single crystals using the LGD approach. The LGD parameters were takenfrom Ref. [48].
driving field amplitude, which is consistent with the smallcontribution of domain walls to the piezoelectric effect.(Sections 6 and 7).
5. Effect of external electric fieldson piezoelectric anisotropy
The effect of an electric field on the piezoelectric proper-ties of perovskite crystals has been recently examined inBaTiO3 by first principle calculations [31] and LGD the-
ory [27], and in PZT by first principle calculations [32].Results show that the application of the field along nonpo-lar directions enhances d∗
33(θ, ϕ) and other piezoelectriccoefficients. In the case of very large fields, the field in-duced phase transitions are accompanied by huge shearpiezoelectric coefficients, and thus a large d∗
33(θ, ϕ) alongnonpolar directions [32].
These results and the discussion in previous sectionssuggest that the enhanced d∗
33(θ, ϕ) along nonpolar direc-
71

FRONTIERS OF FERROELECTRICITY
Figure 11 The longitudinal piezoelectric coefficient in textured 60PZ/40PTthin films as a function of the driving electric field amplitude. The largestresponse is observed in films with [001]c preferential orientation, in qual-itative agreement with results predicted for single crystals. The relativelysmaller piezoelectric nonlinearity of the sample with [001]c orientation isconsistent with reduced contribution of domain walls for this orientation.For details see Ref. [49].
tions may be associated with instabilities related to incip-ient phase transitions, which are manifested by dielectricsoftening in directions perpendicular to the polarizationaxis. In this section we show that such instabilities maybe also induced by application of the electric field biasapplied antiparallel to polarization, leading to a huge en-hancement of the d∗
33(θ, ϕ).For simplicity, we again consider the tetragonal phase
of a mono domain BaTiO3 single crystal under electricbias field applied either along the polar axis [001] or anti-parallel to it, i.e. along the [001] direction. The effect ofthe field on the piezoelectric coefficients and susceptibil-ities is shown in Fig. 12. Calculation details can be foundin Ref. [50]. The orientation dependence of dt∗
33(ϑ) can becalculated using Equation 3 and is shown in Fig. 13 fordifferent bias fields at T = 285 K and 365 K. The d∗
33(ϑ)exhibits its maximum value for all bias fields at approxi-mately ϑmax ≈ 50◦, i.e. close to the [111] axis. The valueof dt∗
33(ϑmax) depends strongly on the bias field. For E3
= 0, dt∗33(ϑmax) = 227 pm/V. While positive bias fields
decrease dt∗33(ϑmax), the calculations predict that negative
bias fields (anti-parallel to polarization) strongly enhancethe piezoelectric coefficient. A field of −9 MV/m (appliedalong [001]) increases d∗
33(ϑmax) to 497 pm/V, which rep-resents more than a five fold increases with respect to thevalue measured along the polar axis at zero bias field [d∗
33(ϑ = 0◦) = d33 = 89 pm/V] and more than a two foldincrease with respect to the maximum value measured atE3 = 0 [ d∗
33(ϑ = 50◦) = 227 pm/V].The above results can be again understood by ana-
lyzing Equations 6–7 and the field dependences of thesusceptibilities and piezoelectric coefficients, shown inFig. 12. The negative bias fields strongly increase η11
and, consequently, lead to a high d15 coefficient, whichis then directly responsible for a maximum of d∗
33(ϑ)
Figure 12 (a) Dielectric suscpetibilities and (b)piezoelectric coefficients ofthe tetragonal BaTiO3 at two temperatures as a function of the electric fieldbias. The negative field is applied against the spontaneous polarization. Thefield dependence was calculated using the LGD theory. For details, see Ref.[50].
along a nonpolar direction. In contrast to earlier stud-ies where strong bias fields were always applied alongnonpolar directions, these results show that a weak-fieldpolarization rotation may be facilitated by application ofstrong bias fields anti-parallel to polarization. It has beenshown in Section 3 that the proximity of the tetragonal-orthorhombic phase transition temperature by itself leadsto a maximum dt∗
33(ϑmax) approximately along the [111]axis, however, we now show that this effect is enhancedconsiderably by anti-parallel bias fields.
Interesting results are also observed at higher tem-peratures, closer to the tetragonal-cubic phase transi-tion that occurs at 393 K. At these temperatures thecondition for having a maximum in dt∗
33(ϑmax) along anon-polar direction is not fulfilled [28] and the piezo-electric response exhibits its maximum value alongthe polar axis. The positive bias field decreases thepiezoelectric coefficient, similarly to what has been re-ported in ferroelectric thin films [51], while the negativefield enhances the piezoelectric response, Fig. 13. At E3
= −4 MV/m and at 365 K, the maximum d∗33(ϑ = 0) is
700 pm/V, compared to 268 pm/V at E3 = 0. Note thatthis field enhancement of the piezoelectric coefficient isnot related to the polarization rotation.
It is interesting to note the similarities among the tem-perature, composition and field dependences of the piezo-electric coefficients in Figs 2, 8 and 12. The common de-nominator for each case is the increase of the susceptbilityi.e., the dielectric softening of the crystal, perpendicularto the polarization. This in turn leads to an increase inthe shear piezoelectric coefficients and enhanced dt∗
33(ϑ)along nonpolar directions. As discussed above, the dielec-tric softening is the direct consequence of the flatteningof the Gibbs free energy.
72

FRONTIERS OF FERROELECTRICITY
Figure 13 Orientation dependence of dt∗33(θ ) for tetragonal BaTiO3 at two temperatures and for different electric fields applied along polarization (positive
fields) and antiparellel to polarization (negative fields). The field dependence was calculated using the LGD theory. For details, see Ref. [50].
Finally, one obtains similar effects under applied exter-nal stresses [52]. For example, calculations on thin filmsshow a large increase in the shear piezoelectric coeffi-cients due to misfit strains [53] which reflects on the ori-entation dependence of piezoelectric coefficients.
6. Effect of domain wall structure onpiezoelectric anisotropy
In previous sections we have discussed the orientationdependence of piezoelectric properties assuming that thecrystal is in the mono domain state. Practically, the monodomain state is difficult to achieve in obliquely cut crys-tals, and in relaxor ferroelectrics the monodoman stateappears to be unstable [14]. When a crystal is cut andpoled along special directions so that the resulting do-main states are equivalent and the piezoelectric proper-ties are enhanced, the resulting domain structure is oftencalled the “engineered domain state” [7]. Clearly there canbe more than one “engineered domain state” for a givensymmetry. In tetragonal crystals with polarization alongthe [001] axis, one of these states is obtained by polingthe crystal along one of the 〈111〉 axes. In rhombohedralmaterials with polarization along the 〈111〉 quasicubicdirections, an engineered domain state can be obtainedby poling the crystal along the [001] quasicubic axis. Inthis case, four equivalent domain states are defined bypolarization vectors oriented along the four equivalentquasicubic directions: [111], [111], [111] and [111], andare shown in Fig. 14. With respect to an electric fieldapplied along the poling direction, i.e. along the [001]quasicubic axis, these rhombohedral domain states areenergetically equivalent and the associated domain wallsare expected to be stable. Likewise, this rhombohedraldomain-engineered state should be stable to stress: uniax-ial pressure applied along the [001] psuedocubic directionwill not favor any one of the four domain states.
The question is posed whether the high properties inpoled relaxor ferroelectric crystals are a simple conse-
Figure 14 Schematic representation of the equivalent polarization direc-tions in a rhombohedral 3m crystal poled along quasicubic [001]c direction.For more examples and discussion see Ref. [54].
quence of the material anisotropy, or whether the “engi-neered domain state” somehow further enhances the prop-erties along nonpolar directions beyond what is expectedfrom the intrinsic anisotropy. Considering the equivalenceof the engineered domain states, the associated domainwalls should be immobile and should not contribute tothe piezoelectric properties. An indication that this is in-deed so is found in the anhysteretic converse piezoelectricresponse of relaxor ferroelectric single crystals with en-gineered domain states (see [7] and Section 7) and in thereduced nonlinearity of piezoelectric properties in highlytextured thin films, Fig. 11 [49].
This question was first addressed by Nakamura et al.[11, 55]. They showed that in tetragonal BaTiO3 and or-thorhombic KNbO3 crystals the piezoelectric response incrystals with an engineered domain state is approximatelythe same as in mono domain crystals cut and measuredalong the same direction. Later, the same was shown [15,22] for 0.67Pb(Mg1/3Nb2/3)O3-0.33PbTiO3 crystals al-though this case is perhaps more controversial. Firstly, asa function of preparation and poling conditions, this lattercomposition can exhibit several different crystal struc-tures [56] and secondly, in order to stabilize the mono
73

FRONTIERS OF FERROELECTRICITY
domain state, the properties of the crystal had to be mea-sured under an electric bias field [15]. It is interesting tonote that in all cases mentioned above the response ofmonodomain samples along the nonpolar directions wascalculated and not measured.
Only recently, Wada et al. [54, 57] have carried out asystematic study of effects of engineered domain structureon properties of perovskite crystals. They showed that inBaTiO3 and KNbO3 crystals the transverse piezoelectricresponse of crystals with an engineered domain structuredepends on the density of domain walls, while the domainstructure remains the same. The piezoelectric d31 coeffi-cient of crystals with a coarse domain structure are similarto those of monodomain crystals measured along the samecrystallographic direction. However, as the domain struc-ture becomes finer, the response of the multidoman crystalbecomes significantly higher than that of the monodomainsample. Considering the supposed equivalence of the do-main states in crystals with engineered domain states thisresult, while significant, is unexpected and puzzling.
It is interesting to speculate about possible origins ofthe enhancement of piezoelectric response in crystals withdense, engineered domain walls if the contribution of do-main wall displacement is, as usually assumed, excluded.One possibility is that as the number of domain walls in-creases, the material within the domains is no longer thesame, i.e. its properties are different to those of the monodomain crystal or coarse-structured material. This canhappen because with a denser domain wall structure thecompensation of charges or stresses at the domain walls[58] may require more material to be involved in the com-pensation process; alternatively, internal fields associatedwith the compensation process may be stronger in crys-tal with finer domains. The previous sections have shownthat antiparallel electric fields can enhance the intrinsicanisotropy. Additionally, the domain walls present, in asense, a phase transition between two states; again, thetransition related instabilities, discussed in previous sec-tions, may lead to enhanced dielectric and piezoelectricproperties.
7. Piezoelectric anisotropy and domain walldisplacement
One of the most interesting features of crystals with “en-gineered domain states” is the absence of hysteresis in thepiezoelectric strain-electric field relation, as illustrated inFig. 15 for a rhombohedral crystal with nominal com-position 0.67PMN-0.33PT. In ferroelectric materials thestrain-electric field hysteresis is usually associated withthe movement of domain walls. As mentioned in the pre-vious section, in tetragonal and rhombohedral crystalswith the special engineered domain structure the domainwalls are not expected to move and their response shouldtherefore be anhysteretic, as shown in Fig. 15.
Figure 15 Anhysteretic strain-electric field relation in a 0.67PMN-0.33PTcrystal poled and measured with unipolar field applied along the [001]pseudocubic direction.
It has, however, been reported that the strain-electricfield relationship becomes hysteretic under uniaxial com-pressive stress [59], indicating a possible contributionfrom the moving domain walls. This fact does put intodoubt the widely accepted picture, Fig. 14, of the engi-neered domain structure with equivalent sets of domainwalls whose motion will not lead to sample size change.Note that, in the first approximation, the associated do-main structure should be insensitive to both uniaxial pres-sure and electric field applied along the [001] quasicubicdirection.
An investigation of the direct piezoelectric effect [60]has shown that in several compositions of PZN-PT andPMN-PT crystals poled along the [001] quasicubic ori-entation the longitudinal piezoelectric charge-force re-sponse is hysteretic and nonlinear, Fig. 16. Pressed crys-tals will even (partially) depole at sufficient uniaxialstresses. These experimental results may again be in-compatible with the simple, usually assumed picture ofthe engineered domain structure. One can speculate thatthe absence of hysteresis in the converse effect may notnecessarily be due to the presence of energetically equiv-alent engineered domain states, but rather due to pinneddomain walls, which can be released by uniaxial compres-sive field, but not by unipolar electric field applied alongthe poling direction. If this is true then the simple pictureof equivalent domain states no longer holds, and the actualdomain wall structure in crystals with engineered domainstates is more complex than is usually assumed.
Interestingly, in some cases (e.g., 0.68PMN-0.32PT and0.045PZN-0.955PT) it was observed that the direct trans-verse piezoelectric response could be anhysteretic evenwhen the longitudinal response is hysteretic, Fig. 17. Thedifference between the two cases is that in the transverseresponse the compressive static and dynamic pressures areapplied perpendicular to the poling direction, whereas in
74

FRONTIERS OF FERROELECTRICITY
Figure 16 (a) Hysteretic charge density-stress relation and (b) field dependence of the piezoelectric coefficient in 0.67PMN-0.33PT single crystal poledand measured along the [001] quasicubic axis. For details see Ref. [60].
Figure 17 (a) Anhysteretic charge density-stress response for the transverse (d31) mode, and (b) hysteretic charge-stress response for the longitudimal (d33)mode in 0.68PMN-0.32PT crystals poled along [001] quasicubic axis. The diagram within each figure shows schematically direction of applied dynamicstress and presumed polarization rotation. Irrespective of the applied compressive stress, the slope of the charge-stress response is chosen to illustrate thepositive sign of the d33 and negative sign of the d31 coefficient. For details, see Ref. [60].
the longitudinal response the pressure is applied alongthe quasicubic [001] poling axis. Such stresses in thetransverse response will rotate the polarization vectorstoward the poling direction, therefore having the same ac-tion as an electric field applied along the [001] axis. Inthe longitudinal case, however, compressive stresses willrotate polarization vectors away from the poling direc-tion (see diagrams in Fig. 17). In either case the rotationdirection, or indeed the rotation path, appears to be im-portant. This apparent anisotropy in the extrinsic piezo-electric behavior should be verified for other perovskitematerials.
8. ConclusionsIntrinsic piezoelectric anisotropy, manifest in the strongorientation dependence of the piezoelectric coefficients,is present in many simple and complex perovskites. Theanisotropy can be associated to instabilities in crystals,
either near temperature induced phase transitions, phasechanges at the morphotropic phase boundary, or under ex-ternal fields. In crystals with engineered domain states, theanisotropy can be dominated by the intrinsic anisotropy ofthe monodomain crystals if the domain structure is coarse.However, it appears that the anisotropy can be further en-hanced when the poled crystal possesses a fine engineereddomain structure.
The usual picture of the simple domain structure incrystals with engineered domain state and immobile do-main walls appears to be questionable. Under externalcompressive pressure both the longitudinal converse andthe direct piezoelectric effect become hysteretic suggest-ing that the domain walls are mobile. In contrast, thestress-free converse piezoelectric effect with a unipolarelectric field applied along the poling axis, and, at leastin some cases, the direct piezoelectric transverse effectwhere compressive pressure is applied in a direction per-pendicular to the poling axis, are anhysteretic.
75

FRONTIERS OF FERROELECTRICITY
References1. J . C . B R I C E , Rev. Mod. Phys. 57 (1985) 105.2. T. I K E DA , “Fundamentals of piezoelectricity” (Oxford Unversity
Press, Oxford, 1990).3. H . TA K E U C H I , S . J YO M U R A, E . YA M A M OTO and Y. I TO ,
J. Acoust. Soc. Am. 72 (1982) 1114.4. D . DA M JA N OV I C , T. R . G U RU R A JA and L . E . C RO S S , Am.
Ceram. Soc. Bull. 66 (1987) 699.5. T. TA K E NA K A, K. S A K ATA and K. TO DA , Jpn. J. Appl. Phys.
24 (1985) 730.6. R . N E W N H A M, D. P. S K I N N E R and L . E . C RO S S , Mat. Res.
Bull. 13 (1978) 52.7. S . E . PA R K and T. R . S H RO U T , J. Appl. Phys. 82 (1997) 1804.8. J . K U WATA, K. U C H I N O and S . N O M U R A , Jpn. J. Appl. Phys.
21 (1982) 1298.9. M. K A H N, R. P. I N G E L and D. L E W I S I I I , Ferroelectrics 102
(1990) 225.10. S . WA DA, S . S U Z U K I , T. N O M A, T. S U Z U K I , M. O S-
A DA, M. K A K I H A NA, S . -E . PA R K, L . E . C RO S S and T .R . S H RO U T , Jpn. J. Appl. Phys. 38 (1999) 5505.
11. K . NA K A M U R A, T. TO K I WA and Y. K AWA M U R A , J. Appl.Phys. 91 (2002) 9272.
12. S . Z H A N G, C. A. R A N DA L L and T. R . S H RO U T , ibid. 95(2004) 4291.
13. S . Z H A N G, P. W. R E H R I G, C . A. R A N DA L L and T. R .S H RO U T , J. Crystal Growth 234 (2002) 415.
14. R . Z H A N G, B. J I A N G and W. C AO , Appl. Phys. Lett. 82 (2003)787.
15. Idem. ibid. 82 (2003) 3737.16. M. B U D I M I R , D. DA M JA N OV I C and N. S E T T E R , J.
Appl.Phys. 74 (2003) 6753.17. B . N O H E DA, D. E . C OX, G. S H I R A N E, J . A . G O N Z A L O,
L . E . C RO S S and S . -E . PA R K , Appl. Phys. Lett. 74 (1999) 2059.18. E . M. S A B O L S K Y, A. R . JA M E S, S . K W O N, S .
T RO L I E R-M C K I N S T RY and G. L . M E S S I N G , ibid. 78 (2001)2553.
19. J . F. N Y E , “Physical Properties of Crystals,” (Oxford University,Oxford, 1985).
20. H . G O L D S T E I N , “Classical Mechanics,” (Addison-Wesley, Read-ing, MA, 1978).
21. D . DA M JA N OV I C , M. B U D I M I R , M. DAV I S and N. S E T-T E R , Appl. Phys. Lett. 83 (2003) 2490.
22. Idem. ibid. 83 (2003) 527.23. S . Z H A N G, L . L AU R E N T, S . L I U , S . R H E E, C . A. R A N-
DA L L and T. R . S H RO U T , Jpn. J. Appl. Phys. 41 (2002) L1099.24. Y. I . S I ROT I N and M. P. S H A S KO L S K AYA , “Fundamentals of
crystal physics,” (Mir, Moscow, 1982).25. M. E . L I N E S and A. M. G L A S S , “Principles and Applications of
Ferroelectrics and Related Materials,” (Clarendon, Oxford, 1979).26. A . G A R C I A and D. VA N D E R B I LT , Appl. Phys. Lett. 72 (1998)
2981.27. A . J . B E L L , J. Appl. Phys. 89 (2001) 3907.28. D . DA M JA N OV I C , F. B R E M and N. S E T T E R , Appl. Phys. Lett.
80 (2002) 652.29. A . F. D E VO N S H I R E , Phil. Mag. 40 (1949) 1040.30. Idem., ibid. 42 (1951) 1065.31. H . F U and R. E . C O H E N , Nature 403 (2000) 281.32. L . B E L L A I C H E, A. G A R C I A and D. VA N D E R B I LT , Phys.
Rev. B 64 (2001) 060103.
33. R . G U O, L . E . C RO S S , S . -E . PA R K, B . N O H E DA,D. E . C OX and G. S H I R A N E , Phys. Rev. Lett. 84 (2000)5423.
34. J . KO BAYA S H I , Y. U E S U and Y. S A K E M I , Phys. Rev. B 28(1983) 3866.
35. M. J . H AU N, E . F U R M A N, S . J . JA N G, H. A.M C K I N S T RY and L . E . C RO S S , J. Appl. Phys. 62 (1987)3331.
36. Z . L I , M. G R I M S D I T C H, X. X U and S . -K. C H A N , Ferro-electrics 141 (1993) 313.
37. J . M. H E R B E RT , “Ferroelectric Transducers and Sensors,” (Gordonand Breach, New York, 1982) Vol. 3.
38. Y. I S H I BA S H I and M. I WATA , Jpn. J. Appl. Phys. 37 (1998) L985.39. Y. I S H I BA S H I and M. I WATA , Japanese Journal of Applied
Physics Part 1-Regular Papers Short Notes & Review Papers 38 (1999)800.
40. M. I WATA and Y. I S H I BA S H I , Jpn. J. Appl. Phys. Part 1 38(9B),(1999) 5670.
41. M. I WATA and Y. I S H I BA S H I , Japanese Journal of AppliedPhysics Part 1-Regular Papers Short Notes & Review Papers 39 (2000)5156.
42. M. I WATA, H. O R I H A R A and Y. I S H I BA S H I , Ferroelectrics266 (2002) 57.
43. D . VA N D E R B I LT , ibid. 301 (2004) 9.44. L . B E L L A I C H E, A. G A R C I A and D. VA N D E R B I LT , Phys.
Rev. Lett. 84 (2000) 5427.45. L . B E L L A I C H E and D. VA N D E R B I LT , ibid. 83 (1999)
1347.46. G . S AG H I-S Z A B O and R. E . C O H E N , Ferroelectrics 194 (1997)
287.47. R . E . C O H E N , Nature 358 (1992) 136.48. M. J . H AU N, E . F U R M A N, S . J . JA N G and L . E . C RO S S ,
Ferroelectrics 99 (1989) 63.49. D . V. TAY L O R and D. DA M JA N OV I C , Appl. Phys. Lett. 76 (2000)
1615.50. M. B U D I M I R , D. DA M JA N OV I C and N. S E T T E R , ibid. 85
(2004) 2890.51. L . C H E N, V. NAG A R A JA N, R . R A M E S H and A. L . ROY T-
B U R D , J. Appl. Phys. 94 (2003) 5147.52. M. B U D I M I R , D. DA M JA N OV I C and N. S E T T E R , (2005)
Unpublished.53. V. G . KO U K H A R, N. A. P E RT S E V and R. WA S E R , Phys.
Rev. B 64 (2001) 214103.54. S . WA DA, H. K A K E M OTO and T. T S U RU M I , Mater. Trans.
45 (2004) 178.55. K . NA K A M U R A, T. TO K I WA and Y. K AWA M U R A , in “Pro-
ceedings of the 12th IEEE International Symposium on the Applicationsof Ferroelectrics,” (IEEE Service Center, Honolulu, 2000) Vol. II, pp.717.
56. Y. L U, D.-Y. J E O N G, Z . -Y. C H E N G, Q. M. Z H A N G, H.-S . L U O, Z . -W. Y I N and D. V I E H L A N D , Appl. Phys. Lett. 78(2001) 3109.
57. S . WA DA, K. M U R AO K A, H. K A K E M OTO, T. T S U RU M I
and H. K U M AG A I , Jpn. J. Appl. Phys. 43 (2004) in print.58. V. Y. TO P O L OV , J. Phys.-Cond. Matter 16 (2004) 2455.59. D . V I E H L A N D, L . E WA RT, J . P OW E R S and J . F. L I , J.
Appl. Phys. 90 (2001) 2479.60. M. DAV I S , D . DA M JA N OV I C and N. S E T T E R , J. Appl. Phys.
95 (2004) 5679.
76