4.1 Introduction - City of Yelm GSP. This section identifies treatment alternatives that may...
42
4-1 Use of contents on this sheet is subject to the limitations specified at the end of this document. F_Section 4 WRF.docx Section 4 Water Reclamation Facility This section evaluates existing conditions and future needs of the WRF per operating conditions from January 2006 to November 2011. 4.1 Introduction This section evaluates existing conditions and future needs related to the treatment of wastewater at the City of Yelm WRF. Estimates of future needs are based on projections of increased demands due to growth within the sewer system as discussed in Section 2. The analyses presented in this section are for the growth scenario that does not include service to the Thurston Highlands MPC. In addition, this section describes management of residual solids from the WRF treatment processes and the STEP collection system. Finally, continued discharge of treated wastewater via existing surface water discharges is evaluated. Treatment capacity analyses in this section focus on existing and future treatment capacity with respect to meeting permitted discharge limits for projected loading conditions. The WRF has not consistently produced reclaimed water since 2010 due to problems meeting the total nitrogen permit limits for reuse. Therefore, the City elected to complete process modeling to help determine the cause of insufficient denitrification occurring at the WRF and to estimate the remaining treatment capacity of the WRF with respect to nitrogen removal. Analysis of the modeling results identified a number of improvements to provide more reliable reclaimed water production in the short term (next 3–5 years). Long-term WRF improvements that will be necessary to increase WRF treatment capacity to meet increased demands due to growth will be evaluated in a separate Facilities Plan to be prepared after completion of this GSP. This section identifies treatment alternatives that may potentially be evaluated in the Facilities Plan, and describes how these alternatives relate to the City’s goals for providing treatment capacity and continued production of Class A reclaimed water. The alternatives for long-term WRF improvements described here are preliminary and will need to be reviewed and further developed as part of the future facilities planning effort. Individual components of this section are summarized as follows: • Section 4.2. Permit Requirements: Existing discharge limits and criteria for maintaining treatment capacity, as stated in the current NPDES permit, are summarized for reclaimed water distribution and surface water disposal. • Section 4.3. WRF Design Criteria: Design criteria for the existing WRF are summarized, based upon evaluation of several planning and design documents. As this GSP was being prepared, it was determined that the design criteria in the existing NPDES permit for the WRF do not reflect the actual design criteria as documented on the WRF record drawings. • Section 4.4. Existing Facility Inventory and Condition Assessment: Discussion of individual WRF treatment components and/or systems, including design criteria, operational strategy, and potential design deficiencies. • Section 4.5. WRF Performance: Evaluation of influent/effluent data for the period between January 2006 and December 2011, and comparison to NPDES permit limits. • Section 4.6. Projected Flows and Loads: Comparison of the projected flows and loads from Section 2 to the WRF design criteria summarized in Section 4.3.
-
Upload
phungthuan -
Category
Documents
-
view
215 -
download
1
Transcript of 4.1 Introduction - City of Yelm GSP. This section identifies treatment alternatives that may...

4-1
Use of contents on this sheet is subject to the limitations specified at the end of this document. F_Section 4 WRF.docx
Section 4
Water Reclamation Facility This section evaluates existing conditions and future needs of the WRF per operating conditions from January 2006 to November 2011.
4.1 Introduction This section evaluates existing conditions and future needs related to the treatment of wastewater at the City of Yelm WRF. Estimates of future needs are based on projections of increased demands due to growth within the sewer system as discussed in Section 2. The analyses presented in this section are for the growth scenario that does not include service to the Thurston Highlands MPC. In addition, this section describes management of residual solids from the WRF treatment processes and the STEP collection system. Finally, continued discharge of treated wastewater via existing surface water discharges is evaluated.
Treatment capacity analyses in this section focus on existing and future treatment capacity with respect to meeting permitted discharge limits for projected loading conditions. The WRF has not consistently produced reclaimed water since 2010 due to problems meeting the total nitrogen permit limits for reuse. Therefore, the City elected to complete process modeling to help determine the cause of insufficient denitrification occurring at the WRF and to estimate the remaining treatment capacity of the WRF with respect to nitrogen removal. Analysis of the modeling results identified a number of improvements to provide more reliable reclaimed water production in the short term (next 3–5 years).
Long-term WRF improvements that will be necessary to increase WRF treatment capacity to meet increased demands due to growth will be evaluated in a separate Facilities Plan to be prepared after completion of this GSP. This section identifies treatment alternatives that may potentially be evaluated in the Facilities Plan, and describes how these alternatives relate to the City’s goals for providing treatment capacity and continued production of Class A reclaimed water. The alternatives for long-term WRF improvements described here are preliminary and will need to be reviewed and further developed as part of the future facilities planning effort.
Individual components of this section are summarized as follows: • Section 4.2. Permit Requirements: Existing discharge limits and criteria for maintaining treatment
capacity, as stated in the current NPDES permit, are summarized for reclaimed water distribution and surface water disposal.
• Section 4.3. WRF Design Criteria: Design criteria for the existing WRF are summarized, based upon evaluation of several planning and design documents. As this GSP was being prepared, it was determined that the design criteria in the existing NPDES permit for the WRF do not reflect the actual design criteria as documented on the WRF record drawings.
• Section 4.4. Existing Facility Inventory and Condition Assessment: Discussion of individual WRF treatment components and/or systems, including design criteria, operational strategy, and potential design deficiencies.
• Section 4.5. WRF Performance: Evaluation of influent/effluent data for the period between January 2006 and December 2011, and comparison to NPDES permit limits.
• Section 4.6. Projected Flows and Loads: Comparison of the projected flows and loads from Section 2 to the WRF design criteria summarized in Section 4.3.

Section 4 City of Yelm General Sewer Plan
4-2
Use of contents on this sheet is subject to the limitations specified at the end of this document. F_Section 4 WRF.docx
• Section 4.7. Surface Water Disposal Analysis: Evaluate compliance with surface water quality standards and establish anticipated effluent quality limitations for future surface water discharges.
• Section 4.8. Treatment Capacity Assessment: Review of process modeling analyses to determine the cause of recent treatment deficiencies and estimate WRF treatment capacity.
• Section 4.9. Planned Improvements for Reliability (Short Term): Identify short-term improvements at the WRF to provide more reliable reclaimed water production. Analyses of improvements are supported by a BCE of the potential alternatives.
• Section 4.10. Plan for Long-Term Capacity: Identify alternatives for long-term improvements to provide increased capacity for future growth demands. Long-term improvements will be discussed in detail in a Facilities Plan prepared after completion of this GSP. The preparation of the Facilities Plan is identified as a CIP project in Section 9.
• Section 4.11. Solids Management Plan: Describe existing solids management procedures and evaluate potential alternatives for future solids handling and disposal.
4.2 Permit Requirements The Yelm sewer system (including reclaimed water production and distribution) is regulated jointly by Ecology and Health under NPDES and State Reclaimed Water Discharge Permit WA0040762. The NPDES permit includes discharge limits, reclaimed water quality criteria, WRF design criteria and treatment capacity requirements, monitoring requirements, and other requirements related to operation, maintenance, and administration of the sewer system. The following sections summarize the permit requirements relevant to analysis of the WRF in this GSP.
The most recent version of the NPDES permit and accompanying Fact Sheet (effective date August 1, 2011) provide background information for the WRF and document past Ecology analyses; both documents are provided in Appendix 1A.
4.2.1 Effluent Discharge Limits The permit allows up to 1.0 mgd (maximum month flow) of discharge to one of three locations: the reclaimed water system, the Centralia Power Canal, or the Nisqually River. Section 4.4.1 describes conditions under which each of the discharge locations is used. Water quality permit limits for each of the discharge locations are summarized in Table 4-1.
The most restrictive permit limits are the effluent limits pertaining to nitrogen. Nitrogen is a principal component of amino acids and proteins, and enters the City’s STEP system through organic matter, such as human waste and food remnants. The nitrogen in the organic matter is broken down into ammonia in individual STEP tanks. When discharged from the STEP tanks and conveyed to the WRF in influent, nitrogen is primarily in the form of ammonia, ammonium, and organic nitrogen.
At the WRF, nitrogen is removed from sewage in a two-step process in the SBRs. During the first stage of the process, called nitrification, bacteria convert the ammonia in plant influent to nitrite and nitrate. When the WRF is discharging to the Centralia Power Canal or the Nisqually River, this is the only required step in the nitrogen removal process. The current NPDES permit requires that the ammonia be reduced to at least 3 mg/L (monthly average) when discharging to the Power Canal or River. Effluent being discharged to the Power Canal or River is required to be tested for ammonia at least monthly.

City of Yelm General Sewer Plan Section 4
4-3
Use of contents on this sheet is subject to the limitations specified at the end of this document. F_Section 4 WRF.docx
Table 4-1. Summary of NPDES Permit Limits Parameter Effluent limit at outfall 1: reclaimed water
BOD 30 mg/L monthly average
TSS 30 mg/L monthly average
Dissolved oxygen Shall be measurably present in discharge at all times
pH Shall be between 6.0 and 9.0 on a daily basis
Total coliform bacteria 2.2 per 100 mL 7-day average; 23 per 100 mL sample maximum
Turbidity 2 NTU monthly average; 5 NTU sample maximum
Total nitrogen (sum of TKN, nitrite, and nitrate) 10 mg/L monthly average; 15 mg/L daily maximum
Parameter Effluent limit at outfall 2: Centralia Power Canal BOD 30 mg/L and 85% removal monthly average; 45 mg/L weekly average
TSS 30 mg/L and 85% removal monthly average; 45 mg/L weekly average
Fecal coliform bacteria 100 per 100 mL monthly average; 200 per 100 mL weekly average
pH Shall be between 6.0 and 9.0 on a daily basis
Total residual chlorine (mg/L) 0.5 mg/L monthly average; 0.75 mg/L weekly average
Total ammonia (mg/L) 3 mg/L monthly average; 4.5 mg/L weekly average
Parameter Effluent limit at outfall 3: Nisqually River BOD 30 mg/L and 85% removal monthly average; 45 mg/L weekly average
TSS 30 mg/L and 85% removal monthly average; 45 mg/L weekly average
Fecal coliform bacteria 100 per 100 mL monthly average; 200 per 100 mL weekly average
pH Shall be between 6.5 and 9.0 on a daily basis
Total ammonia (mg/L) 3 mg/L monthly average; 4.5 mg/L weekly average
Total residual chlorine (mg/L) 0.047 mg/L monthly average; 0.124 mg/L maximum day
Total lead (µg/L) 10 µg/L monthly average; 15 µg/L maximum day
If the WRF is discharging to the reclaimed water distribution system, then denitrification is also required. During this process, which also occurs in the SBRs, bacteria convert the nitrate to nitrogen gas, which is then released to the atmosphere. The current NPDES permit requires that for reclaimed water the total nitrogen, which is a sum of nitrite, nitrate, and TKN (organic nitrogen and ammonia), be less than or equal to (≤) 10 mg/L.
The different processes and compounds related to effluent discharge limits that are discussed in this GSP are described in Table 4-2.
The WRF has consistently met all of its discharge permit limits with the exception of the total nitrogen and ammonia limits. Recent plant performance is described in Section 4.5.

Section 4 City of Yelm General Sewer Plan
4-4
Use of contents on this sheet is subject to the limitations specified at the end of this document. F_Section 4 WRF.docx
Table 4-2. Summary of Processes and Compounds Relevant to Effluent Discharge Limits
Process or compound Definition
Total Kjeldahl nitrogen (TKN) Sum of the nitrogen in wastewater for ammonia (NH3) and organic nitrogen compounds. Typically, most organic nitrogen is converted to ammonia in the collection system.
TKN = NH3 + organic nitrogen
Ammonia (NH3) Primary nitrogen-containing compound in the influent wastewater to the WRF. The NPDES permit limit for ammonia in treated wastewater discharged to the Centralia Power Canal and Nisqually River is 3 mg/L.
Nitrate (NO3) and nitrite (NO2) Compounds that are produced when ammonia is “nitrified.”
Nitrification Conversion of ammonia, first to nitrite (NO2) and then to nitrate (NO3). Nitrification requires aerobic conditions (presence of dissolved oxygen) and sufficient alkalinity to proceed.
NH3 NO2 NO3
Nitrogen (N2) Nitrogen gas (N2) is produced when nitrate is “denitrified.”
Denitrification Conversion of nitrate (NO3) to nitrogen gas (N2). Requires low dissolved oxygen (anoxic) conditions and the presence of sufficient carbon (food source) to proceed.
NO3 N2
Total nitrogen Sum of TKN, nitrite, and nitrate in the Yelm WRF effluent. The NPDES permit limit for total nitrogen in the reclaimed water produced at the WRF is ≤10 mg/L.
Total nitrogen = TKN +NO2 + NO3
5-day biochemical oxygen demand (BOD5)
Also referred to as BOD. The amount of dissolved oxygen needed by biological organisms to break down organic material present in wastewater. When BOD in wastewater effluent is too high, it can create an oxygen deficiency in the receiving water and negatively impact aquatic life. The NPDES permit for BOD in effluent is the same for the Power Canal, the River, and the reclaimed water distribution system and requires a BOD monthly average ≤30 mg/L and weekly average ≤45 mg/L.
Total suspended solids (TSS)
TSS refers to the amount of solids that remain indefinitely suspended in wastewater and can not pass through a filter with a pore size of two micrometers. The NPDES permit for TSS in effluent is the same for the Power Canal, the River, and the reclaimed water distribution system and requires a TSS monthly average ≤30 mg/L and weekly average ≤45 mg/L.
4.2.2 Plans for Maintaining Adequate Capacity Special Condition S4 of the NPDES permit defines the flow and waste loading capacity of the WRF as designed and requires the City to submit to Ecology a plan and schedule for maintaining treatment capacity when one of the following two conditions occurs: • The actual flow or wasteload reaches 85 percent of any one of the design criteria for 3 consecutive
months • The projected increase would reach design capacity within 5 years
Design criteria identified in the NPDES permit are as follows: • Average flow for the maximum month: 1.0 mgd • BOD5 loading for the maximum month: 2,000 pounds per day (lb/day) • TSS loading for the maximum month: 430 lb/day
There is reason to believe the design criteria used in the design and construction of the WRF are different than those identified in the NPDES permit. Apparent design criteria, as documented in WRF design and construction documents, are discussed in Section 4.3.
The design criteria listed in the NPDES permit do not include design criteria for ammonia. In 2011, Brown and Caldwell prepared a treatment capacity assessment to estimate the available ammonia treatment capacity of the WRF; the results of that assessment are presented in Section 4.8.

City of Yelm General Sewer Plan Section 4
4-5
Use of contents on this sheet is subject to the limitations specified at the end of this document. F_Section 4 WRF.docx
4.3 WRF Design Criteria Design criteria are calculated projections of maximum influent flow and wastewater loading characteristics that the WRF can reliably treat while achieving established permit limits. Design criteria for the existing City of Yelm WRF were developed and revised over several years between 1995 and 1999. The following points generally describe the development timeline for the WRF design criteria as can best be determined from existing background information: • September 1995: Design criteria for the WRF were first developed by Skillings Connolly and presented
in the Water Reuse Project Facilities Plan (Skillings Connolly, 1995). The 1995 Facilities Plan identified design criteria for wastewater flow as well as BOD and TSS loading. Design criteria cited in the current NPDES permit (Appendix 1A) match the 1995 Facilities Plan.
• January 1996: Esvelt Environmental Engineering (EEE, 1996) (see Appendix 4A) revised the previous Facilities Plan design criteria based upon influent flow and loading data collected between October 1995 and October 1996. The Esvelt analysis resulted in lower influent loading projections for BOD and TSS, while developing a loading projection for ammonia. Design criteria for flow were nearly identical to the previous values.
• November 1999: Skillings Connolly finalizes the record drawings for the WRF as it was constructed. Sheet G-3 of the record drawing set includes design criteria for influent flow and loading, which agree with the revised design criteria developed by Esvelt in 1996.
• May 2000 (following completion of construction): SBR design calculations by U.S. Filter/Jet Tech (File No. JTS-98056). Calculations show general agreement with 1996 and 1999 design criteria, although projected ammonia load is higher. These calculations show target calculations of 10 mg/L for effluent total nitrogen and 3.0 mg/L for effluent ammonia but provide little detail on how the SBRs were sized to achieve these limits.
There is a significant discrepancy between the design criteria identified in the NPDES permit and the apparent design criteria shown in the background documentation discussed above. Based upon the agreement among the 1996 Esvelt analysis, 1999 record drawings, and 2000 design calculations it appears that the design criteria cited in the NPDES permit do not reflect the revisions made in subsequent influent loading and design analyses that were prepared following the preparation of the 1995 Facilities Plan. Table 4-3 compares the design criteria in the existing NPDES permit to the apparent design criteria for the WRF as it was constructed. Relevant design criteria documentation from the sources discussed above are provided in Appendix 4A. This GSP uses the apparent design criteria for flow, BOD, and TSS when evaluating remaining plant capacity.
The NPDES permit does not include design criteria for ammonia loading, likely because ammonia loading projections were developed during later design criteria revisions. Page 6-14 of the 1995 Facilities Plan states that “nutrient removal (nitrogen and phosphorus) is not required to meet either Class A reuse standards or the proposed NPDES permit for the WRF.”
The 1996 Esvelt analysis does not document how the WRF would be sized to provide ammonia treatment capacity for the estimated influent loadings. The lack of documentation for ammonia treatment capacity combined with the analysis of recent WRF performance (see Section 4.5) suggests that the existing WRF is potentially nearing its treatment capacity for ammonia, thereby triggering the additional capacity planning requirements specified in the NPDES permit (see Section 4.2.2). Section 4.8 documents the results of a treatment capacity assessment of the WRF and establishes the need to plan for additional ammonia treatment capacity.

Section 4 City of Yelm General Sewer Plan
4-6
Use of contents on this sheet is subject to the limitations specified at the end of this document. F_Section 4 WRF.docx
Table 4-3. Comparison of NPDES Permit and Apparent Design Criteria
Parameter NPDES permit design criteria Apparent design criteria Maximum month
Flow 1.0 mgd 1.06 mgd
BOD 2,000 lb/day 1,486 lb/day
TSS 430 lb/day 248 lb/day
Ammonia Not defined 372 lb/day
Maximum day
Flow Not defined 1.36 mgd
BOD Not defined 1,750 lb/day
TSS Not defined 370 lb/day
Ammonia Not defined 435 lb/day a
a. SBR design calculations show a maximum loading of 485 lb/day.
4.4 Existing Facility Inventory and Condition Assessment This section presents a WRF process overview, describes its treatment components and systems, and summarizes the operational assessment conducted in June 2011.
4.4.1 Process Overview The City’s existing WRF generates Class A reclaimed water using several treatment steps, including SBRs, sand filters, and chlorine disinfection. Wastewater enters the plant through a 12-inch-diameter polyvinyl chloride (PVC) STEP force main at an influent control structure with an influent riser designed to keep all of the pressure collection force mains full. The wastewater then flows by gravity to three SBR tanks. Only two tanks are currently used at a time for the sequencing operation, and the third is available as a standby. Decant water from the SBR tanks flows by gravity to a divided equalization basin with four surface aerators. Flow is pumped from the equalization basin to the granular media filters, where polyaluminum chloride (PAX) is added and mixed through an inline static mixer. Effluent from the filters is then chlorinated and flows through a contact chamber before being discharged through an effluent weir. If the quality of the water meets the state’s water reclamation criteria and there is a demand for reuse water, the reclaimed water is pumped to the beneficial use sites (see Section 5). If there is insufficient demand for the reuse water or the water does not meet the reclaimed water standards, the water is dechlorinated and discharged through the standby outfall in the Centralia Power Canal. In emergency situations, where flow in the canal is less than 200 cfs or canal maintenance is being performed, secondary effluent could be discharged to the outfall located in the Nisqually River.
Figure 4-1 provides a process flow diagram for the WRF.
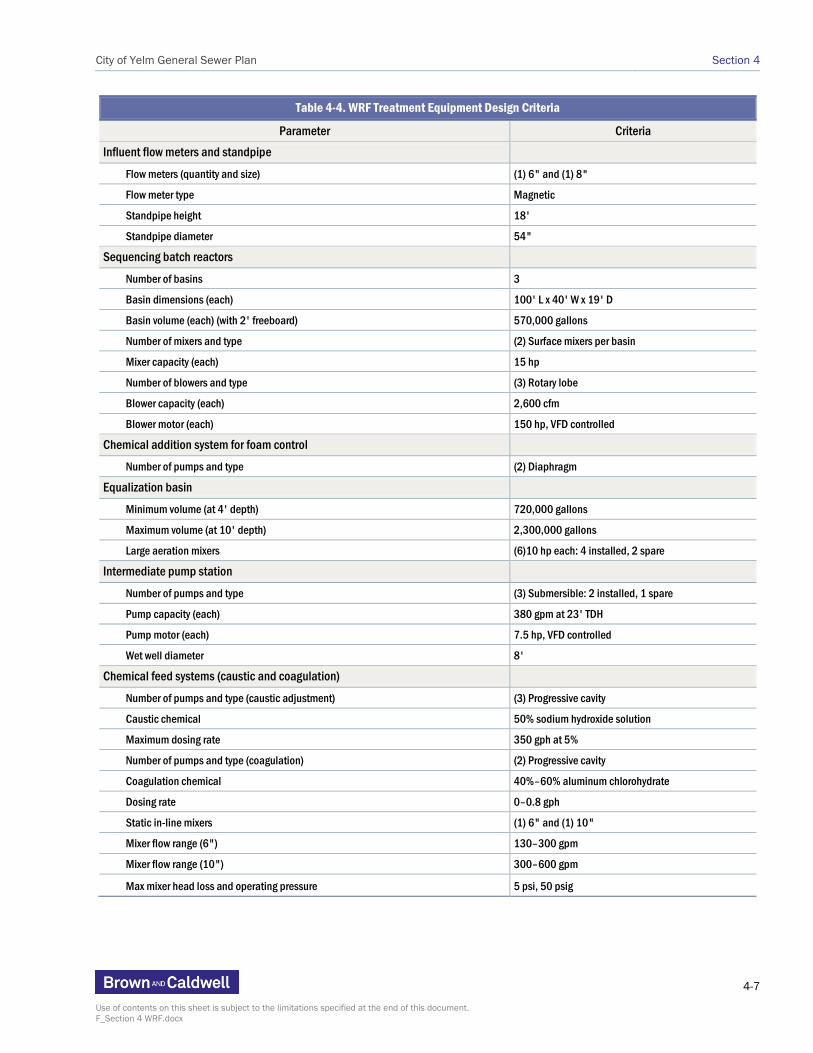
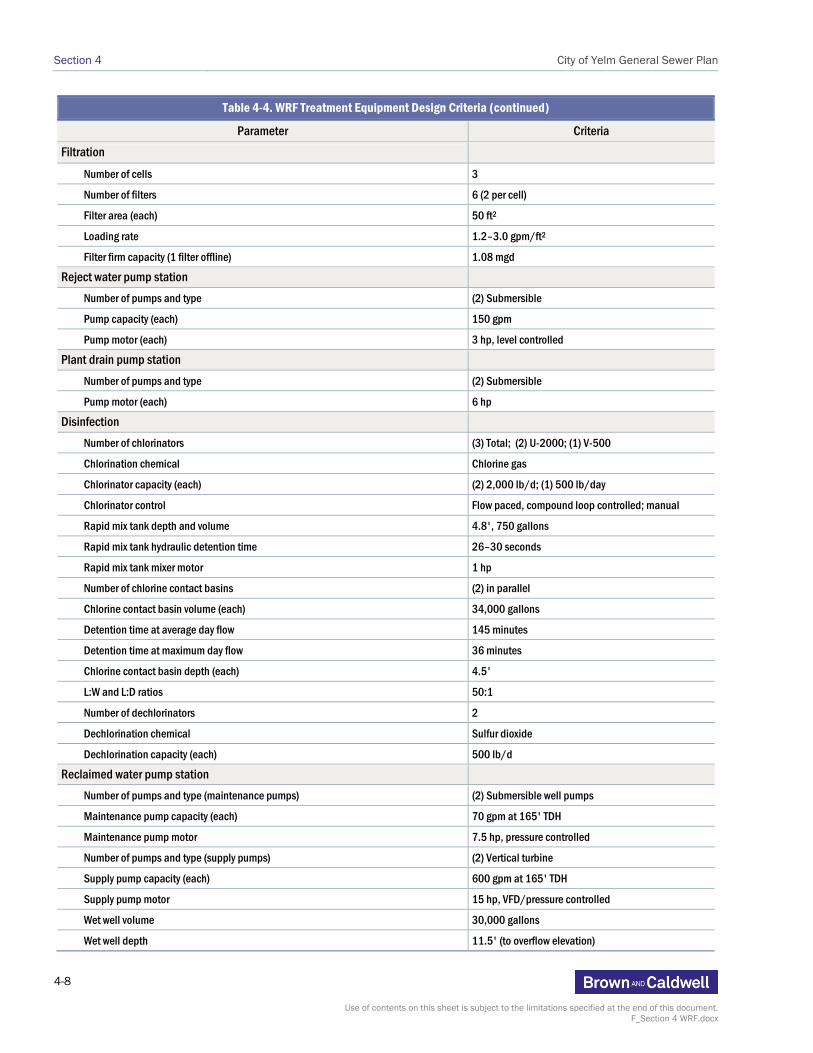
4.4.2 Treatment Components/Systems This section provides more detail on individual treatment components and/or systems, including design criteria, operational strategy, and identified deficiencies. Projects to address identified deficiencies are included in Section 9, Capital Improvement Program. Design criteria for the treatment components and/or systems discussed in this section are summarized in Table 4-4.
City of Yelm General Sewer Plan Section 4
4-7
Use of contents on this sheet is subject to the limitations specified at the end of this document. F_Section 4 WRF.docx
Table 4-4. WRF Treatment Equipment Design Criteria
Parameter Criteria Influent flow meters and standpipe
Flow meters (quantity and size) (1) 6" and (1) 8"
Flow meter type Magnetic
Standpipe height 18'
Standpipe diameter 54"
Sequencing batch reactors Number of basins 3
Basin dimensions (each) 100' L x 40' W x 19' D
Basin volume (each) (with 2' freeboard) 570,000 gallons
Number of mixers and type (2) Surface mixers per basin
Mixer capacity (each) 15 hp
Number of blowers and type (3) Rotary lobe
Blower capacity (each) 2,600 cfm
Blower motor (each) 150 hp, VFD controlled
Chemical addition system for foam control Number of pumps and type (2) Diaphragm
Equalization basin Minimum volume (at 4' depth) 720,000 gallons
Maximum volume (at 10' depth) 2,300,000 gallons
Large aeration mixers (6)10 hp each: 4 installed, 2 spare
Intermediate pump station Number of pumps and type (3) Submersible: 2 installed, 1 spare
Pump capacity (each) 380 gpm at 23' TDH
Pump motor (each) 7.5 hp, VFD controlled
Wet well diameter 8'
Chemical feed systems (caustic and coagulation) Number of pumps and type (caustic adjustment) (3) Progressive cavity
Caustic chemical 50% sodium hydroxide solution
Maximum dosing rate 350 gph at 5%
Number of pumps and type (coagulation) (2) Progressive cavity
Coagulation chemical 40%–60% aluminum chlorohydrate
Dosing rate 0–0.8 gph
Static in-line mixers (1) 6" and (1) 10"
Mixer flow range (6") 130–300 gpm
Mixer flow range (10") 300–600 gpm
Max mixer head loss and operating pressure 5 psi, 50 psig
Section 4 City of Yelm General Sewer Plan
4-8
Use of contents on this sheet is subject to the limitations specified at the end of this document. F_Section 4 WRF.docx
Table 4-4. WRF Treatment Equipment Design Criteria (continued)
Parameter Criteria Filtration
Number of cells 3
Number of filters 6 (2 per cell)
Filter area (each) 50 ft2
Loading rate 1.2–3.0 gpm/ft2
Filter firm capacity (1 filter offline) 1.08 mgd
Reject water pump station Number of pumps and type (2) Submersible
Pump capacity (each) 150 gpm
Pump motor (each) 3 hp, level controlled
Plant drain pump station Number of pumps and type (2) Submersible
Pump motor (each) 6 hp
Disinfection Number of chlorinators (3) Total; (2) U-2000; (1) V-500
Chlorination chemical Chlorine gas
Chlorinator capacity (each) (2) 2,000 lb/d; (1) 500 lb/day
Chlorinator control Flow paced, compound loop controlled; manual
Rapid mix tank depth and volume 4.8', 750 gallons
Rapid mix tank hydraulic detention time 26–30 seconds
Rapid mix tank mixer motor 1 hp
Number of chlorine contact basins (2) in parallel
Chlorine contact basin volume (each) 34,000 gallons
Detention time at average day flow 145 minutes
Detention time at maximum day flow 36 minutes
Chlorine contact basin depth (each) 4.5'
L:W and L:D ratios 50:1
Number of dechlorinators 2
Dechlorination chemical Sulfur dioxide
Dechlorination capacity (each) 500 lb/d
Reclaimed water pump station Number of pumps and type (maintenance pumps) (2) Submersible well pumps
Maintenance pump capacity (each) 70 gpm at 165' TDH
Maintenance pump motor 7.5 hp, pressure controlled
Number of pumps and type (supply pumps) (2) Vertical turbine
Supply pump capacity (each) 600 gpm at 165' TDH
Supply pump motor 15 hp, VFD/pressure controlled
Wet well volume 30,000 gallons
Wet well depth 11.5' (to overflow elevation)

City of Yelm General Sewer Plan Section 4
4-9
Use of contents on this sheet is subject to the limitations specified at the end of this document. F_Section 4 WRF.docx
Table 4-4. WRF Treatment Equipment Design Criteria (continued)
Parameter Criteria Reclaimed water storage tank
Capacity 500,000 gallons
Height 31'
Diameter 53'
Ground elevation 337.5'
High water line 30'
Solids treatment and disposal WAS storage tank volume 332,000 gallons
WAS storage tank retention time 28 days
WAS storage tank aeration Coarse bubble diffusers
Aeration blower number and type (1) Rotary lobe
Blower capacity 660 cfm at 8 psi
Blower motor 40 hp, VFD controlled
Sludge thickener type Gravity belt
Sludge thickener capacity 400 lb total solids/hr and 80 gpm
Sludge thickener output 5% total solids
Biosolids production (per week) 16,400 gallons (at 5% TS)
WAS pump number and type (2) Centrifugal
Pump capacity (each) 150 gpm at 45' TDH
Pump motor (each) 6 hp
Polymer feed pump number and type (2) Progressive cavity pumps
Polymer chemical 0.07% polymer solution
Dosing rate 0.2–0.8 gph
Source: Yelm Wastewater Technical Report, Parametrix, 2007, Appendix J.
4.4.2.1 Influent Flow Meters
Influent flow from the STEP system and recreational vehicle (RV) dump station enters the plant by a 12-inch-diameter pipeline. This flow is subsequently split into two streams by 6- and 8-inch-diameter pipelines. Magnetic flow meters, 6 and 8 inches in size, have been installed in a below-ground vault to measure influent flow. Currently, the 6-inch flow meter is not working and all flow is measured by the 8-inch flow meter.
4.4.2.2 Influent Standpipe (Headworks)
Influent flow and flow from the reject water pump station is conveyed to a high density polyethylene (HDPE) influent control structure, known as the headworks. Flow enters the vertical structure via an 18-inch vertical riser that has an overflow at elevation of 349 feet. The elevation of the overflow keeps the pipe in the STEP system pressurized. A level alarm in the influent structure is triggered when the water surface elevation in the influent structure exceeds 349 feet. A caustic injection point is located at the influent control structure for alkalinity control (this is not currently used due to safety concerns; see Sections 4.4.2.7 and 4.9). Additionally, chlorine can be injected at this structure for odor control. An 18-inch-diameter pipeline directs flow from the influent standpipe to the SBRs.

Section 4 City of Yelm General Sewer Plan
4-10
Use of contents on this sheet is subject to the limitations specified at the end of this document. F_Section 4 WRF.docx
4.4.2.3 Secondary Treatment (SBRs)
Raw sewage receives secondary treatment, ammonia removal (nitrification), and nitrate removal (denitrification) in two SBRs. A third SBR basin, not currently in operation, is a standby basin and provides redundancy in the treatment system. Wastewater is alternately fed to the different basins, via three 18-inch-diameter pipes equipped with pneumatically controlled influent valves. The valve actuators controlling the operation of these influent valves have slow opening and closing times, which impair the performance of the SBRs. The SBRs are operated cyclically, and with automatic programming to fill, aerate, and decant to biologically oxidize organics and ammonia and remove solids. Decanted secondary effluent flows to an equalization basin.
The dissolved oxygen (DO) and pH probes that are used to monitor the operation of the SBRs are approaching the end of their useful lives. Installation of additional probes to measure oxidation reduction potential (ORP), ammonia, and nitrate levels in the SBRs is planned to improve treatment reliability (see Section 4.9). According to the variable-frequency drive (VFD) service provider, the VFDs that control the speed of the SBR blowers have reached the end of their useful life. The result has been operational inconsistency, which has affected plant operations. Furthermore, walkways and handrails are provided over only a portion of the SBR tank perimeter. This poses a safety hazard for plant operators who have had to access the entire tank perimeter in the past.
Planned blower VFD and SBR instrumentation improvements are discussed in more detail in Section 4.9.
4.4.2.4 Chemical Addition System for Foam Control
Microthrix bacteria are filamentous organisms that have historically impaired the performance of the SBRs. These organisms degrade SBR performance by reducing the settleability of the mixed liquor suspended solids. Based on the results of a pilot study, PAX addition is used to control Microthrix at the plant. The PAX equipment consists of two pumps and a feed system but was not constructed with the intent that it would be a permanent installation. PAX is fed in unprotected hoses to two of the three SBRs. PAX is stored in the vicinity of electrical gear that is showing signs of corrosion that is likely caused by the PAX. Planned improvements to the PAX system are included in the CIP described in Section 9.3.
4.4.2.5 Equalization Basin
Decanted water from the SBRs flows by gravity to the equalization basin located at the WRF site. This basin is lined with HDPE. The equalization basin has been divided to reduce detention time and minimize algae growth. Equalization of the cyclic secondary effluent from the SBRs allows pumping from the intermediate pump station at a more constant rate. Algae growth has been periodically observed at the equalization basin, particularly in the summer months. The algae growth appears to impair chlorination efficiency and cause issues with the ability to maintain adequate chlorine residuals in the reclaimed water effluent. The City has implemented chlorination control using compound loop control. This varies the chlorine dosage according to the chlorine residual measurement. Some algae in the equalization basin can be a benefit as algae use nitrate as a nitrogen source for growth and these algae will likely improve treatment performance with respect to nitrate.
4.4.2.6 Intermediate Pump Station
Two variable-speed submersible pumps are installed at the intermediate pump station (IPS), and are used to transfer secondary effluent from the equalization basin to the filters. These pumps are located in a wet well. The access hatches are too small, which makes the pulling of the pumps difficult. A third pump, which is not installed, is available as a standby. Provisions have been made for installation of an additional pump if necessary in the future.

City of Yelm General Sewer Plan Section 4
4-11
Use of contents on this sheet is subject to the limitations specified at the end of this document. F_Section 4 WRF.docx
4.4.2.7 Caustic Feed System
The caustic system can inject sodium hydroxide downstream of the IPS, upstream of the equalization basin, and at the influent control structure. The caustic system is designed to adjust pH and alkalinity at these three injection locations, and maintain optimal conditions for nitrification and denitrification. Concentrated caustic solution in a 55-gallon drum is diluted in a dilution/feed tank and pumped to the discharge locations. The caustic system is not currently used because of concerns about the hazards associated with use of sodium hydroxide; bags of lime are currently added to the SBRs manually as necessary to increase the alkalinity in the basins. The short-term improvements presented in Section 4.9 describe planned improvements to this system and the plans to use magnesium hydroxide for alkalinity control in the future.
4.4.2.8 PAX System (Coagulation)
The PAX system is used to aid the flocculation of particles in the secondary wastewater stream and enhance the filtration process. PAX is injected upstream of the filters to enhance coagulation; the feed rate is typically on the order of 0.3 gallon per hour of 40–60 percent PAX. The progressive cavity pumps that deliver PAX require frequent seal replacement.
4.4.2.9 Filtration
Coagulation causes floc formation in the secondary effluent. This floc is then removed by the three continuous backwash, up-flow, deep-bed granular-media filters at the plant. Filtered effluent exits the top of the filters while accumulated solids are drawn downward to an airlift pipe at the center of the filter. Two compressors provide pressurized air to the filters. The air and sand media, solids, and water slurry rises through a column. The sand is scoured and solids and sand are separated. The solids and dirty water are continuously rejected, being returned to the head of the plant via the reject water pump station.
During filter operation, some sand loss to the reject water stream occurs over time and sand could need to be added to the filters to replace that which is lost. If sand in the reject water stream is excessive, it could potentially wear down the drain pumps and other downstream processes. At the WRF, sand loss has not proved to be significant and replacement sand has never been added to the filters. However, the reject water vault must be cleaned of sand annually. The presence of sand has contributed to wear and tear on the reject water pumps and the drain vault pumps.
4.4.2.10 Reject Water Pump Station
The plant’s reject water pump station receives drainage flows from the gravity belt thickener (GBT) and reject water from the filters. The pump station consists of two submersible pumps, which were initially installed in 1992 and moved to their current location as part of the 1999 plant upgrades. The pumps have been rebuilt and are operating satisfactorily, although they require periodic maintenance.
4.4.2.11 Disinfection System
The disinfection system consists of two gas chlorinators, a rapid mix tank, and two parallel chlorine contact tanks. The gas chlorinators are fed by 150-pound gas cylinders. The plant also has a sulfur dioxide chemical system consisting of two units. Sulfur dioxide can be added after disinfection to remove chlorine from the effluent prior to discharge. A sampler located at the chlorine contact tanks is used to measure residual. The contact tanks provide the volume needed to achieve sufficient detention time to destroy pathogenic organisms. Prior to 2012, chlorine injection into the liquid stream was not automated, and as a result, chlorine residuals were periodically too high in the effluent stream.
4.4.2.12 Reclaimed Water Pump Station and Storage
Disinfected water flows to the reclaimed water pump station, and is pumped to various water reuse facilities. This pump station also supplies process water, which supports the caustic system, the sulfur dioxide system, the chlorine system, the irrigation system, and the hose bibs at the plant. This flow is

Section 4 City of Yelm General Sewer Plan
4-12
Use of contents on this sheet is subject to the limitations specified at the end of this document. F_Section 4 WRF.docx
measured by a separate flow meter, which was installed in 2006. This flow meter is 6 inches in size, and is located in a second below-ground vault adjacent to the vault housing the influent flow meters.
Disinfected water flows to the reclaimed water wet well, where the reclaimed water pumps distribute it to the reclaimed water distribution facilities. The water leaving the reclaimed water pump station is metered by an 8-inch flow meter. This pump station also supplies process water, which supports the caustic system, the sulfur dioxide dechlorination system, the chlorination system, the irrigation system, and the hose hydrants at the plant. The process water flow is measured by a separate flow meter that was installed in 2006. This flow meter is 6 inches in size, and is located in a separate below-ground vault adjacent to the vault housing the influent flow meters.
During low demand periods, reclaimed water is pumped to a reclaimed water storage tank. During high demand periods, this storage tank is drained into the reclaimed water wet well and subsequently pumped to the reclaimed water reuse facilities. The tank is configured so that it can be filled directly with City potable water if necessary to meet reclaimed water demands. When potable water needs to be added to the tank a manual valve on the line is opened and the amount of water that is added is metered and tracked. The City does not currently use potable water to supplement reclaimed water if demand exceeds supply. Alternative locations for the discharge of treated effluent are the Centralia Power Canal and the Nisqually River.
4.4.2.13 Solids Treatment and Disposal
Excess biological solids generated from the secondary treatment process are pumped via self-priming pumps to the WAS storage tank. Sludge from the WAS storage tank is pumped to a GBT and trucked away to the Tacoma Central Treatment Plant (CTP) for disposal.
The storage tank has divider walls and is aerated with a rotary lobe blower and coarse-bubble diffusers. This tank stores biosolids until they are pumped for thickening. The continuous aeration of WAS results in nitrification, a loss of alkalinity, and low pH. This has led to problems with the sludge being accepted by the Tacoma CTP, which receives the finished sludge. Currently, the City of Tacoma requires sludge pH to be above 6.0. The pH is adjusted by adding lime to the sludge storage tanks while the aeration is taking place. The storage tank has acted as a source of nitrifying sludge that has been used to reseed nitrifying bacteria back to the SBRs when nitrification is not being achieved.
Sludge is transferred from the WAS storage tank to the GBT by two sludge transfer pumps. The sludge conveyed to the GBT is conditioned for thickening by the addition of chemical polymer from a chemical feed system. The GBT produces approximately 5 percent solids, to meet the requirements of the facility receiving the biosolids. Plant staff suspect that some objects have become stuck in the drain serving the GBT. However, this does not appear to be impacting plant performance.
Thickened biosolids are hauled by a contract hauler to the City of Tacoma CTP for further solids stabilization and disposal. Another source of solids within the City wastewater system is septage from the STEP tanks. STEP tank septage is pumped and hauled by a contract hauler to biosolids processing facilities owned and operated by Biorecycling in Shelton and Centralia, Washington.
4.4.2.14 Electrical and Control Systems
The existing facility has power service provided for the operation of plant equipment as well as lighting, heating, and ventilation. There are two diesel powered standby generators, one rated at 500 kilowatts (kW) and the other rated at 100 kW.
The treatment process is controlled by a programmable logic controller (PLC) and a supervisory control and data acquisition (SCADA) system. Alarms notify the plant operators of system problems. The SCADA system is in need of an extensive upgrade so that it can provide more reliable control. The facilities planning effort

City of Yelm General Sewer Plan Section 4
4-13
Use of contents on this sheet is subject to the limitations specified at the end of this document. F_Section 4 WRF.docx
that is planned as part of the CIP will include an evaluation of necessary SCADA improvements, with the costs for the improvements budgeted for as part of a future plant upgrade.
4.4.3 June 2011 Operational Assessment In June 2011, Brown and Caldwell completed an operational review to investigate potential causes of the decline in reliability at the WRF during 2011. The operational review concluded that the decline in late 2010 and early 2011 was due to unseasonably cold weather in late November, combined with the failure of Plant operations staff to build up the necessary inventory of biomass in the SBR treatment system in anticipation of winter operating conditions. Without the necessary biomass in the SBRs, the plant was unable to achieve the removal of ammonia (nitrification) and nitrate (denitrification) required to meet permit limits, beginning in November 2010.
The operational assessment made the following recommendations for improving performance: • Implement standard operating procedures (SOPs). The operation of an SBR to achieve low total
nitrogen concentrations is a complex process with a large number of variables to monitor, adjust, and control, including cycle times, constantly changing DO concentrations, and alkalinity concentration. Preparation of a comprehensive set of SOPs for typical modes of operation would help the plant operators prevent upsets and prepare for winter operation. In addition, preparation of contingency plans for operation following a significant plant upset were recommended. Final SOPs, incorporating the results of the process modeling analyses, were prepared in March 2012.
• Review aeration system design and control. When operating at high speed, the existing blowers produce too much air and prevent accurate control of the SBR process. The blowers are provided with a low-speed setting that may provide more control, but plant operators have indicated that the blowers are not operated in this mode. The operational assessment recommended investigation of the operational capabilities of the blowers and this investigation took place in January 2012. The City is currently (February 2012) working to implement changes to the blower controls.
• Improvements to maintain alkalinity in the SBRs. Without adequate alkalinity in the wastewater, the nitrification process cannot take place. Low alkalinity can lead to problems with the corrosivity of the reclaimed water that is produced. A caustic soda addition system at the plant was originally intended to provide alkalinity control for the treatment process, but it has not been used for several years. The operators currently control alkalinity by manually adding bags of lime to the system and measuring alkalinity on a monthly basis. Better control of the alkalinity in the treatment process is required, and the assessment recommended additional evaluation of a new or upgraded alkalinity system.
• Improved measurement of ammonia and nitrate concentrations. Precise control of the nitrification/denitrification process requires frequent measurement of ammonia and nitrate concentrations. Prior to March 2011, samples for these measurements were taken twice weekly; after March 2011, daily samples for nitrate and ammonia have been taken with a composite effluent sampler. The assessment recommended installation of online ammonia and nitrate analyzers to provide continuous monitoring and control. In addition, the existing pH and DO instrumentation is more than 10 years old and should be replaced. The City is currently (February 2012) working to install the recommended instruments in the SBRs.
The complete operational assessment is included in Appendix 4B.
4.5 Recent WRF Performance In general, the WRF has been in compliance with its NPDES permit requirements for most of its operational history. Beginning in late 2010 and continuing throughout 2011, the WRF met its reclaimed water permit limit for total nitrogen only sporadically. In 2011, the permit limit was met only in July and September 2011, and consequently reclaimed water was produced only during these months.

Section 4 City of Yelm General Sewer Plan
4-14
Use of contents on this sheet is subject to the limitations specified at the end of this document. F_Section 4 WRF.docx
The most recent Ecology inspection of the WRF occurred in June 2011. Operation, maintenance, and record-keeping items in need of improvement as indicated by Ecology in its Inspection Report (August 2011) have been or are being addressed by the City. The inspection report is provided in Appendix 4C.
Influent and effluent data presented in this section were collected as part of scheduled monitoring required in the WRF NPDES permit and as reported to Ecology in monthly DMRs for the period between January 2006 and December 2011. This section does not discuss every parameter monitored at the WRF, but focuses on those parameters (flow, BOD, TSS, and nitrogen) that are most critical to compliance and indicative of overall treatment performance. [Note: Flow and loading projections for future conditions that are presented in Section 2 are based on flow and loading data through December 2010. Performance data presented in this section include 2011 data in order to document conditions during the period when reclaimed water permit limits were not being met.]
4.5.1 Flow This section describes influent and effluent flows at the WRF.
4.5.1.1 Influent Flow
Influent flows at the WRF have been steadily increasing over time, consistent with population growth. A comparison of influent flow data and population trends is provided in Figure 4-2. Table 2-8 presents a tabulation of recent flow data. Current influent flow in terms of maximum monthly flow (0.372 mgd in 2011) and maximum day flow (0.441 mgd in 2011) are approximately one-third of the corresponding design criteria presented in Table 4-3 (1.06 mgd maximum monthly flow and 1.36 mgd maximum daily flow).
Peak flows do not exhibit a strong seasonal pattern. Furthermore, the difference between maximum and average day flows is relatively small. This lack of variability is typical of properly functioning STEP collection systems, which minimize I/I during wet weather periods and equalize residential wastewater flows within the individual STEP tanks.
4.5.1.2 Effluent Flow
Depending upon effluent quality, reclaimed water demand, and receiving water flows, effluent flow is directed to one of three points of discharge; (1) the reclaimed water system, (2) the Centralia Power Canal, and (3) the Nisqually River. From 2006 to 2011, approximately 30 percent of total plant flow has been directed to the reclaimed water system. Of the remaining discharge to surface water, over 97 percent is discharged to the Power Canal. The Nisqually River discharge is used only when the Power Canal is closed for maintenance or when flow in the canal is less than 200 cfs.
The point of effluent discharge is strongly influenced by seasonal reclaimed water demand. During the summer dry weather period (June–September), demand for reclaimed water approaches the entire plant flow rate. Outside of these months, when irrigation demands are removed, reclaimed water demand is 35,000 to 50,000 gpd. This baseline reclaimed water demand represents water conveyed to Cochrane Park. Effluent flow to the various points of discharge is summarized in Figure 4-3.
4.5.2 BOD and TSS This section describes influent and effluent BOD and TSS at the WRF.
4.5.2.1 Influent BOD and TSS
Influent BOD and TSS loading are summarized in Table 4-5. Design loading conditions for the WRF are also included in Table 4-5 for reference. BOD and TSS loading have not increased proportionately or as consistently with population as shown in the relationship between flow and population shown in Figure 4-2. Existing BOD and TSS loading is approximately 50 percent and 70 percent, respectively, of the design loading. The NPDES permit requires that planning for expansion take place when loadings reach 85 percent

City of Yelm General Sewer Plan Section 4
4-15
Use of contents on this sheet is subject to the limitations specified at the end of this document. F_Section 4 WRF.docx
of design loading or when projected loading increases would reach design capacity shown in the permit within 5 years.
Table 4-5. Influent BOD and TSS Loading
Design BOD loading: maximum month = 1,486 ppd, maximum day = 1,750 ppd Design TSS loading: maximum month = 248 ppd, maximum day = 370 ppd
2006 2007 2008 2009 2010 2011 BOD
Average day (ppd) 592 679 696 662 639 600
Maximum month (ppd) 659 707 787 766 689 697
Maximum day (ppd) 944 945 919 876 919 835
TSS
Average day (ppd) 133 136 133 155 158 154
Maximum month (ppd) 182 183 155 193 209 173
Maximum day (ppd) 633 682 230 262 315 264
4.5.2.2 Effluent BOD and TSS Compared to Permit Limits
The WRF consistently meets its discharge requirements for BOD and TSS, even during recent process upsets. The NPDES permit requires 85 percent removal of BOD and TSS, with a maximum month allowable discharge concentration of 30 mg/L. However, Ecology notes in the Fact Sheet that the 85 percent removal requirement is difficult to assess for STEP collection systems that utilize septic tanks as part of the treatment system. BOD and TSS removal in the septic tanks is considered an integral part of the overall treatment process. As stated in the NPDES permit Fact Sheet (see Appendix 1A):
Since it is impractical to measure the actual BOD and TSS entering the individual septic tanks, compliance with the 85 percent removal requirement will be assumed if the effluent concentration for BOD and TSS meet the 30 mg/L and 45 mg/L requirements, and there is no excessive infiltration and inflow. Excessive infiltration and inflow is defined by USEPA criteria: • Infiltration is excessive when the highest 7–14 day average dry weather flow is greater than
120 gallons per capita day. • Inflow is excessive when the highest recorded daily flow during a storm event is greater than
275 gallons per capita day or when hydraulic overloading of the treatment plant occurs.
The existing WRF does not exceed the U.S. Environmental Protection Agency (USEPA) I/I criteria. Therefore, the concentration-based effluent limits for BOD and TSS apply. Figure 4-4 presents effluent BOD and TSS concentrations compared to the 30 mg/L discharge limit.
4.5.3 Total Nitrogen and Ammonia Compared to Permit Limits The NPDES permit does not include requirements for routine influent monitoring of influent total nitrogen and ammonia concentrations. The only influent ammonia and nitrogen data available are those that were collected as part of the wastewater characterization in support of the model development for the treatment capacity assessment, as discussed in Section 4.8. In March 2012, the City began monthly monitoring of TKN, chemical oxygen demand (COD), and flocculated COD.

Section 4 City of Yelm General Sewer Plan
4-16
Use of contents on this sheet is subject to the limitations specified at the end of this document. F_Section 4 WRF.docx
There have been six periods between 2006 and 2011 when the WRF has exceeded its effluent total nitrogen limit for reclaimed water, and three periods when the WRF has exceeded its effluent ammonia limit for discharge to the Centralia Power Canal. These periods have ranged in duration from 1 month to 9 months in late 2010/early 2011. Effluent nitrogen and ammonia concentrations are shown in Figure 4-5 in comparison to their respective permit limit. This figure also shows the periods when reclaimed water was not produced. During periods when reclaimed water was not distributed and a total nitrogen concentration was therefore not reported on a monthly DMR, nitrate and ammonia samples were taken and analyzed daily.
In order to help the WRF achieve more consistent compliance with its effluent total nitrogen limit, a BioWin process model was developed in 2011 and operational changes were recommended based on the results of the model. The BioWin modeling effort performed as part of the treatment capacity assessment is described in more detail in Section 4-8.
4.5.4 Metals Compared to Permit Limits Per the NPDES permit, the effluent discharge, whether to surface water or reclaimed water uses, is sampled quarterly for the presence of metals. Although the NPDES permit includes a discharge limit only for lead, additional metals sampling data are required by Ecology to determine whether effluent limits for metals should be applied during the next permit cycle. The analysis in Section 4.7 uses the metals concentration data provided in this section to determine anticipated future permit limits for metals. As discussed in Section 4.7, the existing limit for lead should be removed in the next permit and no additional permit limits for metals are anticipated.
Of the metals included in the quarterly metals analyses between 2006 and 2011, only three are routinely detected above analytical method detection levels: copper, nickel, and zinc. Lead has been detected twice, in March 2008 and December 2010. All other metals, including arsenic, cadmium, chromium, iron, mercury, and silver, are always non-detect with respect to the analytical detection limit. Table 4-6 summarizes the metals sampling results (see Appendix 4D) for the detected effluent concentrations.
Table 4-6. Quarterly Metals Sampling Results Summary (2006–11)
Copper Lead Nickel Zinc
Total sample events 21 21 21 21
No. of detected samples 21 2 21 21
Average concentration 19.0 µg/L 0.4 µg/L 2.2 µg/L 40.7 µg/L
Maximum concentration 39.0 µg/L 0.8 µg/L 3.0 µg/L 63.0 µg/L
When discharging to the Nisqually River, the NPDES permit requires that the lead concentration be below a daily maximum value of 15 µg/L. As shown in Table 4-6, the effluent discharge concentration is well below the permitted limit. The NPDES permit does not currently include discharge limits for any other metals, regardless of discharge location. Without a discharge limit, discharge concentrations for copper, nickel, and zinc cannot be directly related to a water quality standard. Section 4.7 discusses Ecology protocol (Reasonable Potential Analysis) for evaluating effluent metals concentrations with respect to water quality standards and potential future permit limits.

City of Yelm General Sewer Plan Section 4
4-17
Use of contents on this sheet is subject to the limitations specified at the end of this document. F_Section 4 WRF.docx
4.6 Projected Flows and Loads Compared to Design Criteria Wastewater projected flows and loads are presented in Section 2. Flow and loading is projected to increase proportionally with population growth and is anticipated to triple within the planning period. The following sections compare the projected flows and loads to the design criteria summarized in Section 4.3.
4.6.1 Projected Flow Compared to Design Criteria In 2010, the flow at the WRF was approximately 30 percent of the apparent design criteria. When compared to the flow projections in Section 2, the WRF is anticipated to have adequate capacity for flow until the end of the planning period, or approximately 2026. Figure 4-6 shows projected flow compared to the apparent design criteria.
4.6.2 Projected TSS Loading Compared to Design Criteria In 2010, the WRF was at 85 percent of its apparent design criteria for TSS. In 2011, the TSS values decreased and the WRF was at approximately 70 percent of its design criteria. Future TSS projections indicate that the WRF will reach the TSS apparent design criteria by the end of 2012, indicating that facilities planning to increase plant capacity with respect to TSS should begin immediately following this GSP. However, because the WRF has had excellent plant performance relative to TSS, a proposed re-rating for influent solids loading will be included in the Facilities Plan that will be prepared following completion and approval of this GSP (see Section 4.10). Figure 4-7 shows projected TSS loading compared to apparent design criteria.
4.6.3 Projected BOD Loading Compared to Design Criteria Projections for BOD loading indicate that the WRF has adequate capacity with respect to BOD until approximately 2020. Facilities planning to increase BOD treatment capacity would be required in 2018. Figure 4-8 summarizes BOD loading compared to WRF design criteria. Figure 4-8 shows projected BOD loading compared to apparent design criteria.
4.6.4 Projected Ammonia Loading Compared to Design Criteria As summarized in Section 4.5.3, the NPDES permit for the WRF does not provide design criteria for ammonia and total nitrogen treatment capacity. Additionally, these constituents were not routinely measured in plant influent until March 2011, when monthly measurement of TKN, COD, and flocculated COD was initiated. The City completed modeling and a wastewater characterization study to evaluate the remaining treatment capacity of the WRF with respect to total nitrogen and ammonia. The results of the modeling are described in Section 4.8.3.
4.7 Surface Water Disposal Analysis This section presents an analysis of the projected 2030 wastewater discharge with respect to water quality standards for surface water (i.e., discharge to the Nisqually River and the Centralia Power Canal).
4.7.1 Synopsis The surface water disposal analysis follows procedures used by Ecology when developing NPDES permits to determine: (1) whether effluent limits for specific parameters and pollutants should be applied, and (2) appropriate effluent limits and concentrations for future permits.
The analysis presented in this section is an important planning tool for future treatment needs because it provides the City with a prediction of what effluent discharge limits would be at the future discharge flows. This long-term evaluation will give the City time to evaluate, plan for, and implement treatment improvements or modifications if the analysis indicates a potential water quality concern.

Section 4 City of Yelm General Sewer Plan
4-18
Use of contents on this sheet is subject to the limitations specified at the end of this document. F_Section 4 WRF.docx
The water quality evaluation is technical in nature and relies on multiple steps and calculations that are described in this section. In general, the first several sub-sections define the regulatory basis of water quality standards and establish the background data that the analyses will use in the calculations. The calculations then predict the concentration of specific effluent parameters and pollutants downstream of the discharge where water quality standards are applied. Results of the calculations are used to determine whether an effluent limit should be applied and, if necessary, what that limit/concentration should be to ensure that water quality standards for the protection of aquatic life and human health are met.
The results of the water quality analysis indicate that there are no water quality concerns requiring long-term planning for treatment. Most future effluent discharge limits should be the same as described in the existing NPDES permit (see Table 4-7). Discharge of conventional parameters such as BOD, TSS, fecal coliform, and pH is not predicted to cause a water quality concern; therefore, permit limits are based upon the expected minimum performance of standards of secondary wastewater treatment. Existing discharge limits for toxic pollutants such as residual chlorine and lead should be made less stringent (discharge limits made higher), based upon the most recent effluent water quality data.
Table 4-7. Projected NPDES Permit Limits
Parameter Effluent limit at outfall 2: Centralia Power Canal
Existing permit limit Projected permit limit
BOD a 30 mg/L monthly average (250 lb/d); 45 mg/L weekly average (375 lb/d) Minimum 85% removal
No change
TSS a 30 mg/L monthly average (250 lb/d); 45 mg/L weekly average (375 lb/d) Minimum 85% removal
No change
Fecal coliform bacteria b 100 per 100 mL monthly average; 200 per 100 mL weekly average No change
pH a Shall be between 6.0 and 9.0 on a daily basis No change
Total residual chlorine (mg/L) a 0.5 mg/L monthly average; 0.75 mg/L weekly average No change
Total ammonia (mg/L) c 3 mg/L monthly average; 4.5 mg/L weekly average No change
Parameter Effluent limit at outfall 3: Nisqually River
Existing permit limit Projected permit limit
BOD a 30 mg/L monthly average 250 lb/d) ; 45 mg/L weekly average (375 lb/d) Minimum 85% removal
No change
TSS a 30 mg/L monthly average 250 lb/d); 45 mg/L weekly average (375 lb/d) Minimum 85% removal
No change
Fecal coliform bacteria b 100 per 100 mL monthly average; 200 per 100 mL weekly average No change
pH a,b Shall be between 6.5 and 9.0 on a daily basis No change
Total ammonia (mg/L) c 3 mg/L monthly average; 4.5 mg/L weekly average No change
Total residual chlorine (mg/L) a 0.047 mg/L monthly average; 0.124 mg/L maximum day 0.5 mg/L monthly average; 0.75 mg/L weekly average
Total lead (µg/L) b 10 µg/L monthly average; 15 µg/L maximum day --- a. Technology-based limit. b. Water quality-based limit. c. Limit based upon expected WRF performance.

City of Yelm General Sewer Plan Section 4
4-19
Use of contents on this sheet is subject to the limitations specified at the end of this document. F_Section 4 WRF.docx
Calculations show that copper, for which there is no existing permit limit, is close to the water quality standard. Minor changes in assumptions used in the calculations could change the result such that an NPDES permit limit for copper would be required. Although the calculations are conservative, the City is aware that additional copper analyses may be required in the future should effluent copper concentrations increase beyond current values. The City will ensure that proper sampling techniques are followed during quarterly metals sampling to minimize sources of sample contamination. Ecology will evaluate the need for copper effluent limits with each permit renewal based upon the most recent effluent metals concentration data.
4.7.2 Background The WRF is permitted to discharge effluent to two surface water bodies (the Centralia Power Canal and the Nisqually River) as well as to distribute Class A reclaimed water for irrigation and/or groundwater recharge/infiltration. The regulatory requirements and discharge criteria for surface water discharges and reclaimed water use are unique and therefore evaluated individually within this document. The objective of this section is to evaluate compliance with surface water quality standards and establish anticipated effluent quality limitations for surface water discharges. Analysis of reclaimed water use is presented in Section 5.
Discharge to the Centralia Power Canal is considered a “standby” disposal alternative for periods when Class A reclaimed water standards cannot be achieved and for wastewater flows that exceed the reclaimed water demand. Discharge to the Nisqually River is an “emergency” disposal alternative, to be used only when the canal must be shut down for maintenance or anytime flow in the canal drops below 200 cfs. Due to the ambient water quality and designated uses of the Nisqually River, regulatory requirements are more restrictive for the river than for discharges to the canal. Therefore, the remainder of this section conservatively assumes that the surface water discharge receiving water is the Nisqually River.
4.7.3 Basis of Evaluation Existing effluent discharge limits for the WRF were previously summarized in Section 4.2.1. Ecology developed surface water discharge limitations based upon analyses presented in the Fact Sheet developed as a supporting document for the NPDES permit (see Appendix 1A). The Ecology analyses were based on the following regulatory standards: • Technology-based effluent limits (also referred to as All Known, Available, and Reasonable Methods of
Treatment [AKART]) for municipal wastewater treatment plants are defined in both federal (40 CFR 133) and state (WAC 173-221) codes. Technology-based limits define the minimum performance expected for a given wastewater treatment technology and do not directly consider the impact of the discharge on the water quality of the receiving water.
• State water quality-based effluent limits are defined in WAC 173-201(A). Water quality-based limits are based on the toxicity of the parameters within the effluent to aquatic life within the receiving water.
• Human-health-based criteria are defined for Washington State by the USEPA in its National Toxics Rule (Federal Register, V. 57, No. 246). Human-health-based limits are based on the toxicity and impact of the parameters within the effluent to human uses of the receiving water.
Effluent constituents regulated in the City’s current NPDES permit and the applicable basis of effluent limitations are shown in Table 4-8. Where more than one basis applies, the most stringent basis governs treatment requirements.
The Ecology analyses are discussed in the following sections, and are updated and/or revised as appropriate based upon additional data collected since the Ecology analyses were last performed.

Section 4 City of Yelm General Sewer Plan
4-20
Use of contents on this sheet is subject to the limitations specified at the end of this document. F_Section 4 WRF.docx
Table 4-8. Basis of Effluent Discharge Limits a
Constituent Technology-based Water quality-based Human-health-based
BOD
TSS
pH
Fecal coliform
Temperature
Toxic pollutants b,c a. Additional and/or more stringent technology-based limits apply when discharging to the reclaimed water system. Most stringent limits
are as follows: BOD and TSS – technology-based; pH – technology based for the upper range and water quality based for the lower range; Fecal coliform – water quality based; Temperature – water quality based (but there is no limit because there is no reasonable potential to exceed the water quality based limit); Toxic pollutants– technology based for chlorine and ammonia and water quality based for metals (but there is no limit for metals because there is no reasonable potential to exceed the water quality based limit)
b. Toxic pollutants evaluated in the NPDES permit include ammonia, residual chlorine, and metals c. A technology-based limit for residual chlorine is based upon SOPs developed in the Water Pollution Control Federation’s Chlorination
of Wastewater (1976).
4.7.4 Technology-Based Effluent Limits Technology-based effluent limits for municipal treatment plants, promulgated in federal (40 CFR 133) and state (WAC 173-221) regulations, constitute AKART. The AKART effluent limitations applicable to the treatment processes utilized by the City WRF include the following: 1. Discharge to surface waters shall not exceed a 30-day average of 30 mg/L BOD and 30 mg/L TSS.
Seven-day averages shall not exceed 45 mg/L BOD and 45 mg/L TSS. Additionally, the 30-day average percent removals of BOD and TSS shall not be less than 85 percent of influent concentrations.
2. Discharge to surface waters shall not exceed a 30-day average of 0.5 mg/L residual chlorine. Seven-day average shall not exceed 0.75 mg/L.
3. Fecal coliform limits shall not exceed a monthly geometric mean of 200 organisms/100 milliliters (mL), and a weekly geometric mean of 400 organisms per 100 mL.
4. The effluent pH value shall be between 6.0 and 9.0 standard units.
The above technology-based effluent limitations apply to both the Centralia Power Canal and Nisqually River discharges. The existing WRF currently meets all technology-based effluent limits. Section 4.5 provides specific detail related to influent and effluent BOD/TSS data. Although the WRF currently meets the 85 percent removal requirement for BOD and TSS, Ecology notes in the Fact Sheet that this requirement is difficult to assess for STEP collection systems that utilize septic tanks as part of the treatment system. As discussed in Section 4.5.2.2, because BOD and TSS removal in the septic tanks is considered an integral part of the overall treatment process, it is assumed that the 85 percent removal requirement for BOD and TSS is met when the combined septic tank and wastewater treatment system meets the concentration based limitations of 30 mg/L.
The anticipated technology-based effluent limits discussed in this section assume that the City of Yelm WRF would continue to use existing SBR treatment technology. Technology-based effluent limits may change if advanced treatment technologies are implemented in the future.
4.7.5 Water Quality-Based Effluent Limits This section evaluates the anticipated WRF discharge with respect to water quality standards for conventional pollutants DO, temperature, pH, and fecal coliform and for toxic pollutants. Toxic pollutants of concern for the WRF discharge include ammonia, chlorine residual, and metals. The objective of the water
City of Yelm General Sewer Plan Section 4
4-21
Use of contents on this sheet is subject to the limitations specified at the end of this document. F_Section 4 WRF.docx
quality evaluation is to assess the potential to exceed water quality standards and develop anticipated water quality-based effluent discharge limits, if necessary.
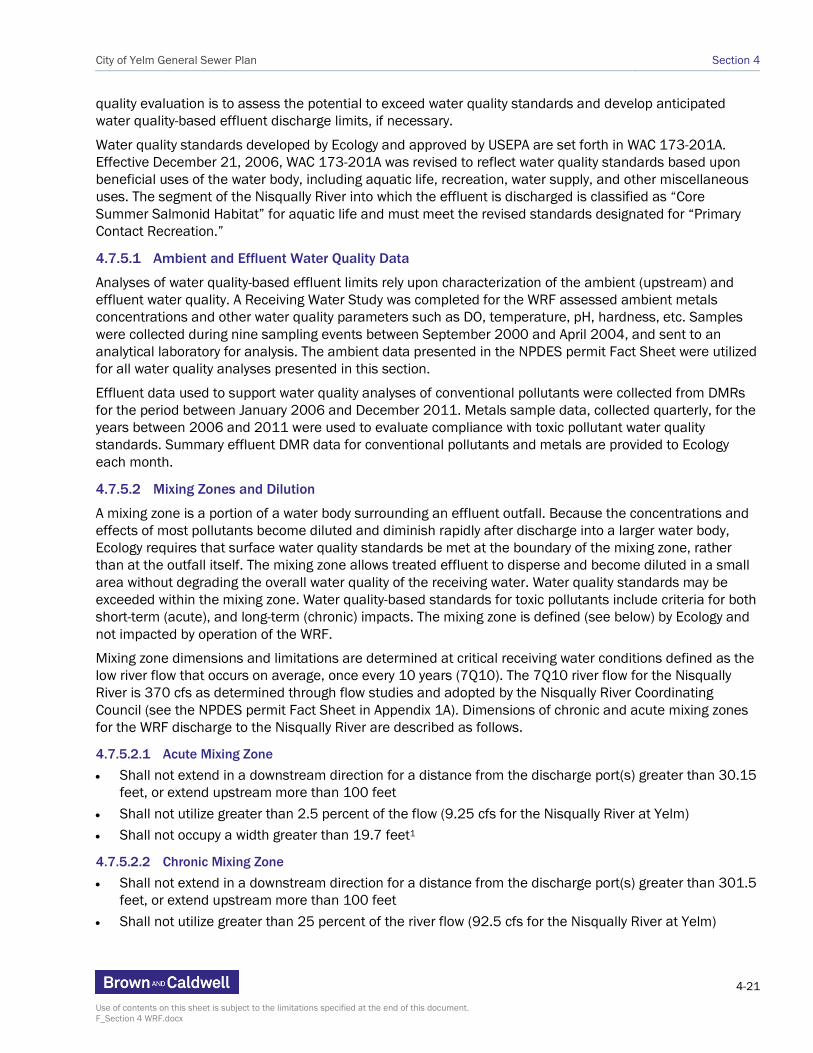
Water quality standards developed by Ecology and approved by USEPA are set forth in WAC 173-201A. Effective December 21, 2006, WAC 173-201A was revised to reflect water quality standards based upon beneficial uses of the water body, including aquatic life, recreation, water supply, and other miscellaneous uses. The segment of the Nisqually River into which the effluent is discharged is classified as “Core Summer Salmonid Habitat” for aquatic life and must meet the revised standards designated for “Primary Contact Recreation.”
4.7.5.1 Ambient and Effluent Water Quality Data
Analyses of water quality-based effluent limits rely upon characterization of the ambient (upstream) and effluent water quality. A Receiving Water Study was completed for the WRF assessed ambient metals concentrations and other water quality parameters such as DO, temperature, pH, hardness, etc. Samples were collected during nine sampling events between September 2000 and April 2004, and sent to an analytical laboratory for analysis. The ambient data presented in the NPDES permit Fact Sheet were utilized for all water quality analyses presented in this section.
Effluent data used to support water quality analyses of conventional pollutants were collected from DMRs for the period between January 2006 and December 2011. Metals sample data, collected quarterly, for the years between 2006 and 2011 were used to evaluate compliance with toxic pollutant water quality standards. Summary effluent DMR data for conventional pollutants and metals are provided to Ecology each month.
4.7.5.2 Mixing Zones and Dilution
A mixing zone is a portion of a water body surrounding an effluent outfall. Because the concentrations and effects of most pollutants become diluted and diminish rapidly after discharge into a larger water body, Ecology requires that surface water quality standards be met at the boundary of the mixing zone, rather than at the outfall itself. The mixing zone allows treated effluent to disperse and become diluted in a small area without degrading the overall water quality of the receiving water. Water quality standards may be exceeded within the mixing zone. Water quality-based standards for toxic pollutants include criteria for both short-term (acute), and long-term (chronic) impacts. The mixing zone is defined (see below) by Ecology and not impacted by operation of the WRF.
Mixing zone dimensions and limitations are determined at critical receiving water conditions defined as the low river flow that occurs on average, once every 10 years (7Q10). The 7Q10 river flow for the Nisqually River is 370 cfs as determined through flow studies and adopted by the Nisqually River Coordinating Council (see the NPDES permit Fact Sheet in Appendix 1A). Dimensions of chronic and acute mixing zones for the WRF discharge to the Nisqually River are described as follows.
4.7.5.2.1 Acute Mixing Zone • Shall not extend in a downstream direction for a distance from the discharge port(s) greater than 30.15
feet, or extend upstream more than 100 feet • Shall not utilize greater than 2.5 percent of the flow (9.25 cfs for the Nisqually River at Yelm) • Shall not occupy a width greater than 19.7 feet1
4.7.5.2.2 Chronic Mixing Zone • Shall not extend in a downstream direction for a distance from the discharge port(s) greater than 301.5
feet, or extend upstream more than 100 feet • Shall not utilize greater than 25 percent of the river flow (92.5 cfs for the Nisqually River at Yelm)

Section 4 City of Yelm General Sewer Plan
4-22
Use of contents on this sheet is subject to the limitations specified at the end of this document. F_Section 4 WRF.docx
• Shall not occupy a width greater than 19.7 feet1
The amount of mixing (dilution) that occurs within the mixing zone is dependent upon effluent discharge flow, design of the outfall, and physical dimensions of the receiving water. The higher the dilution, the lower the concentration of discharged effluent within the receiving water. Although dilution values are not directly related to effluent limits, higher dilution is more favorable for the City with respect to the Reasonable Potential Analysis presented in Section 4.7.5.4. A higher dilution used as an input value to the Reasonable Potential Analysis is more likely to result in a “no” result, indicating that there is no reasonable potential to exceed water quality standards and that a limit does not need to be applied by Ecology in the NPDES permit. Dilution values are not directly impacted by day-to-day operations at the WRF.
Acute and chronic dilution within the mixing zone for the Nisqually River was predicted using RIVPLUM6 (see results in Appendix 4F). RIVPLUM6 is an Ecology-developed Microsoft Excel-based spreadsheet used to calculate dilution in shallow rivers for side-bank discharges or single port outfalls. Ecology-provided instructions for using the model are provided in Appendix 4F, along with model input/output for acute and chronic conditions. Assumptions related to the spreadsheet input data are summarized as follows: • The projected 2030 maximum month effluent flow of 1.22 mgd (“without MPC” scenario) was used for
chronic conditions. • The projected 2030 maximum day effluent flow of 1.48 mgd (“without MPC” scenario) was used for
acute conditions. • Other RIVPLUM6 input values were based upon data provided in the NPDES permit Fact Sheet,
including river depth, current velocity, river width, and Manning’s “n” roughness coefficient. • The RIVPLUM6 default value of 0.6 was used for the transverse mixing coefficient constant (TMCC).
As discussed above, the NPDES permit limits the amount of river flow (volumetric limitations) and width available for mixing. These limitations are applied when more stringent than the downstream mixing predicted by RIVPLUM6. Table 4-9 summarizes RIVPLUM6 dilution results along with volumetric and width limitations. The most stringent (lowest) dilution (identified in BOLD) will then be applied to the water quality analyses for conventional and toxic pollutants discussed below.
Table 4-9. Summary of RIVPLUM6 Dilution Results Including Volumetric and Width Limitations
RIVPLUM6 predicted dilution Volumetric limitation Width limitation
Acute condition 8.8 5.0 8.8
Chronic condition 32.8 50.1 21.6 a
a. Determined using RIVPLUM6 estimates of plume width. Chronic mixing zone width is exceeded approximately 128 feet downstream of the outfall.
The dilution values presented in Table 4-9 differ slightly from those currently utilized by Ecology in the Fact Sheet (acute = 6.5 and chronic = 20). Based upon increased effluent flows for the 2030 conditions, it would be anticipated that dilution would decrease. However, the chronic dilution value in Table 4-9 is slightly higher than the Ecology value.
The dilution analysis presented in this section is conservative because it is based upon worst-case conditions where maximum month/day effluent flows are paired with critical low river flows. This condition rarely, if ever, actually occurs. The Ecology dilution analysis was dynamic, and less conservative, by pairing actual effluent flows with river flows on a daily basis. The difference between Ecology dilution analysis
1 The mixing zone width stated in the NPDES permit (19.7 feet) is less than that allowed within WAC 173-201A-400, which states the limitation as 25 percent of the river width. For a river width of approximately 115 feet, the allowed mixing zone width should be 28.75 feet.

City of Yelm General Sewer Plan Section 4
4-23
Use of contents on this sheet is subject to the limitations specified at the end of this document. F_Section 4 WRF.docx
results and the results presented in this section may be due to specific RIVPLUM6 input parameters (e.g., TMCC) that are adjustable and left to user interpretation. Because Ecology does not define these adjustable parameters in the Fact Sheet, default spreadsheet values were used for the present analysis. Considering that conservative (worst-case) assumptions for effluent/river flows were used to predict dilution, the dilution values presented in Table 4-9 are appropriate for the water quality analyses. If Ecology were to revise its own dilution analysis consistent with the existing Fact Sheet, dilution value results are anticipated to be greater (more favorable for the City) than those in Table 4-9.
4.7.5.3 Conventional Pollutants
Effluent discharge of conventional pollutants, including DO, temperature, pH, and fecal coliform, is not anticipated to impact water quality-based criteria for the predicted 2030 effluent discharge. Analyses for each of these discharge components are described below.
4.7.5.3.1 Dissolved Oxygen
Bacteria present in water decompose organic material (BOD) using DO, thus reducing the DO present for fish. The Ecology analysis of the impact of the discharged BOD load presented in the NPDES permit Fact Sheet indicated that using worst-case assumptions, BOD was not predicted to cause a violation of the DO criterion for Core Summer Salmonid Habitat (9.5 mg/L). The Ecology analysis was updated for this document to incorporate 2030 maximum month discharge flows (1.22 mgd) and utilized the same conservative BOD discharge concentrations of 45 mg/L. The resulting revised analysis predicts a minimum downstream DO concentration of 9.87 mg/L, meeting the applicable water quality standard. Therefore, the technology-based effluent limits (Section 4.7.4 apply to the discharge. DO analysis results are provided in Appendix 4F.
4.7.5.3.2 Temperature
The temperature criterion for Core Summer Salmonid Habitat is 16 degrees Celsius (°C). The temperature standard is applied to the highest 7-day maximum temperature (90th percentile data). In addition, in instances where the ambient water temperature is cooler than the standard, the amount of warming due to a single-point source may not exceed 28/(T+7) (in °C where “T” is the ambient water temperature).
The Ecology analysis in the Fact Sheet appears to evaluate temperature with respect to an outdated standard; therefore, the temperature analysis was revised. A simple mixing analysis was performed using the following formula to determine the necessary mixing required to meet the temperature standard at critical effluent and receiving water temperatures: DF = (Te – Ta)/(T – Ta)
Where DF = Required dilution factor Te = Critical effluent temperature Ta = Critical ambient temperature T = Water quality temperature standard
Critical period (August through October) ambient and effluent temperatures are 15°C (from the Fact Sheet) and 21.0°C (90th percentile of DMR data), respectively. The dilution factor required to meet the temperature water quality standard of 16.0°C is 6.0. The applicable chronic dilution from Table 4-9 is 21.6, which exceeds the necessary dilution to meet the temperature standard.
Applying the chronic dilution (21.6) to the above formula and solving for T results in a mixed temperature of 15.3°C at the chronic mixing zone boundary, or an increase of 0.3°C over ambient temperature. This increase is well within the allowed temperature increase (1.24°C) calculated from the formula 28/(T+7) identified as part of the water quality criterion.

Section 4 City of Yelm General Sewer Plan
4-24
Use of contents on this sheet is subject to the limitations specified at the end of this document. F_Section 4 WRF.docx
The effluent discharge is anticipated to meet temperature water quality standards. There are no technology-based effluent limits for temperature; therefore, no effluent temperature limits are anticipated.
4.7.5.3.3 pH
The pH criterion for Core Summer Salmonid Habitat is within the range of 6.5 and 8.5, with a human caused variation within the above range not to exceed 0.2. In the NPDES permit Fact Sheet, Ecology evaluated the impact of discharged pH using the Ecology model PHMIX2. The Ecology analysis was updated for this document to incorporate chronic dilution at 2030 maximum month discharge flows and more recent effluent data (pH, temperature, and alkalinity). The resulting revised analysis predicts minimum and maximum pH values of 6.04 and 6.05, respectively. The predicted pH within the mixing zone is below the pH standard of 6.5, but only due to the low ambient pH utilized by Ecology (6.0), which itself is below the standard. The human-caused variation from the ambient condition is within allowable limits. Therefore, as was determined by Ecology in the existing Fact Sheet, the pH limitations for discharge to the river are between 6.5 (water quality-based limit) and 9.0 (technology-based limit). Discharge to the Power Canal would utilize only technology-based limits (pH between 6 and 9) because of the absence of fish species.
4.7.5.3.4 Fecal Coliform
The fecal coliform criterion for waters classified for Primary Contact Recreation states that fecal coliform organisms may not exceed a geometric mean value of 100 organisms per 100 mL, with not more than 10 percent of samples exceeding 200 organisms per 100 mL. The fecal coliform analysis presented in the NPDES permit Fact Sheet (see Appendix 1A) is assumed to apply for any future discharge:
The reach of the Nisqually River has been listed on the Ecology 303(d) list as impaired for fecal coliform bacteria. Therefore, the surface water criterion for fecal coliform for a Class A (now Primary Contact Recreation) receiving water was imposed for Outfall #002 (Centralia Power Canal) and Outfall #003 (Nisqually River) instead of the technology-based limitation for fecal coliform bacteria.
Testing for fecal coliform bacteria will not be required as long as each daily result from the total coliform bacteria test for the effluent is less than the monthly average permit limit set for fecal coliform. When any result for total coliform exceeds the monthly limit for fecal coliform, the fecal coliform test shall be performed a minimum of twice a week until each result from the last seven tests for total coliform are less than the fecal coliform monthly limit.
4.7.5.4 Toxic Pollutants
Water quality criteria for toxic pollutants are evaluated using procedures from Ecology’s Permit Writer’s Manual (Ecology, 2008) and the USEPA Technical Support Document for Water Quality Based Toxics Control (USEPA, 1991). The process for determining whether a discharge has the potential to cause an exceedance of water quality criteria for toxic pollutants is called a Reasonable Potential Analysis. The analysis utilizes available ambient and effluent pollutant data, factors of safety related to the number and distribution of data, and effluent dilution values. If there is a reasonable potential to exceed water quality standards (“yes” result for the Reasonable Potential Analysis), then Ecology will place effluent limits for the appropriate pollutant in the NPDES permit.
The results of this section are a prediction of effluent limits that would be applied by Ecology in a future NPDES permit based upon the effluent/ambient water quality data and effluent dilution within the mixing zone presented in previous sections. The reasonable potential analysis is a long-term planning tool for future treatment needs, providing the City time to evaluate, plan for, and implement treatment improvements or modifications if the analysis indicates a potential water quality concern. This analysis

City of Yelm General Sewer Plan Section 4
4-25
Use of contents on this sheet is subject to the limitations specified at the end of this document. F_Section 4 WRF.docx
shows that there is no reason to expect that any discharge limits will be made more stringent in future NPDES permits.
Toxic pollutants that have been identified in the effluent include residual chlorine, ammonia, and metals. Of the metals included in the quarterly metals analyses between 2006 and 2011, only three are routinely detected above analytical method detection levels: copper, nickel, and zinc. Lead has been detected twice, in March 2008 and December 2010. All other metals, including arsenic, cadmium, chromium, iron, mercury, and silver, are always non-detect with respect to the analytical detection limit.
Table 4-10 summarizes the input data and the results of the Reasonable Potential Analysis and presents an “RPA Ratio” for each contaminant. The RPA Ratio is the ratio of the predicted contaminant concentration at the mixing zone boundary to the regulatory standard. The higher the RPA Ratio, the closer the predicted contaminant concentration is to the standard. Of the toxic pollutants, only copper is near the water quality standard that would trigger Ecology to develop an effluent limit for copper within the NPDES permit. Detailed spreadsheets presenting the Reasonable Potential Analysis calculation are presented in Appendix 4G.
Table 4-10. Reasonable Potential Analysis Results Summary
Copper (µg/L) Lead (µg/L) Nickel (µg/L) Zinc (µg/L) Residual
chlorine (mg/L) Ammonia
(mg/L as NH3-N)
Coefficient of variation 0.52 0.60 0.20 0.18 0.87 2.05
Number of sample points 21 21 21 21 2,095 351
95th percentile concentration 34.6 0.8 2.9 51.3 0.05 23.2
Water quality standard
Acute 5.7 17.9 532 97.4 19.0 24.6
Chronic 3.3 0.5 46.0 42.9 11.0 2.11
Ambient concentration 0.736 0.032 0.0 1.104 0.0 0.0
Mixed concentration
@ Acute boundary 5.63 0.09 0.64 30.5 0.01 4.63
@ Chronic boundary 1.87 0.04 0.15 2.48 0.00 1.07
Reasonable potential?
@ Acute boundary NO NO NO NO NO NO
@ Chronic boundary NO NO NO NO NO NO
RPA ratio
@ Acute boundary 0.99 0.00 0.00 0.31 0.00 0.19
@ Chronic boundary 0.57 0.09 0.00 0.06 0.00 0.51
Note: The Reasonable Potential Analysis calculations take into account metals translator values, which Ecology did not account for in the existing NPDES permit Fact Sheet. Metals translator values are used because water quality standards are based upon the dissolved metal fraction while permit limits are based upon total metals concentration. The relationship between total and dissolved metals concentrations is site-specific. The ambient total and dissolved metals data collected by the City during the 2000–04 receiving water study were used to calculate site-specific metals translator values.
Section 4 City of Yelm General Sewer Plan
4-26
Use of contents on this sheet is subject to the limitations specified at the end of this document. F_Section 4 WRF.docx
The following conclusions can be made based upon the Reasonable Potential Analysis results: • Chlorine residual: There is no reasonable potential to exceed chlorine residual water quality standards.
Therefore, technology-based effluent permit limits should apply. The existing NPDES permit applies more stringent permit limits for discharge to the river. The existing chlorine residual permit limits should be modified to technology-based limits in the next NPDES permit revision.
• Ammonia: There is no reasonable potential to exceed ammonia water quality standards. The existing NPDES permit applies an ammonia limit based upon the expected performance of the WRF as stated in the 1995 Facilities Plan. Section 4.8 presents a detailed discussion of the capacity of the WRF with respect to ammonia.
• Metals: For all metals there is no reasonable potential to exceed applicable water quality standards. Therefore, no effluent limits are required and the existing effluent limit for lead should be removed in the next NPDES permit revision.
Results of the Reasonable Potential Analysis indicate that the discharge of copper within the effluent is very near to having a reasonable potential to cause a violation of water quality standards. Minor modifications to the Reasonable Potential Analysis assumptions could change the results such that an NPDES permit limit for copper would be required. Although the Reasonable Potential Analysis process is conservative by design and is based upon 2030 flow data, the City is aware that additional copper analyses may be required in the future should effluent copper concentrations increase beyond current values. The City will ensure that proper sampling techniques are followed during quarterly metals sampling to minimize sources of sample contamination. Ecology will evaluate the need for copper effluent limits with each permit renewal based upon the most recent effluent metals concentration data.
For planning purposes, potential permit limits for copper were projected using Ecology procedures adopted from the USEPA Technical Support Document for Water Quality Based Toxics Control (USEPA, 1991). The projected daily maximum copper limit is 45.6 µg/L for the 2030 design condition. None of the effluent metals samples collected between 2006 and 2011 has exceeded this value.
4.7.6 Human-Health-Based Effluent Limits Washington State water quality standards include numeric human-health-based criteria promulgated for the state by USEPA in its National Toxics Rule (Federal Register, Vol. 57, No. 246, 1992). The existing NPDES permit Fact Sheet (see Appendix 1A) states that the WRF discharge is unlikely to contain chemicals regulated for human health, and thus the discharge is not currently regulated for human-health-based criteria. The discharge will be reevaluated for impacts to human health during each permit renewal cycle. Wastewater system growth is not anticipated to change the nature of the effluent discharge with respect to pollutants regulated for human health as the industrial wastewater flow contribution is anticipated to be minor.
4.7.7 Summary of Findings Table 4-11 summarizes projected NPDES permit limits for the 2030 design condition based upon the analysis presented in this section. For comparison, Table 4-11 provides existing NPDES permit limits. Table footnotes indicate whether the projected limit is governed by technology-based or water quality-based standards. As shown in Table 4-11, none of the discharge limits are anticipated to become more stringent. In some cases, such as lead and residual chlorine, existing limits should be made less stringent or eliminated.

City of Yelm General Sewer Plan Section 4
4-27
Use of contents on this sheet is subject to the limitations specified at the end of this document. F_Section 4 WRF.docx
Table 4-11. Projected NPDES Permit Limits (2030)
Parameter Existing permit limit Projected permit limit
Effluent limit at outfall 2: Centralia Power Canal
BOD a 30 mg/L monthly average (250 lb/d); 45 mg/L weekly average (375 lb/d) Minimum 85% removal
No change
TSS a 30 mg/L monthly average (250 lb/d); 45 mg/L weekly average (375 lb/d) Minimum 85% removal
No change
Fecal coliform bacteria b 100 per 100 mL monthly average; 200 per 100 mL weekly average No change
pH a Shall be between 6.0 and 9.0 on a daily basis No change
Total residual chlorine (mg/L)a 0.5 mg/L monthly average; 0.75 mg/L weekly average No change
Total ammonia (mg/L) c 3 mg/L monthly average; 4.5 mg/L weekly average No change
Effluent limit at outfall 3: Nisqually River
BOD a 30 mg/L monthly average (250 lb/d); 45 mg/L weekly average (375 lb/d) Minimum 85% removal
No change
TSS a 30 mg/L monthly average (250 lb/d); 45 mg/L weekly average (375 lb/d) Minimum 85% removal
No change
Fecal coliform bacteria b 100 per 100 mL monthly average; 200 per 100 mL weekly average No change
pH a,b Shall be between 6.5 and 9.0 on a daily basis No change
Total ammonia (mg/L) c 3 mg/L monthly average; 4.5 mg/L weekly average No change
Total residual chlorine (mg/L)a 0.047 mg/L monthly average; 0.124 mg/L maximum day 0.5 mg/L monthly average; 0.75 mg/L weekly average
Total lead (µg/L)b 10 µg/L monthly average; 15 µg/L maximum day --- a. Technology-based limit. b. Water quality-based limit. c. Limit based upon expected WRF performance.
4.8 Treatment Capacity Assessment In June 2011, the City retained Brown and Caldwell to develop a computerized process model to help determine the cause of insufficient denitrification occurring at the WRF and to estimate the treatment capacity of the WRF with respect to nitrogen removal. The model for the activated sludge secondary treatment processes at the Yelm WRF was created using the BioWin simulator, developed by EnviroSim Associates Ltd of Flamborough Ontario, Canada. BioWin allows the prediction of complex biological interactions using various mechanistic and empirical models to represent material transformations and pollutant removals in the plant for both liquid and solids process streams.
4.8.1 Wastewater Characterization In order to collect sufficient detailed data and to allow calibration of the BioWin process simulator, a detailed wastewater sampling and characterization (WWC) was performed at the WRF. The sampling program consisted of a 4-day period of 24-hour composite samples of influent and effluent process streams from September 6–12, and 1 day of 2-hourly grab sampling on September 11. A technical memorandum describing the methodology and results of the wastewater characterization sampling is included as part of the Reasonable Potential Analysis presented in Appendix 4G.
4.8.2 Process Model Calibration Calibration of the BioWin model was checked against WRF operating data during the wastewater characterization period to produce a final calibrated dynamic model that accurately depicts the

Section 4 City of Yelm General Sewer Plan
4-28
Use of contents on this sheet is subject to the limitations specified at the end of this document. F_Section 4 WRF.docx
nitrifying/denitrifying conditions at the WRF. Dynamic inputs were developed using the diurnal data collected during the wastewater sampling periods. The results of the dynamic simulations were compared to the effluent and mixed liquor characteristics measured during the WWC period to verify that the model was properly calibrated. Calibration was considered complete when effluent characteristics produced by the simulator model matched, as closely as possible, the actual plant performance during the WWC period. A detailed description of the model calibration and results is included in the SBR modeling evaluation technical memorandum in Appendix 4H.
4.8.3 Results of BioWin Process Modeling Once calibrated, the BioWin model was used to simulate the following six operating configurations at the plant: 1. Summer temperatures, two SBR basins in operation, meeting a reclaimed water permit limit of 10 mg/L
total nitrogen (TN) 2. Summer temperatures, three SBR basins in operation, meeting a reclaimed water permit limit of 10
mg/L TN 3. Summer temperatures, two SBR basins in operation, meeting a permit limit of 3 mg N/L ammonia for
discharge to the Centralia Power Canal 4. Winter temperatures, two SBR basins in operation, meeting a reclaimed water permit limit of 10 mg/L
TN 5. Winter temperatures, three SBR basins in operation, meeting a reclaimed water permit limit of 10 mg/L
TN 6. Winter temperatures, three SBR basins in operation, meeting a permit limit of 3 mg N/L ammonia for
discharge to the Centralia Power Canal
Based on the results of the model calibration and subsequent modeling results, the following conclusions can be made. All of these findings are contingent on improvements being made to the WRF as described in the following sections to improve treatment reliability. • The capacity of the WRF has been reached in current operating configuration. Results of the capacity
evaluations are summarized on Table 4-12. For each operating condition the table shows the following: − The maximum monthly flow that can be treated while achieving the associated permit limit − The amount of readily biodegradable chemical oxygen demand (RBCOD) that needs to be added as a
supplemental food source to support denitrification − The amount of alkalinity, in the form of lime, that needs to be added to support nitrification
Table 4-12. Treatment Capacity Evaluation Summary
Capacity condition Treatment capacity (mgd) RBCOD addition Lime addition Summer, 2 SBRs, 10 mg/L TN 0.45 mgd 330 lb/d 0 lb/d
Summer, 3 SBRs, 10 mg/L TN 0.67 mgd 830 lb/d 0 lb/d
Summer, 2 SBRs, 3 mg N/L ammonia 0.89 mgd 0 lb/d 1,190 lb/d
Winter, 2 SBRs, 10 mg/L TN 0.37 mgd 250 lb/d 0 lb/d
Winter, 3 SBRs, 10 mg/L TN 0.56 mgd 500 lb/d 0 lb/d
Winter, 3 SBRs, 3 mg N/L ammonia 0.74 mgd 0 lb/d 950 lb/d

City of Yelm General Sewer Plan Section 4
4-29
Use of contents on this sheet is subject to the limitations specified at the end of this document. F_Section 4 WRF.docx
• The treatment capacity of the WRF is limited by a lack of available COD that is required for denitrification and a lack of alkalinity that is required for nitrification, especially during cold winter months. The addition of RBCOD in the form of a supplemental carbon source is required to achieve effluent nitrogen limits in all scenarios, as the current influent RBCOD is insufficient to drive denitrification to meet effluent total nitrogen limit of 10 mg/L or less. The addition of alkalinity in the form of lime or caustic soda is required if the SBRs are required to achieve nitrification for discharge to the Power Canal.
• At winter operating conditions with two SBRs in operation, the WRF is currently operating at capacity. In 2011 the average annual flow was 0.36 mgd and the table shows that the treatment capacity was 0.37 mgd. The table shows that at summer conditions, there is approximately 0.08 mgd of capacity remaining if two SBRs are in service.
• Lack of process controls and documented SOPs decrease WRF reliability. For example, the DO concentrations in the SBRs vary significantly from the control set points in the control program due to a lack of turn-down capacity with the blowers. Over-aeration is common and DO concentrations at saturation (8–9 mg/L) are frequently observed. This additional DO is frequently carried over through the settling and decant phases of the SBR into the anoxic phase of the next cycle. This additional DO reduces the amount of time available in the anoxic phase and also reduces the amount of soluble COD available during the anoxic phase for denitrification. This detrimentally affects denitrification at the WRF and limits the ability of the WRF to meet effluent total nitrogen requirements for reclaimed water production.
• Significant inert suspended solids (ISS) are added to the wastewater, from both lime addition for pH control and from PAX addition as a coagulant for tertiary sand filtration and for control of Microthrix in the winter. While this additional ISS does not detrimentally affect performance, the additional solids added to the system reduce overall system treatment capacity. However, it is important to point out that the addition of these compounds is necessary for the performance of the system and cannot be reduced or eliminated at this time.
4.8.4 Summary With two SBRs in service, the Yelm WRF is essentially operating at capacity with respect to meeting the total nitrogen limit of 10 mg/L that is necessary to meet the reclaimed water permit requirement. For the WRF to operate reliably at this capacity, a system to add supplemental carbon needs to be constructed and improvements to the WRF controls need to be implemented.
4.9 Planned Improvements for Reliability (Short Term) The previous section shows that the WRF has reached its treatment capacity with respect to nitrogen, and is unable to reliably provide reclaimed water for irrigation and Cochrane Park. The City recognized the need to consider short-term O&M improvements that would increase reliability until a larger expansion to increase capacity could be planned, designed, and constructed.
A BCE was completed to evaluate alternatives to produce reclaimed water in the short term before long-term improvements (providing at least 10 years of additional capacity) are fully planned, designed, and constructed. The following sections summarize the BCE.
4.9.1 Problem Statement and Level-of-Service Goal The goal identified by the City and its consultant was to evaluate plant upgrade options to provide reasonable confidence that the reclaimed water permit can be met by summer 2012.

Section 4 City of Yelm General Sewer Plan
4-30
Use of contents on this sheet is subject to the limitations specified at the end of this document. F_Section 4 WRF.docx
4.9.2 Identify and Analyze Alternatives Based on the operational assessment described in Section 4.5 and the modeling completed to evaluate plant capacity, four general improvement areas were identified to improve the reliability of the WRF: • Change the operating strategy of the SBRs (for example, place the third reactor into service) • Complete instrumentation and control (I&C) upgrades to provide better process awareness and control • Refurbish equipment such as blowers and the alkalinity system to achieve reliable performance • Add supplemental carbon to achieve denitrification and produce reclaimed water
Because the City would use sewer reserve funds to complete the identified improvements, the selected alternative must strike a balance between providing adequate reliability and having a low capital cost. Generally, as reliability increases, so do the cost of the improvements. Therefore, alternatives were identified to determine which improvements will be cost-effective in the short term.
The following alternatives were identified for evaluation in the BCE: • Alternative 1. Do nothing: If improvements are not completed, reclaimed water production will continue
to be unreliable. The BCE assigns a 50 percent chance of making reclaimed water this summer, and 0 percent chance of making reclaimed water throughout the winter.
• Alternative 2. Short-term improvements: The BCE assigned a 90 percent chance of summer reclaimed water production, and 75 percent chance of winter production.
• Alternative 3. Short-term improvements plus I&C/SCADA upgrades: The BCE estimated a 95 percent chance of summer reclaimed water production, and an 80 percent chance for winter production.
• Alternative 4. Structural and process changes: Provides a 95 percent chance of meeting reclaimed water limits year round and would have room for growth. These improvements would not be completed by summer 2012.
Alternative 4 was considered fatally flawed because significant structural improvements should be funded once the financial analysis and CIP have been completed as part of the General Sewer Planning process. Additionally, Alternative 4 did not meet the goal of producing reclaimed water by this summer. Therefore, no further analysis of Alternative 4 was included in the BCE.
4.9.2.1 Capital Costs
Capital costs evaluated for each alternative are summarized in Table 4-13.
Table 4-13. Summary of Improvements for Short-Term BCE Alternatives
Description Alternative 1 Alternative 2 Alternative 3
Carbon addition system
Alkalinity addition system upgrades
Modifications to blower control strategy
Basic instrumentation upgrades
Complete instrumentation upgrades
Implement new SCADA system

City of Yelm General Sewer Plan Section 4
4-31
Use of contents on this sheet is subject to the limitations specified at the end of this document. F_Section 4 WRF.docx
4.9.2.2 Operation and Maintenance Costs
O&M costs are primarily associated with the cost of annual chemical addition for the supplemental carbon source, MicroCg. For planning purposes, it was assumed that 415 lb/day, or approximately 40 gpd, of MicroCg was required for Alternatives 2 and 3. Although Alternatives 2 and 3 also include refurbishment of the alkalinity system, alkalinity would be required only as a backup during periods when reclaimed water was not being produced. The chemical cost associated with alkalinity addition was therefore not included in the BCE for these alternatives. An additional cost was included for operation, maintenance, and data management associated with I&C and SCADA upgrades included in Alternative 3.
4.9.2.3 Repair and Replacement Costs
Repair and replacements costs for the short-term improvements fall outside the evaluated planning window of 2012–14 (assumed date when long-term improvements would be implemented) and therefore were not included in the BCE. All improvements in the BCE could be carried forward as part of the long-term improvements.
4.9.2.4 Risk and Benefit Costs
Existing and pending water rights for the City of Yelm are conditioned upon reclaimed water recharge at Cochrane Park. In the event that reclaimed water is not available, the City runs the risk of compliance issues with Ecology. The BCE assigned a 50, 3, and 2 percent likelihood of water right loss for Alternatives 1, 2, and 3, respectively. A monetary value was assigned to this risk cost based on the value of the water right and the risk of loss.
In the event that reclaimed water is not being produced, the City also runs the risk of the WRF inadequately nitrifying, and failing to meet its ammonia permit limit for the Centralia Power Canal outfall or Nisqually River. The BCE assigns a decreasing risk of a permit violation for Alternatives 1 through 3. The monetary value assigned to each risk cost includes Ecology fines, consultant costs associated with assistance to recover from a plant upset, and the potential for a private lawsuit under the Clean Water Act.
Reclaimed water is required to maintain landscaping at City parks during the summer months. The City has made substantial investments for landscaping and baseball fields at Longmire Park. If reclaimed water is not produced, the City risks loss of investment at these facilities.
Alternative 1 includes risks not associated with the other alternatives because the likelihood of reclaimed water production is less. These risks include a media campaign to provide outreach to existing reclaimed water users as well as a risk associated with the potentially dangerous practice of adjusting alkalinity by manually addling bags of lime to the SBRs.
Benefits for all alternatives include the potential revenue from reclaimed water sales. The benefit value increases as the likelihood of reclaimed water production increases.
4.9.2.5 Summary of BCE Inputs
Table 4-14 summarizes the inputs for each alternative.

Section 4 City of Yelm General Sewer Plan
4-32
Use of contents on this sheet is subject to the limitations specified at the end of this document. F_Section 4 WRF.docx
Table 4-14. Summary of Short-Term Improvement BCE Alternatives
BCE input Alternative 1:
Do nothing Alternative 2:
Short-term improvements
Alternative 3: Short-term improvements plus
I&C/SCADA upgrades
Capital costs
• None • Carbon addition system, using MicroCg as the carbon source
• Alkalinity system upgrade, using MgOH • Limited instrumentation upgrades: replace
DO probes in the SBRs, install influent and effluent ammonia and nitrate probes
• Integrate new instruments with existing SCADA system
• Complete blower modifications: change control strategy and place 3rd SBR into service
• Carbon addition system, using MicroCg as the carbon source (same as Alternative 2)
• Alkalinity system upgrade, using MgOH (same as Alternative 2)
• Install new SCADA system • Substantial instrumentation
upgrades: replace DO probes in the SBRs, install influent and effluent ammonia and nitrate probes, install influent and effluent flow meters to each SBR, ORP meter in each SBR
• Integrate instruments with new SCADA system and add additional controls, including data trending and archive functions
• Complete blower modifications: change control strategy and place 3rd SBR into service (same as Alternative 2)
• Total capital cost: $0 • Total capital cost: $294,000 • Total capital cost: $962,000
O&M costs
• Lime addition • MicroCg for supplemental carbon • MgOH (backup) for alkalinity control
• MicroCg for supplemental carbon • MgOH (backup) for alkalinity control • Maintenance cost for I&C/SCADA
upgrades
• Total annual O&M: $4,000 • Total annual O&M: $74,000 • Total annual O&M: $74,000
Risks
• Public relations: media outreach, response to complaints, negotiations with reclaimed water customers
• Potentially dangerous manual lime addition practices: 2% chance for a disability injury, 10% for minor injury
• Loss of water right: 50% chance • Cost of violating the permit for the
Nisqually River/Centralia Power Canal: 25% chance (includes potential 3rd party lawsuit)
• Loss of landscaping at Longmire Park: 50% chance
• MicroCg has been known to have some issues in the winter. To be conservative, the BCE lowers the chances of producing reclaimed water in the winter to 75%.
• Risk of losing water rights is estimated at 3%
• Risk of violating Nisqually River/Centralia Power Canal permit is estimated at 3%
• Loss of landscaping is estimated at 10%
• Risk of losing water rights estimated at 2%
• Risk of violating Nisqually River/ Centralia Power Canal permit estimated at 2%
• Loss of landscaping estimated at 5%
• Total annual risk: $1.3M • Total annual risk: $100,000 • Total annual risk: $62,000
Benefits • Revenue from reclaimed water
customers • Revenue from reclaimed water customers • Revenue from reclaimed water
customers
• Total annual benefit:$40,000 • Total annual benefit: $74,000 • Total annual benefit: $74,000

City of Yelm General Sewer Plan Section 4
4-33
Use of contents on this sheet is subject to the limitations specified at the end of this document. F_Section 4 WRF.docx
4.9.2.6 BCE Results and Selected Alternative
The results of the analysis were presented to the City on January 27, 2012, and are summarized in Table 4-15. As shown in this table, the alternative with the most favorable (least negative) NPV is Alternative 2.
Table 4-15. Results of Short-Term BCE
Alternative Description Capital outlays Benefits Running costs Risk costs R&R costs NPV
1 Do nothing $0 $200,000 $20,000 $6,420,000 $0 ($6,122,269)
2 Some improvements $294,000 $370,000 $370,000 $500,000 $0 ($784,566)
3 Substantial improvements $962,000 $390,000 $370,000 $310,000 $0 ($1,246,529)
Based on these results, the City selected Alternative 2 for further analysis. Specific improvements identified in the selected alternative, shown in Figure 4-9, include the following: • A new carbon addition system: The addition of supplemental carbon will assist with reducing total
nitrogen levels to the limits established in the WRF’s NPDES permit. The BCE identified a new carbon addition system to be installed on the southwest corner of the chemical feed building at the WRF. Chemical feed would be paced from the influent flow to all three SBRs and fed into the existing sodium hydroxide (NaOH) feed line inside the building for ultimate addition inside the influent stand pipe. The new system would use chemical totes of MicroCg.
• Refurbishment of the existing alkalinity system: The WRF has an alkalinity system that is currently not in service. Refurbishment of the alkalinity system will assist with reducing ammonia levels to the limits established in the WRF’s NPDES permit. Additionally, adjusting alkalinity will assist with reclaimed water corrosivity concerns. The existing NaOH alkalinity system was installed in 2001 but has not been in service since 2003. It consists of a chemical feed pump, dilution tank with mixer, two feed pumps, and associated piping and valves. A control cabinet with relay logic is outside the containment area surrounding the system. The BCE assumes the refurbishment and conversion of this existing system to magnesium hydroxide (MgOH) and the implementation of a new remote telemetry unit (RTU) to replace the existing control cabinet, providing better integration of the system into the WRF control scheme. This system would have the ability to select which of the pH probes at the WRF is the primary control and provide flow-paced dosing accordingly.
• SBR control modifications and instrumentation upgrades: Too much DO in the SBRs can lead to difficulty producing reclaimed water. Modifying the control strategy for the blowers and associated VFDs to allow for on/off capabilities based on DO readings will allow for more flexible process control and will help prevent over-aeration. Instrumentation upgrades, including installation of new ammonia and nitrate analyzers and replacement of existing DO and pH analyzers, will improve process awareness and control. Additional modifications include changes necessary to put the third SBR into service.
As of mid-2012, the City had begun to implement some of the planned improvements and was making modifications to SBR instrumentation and blower controls. The City is completing further investigation of short-term improvements at the WRF concurrently with the completion of this GSP. Investigation will focus on cost-saving interim steps, such as limited instrumentation upgrades (including one ammonia analyzer in one SBR rather than ammonia and nitrate analyzers for influent and effluent to the SBRs, and one hand-held ORP meter rather than replacement of DO probes), evaluation of STEP tank septage as a supplemental carbon source, and a detailed evaluation of the composition of influent TKN that is not in the form of ammonia. Modifications to the blower control strategy are expected to be implemented as assumed in the BCE.

Section 4 City of Yelm General Sewer Plan
4-34
Use of contents on this sheet is subject to the limitations specified at the end of this document. F_Section 4 WRF.docx
4.10 Plan for Long-Term Capacity As described in Section 4.8 the WRF is approaching treatment plant capacity with respect to nitrogen. Once the short-term improvements are completed, the WRF will have remaining capacity for several years, until summer flows reach approximately 0.45 mgd. This is anticipated to occur in approximately 2012–14, depending on how fast growth occurs. The growth projections in Section 2 are conservative and in the first years of the planning period actual growth may be less than projected. In order to provide additional capacity quickly, additional planning for long-term capacity will be required immediately. Following the adoption and approval of the GSP, a long-term plan will be developed in detail in a Facilities Plan to provide enough capacity to serve long-term growth. The Facilities Plan will evaluate plant expansion options and will also examine potential level-of-service alternatives for future reclaimed water production. Potential level-of-service alternatives for reclaimed water include: • Continue to treat all wastewater to Class A reclaimed water standards. This may be accomplished
through expansion and/or modification of SBR process, or implementation of a tertiary process following SBRs. This GSP, including the Reclaimed Water Analysis in Section 5, assumes that all WRF influent will continue to be treated to this level.
• Produce reclaimed water as necessary to meet current mitigation obligations and requirements of existing reclaimed water user agreements. Wastewater effluent in excess of current demands would be treated to a level necessary for discharge to the canal/river, but would not be treated to reclaimed water standards. Future reclaimed water projects would be evaluated based on the costs associated with producing reclaimed water.
• Stop producing reclaimed water. At the initiation of the reclaimed water program, the City Council adopted goals that committed the City to pursue reclamation of 100 percent of Yelm’s wastewater. This alternative would require a reevaluation of those goals. Additionally, the City has water rights that are contingent upon groundwater recharge at the Cochrane Park RIBs. Eliminating recharge at Cochrane Park would require renegotiation of the water rights agreements,
Additional information on the Facilities Plan is included in the CIP described in Section 9.
4.11 Solids Management Plan This section describes the WRF solids management plan, including the existing plan, solids production, and the future biosolids management strategy.
4.11.1 Existing Solids Management Excess biosolids generated within the secondary treatment process are pumped to a 331,700-gallon aerated WAS storage tank. Biosolids from the WAS storage tank are pumped to a GBT designed to dewater biosolids to approximately 5 percent solids. The GBT is currently operated approximately once every 3 days, for 5 to 6 hours per day to produce a 3,500 gallon load of thickened solids for disposal. There is no storage for thickened sludge other than the hopper of the GBT, so disposal occurs on the same day as thickening. Thickened biosolids are hauled by a contract hauler to the City of Tacoma CTP for further solids stabilization and disposal. In 2011, 365,100 gallons of biosolids at an average of 4.8 percent solids, or approximately 74.3 dry tons, were hauled to the City of Tacoma.
Another source of solids within the City wastewater system is septage from the STEP tanks. STEP tank septage is pumped/hauled by a contract hauler to biosolids processing facilities owned and operated by Biorecycling in Shelton and Centralia, Washington. In 2011, the City contracted for the hauling and disposal of 245,820 gallons of septage. Assuming a solids concentration in the septage of 2.0 percent, this equates to approximately 20.5 dry tons.

City of Yelm General Sewer Plan Section 4
4-35
Use of contents on this sheet is subject to the limitations specified at the end of this document. F_Section 4 WRF.docx
Drain-Pro is currently contracted through August 2013 (see Appendix 4I) to haul thickened solids to Tacoma at $0.10 per gallon and pump/haul STEP tank septage to Biorecycling at $0.24 per gallon. An additional state tax of $0.085 is assessed on the septage hauled to Biorecycling. Tacoma also assesses an additional tipping fee of $0.09742 per gallon for the thickened solids. Per connection (annual) and per dry ton costs for septage and WAS disposal are summarized in Table 4-16.
Table 4-16. WAS and Septage Disposal Costs
Per connection (annual) Per dry ton
WAS $33.90 a $968 c
Septage $39.00 b $3,225 d a. Thickened sludge disposal cost was approximately $72,000 in 2011, or $33.90 for each of the 2,125 connections within the collection
system. b. Assuming a 10-year STEP tank pumping interval and a 1,500-gallon tank, septage disposal is approximately $39 per tank per year
(1,500 x $0.24 X 1.085/10). This assumed value compares well to the average septage hauling fee for 2010 and 2011 ($83,250) divided by the existing number of connections (2,125).
c. Thickened sludge disposal cost was approximately $72,000 in 2011 for 74.34 dry tons of solids. d. Septage disposal cost was approximately $66,100 in 2011 for 20.5 dry tons of solids.
4.11.2 Solids Production Assuming continued use of the STEP collection system (see Section 3) and the existing SBR secondary treatment system, WAS and septage solids production will increase proportionately with the growth of the collection system (i.e., the number of new STEP tanks or population served) and influent BOD and TSS loadings at the WRF. Table 4-17 presents 2020 and 2030 solids production estimates for WAS generated at the WRF based upon the projected increase in WRF loading conditions and literature values for biosolids production from TSS and BOD.
Table 4-17. Future Solids Production Estimates
Unit 2020 2030
Influent BOD load lb/day 1,117 1,655
Assumed effluent BOD load a lb/day 50.0 72.6
BOD removed lb/day 1,067.0 1,582.4
Biomass yield b lb/day 640.2 949.4
Influent TSS load lb/day 406 597
Assumed effluent TSS load c lb/day 16.7 24.2
TSS removed lb/day 389.3 572.8
Non-volatile TSS to WAS d lb/day 77.9 114.6
Total solids to WAS lb/day 718.1 1,064.0
Thickened WAS concentration % 4.8 4.8
Total solids volume (to Tacoma) gal/day 1,793.7 2,657.9 a. Assumes average daily flow projection (0.80 mgd for 2020 and 1.16 mgd for 2030) and an effluent concentration of 7.5 mg/L. b. Assumes a yield of 0.6 pound biomass to pounds BOD consumed (Metcalf and Eddy, 1991: Table 8-7). c. Assumes average daily flow projection (0.80 mgd for 2020 and 1.16 mgd for 2030) and an effluent concentration of 2.5 mg/L. d. Assumes 20% inert solids in TSS (Metcalf and Eddy, 1991: Table 3-16).

Section 4 City of Yelm General Sewer Plan
4-36
Use of contents on this sheet is subject to the limitations specified at the end of this document. F_Section 4 WRF.docx
Assuming a 3,500-gallon limit for hauling of thickened solids, the solids projection estimates in Table 4-17 indicate that the existing GBT and solids handling equipment would need to be operated, on average, every 2 days by the 2020 and 2 out of every 3 days in the 2030. It is feasible to operate the solids handling equipment at the frequency required by both the 2020 and 2030 estimates, assuming that most solids handling activities would take place during weekday shifts (Monday through Friday). However, increased solids handling activities will leave less time for other WRF operation and maintenance. Furthermore, considering that the GBT was installed in the late 1990s, it will likely be nearing the end of its useful service life by 2020. The volume of septage handled is less consistent on a year-to-year basis, and is tied to the STEP tank pumping schedule. However, as a long-term average, the City can expect to pump approximately 10 percent of the system STEP tanks annually (pumping schedule of 10 years). It is anticipated that the City will continue to renew a septage hauling contract with a company that has adequate tanker truck capacity to meet City pumping/hauling needs.
4.11.3 Future Biosolids Management Strategy Initial development of the Thurston Highlands MPC is planned for 2020, approximately the same time period that the City may need to replace existing solids handling equipment at the WRF and potentially reevaluate existing solids handling procedures due to increasing operator time constraints. The City will prepare an analysis of the long-term (beyond 10 to 15 years) solids management program for the existing WRF as part of the planning for the satellite treatment facility to serve Thurston Highlands (see Section 6), which will require solids handling facilities to manage increased solids production as a result of a gravity wastewater collection system.
Operation of combined solids management facilities for the two collection and treatment systems would likely be more cost-efficient than individual facilities. A BCE taking into account life-cycle costs for potential biosolids management alternatives, including alternatives that combine solids management facilities for the City of Yelm and Thurston Highlands, would be prepared as part of the Thurston Highlands Wastewater Facilities Plan.
In the short term, the City will continue to manage its biosolids via existing contracts with Drain-Pro, or another private hauler, and the City of Tacoma for pumping, hauling, and further treatment. However, because the City’s current contract with Tacoma is open-ended (Tacoma could terminate the existing agreement at any time), the City will investigate a defined contract term and potential backup plans.

City of Yelm General Sewer Plan Section 4
4-37
Use of contents on this sheet is subject to the limitations specified at the end of this document. F_Section 4 WRF.docx
Figure 4-1. Existing WRF process schematic

Section 4 City of Yelm General Sewer Plan
4-38
Use of contents on this sheet is subject to the limitations specified at the end of this document. F_Section 4 WRF.docx
Figure 4-2. Comparison of influent flow and population trends
Figure 4-3. Effluent flow to permitted points of discharge
0
500
1000
1500
2000
2500
3000
3500
4000
4500
5000
5500
6000
6500
7000
0.000
0.050
0.100
0.150
0.200
0.250
0.300
0.350
0.400
0.450
0.500
1/1/2006 1/1/2007 1/1/2008 1/1/2009 1/1/2010 1/1/2011
Popu
latio
n
Influ
ent f
low
(MGD
)
DateMaximum day flow, by month Average Monthly Flow Population
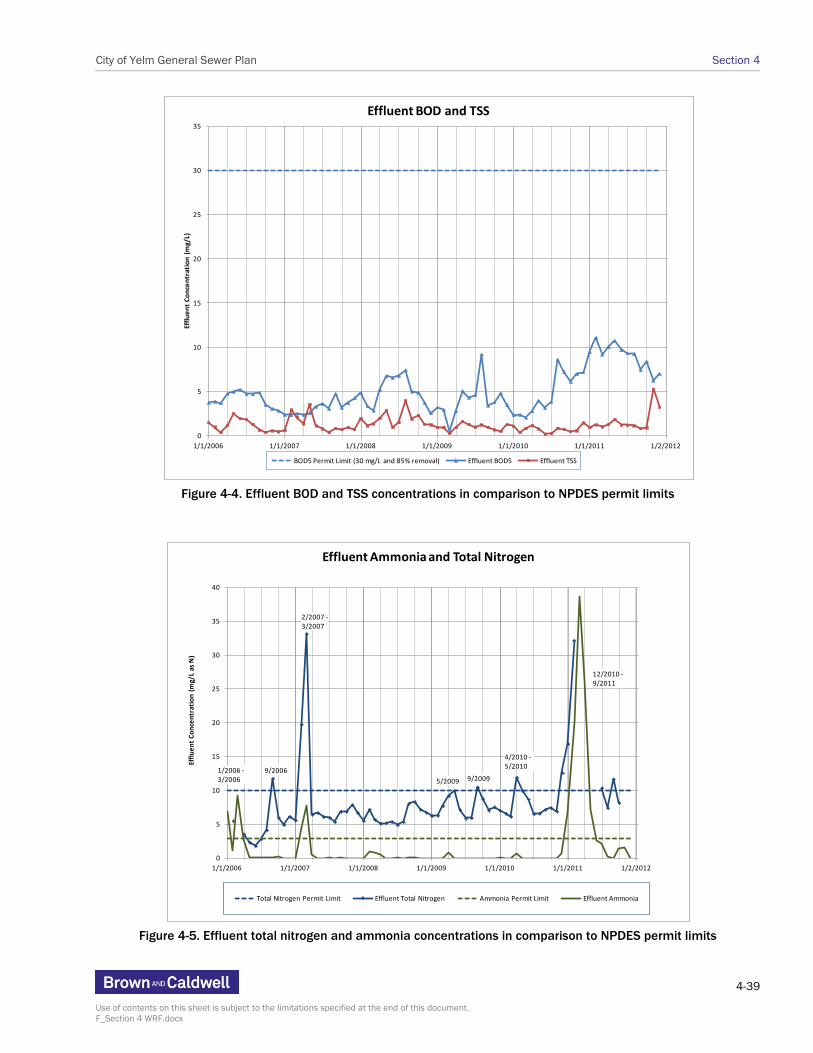
City of Yelm General Sewer Plan Section 4
4-39
Use of contents on this sheet is subject to the limitations specified at the end of this document. F_Section 4 WRF.docx
Figure 4-4. Effluent BOD and TSS concentrations in comparison to NPDES permit limits
Figure 4-5. Effluent total nitrogen and ammonia concentrations in comparison to NPDES permit limits
0
5
10
15
20
25
30
35
1/1/2006 1/1/2007 1/1/2008 1/1/2009 1/1/2010 1/1/2011 1/2/2012
Efflu
ent C
once
ntra
tion
(mg/
L)
Date
Effluent BOD and TSS
BOD5 Permit Limit (30 mg/L and 85% removal) Effluent BOD5 Effluent TSS
0
5
10
15
20
25
30
35
40
1/1/2006 1/1/2007 1/1/2008 1/1/2009 1/1/2010 1/1/2011 1/2/2012
Efflu
ent C
once
ntra
tion
(mg/
L as
N)
Date
Effluent Ammonia and Total Nitrogen
Total Nitrogen Permit Limit Effluent Total Nitrogen Ammonia Permit Limit Effluent Ammonia
9/2006
2/2007 -3/2007
1/2006 -3/2006 5/2009 9/2009
4/2010 -5/2010
12/2010 -9/2011
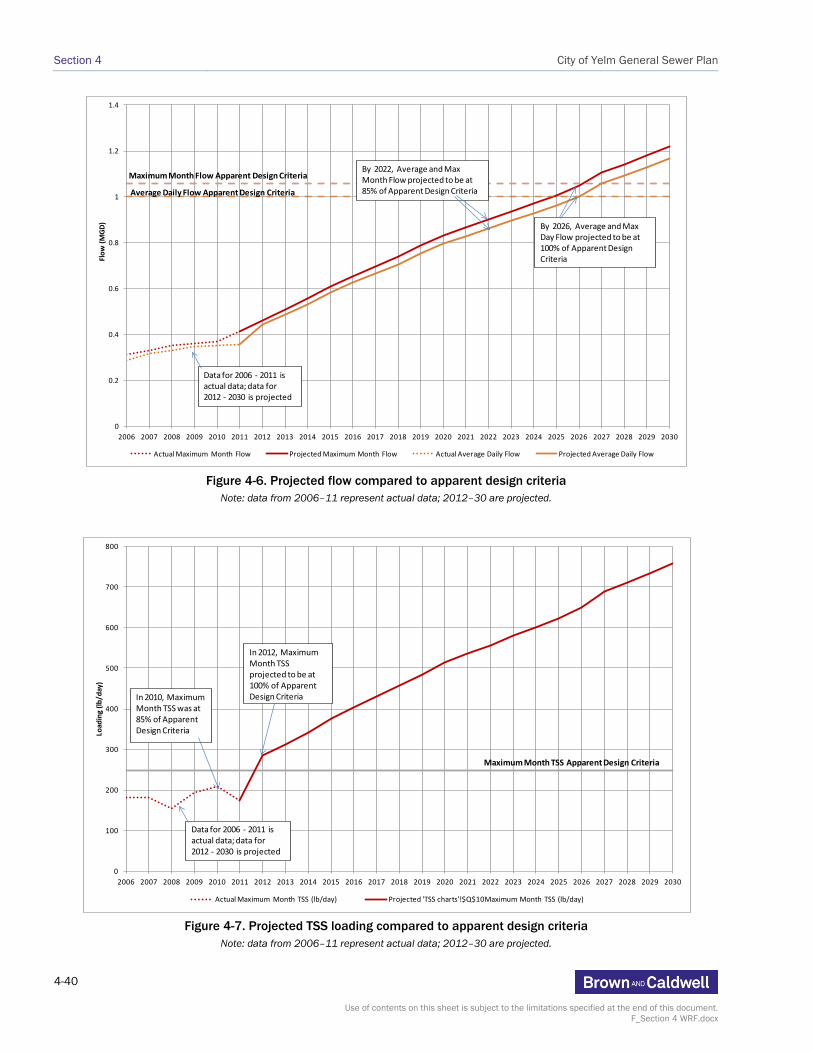
Section 4 City of Yelm General Sewer Plan
4-40
Use of contents on this sheet is subject to the limitations specified at the end of this document. F_Section 4 WRF.docx
Figure 4-6. Projected flow compared to apparent design criteria
Note: data from 2006–11 represent actual data; 2012–30 are projected.
Figure 4-7. Projected TSS loading compared to apparent design criteria
Note: data from 2006–11 represent actual data; 2012–30 are projected.
0
0.2
0.4
0.6
0.8
1
1.2
1.4
2006 2007 2008 2009 2010 2011 2012 2013 2014 2015 2016 2017 2018 2019 2020 2021 2022 2023 2024 2025 2026 2027 2028 2029 2030
Flow
(MGD
)
Actual Maximum Month Flow Projected Maximum Month Flow Actual Average Daily Flow Projected Average Daily Flow
Maximum Month Flow Apparent Design CriteriaBy 2022, Average and Max Month Flow projected to be at 85% of Apparent Design CriteriaAverage Daily Flow Apparent Design Criteria
By 2026, Average and Max Day Flow projected to be at 100% of Apparent Design Criteria
Data for 2006 - 2011 is actual data; data for 2012 - 2030 is projected
0
100
200
300
400
500
600
700
800
2006 2007 2008 2009 2010 2011 2012 2013 2014 2015 2016 2017 2018 2019 2020 2021 2022 2023 2024 2025 2026 2027 2028 2029 2030
Load
ing
(lb/d
ay)
Actual Maximum Month TSS (lb/day) Projected 'TSS charts'!$Q$10Maximum Month TSS (lb/day)
In 2010, Maximum Month TSS was at 85% of ApparentDesign Criteria
In 2012, Maximum Month TSS projected to be at 100% of Apparent Design Criteria
Maximum Month TSS Apparent Design Criteria
Data for 2006 - 2011 is actual data; data for 2012 - 2030 is projected

City of Yelm General Sewer Plan Section 4
4-41
Use of contents on this sheet is subject to the limitations specified at the end of this document. F_Section 4 WRF.docx
Figure 4-8. Projected BOD loading compared to apparent design criteria
Note: data from 2006–11 represent actual data; 2012–30 are projected.
0
500
1000
1500
2000
2500
2006 2007 2008 2009 2010 2011 2012 2013 2014 2015 2016 2017 2018 2019 2020 2021 2022 2023 2024 2025 2026 2027 2028 2029 2030
Load
ing
(lb/d
ay)
Actual Maximum Month BOD (lb/day) Maximum Month BOD (lb/day)
Maximum Month BOD Apparent Design Criteria
By 2020, Maximum Month BOD projected to be at 100% of Apparent Design Criteria
By 2018, Maximum Month BOD is projected to be at 85% of Apparent Design Criteria
Data for 2006 - 2011 is actual data; data for 2012 - 2030 is projected

Section 4 City of Yelm General Sewer Plan
4-42
Use of contents on this sheet is subject to the limitations specified at the end of this document. F_Section 4 WRF.docx
Figure 4-9. Improvements identified in the short-term improvement BCE
MicroCgAddition
1. Construct Carbon Addition (MicroCg) System
3. SBR Control Modifications and instrumentation upgrades-- Improved blower control -- Bring 3rd SBR Online-- Improved Instrumentation and SCADA
2. Refurbish Alkalinity (caustic) System
![pregnancy care guide[1] - Yelm ... - Yelm Family Medicineyelmfamilymedicine.com/.../uploads/2016/07/pregnancy_care_guide2.pdfMaternity Care Yelm Family Medicine ... the hospital if](https://static.fdocuments.in/doc/165x107/5aacbde07f8b9a2b4c8d892b/pregnancy-care-guide1-yelm-yelm-family-medici-care-yelm-family-medicine.jpg)