
401(k) Hot Topics & Trends Insert Name Insert Title Insert Phone Number Insert E-mail Address...
51
401(k) Hot Topics & Trends Insert Name Insert Title Insert Phone Number Insert E-mail Address Fiduciary Trends I Legislation I Investment Expectation I Investment Choices I Fees Participant Attitudes I Participation/Deferral Rates I Plan Sponsor Attitudes
-
Upload
robert-walters -
Category
Documents
-
view
219 -
download
1
Transcript of 401(k) Hot Topics & Trends Insert Name Insert Title Insert Phone Number Insert E-mail Address...
401(k) Hot Topics & Trends
Insert NameInsert Title
Insert Phone Number
Insert E-mail Address
Fiduciary Trends I Legislation I Investment Expectation I Investment Choices I Fees Participant Attitudes I Participation/Deferral Rates I Plan Sponsor Attitudes
Fiduciary Trends
Fiduciary Trends I Legislation I Investment Expectation I Investment Choices I Fees Participant Attitudes I Participation/Deferral Rates I Plan Sponsor Attitudes
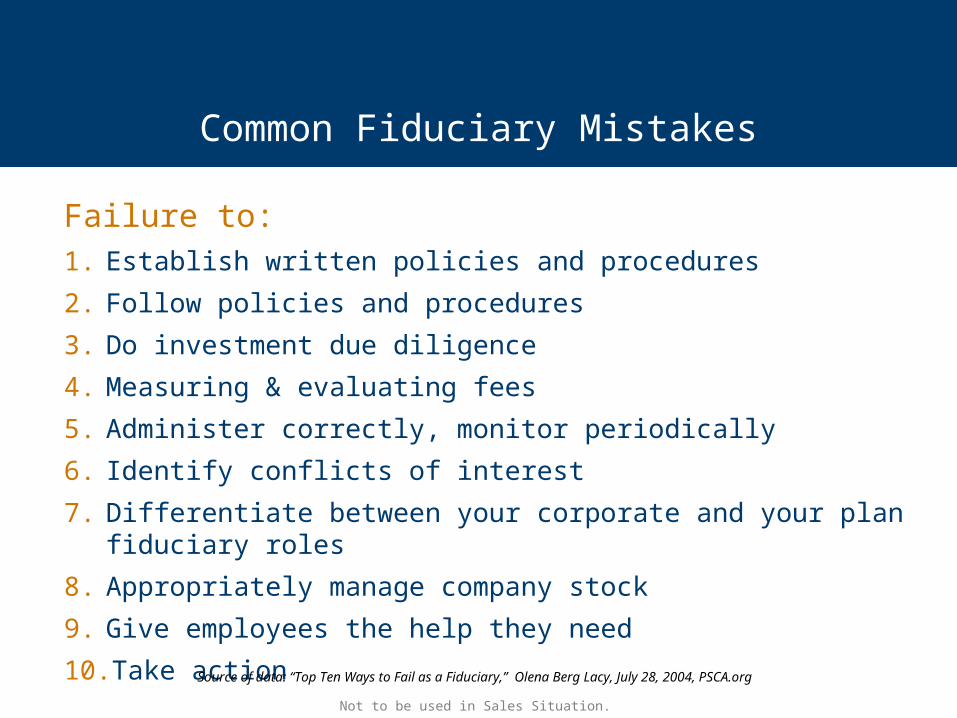
Failure to: 1. Establish written policies and procedures
2. Follow policies and procedures
3. Do investment due diligence
4. Measuring & evaluating fees
5. Administer correctly, monitor periodically
6. Identify conflicts of interest
7. Differentiate between your corporate and your plan fiduciary roles
8. Appropriately manage company stock
9. Give employees the help they need
10. Take actionSource of data: “Top Ten Ways to Fail as a Fiduciary,” Olena Berg Lacy, July 28, 2004, PSCA.org
Common Fiduciary Mistakes
Not to be used in Sales Situation.
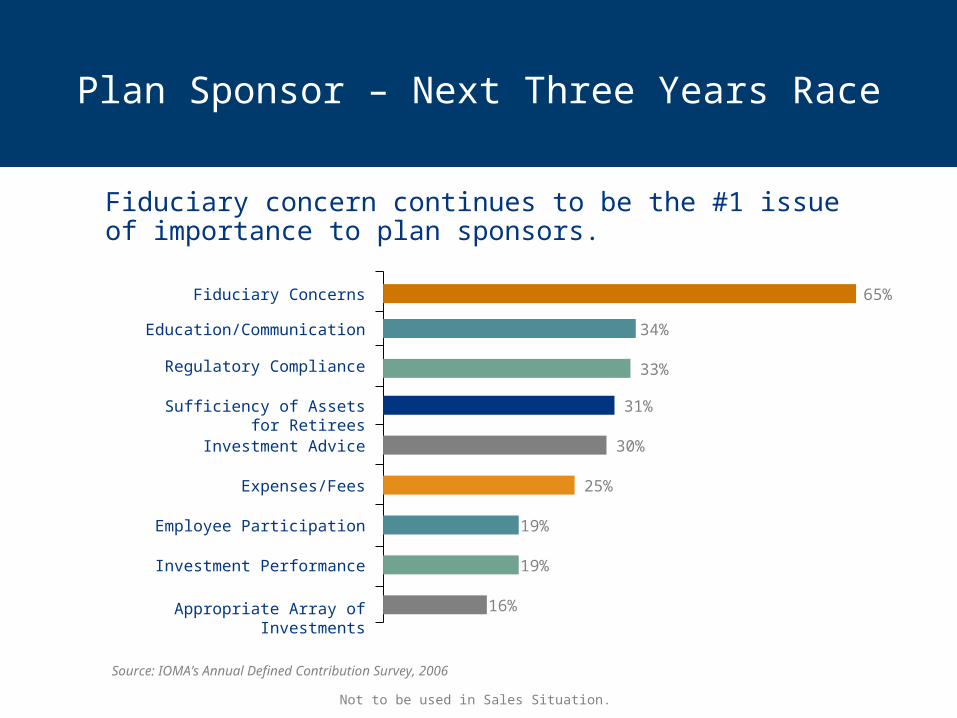
Plan Sponsor – Next Three Years Race
Fiduciary concern continues to be the #1 issue of importance to plan sponsors.
Source: IOMA’s Annual Defined Contribution Survey, 2006
Fiduciary Concerns
Education/Communication
Regulatory Compliance
Sufficiency of Assets for Retirees
Investment Advice
Expenses/Fees
Employee Participation
Investment Performance
Appropriate Array of Investments
65%
34%
33%
31%
30%
25%
19%
19%
16%
Not to be used in Sales Situation.
Common 404(c) Mistakes
Failure to:
• Communicate to participants that the plan intends to comply with 404(c)
• Identify the fiduciary
• Provide participants with prospectuses
Not to be used in Sales Situation.
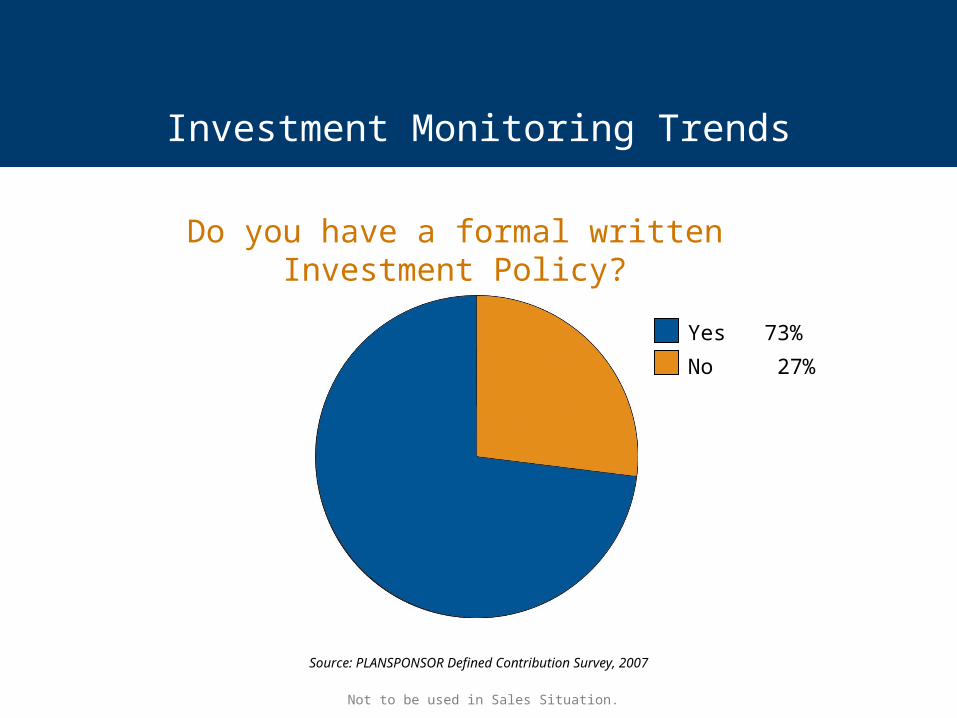
Investment Monitoring Trends
Do you have a formal written Investment Policy?
Source: PLANSPONSOR Defined Contribution Survey, 2007
Yes 73%
No 27%
Not to be used in Sales Situation.
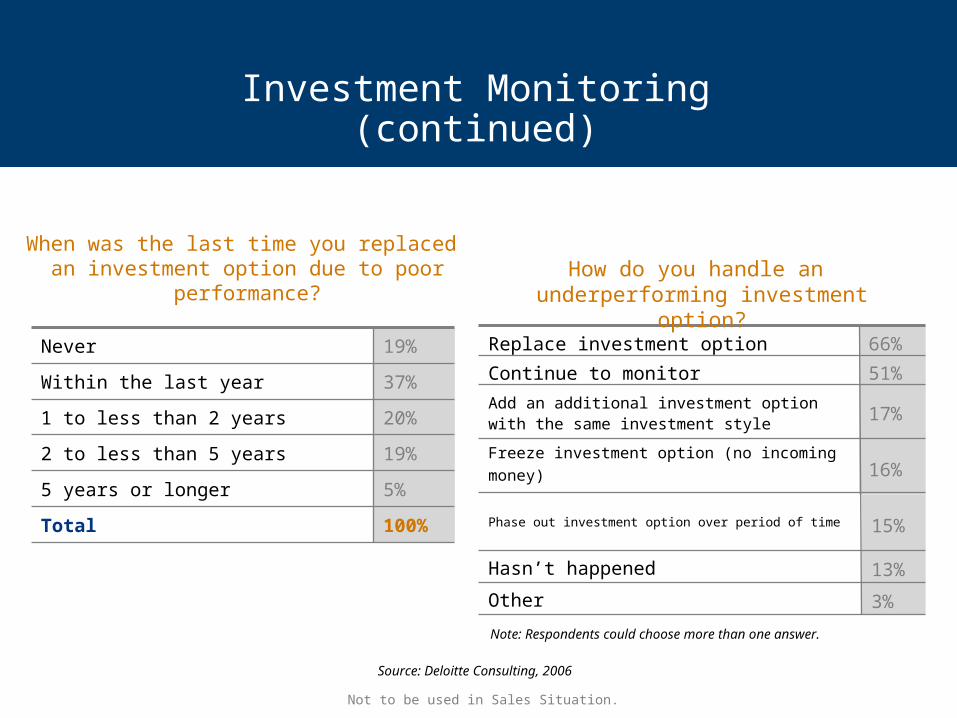
Investment Monitoring (continued)
100%Total
5%5 years or longer
19%2 to less than 5 years
20%1 to less than 2 years
19%Never
37%Within the last year
When was the last time you replaced an investment option due to poor
performance?
Source: Deloitte Consulting, 2006
15%Phase out investment option over period of time
3%Other
13%Hasn’t happened
16%Freeze investment option (no incoming money)
17%Add an additional investment option with the same investment style
51%Continue to monitor
66%Replace investment option
How do you handle an underperforming investment option?
Note: Respondents could choose more than one answer.
Not to be used in Sales Situation.
Legislation
Fiduciary Trends I Legislation I Investment Expectation I Investment Choices I Fees IParticipant Attitudes I Participation/Deferral Rates I Plan Sponsor Attitudes
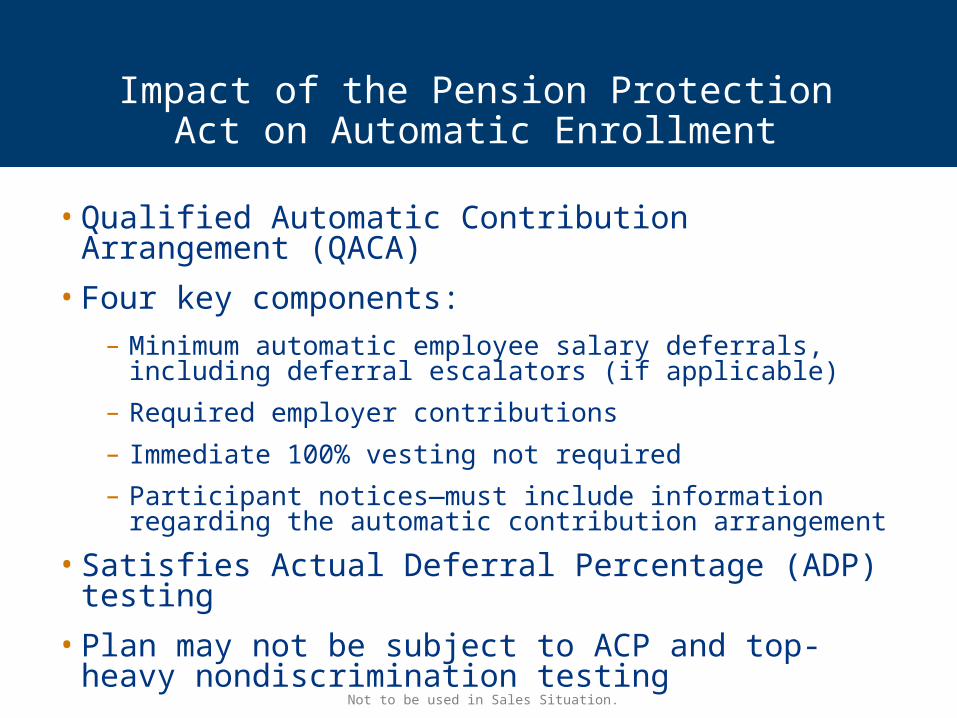
• Qualified Automatic Contribution Arrangement (QACA)
• Four key components:
– Minimum automatic employee salary deferrals, including deferral escalators (if applicable)
– Required employer contributions
– Immediate 100% vesting not required
– Participant notices—must include information regarding the automatic contribution arrangement
• Satisfies Actual Deferral Percentage (ADP) testing
• Plan may not be subject to ACP and top-heavy nondiscrimination testing
Impact of the Pension Protection Act on Automatic Enrollment
Not to be used in Sales Situation.
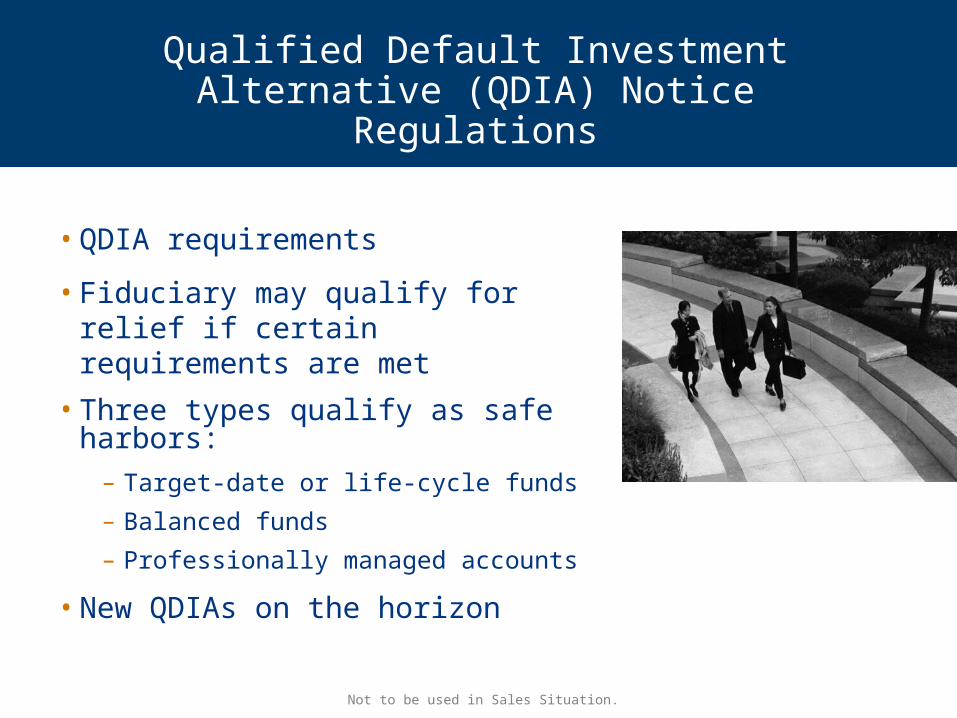
• QDIA requirements
• Fiduciary may qualify for relief if certain requirements are met
• Three types qualify as safe harbors:
– Target-date or life-cycle funds
– Balanced funds
– Professionally managed accounts
• New QDIAs on the horizon
Qualified Default Investment Alternative (QDIA) Notice Regulations
Not to be used in Sales Situation.
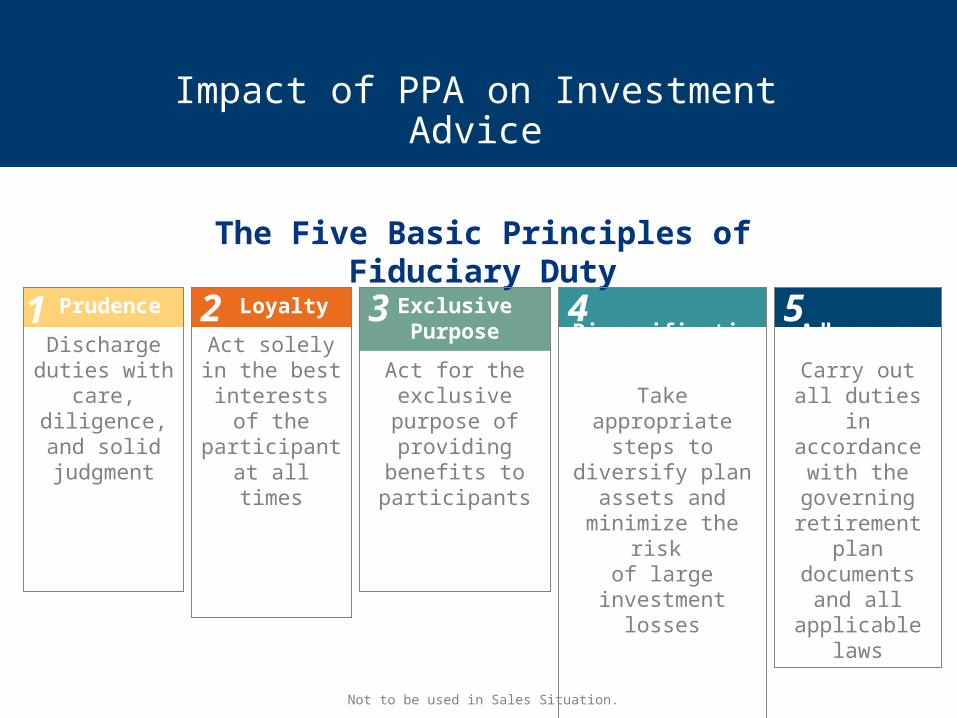
Impact of PPA on Investment Advice
The Five Basic Principles of Fiduciary Duty
Loyalty
Act solely in the best
interests of the participant at
all times
Exclusive Purpose
Act for the exclusive purpose
of providing benefits to participants
Diversification
Take appropriate steps to diversify plan assets and
minimize the risk of large investment
losses
Adherence
Carry out all duties in
accordance with the
governing retirement plan documents and all applicable
laws
Prudence
Discharge duties with
care, diligence, and solid judgment
1 2 3 4 5
Not to be used in Sales Situation.

• Eligible Investment Advice Arrangement (EIAA)
• Disclosure requirements
• Annual compliance audit by independent source
• Exemption from prohibited transaction rules if:
– Flat fee
– Computer model
• Plan sponsor not liable for investment advice, but still responsible for prudent selection & monitoring of fiduciary adviser
Impact of PPA on Investment Advice
Note: Princor Registered Representatives are prohibited from giving investment advice on ERISA-covered assets.
Not to be used in Sales Situation.
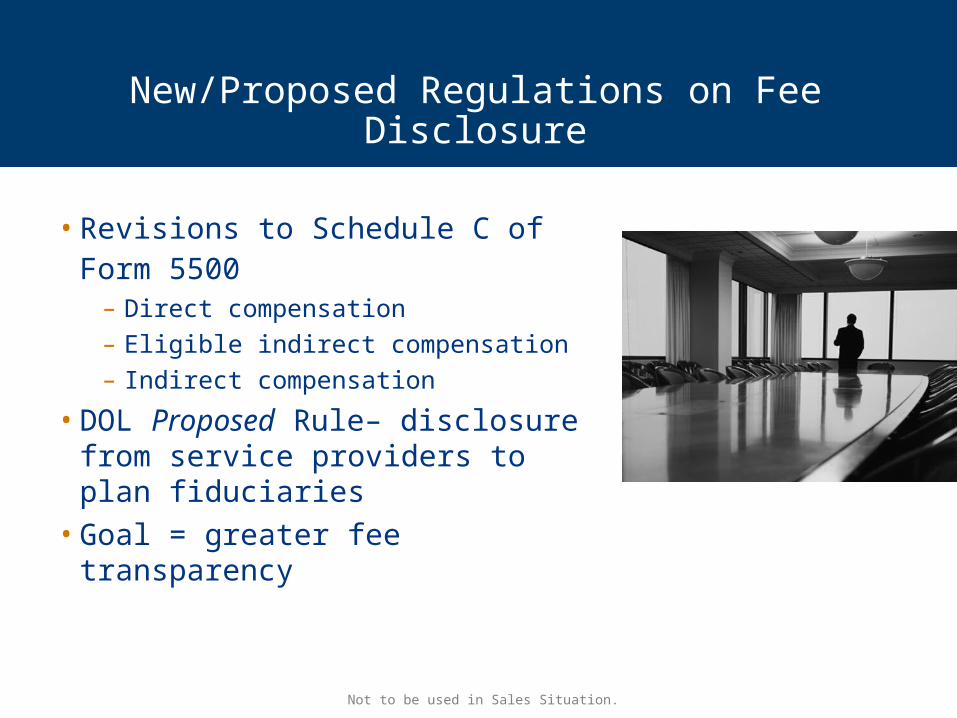
• Revisions to Schedule C of Form 5500
– Direct compensation– Eligible indirect compensation– Indirect compensation
• DOL Proposed Rule– disclosure from service providers to plan fiduciaries
• Goal = greater fee transparency
New/Proposed Regulations on Fee Disclosure
Not to be used in Sales Situation.
Investment Expectation
Fiduciary Trends I Legislation I Investment Expectation I Investment Choices I Fees IParticipant Attitudes I Participation/Deferral Rates I Plan Sponsor Attitudes
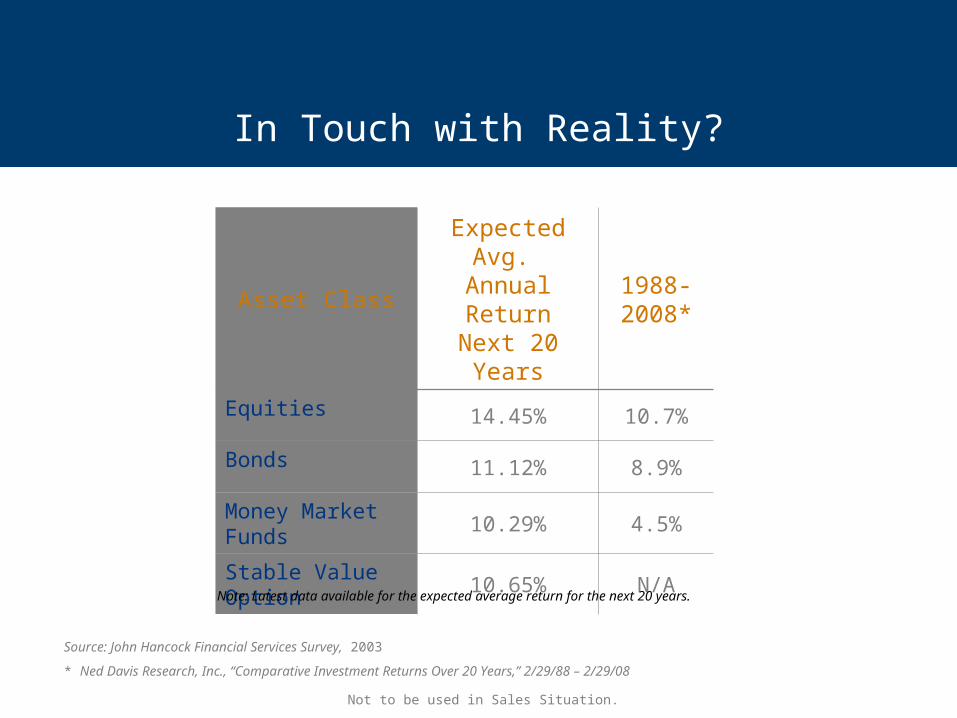
In Touch with Reality?
Asset ClassExpected Avg. Annual ReturnNext 20 Years
1988-2008*
Equities 14.45% 10.7%
Bonds 11.12% 8.9%
Money Market Funds
10.29% 4.5%
Stable Value Option
10.65% N/A
Source: John Hancock Financial Services Survey, 2003
* Ned Davis Research, Inc., “Comparative Investment Returns Over 20 Years,” 2/29/88 – 2/29/08
Note: Latest data available for the expected average return for the next 20 years.
Not to be used in Sales Situation.
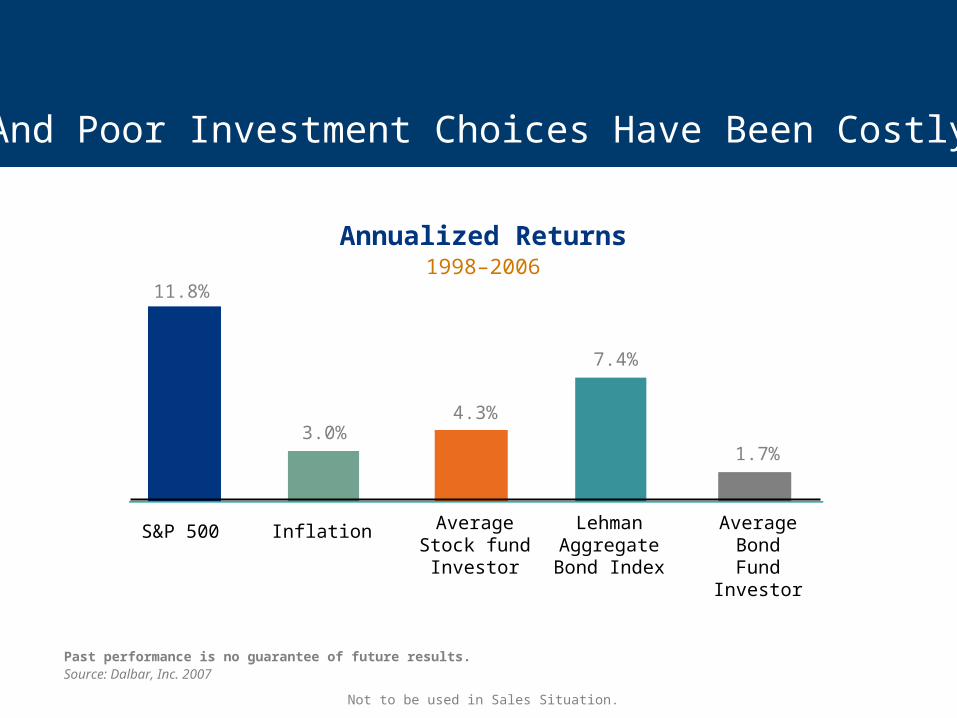
1.7%
7.4%
4.3%
11.8%
3.0%
S&P 500 Inflation Average Stock fund
Investor
LehmanAggregate Bond Index
Average Bond Fund
Investor
Past performance is no guarantee of future results.Source: Dalbar, Inc. 2007
Annualized Returns1998–2006
And Poor Investment Choices Have Been Costly
Not to be used in Sales Situation.
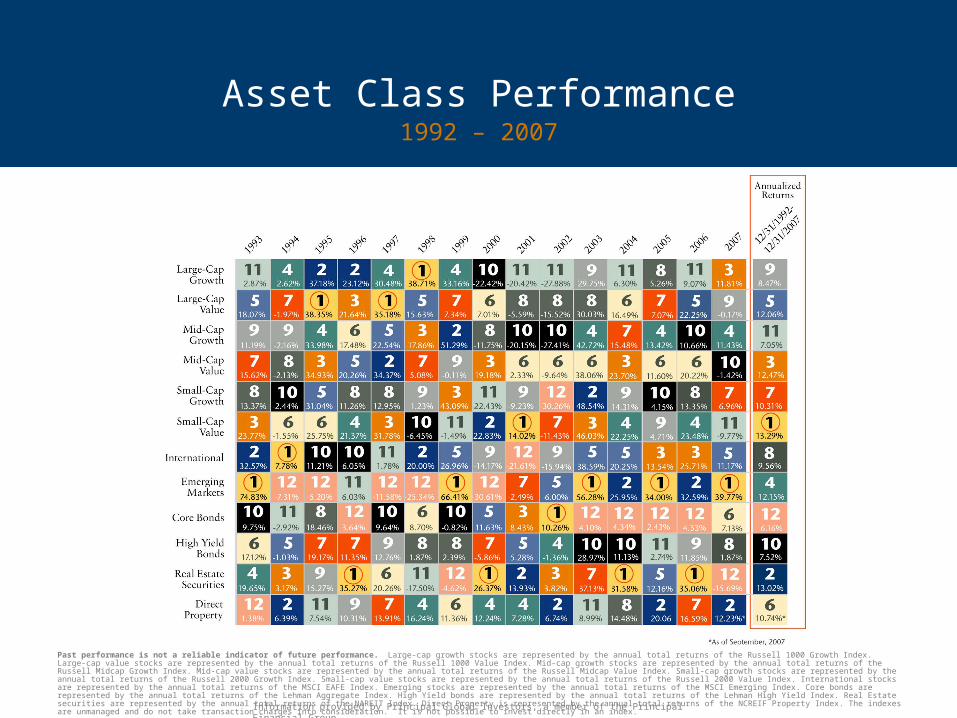
Asset Class Performance1992 – 2007
Past performance is not a reliable indicator of future performance. Large-cap growth stocks are represented by the annual total returns of the Russell 1000 Growth Index. Large-cap value stocks are represented by the annual total returns of the Russell 1000 Value Index. Mid-cap growth stocks are represented by the annual total returns of the Russell Midcap Growth Index. Mid-cap value stocks are represented by the annual total returns of the Russell Midcap Value Index. Small-cap growth stocks are represented by the annual total returns of the Russell 2000 Growth Index. Small-cap value stocks are represented by the annual total returns of the Russell 2000 Value Index. International stocks are represented by the annual total returns of the MSCI EAFE Index. Emerging stocks are represented by the annual total returns of the MSCI Emerging Index. Core bonds are represented by the annual total returns of the Lehman Aggregate Index. High Yield bonds are represented by the annual total returns of the Lehman High Yield Index. Real Estate securities are represented by the annual total returns of the NAREIT Index. Direct Property is represented by the annual total returns of the NCREIF Property Index. The indexes are unmanaged and do not take transaction charges into consideration. It is not possible to invest directly in an index.
Information provided by Principal Global Investors, a member of the Principal Financial Group.
Investment Choices
Fiduciary Trends I Legislation I Investment Expectation I Investment Choices I Fees IParticipant Attitudes I Participation/Deferral Rates I Plan Sponsor Attitudes
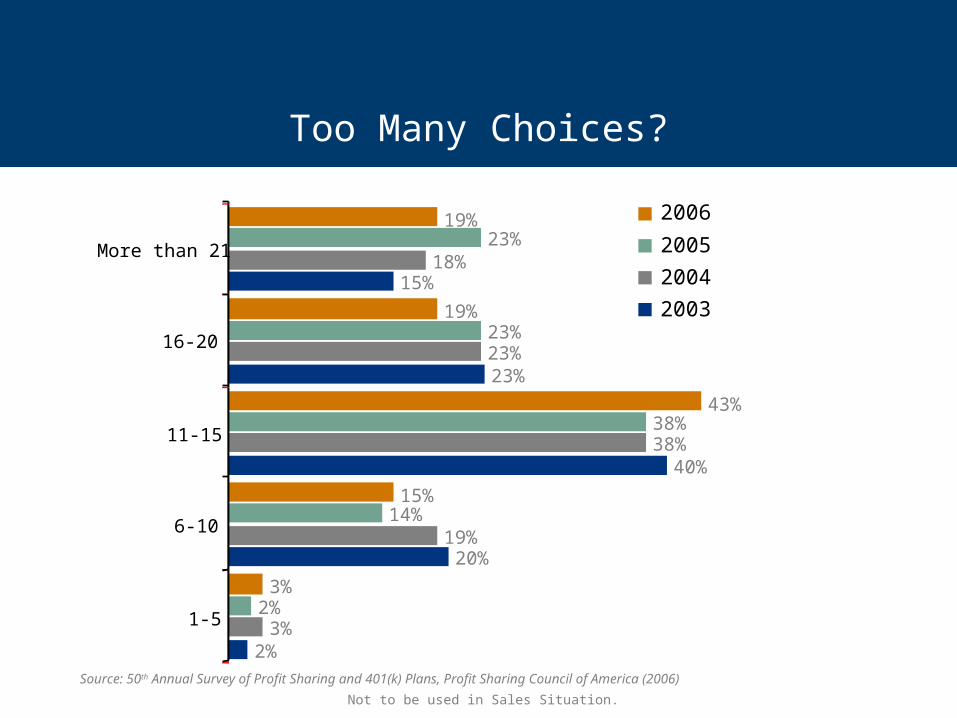
2%
20%
40%
23%
15%
3%
19%
38%
23%
18%
2%
14%
38%
23%
23%
3%
15%
43%
19%
19%
1-5
6-10
11-15
16-20
More than 21
2006
2005
2004
2003
Source: 50th Annual Survey of Profit Sharing and 401(k) Plans, Profit Sharing Council of America (2006)
Too Many Choices?
Not to be used in Sales Situation.
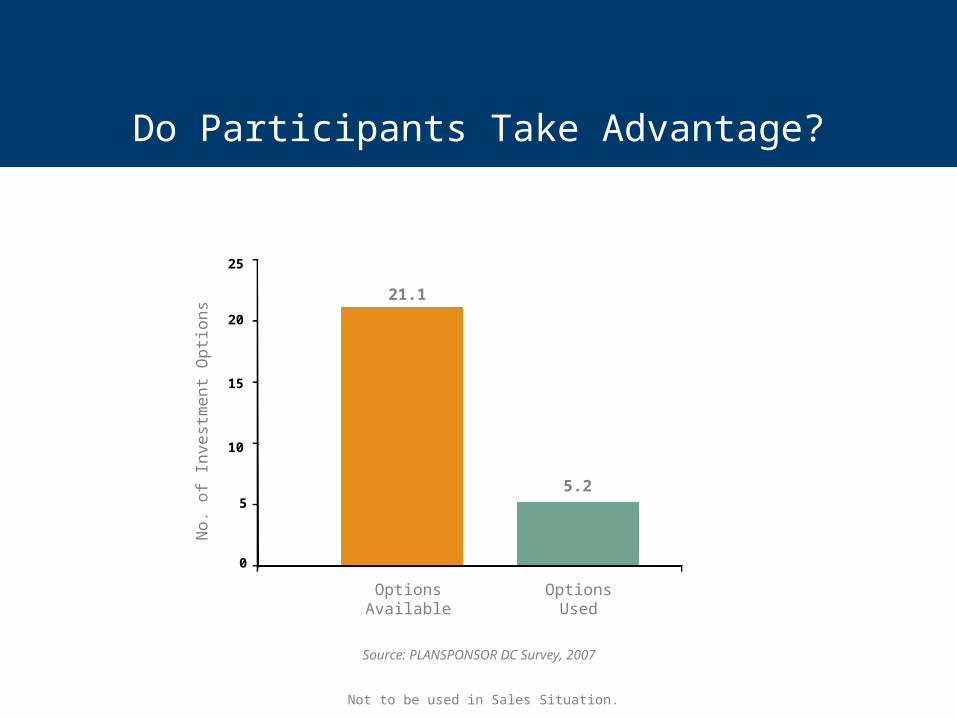
Do Participants Take Advantage?
Options Used
Options Available
Source: PLANSPONSOR DC Survey, 2007
No
. o
f In
vest
me
nt
Op
tion
s
21.1
5.2
0
5
10
15
20
25
Not to be used in Sales Situation.
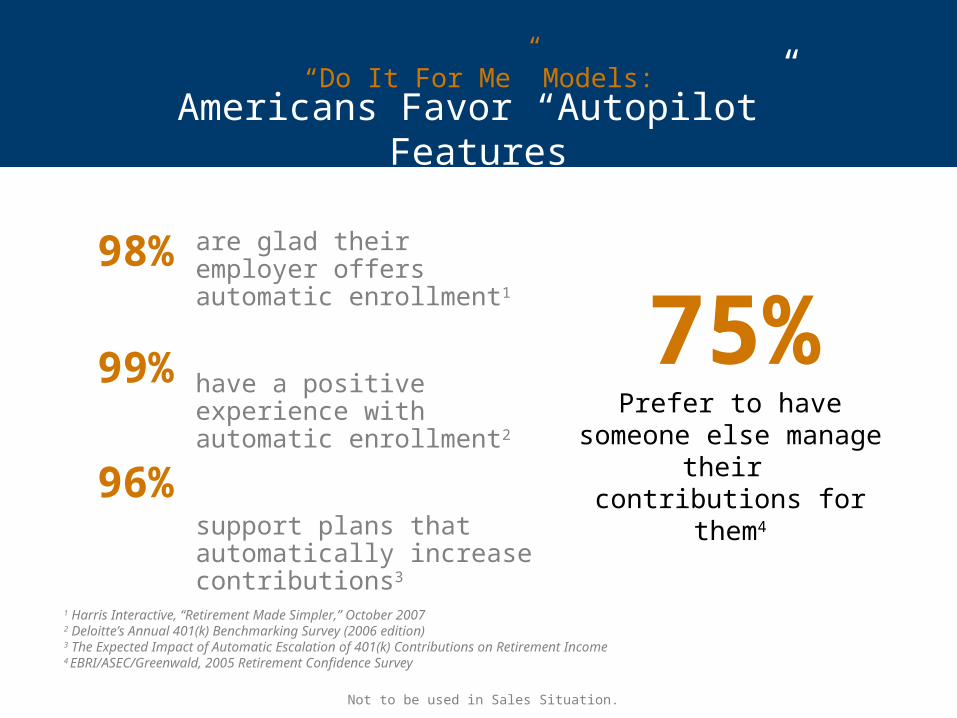
are glad their employer offers automatic enrollment1
have a positive experience with automatic enrollment2
support plans that automatically increase contributions3
Prefer to have someone else manage their
contributions for them4
1 Harris Interactive, “Retirement Made Simpler,” October 20072 Deloitte’s Annual 401(k) Benchmarking Survey (2006 edition) 3 The Expected Impact of Automatic Escalation of 401(k) Contributions on Retirement Income4 EBRI/ASEC/Greenwald, 2005 Retirement Confidence Survey
Americans Favor “Autopilot” Features
“Do It For Me” Models:
75%98%
99%
96%
Not to be used in Sales Situation.
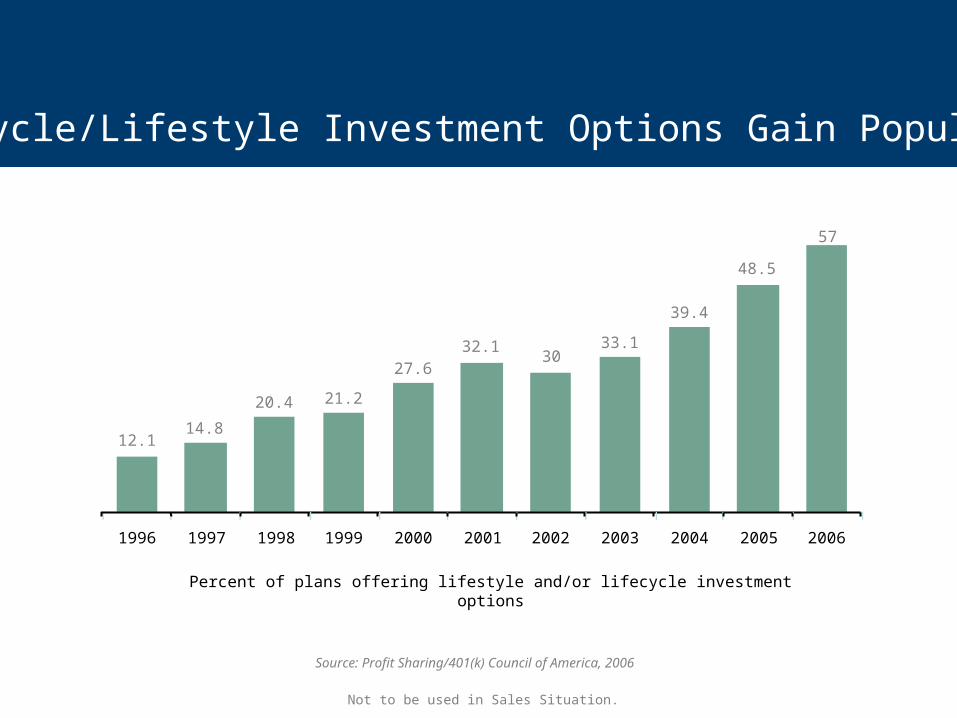
12.114.8
20.4 21.2
27.632.1
3033.1
39.4
48.5
57
1996 1997 1998 1999 2000 2001 2002 2003 2004 2005 2006
Percent of plans offering lifestyle and/or lifecycle investment options
Source: Profit Sharing/401(k) Council of America, 2006
Lifecycle/Lifestyle Investment Options Gain Popularity
Not to be used in Sales Situation.
Fees
Fiduciary Trends I Legislation I Investment Expectation I Investment Choices I Fees IParticipant Attitudes I Participation/Deferral Rates I Plan Sponsor Attitudes
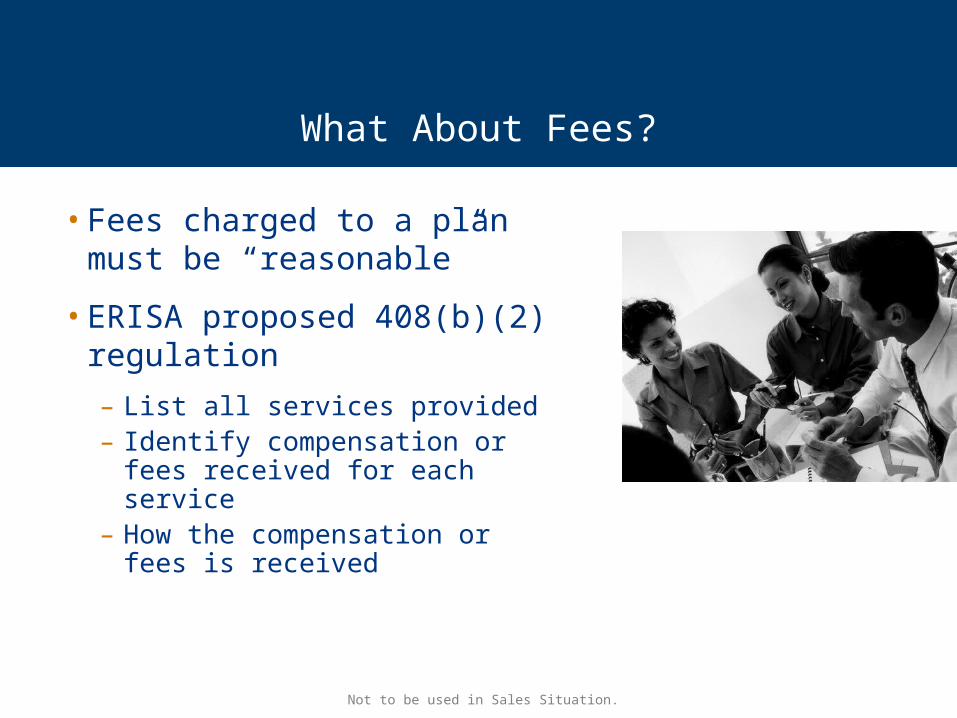
• Fees charged to a plan must be “reasonable”
• ERISA proposed 408(b)(2) regulation
– List all services provided– Identify compensation or fees
received for each service– How the compensation or fees is
received
What About Fees?
Not to be used in Sales Situation.
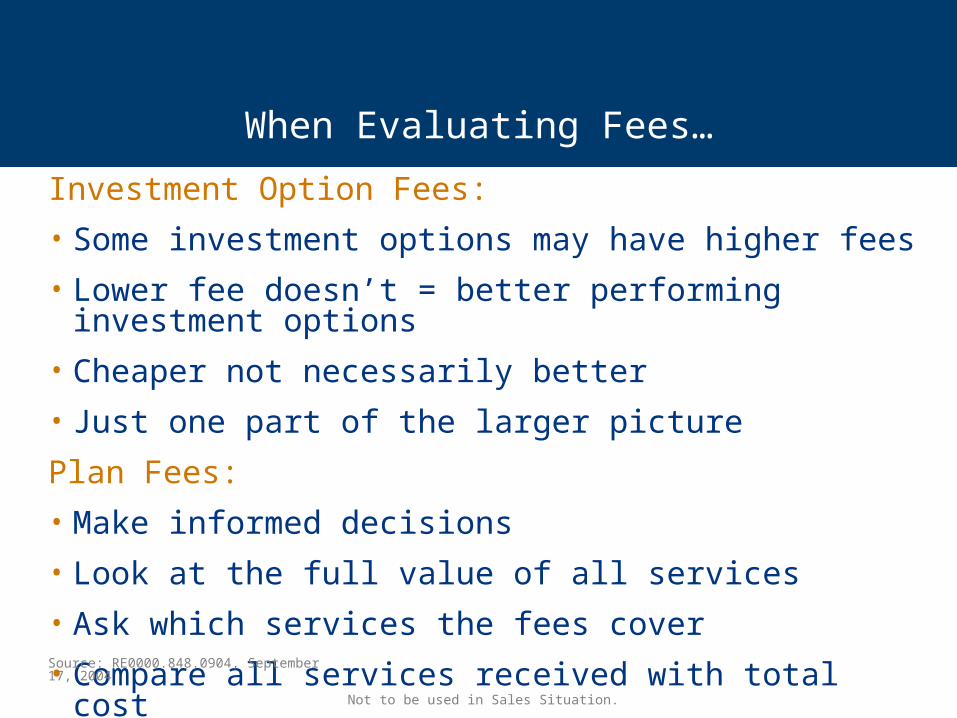
Investment Option Fees:
• Some investment options may have higher fees
• Lower fee doesn’t = better performing investment options
• Cheaper not necessarily better
• Just one part of the larger picture
Plan Fees:
• Make informed decisions
• Look at the full value of all services
• Ask which services the fees cover
• Compare all services received with total costSource: RE0000.848.0904, September 17, 2004
When Evaluating Fees…
Not to be used in Sales Situation.
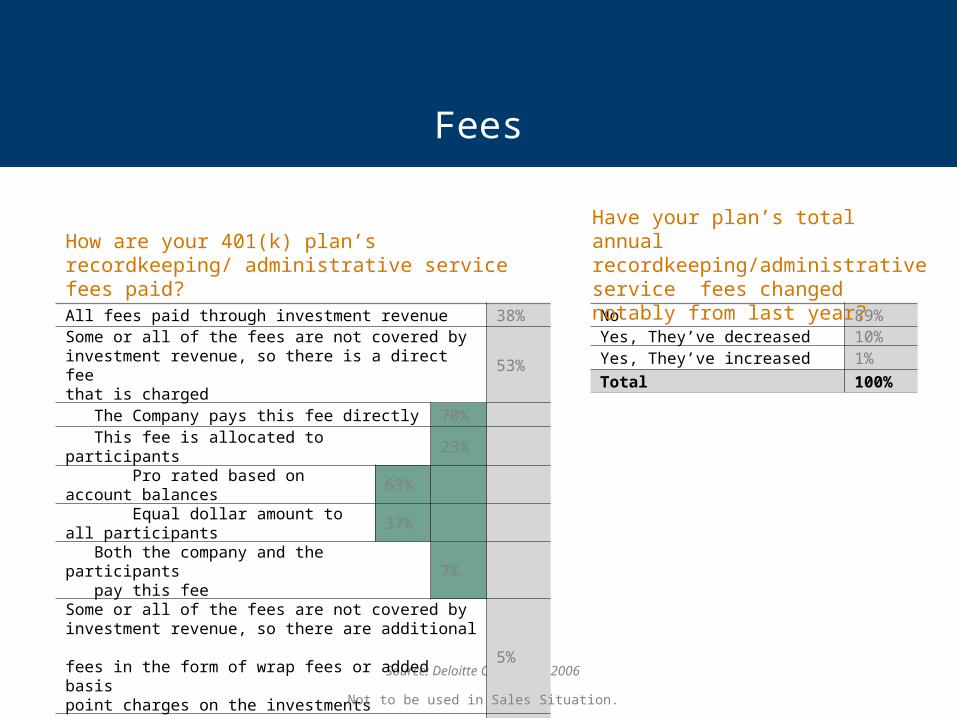
Fees
Source: Deloitte Consulting, 2006
No 89%Yes, They’ve decreased 10%Yes, They’ve increased 1%
Total 100%
Have your plan’s total annual recordkeeping/administrative service fees changed notably from last year?
All fees paid through investment revenue 38%Some or all of the fees are not covered by investment revenue, so there is a direct fee that is charged
53%
The Company pays this fee directly 70%
This fee is allocated to participants 23%
Pro rated based on account balances 63%
Equal dollar amount to all participants 37% Both the company and the participants pay this fee
7%
Some or all of the fees are not covered by investment revenue, so there are additional fees in the form of wrap fees or added basis point charges on the investments
5%
Other 4%
Total 100%
How are your 401(k) plan’s recordkeeping/ administrative service fees paid?
Not to be used in Sales Situation.
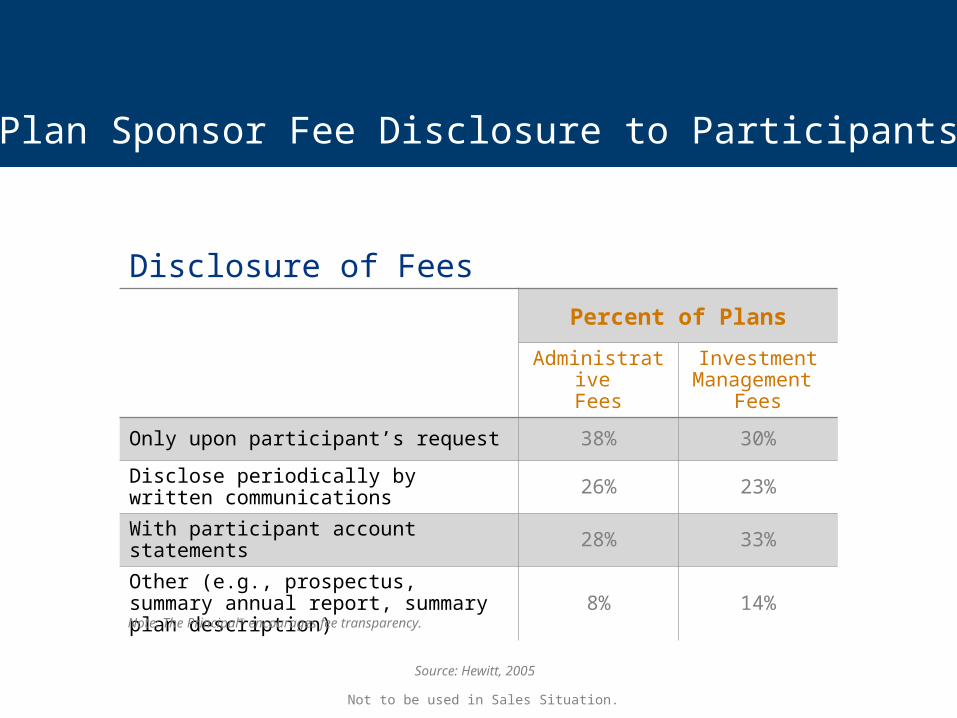
Plan Sponsor Fee Disclosure to Participants
Source: Hewitt, 2005
Disclosure of Fees
Percent of Plans
Administrative Fees
InvestmentManagement
Fees
Only upon participant’s request 38% 30%
Disclose periodically by written communications 26% 23%
With participant account statements 28% 33%
Other (e.g., prospectus, summary annual report, summary plan description) 8% 14%
Note: The Principal® encourages fee transparency.
Not to be used in Sales Situation.

July 2004
Participant Attitudes
Fiduciary Trends I Legislation I Investment Expectation I Investment Choices I Fees IParticipant Attitudes I Participation/Deferral Rates I Plan Sponsor Attitudes
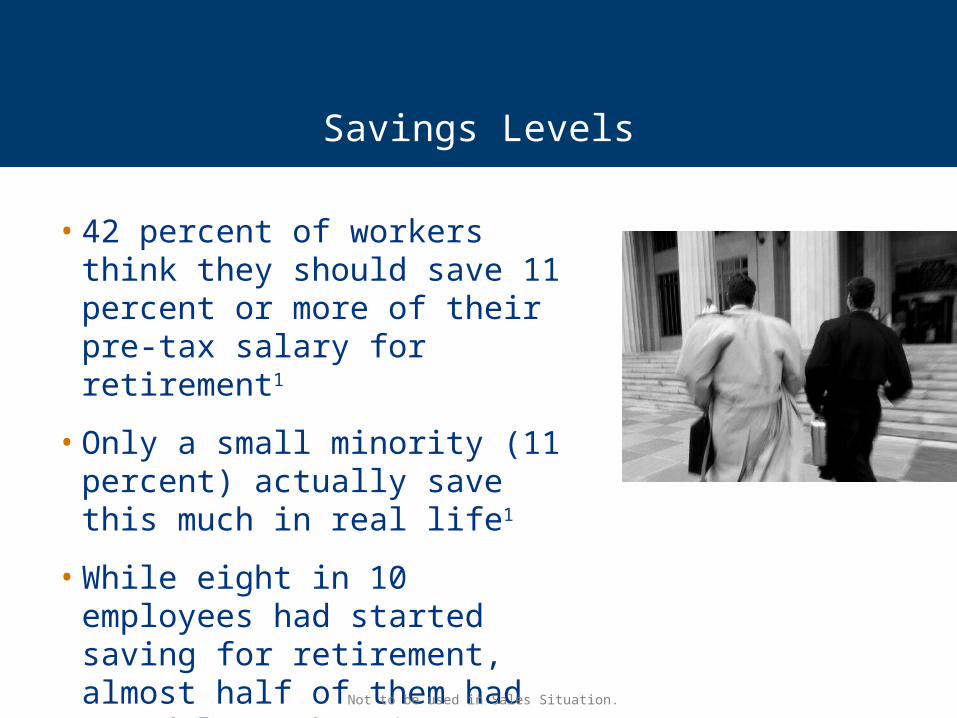
Savings Levels
• 42 percent of workers think they should save 11 percent or more of their pre-tax salary for retirement1
• Only a small minority (11 percent) actually save this much in real life1
• While eight in 10 employees had started saving for retirement, almost half of them had saved less than $25,0002
1 2007 3rd Quarter The Principal Financial Well-Being IndexSM
2 2008 Employee Benefit Research Institute (EBRI) Retirement Confidence SurveyNot to be used in Sales Situation.
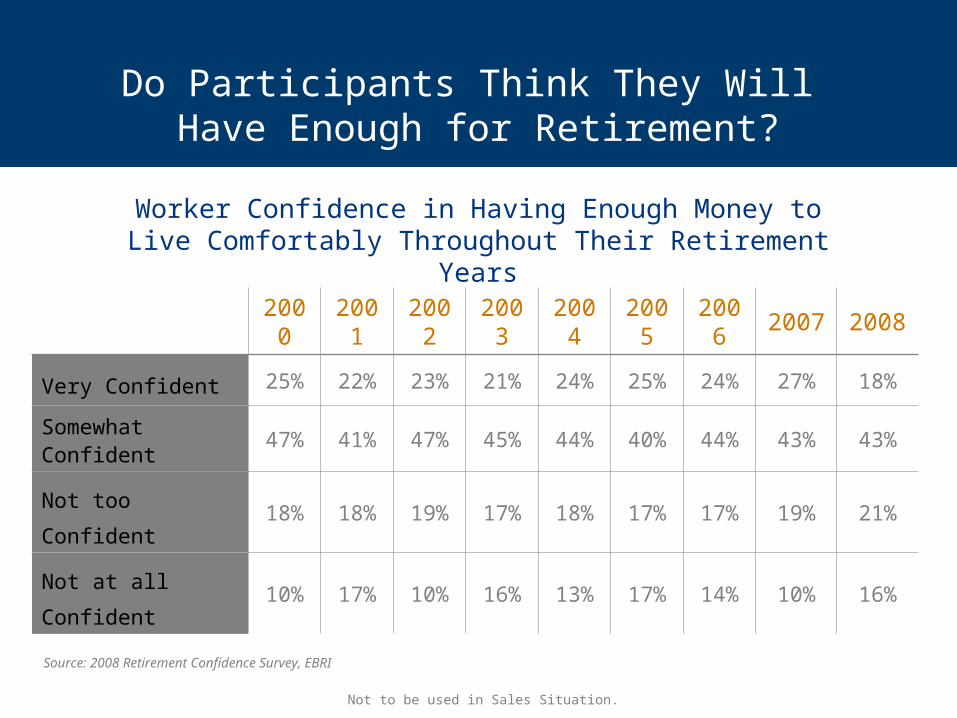
Worker Confidence in Having Enough Money to Live Comfortably Throughout Their Retirement Years
Source: 2008 Retirement Confidence Survey, EBRI
Do Participants Think They Will Have Enough for Retirement?
2000 2001 2002 2003 2004 2005 2006 2007 2008
Very Confident 25% 22% 23% 21% 24% 25% 24% 27% 18%
Somewhat Confident 47% 41% 47% 45% 44% 40% 44% 43% 43%
Not too Confident 18% 18% 19% 17% 18% 17% 17% 19% 21%
Not at all Confident 10% 17% 10% 16% 13% 17% 14% 10% 16%
Not to be used in Sales Situation.
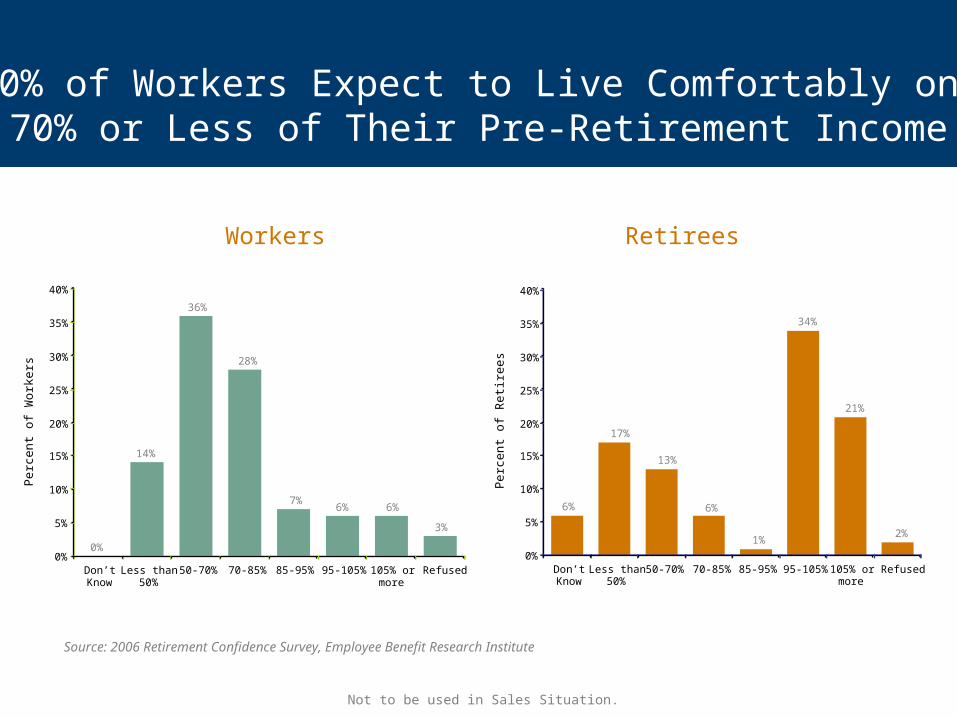
Source: 2006 Retirement Confidence Survey, Employee Benefit Research Institute
36%
6%
3%
0%
14%
7%
28%
6%
0%
5%
10%
15%
20%
25%
30%
35%
40%
Don’tKnow
Less than50%
50-70% 70-85% 85-95% 95-105% 105% ormore
Refused
50% of Workers Expect to Live Comfortably on 70% or Less of Their Pre-Retirement Income
6%
17%
13%
1%
6%
34%
21%
2%
0%
5%
10%
15%
20%
25%
30%
35%
40%
Don’tKnow
Less than50%
50-70% 70-85% 85-95% 95-105% 105% ormore
Refused
Workers Retirees
Per
cen
t of
Wo
rke
rs
Per
cen
t of
Re
tire
es
Not to be used in Sales Situation.
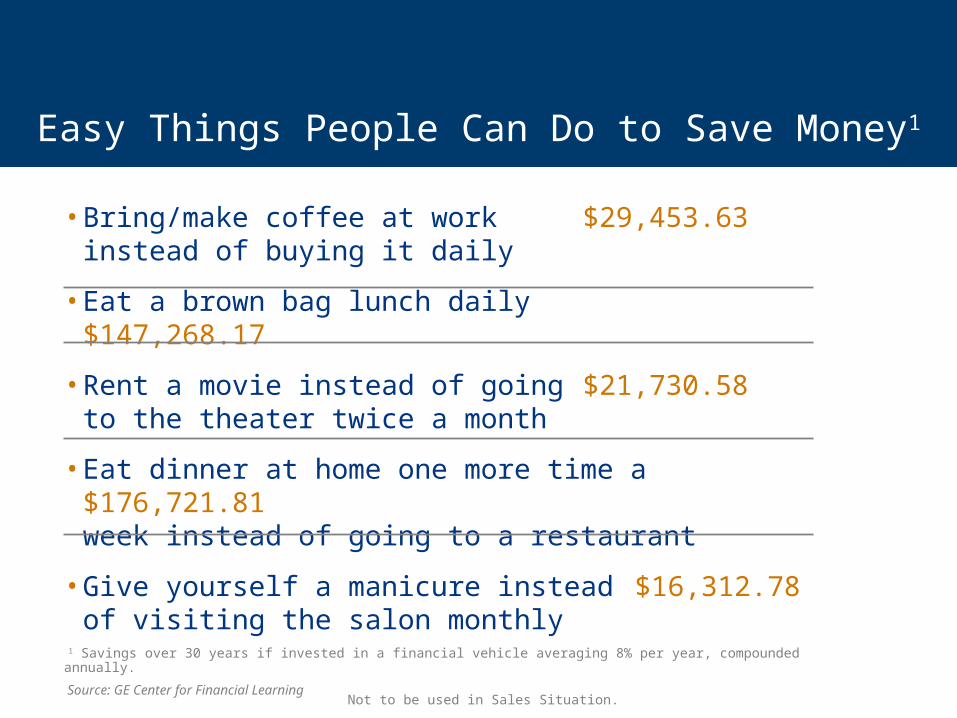
• Bring/make coffee at work $29,453.63instead of buying it daily
• Eat a brown bag lunch daily $147,268.17
• Rent a movie instead of going $21,730.58to the theater twice a month
• Eat dinner at home one more time a $176,721.81week instead of going to a restaurant
• Give yourself a manicure instead $16,312.78of visiting the salon monthly
1 Savings over 30 years if invested in a financial vehicle averaging 8% per year, compounded annually.
Source: GE Center for Financial Learning
Easy Things People Can Do to Save Money1
Not to be used in Sales Situation.
July 2004
Participation/Deferral Rates
Fiduciary Trends I Legislation I Investment Expectation I Investment Choices I Fees IParticipant Attitudes I Participation/Deferral Rates I Plan Sponsor Attitudes
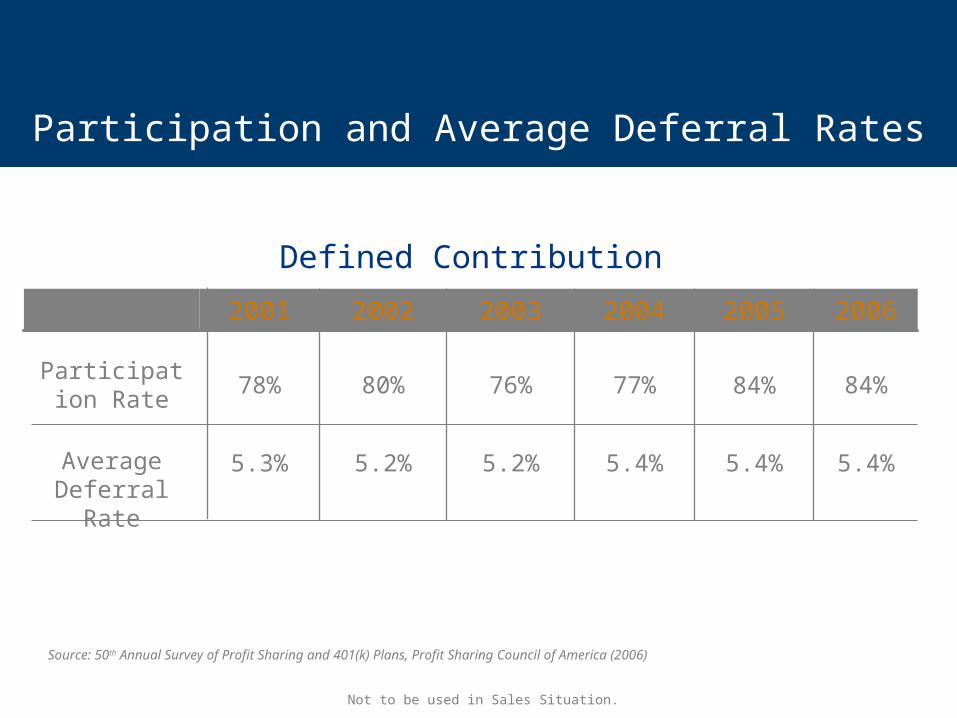
Source: 50th Annual Survey of Profit Sharing and 401(k) Plans, Profit Sharing Council of America (2006)
Participation and Average Deferral Rates
5.4%5.4%5.4%5.2%5.2%5.3%
Participation Rate
84%84%77%76%80%78%
2005 20062004200320022001
Defined Contribution
Average Deferral Rate
Not to be used in Sales Situation.
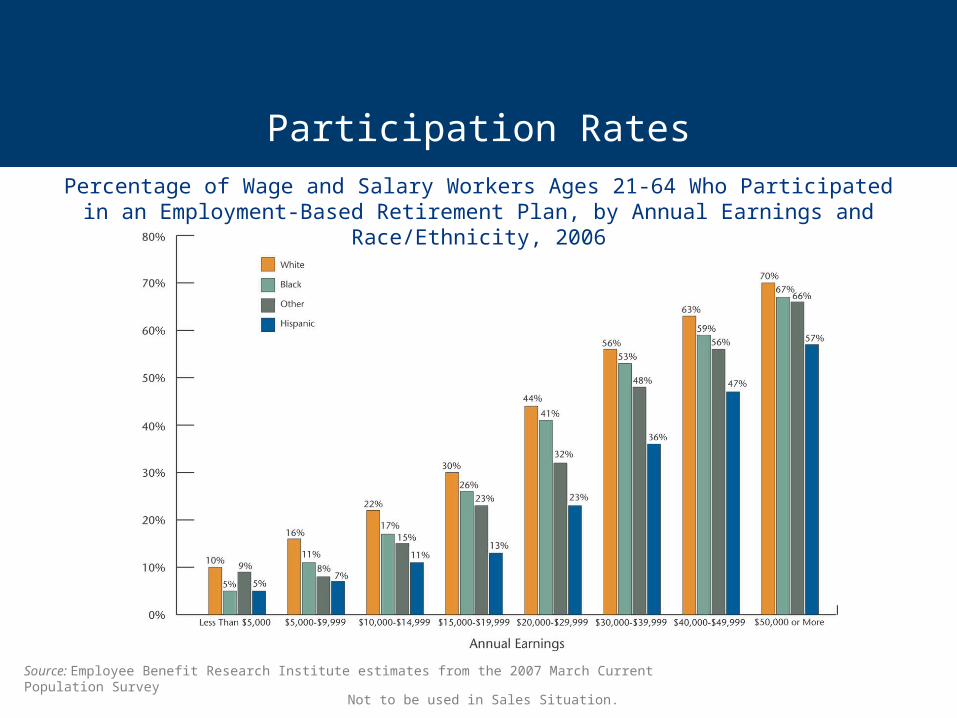
Source: Employee Benefit Research Institute estimates from the 2007 March Current Population Survey
Participation Rates
Percentage of Wage and Salary Workers Ages 21-64 Who Participated in an Employment-Based Retirement Plan, by Annual Earnings and Race/Ethnicity, 2006
Not to be used in Sales Situation.
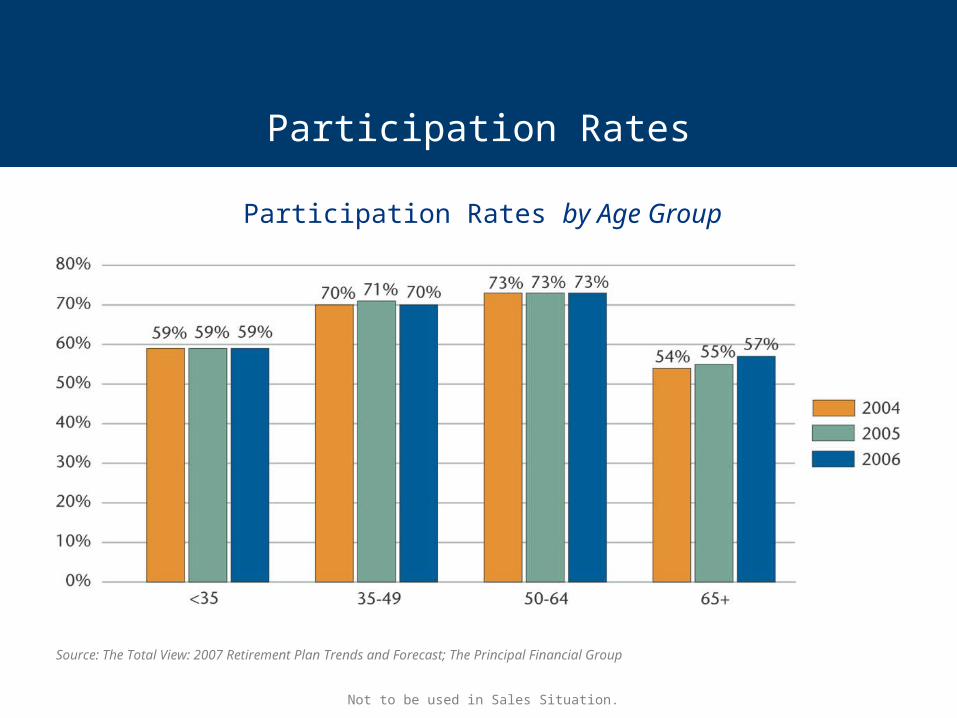
Source: The Total View: 2007 Retirement Plan Trends and Forecast; The Principal Financial Group
Participation Rates
Participation Rates by Age Group
Not to be used in Sales Situation.

Average Salary Deferral Rates
Average Salary Deferral Rates by Participant Age
Source: The Total View: 2007 Retirement Plan Trends and Forecast; The Principal Financial Group
Not to be used in Sales Situation.
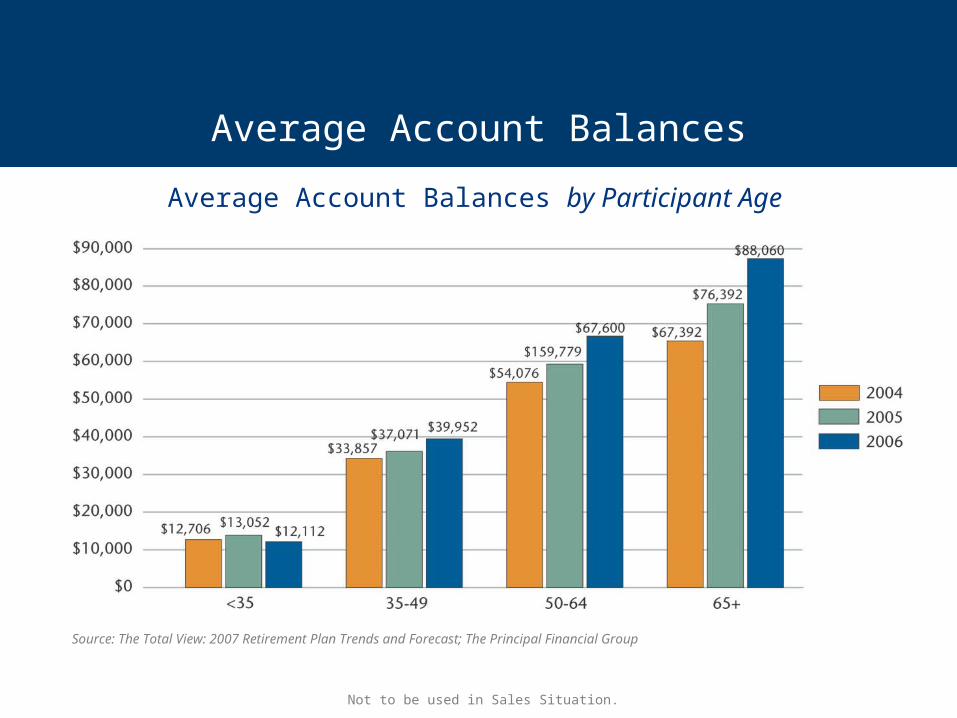
Average Account Balances
Average Account Balances by Participant Age
Source: The Total View: 2007 Retirement Plan Trends and Forecast; The Principal Financial Group
Not to be used in Sales Situation.
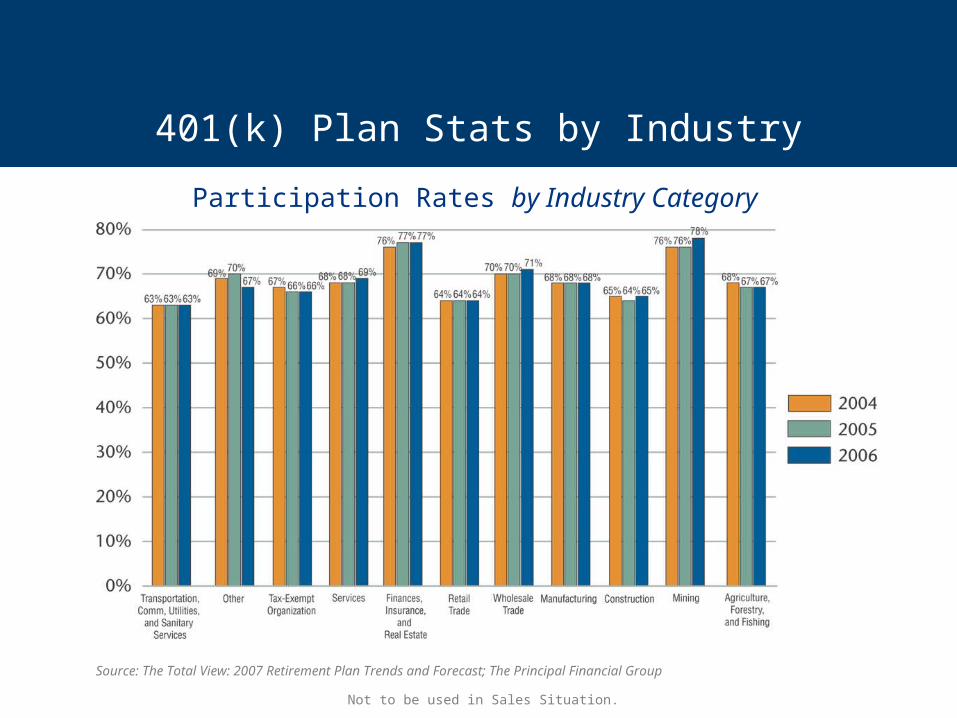
401(k) Plan Stats by Industry
Participation Rates by Industry Category
Source: The Total View: 2007 Retirement Plan Trends and Forecast; The Principal Financial Group
Not to be used in Sales Situation.
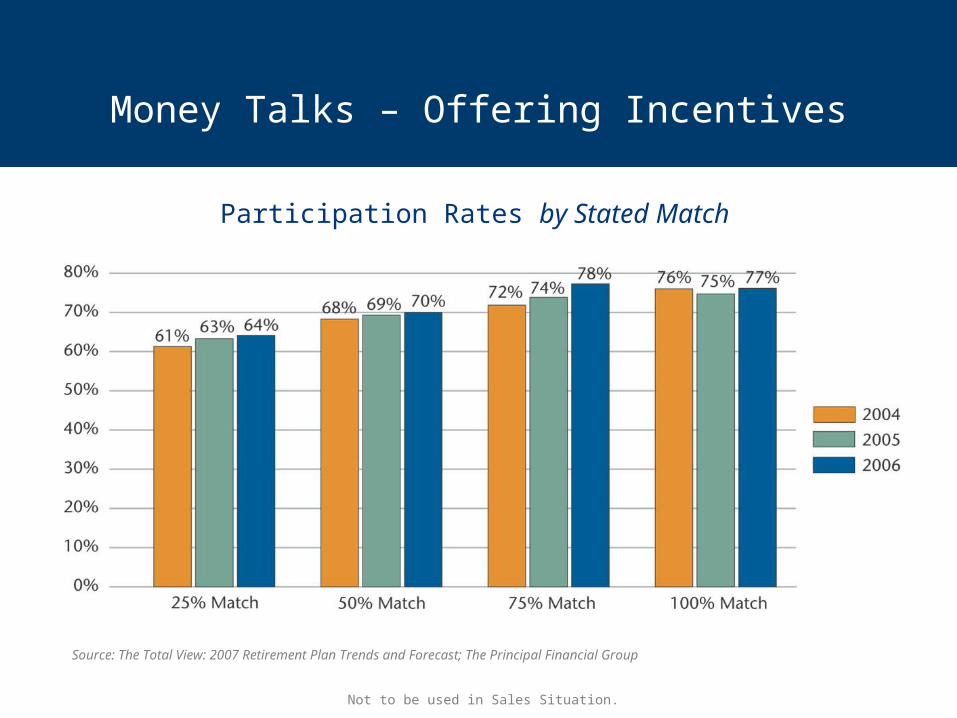
Money Talks – Offering Incentives
Participation Rates by Stated Match
Source: The Total View: 2007 Retirement Plan Trends and Forecast; The Principal Financial Group
Not to be used in Sales Situation.
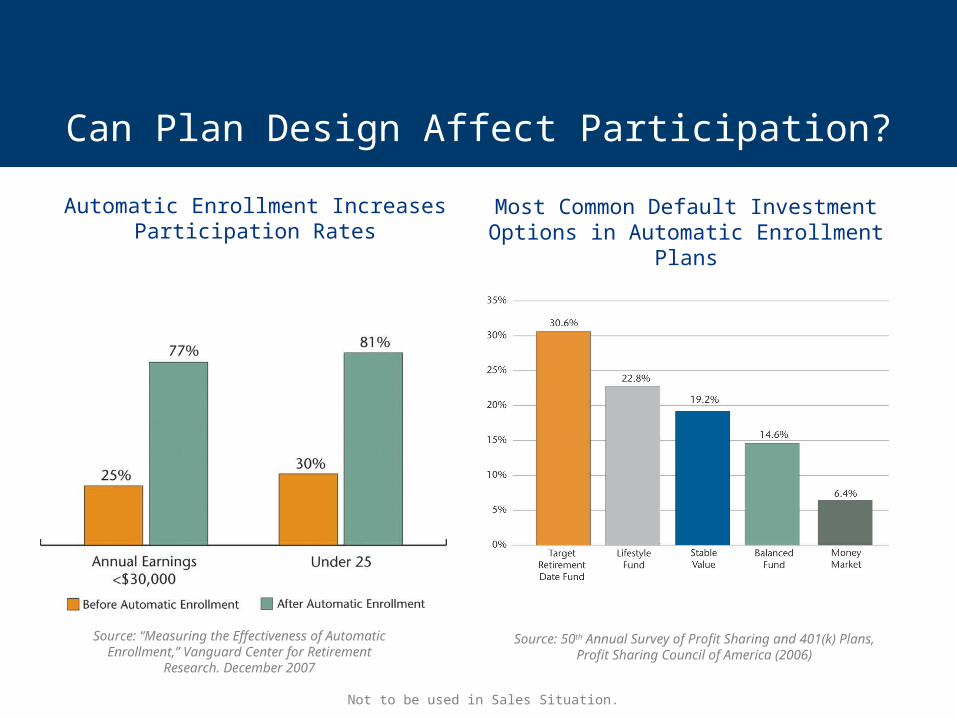
Can Plan Design Affect Participation?
Source: 50th Annual Survey of Profit Sharing and 401(k) Plans, Profit Sharing Council of America (2006)
Most Common Default Investment Options in Automatic Enrollment Plans
Automatic Enrollment Increases Participation Rates
Source: “Measuring the Effectiveness of Automatic Enrollment,” Vanguard Center for Retirement
Research. December 2007
Not to be used in Sales Situation.
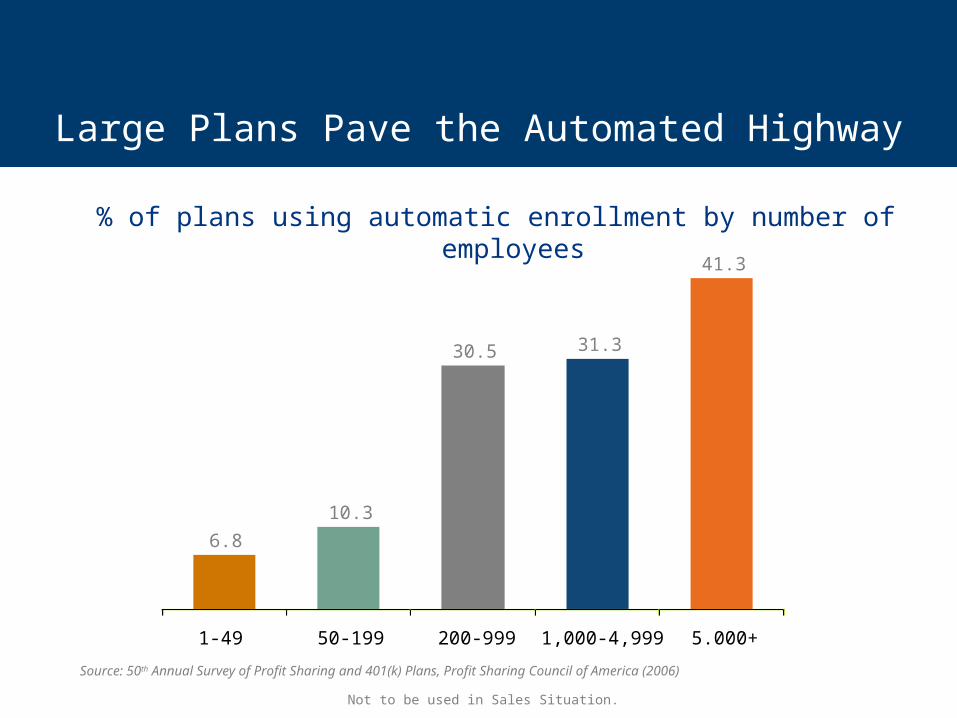
% of plans using automatic enrollment by number of employees
Large Plans Pave the Automated Highway
6.8
10.3
30.5 31.3
41.3
1-49 50-199 200-999 1,000-4,999 5.000+
Source: 50th Annual Survey of Profit Sharing and 401(k) Plans, Profit Sharing Council of America (2006)
Not to be used in Sales Situation.
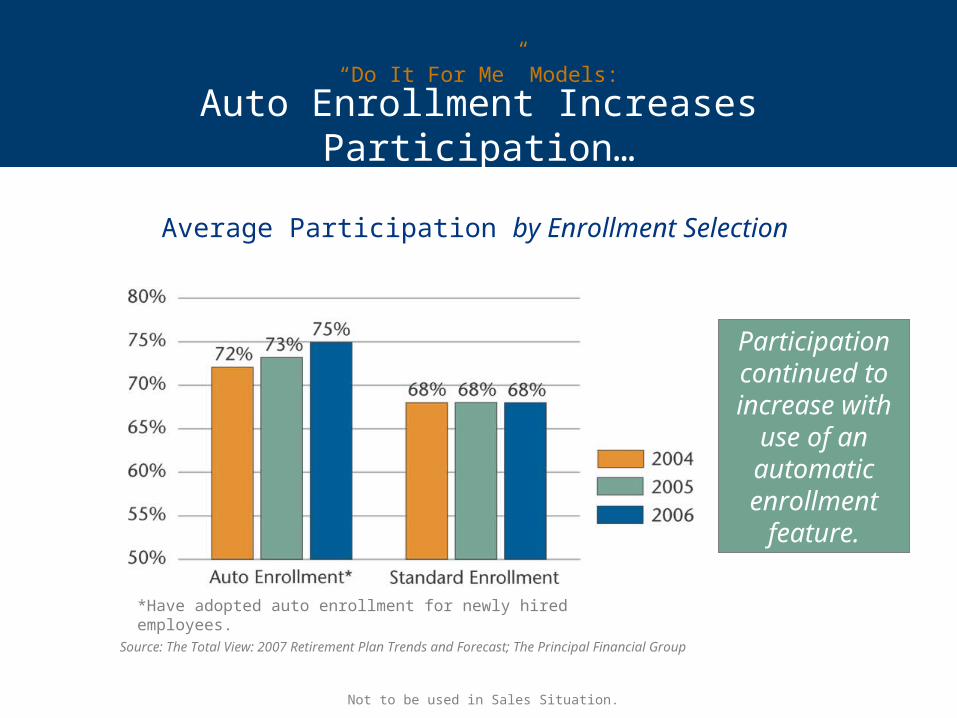
Auto Enrollment Increases Participation…
“Do It For Me” Models:
Average Participation by Enrollment Selection
Participation continued to increase with
use of an automatic enrollment
feature.
*Have adopted auto enrollment for newly hired employees.
Source: The Total View: 2007 Retirement Plan Trends and Forecast; The Principal Financial Group
Not to be used in Sales Situation.
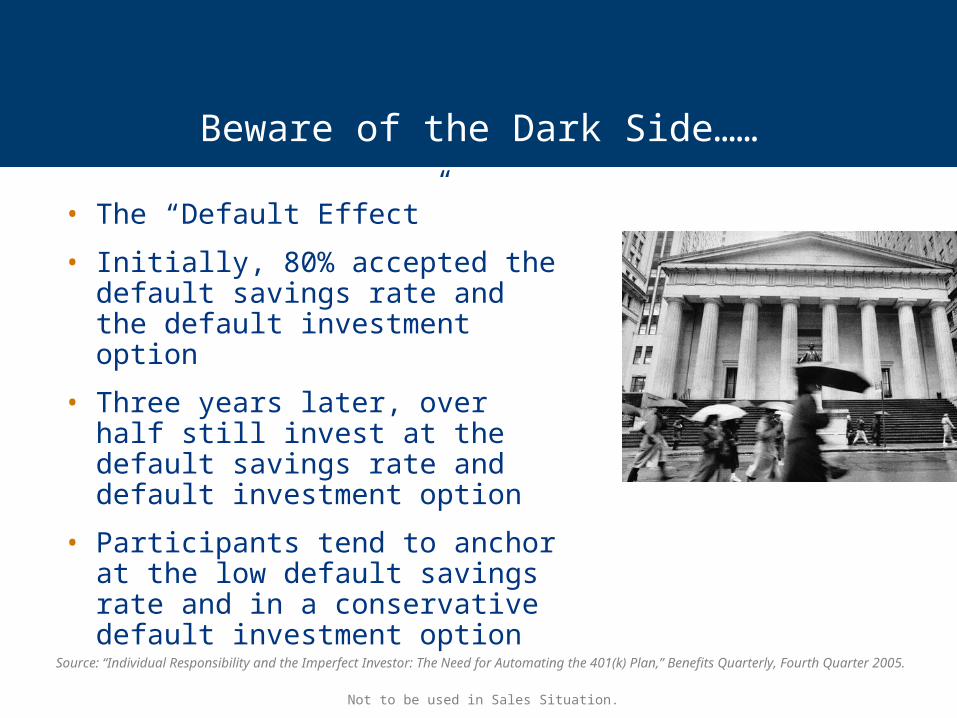
• The “Default Effect”
• Initially, 80% accepted the default savings rate and the default investment option
• Three years later, over half still invest at the default savings rate and default investment option
• Participants tend to anchor at the low default savings rate and in a conservative default investment option
Source: “Individual Responsibility and the Imperfect Investor: The Need for Automating the 401(k) Plan,” Benefits Quarterly, Fourth Quarter 2005.
Beware of the Dark Side……
Not to be used in Sales Situation.
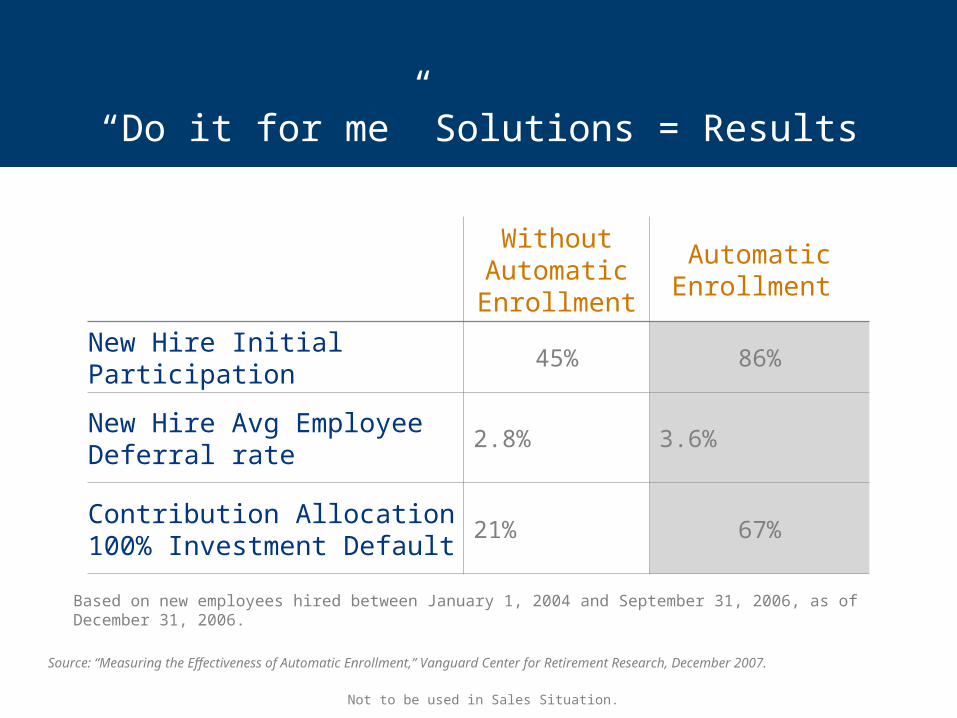
Without Automatic
Enrollment
Automatic Enrollment
New Hire Initial Participation 45% 86%
New Hire Avg Employee Deferral rate
2.8% 3.6%
Contribution Allocation 100% Investment Default
21% 67%
“Do it for me” Solutions = Results
Based on new employees hired between January 1, 2004 and September 31, 2006, as of December 31, 2006.
Source: “Measuring the Effectiveness of Automatic Enrollment,” Vanguard Center for Retirement Research, December 2007.
Not to be used in Sales Situation.
Plan Sponsor Attitudes
Fiduciary Trends I Legislation I Investment Expectation I Investment Choices I Fees IParticipant Attitudes I Participation/Deferral Rates I Plan Sponsor Attitudes
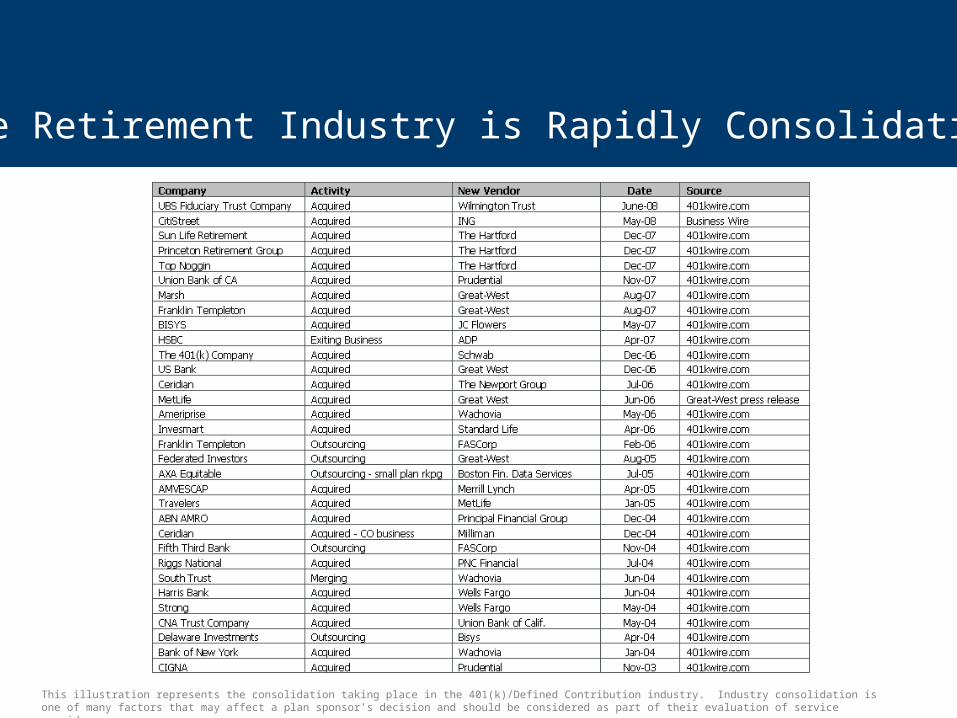
The Retirement Industry is Rapidly Consolidating
This illustration represents the consolidation taking place in the 401(k)/Defined Contribution industry. Industry consolidation is one of many factors that may affect a plan sponsor’s decision and should be considered as part of their evaluation of service providers.
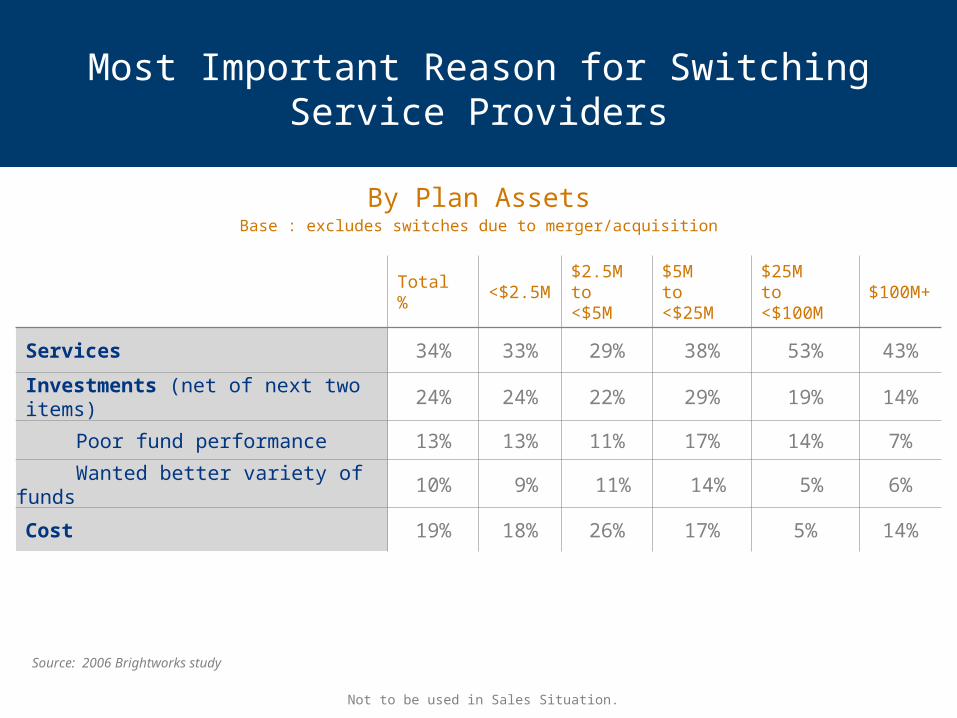
Most Important Reason for Switching Service Providers
By Plan AssetsBase : excludes switches due to merger/acquisition
Total % <$2.5M$2.5Mto <$5M
$5Mto <$25M
$25Mto <$100M
$100M+
Services 34% 33% 29% 38% 53% 43%
Investments (net of next two items) 24% 24% 22% 29% 19% 14%
Poor fund performance 13% 13% 11% 17% 14% 7%
Wanted better variety of funds 10% 9% 11% 14% 5% 6%
Cost 19% 18% 26% 17% 5% 14%
Source: 2006 Brightworks study
Not to be used in Sales Situation.
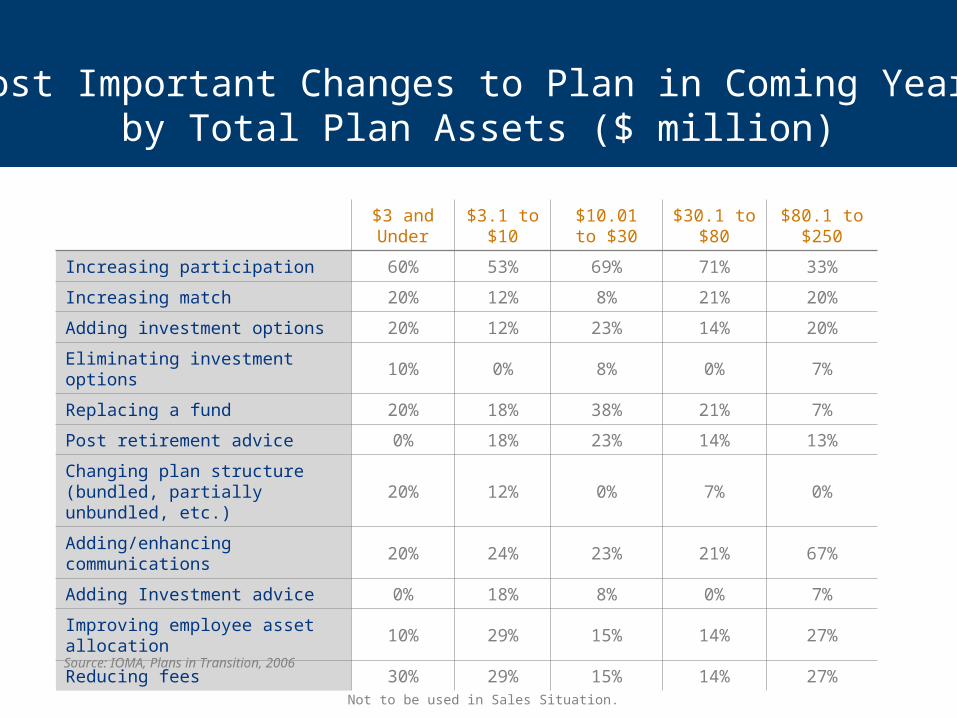
$3 and Under
$3.1 to $10
$10.01 to $30
$30.1 to $80
$80.1 to $250
Increasing participation 60% 53% 69% 71% 33%
Increasing match 20% 12% 8% 21% 20%
Adding investment options 20% 12% 23% 14% 20%
Eliminating investment options 10% 0% 8% 0% 7%
Replacing a fund 20% 18% 38% 21% 7%
Post retirement advice 0% 18% 23% 14% 13%
Changing plan structure (bundled, partially unbundled, etc.)
20% 12% 0% 7% 0%
Adding/enhancing communications 20% 24% 23% 21% 67%
Adding Investment advice 0% 18% 8% 0% 7%
Improving employee asset allocation
10% 29% 15% 14% 27%
Reducing fees 30% 29% 15% 14% 27%
Most Important Changes to Plan in Coming Year by Total Plan Assets ($ million)
Source: IOMA, Plans in Transition, 2006
Not to be used in Sales Situation.
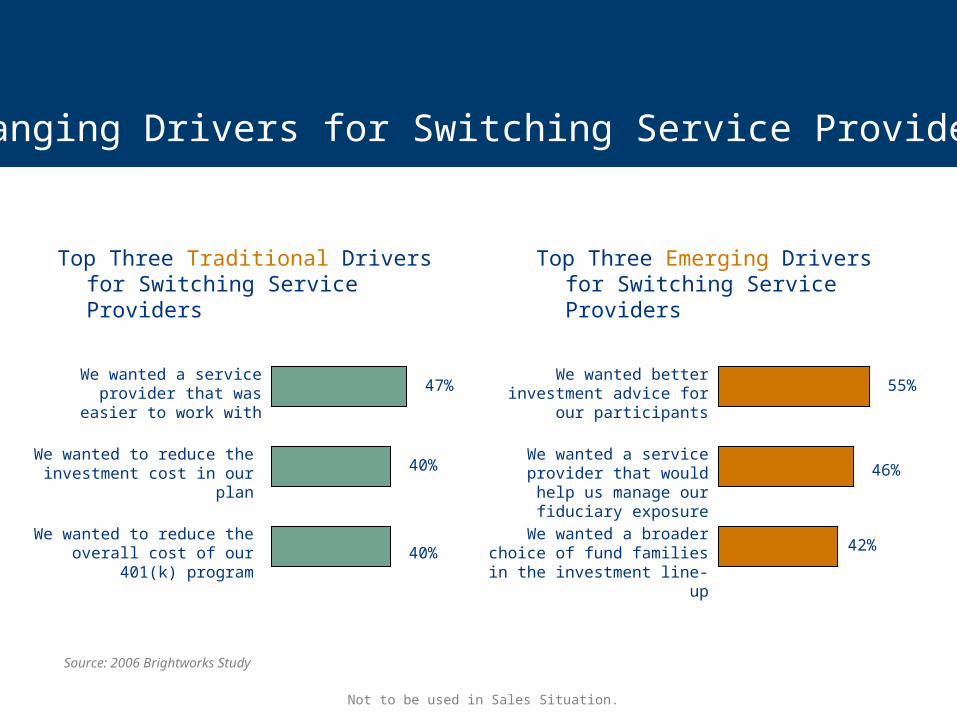
Top Three Traditional Drivers for Switching Service Providers
Changing Drivers for Switching Service Providers
Top Three Emerging Drivers for Switching Service Providers
We wanted a service provider that was easier to work with
We wanted to reduce the investment cost in our plan
We wanted to reduce the overall cost of our 401(k)
program
47%
40%
40%
We wanted better investment advice for our participants
We wanted a service provider that would help us manage our
fiduciary exposure
We wanted a broader choice of fund families in the
investment line-up
55%
46%
42%
Source: 2006 Brightworks Study
Not to be used in Sales Situation.
© 2008 Principal Financial Services, Inc.
PQ 8606 Al #5864062010 7/2008
No part of this presentation may be reproduced or used in any form or by any means, electronic or mechanical, including photocopying or recording, or by any information storage and retrieval system, without prior written permission from the Principal Financial Group®. While this presentation may be used to promote or market a transaction or an idea, it is intended to provide general information about the subject matter covered and is provided with the understanding that The Principal is not rendering legal, accounting or tax advice. It is not a marketed opinion and may not be used to avoid penalties under the Internal Revenue Code. You should consult with appropriate counsel or other advisors on all matters pertaining to legal, tax or accounting obligations and requirements.Asset allocation does not guarantee a profit or protect against a loss. Investing in real estate, small-cap, international, and high-yield investment options involves additional risks.
Insurance products and plan administrative services are provided by Principal Life Insurance Company, a member of the Principal Financial Group® (The Principal®), Des Moines, IA 50392.
Not to be used in sales situation.
Disclosure
![Facilitator: [Insert name] Date: [Insert] Venue: [Insert] Wellcome !](https://static.fdocuments.in/doc/165x107/56649dd05503460f94ac59be/facilitator-insert-name-date-insert-venue-insert-wellcome-.jpg)


![Welcome [] · 2019. 7. 31. · Shipper ID: 00000000 Insert #1 Insert #2 Shipping Method: 2ND DAY Insert #3 Insert #4 CARRIER: UPS Insert #5 Insert #6 Address: Insert #7 Insert #8](https://static.fdocuments.in/doc/165x107/606af0d80d38412add396492/welcome-2019-7-31-shipper-id-00000000-insert-1-insert-2-shipping-method.jpg)


![INSERT Photograph 1: Satellite image – Question 2€¦ · NATIONAL SENIOR CERTIFICATE: GEOGRAPHY: PAPER I – INSERT Page i of iv ... Question 2.3 [Azur Photography 2008] Q P .](https://static.fdocuments.in/doc/165x107/5ed83cc20fa3e705ec0e17eb/insert-photograph-1-satellite-image-a-question-2-national-senior-certificate.jpg)

