4. VEHICLE PRODUCTION AND LIFECYCLE COST - rand.org · components of battery-powered electric...
45
-31- 4. VEHICLE PRODUCTION AND LIFECYCLE COST This section examines the costs of producing and operating the advanced technology vehicles that manufacturers may build to meet ZEV program requirements. First, we describe the components of battery-powered electric vehicles (BPEVs), direct hydrogen fuel-cell vehicles (DHFCVs), gasoline hybrid electric vehicles (GHEVs), and gasoline vehicles that meet the partial zero emission vehicle (PZEV) emission requirements. Second, we provide an overview of the factors that can cause component costs to fall over time. Third, we discuss the costs of the various components. We estimate costs at the production volumes likely between 2003 and 2007 and at high production volumes. The estimates at high volume are based on well-grounded projections of technological improvements that are plausible given what is known about the technology and about the manufacturing processes possible at high volumes. They are thus the costs that can currently be anticipated after an introductory period during which costs will be higher. Fourth, we combine the component costs to estimate the incremental cost of each type of advanced technology vehicle over the cost of a gasoline internal combustion engine vehicle (ICEV). The overall social cost of an advanced technology vehicle depends not only on the initial vehicle cost, but also on the cost of operating and maintaining the vehicle over its lifetime. We thus also estimate the incremental lifetime operating costs of each vehicle relative to an ICEV and conclude the section by combining incremental operating cost with incremental vehicle cost to calculate the incremental lifecycle vehicle cost. 4.1 KEY VEHICLE COMPONENTS We begin by describing the primary components of BPEVs and then turn to the primary components of DHFCVs, GHEVs, and PZEVs. Battery-Powered Electric Vehicles The cost increment of a BPEV over a gasoline ICEV comes from the addition of the following basic components: 1. battery modules 2. battery auxiliaries such as tray and straps, harness, and cooling system (modules + auxiliaries = battery pack) 3. electric motor 4. power electronics to control the electric motor
Transcript of 4. VEHICLE PRODUCTION AND LIFECYCLE COST - rand.org · components of battery-powered electric...
-31-
4 VEHICLE PRODUCTION AND LIFECYCLE COST
This section examines the costs of producing and operating the advanced technology vehicles that manufacturers may build to meet ZEV program requirements First we describe the components of battery-powered electric vehicles (BPEVs) direct hydrogen fuel-cell vehicles (DHFCVs) gasoline hybrid electric vehicles (GHEVs) and gasoline vehicles that meet the partial zero emission vehicle (PZEV) emission requirements Second we provide an overview of the factors that can cause component costs to fall over time Third we discuss the costs of the various components We estimate costs at the production volumes likely between 2003 and 2007 and at high production volumes The estimates at high volume are based on well-grounded projections of technological improvements that are plausible given what is known about the technology and about the manufacturing processes possible at high volumes They are thus the costs that can currently be anticipated after an introductory period during which costs will be higher
Fourth we combine the component costs to estimate the incremental cost of each type of advanced technology vehicle over the cost of a gasoline internal combustion engine vehicle (ICEV) The overall social cost of an advanced technology vehicle depends not only on the initial vehicle cost but also on the cost of operating and maintaining the vehicle over its lifetime We thus also estimate the incremental lifetime operating costs of each vehicle relative to an ICEV and conclude the section by combining incremental operating cost with incremental vehicle cost to calculate the incremental lifecycle vehicle cost
41 KEY VEHICLE COMPONENTS We begin by describing the primary components of BPEVs and then turn to the primary
components of DHFCVs GHEVs and PZEVs
Battery-Powered Electric Vehicles The cost increment of a BPEV over a gasoline ICEV comes from the addition of the
following basic components 1 battery modules 2 battery auxiliaries such as tray and straps harness and cooling system (modules +
auxiliaries = battery pack) 3 electric motor 4 power electronics to control the electric motor
-32-
5 electric vehicle transmission 6 on-board (integrated) charger1 7 other auxiliaries (eg electric power steering electric brakes)
Cost savings accrue from the exclusion of some components common to conventional vehicles internal combustion engine and emission control system fuel tank and conventional transmission
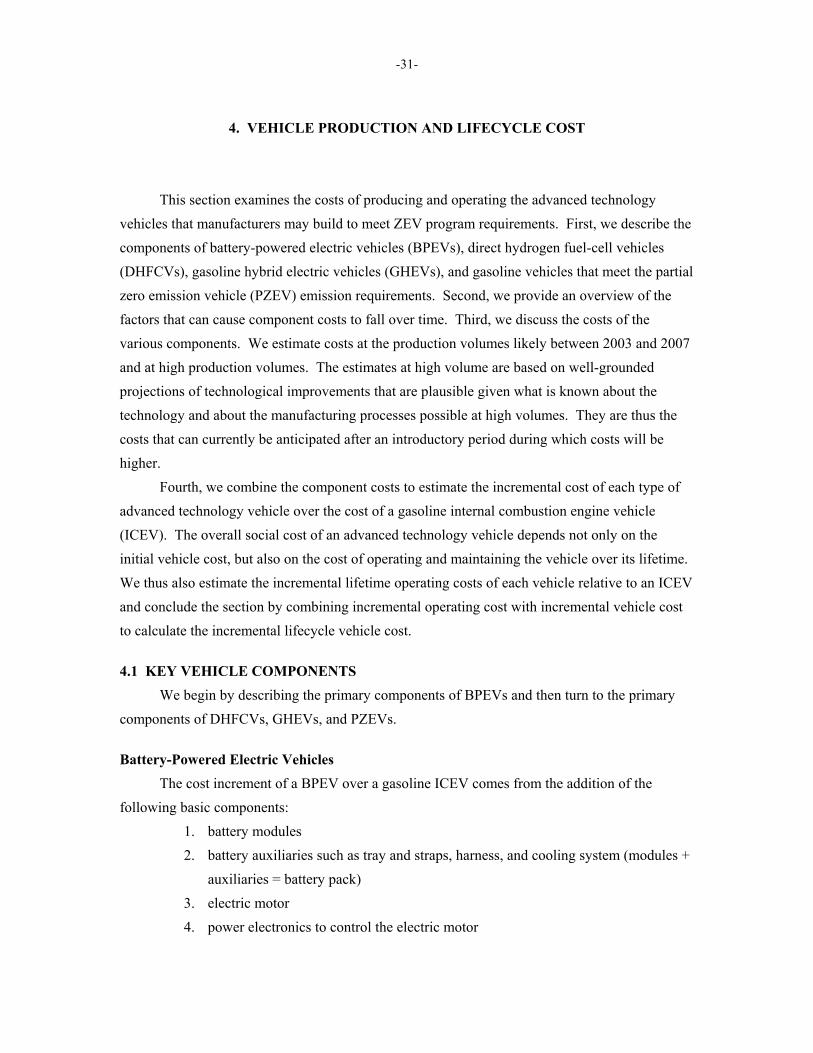
Table 41 reviews the technical specifications of the BPEVs developed by major manufacturers Based on this review we cost out a full-function EV with 30 kWh of battery storage and a 50-kW electric motor between 2003 and 2007 We cost out a city EV with 10 kWh of battery storage and a 25-kW electric motor during the same period For our high-volume cost estimates we allow the full-function EV battery pack to vary between 24 and 30 kWh and the city EV battery pack to vary between 8 and 10 kWh to account for plausible improvements in vehicle efficiency Manufacturers are currently using advanced batteriesmdashnickel metal hydride (NiMH) nickel cadmium (NiCd) and lithium ion (LiIon)mdashin their full-function EVs rather than the more conventional lead acid (PbA) batteries Because NiMH batteries currently appear to be the best suited for automotive use (see discussion in Anderman Kalhammer and MacArthur 2000) we assume they are the advanced battery that auto manufacturers choose for their vehicles2 We also run scenarios with PbA batteries because of the possibility that they will be used in some types of vehicles Due to their low energy density however PbA batteries may be difficult to use in vehicles with the ranges we assume here Their size and weight also create challenges in designing EVs with interior space and handling characteristics comparable to vehicles currently on the road
Direct Hydrogen Fuel-Cell Vehicles The cost increment for DHFCVs is due to the following
1 proton exchange membrane (PEM) fuel-cell system 2 compressed hydrogen tank
____________ 1According to the Pacific Gas and Electric EV glossary an off-board charger is ldquoa charger with the
intelligence and control in the charger stand not on the vehicle [An] on-board charger is a charger with the intelligence and control on the vehicle not in the charger standrdquo On-board chargers appear to be superior to off-board chargers According to Korthof (2000) ldquoIntegrated charging systems have been developed for electric vehicles by Ford GM Renault Toyota and Volkswagen AC propulsion drive systems include an integrated charger rated at 20 kW This system compares favorably in efficiency weight cost and power quality and also supports several times more power than comparable isolated conductive chargers or inductive charging systemsrdquo An onboard charger also requires some off-board equipment (described in Subection 42)
2LiIon batteries have the energy densities needed for vehicles with a 100-mile range but this technology has shortcomings (see Anderman Kalhammer and MacArthur 2000)
-33-
Table 41
Specifications of BPEVs
Vehicle
Peak Power (kW)
Energy Storage (kWh)
Battery Type
Rangea (miles)
Electric
Motor Type Full-Function EVs
Toyota RAV4-EV 50 27 NiMH 8478 DC permanent magnet
Nissan Altra EV 62 32 LiIon 9582 AC
Vehicle modeled in this study 50 24-30 NiMH amp PbA
90-110 AC
City EVs
Toyota ecom 19 ~8 NiMH 60 DC permanent magnet
Ford Thnk City 27 12 NiCd 60 AC
Vehicle modeled in this study 25 8-10 NiMH amp PbA
50-60 AC
aNumbers separated by a slash show city range with accessories followed by highway range with accessories (see Table A1 in Appendix A)
3 small (GHEV-sized) battery pack (or other energy storage device) 4 electric motor and transmission 5 power electronics
Cost savings result from the exclusion of the engine emissions control system transmission and fuel tank found in an ICEV
The PEM system is in turn made up of the fuel-cell stack and auxiliary equipment associated with the stack The auxiliary equipment manages the air water and thermal issues related to the system and includes compressors heat exchangers a humidification system safety devices and a control system (Lipman 1999b p 12) The fuel-cell stack is made up of the following components
1 membrane electrode assembly (MEA) a cathode b anode c electrolytemembrane d cathode and anode catalyst (platinum) and
2 bipolar (separator) plates A fuel-cell stack consists of many fuel cells The structure of a single fuel cell is illustrated in Figure 41
-34-
SOURCE Chalk 2002
Figure 41mdashSingle PEM Fuel Cell
Ballard Power Systems Incorporated a leader in the development of PEM fuel cells describes the key components and principles of operation of a fuel cell as follows
A single fuel cell consists of a membrane electrode assembly and two flow field [bipolar] plates Single cells are combined into a fuel cell stack to produce the desired level of electrical power Each membrane electrode assembly consists of two electrodes (anode and cathode) with a thin layer of catalyst bonded to either side of a proton exchange membrane (PEM) Gases (hydrogen and air) are supplied to the electrodes on either side of the PEM through channels formed in the flow field [bipolar] plates Hydrogen flows through the channels to the anode where the platinum catalyst promotes its separation into protons and electrons On the opposite side of the PEM air flows through the channels to the cathode where oxygen in the air attracts the hydrogen protons through the PEM The electrons are captured as useful electricity through an external circuit and combine with the protons and oxygen to produce water vapor on the cathode side (Ballard 2002)
The feasibility of compressed hydrogen fuel tanks has been shown in a number of prototype vehicles Table 42 lists the specifications of some of the prototype DHFCVs that have been produced by various automakers Manufacturers are experimenting with different energy storage devices and different balances between battery and fuel-cell size Some are using NiMH
-35-
batteries to store energy and provide power others are using supercapacitors Some designs have a large fuel cell (over 60 kW) and a modest battery (25 kW) others have the reverse For our
Table 42
Specifications of Prototype DHFCVs
MakeModel
Capacity and Pressure of Hydrogen Tank
Top Speed (mph)
Range (miles)
Power Plant (kW)
Battery Power (kW)
Electric Motor
Type and Power (kW)
Honda 5000 psi 130-liter tank 87 185+ 78 ns 60 kW AC Toyota
Highlander FCHV-4
3700 psi 95 155 90 ns 80 kW DC
Ford Focus FCV 5000 psi two 41-liter tanks 80 155 80 ns 67 kW AC Hyundai
Santa Fe FCEV 5000 psi 77 100+ 75 ns 65 kW
Vehicle modeled in this study Option 1 5000 psi ns 150+ 25 60 75 kW Option 2 5000 psi ns 150+ 60 25 75 kW
NOTE ns = not specified
near-term projections we assume a 25-kW fuel cell because high fuel-cell costs in the near term suggest that it will be cheaper to keep the fuel cell small For volume production we examine the costs of both vehicles with relatively large and relatively small fuel cells (see options 1 and 2 in Table 42) Range should be over 150 miles with the fuel tank we specify in our analysis
Gasoline Hybrid Electric Vehicles The cost increment associated with a GHEV comes from the addition of the following
components 1 small battery pack 2 electric motor 3 power electronics (eg motor controller)
Cost savings over a conventional ICEV result from the smaller internal combustion engine needed to power a GHEV
Table 43 lists the specifications of GHEVs that have been introduced in the United States or are scheduled to be introduced in the near future Based on these figures we cost out a GHEV with an NiMH battery producing 25 kW of power an electric motor of 33 kW and an internal combustion engine that is 33 kW smaller than it would need to be in a conventional ICEV
Gasoline Partial Zero Emission Vehicles A gasoline PZEV must meet very stringent emission durability and warranty standards
The vehicles must be certified to CARBrsquos
-36-
bull 150000-mile super ultra low emission vehicle (SULEV) exhaust emission standard for light-duty vehicles (LDVs)
Table 43
Specifications of Typical GHEVs
Model
ICE Peak Motor Power (kW)
Battery Type
Battery Power (kW)
Energy Storage (kWh)
Electric Motor
Honda Insight 50 NiMH ~20 094 10 kW DC permanent magnet
Honda Civic GHEV
63 NiMH 97 086 10 kW DC permanent magnet
Toyota Prius 52 NiMH 25 14 33 kW DC permanent magnet
Vehicle modeled in this study
52 NiMH 25 not specified
33 kW DC permanent magnet
NOTE ICE = internal combustion engine
bull zero evaporative emission standard and bull on-board diagnostics (OBD) system requirements The OBD system must be able
to detect emissions that exceed the standards even very slightly In addition the vehicle warranty on emission control equipment must be extended to 15
years or 150000 miles whichever occurs first As is discussed in Subsection 44 major progress has been made in designing vehicles that
meet PZEV standards The required emission control system is similar to that in vehicles on the road today
42 OVERVIEW OF FACTORS THAT CAUSE COSTS TO DECLINE Before examining the costs of vehicle components it is useful to review the various factors
that cause costs to fall Economists and engineers generally agree that three factors or processes can lead to reductions in unit component cost production scale economies learning and technological advances
Production Scale Economies Higher rates of production per period usually cause the unit cost of production to drop
They can mean discounts on bulk purchases of input materials and components and more efficient
-37-
usage of machinery and labor They can also justify the increased use of automated manufacturing equipment which can further reduce unit costs In addition higher production volumes can justify changes in product designs that reduce production costs For example it may not be cost-effective to design application-specific integrated circuits until production volumes are high
Predictions of the cost savings due to scale economies are based on what is known about the product design and technological improvements that can be incorporated at high production volumes They are also based on what is known about the manufacturing processes possible at high volumes
Learning Costs may drop over time as learning-by-doing improves the efficiency of the
manufacturing process These reductions are in addition to those solely caused by an increase in production volume Refinements or wholesale changes in the production process may be discovered based on accumulated production experience For example production experience may lead to a better way to combine the various steps of the production process or to a more efficient mix of capital and labor
Technological Advances Improvements in the technical design of a component can reduce its unit cost For
example advances that allow reductions in the amount of nickel per kilowatt-hour storage capacity will reduce NiMH battery costs
In our analysis of costs we restrict our attention to component designs that appear feasible given what is known about the technology While a specific design does not need to currently exist there should be a clear path to it that appears feasible Technology breakthroughs that cannot currently be foreseen may indeed happen in the future but it does not make sense to base policy decisions on the presumption that they will
How Cost Reduction Factors Enter Our Analysis We carefully consider the effects of production scale on our estimates and the high-
volume estimates are based on knowledge about the types of production processes that are feasible at high volumes for the products considered Manufacturing experience may result in additional cost reductions and experience in many settings suggests that costs do fall substantially with manufacturing experience But this is not guaranteed It could be that the manufacturing process envisioned when developing the high-volume estimate does not work out as well as conceived Component costs thus may indeed fall below those currently predicted at
-38-
high production volume but it is also possible that even with additional manufacturing experience unanticipated problems may mean that the high-volume predictions are not realized
In the analysis below we provide some evaluation of the opportunities for additional cost reductions through learning Generally we believe that the high-volume cost estimates in the studies we reviewed have squeezed costs down about as far as possible given the material requirements of the product Thus we think it unlikely that costs will fall below the high-volume cost estimates here absent technological advances that currently cannot be foreseen
Our analysis combines estimates of the relation between production volume and cost and expected production volume between 2003 and 2007 to predict component costs during the first five years of the program We think it likely that these cost projections are reasonably realistic for what will be observed in the near term We then predict costs at high production volumes Forecasting technological advances is very difficult beyond 10 years or so We thus think it appropriate to interpret our high-volume cost estimates as the lowest costs that can be expected over the next 10 years or so given what is currently known about advanced vehicle technologies and manufacturing processes
43 COMPONENT COSTS OF BATTERY-POWERED ELECTRIC VEHICLES AND GASOLINE HYBRID ELECTRIC VEHICLES
This subsection synthesizes the results of existing studies to estimate the costs of the components in BPEVs and GHEVs Subsequent subsections address the costs of DHFCV and PZEV components
Battery Modules and Auxiliaries NiMH Battery Modules CARBrsquos Battery Technology Advisory Panel (BTAP) assessed
the cost performance and availability of batteries for EVs and issued a report in 2000 (Anderman Kalhammer and MacArthur 2000) It based its analysis on data from battery manufacturers automakers existing research reports and its own analysis It concluded
From the cost projections of manufacturers and some carmakers battery module specific costs of at least $350kWh $300kWh and $225-250kWh can be estimated for production volumes of about 10k 20k and 100k battery packs per year respectively To the module costs at least $1200 per battery pack (perhaps half of that sum in true mass production) has to be added for the other major components of a complete EV-battery which include the required electrical and thermal management systems (Anderman Kalhammer and MacArthur 2000 p v)
The Panel assumed only incremental technological improvements (p vi) so it based its projections on what is known about the technology today The declines in unit cost with production volume are due to ldquoeconomies of scale that result from discounts on bulk purchases of
-39-
materials and components higher efficiencies in the use of labor and equipment and especially use of custom-designed automated manufacturing equipment with high production rates and product yieldsrdquo (p 23) The Panel believes that further reductions in module costs below $225 to $250 per kilowatt-hour are possible with sustained production on a true mass production scale (100000 or more battery packs per year)3 These reductions would be due to additional automation incremental improvements in battery design and process technology refinement based on accumulated production experience The Panel did not predict how low costs could go but it concluded that reductions in costs below $225 to $250 per kilowatt-hour would be possible only if material costs declined significantly (p 24)4 We thus conclude that additional learning by experience will produce only limited cost savings given what is currently known about the physics of battery development
Figure 42 displays a curve fit to approximate the BTAP estimates Data presented by Panasonic EV at the 1999 UC Davis conference are also included in the figure In our analysis of EV costs at high production volumes we allow NiMH module costs to vary between $225 and $250 per kilowatt-hour
Lead Acid Battery Modules The BTAP cites a range of $100 to $150 per kilowatt-hour for the production costs of lead acid (PbA) batteries at volumes of 10000 to 25000 packs per year (Anderman Kalhammer and MacArthur 2000 p iv) Lipman (1999b) estimates that PbA battery costs are between $107 and $113 per kilowatt-hour for high volumes (gt100000 full-function battery packs per year) Data provided to AC Propulsion and CARB by a major EV battery manufacturer (the name is not publicly available) also provide a half-dozen data points We used these data to fit a relationship between cost and production volume (see Figure 43 where the data represent the cost of a 60-Ah battery module)
In the early years of the ZEV program manufacturers may produce 5000 or fewer full-function EVs If the entire 5000 full-function EVs were produced with PbA batteries annual battery production would be 150000 kWh The resulting battery cost from Figure 43 would be roughly $150 per kilowatt-hour Figure 43 suggests that $100 per kilowatt-hour is a plausible high-volume cost for PbA battery modules
Table 44 gives battery costs for two production scenarios between 2003 and 2007 and for high-volume production The high full-function EV scenario (2003-2007) accounts for an average annual production of 16600 vehicles between 2003 and 2007 the low full-function EV ____________
3Note that there are multiple battery modules in a battery pack 4The Panel concluded that major advances or breakthroughs that could reduce battery costs were
unlikely for the next six to eight yearsmdashthat is through 2006 or 2008 (Anderman Kalhammer and MacArthur 2000 p vi)
-40-
BTAP estimatesPanasonic EV estimates
600
200
300
400
500
100
$ pe
r kW
h
0 15 30 45 60 75 90 105
kWh per year (millions)
Figure 42mdashNiMH Module Cost as a Function of Production Quantity
0
50
100
150
200
250
300
350
400
0 100000 200000 300000 400000 500000 600000 700000 800000
$ pe
r kW
h
kWh per year
Estimates from a major battery manufacturer
Lipman (1999b) estimates
BTAP estimates
Figure 43mdashPbA Module Cost as a Function of Production Quantity
-41-
Table 44
EV Battery Module Costs ($ per kWh)
Battery Type
High Full-Function
EV Scenario 2003-2007
Low Full-Function EV
Scenario 2003-2007
Cost in High-
Volume Production
PbA 103 174 100
NiMH 356 465 225-250
scenario accounts for an average annual production of 4700 vehicles (see scenarios 1 and 2 in Section 3)
NiMH Batteries for GHEVs Batteries for GHEVs require a higher power density than those for full-function EVs and city EVs Consequently these batteries are costed as a function of power NiMH GHEV batteries provide approximately four times the power density of NiMH EV batteries (Current designs from Sanyo and Ovonic claim to achieve a power density of 1000 watts per kilogram of battery weight) According to a recent report the cost to auto manufacturers is $500 to $2000 per GHEV battery pack with a life expectancy of five to eight years (PRNewswire 2001) Given the power ratings on the current fleet of GHEVs that equates to roughly a range of $20 to $80 per kilowatt Lipman Delucchi and Friedman (2000) develop a range of $22 to $31 per kilowatt with future manufacturing experience taken into account We use $20 per kilowatt as a high-volume cost for a NiMH GHEV battery
Battery Auxiliaries Battery auxiliaries must be added to the battery modules to create a complete pack They include (1) a battery tray and straps (2) an electrical wire harness (3) bus bars and terminals and perhaps (4) a coolingventilation system Delucchi et al (2000) provide information on the cost of battery auxiliaries Based on this study we put the costs of auxiliaries at $14 to $19 per kilowatt-hour for a PbA battery pack and $8 to $11 per kilowatt-hour for a NiMH pack between 2003 and 2007 As quoted above the BTAP puts the cost for a 30-kWh full-function EV pack at $1200 but believes that this figure could be halved in high-volume production We therefore interpret the Panel estimates to be between $600 and $1200 depending on production volume equivalent to $20 to $40 per kilowatt-hour of pack storage capacity We combine these findings to estimate the costs of battery auxiliaries as $8 to $40 per kilowatt-hour for NiMH packs and $14 to $19 for PbA packs these estimates hold for the different types of EVs that may be used to satisfy ZEV program requirements The lower ends of the ranges are used to develop high-volume cost increments for the entire EV (see Table 45) While not insignificant the costs of battery auxiliaries are much less than the costs of battery modules
-42-
Table 45
EV Battery Auxiliary Costs ($ per kWh)
Type
2003-2007
Volume Production
PbA auxiliaries 14-19 14
NiMH auxiliaries 8-40 8
Motors and Controllers Two types of motors and motor controllers are used by major original equipment
manufacturers (OEMs) for BPEVs AC and DC motormotor controllers It is accepted in the literature that motor costs are a function of peak power requirements but that motor controller costs are not as closely tied to the motorrsquos peak power Generally AC motors are less expensive than DC motors but the opposite holds for motor controllers (since DC controllers require fewer power switching modules)
Our estimates of motor and motor controller costs as well as the estimates discussed below for EV transmission costs are largely based on the work of Lipman (1999a) and Lipman Delucchi and Friedman (2000) A brief description of the methods used in these analyses is warranted
Lipman estimates component costs for different production volumes by estimating parameters for material costs costs of adding values to materials (eg labor and equipment costs) and manufacturer profit (Lipman 1999a p 44) The parameters are estimated in part using data provided by component manufacturers His estimates are also based on work done at Argonnne National Laboratory (ANL) ANL has extensively analyzed the relationships among material labor costs production equipment and other costs in conventional vehicles produced at high volumes and Lipman uses these multipliers to help estimate EV component costs at high volumes He develops high central and low estimates of cost at each production volume which in the case of motor controllers reflect ldquodifferent assumptions about the degree to which costs of key motor controller components will be reduced by production volumerdquo (Lipman 1999a p 44) We use Lipmanrsquos central cost estimates He estimates production costs for 2000 20000 and 200000 units per year We use curves fit to these data to predict costs between 2003 and 2007 For high-volume production we use the equations to predict costs when annual production volume is 500000 units
Lipmanrsquos estimates clearly capture technological scale effects and his projections start with detailed descriptions of the parts and costs of current technologies Thus his cost estimates appear to be based on technological improvements that are reasonably likely His high-volume
-43-
cost projections consider ratios between materials cost overhead and other costs that are based on volume production of conventional vehicles Thus he is incorporating reductions in manufacturing costs that can be expected with increased volume based on past experience Additional cost reductions may be possible as manufacturers gain experience with the production process On the whole however Lipmanrsquos description of his approach suggests to us that his analysis contains enough optimistic assumptions that make it unlikely that learning will cause costs to fall beyond our high-volume cost estimates for the next 10 years or so absent unanticipated technological improvements5
AC Induction Motor and Controller Following Lipman Delucchi and Friedman (2000) we assume that the cost of AC induction motors is not sensitive to further increases in production volume and is $1080 per kilowatt-hour of rated peak power from 2003 to 2007 Lipman argues that existing production of AC motors is large enough that cost is steady across production volumes The tooling for these motors is in place and they are produced on flexible-flow production lines (Lipman 1999a p 45)
We follow Delucchi et al (2000) who cite the data from Lipman and SatCon Technology Corporation in developing costs for AC controllers for several production quantities The cost estimates when production volume is 200000 units a year are based on data from SatCon SatCon has recently received funding from the Department of Energy to develop EV motor and controller components SatCon seeks to reduce controller manufacturing costs by selecting low-cost material integrating subsystems to reduce parts counts and utilizing low-cost production techniques (Lipman 1999a p 43) SatConrsquos projections at 10000 to 200000 units per year represent substantial cost reductions over costs today (from costs over $3300 today to $500 to $700 for a 50-kW-peak motor) In principle additional cost reductions are possible with manufacturing experience but it seems likely that in developing its cost targets SatCon has squeezed margins above material costs very hard
Delucchi et al (2000) include a cost component that is a function of power rating and a component that reflects internal elements of the controller that are not necessarily cost-sensitive to the power rating but are cost-sensitive to production volume increases Based on these data we fit the following equation for AC controller costs
$710 to $900 per kWmotor-peak + y where y = 149255x-051 and x is the annual unit production volume
____________ 5For example his central-cost projections for controllers are based primarily on target data for
costs from SatCon Technology Corporation (Lipman 1999a p 47)
-44-
DC Permanent Magnet Motor and Controller Lipman Delucchi and Friedman (2000) surveyed the literature on DC permanent magnet motors (including Cuenca Gaines and Vyas 1999) and determined costs on the basis of both peak kilowatt rating and production volume His estimates run from $1251 to $2969 per peak kilowatt depending on production volume not including additional power-invariant costs Lipman adds $779 for production volumes as low as 2000 per year and $88 for production volumes around 20000 per year6 His estimates are shown in Figure 44 for three different production volumes we can interpolate for production quantities between these levels
The material costs used in Lipmanrsquos estimates of DC permanent magnet motors are generally based on Cuenca Gaines and Vyasrsquos analyses (Lipman 1999a p 45) Cuenca and his colleagues at ANL have developed detailed material costs and high-volume manufacturing costs for permanent magnet motors At high volume material costs account for 60 to 70 percent of overall component cost per unit (Lipman 1999a p 75) Thus absent technological changes in the design there is not much room for reductions in manufacturing costs through manufacturing experience
Our estimates for DC permanent magnet controller costs are drawn from the same sources as the AC controller costs discussed above The resulting equation is
$480 to $690 per kWmotor-peak + y where y = 162123x-053 and x is the annual unit production volume
Motor and Controller Costs Used in Our Analysis For 2003 to 2007 we combine the above equations with estimates of production volume from Subsection 32 to predict motor and controller costs
Cuenca Gaines and Vyas (1999) provide a starting point for estimates of high-volume production costs As shown in Table 46 the materials in their DC system (ie motor and controller) cost $1190 to $1360 and the materials in the AC system run from $1316 to $1516 for the size of the motor indicated For the 50-kW motor used in our analysis these estimates translate to between roughly $1200 and $1500 for the motor and controller costs combined Since these estimates were made the costs and sizes of motor controller parts have declined GM reported in 1999 that it had cut the cost of its EV1 drivetrain (motor and motor controller) in half reduced its size by half and cut the number of parts by one-third as part of its ldquoGeneration IIrdquo design At one point GMrsquos Advanced Technology Vehicle center was working on ldquoGeneration
____________ 6These power-invariant costs can be approximated with the function 687000x-090 where x is the
annual production volume
-45-
0
10
20
30
40
50
60
25 45 65 85 105 125
$ pe
r kW
kW of peak power
2000 units per year
20000 units per year
200000 units per year
SOURCE Based on Lipman Delucchi and Friedman 2000
Figure 44mdashDC Motor Cost as a Function of Production Quantity
IIIrdquo drive components that were to be half again the cost of the Generation II components (EV World 1999) CARB notes that for the GM Precept equipped with Generation III drivetrain components a key component of the power inverter (motor controller) module is one-sixth the size of the one used in the EV1 Honda has published similar statements in regard to electric motors and controllers Therefore it seems likely that the material costs in Cuenca Gaines and Vyas 1999 are high given the technological improvements that have already occurred since their study
We extrapolate from the relationships between production volume and cost above to predict motor and controller costs at high volume The relationship between combined motor and controller costs and production volume for a 50-kW motor is presented in Figure 45 The combined cost at 500000 units lies between $725 and $1200 (compared to $1200 to $1500 in Cuenca Gaines and Vyas 1999) We use this range in our high-volume production scenarios As a city EV system is rated at half the power of a full-function EV system we use a figure that is roughly half these estimates for the city EV motor and controller in high-volume production The motor in the DHFCV that we cost out is rated at 75 kW We thus increase the range estimated for a 50-kW system by 50 percent The resulting range is $1100 to $1800
-46-
Table 46 Estimate of High-Volume Costs for 53-kW DC Motor 67-kW AC Motor
and 70-kW DC and AC Motor Controllers ($)
Cost Driver DC System AC System Motor
Magnets 175 0 Other materials 215 291 Assembly and test 97-167 125-194 Total mfg cost 487-557 416-485 Gross margin (at 20) 97-111 82-97 Total cost 584-668 498-582 Cost per kW 11-126 74-87
Motor Controller Switching modules 200-300 400-600 Other components 500 500 Assembly costs 100 100 Total mfg cost 800-900 1000-1200 Supplier margin (at 20) 160-180 200-240 Total OEM cost range 960-1080 1200-1440 Cost per kW 137-154 171-206
Total Motor and Controller ($kW) 247-280 245-293 SOURCE Cuenca Gaines and Vyas 1999
Summary of Motor and Controller Costs for BPEVs Table 47 summarizes our estimates of the average motor and motor controller costs The second column predicts costs between 2003 and 2007 for the high-volume scenarios (see Section 3) the third column predicts cost for the same period for the low-volume scenarios The final column lists high-volume production costs
Learning through manufacturing experience could conceivably reduce costs below the volume production costs listed here However we have been aggressive about continuing to reduce costs as volume increases (production scale economies) and thus think it unlikely that learning will reduce costs further over the next 10 years or so given what is known about the technology and manufacturing processes
Motor and Controller Costs for GHEVs Energy and Environmental Analysis estimates the volume production costs for the Toyota Prius (Duleep 1998) It put the motor controller at $704 and its 33-kW electric motor at $147 Accordingly we use the sum ($851) as our upper bound for high-volume cost for a GHEV motor and motor controller GHEV motor and controller costs should not exceed those for a full-function EV in the long run We thus set the lower bound of the range at $725
-47-
0
500
1000
1500
2000
2500
3000
0 100000 200000 300000 400000 500000
Cos
t ($)
California production volume of EVs
High estimate
Low estimate
Figure 45mdashCombined Cost of 50-kW Motor and Motor Controller at
Different Production Volumes
Table 47
Motor and Motor Controller Costs for Full-Function EVs and City EVs ($ per motor and controller)
Type
High-Volume Scenarios 2003-2007
Low-Volume Scenarios 2003-2007
High-Volume
Production 50-kW Full-Function EV AC 2000-2100 3000-3100 725-1200 DC 2100-2500 3500-3850 725-1200 25-kW City EV AC 1550-1600 3000-3100 450-550 DC 1550-1800 3500-3850 450-550
EV Transmission and Other EV Auxiliaries Lipman (1999b) reports data from Unique Mobility on the cost of a single-speed EV
transaxle for volumes of 2000 20000 and 200000 units per year7 Based on those data we fit the following equation ____________
7Unique Mobility considers itself to be a ldquoworld recognized technology leader in the development and manufacture of energy efficient power dense electric motors generators and electronic inverters aimed at high growth and emerging marketsrdquo (httpwwwuqmcom)
-48-
cost per kWmotor-peak = 315x-030
where x is the annual unit production volume
For EV auxiliaries (including motors to drive compressors for steering and braking systems) we use the data in Delucchi et al 2000 (p 40) to fit the function
cost per kWmotor-peak = 72x-018+ 045x-020
where x is the annual unit production volume
The costs of these auxiliaries are small amounting to roughly $2 per kilowatt of peak motor power when annual production is 2000 and $085 per kilowatt when annual production is 200000 units
The high-volume estimate for the EV transmission and auxiliaries is based on predictions of these equations when volume is 500000 units per year It comes to $7 per kilowatt of peak motor power
Integrated Charger For integrated chargers we use estimates obtained from AC Propulsion (Brooks and Gage
2001) $1338 $474 and under $300 for vehicle volumes of 100 1000 and 10000 respectively for a conductive system8 These cost figures fit the following curve
cost = 5417x-032
where x is the annual unit production volume
This curve predicts a cost of $284 at a volume of 10000 and we used it to project integrated charger costs between 2003 and 2007
AC Propulsion had earlier (in 2000) provided Delucchi et al with integrated charger cost estimates (Delucchi et al 2000 p 39) The costs were $800 per vehicle when production ranged from 5000 to 10000 units per year The 2001 estimates are substantially below this and may reflect technical improvements or projected improvement in manufacturing processes We have not been able to investigate the reason for the decrease Data are not available on high-volume production costs The substantial decrease in estimated costs between 2000 and 2001 may indicate that costs will continue to decrease in the future But they may also mean that the 2001 estimates have squeezed costs hard (AC Propulsion is a strong advocate of EVs) We conclude that it is reasonable to use $250 to $300 for high-volume production costs ____________
8In June 2001 CARB adopted on-board conductive charging as the standardized charging system for EVs in California with implementation to be in 2006
-49-
Savings From Exclusion of Internal Combustion Engine Vehicle Components It is important to consider the savings that accrue because several key components of
ICEVs are not needed in EVs In Cuenca Gaines and Vyas 1999 manufacturing costs represent 50 percent of the manufacturerrsquos suggested retail price (MSRP) The engine transmission fuel and exhaust system represent 22 percent of the manufacturing cost (or 11 percent of the MSRP) for a subcompact and 20 percent (10 percent of MSRP) for a minivan9 Based on these percentages and a review of current MSRPs for subcompacts and minivans we put costs uniquely associated with ICEVs at $16 to $18 per kilowatt of rated engine power when nonmanufacturing costs are excluded and $32 to $36 once nonmanufacturing costs are included
The cost of ICEV components not required for an EV may well increase Auxiliary power requirements are expected to rise to the point that existing auxiliary power systems will have to be improved for vehicles with internal combustion engines as the sole power plant One published estimate puts the cost increment (for more powerful batteries alternators and wire harness) at $1000 (Sullivan 2001)
Currently passenger cars operate between 1 and 2 kW of auxiliaries but this amount is rising as amenities such as cell phones entertainment systems navigation systems electric steering electric brakes electric suspension and electric valves are added Existing 14-volt generators on ICEVs are limited to generating around 2 kW maximum All together nonpropulsion-related power needs could rise to between 5 and 10 kW or more (see Table 48) which is comparable to the power needs of a large home
Cars with 42-volt electrical systems designed for increased loads may arrive in the next several years These systems entail added costs for a larger battery more robust wiring and advanced switching components EVs and hybrid EVs are inherently capable of producing large amounts of electrical power so it is possible that the cost differential between conventional ICEVs and EVs and hybrid EVs may narrow as ICEV electrical systems are upgraded We do not make an adjustment for this effect in our analysis First we have not been able to examine the basis for the $1000 estimate above Second the extra power requirements will presumably also require more battery storage (and higher costs) to maintain the same vehicle range
Our discussion so far concerns the costs of ICEV components that are not required in EVs But our cost estimates of GHEVs must also include the cost savings due to the smaller internal combustion engines that are feasible in hybrids For example the Ford Escape GHEV will have a ____________
9In Cuenca Gaines and Vyas 1999 a subcompact has a 4-cylinder engine and a 5-speed transmission and a minivan has a 6-cylinder engine and a 4-speed transmission
-50-
4-cylinder internal combustion engine that performs like a conventional 6-cylinder power plant The increment in MSRP from the 4-cylinder to the 6-cylinder is $1400 according to Fordrsquos price
Table 48
Breakdown of Current and Potential Power Needs of an ICEV
Load Peak (watts) Average Electromechanical valves (6 cyl 6000 rpm) 2400 800 Water pump 300 300 Engine cooling fan 800 300 Power steering (all elec) 1000 100 Heated windshield 2500 200 Catalytic converter pre-heat 3000 60 Active suspension 12000 360 Commnaventertainment -- 100 Total -- 2220
SOURCE Kassakian 2000
guides We assume that the MSRP increment is twice the increment of the engine cost putting the reduction in engine cost at $700
44 COMPONENT COSTS OF DIRECT HYDROGEN FUEL-CELL VEHICLES In this subsection we first provide an overview of studies on projected proton exchange
membrane (PEM) fuel-cell system costs We then examine the costs of key fuel-cell components and their cost drivers
Overview of Recent Studies on PEM Fuel-Cell Systems The cost today of fuel cells is very high Current estimates for a hydrogenair fuel-cell
system run from $500 (Arthur D Little Inc [ADL] 2001 p 17) to $2500 per kilowatt (US Department of Energy [DOE] 1998 as cited in Lipman Delucchi and Friedman 2000 p 18) This translates into $30000 to $150000 for the 60-kW systems that will be needed for standard-size vehicles However many analysts project that fuel-cell costs will drop dramatically because of design and manufacturing improvements and volume production For example Ford Motor Company and Directed Technologies Inc (DTI) detail a product specification and manufacturing process that result in costs of $33 to $43 per kilowatt (fuel-cell stack and auxiliaries combined) at high-production volumes (Oei et al 2000) The following paragraphs describe the key studies Table 49 summarizes their findings
Arthur D Little (ADL) 2001 Study This study employs the Delphi method to solicit opinions from experts on the cost and performance of PEM fuel-cell vehicles over the next 30 years It provides costs for a fuel-cell system that could use hydrogen generated from gasoline by an on-board fuel reformer Such fuel cells require higher loadings of precious metals because of
-51-
impurities that remain after the reforming process The report concludes that future costs for a complete system (stack and auxiliaries) could drop to $111 per kilowatt The key cost driver with
Table 49
Summary of Studies on Fuel-Cell Costs
Study
Sponsor
Platinum Loading (mgcm2)
High-Volume Cost Arthur D Little 2001 California Energy Commission 08a $111kW for stack plus
auxiliaries Fuel Cell Technical
Advisory Panel 1998 CARB 025 $20kW for stack
$15kW for auxiliaries Oei et al (FordDTI) 2000 Ford and US DOE 025 $19-$28kW for stack Lipman Delucchi and
Friedman 2000 Kirsch Foundation and Union of Concerned Scientists
025 $39-$43kW for stack plus auxiliaries
aThe ADL design requires rhodium as well as platinum
regard to fuel cells is the amount of precious materials required As shown in Table 49 the ADL study assumes 08 grams of platinum and rhodium per square centimeter of active fuel-cell area
According to the ADL study (p 17) experts from Ballard Ford and DaimlerChrysler have predicted the cost of the Ballard Mark 900 fuel-cell module to be $50 to $60 per kilowatt in large volumes (approximately 300000 units per year) This range suggests that the platinum loading in the Ballard design is substantially less than 08 gmcm2
Kalhammer et al (Fuel Cell Technical Advisory Panel FCTAP) 1998 Study CARB established the FCTAP in 1996 to assist it in assessing the status and prospect of fuel cells for auto use A study was completed and a report was issued in July 1998 The research method was to ldquoacquire information from responses to a widely distributed questionnaire and in visits with organizations considered leaders in key aspects of fuel cell electric engine and vehicle developmentrdquo The panel concluded
The Panelrsquos visits and discussions with leading developers and potential manufacturers of PEM fuel cell components and stacks made clear that the fundamental technical barriers to the development of automotive fuel cell stacks have been overcome by the advances achieved over the past 5ndash7 years The large increases in the specific performance of PEM cells and stacks also have lowered the cost barriers to the point where future mass production may be able to meet the stringent cost goals for critical cell components and stacks intended for automotive applications (Kalhammer et al 1998 p III-21)
The FCTAP went on to predict
[On] the basis of the performance already achieved with preprototype stacks there appear to be reasonable prospects for meeting the $20kW ($100050kW) cost target for automotive fuel stacks if production reaches about 100000 to 200000 units per year At this level the
-52-
most critical stack componentsmdashmembrane MEA and separator platemdashwill reach production volumes that justify true mass manufacturing methods (Kalhammer et al 1998 p III-54)
-52-
Oei et al (FordDTI) 2000 Study This study considers four detailed designs and assesses the cost based on high-volume production (500000 units per year) with cost reductions gained by applying DFMA (design for manufacturing and assembly) techniques The DFMA process has been formally adopted by Ford as a systematic means for the design and evaluation of cost-optimized components and systems It combines historical cost data and manufacturing acumen accumulated by Ford since the earliest days of the company (Oei et al 2000 p 3-1)
FordDTI project that costs for PEM stacks will range from $19 to $28 per kilowatt in high-volume production The range is due to the overall stack power rating (eg 60 to 80 kW) Costs include material manufacturing and assembly costs as well as markups to reflect profit scrap RampD and administrative costs
As we discuss in more detail below the Ford design incorporates a number of well-researched but still untested features Learning through manufacturing experience could reduce costs further but Lipman notes that ldquothe estimation methodology used by DTI was specifically designed to identify the lowest cost PEM stack design configuration and the choice of a production volume of 300000 units per year suggests that it would be difficult to construe a lower cost caserdquo (Lipman Delucchi and Friedman 2000 p 19) In Ford and DTIrsquos view further cost reductions will require important technological advances They conclude that further cost reductions will require a reduction in platinum catalyst loading or in gas diffusion electrode costs because the costs of other components are based on ldquomaturerdquo manufacturing technologies (Oei et al 2000 p 3-47)
Lipman Delucchi and Friedman 2000 Study To project fuel-cell costs in the near term Lipman Delucchi and Friedman use an experience curve which is a way to relate unit cost (in this case $kW) to cumulative production They start with a cost of $2000 per kilowatt and 5000 kW of cumulative production in 2006 (p 19) costs then decline 22 percent for each doubling of production (this corresponds to a 78 percent experience curve) They note that experience curves typically range from 70 to 90 percent10 Costs decline until they reach a lower bound based on DTIrsquos estimates Lipman Delucchi and Friedman reduce cell peak power density roughly 15 percent from that assumed by DTI and arrive at a lower bound of $39 to $43 per kilowatt for the stack and auxiliaries combined
Figure 46 illustrates the experience curve of Lipman Delucchi and Friedman for a 25-kW PEM fuel-cell system As cumulative production increases costs fall rapidly and approach $60 per kilowatt ____________
10Note that these experience curves are for the successful products For many products the technology or costs did not allow commercial production that was long enough for an experience curve to be observed
-53-
25000 75000 125000 175000 225000 275000
SOURCE Based on Lipman Delucchi and Friedman 2000
0
50
100
150
200
250
$ pe
r kW
Worldwide cumulative production of DHFCVs (in thousands)
Figure 46mdashPEM Fuel-Cell System Costs as a Function of
Accumulated Production Quantity
Fuel-Cell Components Membrane Electrode Assembly Cost and Design The biggest contributor to the cost of
a PEM fuel-cell stack is the platinum (which serves as a catalyst) Platinum accounts for a significant portion of the MEA cost in any design For the design specified in the FordDTI study (Oei et al 2000) the cost of the platinum represents 75 percent of the total cost of the MEA
Table 410 compares the platinum loading in the MEA for the relevant studies The ADL 2001 study assumes a design with a large amount of platinum (08 mgcm2) which easily accounts for half of the MEA cost All the other studies assume far less for future-year designs DOE claims a breakthrough of 015 mgcm2 for experimental MEAs in laboratory quantities from a 3M design11 The FordDTI study (Oei et al 2000) assumes 025 mgcm2 and the FCTAP study (Kalhammer et al 1998) cites designs that range from 025 to 035 mgcm2 A Los Alamos National Laboratory study (LANL 2002) describes PEM fuel cells with low platinum loads (011 and 015 mgcm2) that have been tested to 4000 hours One reason that the ADL studyrsquos loading ____________
11In June 2001 DOE announced that 3M was selected for a $77 million cost-shared contract to develop MEAs with improved cathodes high-temperature membranes and optimized gas diffusion layers Improved flow fields and MEA fabrication processes will also be developed
-54-
Table 410
Platinum Loading in Membrane Electrode Assembly
Study
Platinum Loading (mgcm2)
MEA Cost in High Volume ($kW)
Comment Arthur D Little 2001 08 -- Assumes platinum is $1350gm Oei et al (FordDTI) 2000 025 10-11 Assumes platinum is $1286gm Los Alamos National Laboratory 2002 011-015 -- -- Kalhammer et al (FCTAP) 1998 Designs reviewed
Gore 03 -- -- Johnson Matthey 035 lt15 -- 3M 025 5-10 Assumes production of gt1 million m2yr
is much higher is that it is based on a fuel cell that can accept hydrogen reformed from gasoline or methanol Such fuel cells likely require more platinum and also rhodium to protect against impurities that remain after the reforming process A DHFCV is less susceptible to this type of catalyst poisoning so lower catalyst loadings are possible
These studies suggest that it is highly likely that an MEA with 025 mgcm2 can be built for automotive use and we have adopted this catalyst loading in our analysis Information on the durability of such cells is not publicly available It is possible that the Ballard fuel-cell system currently being tested by Toyota and GM and the fuel cell in Hondarsquos vehicles contain levels approaching 025 mgcm2 but such data are not publicly available Even if the levels in these cells are near 025 their real-world durability is still being investigated We thus cannot be entirely sure that fuel cells with 025 mgcm2 of platinum will work for automotive use Designs with even lower loadings however suggest that 025 mgcm2 is not a wildly optimistic assumption
The low MEA cost in the FordDTI study (Oei et al 2000) is based on a number of other design features that are well documented and researched but have not yet been produced For example FordDTI propose a composite polymer electrolyte membrane rather than conventional homogeneous membranes (p 3-5) The projected cost savings are 98 percent of current homogeneous membrane costs The electrodes in the FordDTI study are constructed from an advanced carbon paper that is still under development (p 3-11) Highly automated manufacturing techniques are used that might not pan out as well as envisioned FordDTI did however build some cushion into their estimates For example projected costs are inflated by 10 percent to ensure ldquoappropriate conservatismrdquo (p 3-44) and the lowest projected advanced carbon paper costs were not used (p 3-14) FordDTI believe their projections are based on ldquoaccepted manufacturing techniques and realistic technical parametersrdquo (p 3-19) In their view the projections would require a minimum of technological advancement (p 3-46)
-55-
FordDTI conclude that the MEA for a direct hydrogen fuel-cell stack can be built for $10 to $11 per kilowatt at high-volume production CARBrsquos FCTAP concludes that costs could run from $5 to $10 per kilowatt
Bipolar Plate Cost and Design The role of the bipolar plate (also called the separator plate) is to provide support for the fuel-cell membrane as well as to uniformly distribute the hydrogen on one side of the membrane and the oxygen on the other side The plate also has a role in conducting heat to allow for proper cooling It must be corrosion resistant and able to operate under pressure (Dayton 1999 Bulk Molding Compounds Inc 2001)
The FCTAP 1998 study cites a variety of approaches and designs for bipolar or separator plates as well as uncertainty as to the cost of this component A number of different types of materials could be used for the bipolar plates but the four main considerations are
1 corrosion-resistant metals 2 coated metals 3 carbongraphite 4 compatible polymers The FordDTI study assumes a metallic bipolar plate made of 316 stainless steel (which
contains high percentages of chromium nickel and molybdenum) This study considers two types of cell construction a three-piece design and a cheaper unitized (one-piece) separator plate An earlier ADL study (ADL 2000) assumes the use of a molded graphitepolymer composite bipolar plate the plate is molded into two pieces and bonded together
The FCTAP study does conclude that at least one developer could provide a design that allows the cost of the bipolar plate to be $5 per kilowatt
No stack developer appears to have made a final choice but several approaches look promising including embossing of impregnated porous carbon molding of commercially available carbon composites (Energy Partners) embossing of coated metal plates (Allied Signal Siemens) and perhaps bonding of appropriately shaped metal sheets (H-Power) At present confident estimates of separator plate costs are still lacking However the approaches under development were all selected for their potential to permit low-cost mass manufacturing of plates from inexpensive materials lending credibility to the $5kW cost projected by a leading developer (Kalhammer et al 1998 III-24)
Oak Ridge National Laboratory reports that it is working on a design envisioned to meet a cost goal of $10 per kilowatt The design being considered is one with thin metallic plates (thinner than a few millimeters) that uses carbon composites instead of graphite which is more costly to work with (Fuel Cell Catalyst 2001)
-56-
Fuel-Cell Auxiliaries Auxiliaries are devices that manage air water and other thermal issues In addition control electronics are required The cost of the auxiliary equipment supporting a fuel-cell stack has to be considered Fewer studies project costs for this part of a fuel-cell system Auto industry goals are $20 per kilowatt DTI (1998) assesses them to be $14 to $15 per kilowatt ADL concludes that the balance of plant costs in high-volume production for a gasoline-fueled PEM fuel cell would be $10 per kilowatt of stack power (ADL 2000)
Summary of Fuel-Cell System Costs It seems likely that DHFCVs will be available in only very small numbers through 2005 (see Subsection 31) We base our fuel-cell system costs between 2006 and 2010 on the manufacturing experience curve developed by Lipman Delucchi and Friedman (2000) Our estimates of fuel-cell system costs for this period run from $100 to $150 per kilowatt For high-production volumes we use $35 to $60 per kilowatt The lower bound reflects $20 per kilowatt for the fuel-cell stack and $15 for the auxiliaries FordDTI (Oei et al 2000) predict stack costs between $18 and $28 and we use $20 which is the low cost for the intermediate-size stacks likely in automotive applications The upper bound is based on estimates that the Ballard Mark 900 fuel cell will cost $50 to $60 per kilowatt in volume production
Our review of the literature led us to conclude that the projections that fuel-cell system costs can fall to $35 to $60 per kilowatt in volume production are well grounded Costs might be even lower if the very low platinum designs currently being investigated pan out However it is too early to tell if this will be the case Manufacturing experience may also reduce costs although additional reductions may not be large because most of the nonmaterial costs have been squeezed out by mature manufacturing techniques However a number of uncertainties remain Unexpected technological or production problems may arise and the durability of automotive fuel cells has not been extensively tested in demanding real-world environments We use this range for volume production costs in our analysis but note that much remains to be done to demonstrate that these low production costs can actually be realized
Hydrogen Tank for a Fuel-Cell Vehicle We considered the cost of the ldquonovel polymer-lined cylindersrdquo described by Thomas et al
(1999) Lipman Delucchi and Friedman (2000) estimate their cost to be $510 per kilogram of hydrogen stored at 350 atmospheres (5000 psi) based on current prices for compressed natural gas tanks Lipman cites a DTI study on high-volume production of such tanks to estimate a lower bound cost of $84 to $163 per kilogram of stored hydrogen This translates to $336 to $652 for a tank that stores 4 kg We use this cost range in our estimates of high-volume costs For the near
-57-
term we use the relation between cost and cumulative volume postulated by Lipman Delucchi and Friedman (2000)12 Figure 47 shows the resulting relationship for a 4-kg tank
45 PZEV COSTS CARB reviewed various technological approaches to PZEVs and concluded that the
incremental cost relative to a vehicle meeting the SULEV exhaust and near-zero evaporative standards was minor
[C]onfidential information from several manufacturers indicates that PZEVs soon to be introduced for sale in California will use a simpler and much less costly combined HC adsorbercatalyst rather than a separate adsorber and an attendant switching valve as had been assumed earlier Further the new information indicates that additional catalyst volume will not likely be required as was the case in the first PZEV system certified for sale in California Manufacturers will still face some increased cost to build increased durability into the emission control components (eg increased catalyst loading) in order to avoid excessive repair costs during the 150000 mile emission warranty period Based on the information acquired by staff some additional carbon trap capability will be added along with improved seals and reconfiguration of some components that do not add large cost The cost of going to a zero evaporative system from the near zero systems is now estimated to be $10 per vehicle Taking all of these factors into account staff now estimates that the necessary hardware modifications to meet PZEV requirements will range from $60 to $85 per vehicle (CARB 2001d p 5)
These estimates are for passenger cars and the smallest category of light-duty trucks (LDT1)13 The additional warranty requirements of PZEVs will range between $125 and $150 per
vehicle according to CARB estimates It is unlikely that all these costs represent incremental costs of PZEVs To some extent the warranty causes a transfer of the costs of maintaining the vehicle from consumers to producers and thus does not change the overall resource costs of PZEVs PZEVs may however cost more to maintain over their lifetimes because of the tighter emission standards The proportion of the warranty that represents a transfer of costs from consumers to producers also depends on the stringency of Californiarsquos inspection and maintenance (Smog Check) program A less stringent program requires fewer problems to be repaired in the absence of a warranty so a larger fraction of the warranty costs are true resource costs Given these uncertainties we vary resource costs due to the extended warranty from $0 to $150 per vehicle This range assumes from none to all of the increased warranty costs represent transfers from consumers to automakers Thus our estimate of the incremental cost of a PZEV
____________
12Tank cost = 321x-02318 where x is cumulative production volume 13Paul Hughes CARB personal communication May 2002
-58-
0
100
200
300
400
500
600
700
800
SOURCE Based on Lipman Delucchi and Friedman 2000
Tank
cos
t ($)
Cumulative production volume (in millions)
0 432 651
Figure 47mdashCost of Tank That Stores 4 kg of Hydrogen as a Function
of Production Quantity
relative to a SULEV meeting the near-zero evaporative emission standards ranges from $60 to $235
We have not been able to examine in detail the basis for CARBrsquos PZEV cost estimates Earlier CARB estimates were higher In August 2000 CARB put the incremental costs of a PZEV (relative to a SULEV) at $500 (CARB 2000b p 106) The design improvements outlined above make a plausible case for the reduced estimates but further analysis is warranted
46 INCREMENTAL VEHICLE PRODUCTION COSTS So far we have discussed the costs of individual vehicle components To calculate the
incremental production costs of vehicles that manufacturers may use to meet ZEV program requirements we subtract the costs of components associated with the conventional ICEV and add in the costs of components associated with each vehicle technology14 Indirect costs associated with each of the components are also dropped and added and we account for changes in these costs (eg corporate overhead warranty and normal profit) Here we first detail the ____________
14As an alternative to this approach one could also build costs of various vehicles from the ground up and then compare the resulting total vehicle costs Delucchi et al (2000) use such an approach
-59-
indirect cost multipliers used in our analysis We then present estimates of the incremental costs of ZEVs ATPZEVs and PZEVs
Multipliers Used to Calculate Indirect Costs Analysis of indirect costs is usually framed in terms of the difference between
manufacturing cost and final manufacturerrsquos suggested retail price (MSRP) Vyas Cuenca and Gaines (1998) break down the components of MSRP and show that the direct manufacturing cost accounts for half of the price (see Table 411) A later report (Cuenca Gaines and Vyas 1999) proposes multipliers to translate vehicle cost to vehicle price Depending on the component the multipliers range from 115 to 20 115 to 13 for the battery pack 15 for all other components supplied to the auto manufacturer and 20 for components developed solely by the auto manufacturer (eg the internal combustion engine) We use these estimates in our analysis For battery packs and fuel-cell systems 115 and 130 are used in calculations of the lower and upper bounds respectively of the cost ranges projected for each production volume scenario15
Incremental Vehicle Production Costs
Estimates of the incremental production costs of the various low-emission vehicles and ZEVs are presented in Table 412 Costs are incremental to a standard ICEV that meets the SULEV exhaust standard and the near-zero evaporative emission standard The second column presents estimates of the range into which incremental production costs are likely to fall on average between 2003 and 2007 if annual production volumes are at the low end of the ranges specified in Subsection 32 The third column presents the range if annual production volumes are at the high end of the ranges specified in Subsection 32 The last column reports incremental costs in volume production Breakdowns of volume production costs for each vehicle technology are presented in Appendix C as is an analysis of the sensitivity of the incremental cost of full-function EVs to changes in peak motor power and battery pack size
As discussed above the incremental costs of a PZEV are modest GHEVs will likely cost several thousand dollars more to produce during the first five years of the program Costs come down in high-volume production but are still expected to exceed standard ICEV costs by $500 to $900 per vehicle BPEVs will be much more expensive to produce during the initial years of the program Incremental production costs including the cost of the first battery pack for a full-function EV using NiMH batteries range from $16700 to $26100 Incremental costs for PbA ____________
15CARBrsquos first estimate of PZEV costs included a 10 percent adjustment for indirect costs (CARB 2000b p 106) We assume that CARBrsquos 2001 estimate also includes indirect costs but the indirect cost multiplier is unknown
-60-
Table 411
Breakdown of Manufacturerrsquos Suggested Retail Price for an ICEV
Share of MSRP () Cost CategorySubcategory By Cost Category By Subcategory Production 670
Manufacturing 500 Warranty 50 RampD and engineering 65 Depreciationamortization 55
Selling 235 Distribution 200 Advertising and dealer support 35
Administration and profit 95 Corporate overhead 50 Retirement and health benefits 20 Profit 25
Total 1000 1000 SOURCE Vyas Cuenca and Gaines 1998
Table 412
Incremental Vehicle Production Costs (relative to an ICEV meeting SULEV exhaust and near-zero evaporative emission standards) (estimated ranges in brackets $1000s per vehicle)
Near-Term Costs Vehicle Technology
Low-Volume Scenario
High-Volume Scenario
High-Volume Production
2003-2007 2003-2007 PZEV [006 023] [006 023] [006 023] GHEV [24 33] [23 29] [05 09] Full-function EV NiMH [225 261] [167 198] [51 99] PbA [127 152] [80 96] [18 43] City EV NiMH [120 134] [85 97] [17 34] PbA [86 99] [53 60] [07 15] 2006-2010 2006-2010 DHFCV [114 152] [83 110] [12 39]
batteries and for city EVs are lower but remain very large between 2003 and 2007 Even in volume production production costs remain substantially above those for ICEVs The lowest incremental cost in high-volume production is $700 to $1500 for city EVs with PbA batteries But these numbers should be used with caution because as discussed above there are drawbacks to designing vehicles with PbA batteries DHFCVs will also likely be much more expensive when they are first introduced Because of low production volumes and the developing technology we estimate that the incremental costs of DHFCVs will run from $8300 to $15200 between 2006 and 2010 But in the long run DHFCV technology looks more promising than BPEV technology does Projections based on what is currently known about fuel cells show that
-61-
incremental production costs may come down to $1200 However we cannot rule out the possibility that production costs will remain nearly $4000 above those of an ICEV
47 INCREMENTAL LIFECYCLE COSTS So far we have discussed the incremental production cost of advanced technology vehicles
but their overall social cost also depends on their incremental lifetime operating costs by which we mean the cost of operating and maintaining the vehicle relative to the cost of operating and maintaining a baseline ICEV We add incremental lifetime operating costs to incremental production costs to estimate incremental lifecycle cost
We begin by presenting and justifying the parameters we use to estimate the incremental lifecycle costs starting with full-function EVs and city EVs and then moving to DHFCVs and GHEVs Any incremental lifetime operating costs of PZEVs (due for example to increased warranty costs) are captured in the production costs estimated above Thus the PZEV incremental lifecycle cost is only the incremental production cost After presenting the parameters we discuss the method we use to predict incremental lifecycle costs using these parameters Finally we present the results of the analysis
Parameters Used to Estimate Incremental Lifecycle Costs of Full-Function and City EVs The incremental lifecycle costs of BPEVs are determined by
bull incremental initial vehicle costs (including first battery and off-board charger) bull vehicle life bull replacement costs and salvage value of batteries bull EV and ICEV fuel costs bull EV and ICEV repair and maintenance costs bull charger installation costs bull the discount rate
Table 413 lists the parameters that determine the incremental costs for full-function EVs in each of these areas along with plausible ranges for their values between 2003 and 2007 and when these vehicles are in high-volume production Parameters for full-function EVs using both NiMH and PbA batteries are shown Table 414 lists parameter values for city EVs with both types of batteries We now discuss the rationale for each parameter range
Incremental Vehicle Cost The incremental vehicle costs between 2003 and 2007 and in volume production are taken from Table 412 For both the full-function and the city EVs they include the cost of the first battery pack
-62-
Vehicle Life Using data from the Transportation Energy Data Book and other sources Delucchi et al (2000 p 55) estimate an average vehicle life of 150000 miles In its analysis of
Table 413
Parameters Used to Calculate Lifetime Operating Cost of a Full-Function EV Relative to a Comparable ICEVa
Full-Function EV with NiMH Batteries
Full-Function EV with PbA Batteries
Parameter
2003-2007
Volume Production
2003-2007
Volume Production
Initial Vehicle Cost ($) (including first battery and off-board charger)
16700-26100
5100- 9900
8000-15200
1800- 4300
Vehicle Life Lifetime vehicle miles traveled 150000 150000 150000 150000 Vehicle life in years 15 15 15 15
Parameters Affecting Battery Replacement Cost
Pack size (kWh) 30 24 30 24 Battery cost ($kWh) 305-360 233-258 115-154 114 Cycle life (1000 cycles) 10-15 15 06-10 10 Range (milescycle) 90-110 90-110 90-110 90-110 Cost surcharge for installing
subsequent packs ($installation) 500 500 500 500
Salvage value ($kWh) 0-40 0-40 -15 to 5 -15 to 5 Parameters Affecting Fuel Costs
EV efficiency (mikWh AC) 2-3 25-35 2-3 25-35 ICEV efficiency (migal) 25-30 25-30 25-30 25-30 Electricity price ($kWh) 0035-005 007-009 0035-005 007-009 Gasoline price ($gal) 056-149 056-149 056-149 056-149
Other Costs EV repair and maintenance (
of ICEV costs) 65-70 65-70 65-70 65-70
ICEV maintenance ($mile) 006 006 006 006 Charger installation ($) 500-1500 500 500-1500 500
Discount Rate () 4 4 4 4 aThe comparable ICEV is mid-sized meets the SULEV and near-zero evaporative emission standards and averages 25 to 30 miles per gallon
lifecycle costs CARB assumes that vehicles travel 117000 miles over their lifetimes (CARB 2000b p 98) which is close to CARBrsquos definition of a ldquouseful vehiclerdquo life rather than actual miles driven before a vehicle is retired Thus for a full-function EV we set lifetime miles traveled at 150000 miles CARB also assumes a vehicle life of 10 years we set vehicle life to 15 years to correspond to the higher lifetime miles traveled that we assumed in our analysis
Because of the limited top speed and range of city EVs they are unlikely to be driven as far on average as full-function EVs over their lifetimes Based on the National Personal Transportation Survey Reuyl and Schuurmans (1996) estimate that vehicles with a daily range of 50 to 60 miles can be used for 50 percent of the miles driven by the average driver We thus
-63-
assume that city EVs will be driven 75000 miles over their lifetimes CARB assumes 88000 (2000b p 113)
Table 414
Parameters Used to Calculate Lifetime Operating Cost of a City EV Relative to a Comparable ICEVa
City EV with NiMH Batteries
City EV with PbA Batteries
Parameter
2003-2007
Volume Production
2003-2007
Volume Production
Initial Vehicle Cost ($) (including first battery and off-board charger)
8500-13400 1700ndash3400 5300-9900
700-1500
Vehicle Life Lifetime vehicle miles traveled 75000 75000 75000 75000 Vehicle life in years 15 15 15 15
Parameters Affecting Battery Cost Pack size (kWh) 10 8 10 8 Battery cost ($kWh) 305-360 233-258 115-154 114 Cycle life (1000 cycles) 10-15 15 06-10 10 Range (milescycle) 50-60 50-60 50-60 50-60 Cost surcharge for installing
subsequent packs ($installation) 250 250 250 250
Salvage value ($kWh) 0 to 40 0 to 40 -15 to 5 -15 to 5 Parameters Affecting Fuel Costs
EV efficiency (mikWh AC) 4-5 5-6 4-5 5-6 ICEV efficiency (migal) 40 40 40 40 Electricity price ($kWh) 0035-005 007-009 0035-005 007-009 Gasoline price ($gal) 056-149 056-149 056-149 056-149
Other Costs EV repair and maintenance (
of ICEV costs) 65-70 65-70 65-70 65-70
ICEV maintenance ($mile) 0045 0045 0045 0045 Charger installation ($) 0 0 0 0
Discount Rate () 4 4 4 4 aThe comparable ICEV is small meets the SULEV and near-zero evaporative emission standards and averages 40 miles per gallon
Parameters That Affect Battery Replacement Cost The cost of the batteries (excluding the first battery pack) needed over a vehiclersquos lifetime is determined by
bull the battery pack size bull the cost of the batteries in dollars per kilowatt-hour bull the cycle life of the battery bull the miles driven on a battery cycle bull the cost markup for buying and installing subsequent battery packs bull the salvage value of batteries
We discuss each in turn
-64-
As described in Subsection 41 we set the 2003-through-2007 battery pack size to 30 kWh for a full-function EV and to 10 kWh for a city EV It seems plausible that the efficiency of EVs (in terms of kilowatt-hours per mile) will increase in the future (see discussion below) We increase efficiency by 20 percent for our estimates of lifecycle costs in volume production so that the battery pack can be smaller and maintain the same range Accordingly we reduce the full-function EV and city EV battery packs to 24 and 8 kWh respectively for the high-production volume cost calculations
The above analysis of battery costs led us to conclude that NiMH battery packs (including battery auxiliaries and indirect costs) would cost from $425 to $460 per kilowatt-hour between 2003 and 2007 The range for PbA batteries is $130 to $170 The cost of replacement batteries for vehicles sold between 2003 and 2007 may well be lower than it was when the vehicle was built due to battery production volumes increasing over time We assume that by the time the battery is replaced 50 percent of the difference between the 2003-2007 costs and the midpoint of the high-volume cost range will have been eliminated The result NiMH replacement costs will be $305 to $360 and PbA replacement costs $115 to $154 In the volume production scenarios we allow NiMH battery pack costs to range from $233 to $258 per kilowatt-hour and set PbA battery costs at $114 per kilowatt-hour
The EVrsquos range (90 to 110 miles for a full-function EV and 50 to 60 miles for a city EV) multiplied by the battery cycle life is a starting point for the miles driven over one packrsquos lifetime which in turn determines the number of packs needed over a vehiclersquos lifetime We reduce the resulting estimate of the miles driven using a single pack by 20 percent because vehicle range is determined by taking the battery down to empty whereas cycle life is usually determined by taking the battery down to a 20 percent charge
We put NiMH cycle life at 1000 to 1500 cycles between 2003 and 2007 and at 1500 cycles in the high-volume cost scenario CARBrsquos Battery Technology Advisory Panel (BTAP) report (Anderman Kalhammer and MacArthur 2000 p 37) cites one auto manufacturerrsquos projection of 1200 cycles and 100000 miles at 77degF and 1100 cycles at 95degF from bench tests that have been partially corroborated by field tests of battery packs in vehicles While cycle life deteriorates when the pack is continuously exposed to extreme heat (113degF) the important implication is that a NiMH battery pack that is properly thermally managed can now achieve 100000 miles In reference to a Panasonic NiMH battery16 the BTAP report optimistically ____________
16At the November 1999 UC Davis Conference on EVs Panasonic EV reported that the RAV4-EV (NiMH) had already achieved 100000 kilometers of driving on one pack in tests in Japan Furthermore Panasonic EV suggested that longer life can be expected with ldquoeconomy chargingrdquo ie intermittent full charging in order to reduce deterioration of the NiMH battery electrode
-65-
forecasts that ldquoit seems quite possible that 1000 to 2000 cycles at 100 percent depth of discharge can eventually be achieved depending on the batteryrsquos initial power versus the carrsquos requirementsrdquo (Anderman Kalhammer and MacArthur 2000 p 31)
PbA batteries currently achieve roughly 600 cycles but Panasonic has been developing designs with longer cycle lives and 1000 cycles appears to be possible (Matsushita Electric 2000)17 We set PbA cycle life to 600 to 1000 cycles between 2003 and 2007 and to 1000 cycles in the high-volume scenarios
Following CARB (2000b p 100) we set the cost of handling and installing replacement battery packs at $500 per pack
Batteries may have salvage value at the end of their lives Battery experts at Southern California Edison told Delucchi et al (2000 p 45) that used NiMH batteries would be at least as good for load-leveling backup and other utility applications as the new PbA packs they currently buy for such uses Thus the salvage value for NiMH batteries might be as high as $100 per kilowatt-hour (roughly the current cost of new PbA batteries) at least until the supply of retired NiMH batteries saturates the market The secondary market for NiMH batteries is quite uncertain however CARB (2000b p 100) assumes that the salvage value is $40 per kilowatt-hour for NiMH batteries but Delucchi et al (2000) believe the batteries will lose their remaining value very quickly and that there thus will be little market for them They believe the batteries will have to be recycled at a small net cost at low volumes and will have a small net salvage value at medium volumes In our analysis we vary the salvage value of NiMH batteries from $0 to $40 per kilowatt-hour
CARB (2000b p 100) believes a secondary market for used PbA batteries at meaningful volumes is speculative and assumes a salvage value of $3 per kilowatt-hourmdashthe value of the materials in the battery Delucchi et al (2000 p 46) assumes that PbA batteries will have negative salvage valuemdashthat is they will cost between $5 and $15 to recycle In our analysis we vary PbA salvage values from -$15 to $5 per kilowatt-hour
The last battery pack installed in the vehicle might not be fully used at the end of the vehicle life Following Delucchi et al (2000 p 69) we set the salvage value of the unused portion of the pack equal to 70 percent of the cost of batteries to the manufacturer ____________
17ldquoThe newly developed EV battery lasts approximately twice as long and offers about twice as much power as existing lead-acid EV batteries It can be discharged and recharged approximately 1000 times which is about twice as many cycles as the companyrsquos existing lead-acid EV battery productsrdquo (Matsushita Electric 2000)
-66-
Parameters That Affect Fuel Costs The cost of electricity the cost of gasoline the wall-to-wheels (or AC) efficiency of the EV and the fuel efficiency of the ICEV determine the lifetime fuel costs of a full-function EV relative to an ICEV
The number of BPEVs is relatively small between 2003 and 2007 and we assume that BPEVs can be charged off-peak using existing power generation transmission and distribution facilities As shown in Appendix D the costs of power in such a situation might be expected to run from $0035 to $005 per kilowatt-hour If EVs become a significant part of the transportation system they will use a significant amount of power requiring additional generation transmission and distribution facilities18 For volume production we thus put electricity costs at $007 to $009 per kilowatt-hour which covers the capital cost of the power plant and the transmission and distribution system (see Appendix D) Because we are interested in resource costs we do not include taxes or charges imposed to recover costs during Californiarsquos recent energy crisis Likewise CARB does not include taxes in its analysis of operating costs CARB assumes an electricity cost of $005 per kilowatt-hour however it also presents a scenario in which costs are $0075 per kilowatt-hour (CARB 2000b p 107)
There is a good deal of uncertainty regarding gasoline prices over the lives of the vehicles We assume prices at the pump will vary between $100 and $200 per gallon which is consistent with prices observed in recent years in California Federal and state fuel excise taxes currently total $0363 per gallon and sales taxes on gasoline average roughly 8 percent in the state (CARB 2000b p 107) We thus assume that gasoline costs vary from $056 to $149 per gallon net of taxes
EV efficiency (in miles per kilowatt-hour AC) is based on data developed by Southern California Edison for the EVs produced by the large manufacturers19 Our figures for ICEV fuel efficiency reflect a rough average of the fuel efficiencies of ICEVs that are comparable in size to full-function EVs and city EVs (275 miles per gallon for mid-size ICEVs and 40 miles per gallon for very small ICEVs)
The efficiency of EVs may improve over future design cycles and thus might be higher in volume production than it will be between 2003 and 2007 CARB assumes that efficiency increases from about 22 miles per kilowatt-hour in 2003 to roughly 4 miles per kilowatt-hour in volume production for a four-passenger full-function EV (CARB 2000b p 111) This ____________
18For example to charge 100000 full-function EVs overnight will require a 250-megawatt power plantmdasha good-sized plant (If each full-function EV requires 30 kWh per night 100000 full-function EVs require 3000 megawatt-hours And 3000 MWh12 hours = 250 megawatts)
19We determined the range using the efficiencies remaining after the vehicles with the highest efficiency (the EV1) and lowest efficiency (the EPIC) were discarded (see httpevinelgovfop)
-67-
improvement is driven by a substantial reduction in aerodynamic drag lower-loss tires a higher-efficiency drive system and substantial improvements in charging efficiency While efficiency may well improve we think it likely that CARB is overly optimistic For example vehicles with very low aerodynamic drag are technologically feasible but are not assured of success in the marketplace We increase EV efficiency roughly 20 percent from the levels used to estimate costs between 2003 and 2007 yielding a battery pack that is 20 percent smaller but allows the same range
EV Repair and Maintenance Costs It is often argued that EVs will have lower repair and maintenance costs than ICEVs do because EVs have fewer components and fewer moving parts While this may be so in the long term we follow Dixon and Garber (1996 p 244) in assuming there are several reasons to be skeptical in the near term
bull EV technology is evolving rapidly but projections of EV repair and maintenance costs may be based implicitly on costs for stable designs Components will probably be less reliable in the early years of commercial scale production than in later years
bull Several manufacturers have had problems with their battery packs and have had to replace battery modules an expensive process Installing replacement packs may also be time consuming and costly
bull Repair and maintenance costs of ICEVs appear to be declining Delucchi et al (2000 p 245) put EV repair and maintenance costs at approximately 70
percent of ICEV costs CARB (2000b p 108) uses 66 percent in its analysis We let the proportion vary from 65 to 70 percent The ICEV repair and maintenance cost we use for reference for the full-function EV is $006 per mile (as in Delucchi et al 2000 p 245 and CARB 2000b p 108) We reduce the repair and maintenance cost by 25 percent for the smaller ICEV used in the city EV incremental-cost calculation
Charger Installation We assume that the off-board charging equipment is included in the cost of the EV but that the off-board charger must be installed at the business or residence where the vehicle is charged Installation often requires significant extension or modification of the businessresidence electrical system and may require structural modifications There appears to be a great deal of variation across customers in charger installation costs Nissan reports an average cost (based on a fairly small number of installations) of $3000 for installation of a full-function EV charger inside the garage of a single-family home (Atkins et al 1999) CARB sets the cost of the charger plus installation at $1500 in 2003 and $750 in volume production Our analysis assumes installation costs range from $500 to $1500 between 2003 and 2007 Average installation costs in volume production should be lowermdashin part because some households and
-68-
businesses will already have installed the 220-volt line used by most full-function EV chargers We set installation costs at $500 for volume production
It appears that city EVs will likely be offered with a number of different charging options ranging from simply plugging the vehicle into a standard 110-volt outlet to using a rapid charging system that requires the same 220-volt 30-ampere outlets used by full-function EVs The 110-volt option requires no charger installation costs but it may take up to 8 hours to charge the 10-kWh battery The rapid-charge option will charge the battery very quickly but may require installation costs as high as those for full-function EVs We set charger installation costs to zero in our analysis The key requirement for any EV is that it be able to charge overnight and the city EV will be able to do so using a standard 110-volt circuit
Discount Rate The discount rate translates costs incurred in the future to present-day costs Because we are interested in the resource costs of advanced technology vehicles to society as a whole we set the discount rate to the social (as opposed to the private) discount rate20 The social discount rate is defined as the social opportunity cost of capital and is often based on the long-run risk-free (or low-risk) return on capital (Tietenberg 1992 p 88) Examples include the return on US Treasury bonds Estimates of the long-run risk-free return are typically 3 to 5 percent net of inflation
Parameters Used to Estimate Incremental Lifecycle Costs of DHFCVs Table 415 lists the parameters used to estimate the incremental lifecycle costs of a
DHFCV relative to an ICEV that meets the SULEV exhaust and near-zero evaporative emission exhaust standards The key parameters in the incremental operating costs are the DHFCVrsquos fuel economy in miles per kilogram of hydrogen and the cost of hydrogen in dollars per kilogram The Methanol Institute summarizes the findings of eight studies on the expected fuel economy of DHFCVs21 The efficiencies range from 55 to 106 miles per equivalent gallon of gasoline and the Methanol Institute uses 65 to 85 miles in its analysis The two measuresmdashmiles per equivalent gallon of gasoline and miles per kilogram of hydrogenmdashare very close and we use 65 to 85 miles per kilogram for our cost projections for 2006 to 2010 For high-volume lifecycle cost projections we set the efficiency at 85 miles per kilogram
Appendix D derives an estimate of the cost of hydrogen fuel We assume that hydrogen is sold at filling stations that generate hydrogen from natural gas piped to the site Assumptions on the cost of natural gas and the cost of the reformer that generates hydrogen ____________
20Consumers are thought to apply much higher discount rates when buying durable goods See for example Kavalec 1996 p 30
21See httpwwwmethanolorgfuelcellspecialcontadini_pg1html Tables 1 and 2
-69-
from natural gas result in hydrogen costs of $232 to $316 per kilogram between 2006 and 2010 The costs fall to $185 to $233 per kilogram for high-volume production of reformers To put these numbers in perspective $200 per kilogram corresponds to $0027 per mile in a vehicle that gets 75 miles per kilogram Fuel cost for a mid-size ICEV that
Table 415
Parameters Used to Calculate Lifetime Operating Costs of a DHFCV Relative to a Comparable ICEVa
Parameter 2006-2010 Volume Production Initial vehicle cost ($) 8300-15200 1200 - 3900 Vehicle efficiency
DHFCV (mikg of hydrogen) 65-85 85 ICEV (migal) 25-30 25-30
Fuel cost Gasoline ($gal) 056-149 056-149 Hydrogen ($kg) 232-316 185-233
Maintenance costs ($mi) DHFCV 006 006 ICEV 006 006
aThe comparable ICEV used in the calculations is mid-size meets the SULEV and near-zero evaporative emission standards and averages 25 to 30 miles per gallon
averages 275 miles per gallon when gasoline (net of taxes) is $100 per gallon is $0036 per mile
Little information is available on the maintenance costs of DHFCVs relative to ICEVs A DHFCVrsquos electric power train has fewer parts than an ICEVrsquos drivetrain and may be cheaper to maintain The reliability and maintenance costs of a PEM fuel cell however are uncertain Lacking better information we set the maintenance costs of DHFCVs equal to those for ICEVs
Parameters Used to Estimate Incremental Lifecycle Costs of GHEVs GHEVs may be cheaper to operate than standard ICEVs because of their higher gas
mileage Following CARB (2000b p 114) we set the efficiency of a four-passenger GHEV to 45 miles per gallon between 2003 and 2007 and assume that improvements in vehicle design will increase the fuel economy to 55 miles per gallon in volume production (see Table 416)22 These fuel economies are 50 and 57 percent greater respectively than the 30 and 35 miles per gallon that CARB (2000b p 115) assumes for a comparable ICEV
In its initial analysis of hybrid costs CARB concluded that hybrid maintenance costs may be higher than those of standard gasoline vehicles because hybrids contain both a conventional ____________
22CARBrsquos estimate of 45 miles per gallon is based on published fuel mileage figures for currently available hybrids
-70-
and an electric drive system CARB noted that little was known about hybrid operating costs however and ldquoin the absence of more specific informationrdquo set maintenance costs at $0075 per mile (CARB 2000b p 108) CARB later reexamined the maintenance costs of hybrids and
-71-
Table 416
Parameters Used to Calculate Incremental Lifecycle Cost of a GHEV Relative to a Comparable ICEVa
Parameter
2003-2007
High-Volume Production
Initial vehicle cost ($) (including first battery and off-board charger)
2300-3300 500-900
Vehicle efficiency (migal) GHEV(ATPZEV) 45 55 ICEV 30 35
Fuel costs ($gal) 056-149 056-149 Maintenance costs ($mi)
GHEV(ATPZEV) 006-078 006-065 ICEV 006 006
aThe comparable ICEV used in the calculations is mid-size meets the SULEV and near-zero evaporative standards and averages 30 miles per gallon between 2003 and 2007 and 35 miles per gallon when GHEVs are in volume production
concluded that incremental maintenance costs would be zero CARB noted that there may be some incremental maintenance costs associated with the battery or electric drive components (eg the 2002 Toyota Prius requires a coolant change for the electric power inverter at 34000 miles) but that there may be less brake wear due to regenerative braking (CARB 2001h p 167)
CARB never explicitly addresses the costs associated with maintaining and possibly replacing the battery in hybrids There is uncertainty over whether one battery will last the entire life of the vehicle As noted in Subsection 43 a recent report put the life expectancy of a NiMH hybrid battery at five to eight years Ford reports that the battery in its Escape hybrid will have to be replaced at least once during a 15-year vehicle life Honda implies that 15 years in service is beyond todayrsquos battery technology Toyota believes that scheduled replacement of the battery will not be required over a 15-year lifetime but that unscheduled maintenance is possible (CARB 2001h p 129)
This uncertainty drives us to develop a range for hybrid maintenance costs The lower end of the range is $006 per mile equal to the maintenance costs of standard ICEVs The upper end allows for the accumulation of enough money over the life of the vehicle to replace the battery once For 2003 to 2007 we take the upper estimate for the cost of the battery ($2000mdashsee Subsection 43) add 30 percent for indirect costs (see Subsection 46) and add $125 for installation (lower than the $500 assumed cost to replace the much larger full-function EV pack) The sum translates into $0018 per mile resulting in a maintenance cost range that runs from $006 to $007 per mile In high-volume production the pack costs $500 resulting in a range of $006 to $0065 per mile
-72-
Method for Calculating Incremental Lifecycle Costs We assume that each of the parameters is statistically independent and uniformly
distributed on its specified range We then randomly draw a value from each parameter range and use the resulting set of values to calculate the incremental lifetime operating cost and incremental lifecycle cost of each advanced technology vehicle relative to an ICEV We repeat this process 10000 times and report the 5th and 95th percentiles of the distribution Given assumptions on the distributions of the parameters if we repeated the process for constructing the interval over and over this interval would contain the true incremental cost 90 percent of the time We chose to repeat the process 10000 times because the distribution is stable to two significant digits with this number
Findings on Incremental Lifecycle Costs Results of our analysis of incremental lifetime operating and lifecycle costs are reported in
Table 417 The second and third columns show our findings on the incremental lifetime operating cost in the near term and in volume production respectively The fourth and fifth columns add in the incremental initial cost of the vehicle and show the incremental lifecycle cost The brackets in each cell contain the 90 percent probability interval for the estimate
Full-Function EVs During the first five years of the program the lifetime operating cost of full-function EVs with NiMH batteries may be higher or lower than that of an ICEV meeting the SULEV exhaust and near-zero evaporative emission standards As can be seen in the second column of Table 417 the 90 percent probability interval runs from -$1600 to $4000 Once the high incremental production cost for these vehicles is included the incremental lifecycle cost ranges from $17300 to $27800 Our analysis suggests that even in volume production the lifecycle cost of full-function EVs with NiMH batteries will remain substantially above that for ICEVs The incremental cost estimates range from $3100 to $8700
PbA batteries are cheaper than NiMH batteries but their short cycle life means that the lifetime operating cost will likely be somewhat greater for full-function EVs with PbA batteries than for their NiMH-powered counterparts Incremental lifecycle cost is a good deal lower however because the initial vehicle is cheaper Between 2003 and 2007 there will still be a substantial lifecycle cost premium for full-function EVs powered with PbA batteries ($9000 to $18400) Incremental lifecycle cost may be small in volume production ($200) but there is an equally good chance that incremental lifecycle cost will remain substantial (the upper end of the 90 percent probability interval is $5100) Thus even with PbA batteries the lifecycle cost of full-function EVs is likely to exceed that of ICEVs What is more questions remain about whether PbA batteries are feasible for full-function EVs that have a range of roughly 100 miles
-73-
Table 417
Incremental Lifetime Operating and Lifecycle Costs of Advanced Technology Vehicles (incremental over a vehicle meeting SULEV and near-zero evaporative emission standards)
($1000s per vehicle 90 percent probability intervals in brackets)a
Incremental Lifetime Operating Cost Incremental Lifecycle Cost Vehicle Technology
Near Term
High-Volume Production
Near Term
High-Volume Production
2003-2007 2003-2007 Full-function EV
NiMH [-16 40] [-31 10] [173 278] [31 87] PbA [-11 52] [-25 51] [90 184] [02 51]
City EV NiMH [-13 05] [-16 -03] [81 129] [05 24] PbA [-11 10] [-13 -01] [51 99] [-04 12]
GHEV [-14 08] [-15 03] [13 37] [-09 04] PZEV 0 0 [006 023] [006 023] 2006-2010 2006-2010 DHFCV [-21 20] [-34 03] [78 156] [-13 34] aDiscounted to the time of vehicle sale using a 4 percent discount rate
since the size and weight of these batteries make it difficult to design such a vehicle with acceptable space and handling
City EVs Mainly because of their smaller battery packs city EVs have a much lower incremental lifecycle cost than full-function EVs do Between 2003 and 2007 the operating cost of a city EV with either PbA or NiMH batteries may be above or below that of a small ICEV Substantial incremental vehicle production cost between 2003 and 2007 still means however that incremental lifecycle cost for a city EV remains sizable with either type of battery
For high-volume production our analysis predicts that if battery cycle life reaches the most optimistic expectations and vehicle efficiencies improve somewhat the lifecycle cost of a city EV with PbA batteries could be comparable to that of a small ICEV As shown in Table 417 the 90 percent probability interval ranges from -$400 to $1200 Again however note that manufacturers are choosing to use NiMH batteries and NiCd batteries in their city EVs despite the higher costs which suggests that PbA batteries do not work well in a city EV design
GHEVs The cost of servicing and possibly replacing the battery in a GHEV more than offsets the savings due to this vehiclersquos higher gas mileage Our estimates of incremental lifetime operating cost range from -$1400 to $800 per vehicle for vehicles produced between 2003 and 2007 and from -$1500 to $300 in high-volume production Once the incremental cost of the vehicle is added in the hybridrsquos lifecycle cost is $1300 to $3700 greater than that of a standard ICEV between 2003 and 2007 Incremental lifecycle cost runs from -$900 to $400 in volume production
-74-
PZEVs The greater incremental lifecycle cost of a PZEV relative to an ICEV that meets the SULEV exhaust and near-zero evaporative emission standards is due only to the increased initial cost of a PZEV Our estimates range from $60 to $235 from 2003 on
DHFCVs Given our assumptions on the cost of hydrogen fuel fuel efficiency and vehicle maintenance the lifetime operating cost of a DHFCV may be several thousand dollars less than that of an ICEV The midpoint of the estimate for incremental operating cost between 2006 and 2010 is near zero although there is enough uncertainty in the parameters that the upper end of the 90 percent probability interval reaches $2000 Very high initial vehicle cost means that the incremental lifecycle cost of DHFCVs remains high through 2010 Plausible improvements in fuel-cell technology and reductions in the cost of providing hydrogen fuel may ultimately reduce the lifecycle cost for this vehicle to below that for an ICEV (the lower end of the probability interval is -$1300) However this is by no means guaranteed The upper end of the interval is $3400
- 4 VEHICLE PRODUCTION AND LIFECYCLE COST
-
- 41 KEY VEHICLE COMPONENTS
-
- Battery-Powered Electric Vehicles
- Direct Hydrogen Fuel-Cell Vehicles
-
- Table 41
-
- Specifications of BPEVs
-
- Full-Function EVs
-
- ~8
- DC permanent magnet
-
- Figure 41mdashSingle PEM Fuel Cell
-
- Table 42
-
- Specifications of Prototype DHFCVs
-
- Gasoline Hybrid Electric Vehicles
- Gasoline Partial Zero Emission Vehicles
-
- Table 43
-
- Specifications of Typical GHEVs
-
- 97
- 086
-
- 42 OVERVIEW OF FACTORS THAT CAUSE COSTS TO DECLINE
-
- Production Scale Economies
- Learning
- Technological Advances
- How Cost Reduction Factors Enter Our Analysis
-
- 43 COMPONENT COSTS OF BATTERY-POWERED ELECTRIC VEHICLES AND GASOLINE HYBRID ELECTRIC VEHICLES
-
- Battery Modules and Auxiliaries
-
- Figure 42mdashNiMH Module Cost as a Function of Prod
- Figure 43mdashPbA Module Cost as a Function of Produ
-
- Table 44
-
- EV Battery Module Costs($ per kWh)
-
- Table 45
-
- EV Battery Auxiliary Costs($ per kWh)
-
- Motors and Controllers
-
- Figure 44mdashDC Motor Cost as a Function of Product
-
- Table 46
-
- Estimate of High-Volume Costs for 53-kW DC Motor 67-kW AC Motor and 70-kW DC and AC Motor Controllers($)
-
- Motor
- Motor Controller
-
- Figure 45mdashCombined Cost of 50-kW Motor and Motor
-
- Table 47
-
- Motor and Motor Controller Costs for Full-Function EVs and City EVs ($ per motor and controller)
-
- EV Transmission and Other EV Auxiliaries
- Integrated Charger
- Savings From Exclusion of Internal Combustion Engine Vehicle Components
-
- Table 48
-
- Breakdown of Current and Potential Power Needs of an ICEV
-
- 44 COMPONENT COSTS OF DIRECT HYDROGEN FUEL-CELL VEHICLES
-
- Overview of Recent Studies on PEM Fuel-Cell Systems
-
- Table 49
-
- Summary of Studies on Fuel-Cell Costs
-
- MR1578_ch4B_Finalpdf
-
- Figure 46mdashPEM Fuel-Cell System Costs as a Functi
- Fuel-Cell Components
-
- Table 410
-
- Platinum Loading in Membrane Electrode Assembly
-
- Hydrogen Tank for a Fuel-Cell Vehicle
- 45 PZEV COSTS
-
- Figure 47mdashCost of Tank That Stores 4 kg of Hydro
-
- 46 INCREMENTAL VEHICLE PRODUCTION COSTS
-
- Multipliers Used to Calculate Indirect Costs
- Incremental Vehicle Production Costs
-
- Table 411
-
- Breakdown of Manufacturerrsquos Suggested Retail Pric
-
- Table 412
-
- Incremental Vehicle Production Costs (relative to an ICEV meeting SULEV exhaust and near-zero evaporative emission standards) (estimated ranges in brackets $1000s per vehicle)
-
- NiMH
- City EV
- NiMH
-
- 47 INCREMENTAL LIFECYCLE COSTS
-
- Parameters Used to Estimate Incremental Lifecycle Costs of Full-Function and City EVs
-
- Table 413
-
- Parameters Used to Calculate Lifetime Operating Cost of a Full-Function EV Relative to a Comparable ICEVa
-
- Initial Vehicle Cost ($) (including first battery and off-board charger)
- Vehicle Life
- Parameters Affecting Battery Replacement Cost
- Parameters Affecting Fuel Costs
- Discount Rate ()
-
- Table 414
-
- Parameters Used to Calculate Lifetime Operating Cost of a City EV Relative to a Comparable ICEVa
-
- Initial Vehicle Cost ($) (including first battery and off-board charger)
- Vehicle Life
- Parameters Affecting Battery Cost
- Parameters Affecting Fuel Costs
- Other Costs
- Discount Rate ()
-
- Parameters Used to Estimate Incremental Lifecycle Costs of DHFCVs
-
- Table 415
-
- Parameters Used to Calculate Lifetime Operating Costs of a DHFCV Relative to a Comparable ICEVa
-
- Initial vehicle cost ($)
-
- Parameters Used to Estimate Incremental Lifecycle Costs of GHEVs
-
- Table 416
-
- Parameters Used to Calculate Incremental Lifecycle Cost of a GHEV Relative to a Comparable ICEVa
-
- Initial vehicle cost ($) (including first battery and off-board charger)
-
- Method for Calculating Incremental Lifecycle Costs
- Findings on Incremental Lifecycle Costs
-
- Table 417
-
- Incremental Lifetime Operating and Lifecycle Costs of Advanced Technology Vehicles (incremental over a vehicle meeting SULEV and near-zero evaporative emission standards) ($1000s per vehicle 90 percent probability intervals in brackets)a
-
- NiMH
- City EV
- NiMH
-
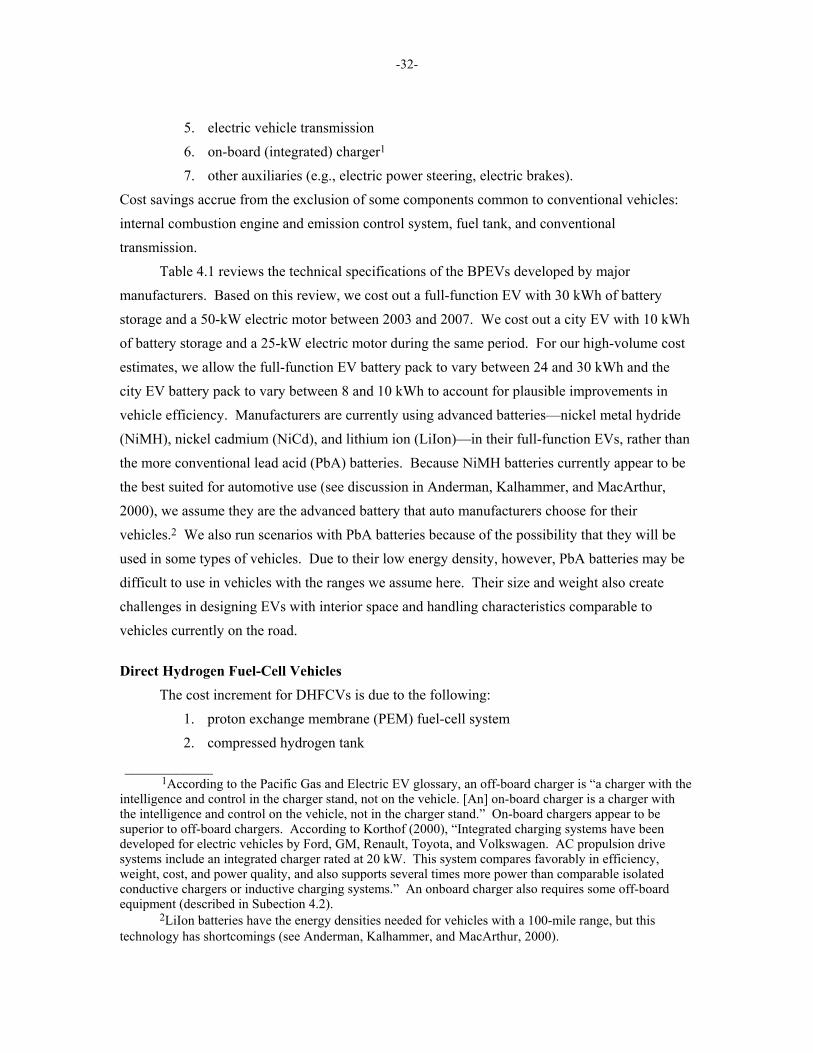
-32-
5 electric vehicle transmission 6 on-board (integrated) charger1 7 other auxiliaries (eg electric power steering electric brakes)
Cost savings accrue from the exclusion of some components common to conventional vehicles internal combustion engine and emission control system fuel tank and conventional transmission
Table 41 reviews the technical specifications of the BPEVs developed by major manufacturers Based on this review we cost out a full-function EV with 30 kWh of battery storage and a 50-kW electric motor between 2003 and 2007 We cost out a city EV with 10 kWh of battery storage and a 25-kW electric motor during the same period For our high-volume cost estimates we allow the full-function EV battery pack to vary between 24 and 30 kWh and the city EV battery pack to vary between 8 and 10 kWh to account for plausible improvements in vehicle efficiency Manufacturers are currently using advanced batteriesmdashnickel metal hydride (NiMH) nickel cadmium (NiCd) and lithium ion (LiIon)mdashin their full-function EVs rather than the more conventional lead acid (PbA) batteries Because NiMH batteries currently appear to be the best suited for automotive use (see discussion in Anderman Kalhammer and MacArthur 2000) we assume they are the advanced battery that auto manufacturers choose for their vehicles2 We also run scenarios with PbA batteries because of the possibility that they will be used in some types of vehicles Due to their low energy density however PbA batteries may be difficult to use in vehicles with the ranges we assume here Their size and weight also create challenges in designing EVs with interior space and handling characteristics comparable to vehicles currently on the road
Direct Hydrogen Fuel-Cell Vehicles The cost increment for DHFCVs is due to the following
1 proton exchange membrane (PEM) fuel-cell system 2 compressed hydrogen tank
____________ 1According to the Pacific Gas and Electric EV glossary an off-board charger is ldquoa charger with the
intelligence and control in the charger stand not on the vehicle [An] on-board charger is a charger with the intelligence and control on the vehicle not in the charger standrdquo On-board chargers appear to be superior to off-board chargers According to Korthof (2000) ldquoIntegrated charging systems have been developed for electric vehicles by Ford GM Renault Toyota and Volkswagen AC propulsion drive systems include an integrated charger rated at 20 kW This system compares favorably in efficiency weight cost and power quality and also supports several times more power than comparable isolated conductive chargers or inductive charging systemsrdquo An onboard charger also requires some off-board equipment (described in Subection 42)
2LiIon batteries have the energy densities needed for vehicles with a 100-mile range but this technology has shortcomings (see Anderman Kalhammer and MacArthur 2000)
-33-
Table 41
Specifications of BPEVs
Vehicle
Peak Power (kW)
Energy Storage (kWh)
Battery Type
Rangea (miles)
Electric
Motor Type Full-Function EVs
Toyota RAV4-EV 50 27 NiMH 8478 DC permanent magnet
Nissan Altra EV 62 32 LiIon 9582 AC
Vehicle modeled in this study 50 24-30 NiMH amp PbA
90-110 AC
City EVs
Toyota ecom 19 ~8 NiMH 60 DC permanent magnet
Ford Thnk City 27 12 NiCd 60 AC
Vehicle modeled in this study 25 8-10 NiMH amp PbA
50-60 AC
aNumbers separated by a slash show city range with accessories followed by highway range with accessories (see Table A1 in Appendix A)
3 small (GHEV-sized) battery pack (or other energy storage device) 4 electric motor and transmission 5 power electronics
Cost savings result from the exclusion of the engine emissions control system transmission and fuel tank found in an ICEV
The PEM system is in turn made up of the fuel-cell stack and auxiliary equipment associated with the stack The auxiliary equipment manages the air water and thermal issues related to the system and includes compressors heat exchangers a humidification system safety devices and a control system (Lipman 1999b p 12) The fuel-cell stack is made up of the following components
1 membrane electrode assembly (MEA) a cathode b anode c electrolytemembrane d cathode and anode catalyst (platinum) and
2 bipolar (separator) plates A fuel-cell stack consists of many fuel cells The structure of a single fuel cell is illustrated in Figure 41
-34-
SOURCE Chalk 2002
Figure 41mdashSingle PEM Fuel Cell
Ballard Power Systems Incorporated a leader in the development of PEM fuel cells describes the key components and principles of operation of a fuel cell as follows
A single fuel cell consists of a membrane electrode assembly and two flow field [bipolar] plates Single cells are combined into a fuel cell stack to produce the desired level of electrical power Each membrane electrode assembly consists of two electrodes (anode and cathode) with a thin layer of catalyst bonded to either side of a proton exchange membrane (PEM) Gases (hydrogen and air) are supplied to the electrodes on either side of the PEM through channels formed in the flow field [bipolar] plates Hydrogen flows through the channels to the anode where the platinum catalyst promotes its separation into protons and electrons On the opposite side of the PEM air flows through the channels to the cathode where oxygen in the air attracts the hydrogen protons through the PEM The electrons are captured as useful electricity through an external circuit and combine with the protons and oxygen to produce water vapor on the cathode side (Ballard 2002)
The feasibility of compressed hydrogen fuel tanks has been shown in a number of prototype vehicles Table 42 lists the specifications of some of the prototype DHFCVs that have been produced by various automakers Manufacturers are experimenting with different energy storage devices and different balances between battery and fuel-cell size Some are using NiMH
-35-
batteries to store energy and provide power others are using supercapacitors Some designs have a large fuel cell (over 60 kW) and a modest battery (25 kW) others have the reverse For our
Table 42
Specifications of Prototype DHFCVs
MakeModel
Capacity and Pressure of Hydrogen Tank
Top Speed (mph)
Range (miles)
Power Plant (kW)
Battery Power (kW)
Electric Motor
Type and Power (kW)
Honda 5000 psi 130-liter tank 87 185+ 78 ns 60 kW AC Toyota
Highlander FCHV-4
3700 psi 95 155 90 ns 80 kW DC
Ford Focus FCV 5000 psi two 41-liter tanks 80 155 80 ns 67 kW AC Hyundai
Santa Fe FCEV 5000 psi 77 100+ 75 ns 65 kW
Vehicle modeled in this study Option 1 5000 psi ns 150+ 25 60 75 kW Option 2 5000 psi ns 150+ 60 25 75 kW
NOTE ns = not specified
near-term projections we assume a 25-kW fuel cell because high fuel-cell costs in the near term suggest that it will be cheaper to keep the fuel cell small For volume production we examine the costs of both vehicles with relatively large and relatively small fuel cells (see options 1 and 2 in Table 42) Range should be over 150 miles with the fuel tank we specify in our analysis
Gasoline Hybrid Electric Vehicles The cost increment associated with a GHEV comes from the addition of the following
components 1 small battery pack 2 electric motor 3 power electronics (eg motor controller)
Cost savings over a conventional ICEV result from the smaller internal combustion engine needed to power a GHEV
Table 43 lists the specifications of GHEVs that have been introduced in the United States or are scheduled to be introduced in the near future Based on these figures we cost out a GHEV with an NiMH battery producing 25 kW of power an electric motor of 33 kW and an internal combustion engine that is 33 kW smaller than it would need to be in a conventional ICEV
Gasoline Partial Zero Emission Vehicles A gasoline PZEV must meet very stringent emission durability and warranty standards
The vehicles must be certified to CARBrsquos
-36-
bull 150000-mile super ultra low emission vehicle (SULEV) exhaust emission standard for light-duty vehicles (LDVs)
Table 43
Specifications of Typical GHEVs
Model
ICE Peak Motor Power (kW)
Battery Type
Battery Power (kW)
Energy Storage (kWh)
Electric Motor
Honda Insight 50 NiMH ~20 094 10 kW DC permanent magnet
Honda Civic GHEV
63 NiMH 97 086 10 kW DC permanent magnet
Toyota Prius 52 NiMH 25 14 33 kW DC permanent magnet
Vehicle modeled in this study
52 NiMH 25 not specified
33 kW DC permanent magnet
NOTE ICE = internal combustion engine
bull zero evaporative emission standard and bull on-board diagnostics (OBD) system requirements The OBD system must be able
to detect emissions that exceed the standards even very slightly In addition the vehicle warranty on emission control equipment must be extended to 15
years or 150000 miles whichever occurs first As is discussed in Subsection 44 major progress has been made in designing vehicles that
meet PZEV standards The required emission control system is similar to that in vehicles on the road today
42 OVERVIEW OF FACTORS THAT CAUSE COSTS TO DECLINE Before examining the costs of vehicle components it is useful to review the various factors
that cause costs to fall Economists and engineers generally agree that three factors or processes can lead to reductions in unit component cost production scale economies learning and technological advances
Production Scale Economies Higher rates of production per period usually cause the unit cost of production to drop
They can mean discounts on bulk purchases of input materials and components and more efficient
-37-
usage of machinery and labor They can also justify the increased use of automated manufacturing equipment which can further reduce unit costs In addition higher production volumes can justify changes in product designs that reduce production costs For example it may not be cost-effective to design application-specific integrated circuits until production volumes are high
Predictions of the cost savings due to scale economies are based on what is known about the product design and technological improvements that can be incorporated at high production volumes They are also based on what is known about the manufacturing processes possible at high volumes
Learning Costs may drop over time as learning-by-doing improves the efficiency of the
manufacturing process These reductions are in addition to those solely caused by an increase in production volume Refinements or wholesale changes in the production process may be discovered based on accumulated production experience For example production experience may lead to a better way to combine the various steps of the production process or to a more efficient mix of capital and labor
Technological Advances Improvements in the technical design of a component can reduce its unit cost For
example advances that allow reductions in the amount of nickel per kilowatt-hour storage capacity will reduce NiMH battery costs
In our analysis of costs we restrict our attention to component designs that appear feasible given what is known about the technology While a specific design does not need to currently exist there should be a clear path to it that appears feasible Technology breakthroughs that cannot currently be foreseen may indeed happen in the future but it does not make sense to base policy decisions on the presumption that they will
How Cost Reduction Factors Enter Our Analysis We carefully consider the effects of production scale on our estimates and the high-
volume estimates are based on knowledge about the types of production processes that are feasible at high volumes for the products considered Manufacturing experience may result in additional cost reductions and experience in many settings suggests that costs do fall substantially with manufacturing experience But this is not guaranteed It could be that the manufacturing process envisioned when developing the high-volume estimate does not work out as well as conceived Component costs thus may indeed fall below those currently predicted at
-38-
high production volume but it is also possible that even with additional manufacturing experience unanticipated problems may mean that the high-volume predictions are not realized
In the analysis below we provide some evaluation of the opportunities for additional cost reductions through learning Generally we believe that the high-volume cost estimates in the studies we reviewed have squeezed costs down about as far as possible given the material requirements of the product Thus we think it unlikely that costs will fall below the high-volume cost estimates here absent technological advances that currently cannot be foreseen
Our analysis combines estimates of the relation between production volume and cost and expected production volume between 2003 and 2007 to predict component costs during the first five years of the program We think it likely that these cost projections are reasonably realistic for what will be observed in the near term We then predict costs at high production volumes Forecasting technological advances is very difficult beyond 10 years or so We thus think it appropriate to interpret our high-volume cost estimates as the lowest costs that can be expected over the next 10 years or so given what is currently known about advanced vehicle technologies and manufacturing processes
43 COMPONENT COSTS OF BATTERY-POWERED ELECTRIC VEHICLES AND GASOLINE HYBRID ELECTRIC VEHICLES
This subsection synthesizes the results of existing studies to estimate the costs of the components in BPEVs and GHEVs Subsequent subsections address the costs of DHFCV and PZEV components
Battery Modules and Auxiliaries NiMH Battery Modules CARBrsquos Battery Technology Advisory Panel (BTAP) assessed
the cost performance and availability of batteries for EVs and issued a report in 2000 (Anderman Kalhammer and MacArthur 2000) It based its analysis on data from battery manufacturers automakers existing research reports and its own analysis It concluded
From the cost projections of manufacturers and some carmakers battery module specific costs of at least $350kWh $300kWh and $225-250kWh can be estimated for production volumes of about 10k 20k and 100k battery packs per year respectively To the module costs at least $1200 per battery pack (perhaps half of that sum in true mass production) has to be added for the other major components of a complete EV-battery which include the required electrical and thermal management systems (Anderman Kalhammer and MacArthur 2000 p v)
The Panel assumed only incremental technological improvements (p vi) so it based its projections on what is known about the technology today The declines in unit cost with production volume are due to ldquoeconomies of scale that result from discounts on bulk purchases of
-39-
materials and components higher efficiencies in the use of labor and equipment and especially use of custom-designed automated manufacturing equipment with high production rates and product yieldsrdquo (p 23) The Panel believes that further reductions in module costs below $225 to $250 per kilowatt-hour are possible with sustained production on a true mass production scale (100000 or more battery packs per year)3 These reductions would be due to additional automation incremental improvements in battery design and process technology refinement based on accumulated production experience The Panel did not predict how low costs could go but it concluded that reductions in costs below $225 to $250 per kilowatt-hour would be possible only if material costs declined significantly (p 24)4 We thus conclude that additional learning by experience will produce only limited cost savings given what is currently known about the physics of battery development
Figure 42 displays a curve fit to approximate the BTAP estimates Data presented by Panasonic EV at the 1999 UC Davis conference are also included in the figure In our analysis of EV costs at high production volumes we allow NiMH module costs to vary between $225 and $250 per kilowatt-hour
Lead Acid Battery Modules The BTAP cites a range of $100 to $150 per kilowatt-hour for the production costs of lead acid (PbA) batteries at volumes of 10000 to 25000 packs per year (Anderman Kalhammer and MacArthur 2000 p iv) Lipman (1999b) estimates that PbA battery costs are between $107 and $113 per kilowatt-hour for high volumes (gt100000 full-function battery packs per year) Data provided to AC Propulsion and CARB by a major EV battery manufacturer (the name is not publicly available) also provide a half-dozen data points We used these data to fit a relationship between cost and production volume (see Figure 43 where the data represent the cost of a 60-Ah battery module)
In the early years of the ZEV program manufacturers may produce 5000 or fewer full-function EVs If the entire 5000 full-function EVs were produced with PbA batteries annual battery production would be 150000 kWh The resulting battery cost from Figure 43 would be roughly $150 per kilowatt-hour Figure 43 suggests that $100 per kilowatt-hour is a plausible high-volume cost for PbA battery modules
Table 44 gives battery costs for two production scenarios between 2003 and 2007 and for high-volume production The high full-function EV scenario (2003-2007) accounts for an average annual production of 16600 vehicles between 2003 and 2007 the low full-function EV ____________
3Note that there are multiple battery modules in a battery pack 4The Panel concluded that major advances or breakthroughs that could reduce battery costs were
unlikely for the next six to eight yearsmdashthat is through 2006 or 2008 (Anderman Kalhammer and MacArthur 2000 p vi)
-40-
BTAP estimatesPanasonic EV estimates
600
200
300
400
500
100
$ pe
r kW
h
0 15 30 45 60 75 90 105
kWh per year (millions)
Figure 42mdashNiMH Module Cost as a Function of Production Quantity
0
50
100
150
200
250
300
350
400
0 100000 200000 300000 400000 500000 600000 700000 800000
$ pe
r kW
h
kWh per year
Estimates from a major battery manufacturer
Lipman (1999b) estimates
BTAP estimates
Figure 43mdashPbA Module Cost as a Function of Production Quantity
-41-
Table 44
EV Battery Module Costs ($ per kWh)
Battery Type
High Full-Function
EV Scenario 2003-2007
Low Full-Function EV
Scenario 2003-2007
Cost in High-
Volume Production
PbA 103 174 100
NiMH 356 465 225-250
scenario accounts for an average annual production of 4700 vehicles (see scenarios 1 and 2 in Section 3)
NiMH Batteries for GHEVs Batteries for GHEVs require a higher power density than those for full-function EVs and city EVs Consequently these batteries are costed as a function of power NiMH GHEV batteries provide approximately four times the power density of NiMH EV batteries (Current designs from Sanyo and Ovonic claim to achieve a power density of 1000 watts per kilogram of battery weight) According to a recent report the cost to auto manufacturers is $500 to $2000 per GHEV battery pack with a life expectancy of five to eight years (PRNewswire 2001) Given the power ratings on the current fleet of GHEVs that equates to roughly a range of $20 to $80 per kilowatt Lipman Delucchi and Friedman (2000) develop a range of $22 to $31 per kilowatt with future manufacturing experience taken into account We use $20 per kilowatt as a high-volume cost for a NiMH GHEV battery
Battery Auxiliaries Battery auxiliaries must be added to the battery modules to create a complete pack They include (1) a battery tray and straps (2) an electrical wire harness (3) bus bars and terminals and perhaps (4) a coolingventilation system Delucchi et al (2000) provide information on the cost of battery auxiliaries Based on this study we put the costs of auxiliaries at $14 to $19 per kilowatt-hour for a PbA battery pack and $8 to $11 per kilowatt-hour for a NiMH pack between 2003 and 2007 As quoted above the BTAP puts the cost for a 30-kWh full-function EV pack at $1200 but believes that this figure could be halved in high-volume production We therefore interpret the Panel estimates to be between $600 and $1200 depending on production volume equivalent to $20 to $40 per kilowatt-hour of pack storage capacity We combine these findings to estimate the costs of battery auxiliaries as $8 to $40 per kilowatt-hour for NiMH packs and $14 to $19 for PbA packs these estimates hold for the different types of EVs that may be used to satisfy ZEV program requirements The lower ends of the ranges are used to develop high-volume cost increments for the entire EV (see Table 45) While not insignificant the costs of battery auxiliaries are much less than the costs of battery modules
-42-
Table 45
EV Battery Auxiliary Costs ($ per kWh)
Type
2003-2007
Volume Production
PbA auxiliaries 14-19 14
NiMH auxiliaries 8-40 8
Motors and Controllers Two types of motors and motor controllers are used by major original equipment
manufacturers (OEMs) for BPEVs AC and DC motormotor controllers It is accepted in the literature that motor costs are a function of peak power requirements but that motor controller costs are not as closely tied to the motorrsquos peak power Generally AC motors are less expensive than DC motors but the opposite holds for motor controllers (since DC controllers require fewer power switching modules)
Our estimates of motor and motor controller costs as well as the estimates discussed below for EV transmission costs are largely based on the work of Lipman (1999a) and Lipman Delucchi and Friedman (2000) A brief description of the methods used in these analyses is warranted
Lipman estimates component costs for different production volumes by estimating parameters for material costs costs of adding values to materials (eg labor and equipment costs) and manufacturer profit (Lipman 1999a p 44) The parameters are estimated in part using data provided by component manufacturers His estimates are also based on work done at Argonnne National Laboratory (ANL) ANL has extensively analyzed the relationships among material labor costs production equipment and other costs in conventional vehicles produced at high volumes and Lipman uses these multipliers to help estimate EV component costs at high volumes He develops high central and low estimates of cost at each production volume which in the case of motor controllers reflect ldquodifferent assumptions about the degree to which costs of key motor controller components will be reduced by production volumerdquo (Lipman 1999a p 44) We use Lipmanrsquos central cost estimates He estimates production costs for 2000 20000 and 200000 units per year We use curves fit to these data to predict costs between 2003 and 2007 For high-volume production we use the equations to predict costs when annual production volume is 500000 units
Lipmanrsquos estimates clearly capture technological scale effects and his projections start with detailed descriptions of the parts and costs of current technologies Thus his cost estimates appear to be based on technological improvements that are reasonably likely His high-volume
-43-
cost projections consider ratios between materials cost overhead and other costs that are based on volume production of conventional vehicles Thus he is incorporating reductions in manufacturing costs that can be expected with increased volume based on past experience Additional cost reductions may be possible as manufacturers gain experience with the production process On the whole however Lipmanrsquos description of his approach suggests to us that his analysis contains enough optimistic assumptions that make it unlikely that learning will cause costs to fall beyond our high-volume cost estimates for the next 10 years or so absent unanticipated technological improvements5
AC Induction Motor and Controller Following Lipman Delucchi and Friedman (2000) we assume that the cost of AC induction motors is not sensitive to further increases in production volume and is $1080 per kilowatt-hour of rated peak power from 2003 to 2007 Lipman argues that existing production of AC motors is large enough that cost is steady across production volumes The tooling for these motors is in place and they are produced on flexible-flow production lines (Lipman 1999a p 45)
We follow Delucchi et al (2000) who cite the data from Lipman and SatCon Technology Corporation in developing costs for AC controllers for several production quantities The cost estimates when production volume is 200000 units a year are based on data from SatCon SatCon has recently received funding from the Department of Energy to develop EV motor and controller components SatCon seeks to reduce controller manufacturing costs by selecting low-cost material integrating subsystems to reduce parts counts and utilizing low-cost production techniques (Lipman 1999a p 43) SatConrsquos projections at 10000 to 200000 units per year represent substantial cost reductions over costs today (from costs over $3300 today to $500 to $700 for a 50-kW-peak motor) In principle additional cost reductions are possible with manufacturing experience but it seems likely that in developing its cost targets SatCon has squeezed margins above material costs very hard
Delucchi et al (2000) include a cost component that is a function of power rating and a component that reflects internal elements of the controller that are not necessarily cost-sensitive to the power rating but are cost-sensitive to production volume increases Based on these data we fit the following equation for AC controller costs
$710 to $900 per kWmotor-peak + y where y = 149255x-051 and x is the annual unit production volume
____________ 5For example his central-cost projections for controllers are based primarily on target data for
costs from SatCon Technology Corporation (Lipman 1999a p 47)
-44-
DC Permanent Magnet Motor and Controller Lipman Delucchi and Friedman (2000) surveyed the literature on DC permanent magnet motors (including Cuenca Gaines and Vyas 1999) and determined costs on the basis of both peak kilowatt rating and production volume His estimates run from $1251 to $2969 per peak kilowatt depending on production volume not including additional power-invariant costs Lipman adds $779 for production volumes as low as 2000 per year and $88 for production volumes around 20000 per year6 His estimates are shown in Figure 44 for three different production volumes we can interpolate for production quantities between these levels
The material costs used in Lipmanrsquos estimates of DC permanent magnet motors are generally based on Cuenca Gaines and Vyasrsquos analyses (Lipman 1999a p 45) Cuenca and his colleagues at ANL have developed detailed material costs and high-volume manufacturing costs for permanent magnet motors At high volume material costs account for 60 to 70 percent of overall component cost per unit (Lipman 1999a p 75) Thus absent technological changes in the design there is not much room for reductions in manufacturing costs through manufacturing experience
Our estimates for DC permanent magnet controller costs are drawn from the same sources as the AC controller costs discussed above The resulting equation is
$480 to $690 per kWmotor-peak + y where y = 162123x-053 and x is the annual unit production volume
Motor and Controller Costs Used in Our Analysis For 2003 to 2007 we combine the above equations with estimates of production volume from Subsection 32 to predict motor and controller costs
Cuenca Gaines and Vyas (1999) provide a starting point for estimates of high-volume production costs As shown in Table 46 the materials in their DC system (ie motor and controller) cost $1190 to $1360 and the materials in the AC system run from $1316 to $1516 for the size of the motor indicated For the 50-kW motor used in our analysis these estimates translate to between roughly $1200 and $1500 for the motor and controller costs combined Since these estimates were made the costs and sizes of motor controller parts have declined GM reported in 1999 that it had cut the cost of its EV1 drivetrain (motor and motor controller) in half reduced its size by half and cut the number of parts by one-third as part of its ldquoGeneration IIrdquo design At one point GMrsquos Advanced Technology Vehicle center was working on ldquoGeneration
____________ 6These power-invariant costs can be approximated with the function 687000x-090 where x is the
annual production volume
-45-
0
10
20
30
40
50
60
25 45 65 85 105 125
$ pe
r kW
kW of peak power
2000 units per year
20000 units per year
200000 units per year
SOURCE Based on Lipman Delucchi and Friedman 2000
Figure 44mdashDC Motor Cost as a Function of Production Quantity
IIIrdquo drive components that were to be half again the cost of the Generation II components (EV World 1999) CARB notes that for the GM Precept equipped with Generation III drivetrain components a key component of the power inverter (motor controller) module is one-sixth the size of the one used in the EV1 Honda has published similar statements in regard to electric motors and controllers Therefore it seems likely that the material costs in Cuenca Gaines and Vyas 1999 are high given the technological improvements that have already occurred since their study
We extrapolate from the relationships between production volume and cost above to predict motor and controller costs at high volume The relationship between combined motor and controller costs and production volume for a 50-kW motor is presented in Figure 45 The combined cost at 500000 units lies between $725 and $1200 (compared to $1200 to $1500 in Cuenca Gaines and Vyas 1999) We use this range in our high-volume production scenarios As a city EV system is rated at half the power of a full-function EV system we use a figure that is roughly half these estimates for the city EV motor and controller in high-volume production The motor in the DHFCV that we cost out is rated at 75 kW We thus increase the range estimated for a 50-kW system by 50 percent The resulting range is $1100 to $1800
-46-
Table 46 Estimate of High-Volume Costs for 53-kW DC Motor 67-kW AC Motor
and 70-kW DC and AC Motor Controllers ($)
Cost Driver DC System AC System Motor
Magnets 175 0 Other materials 215 291 Assembly and test 97-167 125-194 Total mfg cost 487-557 416-485 Gross margin (at 20) 97-111 82-97 Total cost 584-668 498-582 Cost per kW 11-126 74-87
Motor Controller Switching modules 200-300 400-600 Other components 500 500 Assembly costs 100 100 Total mfg cost 800-900 1000-1200 Supplier margin (at 20) 160-180 200-240 Total OEM cost range 960-1080 1200-1440 Cost per kW 137-154 171-206
Total Motor and Controller ($kW) 247-280 245-293 SOURCE Cuenca Gaines and Vyas 1999
Summary of Motor and Controller Costs for BPEVs Table 47 summarizes our estimates of the average motor and motor controller costs The second column predicts costs between 2003 and 2007 for the high-volume scenarios (see Section 3) the third column predicts cost for the same period for the low-volume scenarios The final column lists high-volume production costs
Learning through manufacturing experience could conceivably reduce costs below the volume production costs listed here However we have been aggressive about continuing to reduce costs as volume increases (production scale economies) and thus think it unlikely that learning will reduce costs further over the next 10 years or so given what is known about the technology and manufacturing processes
Motor and Controller Costs for GHEVs Energy and Environmental Analysis estimates the volume production costs for the Toyota Prius (Duleep 1998) It put the motor controller at $704 and its 33-kW electric motor at $147 Accordingly we use the sum ($851) as our upper bound for high-volume cost for a GHEV motor and motor controller GHEV motor and controller costs should not exceed those for a full-function EV in the long run We thus set the lower bound of the range at $725
-47-
0
500
1000
1500
2000
2500
3000
0 100000 200000 300000 400000 500000
Cos
t ($)
California production volume of EVs
High estimate
Low estimate
Figure 45mdashCombined Cost of 50-kW Motor and Motor Controller at
Different Production Volumes
Table 47
Motor and Motor Controller Costs for Full-Function EVs and City EVs ($ per motor and controller)
Type
High-Volume Scenarios 2003-2007
Low-Volume Scenarios 2003-2007
High-Volume
Production 50-kW Full-Function EV AC 2000-2100 3000-3100 725-1200 DC 2100-2500 3500-3850 725-1200 25-kW City EV AC 1550-1600 3000-3100 450-550 DC 1550-1800 3500-3850 450-550
EV Transmission and Other EV Auxiliaries Lipman (1999b) reports data from Unique Mobility on the cost of a single-speed EV
transaxle for volumes of 2000 20000 and 200000 units per year7 Based on those data we fit the following equation ____________
7Unique Mobility considers itself to be a ldquoworld recognized technology leader in the development and manufacture of energy efficient power dense electric motors generators and electronic inverters aimed at high growth and emerging marketsrdquo (httpwwwuqmcom)
-48-
cost per kWmotor-peak = 315x-030
where x is the annual unit production volume
For EV auxiliaries (including motors to drive compressors for steering and braking systems) we use the data in Delucchi et al 2000 (p 40) to fit the function
cost per kWmotor-peak = 72x-018+ 045x-020
where x is the annual unit production volume
The costs of these auxiliaries are small amounting to roughly $2 per kilowatt of peak motor power when annual production is 2000 and $085 per kilowatt when annual production is 200000 units
The high-volume estimate for the EV transmission and auxiliaries is based on predictions of these equations when volume is 500000 units per year It comes to $7 per kilowatt of peak motor power
Integrated Charger For integrated chargers we use estimates obtained from AC Propulsion (Brooks and Gage
2001) $1338 $474 and under $300 for vehicle volumes of 100 1000 and 10000 respectively for a conductive system8 These cost figures fit the following curve
cost = 5417x-032
where x is the annual unit production volume
This curve predicts a cost of $284 at a volume of 10000 and we used it to project integrated charger costs between 2003 and 2007
AC Propulsion had earlier (in 2000) provided Delucchi et al with integrated charger cost estimates (Delucchi et al 2000 p 39) The costs were $800 per vehicle when production ranged from 5000 to 10000 units per year The 2001 estimates are substantially below this and may reflect technical improvements or projected improvement in manufacturing processes We have not been able to investigate the reason for the decrease Data are not available on high-volume production costs The substantial decrease in estimated costs between 2000 and 2001 may indicate that costs will continue to decrease in the future But they may also mean that the 2001 estimates have squeezed costs hard (AC Propulsion is a strong advocate of EVs) We conclude that it is reasonable to use $250 to $300 for high-volume production costs ____________
8In June 2001 CARB adopted on-board conductive charging as the standardized charging system for EVs in California with implementation to be in 2006
-49-
Savings From Exclusion of Internal Combustion Engine Vehicle Components It is important to consider the savings that accrue because several key components of
ICEVs are not needed in EVs In Cuenca Gaines and Vyas 1999 manufacturing costs represent 50 percent of the manufacturerrsquos suggested retail price (MSRP) The engine transmission fuel and exhaust system represent 22 percent of the manufacturing cost (or 11 percent of the MSRP) for a subcompact and 20 percent (10 percent of MSRP) for a minivan9 Based on these percentages and a review of current MSRPs for subcompacts and minivans we put costs uniquely associated with ICEVs at $16 to $18 per kilowatt of rated engine power when nonmanufacturing costs are excluded and $32 to $36 once nonmanufacturing costs are included
The cost of ICEV components not required for an EV may well increase Auxiliary power requirements are expected to rise to the point that existing auxiliary power systems will have to be improved for vehicles with internal combustion engines as the sole power plant One published estimate puts the cost increment (for more powerful batteries alternators and wire harness) at $1000 (Sullivan 2001)
Currently passenger cars operate between 1 and 2 kW of auxiliaries but this amount is rising as amenities such as cell phones entertainment systems navigation systems electric steering electric brakes electric suspension and electric valves are added Existing 14-volt generators on ICEVs are limited to generating around 2 kW maximum All together nonpropulsion-related power needs could rise to between 5 and 10 kW or more (see Table 48) which is comparable to the power needs of a large home
Cars with 42-volt electrical systems designed for increased loads may arrive in the next several years These systems entail added costs for a larger battery more robust wiring and advanced switching components EVs and hybrid EVs are inherently capable of producing large amounts of electrical power so it is possible that the cost differential between conventional ICEVs and EVs and hybrid EVs may narrow as ICEV electrical systems are upgraded We do not make an adjustment for this effect in our analysis First we have not been able to examine the basis for the $1000 estimate above Second the extra power requirements will presumably also require more battery storage (and higher costs) to maintain the same vehicle range
Our discussion so far concerns the costs of ICEV components that are not required in EVs But our cost estimates of GHEVs must also include the cost savings due to the smaller internal combustion engines that are feasible in hybrids For example the Ford Escape GHEV will have a ____________
9In Cuenca Gaines and Vyas 1999 a subcompact has a 4-cylinder engine and a 5-speed transmission and a minivan has a 6-cylinder engine and a 4-speed transmission
-50-
4-cylinder internal combustion engine that performs like a conventional 6-cylinder power plant The increment in MSRP from the 4-cylinder to the 6-cylinder is $1400 according to Fordrsquos price
Table 48
Breakdown of Current and Potential Power Needs of an ICEV
Load Peak (watts) Average Electromechanical valves (6 cyl 6000 rpm) 2400 800 Water pump 300 300 Engine cooling fan 800 300 Power steering (all elec) 1000 100 Heated windshield 2500 200 Catalytic converter pre-heat 3000 60 Active suspension 12000 360 Commnaventertainment -- 100 Total -- 2220
SOURCE Kassakian 2000
guides We assume that the MSRP increment is twice the increment of the engine cost putting the reduction in engine cost at $700
44 COMPONENT COSTS OF DIRECT HYDROGEN FUEL-CELL VEHICLES In this subsection we first provide an overview of studies on projected proton exchange
membrane (PEM) fuel-cell system costs We then examine the costs of key fuel-cell components and their cost drivers
Overview of Recent Studies on PEM Fuel-Cell Systems The cost today of fuel cells is very high Current estimates for a hydrogenair fuel-cell
system run from $500 (Arthur D Little Inc [ADL] 2001 p 17) to $2500 per kilowatt (US Department of Energy [DOE] 1998 as cited in Lipman Delucchi and Friedman 2000 p 18) This translates into $30000 to $150000 for the 60-kW systems that will be needed for standard-size vehicles However many analysts project that fuel-cell costs will drop dramatically because of design and manufacturing improvements and volume production For example Ford Motor Company and Directed Technologies Inc (DTI) detail a product specification and manufacturing process that result in costs of $33 to $43 per kilowatt (fuel-cell stack and auxiliaries combined) at high-production volumes (Oei et al 2000) The following paragraphs describe the key studies Table 49 summarizes their findings
Arthur D Little (ADL) 2001 Study This study employs the Delphi method to solicit opinions from experts on the cost and performance of PEM fuel-cell vehicles over the next 30 years It provides costs for a fuel-cell system that could use hydrogen generated from gasoline by an on-board fuel reformer Such fuel cells require higher loadings of precious metals because of
-51-
impurities that remain after the reforming process The report concludes that future costs for a complete system (stack and auxiliaries) could drop to $111 per kilowatt The key cost driver with
Table 49
Summary of Studies on Fuel-Cell Costs
Study
Sponsor
Platinum Loading (mgcm2)
High-Volume Cost Arthur D Little 2001 California Energy Commission 08a $111kW for stack plus
auxiliaries Fuel Cell Technical
Advisory Panel 1998 CARB 025 $20kW for stack
$15kW for auxiliaries Oei et al (FordDTI) 2000 Ford and US DOE 025 $19-$28kW for stack Lipman Delucchi and
Friedman 2000 Kirsch Foundation and Union of Concerned Scientists
025 $39-$43kW for stack plus auxiliaries
aThe ADL design requires rhodium as well as platinum
regard to fuel cells is the amount of precious materials required As shown in Table 49 the ADL study assumes 08 grams of platinum and rhodium per square centimeter of active fuel-cell area
According to the ADL study (p 17) experts from Ballard Ford and DaimlerChrysler have predicted the cost of the Ballard Mark 900 fuel-cell module to be $50 to $60 per kilowatt in large volumes (approximately 300000 units per year) This range suggests that the platinum loading in the Ballard design is substantially less than 08 gmcm2
Kalhammer et al (Fuel Cell Technical Advisory Panel FCTAP) 1998 Study CARB established the FCTAP in 1996 to assist it in assessing the status and prospect of fuel cells for auto use A study was completed and a report was issued in July 1998 The research method was to ldquoacquire information from responses to a widely distributed questionnaire and in visits with organizations considered leaders in key aspects of fuel cell electric engine and vehicle developmentrdquo The panel concluded
The Panelrsquos visits and discussions with leading developers and potential manufacturers of PEM fuel cell components and stacks made clear that the fundamental technical barriers to the development of automotive fuel cell stacks have been overcome by the advances achieved over the past 5ndash7 years The large increases in the specific performance of PEM cells and stacks also have lowered the cost barriers to the point where future mass production may be able to meet the stringent cost goals for critical cell components and stacks intended for automotive applications (Kalhammer et al 1998 p III-21)
The FCTAP went on to predict
[On] the basis of the performance already achieved with preprototype stacks there appear to be reasonable prospects for meeting the $20kW ($100050kW) cost target for automotive fuel stacks if production reaches about 100000 to 200000 units per year At this level the
-52-
most critical stack componentsmdashmembrane MEA and separator platemdashwill reach production volumes that justify true mass manufacturing methods (Kalhammer et al 1998 p III-54)
-52-
Oei et al (FordDTI) 2000 Study This study considers four detailed designs and assesses the cost based on high-volume production (500000 units per year) with cost reductions gained by applying DFMA (design for manufacturing and assembly) techniques The DFMA process has been formally adopted by Ford as a systematic means for the design and evaluation of cost-optimized components and systems It combines historical cost data and manufacturing acumen accumulated by Ford since the earliest days of the company (Oei et al 2000 p 3-1)
FordDTI project that costs for PEM stacks will range from $19 to $28 per kilowatt in high-volume production The range is due to the overall stack power rating (eg 60 to 80 kW) Costs include material manufacturing and assembly costs as well as markups to reflect profit scrap RampD and administrative costs
As we discuss in more detail below the Ford design incorporates a number of well-researched but still untested features Learning through manufacturing experience could reduce costs further but Lipman notes that ldquothe estimation methodology used by DTI was specifically designed to identify the lowest cost PEM stack design configuration and the choice of a production volume of 300000 units per year suggests that it would be difficult to construe a lower cost caserdquo (Lipman Delucchi and Friedman 2000 p 19) In Ford and DTIrsquos view further cost reductions will require important technological advances They conclude that further cost reductions will require a reduction in platinum catalyst loading or in gas diffusion electrode costs because the costs of other components are based on ldquomaturerdquo manufacturing technologies (Oei et al 2000 p 3-47)
Lipman Delucchi and Friedman 2000 Study To project fuel-cell costs in the near term Lipman Delucchi and Friedman use an experience curve which is a way to relate unit cost (in this case $kW) to cumulative production They start with a cost of $2000 per kilowatt and 5000 kW of cumulative production in 2006 (p 19) costs then decline 22 percent for each doubling of production (this corresponds to a 78 percent experience curve) They note that experience curves typically range from 70 to 90 percent10 Costs decline until they reach a lower bound based on DTIrsquos estimates Lipman Delucchi and Friedman reduce cell peak power density roughly 15 percent from that assumed by DTI and arrive at a lower bound of $39 to $43 per kilowatt for the stack and auxiliaries combined
Figure 46 illustrates the experience curve of Lipman Delucchi and Friedman for a 25-kW PEM fuel-cell system As cumulative production increases costs fall rapidly and approach $60 per kilowatt ____________
10Note that these experience curves are for the successful products For many products the technology or costs did not allow commercial production that was long enough for an experience curve to be observed
-53-
25000 75000 125000 175000 225000 275000
SOURCE Based on Lipman Delucchi and Friedman 2000
0
50
100
150
200
250
$ pe
r kW
Worldwide cumulative production of DHFCVs (in thousands)
Figure 46mdashPEM Fuel-Cell System Costs as a Function of
Accumulated Production Quantity
Fuel-Cell Components Membrane Electrode Assembly Cost and Design The biggest contributor to the cost of
a PEM fuel-cell stack is the platinum (which serves as a catalyst) Platinum accounts for a significant portion of the MEA cost in any design For the design specified in the FordDTI study (Oei et al 2000) the cost of the platinum represents 75 percent of the total cost of the MEA
Table 410 compares the platinum loading in the MEA for the relevant studies The ADL 2001 study assumes a design with a large amount of platinum (08 mgcm2) which easily accounts for half of the MEA cost All the other studies assume far less for future-year designs DOE claims a breakthrough of 015 mgcm2 for experimental MEAs in laboratory quantities from a 3M design11 The FordDTI study (Oei et al 2000) assumes 025 mgcm2 and the FCTAP study (Kalhammer et al 1998) cites designs that range from 025 to 035 mgcm2 A Los Alamos National Laboratory study (LANL 2002) describes PEM fuel cells with low platinum loads (011 and 015 mgcm2) that have been tested to 4000 hours One reason that the ADL studyrsquos loading ____________
11In June 2001 DOE announced that 3M was selected for a $77 million cost-shared contract to develop MEAs with improved cathodes high-temperature membranes and optimized gas diffusion layers Improved flow fields and MEA fabrication processes will also be developed
-54-
Table 410
Platinum Loading in Membrane Electrode Assembly
Study
Platinum Loading (mgcm2)
MEA Cost in High Volume ($kW)
Comment Arthur D Little 2001 08 -- Assumes platinum is $1350gm Oei et al (FordDTI) 2000 025 10-11 Assumes platinum is $1286gm Los Alamos National Laboratory 2002 011-015 -- -- Kalhammer et al (FCTAP) 1998 Designs reviewed
Gore 03 -- -- Johnson Matthey 035 lt15 -- 3M 025 5-10 Assumes production of gt1 million m2yr
is much higher is that it is based on a fuel cell that can accept hydrogen reformed from gasoline or methanol Such fuel cells likely require more platinum and also rhodium to protect against impurities that remain after the reforming process A DHFCV is less susceptible to this type of catalyst poisoning so lower catalyst loadings are possible
These studies suggest that it is highly likely that an MEA with 025 mgcm2 can be built for automotive use and we have adopted this catalyst loading in our analysis Information on the durability of such cells is not publicly available It is possible that the Ballard fuel-cell system currently being tested by Toyota and GM and the fuel cell in Hondarsquos vehicles contain levels approaching 025 mgcm2 but such data are not publicly available Even if the levels in these cells are near 025 their real-world durability is still being investigated We thus cannot be entirely sure that fuel cells with 025 mgcm2 of platinum will work for automotive use Designs with even lower loadings however suggest that 025 mgcm2 is not a wildly optimistic assumption
The low MEA cost in the FordDTI study (Oei et al 2000) is based on a number of other design features that are well documented and researched but have not yet been produced For example FordDTI propose a composite polymer electrolyte membrane rather than conventional homogeneous membranes (p 3-5) The projected cost savings are 98 percent of current homogeneous membrane costs The electrodes in the FordDTI study are constructed from an advanced carbon paper that is still under development (p 3-11) Highly automated manufacturing techniques are used that might not pan out as well as envisioned FordDTI did however build some cushion into their estimates For example projected costs are inflated by 10 percent to ensure ldquoappropriate conservatismrdquo (p 3-44) and the lowest projected advanced carbon paper costs were not used (p 3-14) FordDTI believe their projections are based on ldquoaccepted manufacturing techniques and realistic technical parametersrdquo (p 3-19) In their view the projections would require a minimum of technological advancement (p 3-46)
-55-
FordDTI conclude that the MEA for a direct hydrogen fuel-cell stack can be built for $10 to $11 per kilowatt at high-volume production CARBrsquos FCTAP concludes that costs could run from $5 to $10 per kilowatt
Bipolar Plate Cost and Design The role of the bipolar plate (also called the separator plate) is to provide support for the fuel-cell membrane as well as to uniformly distribute the hydrogen on one side of the membrane and the oxygen on the other side The plate also has a role in conducting heat to allow for proper cooling It must be corrosion resistant and able to operate under pressure (Dayton 1999 Bulk Molding Compounds Inc 2001)
The FCTAP 1998 study cites a variety of approaches and designs for bipolar or separator plates as well as uncertainty as to the cost of this component A number of different types of materials could be used for the bipolar plates but the four main considerations are
1 corrosion-resistant metals 2 coated metals 3 carbongraphite 4 compatible polymers The FordDTI study assumes a metallic bipolar plate made of 316 stainless steel (which
contains high percentages of chromium nickel and molybdenum) This study considers two types of cell construction a three-piece design and a cheaper unitized (one-piece) separator plate An earlier ADL study (ADL 2000) assumes the use of a molded graphitepolymer composite bipolar plate the plate is molded into two pieces and bonded together
The FCTAP study does conclude that at least one developer could provide a design that allows the cost of the bipolar plate to be $5 per kilowatt
No stack developer appears to have made a final choice but several approaches look promising including embossing of impregnated porous carbon molding of commercially available carbon composites (Energy Partners) embossing of coated metal plates (Allied Signal Siemens) and perhaps bonding of appropriately shaped metal sheets (H-Power) At present confident estimates of separator plate costs are still lacking However the approaches under development were all selected for their potential to permit low-cost mass manufacturing of plates from inexpensive materials lending credibility to the $5kW cost projected by a leading developer (Kalhammer et al 1998 III-24)
Oak Ridge National Laboratory reports that it is working on a design envisioned to meet a cost goal of $10 per kilowatt The design being considered is one with thin metallic plates (thinner than a few millimeters) that uses carbon composites instead of graphite which is more costly to work with (Fuel Cell Catalyst 2001)
-56-
Fuel-Cell Auxiliaries Auxiliaries are devices that manage air water and other thermal issues In addition control electronics are required The cost of the auxiliary equipment supporting a fuel-cell stack has to be considered Fewer studies project costs for this part of a fuel-cell system Auto industry goals are $20 per kilowatt DTI (1998) assesses them to be $14 to $15 per kilowatt ADL concludes that the balance of plant costs in high-volume production for a gasoline-fueled PEM fuel cell would be $10 per kilowatt of stack power (ADL 2000)
Summary of Fuel-Cell System Costs It seems likely that DHFCVs will be available in only very small numbers through 2005 (see Subsection 31) We base our fuel-cell system costs between 2006 and 2010 on the manufacturing experience curve developed by Lipman Delucchi and Friedman (2000) Our estimates of fuel-cell system costs for this period run from $100 to $150 per kilowatt For high-production volumes we use $35 to $60 per kilowatt The lower bound reflects $20 per kilowatt for the fuel-cell stack and $15 for the auxiliaries FordDTI (Oei et al 2000) predict stack costs between $18 and $28 and we use $20 which is the low cost for the intermediate-size stacks likely in automotive applications The upper bound is based on estimates that the Ballard Mark 900 fuel cell will cost $50 to $60 per kilowatt in volume production
Our review of the literature led us to conclude that the projections that fuel-cell system costs can fall to $35 to $60 per kilowatt in volume production are well grounded Costs might be even lower if the very low platinum designs currently being investigated pan out However it is too early to tell if this will be the case Manufacturing experience may also reduce costs although additional reductions may not be large because most of the nonmaterial costs have been squeezed out by mature manufacturing techniques However a number of uncertainties remain Unexpected technological or production problems may arise and the durability of automotive fuel cells has not been extensively tested in demanding real-world environments We use this range for volume production costs in our analysis but note that much remains to be done to demonstrate that these low production costs can actually be realized
Hydrogen Tank for a Fuel-Cell Vehicle We considered the cost of the ldquonovel polymer-lined cylindersrdquo described by Thomas et al
(1999) Lipman Delucchi and Friedman (2000) estimate their cost to be $510 per kilogram of hydrogen stored at 350 atmospheres (5000 psi) based on current prices for compressed natural gas tanks Lipman cites a DTI study on high-volume production of such tanks to estimate a lower bound cost of $84 to $163 per kilogram of stored hydrogen This translates to $336 to $652 for a tank that stores 4 kg We use this cost range in our estimates of high-volume costs For the near
-57-
term we use the relation between cost and cumulative volume postulated by Lipman Delucchi and Friedman (2000)12 Figure 47 shows the resulting relationship for a 4-kg tank
45 PZEV COSTS CARB reviewed various technological approaches to PZEVs and concluded that the
incremental cost relative to a vehicle meeting the SULEV exhaust and near-zero evaporative standards was minor
[C]onfidential information from several manufacturers indicates that PZEVs soon to be introduced for sale in California will use a simpler and much less costly combined HC adsorbercatalyst rather than a separate adsorber and an attendant switching valve as had been assumed earlier Further the new information indicates that additional catalyst volume will not likely be required as was the case in the first PZEV system certified for sale in California Manufacturers will still face some increased cost to build increased durability into the emission control components (eg increased catalyst loading) in order to avoid excessive repair costs during the 150000 mile emission warranty period Based on the information acquired by staff some additional carbon trap capability will be added along with improved seals and reconfiguration of some components that do not add large cost The cost of going to a zero evaporative system from the near zero systems is now estimated to be $10 per vehicle Taking all of these factors into account staff now estimates that the necessary hardware modifications to meet PZEV requirements will range from $60 to $85 per vehicle (CARB 2001d p 5)
These estimates are for passenger cars and the smallest category of light-duty trucks (LDT1)13 The additional warranty requirements of PZEVs will range between $125 and $150 per
vehicle according to CARB estimates It is unlikely that all these costs represent incremental costs of PZEVs To some extent the warranty causes a transfer of the costs of maintaining the vehicle from consumers to producers and thus does not change the overall resource costs of PZEVs PZEVs may however cost more to maintain over their lifetimes because of the tighter emission standards The proportion of the warranty that represents a transfer of costs from consumers to producers also depends on the stringency of Californiarsquos inspection and maintenance (Smog Check) program A less stringent program requires fewer problems to be repaired in the absence of a warranty so a larger fraction of the warranty costs are true resource costs Given these uncertainties we vary resource costs due to the extended warranty from $0 to $150 per vehicle This range assumes from none to all of the increased warranty costs represent transfers from consumers to automakers Thus our estimate of the incremental cost of a PZEV
____________
12Tank cost = 321x-02318 where x is cumulative production volume 13Paul Hughes CARB personal communication May 2002
-58-
0
100
200
300
400
500
600
700
800
SOURCE Based on Lipman Delucchi and Friedman 2000
Tank
cos
t ($)
Cumulative production volume (in millions)
0 432 651
Figure 47mdashCost of Tank That Stores 4 kg of Hydrogen as a Function
of Production Quantity
relative to a SULEV meeting the near-zero evaporative emission standards ranges from $60 to $235
We have not been able to examine in detail the basis for CARBrsquos PZEV cost estimates Earlier CARB estimates were higher In August 2000 CARB put the incremental costs of a PZEV (relative to a SULEV) at $500 (CARB 2000b p 106) The design improvements outlined above make a plausible case for the reduced estimates but further analysis is warranted
46 INCREMENTAL VEHICLE PRODUCTION COSTS So far we have discussed the costs of individual vehicle components To calculate the
incremental production costs of vehicles that manufacturers may use to meet ZEV program requirements we subtract the costs of components associated with the conventional ICEV and add in the costs of components associated with each vehicle technology14 Indirect costs associated with each of the components are also dropped and added and we account for changes in these costs (eg corporate overhead warranty and normal profit) Here we first detail the ____________
14As an alternative to this approach one could also build costs of various vehicles from the ground up and then compare the resulting total vehicle costs Delucchi et al (2000) use such an approach
-59-
indirect cost multipliers used in our analysis We then present estimates of the incremental costs of ZEVs ATPZEVs and PZEVs
Multipliers Used to Calculate Indirect Costs Analysis of indirect costs is usually framed in terms of the difference between
manufacturing cost and final manufacturerrsquos suggested retail price (MSRP) Vyas Cuenca and Gaines (1998) break down the components of MSRP and show that the direct manufacturing cost accounts for half of the price (see Table 411) A later report (Cuenca Gaines and Vyas 1999) proposes multipliers to translate vehicle cost to vehicle price Depending on the component the multipliers range from 115 to 20 115 to 13 for the battery pack 15 for all other components supplied to the auto manufacturer and 20 for components developed solely by the auto manufacturer (eg the internal combustion engine) We use these estimates in our analysis For battery packs and fuel-cell systems 115 and 130 are used in calculations of the lower and upper bounds respectively of the cost ranges projected for each production volume scenario15
Incremental Vehicle Production Costs
Estimates of the incremental production costs of the various low-emission vehicles and ZEVs are presented in Table 412 Costs are incremental to a standard ICEV that meets the SULEV exhaust standard and the near-zero evaporative emission standard The second column presents estimates of the range into which incremental production costs are likely to fall on average between 2003 and 2007 if annual production volumes are at the low end of the ranges specified in Subsection 32 The third column presents the range if annual production volumes are at the high end of the ranges specified in Subsection 32 The last column reports incremental costs in volume production Breakdowns of volume production costs for each vehicle technology are presented in Appendix C as is an analysis of the sensitivity of the incremental cost of full-function EVs to changes in peak motor power and battery pack size
As discussed above the incremental costs of a PZEV are modest GHEVs will likely cost several thousand dollars more to produce during the first five years of the program Costs come down in high-volume production but are still expected to exceed standard ICEV costs by $500 to $900 per vehicle BPEVs will be much more expensive to produce during the initial years of the program Incremental production costs including the cost of the first battery pack for a full-function EV using NiMH batteries range from $16700 to $26100 Incremental costs for PbA ____________
15CARBrsquos first estimate of PZEV costs included a 10 percent adjustment for indirect costs (CARB 2000b p 106) We assume that CARBrsquos 2001 estimate also includes indirect costs but the indirect cost multiplier is unknown
-60-
Table 411
Breakdown of Manufacturerrsquos Suggested Retail Price for an ICEV
Share of MSRP () Cost CategorySubcategory By Cost Category By Subcategory Production 670
Manufacturing 500 Warranty 50 RampD and engineering 65 Depreciationamortization 55
Selling 235 Distribution 200 Advertising and dealer support 35
Administration and profit 95 Corporate overhead 50 Retirement and health benefits 20 Profit 25
Total 1000 1000 SOURCE Vyas Cuenca and Gaines 1998
Table 412
Incremental Vehicle Production Costs (relative to an ICEV meeting SULEV exhaust and near-zero evaporative emission standards) (estimated ranges in brackets $1000s per vehicle)
Near-Term Costs Vehicle Technology
Low-Volume Scenario
High-Volume Scenario
High-Volume Production
2003-2007 2003-2007 PZEV [006 023] [006 023] [006 023] GHEV [24 33] [23 29] [05 09] Full-function EV NiMH [225 261] [167 198] [51 99] PbA [127 152] [80 96] [18 43] City EV NiMH [120 134] [85 97] [17 34] PbA [86 99] [53 60] [07 15] 2006-2010 2006-2010 DHFCV [114 152] [83 110] [12 39]
batteries and for city EVs are lower but remain very large between 2003 and 2007 Even in volume production production costs remain substantially above those for ICEVs The lowest incremental cost in high-volume production is $700 to $1500 for city EVs with PbA batteries But these numbers should be used with caution because as discussed above there are drawbacks to designing vehicles with PbA batteries DHFCVs will also likely be much more expensive when they are first introduced Because of low production volumes and the developing technology we estimate that the incremental costs of DHFCVs will run from $8300 to $15200 between 2006 and 2010 But in the long run DHFCV technology looks more promising than BPEV technology does Projections based on what is currently known about fuel cells show that
-61-
incremental production costs may come down to $1200 However we cannot rule out the possibility that production costs will remain nearly $4000 above those of an ICEV
47 INCREMENTAL LIFECYCLE COSTS So far we have discussed the incremental production cost of advanced technology vehicles
but their overall social cost also depends on their incremental lifetime operating costs by which we mean the cost of operating and maintaining the vehicle relative to the cost of operating and maintaining a baseline ICEV We add incremental lifetime operating costs to incremental production costs to estimate incremental lifecycle cost
We begin by presenting and justifying the parameters we use to estimate the incremental lifecycle costs starting with full-function EVs and city EVs and then moving to DHFCVs and GHEVs Any incremental lifetime operating costs of PZEVs (due for example to increased warranty costs) are captured in the production costs estimated above Thus the PZEV incremental lifecycle cost is only the incremental production cost After presenting the parameters we discuss the method we use to predict incremental lifecycle costs using these parameters Finally we present the results of the analysis
Parameters Used to Estimate Incremental Lifecycle Costs of Full-Function and City EVs The incremental lifecycle costs of BPEVs are determined by
bull incremental initial vehicle costs (including first battery and off-board charger) bull vehicle life bull replacement costs and salvage value of batteries bull EV and ICEV fuel costs bull EV and ICEV repair and maintenance costs bull charger installation costs bull the discount rate
Table 413 lists the parameters that determine the incremental costs for full-function EVs in each of these areas along with plausible ranges for their values between 2003 and 2007 and when these vehicles are in high-volume production Parameters for full-function EVs using both NiMH and PbA batteries are shown Table 414 lists parameter values for city EVs with both types of batteries We now discuss the rationale for each parameter range
Incremental Vehicle Cost The incremental vehicle costs between 2003 and 2007 and in volume production are taken from Table 412 For both the full-function and the city EVs they include the cost of the first battery pack
-62-
Vehicle Life Using data from the Transportation Energy Data Book and other sources Delucchi et al (2000 p 55) estimate an average vehicle life of 150000 miles In its analysis of
Table 413
Parameters Used to Calculate Lifetime Operating Cost of a Full-Function EV Relative to a Comparable ICEVa
Full-Function EV with NiMH Batteries
Full-Function EV with PbA Batteries
Parameter
2003-2007
Volume Production
2003-2007
Volume Production
Initial Vehicle Cost ($) (including first battery and off-board charger)
16700-26100
5100- 9900
8000-15200
1800- 4300
Vehicle Life Lifetime vehicle miles traveled 150000 150000 150000 150000 Vehicle life in years 15 15 15 15
Parameters Affecting Battery Replacement Cost
Pack size (kWh) 30 24 30 24 Battery cost ($kWh) 305-360 233-258 115-154 114 Cycle life (1000 cycles) 10-15 15 06-10 10 Range (milescycle) 90-110 90-110 90-110 90-110 Cost surcharge for installing
subsequent packs ($installation) 500 500 500 500
Salvage value ($kWh) 0-40 0-40 -15 to 5 -15 to 5 Parameters Affecting Fuel Costs
EV efficiency (mikWh AC) 2-3 25-35 2-3 25-35 ICEV efficiency (migal) 25-30 25-30 25-30 25-30 Electricity price ($kWh) 0035-005 007-009 0035-005 007-009 Gasoline price ($gal) 056-149 056-149 056-149 056-149
Other Costs EV repair and maintenance (
of ICEV costs) 65-70 65-70 65-70 65-70
ICEV maintenance ($mile) 006 006 006 006 Charger installation ($) 500-1500 500 500-1500 500
Discount Rate () 4 4 4 4 aThe comparable ICEV is mid-sized meets the SULEV and near-zero evaporative emission standards and averages 25 to 30 miles per gallon
lifecycle costs CARB assumes that vehicles travel 117000 miles over their lifetimes (CARB 2000b p 98) which is close to CARBrsquos definition of a ldquouseful vehiclerdquo life rather than actual miles driven before a vehicle is retired Thus for a full-function EV we set lifetime miles traveled at 150000 miles CARB also assumes a vehicle life of 10 years we set vehicle life to 15 years to correspond to the higher lifetime miles traveled that we assumed in our analysis
Because of the limited top speed and range of city EVs they are unlikely to be driven as far on average as full-function EVs over their lifetimes Based on the National Personal Transportation Survey Reuyl and Schuurmans (1996) estimate that vehicles with a daily range of 50 to 60 miles can be used for 50 percent of the miles driven by the average driver We thus
-63-
assume that city EVs will be driven 75000 miles over their lifetimes CARB assumes 88000 (2000b p 113)
Table 414
Parameters Used to Calculate Lifetime Operating Cost of a City EV Relative to a Comparable ICEVa
City EV with NiMH Batteries
City EV with PbA Batteries
Parameter
2003-2007
Volume Production
2003-2007
Volume Production
Initial Vehicle Cost ($) (including first battery and off-board charger)
8500-13400 1700ndash3400 5300-9900
700-1500
Vehicle Life Lifetime vehicle miles traveled 75000 75000 75000 75000 Vehicle life in years 15 15 15 15
Parameters Affecting Battery Cost Pack size (kWh) 10 8 10 8 Battery cost ($kWh) 305-360 233-258 115-154 114 Cycle life (1000 cycles) 10-15 15 06-10 10 Range (milescycle) 50-60 50-60 50-60 50-60 Cost surcharge for installing
subsequent packs ($installation) 250 250 250 250
Salvage value ($kWh) 0 to 40 0 to 40 -15 to 5 -15 to 5 Parameters Affecting Fuel Costs
EV efficiency (mikWh AC) 4-5 5-6 4-5 5-6 ICEV efficiency (migal) 40 40 40 40 Electricity price ($kWh) 0035-005 007-009 0035-005 007-009 Gasoline price ($gal) 056-149 056-149 056-149 056-149
Other Costs EV repair and maintenance (
of ICEV costs) 65-70 65-70 65-70 65-70
ICEV maintenance ($mile) 0045 0045 0045 0045 Charger installation ($) 0 0 0 0
Discount Rate () 4 4 4 4 aThe comparable ICEV is small meets the SULEV and near-zero evaporative emission standards and averages 40 miles per gallon
Parameters That Affect Battery Replacement Cost The cost of the batteries (excluding the first battery pack) needed over a vehiclersquos lifetime is determined by
bull the battery pack size bull the cost of the batteries in dollars per kilowatt-hour bull the cycle life of the battery bull the miles driven on a battery cycle bull the cost markup for buying and installing subsequent battery packs bull the salvage value of batteries
We discuss each in turn
-64-
As described in Subsection 41 we set the 2003-through-2007 battery pack size to 30 kWh for a full-function EV and to 10 kWh for a city EV It seems plausible that the efficiency of EVs (in terms of kilowatt-hours per mile) will increase in the future (see discussion below) We increase efficiency by 20 percent for our estimates of lifecycle costs in volume production so that the battery pack can be smaller and maintain the same range Accordingly we reduce the full-function EV and city EV battery packs to 24 and 8 kWh respectively for the high-production volume cost calculations
The above analysis of battery costs led us to conclude that NiMH battery packs (including battery auxiliaries and indirect costs) would cost from $425 to $460 per kilowatt-hour between 2003 and 2007 The range for PbA batteries is $130 to $170 The cost of replacement batteries for vehicles sold between 2003 and 2007 may well be lower than it was when the vehicle was built due to battery production volumes increasing over time We assume that by the time the battery is replaced 50 percent of the difference between the 2003-2007 costs and the midpoint of the high-volume cost range will have been eliminated The result NiMH replacement costs will be $305 to $360 and PbA replacement costs $115 to $154 In the volume production scenarios we allow NiMH battery pack costs to range from $233 to $258 per kilowatt-hour and set PbA battery costs at $114 per kilowatt-hour
The EVrsquos range (90 to 110 miles for a full-function EV and 50 to 60 miles for a city EV) multiplied by the battery cycle life is a starting point for the miles driven over one packrsquos lifetime which in turn determines the number of packs needed over a vehiclersquos lifetime We reduce the resulting estimate of the miles driven using a single pack by 20 percent because vehicle range is determined by taking the battery down to empty whereas cycle life is usually determined by taking the battery down to a 20 percent charge
We put NiMH cycle life at 1000 to 1500 cycles between 2003 and 2007 and at 1500 cycles in the high-volume cost scenario CARBrsquos Battery Technology Advisory Panel (BTAP) report (Anderman Kalhammer and MacArthur 2000 p 37) cites one auto manufacturerrsquos projection of 1200 cycles and 100000 miles at 77degF and 1100 cycles at 95degF from bench tests that have been partially corroborated by field tests of battery packs in vehicles While cycle life deteriorates when the pack is continuously exposed to extreme heat (113degF) the important implication is that a NiMH battery pack that is properly thermally managed can now achieve 100000 miles In reference to a Panasonic NiMH battery16 the BTAP report optimistically ____________
16At the November 1999 UC Davis Conference on EVs Panasonic EV reported that the RAV4-EV (NiMH) had already achieved 100000 kilometers of driving on one pack in tests in Japan Furthermore Panasonic EV suggested that longer life can be expected with ldquoeconomy chargingrdquo ie intermittent full charging in order to reduce deterioration of the NiMH battery electrode
-65-
forecasts that ldquoit seems quite possible that 1000 to 2000 cycles at 100 percent depth of discharge can eventually be achieved depending on the batteryrsquos initial power versus the carrsquos requirementsrdquo (Anderman Kalhammer and MacArthur 2000 p 31)
PbA batteries currently achieve roughly 600 cycles but Panasonic has been developing designs with longer cycle lives and 1000 cycles appears to be possible (Matsushita Electric 2000)17 We set PbA cycle life to 600 to 1000 cycles between 2003 and 2007 and to 1000 cycles in the high-volume scenarios
Following CARB (2000b p 100) we set the cost of handling and installing replacement battery packs at $500 per pack
Batteries may have salvage value at the end of their lives Battery experts at Southern California Edison told Delucchi et al (2000 p 45) that used NiMH batteries would be at least as good for load-leveling backup and other utility applications as the new PbA packs they currently buy for such uses Thus the salvage value for NiMH batteries might be as high as $100 per kilowatt-hour (roughly the current cost of new PbA batteries) at least until the supply of retired NiMH batteries saturates the market The secondary market for NiMH batteries is quite uncertain however CARB (2000b p 100) assumes that the salvage value is $40 per kilowatt-hour for NiMH batteries but Delucchi et al (2000) believe the batteries will lose their remaining value very quickly and that there thus will be little market for them They believe the batteries will have to be recycled at a small net cost at low volumes and will have a small net salvage value at medium volumes In our analysis we vary the salvage value of NiMH batteries from $0 to $40 per kilowatt-hour
CARB (2000b p 100) believes a secondary market for used PbA batteries at meaningful volumes is speculative and assumes a salvage value of $3 per kilowatt-hourmdashthe value of the materials in the battery Delucchi et al (2000 p 46) assumes that PbA batteries will have negative salvage valuemdashthat is they will cost between $5 and $15 to recycle In our analysis we vary PbA salvage values from -$15 to $5 per kilowatt-hour
The last battery pack installed in the vehicle might not be fully used at the end of the vehicle life Following Delucchi et al (2000 p 69) we set the salvage value of the unused portion of the pack equal to 70 percent of the cost of batteries to the manufacturer ____________
17ldquoThe newly developed EV battery lasts approximately twice as long and offers about twice as much power as existing lead-acid EV batteries It can be discharged and recharged approximately 1000 times which is about twice as many cycles as the companyrsquos existing lead-acid EV battery productsrdquo (Matsushita Electric 2000)
-66-
Parameters That Affect Fuel Costs The cost of electricity the cost of gasoline the wall-to-wheels (or AC) efficiency of the EV and the fuel efficiency of the ICEV determine the lifetime fuel costs of a full-function EV relative to an ICEV
The number of BPEVs is relatively small between 2003 and 2007 and we assume that BPEVs can be charged off-peak using existing power generation transmission and distribution facilities As shown in Appendix D the costs of power in such a situation might be expected to run from $0035 to $005 per kilowatt-hour If EVs become a significant part of the transportation system they will use a significant amount of power requiring additional generation transmission and distribution facilities18 For volume production we thus put electricity costs at $007 to $009 per kilowatt-hour which covers the capital cost of the power plant and the transmission and distribution system (see Appendix D) Because we are interested in resource costs we do not include taxes or charges imposed to recover costs during Californiarsquos recent energy crisis Likewise CARB does not include taxes in its analysis of operating costs CARB assumes an electricity cost of $005 per kilowatt-hour however it also presents a scenario in which costs are $0075 per kilowatt-hour (CARB 2000b p 107)
There is a good deal of uncertainty regarding gasoline prices over the lives of the vehicles We assume prices at the pump will vary between $100 and $200 per gallon which is consistent with prices observed in recent years in California Federal and state fuel excise taxes currently total $0363 per gallon and sales taxes on gasoline average roughly 8 percent in the state (CARB 2000b p 107) We thus assume that gasoline costs vary from $056 to $149 per gallon net of taxes
EV efficiency (in miles per kilowatt-hour AC) is based on data developed by Southern California Edison for the EVs produced by the large manufacturers19 Our figures for ICEV fuel efficiency reflect a rough average of the fuel efficiencies of ICEVs that are comparable in size to full-function EVs and city EVs (275 miles per gallon for mid-size ICEVs and 40 miles per gallon for very small ICEVs)
The efficiency of EVs may improve over future design cycles and thus might be higher in volume production than it will be between 2003 and 2007 CARB assumes that efficiency increases from about 22 miles per kilowatt-hour in 2003 to roughly 4 miles per kilowatt-hour in volume production for a four-passenger full-function EV (CARB 2000b p 111) This ____________
18For example to charge 100000 full-function EVs overnight will require a 250-megawatt power plantmdasha good-sized plant (If each full-function EV requires 30 kWh per night 100000 full-function EVs require 3000 megawatt-hours And 3000 MWh12 hours = 250 megawatts)
19We determined the range using the efficiencies remaining after the vehicles with the highest efficiency (the EV1) and lowest efficiency (the EPIC) were discarded (see httpevinelgovfop)
-67-
improvement is driven by a substantial reduction in aerodynamic drag lower-loss tires a higher-efficiency drive system and substantial improvements in charging efficiency While efficiency may well improve we think it likely that CARB is overly optimistic For example vehicles with very low aerodynamic drag are technologically feasible but are not assured of success in the marketplace We increase EV efficiency roughly 20 percent from the levels used to estimate costs between 2003 and 2007 yielding a battery pack that is 20 percent smaller but allows the same range
EV Repair and Maintenance Costs It is often argued that EVs will have lower repair and maintenance costs than ICEVs do because EVs have fewer components and fewer moving parts While this may be so in the long term we follow Dixon and Garber (1996 p 244) in assuming there are several reasons to be skeptical in the near term
bull EV technology is evolving rapidly but projections of EV repair and maintenance costs may be based implicitly on costs for stable designs Components will probably be less reliable in the early years of commercial scale production than in later years
bull Several manufacturers have had problems with their battery packs and have had to replace battery modules an expensive process Installing replacement packs may also be time consuming and costly
bull Repair and maintenance costs of ICEVs appear to be declining Delucchi et al (2000 p 245) put EV repair and maintenance costs at approximately 70
percent of ICEV costs CARB (2000b p 108) uses 66 percent in its analysis We let the proportion vary from 65 to 70 percent The ICEV repair and maintenance cost we use for reference for the full-function EV is $006 per mile (as in Delucchi et al 2000 p 245 and CARB 2000b p 108) We reduce the repair and maintenance cost by 25 percent for the smaller ICEV used in the city EV incremental-cost calculation
Charger Installation We assume that the off-board charging equipment is included in the cost of the EV but that the off-board charger must be installed at the business or residence where the vehicle is charged Installation often requires significant extension or modification of the businessresidence electrical system and may require structural modifications There appears to be a great deal of variation across customers in charger installation costs Nissan reports an average cost (based on a fairly small number of installations) of $3000 for installation of a full-function EV charger inside the garage of a single-family home (Atkins et al 1999) CARB sets the cost of the charger plus installation at $1500 in 2003 and $750 in volume production Our analysis assumes installation costs range from $500 to $1500 between 2003 and 2007 Average installation costs in volume production should be lowermdashin part because some households and
-68-
businesses will already have installed the 220-volt line used by most full-function EV chargers We set installation costs at $500 for volume production
It appears that city EVs will likely be offered with a number of different charging options ranging from simply plugging the vehicle into a standard 110-volt outlet to using a rapid charging system that requires the same 220-volt 30-ampere outlets used by full-function EVs The 110-volt option requires no charger installation costs but it may take up to 8 hours to charge the 10-kWh battery The rapid-charge option will charge the battery very quickly but may require installation costs as high as those for full-function EVs We set charger installation costs to zero in our analysis The key requirement for any EV is that it be able to charge overnight and the city EV will be able to do so using a standard 110-volt circuit
Discount Rate The discount rate translates costs incurred in the future to present-day costs Because we are interested in the resource costs of advanced technology vehicles to society as a whole we set the discount rate to the social (as opposed to the private) discount rate20 The social discount rate is defined as the social opportunity cost of capital and is often based on the long-run risk-free (or low-risk) return on capital (Tietenberg 1992 p 88) Examples include the return on US Treasury bonds Estimates of the long-run risk-free return are typically 3 to 5 percent net of inflation
Parameters Used to Estimate Incremental Lifecycle Costs of DHFCVs Table 415 lists the parameters used to estimate the incremental lifecycle costs of a
DHFCV relative to an ICEV that meets the SULEV exhaust and near-zero evaporative emission exhaust standards The key parameters in the incremental operating costs are the DHFCVrsquos fuel economy in miles per kilogram of hydrogen and the cost of hydrogen in dollars per kilogram The Methanol Institute summarizes the findings of eight studies on the expected fuel economy of DHFCVs21 The efficiencies range from 55 to 106 miles per equivalent gallon of gasoline and the Methanol Institute uses 65 to 85 miles in its analysis The two measuresmdashmiles per equivalent gallon of gasoline and miles per kilogram of hydrogenmdashare very close and we use 65 to 85 miles per kilogram for our cost projections for 2006 to 2010 For high-volume lifecycle cost projections we set the efficiency at 85 miles per kilogram
Appendix D derives an estimate of the cost of hydrogen fuel We assume that hydrogen is sold at filling stations that generate hydrogen from natural gas piped to the site Assumptions on the cost of natural gas and the cost of the reformer that generates hydrogen ____________
20Consumers are thought to apply much higher discount rates when buying durable goods See for example Kavalec 1996 p 30
21See httpwwwmethanolorgfuelcellspecialcontadini_pg1html Tables 1 and 2
-69-
from natural gas result in hydrogen costs of $232 to $316 per kilogram between 2006 and 2010 The costs fall to $185 to $233 per kilogram for high-volume production of reformers To put these numbers in perspective $200 per kilogram corresponds to $0027 per mile in a vehicle that gets 75 miles per kilogram Fuel cost for a mid-size ICEV that
Table 415
Parameters Used to Calculate Lifetime Operating Costs of a DHFCV Relative to a Comparable ICEVa
Parameter 2006-2010 Volume Production Initial vehicle cost ($) 8300-15200 1200 - 3900 Vehicle efficiency
DHFCV (mikg of hydrogen) 65-85 85 ICEV (migal) 25-30 25-30
Fuel cost Gasoline ($gal) 056-149 056-149 Hydrogen ($kg) 232-316 185-233
Maintenance costs ($mi) DHFCV 006 006 ICEV 006 006
aThe comparable ICEV used in the calculations is mid-size meets the SULEV and near-zero evaporative emission standards and averages 25 to 30 miles per gallon
averages 275 miles per gallon when gasoline (net of taxes) is $100 per gallon is $0036 per mile
Little information is available on the maintenance costs of DHFCVs relative to ICEVs A DHFCVrsquos electric power train has fewer parts than an ICEVrsquos drivetrain and may be cheaper to maintain The reliability and maintenance costs of a PEM fuel cell however are uncertain Lacking better information we set the maintenance costs of DHFCVs equal to those for ICEVs
Parameters Used to Estimate Incremental Lifecycle Costs of GHEVs GHEVs may be cheaper to operate than standard ICEVs because of their higher gas
mileage Following CARB (2000b p 114) we set the efficiency of a four-passenger GHEV to 45 miles per gallon between 2003 and 2007 and assume that improvements in vehicle design will increase the fuel economy to 55 miles per gallon in volume production (see Table 416)22 These fuel economies are 50 and 57 percent greater respectively than the 30 and 35 miles per gallon that CARB (2000b p 115) assumes for a comparable ICEV
In its initial analysis of hybrid costs CARB concluded that hybrid maintenance costs may be higher than those of standard gasoline vehicles because hybrids contain both a conventional ____________
22CARBrsquos estimate of 45 miles per gallon is based on published fuel mileage figures for currently available hybrids
-70-
and an electric drive system CARB noted that little was known about hybrid operating costs however and ldquoin the absence of more specific informationrdquo set maintenance costs at $0075 per mile (CARB 2000b p 108) CARB later reexamined the maintenance costs of hybrids and
-71-
Table 416
Parameters Used to Calculate Incremental Lifecycle Cost of a GHEV Relative to a Comparable ICEVa
Parameter
2003-2007
High-Volume Production
Initial vehicle cost ($) (including first battery and off-board charger)
2300-3300 500-900
Vehicle efficiency (migal) GHEV(ATPZEV) 45 55 ICEV 30 35
Fuel costs ($gal) 056-149 056-149 Maintenance costs ($mi)
GHEV(ATPZEV) 006-078 006-065 ICEV 006 006
aThe comparable ICEV used in the calculations is mid-size meets the SULEV and near-zero evaporative standards and averages 30 miles per gallon between 2003 and 2007 and 35 miles per gallon when GHEVs are in volume production
concluded that incremental maintenance costs would be zero CARB noted that there may be some incremental maintenance costs associated with the battery or electric drive components (eg the 2002 Toyota Prius requires a coolant change for the electric power inverter at 34000 miles) but that there may be less brake wear due to regenerative braking (CARB 2001h p 167)
CARB never explicitly addresses the costs associated with maintaining and possibly replacing the battery in hybrids There is uncertainty over whether one battery will last the entire life of the vehicle As noted in Subsection 43 a recent report put the life expectancy of a NiMH hybrid battery at five to eight years Ford reports that the battery in its Escape hybrid will have to be replaced at least once during a 15-year vehicle life Honda implies that 15 years in service is beyond todayrsquos battery technology Toyota believes that scheduled replacement of the battery will not be required over a 15-year lifetime but that unscheduled maintenance is possible (CARB 2001h p 129)
This uncertainty drives us to develop a range for hybrid maintenance costs The lower end of the range is $006 per mile equal to the maintenance costs of standard ICEVs The upper end allows for the accumulation of enough money over the life of the vehicle to replace the battery once For 2003 to 2007 we take the upper estimate for the cost of the battery ($2000mdashsee Subsection 43) add 30 percent for indirect costs (see Subsection 46) and add $125 for installation (lower than the $500 assumed cost to replace the much larger full-function EV pack) The sum translates into $0018 per mile resulting in a maintenance cost range that runs from $006 to $007 per mile In high-volume production the pack costs $500 resulting in a range of $006 to $0065 per mile
-72-
Method for Calculating Incremental Lifecycle Costs We assume that each of the parameters is statistically independent and uniformly
distributed on its specified range We then randomly draw a value from each parameter range and use the resulting set of values to calculate the incremental lifetime operating cost and incremental lifecycle cost of each advanced technology vehicle relative to an ICEV We repeat this process 10000 times and report the 5th and 95th percentiles of the distribution Given assumptions on the distributions of the parameters if we repeated the process for constructing the interval over and over this interval would contain the true incremental cost 90 percent of the time We chose to repeat the process 10000 times because the distribution is stable to two significant digits with this number
Findings on Incremental Lifecycle Costs Results of our analysis of incremental lifetime operating and lifecycle costs are reported in
Table 417 The second and third columns show our findings on the incremental lifetime operating cost in the near term and in volume production respectively The fourth and fifth columns add in the incremental initial cost of the vehicle and show the incremental lifecycle cost The brackets in each cell contain the 90 percent probability interval for the estimate
Full-Function EVs During the first five years of the program the lifetime operating cost of full-function EVs with NiMH batteries may be higher or lower than that of an ICEV meeting the SULEV exhaust and near-zero evaporative emission standards As can be seen in the second column of Table 417 the 90 percent probability interval runs from -$1600 to $4000 Once the high incremental production cost for these vehicles is included the incremental lifecycle cost ranges from $17300 to $27800 Our analysis suggests that even in volume production the lifecycle cost of full-function EVs with NiMH batteries will remain substantially above that for ICEVs The incremental cost estimates range from $3100 to $8700
PbA batteries are cheaper than NiMH batteries but their short cycle life means that the lifetime operating cost will likely be somewhat greater for full-function EVs with PbA batteries than for their NiMH-powered counterparts Incremental lifecycle cost is a good deal lower however because the initial vehicle is cheaper Between 2003 and 2007 there will still be a substantial lifecycle cost premium for full-function EVs powered with PbA batteries ($9000 to $18400) Incremental lifecycle cost may be small in volume production ($200) but there is an equally good chance that incremental lifecycle cost will remain substantial (the upper end of the 90 percent probability interval is $5100) Thus even with PbA batteries the lifecycle cost of full-function EVs is likely to exceed that of ICEVs What is more questions remain about whether PbA batteries are feasible for full-function EVs that have a range of roughly 100 miles
-73-
Table 417
Incremental Lifetime Operating and Lifecycle Costs of Advanced Technology Vehicles (incremental over a vehicle meeting SULEV and near-zero evaporative emission standards)
($1000s per vehicle 90 percent probability intervals in brackets)a
Incremental Lifetime Operating Cost Incremental Lifecycle Cost Vehicle Technology
Near Term
High-Volume Production
Near Term
High-Volume Production
2003-2007 2003-2007 Full-function EV
NiMH [-16 40] [-31 10] [173 278] [31 87] PbA [-11 52] [-25 51] [90 184] [02 51]
City EV NiMH [-13 05] [-16 -03] [81 129] [05 24] PbA [-11 10] [-13 -01] [51 99] [-04 12]
GHEV [-14 08] [-15 03] [13 37] [-09 04] PZEV 0 0 [006 023] [006 023] 2006-2010 2006-2010 DHFCV [-21 20] [-34 03] [78 156] [-13 34] aDiscounted to the time of vehicle sale using a 4 percent discount rate
since the size and weight of these batteries make it difficult to design such a vehicle with acceptable space and handling
City EVs Mainly because of their smaller battery packs city EVs have a much lower incremental lifecycle cost than full-function EVs do Between 2003 and 2007 the operating cost of a city EV with either PbA or NiMH batteries may be above or below that of a small ICEV Substantial incremental vehicle production cost between 2003 and 2007 still means however that incremental lifecycle cost for a city EV remains sizable with either type of battery
For high-volume production our analysis predicts that if battery cycle life reaches the most optimistic expectations and vehicle efficiencies improve somewhat the lifecycle cost of a city EV with PbA batteries could be comparable to that of a small ICEV As shown in Table 417 the 90 percent probability interval ranges from -$400 to $1200 Again however note that manufacturers are choosing to use NiMH batteries and NiCd batteries in their city EVs despite the higher costs which suggests that PbA batteries do not work well in a city EV design
GHEVs The cost of servicing and possibly replacing the battery in a GHEV more than offsets the savings due to this vehiclersquos higher gas mileage Our estimates of incremental lifetime operating cost range from -$1400 to $800 per vehicle for vehicles produced between 2003 and 2007 and from -$1500 to $300 in high-volume production Once the incremental cost of the vehicle is added in the hybridrsquos lifecycle cost is $1300 to $3700 greater than that of a standard ICEV between 2003 and 2007 Incremental lifecycle cost runs from -$900 to $400 in volume production
-74-
PZEVs The greater incremental lifecycle cost of a PZEV relative to an ICEV that meets the SULEV exhaust and near-zero evaporative emission standards is due only to the increased initial cost of a PZEV Our estimates range from $60 to $235 from 2003 on
DHFCVs Given our assumptions on the cost of hydrogen fuel fuel efficiency and vehicle maintenance the lifetime operating cost of a DHFCV may be several thousand dollars less than that of an ICEV The midpoint of the estimate for incremental operating cost between 2006 and 2010 is near zero although there is enough uncertainty in the parameters that the upper end of the 90 percent probability interval reaches $2000 Very high initial vehicle cost means that the incremental lifecycle cost of DHFCVs remains high through 2010 Plausible improvements in fuel-cell technology and reductions in the cost of providing hydrogen fuel may ultimately reduce the lifecycle cost for this vehicle to below that for an ICEV (the lower end of the probability interval is -$1300) However this is by no means guaranteed The upper end of the interval is $3400
- 4 VEHICLE PRODUCTION AND LIFECYCLE COST
-
- 41 KEY VEHICLE COMPONENTS
-
- Battery-Powered Electric Vehicles
- Direct Hydrogen Fuel-Cell Vehicles
-
- Table 41
-
- Specifications of BPEVs
-
- Full-Function EVs
-
- ~8
- DC permanent magnet
-
- Figure 41mdashSingle PEM Fuel Cell
-
- Table 42
-
- Specifications of Prototype DHFCVs
-
- Gasoline Hybrid Electric Vehicles
- Gasoline Partial Zero Emission Vehicles
-
- Table 43
-
- Specifications of Typical GHEVs
-
- 97
- 086
-
- 42 OVERVIEW OF FACTORS THAT CAUSE COSTS TO DECLINE
-
- Production Scale Economies
- Learning
- Technological Advances
- How Cost Reduction Factors Enter Our Analysis
-
- 43 COMPONENT COSTS OF BATTERY-POWERED ELECTRIC VEHICLES AND GASOLINE HYBRID ELECTRIC VEHICLES
-
- Battery Modules and Auxiliaries
-
- Figure 42mdashNiMH Module Cost as a Function of Prod
- Figure 43mdashPbA Module Cost as a Function of Produ
-
- Table 44
-
- EV Battery Module Costs($ per kWh)
-
- Table 45
-
- EV Battery Auxiliary Costs($ per kWh)
-
- Motors and Controllers
-
- Figure 44mdashDC Motor Cost as a Function of Product
-
- Table 46
-
- Estimate of High-Volume Costs for 53-kW DC Motor 67-kW AC Motor and 70-kW DC and AC Motor Controllers($)
-
- Motor
- Motor Controller
-
- Figure 45mdashCombined Cost of 50-kW Motor and Motor
-
- Table 47
-
- Motor and Motor Controller Costs for Full-Function EVs and City EVs ($ per motor and controller)
-
- EV Transmission and Other EV Auxiliaries
- Integrated Charger
- Savings From Exclusion of Internal Combustion Engine Vehicle Components
-
- Table 48
-
- Breakdown of Current and Potential Power Needs of an ICEV
-
- 44 COMPONENT COSTS OF DIRECT HYDROGEN FUEL-CELL VEHICLES
-
- Overview of Recent Studies on PEM Fuel-Cell Systems
-
- Table 49
-
- Summary of Studies on Fuel-Cell Costs
-
- MR1578_ch4B_Finalpdf
-
- Figure 46mdashPEM Fuel-Cell System Costs as a Functi
- Fuel-Cell Components
-
- Table 410
-
- Platinum Loading in Membrane Electrode Assembly
-
- Hydrogen Tank for a Fuel-Cell Vehicle
- 45 PZEV COSTS
-
- Figure 47mdashCost of Tank That Stores 4 kg of Hydro
-
- 46 INCREMENTAL VEHICLE PRODUCTION COSTS
-
- Multipliers Used to Calculate Indirect Costs
- Incremental Vehicle Production Costs
-
- Table 411
-
- Breakdown of Manufacturerrsquos Suggested Retail Pric
-
- Table 412
-
- Incremental Vehicle Production Costs (relative to an ICEV meeting SULEV exhaust and near-zero evaporative emission standards) (estimated ranges in brackets $1000s per vehicle)
-
- NiMH
- City EV
- NiMH
-
- 47 INCREMENTAL LIFECYCLE COSTS
-
- Parameters Used to Estimate Incremental Lifecycle Costs of Full-Function and City EVs
-
- Table 413
-
- Parameters Used to Calculate Lifetime Operating Cost of a Full-Function EV Relative to a Comparable ICEVa
-
- Initial Vehicle Cost ($) (including first battery and off-board charger)
- Vehicle Life
- Parameters Affecting Battery Replacement Cost
- Parameters Affecting Fuel Costs
- Discount Rate ()
-
- Table 414
-
- Parameters Used to Calculate Lifetime Operating Cost of a City EV Relative to a Comparable ICEVa
-
- Initial Vehicle Cost ($) (including first battery and off-board charger)
- Vehicle Life
- Parameters Affecting Battery Cost
- Parameters Affecting Fuel Costs
- Other Costs
- Discount Rate ()
-
- Parameters Used to Estimate Incremental Lifecycle Costs of DHFCVs
-
- Table 415
-
- Parameters Used to Calculate Lifetime Operating Costs of a DHFCV Relative to a Comparable ICEVa
-
- Initial vehicle cost ($)
-
- Parameters Used to Estimate Incremental Lifecycle Costs of GHEVs
-
- Table 416
-
- Parameters Used to Calculate Incremental Lifecycle Cost of a GHEV Relative to a Comparable ICEVa
-
- Initial vehicle cost ($) (including first battery and off-board charger)
-
- Method for Calculating Incremental Lifecycle Costs
- Findings on Incremental Lifecycle Costs
-
- Table 417
-
- Incremental Lifetime Operating and Lifecycle Costs of Advanced Technology Vehicles (incremental over a vehicle meeting SULEV and near-zero evaporative emission standards) ($1000s per vehicle 90 percent probability intervals in brackets)a
-
- NiMH
- City EV
- NiMH
-
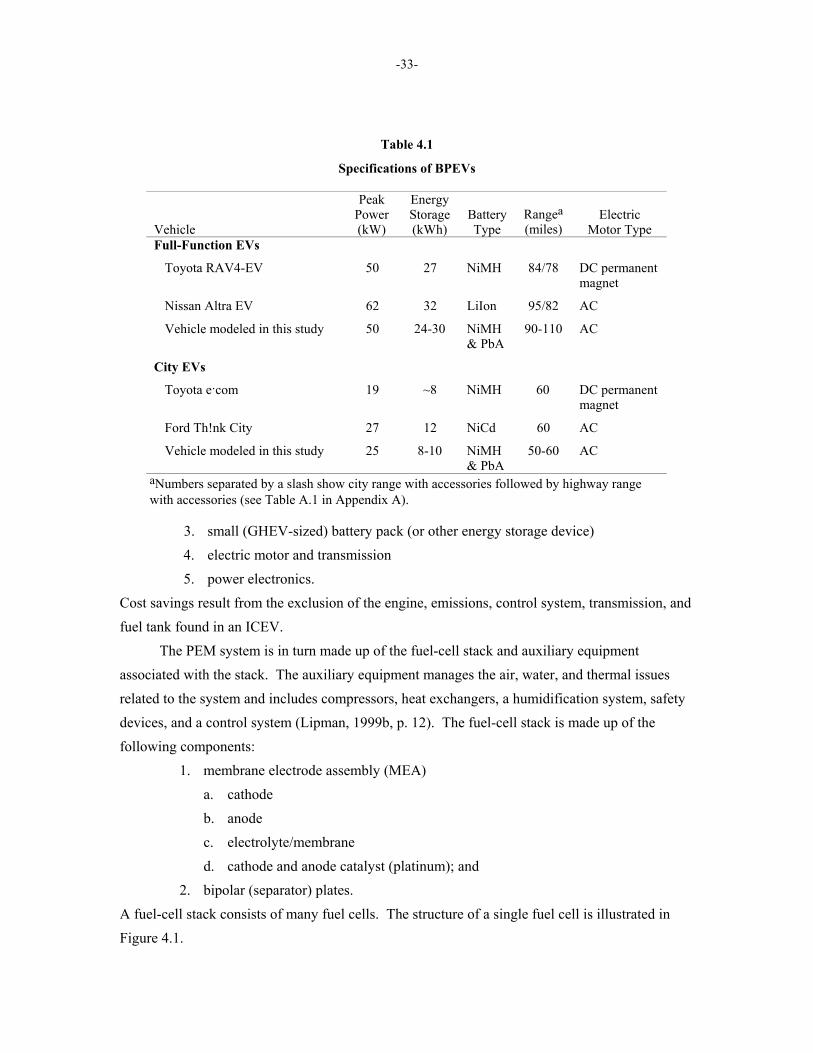
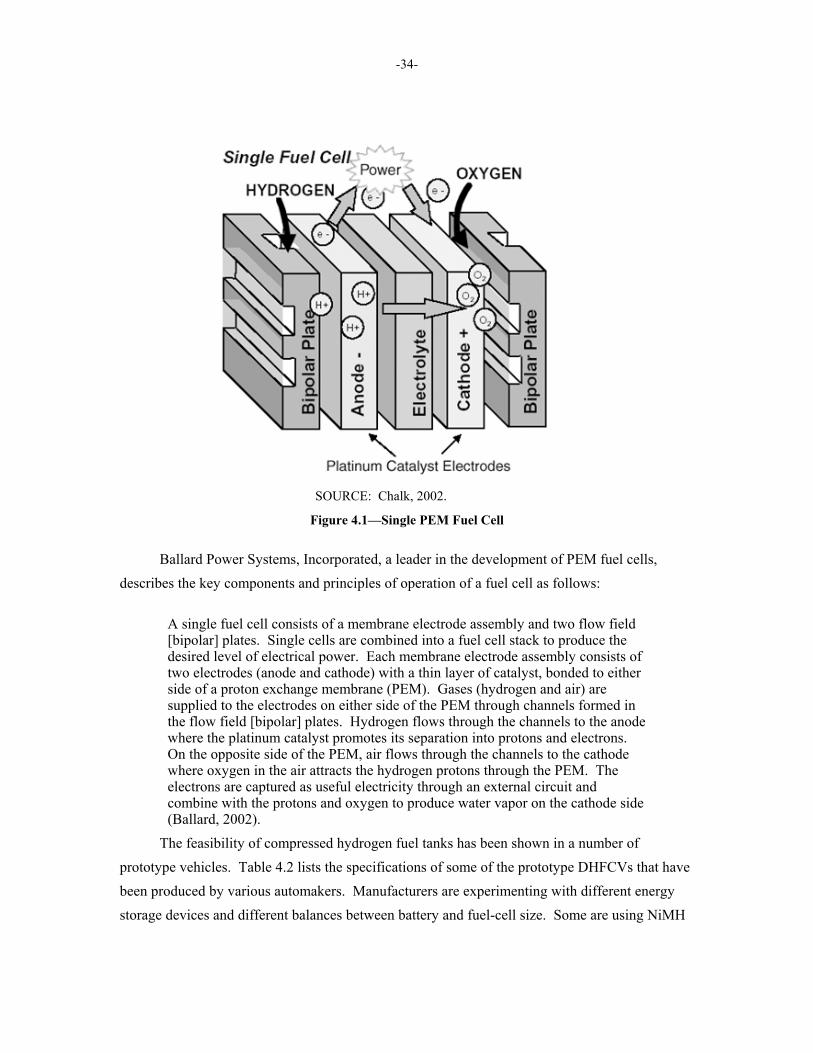
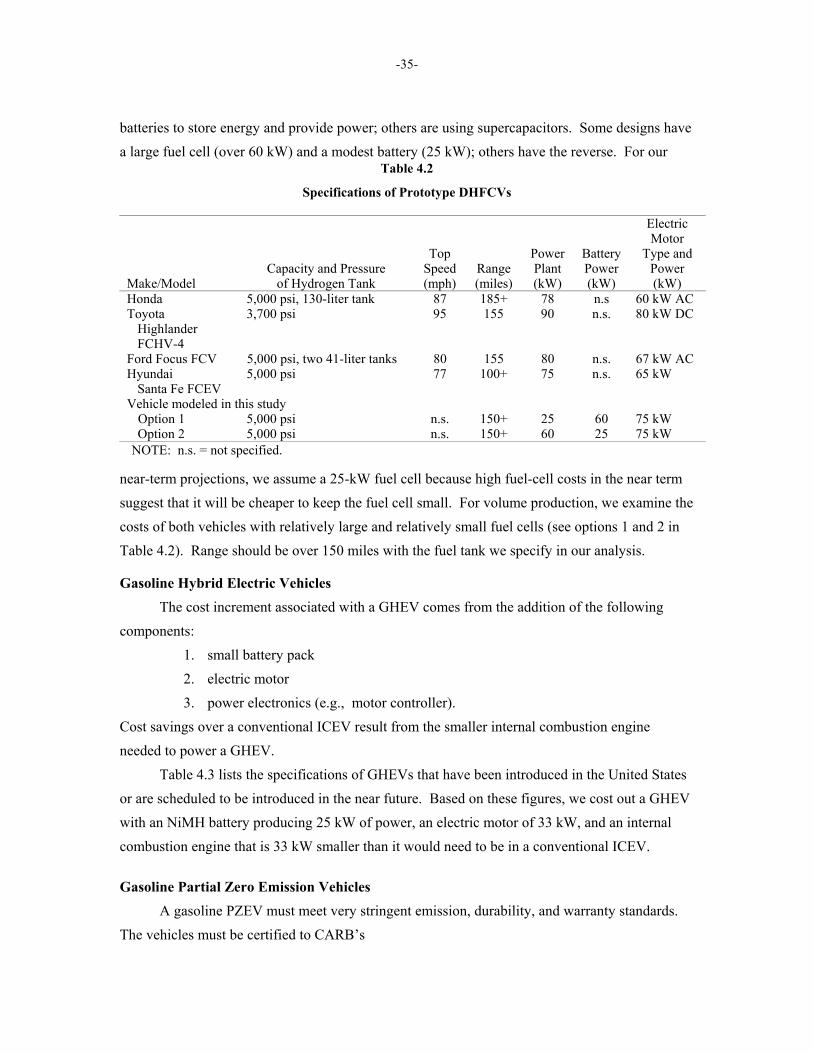
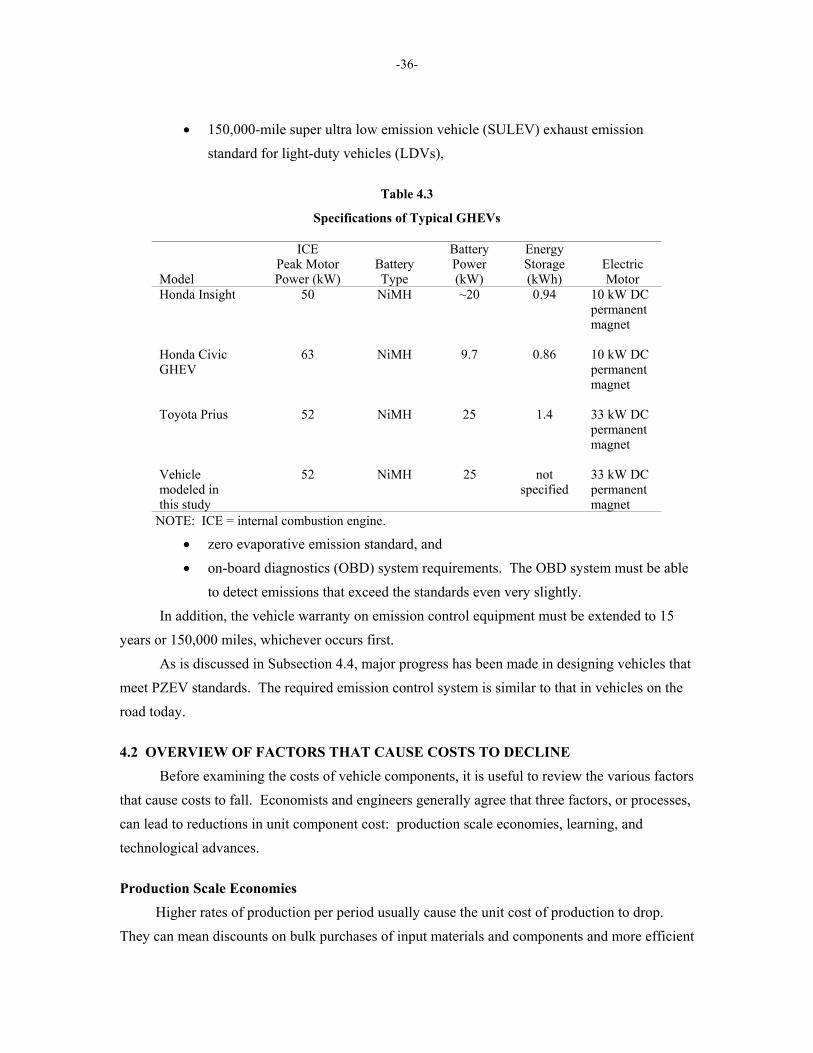
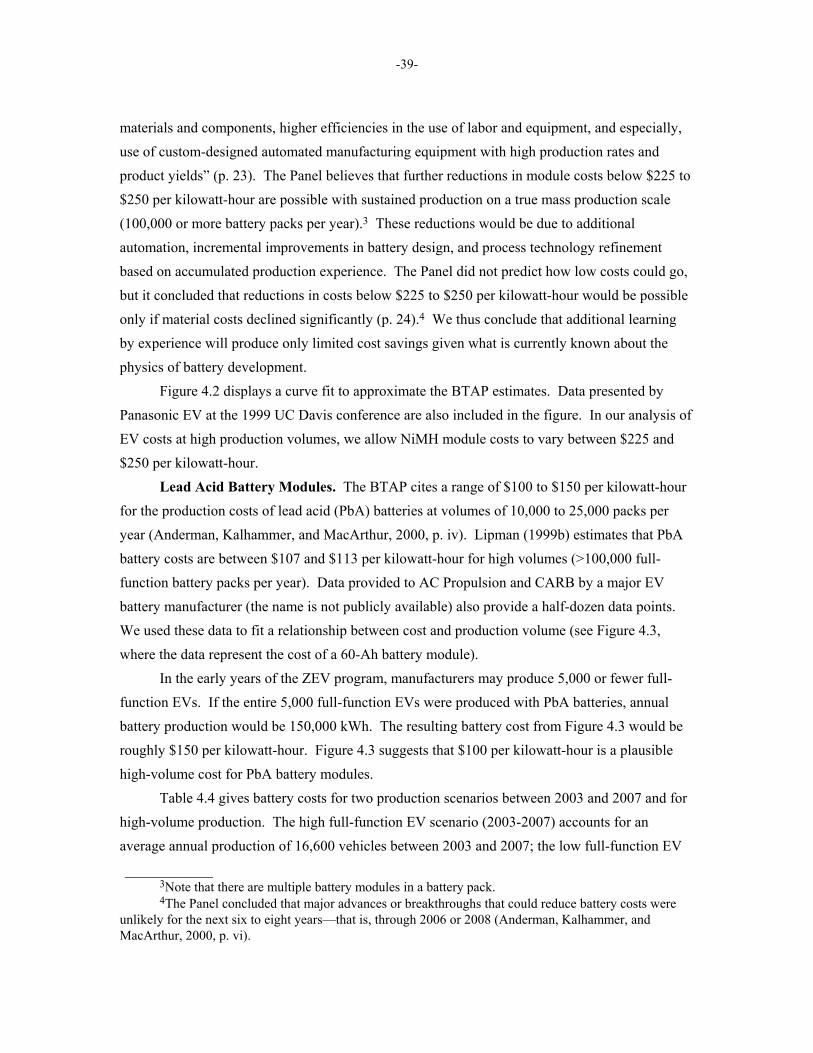
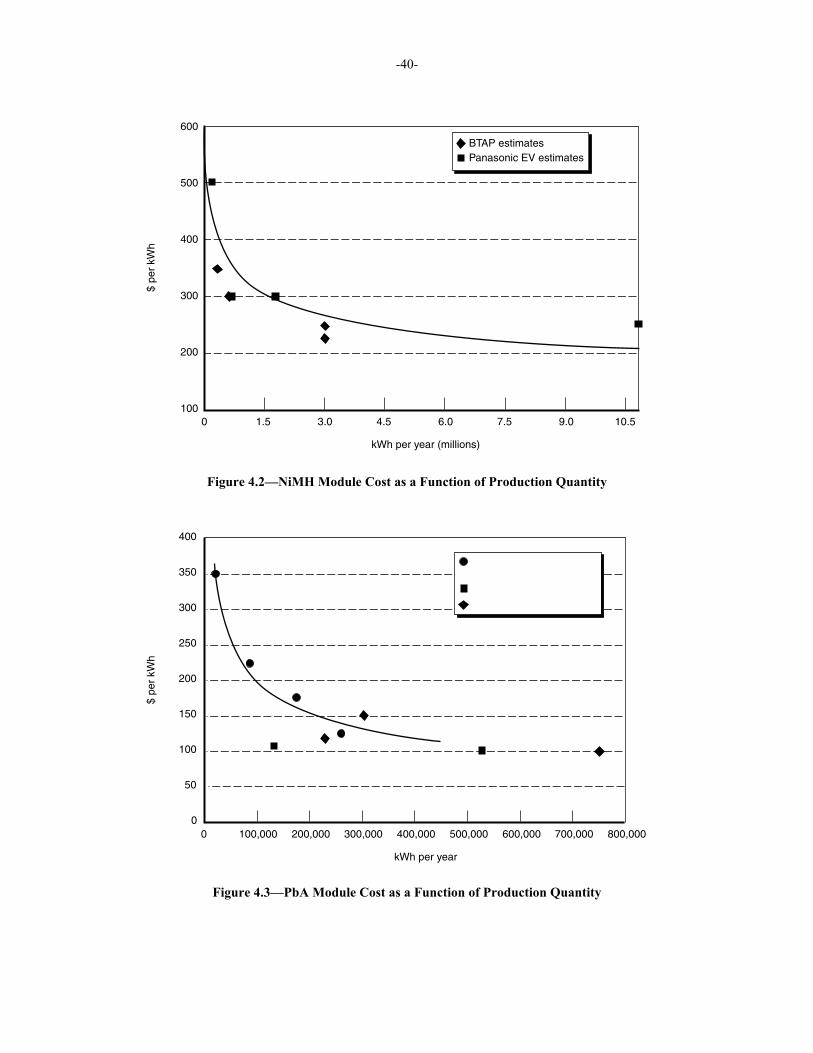
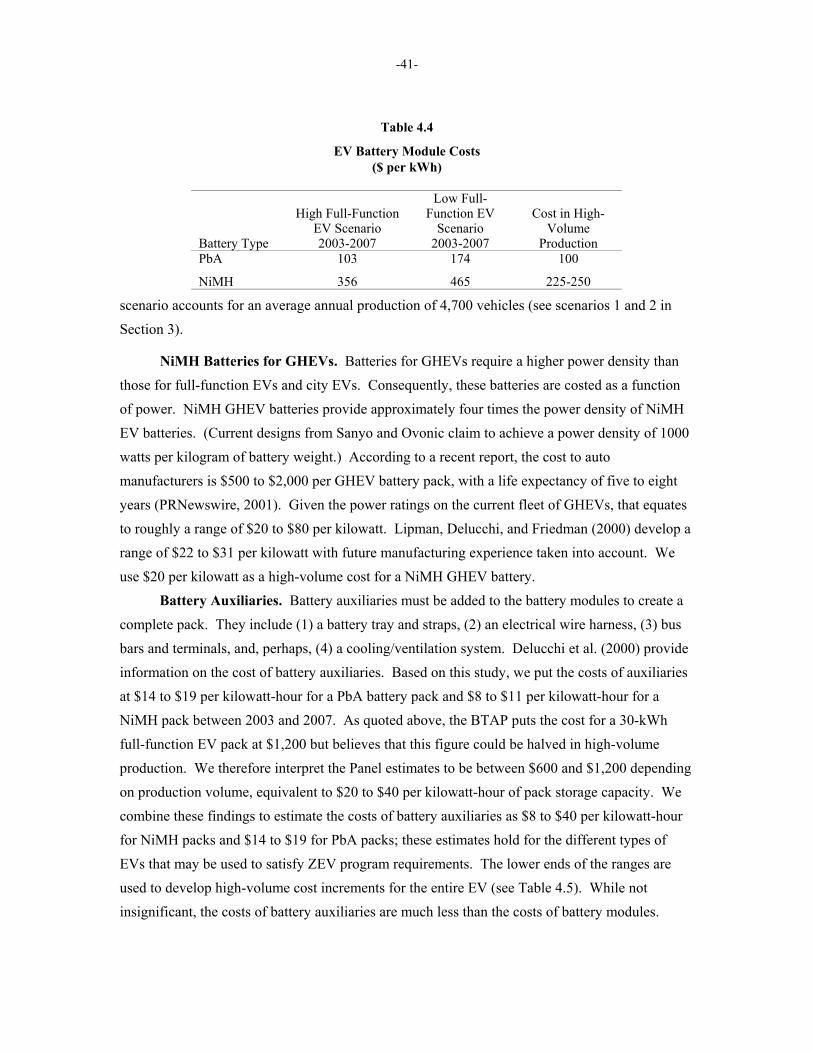
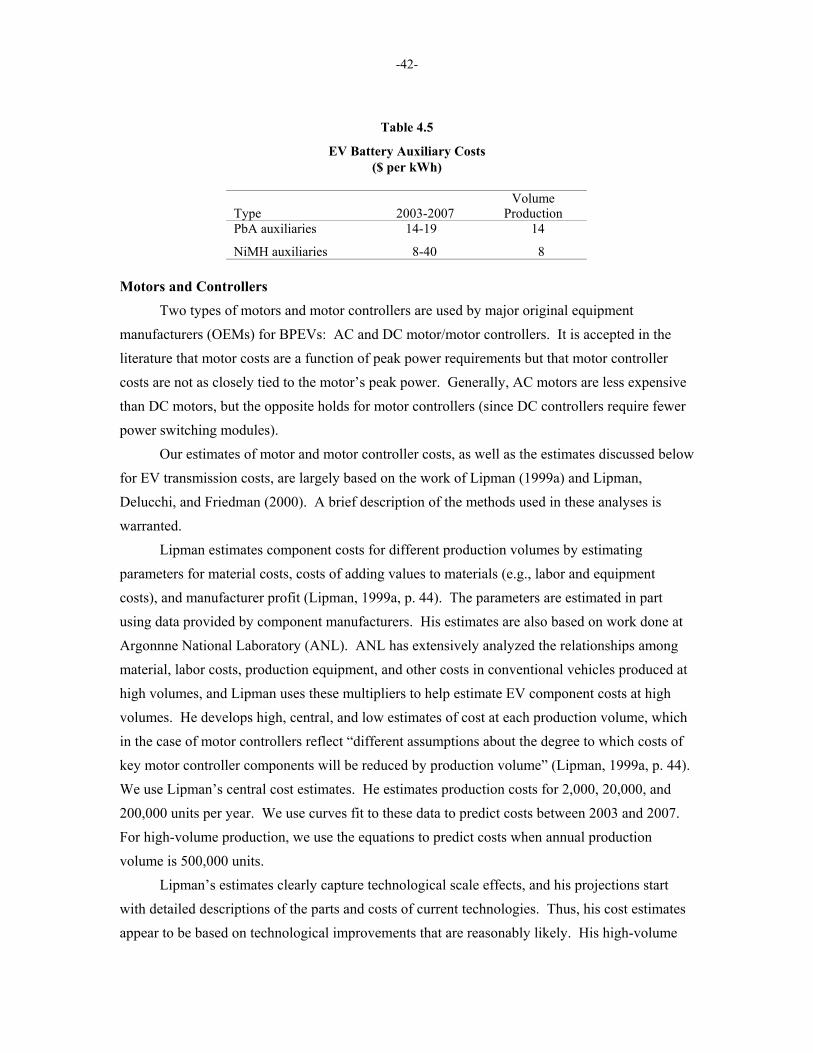
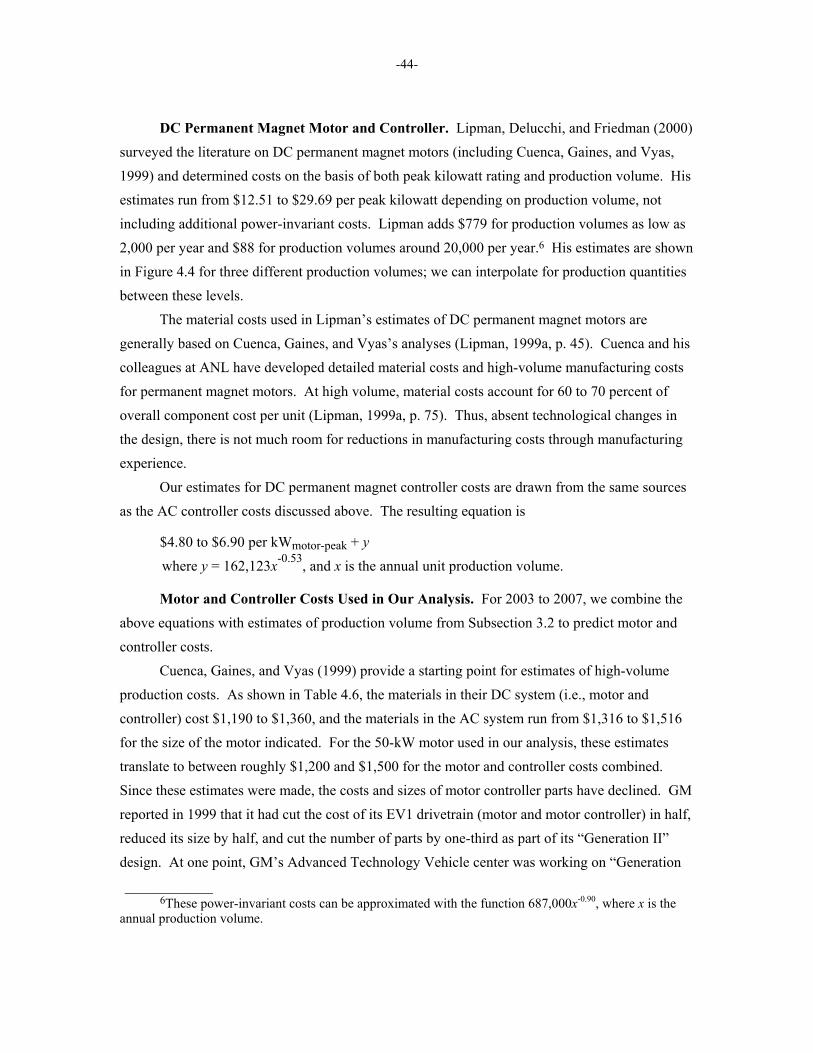
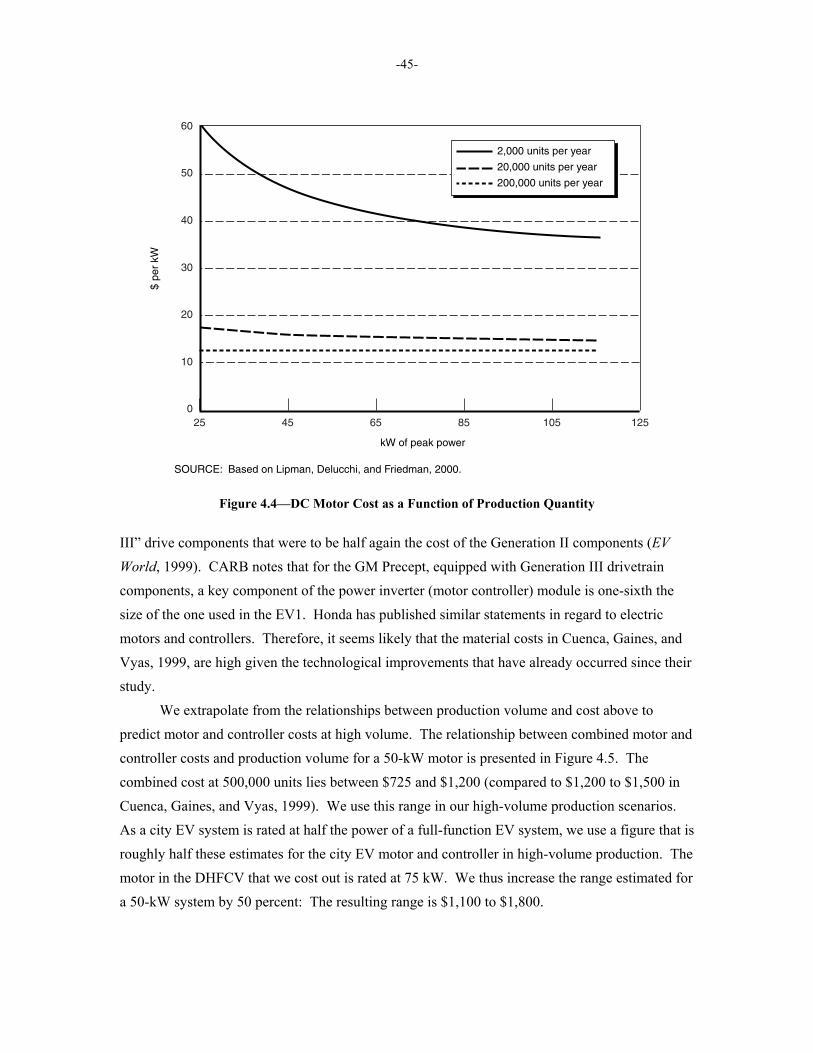
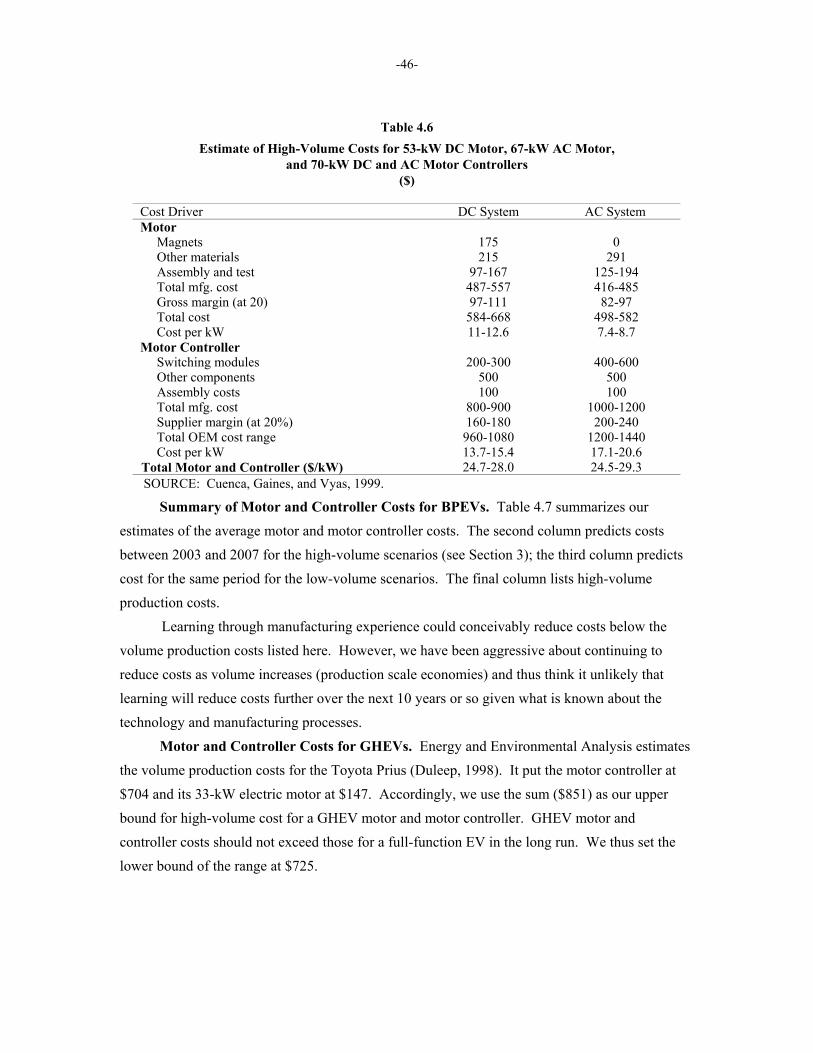
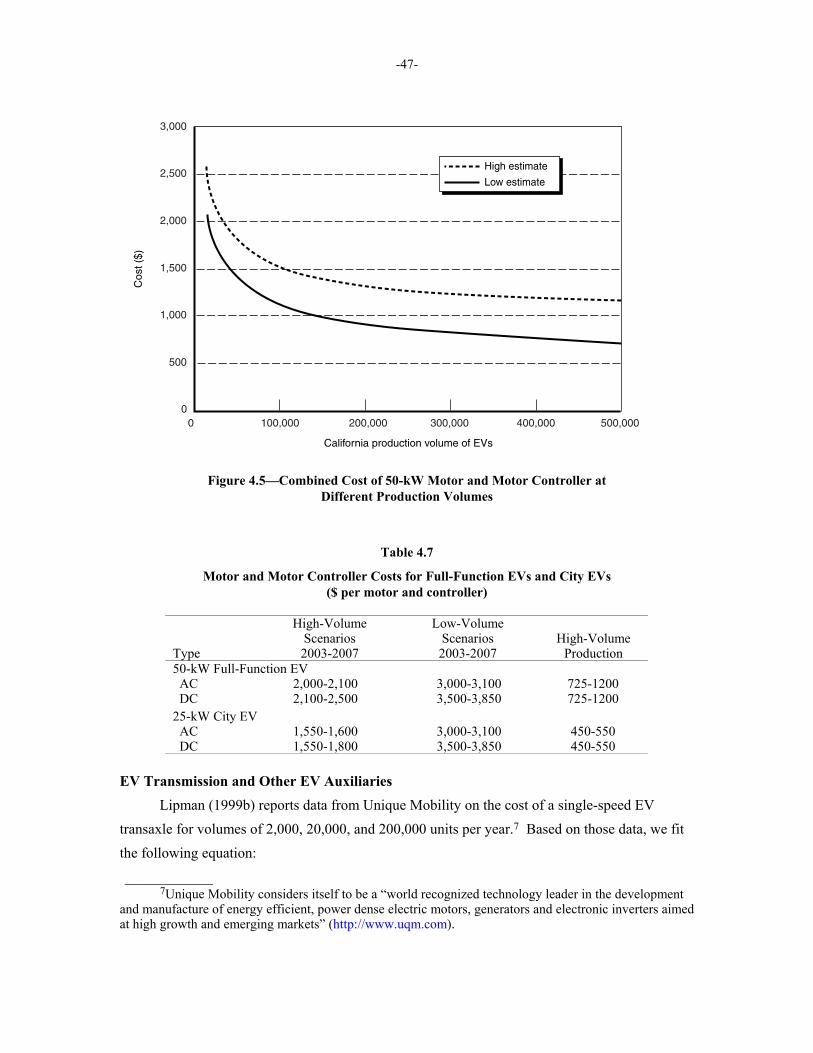
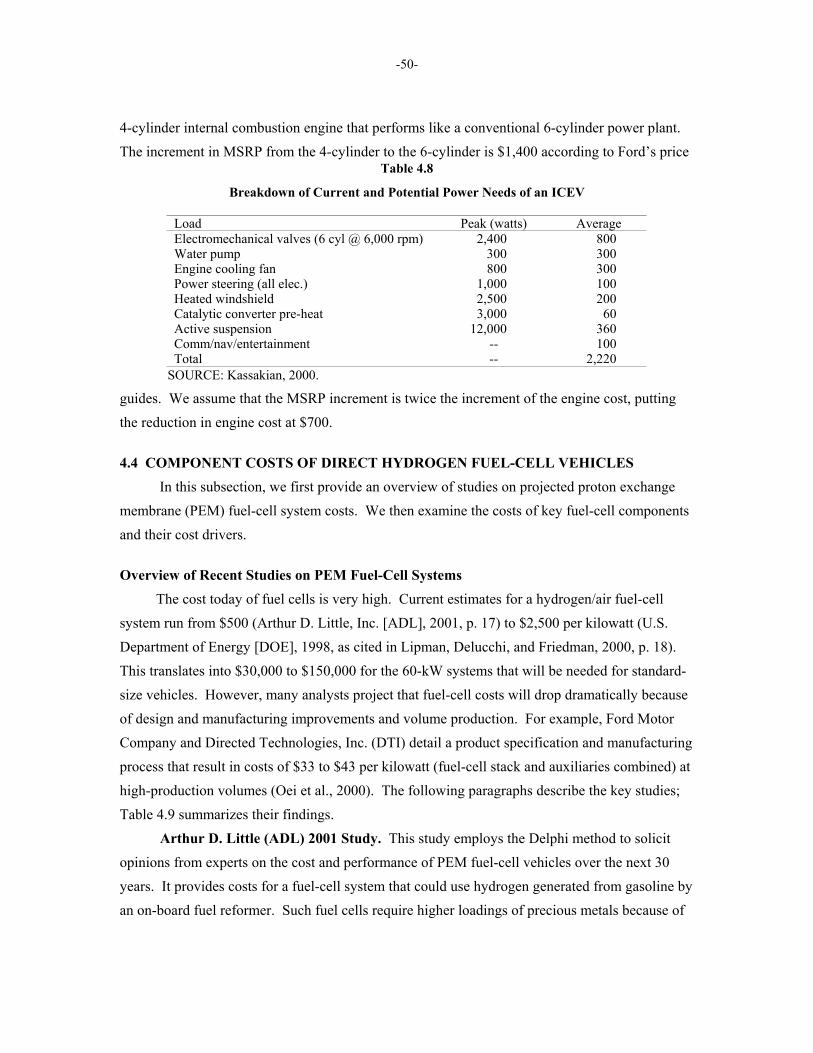
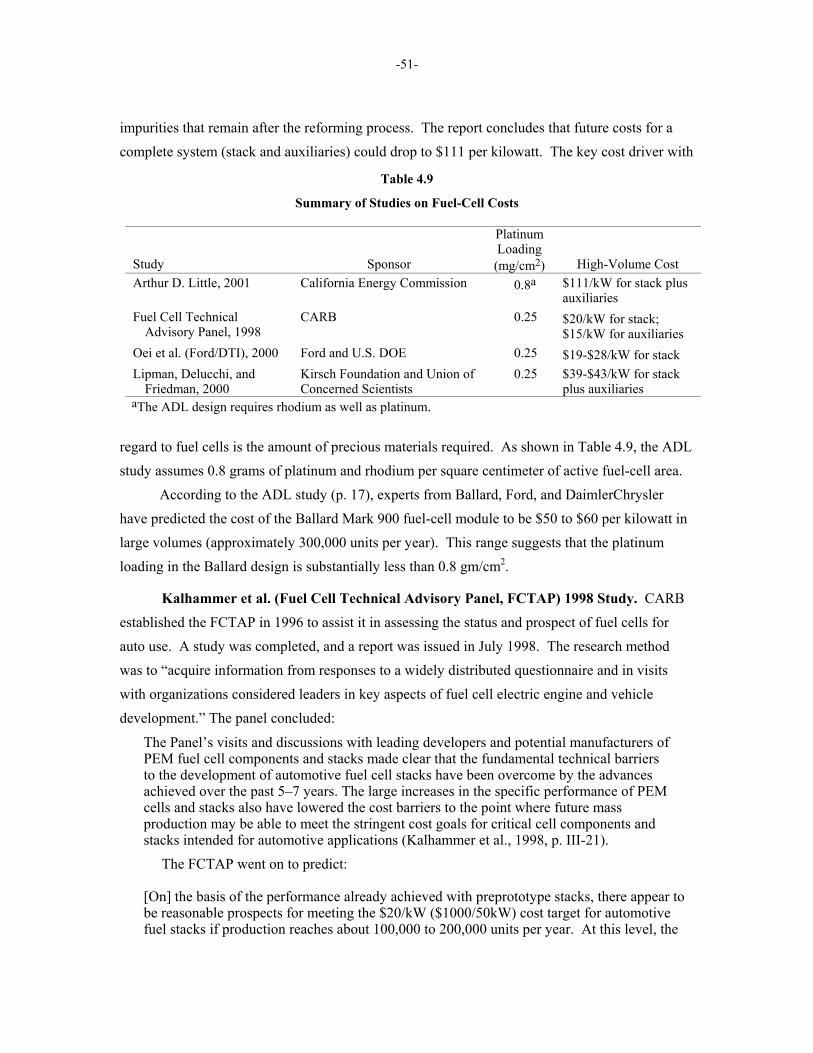

-52-
most critical stack componentsmdashmembrane MEA and separator platemdashwill reach production volumes that justify true mass manufacturing methods (Kalhammer et al 1998 p III-54)
-52-
Oei et al (FordDTI) 2000 Study This study considers four detailed designs and assesses the cost based on high-volume production (500000 units per year) with cost reductions gained by applying DFMA (design for manufacturing and assembly) techniques The DFMA process has been formally adopted by Ford as a systematic means for the design and evaluation of cost-optimized components and systems It combines historical cost data and manufacturing acumen accumulated by Ford since the earliest days of the company (Oei et al 2000 p 3-1)
FordDTI project that costs for PEM stacks will range from $19 to $28 per kilowatt in high-volume production The range is due to the overall stack power rating (eg 60 to 80 kW) Costs include material manufacturing and assembly costs as well as markups to reflect profit scrap RampD and administrative costs
As we discuss in more detail below the Ford design incorporates a number of well-researched but still untested features Learning through manufacturing experience could reduce costs further but Lipman notes that ldquothe estimation methodology used by DTI was specifically designed to identify the lowest cost PEM stack design configuration and the choice of a production volume of 300000 units per year suggests that it would be difficult to construe a lower cost caserdquo (Lipman Delucchi and Friedman 2000 p 19) In Ford and DTIrsquos view further cost reductions will require important technological advances They conclude that further cost reductions will require a reduction in platinum catalyst loading or in gas diffusion electrode costs because the costs of other components are based on ldquomaturerdquo manufacturing technologies (Oei et al 2000 p 3-47)
Lipman Delucchi and Friedman 2000 Study To project fuel-cell costs in the near term Lipman Delucchi and Friedman use an experience curve which is a way to relate unit cost (in this case $kW) to cumulative production They start with a cost of $2000 per kilowatt and 5000 kW of cumulative production in 2006 (p 19) costs then decline 22 percent for each doubling of production (this corresponds to a 78 percent experience curve) They note that experience curves typically range from 70 to 90 percent10 Costs decline until they reach a lower bound based on DTIrsquos estimates Lipman Delucchi and Friedman reduce cell peak power density roughly 15 percent from that assumed by DTI and arrive at a lower bound of $39 to $43 per kilowatt for the stack and auxiliaries combined
Figure 46 illustrates the experience curve of Lipman Delucchi and Friedman for a 25-kW PEM fuel-cell system As cumulative production increases costs fall rapidly and approach $60 per kilowatt ____________
10Note that these experience curves are for the successful products For many products the technology or costs did not allow commercial production that was long enough for an experience curve to be observed
-53-
25000 75000 125000 175000 225000 275000
SOURCE Based on Lipman Delucchi and Friedman 2000
0
50
100
150
200
250
$ pe
r kW
Worldwide cumulative production of DHFCVs (in thousands)
Figure 46mdashPEM Fuel-Cell System Costs as a Function of
Accumulated Production Quantity
Fuel-Cell Components Membrane Electrode Assembly Cost and Design The biggest contributor to the cost of
a PEM fuel-cell stack is the platinum (which serves as a catalyst) Platinum accounts for a significant portion of the MEA cost in any design For the design specified in the FordDTI study (Oei et al 2000) the cost of the platinum represents 75 percent of the total cost of the MEA
Table 410 compares the platinum loading in the MEA for the relevant studies The ADL 2001 study assumes a design with a large amount of platinum (08 mgcm2) which easily accounts for half of the MEA cost All the other studies assume far less for future-year designs DOE claims a breakthrough of 015 mgcm2 for experimental MEAs in laboratory quantities from a 3M design11 The FordDTI study (Oei et al 2000) assumes 025 mgcm2 and the FCTAP study (Kalhammer et al 1998) cites designs that range from 025 to 035 mgcm2 A Los Alamos National Laboratory study (LANL 2002) describes PEM fuel cells with low platinum loads (011 and 015 mgcm2) that have been tested to 4000 hours One reason that the ADL studyrsquos loading ____________
11In June 2001 DOE announced that 3M was selected for a $77 million cost-shared contract to develop MEAs with improved cathodes high-temperature membranes and optimized gas diffusion layers Improved flow fields and MEA fabrication processes will also be developed
-54-
Table 410
Platinum Loading in Membrane Electrode Assembly
Study
Platinum Loading (mgcm2)
MEA Cost in High Volume ($kW)
Comment Arthur D Little 2001 08 -- Assumes platinum is $1350gm Oei et al (FordDTI) 2000 025 10-11 Assumes platinum is $1286gm Los Alamos National Laboratory 2002 011-015 -- -- Kalhammer et al (FCTAP) 1998 Designs reviewed
Gore 03 -- -- Johnson Matthey 035 lt15 -- 3M 025 5-10 Assumes production of gt1 million m2yr
is much higher is that it is based on a fuel cell that can accept hydrogen reformed from gasoline or methanol Such fuel cells likely require more platinum and also rhodium to protect against impurities that remain after the reforming process A DHFCV is less susceptible to this type of catalyst poisoning so lower catalyst loadings are possible
These studies suggest that it is highly likely that an MEA with 025 mgcm2 can be built for automotive use and we have adopted this catalyst loading in our analysis Information on the durability of such cells is not publicly available It is possible that the Ballard fuel-cell system currently being tested by Toyota and GM and the fuel cell in Hondarsquos vehicles contain levels approaching 025 mgcm2 but such data are not publicly available Even if the levels in these cells are near 025 their real-world durability is still being investigated We thus cannot be entirely sure that fuel cells with 025 mgcm2 of platinum will work for automotive use Designs with even lower loadings however suggest that 025 mgcm2 is not a wildly optimistic assumption
The low MEA cost in the FordDTI study (Oei et al 2000) is based on a number of other design features that are well documented and researched but have not yet been produced For example FordDTI propose a composite polymer electrolyte membrane rather than conventional homogeneous membranes (p 3-5) The projected cost savings are 98 percent of current homogeneous membrane costs The electrodes in the FordDTI study are constructed from an advanced carbon paper that is still under development (p 3-11) Highly automated manufacturing techniques are used that might not pan out as well as envisioned FordDTI did however build some cushion into their estimates For example projected costs are inflated by 10 percent to ensure ldquoappropriate conservatismrdquo (p 3-44) and the lowest projected advanced carbon paper costs were not used (p 3-14) FordDTI believe their projections are based on ldquoaccepted manufacturing techniques and realistic technical parametersrdquo (p 3-19) In their view the projections would require a minimum of technological advancement (p 3-46)
-55-
FordDTI conclude that the MEA for a direct hydrogen fuel-cell stack can be built for $10 to $11 per kilowatt at high-volume production CARBrsquos FCTAP concludes that costs could run from $5 to $10 per kilowatt
Bipolar Plate Cost and Design The role of the bipolar plate (also called the separator plate) is to provide support for the fuel-cell membrane as well as to uniformly distribute the hydrogen on one side of the membrane and the oxygen on the other side The plate also has a role in conducting heat to allow for proper cooling It must be corrosion resistant and able to operate under pressure (Dayton 1999 Bulk Molding Compounds Inc 2001)
The FCTAP 1998 study cites a variety of approaches and designs for bipolar or separator plates as well as uncertainty as to the cost of this component A number of different types of materials could be used for the bipolar plates but the four main considerations are
1 corrosion-resistant metals 2 coated metals 3 carbongraphite 4 compatible polymers The FordDTI study assumes a metallic bipolar plate made of 316 stainless steel (which
contains high percentages of chromium nickel and molybdenum) This study considers two types of cell construction a three-piece design and a cheaper unitized (one-piece) separator plate An earlier ADL study (ADL 2000) assumes the use of a molded graphitepolymer composite bipolar plate the plate is molded into two pieces and bonded together
The FCTAP study does conclude that at least one developer could provide a design that allows the cost of the bipolar plate to be $5 per kilowatt
No stack developer appears to have made a final choice but several approaches look promising including embossing of impregnated porous carbon molding of commercially available carbon composites (Energy Partners) embossing of coated metal plates (Allied Signal Siemens) and perhaps bonding of appropriately shaped metal sheets (H-Power) At present confident estimates of separator plate costs are still lacking However the approaches under development were all selected for their potential to permit low-cost mass manufacturing of plates from inexpensive materials lending credibility to the $5kW cost projected by a leading developer (Kalhammer et al 1998 III-24)
Oak Ridge National Laboratory reports that it is working on a design envisioned to meet a cost goal of $10 per kilowatt The design being considered is one with thin metallic plates (thinner than a few millimeters) that uses carbon composites instead of graphite which is more costly to work with (Fuel Cell Catalyst 2001)
-56-
Fuel-Cell Auxiliaries Auxiliaries are devices that manage air water and other thermal issues In addition control electronics are required The cost of the auxiliary equipment supporting a fuel-cell stack has to be considered Fewer studies project costs for this part of a fuel-cell system Auto industry goals are $20 per kilowatt DTI (1998) assesses them to be $14 to $15 per kilowatt ADL concludes that the balance of plant costs in high-volume production for a gasoline-fueled PEM fuel cell would be $10 per kilowatt of stack power (ADL 2000)
Summary of Fuel-Cell System Costs It seems likely that DHFCVs will be available in only very small numbers through 2005 (see Subsection 31) We base our fuel-cell system costs between 2006 and 2010 on the manufacturing experience curve developed by Lipman Delucchi and Friedman (2000) Our estimates of fuel-cell system costs for this period run from $100 to $150 per kilowatt For high-production volumes we use $35 to $60 per kilowatt The lower bound reflects $20 per kilowatt for the fuel-cell stack and $15 for the auxiliaries FordDTI (Oei et al 2000) predict stack costs between $18 and $28 and we use $20 which is the low cost for the intermediate-size stacks likely in automotive applications The upper bound is based on estimates that the Ballard Mark 900 fuel cell will cost $50 to $60 per kilowatt in volume production
Our review of the literature led us to conclude that the projections that fuel-cell system costs can fall to $35 to $60 per kilowatt in volume production are well grounded Costs might be even lower if the very low platinum designs currently being investigated pan out However it is too early to tell if this will be the case Manufacturing experience may also reduce costs although additional reductions may not be large because most of the nonmaterial costs have been squeezed out by mature manufacturing techniques However a number of uncertainties remain Unexpected technological or production problems may arise and the durability of automotive fuel cells has not been extensively tested in demanding real-world environments We use this range for volume production costs in our analysis but note that much remains to be done to demonstrate that these low production costs can actually be realized
Hydrogen Tank for a Fuel-Cell Vehicle We considered the cost of the ldquonovel polymer-lined cylindersrdquo described by Thomas et al
(1999) Lipman Delucchi and Friedman (2000) estimate their cost to be $510 per kilogram of hydrogen stored at 350 atmospheres (5000 psi) based on current prices for compressed natural gas tanks Lipman cites a DTI study on high-volume production of such tanks to estimate a lower bound cost of $84 to $163 per kilogram of stored hydrogen This translates to $336 to $652 for a tank that stores 4 kg We use this cost range in our estimates of high-volume costs For the near
-57-
term we use the relation between cost and cumulative volume postulated by Lipman Delucchi and Friedman (2000)12 Figure 47 shows the resulting relationship for a 4-kg tank
45 PZEV COSTS CARB reviewed various technological approaches to PZEVs and concluded that the
incremental cost relative to a vehicle meeting the SULEV exhaust and near-zero evaporative standards was minor
[C]onfidential information from several manufacturers indicates that PZEVs soon to be introduced for sale in California will use a simpler and much less costly combined HC adsorbercatalyst rather than a separate adsorber and an attendant switching valve as had been assumed earlier Further the new information indicates that additional catalyst volume will not likely be required as was the case in the first PZEV system certified for sale in California Manufacturers will still face some increased cost to build increased durability into the emission control components (eg increased catalyst loading) in order to avoid excessive repair costs during the 150000 mile emission warranty period Based on the information acquired by staff some additional carbon trap capability will be added along with improved seals and reconfiguration of some components that do not add large cost The cost of going to a zero evaporative system from the near zero systems is now estimated to be $10 per vehicle Taking all of these factors into account staff now estimates that the necessary hardware modifications to meet PZEV requirements will range from $60 to $85 per vehicle (CARB 2001d p 5)
These estimates are for passenger cars and the smallest category of light-duty trucks (LDT1)13 The additional warranty requirements of PZEVs will range between $125 and $150 per
vehicle according to CARB estimates It is unlikely that all these costs represent incremental costs of PZEVs To some extent the warranty causes a transfer of the costs of maintaining the vehicle from consumers to producers and thus does not change the overall resource costs of PZEVs PZEVs may however cost more to maintain over their lifetimes because of the tighter emission standards The proportion of the warranty that represents a transfer of costs from consumers to producers also depends on the stringency of Californiarsquos inspection and maintenance (Smog Check) program A less stringent program requires fewer problems to be repaired in the absence of a warranty so a larger fraction of the warranty costs are true resource costs Given these uncertainties we vary resource costs due to the extended warranty from $0 to $150 per vehicle This range assumes from none to all of the increased warranty costs represent transfers from consumers to automakers Thus our estimate of the incremental cost of a PZEV
____________
12Tank cost = 321x-02318 where x is cumulative production volume 13Paul Hughes CARB personal communication May 2002
-58-
0
100
200
300
400
500
600
700
800
SOURCE Based on Lipman Delucchi and Friedman 2000
Tank
cos
t ($)
Cumulative production volume (in millions)
0 432 651
Figure 47mdashCost of Tank That Stores 4 kg of Hydrogen as a Function
of Production Quantity
relative to a SULEV meeting the near-zero evaporative emission standards ranges from $60 to $235
We have not been able to examine in detail the basis for CARBrsquos PZEV cost estimates Earlier CARB estimates were higher In August 2000 CARB put the incremental costs of a PZEV (relative to a SULEV) at $500 (CARB 2000b p 106) The design improvements outlined above make a plausible case for the reduced estimates but further analysis is warranted
46 INCREMENTAL VEHICLE PRODUCTION COSTS So far we have discussed the costs of individual vehicle components To calculate the
incremental production costs of vehicles that manufacturers may use to meet ZEV program requirements we subtract the costs of components associated with the conventional ICEV and add in the costs of components associated with each vehicle technology14 Indirect costs associated with each of the components are also dropped and added and we account for changes in these costs (eg corporate overhead warranty and normal profit) Here we first detail the ____________
14As an alternative to this approach one could also build costs of various vehicles from the ground up and then compare the resulting total vehicle costs Delucchi et al (2000) use such an approach
-59-
indirect cost multipliers used in our analysis We then present estimates of the incremental costs of ZEVs ATPZEVs and PZEVs
Multipliers Used to Calculate Indirect Costs Analysis of indirect costs is usually framed in terms of the difference between
manufacturing cost and final manufacturerrsquos suggested retail price (MSRP) Vyas Cuenca and Gaines (1998) break down the components of MSRP and show that the direct manufacturing cost accounts for half of the price (see Table 411) A later report (Cuenca Gaines and Vyas 1999) proposes multipliers to translate vehicle cost to vehicle price Depending on the component the multipliers range from 115 to 20 115 to 13 for the battery pack 15 for all other components supplied to the auto manufacturer and 20 for components developed solely by the auto manufacturer (eg the internal combustion engine) We use these estimates in our analysis For battery packs and fuel-cell systems 115 and 130 are used in calculations of the lower and upper bounds respectively of the cost ranges projected for each production volume scenario15
Incremental Vehicle Production Costs
Estimates of the incremental production costs of the various low-emission vehicles and ZEVs are presented in Table 412 Costs are incremental to a standard ICEV that meets the SULEV exhaust standard and the near-zero evaporative emission standard The second column presents estimates of the range into which incremental production costs are likely to fall on average between 2003 and 2007 if annual production volumes are at the low end of the ranges specified in Subsection 32 The third column presents the range if annual production volumes are at the high end of the ranges specified in Subsection 32 The last column reports incremental costs in volume production Breakdowns of volume production costs for each vehicle technology are presented in Appendix C as is an analysis of the sensitivity of the incremental cost of full-function EVs to changes in peak motor power and battery pack size
As discussed above the incremental costs of a PZEV are modest GHEVs will likely cost several thousand dollars more to produce during the first five years of the program Costs come down in high-volume production but are still expected to exceed standard ICEV costs by $500 to $900 per vehicle BPEVs will be much more expensive to produce during the initial years of the program Incremental production costs including the cost of the first battery pack for a full-function EV using NiMH batteries range from $16700 to $26100 Incremental costs for PbA ____________
15CARBrsquos first estimate of PZEV costs included a 10 percent adjustment for indirect costs (CARB 2000b p 106) We assume that CARBrsquos 2001 estimate also includes indirect costs but the indirect cost multiplier is unknown
-60-
Table 411
Breakdown of Manufacturerrsquos Suggested Retail Price for an ICEV
Share of MSRP () Cost CategorySubcategory By Cost Category By Subcategory Production 670
Manufacturing 500 Warranty 50 RampD and engineering 65 Depreciationamortization 55
Selling 235 Distribution 200 Advertising and dealer support 35
Administration and profit 95 Corporate overhead 50 Retirement and health benefits 20 Profit 25
Total 1000 1000 SOURCE Vyas Cuenca and Gaines 1998
Table 412
Incremental Vehicle Production Costs (relative to an ICEV meeting SULEV exhaust and near-zero evaporative emission standards) (estimated ranges in brackets $1000s per vehicle)
Near-Term Costs Vehicle Technology
Low-Volume Scenario
High-Volume Scenario
High-Volume Production
2003-2007 2003-2007 PZEV [006 023] [006 023] [006 023] GHEV [24 33] [23 29] [05 09] Full-function EV NiMH [225 261] [167 198] [51 99] PbA [127 152] [80 96] [18 43] City EV NiMH [120 134] [85 97] [17 34] PbA [86 99] [53 60] [07 15] 2006-2010 2006-2010 DHFCV [114 152] [83 110] [12 39]
batteries and for city EVs are lower but remain very large between 2003 and 2007 Even in volume production production costs remain substantially above those for ICEVs The lowest incremental cost in high-volume production is $700 to $1500 for city EVs with PbA batteries But these numbers should be used with caution because as discussed above there are drawbacks to designing vehicles with PbA batteries DHFCVs will also likely be much more expensive when they are first introduced Because of low production volumes and the developing technology we estimate that the incremental costs of DHFCVs will run from $8300 to $15200 between 2006 and 2010 But in the long run DHFCV technology looks more promising than BPEV technology does Projections based on what is currently known about fuel cells show that
-61-
incremental production costs may come down to $1200 However we cannot rule out the possibility that production costs will remain nearly $4000 above those of an ICEV
47 INCREMENTAL LIFECYCLE COSTS So far we have discussed the incremental production cost of advanced technology vehicles
but their overall social cost also depends on their incremental lifetime operating costs by which we mean the cost of operating and maintaining the vehicle relative to the cost of operating and maintaining a baseline ICEV We add incremental lifetime operating costs to incremental production costs to estimate incremental lifecycle cost
We begin by presenting and justifying the parameters we use to estimate the incremental lifecycle costs starting with full-function EVs and city EVs and then moving to DHFCVs and GHEVs Any incremental lifetime operating costs of PZEVs (due for example to increased warranty costs) are captured in the production costs estimated above Thus the PZEV incremental lifecycle cost is only the incremental production cost After presenting the parameters we discuss the method we use to predict incremental lifecycle costs using these parameters Finally we present the results of the analysis
Parameters Used to Estimate Incremental Lifecycle Costs of Full-Function and City EVs The incremental lifecycle costs of BPEVs are determined by
bull incremental initial vehicle costs (including first battery and off-board charger) bull vehicle life bull replacement costs and salvage value of batteries bull EV and ICEV fuel costs bull EV and ICEV repair and maintenance costs bull charger installation costs bull the discount rate
Table 413 lists the parameters that determine the incremental costs for full-function EVs in each of these areas along with plausible ranges for their values between 2003 and 2007 and when these vehicles are in high-volume production Parameters for full-function EVs using both NiMH and PbA batteries are shown Table 414 lists parameter values for city EVs with both types of batteries We now discuss the rationale for each parameter range
Incremental Vehicle Cost The incremental vehicle costs between 2003 and 2007 and in volume production are taken from Table 412 For both the full-function and the city EVs they include the cost of the first battery pack
-62-
Vehicle Life Using data from the Transportation Energy Data Book and other sources Delucchi et al (2000 p 55) estimate an average vehicle life of 150000 miles In its analysis of
Table 413
Parameters Used to Calculate Lifetime Operating Cost of a Full-Function EV Relative to a Comparable ICEVa
Full-Function EV with NiMH Batteries
Full-Function EV with PbA Batteries
Parameter
2003-2007
Volume Production
2003-2007
Volume Production
Initial Vehicle Cost ($) (including first battery and off-board charger)
16700-26100
5100- 9900
8000-15200
1800- 4300
Vehicle Life Lifetime vehicle miles traveled 150000 150000 150000 150000 Vehicle life in years 15 15 15 15
Parameters Affecting Battery Replacement Cost
Pack size (kWh) 30 24 30 24 Battery cost ($kWh) 305-360 233-258 115-154 114 Cycle life (1000 cycles) 10-15 15 06-10 10 Range (milescycle) 90-110 90-110 90-110 90-110 Cost surcharge for installing
subsequent packs ($installation) 500 500 500 500
Salvage value ($kWh) 0-40 0-40 -15 to 5 -15 to 5 Parameters Affecting Fuel Costs
EV efficiency (mikWh AC) 2-3 25-35 2-3 25-35 ICEV efficiency (migal) 25-30 25-30 25-30 25-30 Electricity price ($kWh) 0035-005 007-009 0035-005 007-009 Gasoline price ($gal) 056-149 056-149 056-149 056-149
Other Costs EV repair and maintenance (
of ICEV costs) 65-70 65-70 65-70 65-70
ICEV maintenance ($mile) 006 006 006 006 Charger installation ($) 500-1500 500 500-1500 500
Discount Rate () 4 4 4 4 aThe comparable ICEV is mid-sized meets the SULEV and near-zero evaporative emission standards and averages 25 to 30 miles per gallon
lifecycle costs CARB assumes that vehicles travel 117000 miles over their lifetimes (CARB 2000b p 98) which is close to CARBrsquos definition of a ldquouseful vehiclerdquo life rather than actual miles driven before a vehicle is retired Thus for a full-function EV we set lifetime miles traveled at 150000 miles CARB also assumes a vehicle life of 10 years we set vehicle life to 15 years to correspond to the higher lifetime miles traveled that we assumed in our analysis
Because of the limited top speed and range of city EVs they are unlikely to be driven as far on average as full-function EVs over their lifetimes Based on the National Personal Transportation Survey Reuyl and Schuurmans (1996) estimate that vehicles with a daily range of 50 to 60 miles can be used for 50 percent of the miles driven by the average driver We thus
-63-
assume that city EVs will be driven 75000 miles over their lifetimes CARB assumes 88000 (2000b p 113)
Table 414
Parameters Used to Calculate Lifetime Operating Cost of a City EV Relative to a Comparable ICEVa
City EV with NiMH Batteries
City EV with PbA Batteries
Parameter
2003-2007
Volume Production
2003-2007
Volume Production
Initial Vehicle Cost ($) (including first battery and off-board charger)
8500-13400 1700ndash3400 5300-9900
700-1500
Vehicle Life Lifetime vehicle miles traveled 75000 75000 75000 75000 Vehicle life in years 15 15 15 15
Parameters Affecting Battery Cost Pack size (kWh) 10 8 10 8 Battery cost ($kWh) 305-360 233-258 115-154 114 Cycle life (1000 cycles) 10-15 15 06-10 10 Range (milescycle) 50-60 50-60 50-60 50-60 Cost surcharge for installing
subsequent packs ($installation) 250 250 250 250
Salvage value ($kWh) 0 to 40 0 to 40 -15 to 5 -15 to 5 Parameters Affecting Fuel Costs
EV efficiency (mikWh AC) 4-5 5-6 4-5 5-6 ICEV efficiency (migal) 40 40 40 40 Electricity price ($kWh) 0035-005 007-009 0035-005 007-009 Gasoline price ($gal) 056-149 056-149 056-149 056-149
Other Costs EV repair and maintenance (
of ICEV costs) 65-70 65-70 65-70 65-70
ICEV maintenance ($mile) 0045 0045 0045 0045 Charger installation ($) 0 0 0 0
Discount Rate () 4 4 4 4 aThe comparable ICEV is small meets the SULEV and near-zero evaporative emission standards and averages 40 miles per gallon
Parameters That Affect Battery Replacement Cost The cost of the batteries (excluding the first battery pack) needed over a vehiclersquos lifetime is determined by
bull the battery pack size bull the cost of the batteries in dollars per kilowatt-hour bull the cycle life of the battery bull the miles driven on a battery cycle bull the cost markup for buying and installing subsequent battery packs bull the salvage value of batteries
We discuss each in turn
-64-
As described in Subsection 41 we set the 2003-through-2007 battery pack size to 30 kWh for a full-function EV and to 10 kWh for a city EV It seems plausible that the efficiency of EVs (in terms of kilowatt-hours per mile) will increase in the future (see discussion below) We increase efficiency by 20 percent for our estimates of lifecycle costs in volume production so that the battery pack can be smaller and maintain the same range Accordingly we reduce the full-function EV and city EV battery packs to 24 and 8 kWh respectively for the high-production volume cost calculations
The above analysis of battery costs led us to conclude that NiMH battery packs (including battery auxiliaries and indirect costs) would cost from $425 to $460 per kilowatt-hour between 2003 and 2007 The range for PbA batteries is $130 to $170 The cost of replacement batteries for vehicles sold between 2003 and 2007 may well be lower than it was when the vehicle was built due to battery production volumes increasing over time We assume that by the time the battery is replaced 50 percent of the difference between the 2003-2007 costs and the midpoint of the high-volume cost range will have been eliminated The result NiMH replacement costs will be $305 to $360 and PbA replacement costs $115 to $154 In the volume production scenarios we allow NiMH battery pack costs to range from $233 to $258 per kilowatt-hour and set PbA battery costs at $114 per kilowatt-hour
The EVrsquos range (90 to 110 miles for a full-function EV and 50 to 60 miles for a city EV) multiplied by the battery cycle life is a starting point for the miles driven over one packrsquos lifetime which in turn determines the number of packs needed over a vehiclersquos lifetime We reduce the resulting estimate of the miles driven using a single pack by 20 percent because vehicle range is determined by taking the battery down to empty whereas cycle life is usually determined by taking the battery down to a 20 percent charge
We put NiMH cycle life at 1000 to 1500 cycles between 2003 and 2007 and at 1500 cycles in the high-volume cost scenario CARBrsquos Battery Technology Advisory Panel (BTAP) report (Anderman Kalhammer and MacArthur 2000 p 37) cites one auto manufacturerrsquos projection of 1200 cycles and 100000 miles at 77degF and 1100 cycles at 95degF from bench tests that have been partially corroborated by field tests of battery packs in vehicles While cycle life deteriorates when the pack is continuously exposed to extreme heat (113degF) the important implication is that a NiMH battery pack that is properly thermally managed can now achieve 100000 miles In reference to a Panasonic NiMH battery16 the BTAP report optimistically ____________
16At the November 1999 UC Davis Conference on EVs Panasonic EV reported that the RAV4-EV (NiMH) had already achieved 100000 kilometers of driving on one pack in tests in Japan Furthermore Panasonic EV suggested that longer life can be expected with ldquoeconomy chargingrdquo ie intermittent full charging in order to reduce deterioration of the NiMH battery electrode
-65-
forecasts that ldquoit seems quite possible that 1000 to 2000 cycles at 100 percent depth of discharge can eventually be achieved depending on the batteryrsquos initial power versus the carrsquos requirementsrdquo (Anderman Kalhammer and MacArthur 2000 p 31)
PbA batteries currently achieve roughly 600 cycles but Panasonic has been developing designs with longer cycle lives and 1000 cycles appears to be possible (Matsushita Electric 2000)17 We set PbA cycle life to 600 to 1000 cycles between 2003 and 2007 and to 1000 cycles in the high-volume scenarios
Following CARB (2000b p 100) we set the cost of handling and installing replacement battery packs at $500 per pack
Batteries may have salvage value at the end of their lives Battery experts at Southern California Edison told Delucchi et al (2000 p 45) that used NiMH batteries would be at least as good for load-leveling backup and other utility applications as the new PbA packs they currently buy for such uses Thus the salvage value for NiMH batteries might be as high as $100 per kilowatt-hour (roughly the current cost of new PbA batteries) at least until the supply of retired NiMH batteries saturates the market The secondary market for NiMH batteries is quite uncertain however CARB (2000b p 100) assumes that the salvage value is $40 per kilowatt-hour for NiMH batteries but Delucchi et al (2000) believe the batteries will lose their remaining value very quickly and that there thus will be little market for them They believe the batteries will have to be recycled at a small net cost at low volumes and will have a small net salvage value at medium volumes In our analysis we vary the salvage value of NiMH batteries from $0 to $40 per kilowatt-hour
CARB (2000b p 100) believes a secondary market for used PbA batteries at meaningful volumes is speculative and assumes a salvage value of $3 per kilowatt-hourmdashthe value of the materials in the battery Delucchi et al (2000 p 46) assumes that PbA batteries will have negative salvage valuemdashthat is they will cost between $5 and $15 to recycle In our analysis we vary PbA salvage values from -$15 to $5 per kilowatt-hour
The last battery pack installed in the vehicle might not be fully used at the end of the vehicle life Following Delucchi et al (2000 p 69) we set the salvage value of the unused portion of the pack equal to 70 percent of the cost of batteries to the manufacturer ____________
17ldquoThe newly developed EV battery lasts approximately twice as long and offers about twice as much power as existing lead-acid EV batteries It can be discharged and recharged approximately 1000 times which is about twice as many cycles as the companyrsquos existing lead-acid EV battery productsrdquo (Matsushita Electric 2000)
-66-
Parameters That Affect Fuel Costs The cost of electricity the cost of gasoline the wall-to-wheels (or AC) efficiency of the EV and the fuel efficiency of the ICEV determine the lifetime fuel costs of a full-function EV relative to an ICEV
The number of BPEVs is relatively small between 2003 and 2007 and we assume that BPEVs can be charged off-peak using existing power generation transmission and distribution facilities As shown in Appendix D the costs of power in such a situation might be expected to run from $0035 to $005 per kilowatt-hour If EVs become a significant part of the transportation system they will use a significant amount of power requiring additional generation transmission and distribution facilities18 For volume production we thus put electricity costs at $007 to $009 per kilowatt-hour which covers the capital cost of the power plant and the transmission and distribution system (see Appendix D) Because we are interested in resource costs we do not include taxes or charges imposed to recover costs during Californiarsquos recent energy crisis Likewise CARB does not include taxes in its analysis of operating costs CARB assumes an electricity cost of $005 per kilowatt-hour however it also presents a scenario in which costs are $0075 per kilowatt-hour (CARB 2000b p 107)
There is a good deal of uncertainty regarding gasoline prices over the lives of the vehicles We assume prices at the pump will vary between $100 and $200 per gallon which is consistent with prices observed in recent years in California Federal and state fuel excise taxes currently total $0363 per gallon and sales taxes on gasoline average roughly 8 percent in the state (CARB 2000b p 107) We thus assume that gasoline costs vary from $056 to $149 per gallon net of taxes
EV efficiency (in miles per kilowatt-hour AC) is based on data developed by Southern California Edison for the EVs produced by the large manufacturers19 Our figures for ICEV fuel efficiency reflect a rough average of the fuel efficiencies of ICEVs that are comparable in size to full-function EVs and city EVs (275 miles per gallon for mid-size ICEVs and 40 miles per gallon for very small ICEVs)
The efficiency of EVs may improve over future design cycles and thus might be higher in volume production than it will be between 2003 and 2007 CARB assumes that efficiency increases from about 22 miles per kilowatt-hour in 2003 to roughly 4 miles per kilowatt-hour in volume production for a four-passenger full-function EV (CARB 2000b p 111) This ____________
18For example to charge 100000 full-function EVs overnight will require a 250-megawatt power plantmdasha good-sized plant (If each full-function EV requires 30 kWh per night 100000 full-function EVs require 3000 megawatt-hours And 3000 MWh12 hours = 250 megawatts)
19We determined the range using the efficiencies remaining after the vehicles with the highest efficiency (the EV1) and lowest efficiency (the EPIC) were discarded (see httpevinelgovfop)
-67-
improvement is driven by a substantial reduction in aerodynamic drag lower-loss tires a higher-efficiency drive system and substantial improvements in charging efficiency While efficiency may well improve we think it likely that CARB is overly optimistic For example vehicles with very low aerodynamic drag are technologically feasible but are not assured of success in the marketplace We increase EV efficiency roughly 20 percent from the levels used to estimate costs between 2003 and 2007 yielding a battery pack that is 20 percent smaller but allows the same range
EV Repair and Maintenance Costs It is often argued that EVs will have lower repair and maintenance costs than ICEVs do because EVs have fewer components and fewer moving parts While this may be so in the long term we follow Dixon and Garber (1996 p 244) in assuming there are several reasons to be skeptical in the near term
bull EV technology is evolving rapidly but projections of EV repair and maintenance costs may be based implicitly on costs for stable designs Components will probably be less reliable in the early years of commercial scale production than in later years
bull Several manufacturers have had problems with their battery packs and have had to replace battery modules an expensive process Installing replacement packs may also be time consuming and costly
bull Repair and maintenance costs of ICEVs appear to be declining Delucchi et al (2000 p 245) put EV repair and maintenance costs at approximately 70
percent of ICEV costs CARB (2000b p 108) uses 66 percent in its analysis We let the proportion vary from 65 to 70 percent The ICEV repair and maintenance cost we use for reference for the full-function EV is $006 per mile (as in Delucchi et al 2000 p 245 and CARB 2000b p 108) We reduce the repair and maintenance cost by 25 percent for the smaller ICEV used in the city EV incremental-cost calculation
Charger Installation We assume that the off-board charging equipment is included in the cost of the EV but that the off-board charger must be installed at the business or residence where the vehicle is charged Installation often requires significant extension or modification of the businessresidence electrical system and may require structural modifications There appears to be a great deal of variation across customers in charger installation costs Nissan reports an average cost (based on a fairly small number of installations) of $3000 for installation of a full-function EV charger inside the garage of a single-family home (Atkins et al 1999) CARB sets the cost of the charger plus installation at $1500 in 2003 and $750 in volume production Our analysis assumes installation costs range from $500 to $1500 between 2003 and 2007 Average installation costs in volume production should be lowermdashin part because some households and
-68-
businesses will already have installed the 220-volt line used by most full-function EV chargers We set installation costs at $500 for volume production
It appears that city EVs will likely be offered with a number of different charging options ranging from simply plugging the vehicle into a standard 110-volt outlet to using a rapid charging system that requires the same 220-volt 30-ampere outlets used by full-function EVs The 110-volt option requires no charger installation costs but it may take up to 8 hours to charge the 10-kWh battery The rapid-charge option will charge the battery very quickly but may require installation costs as high as those for full-function EVs We set charger installation costs to zero in our analysis The key requirement for any EV is that it be able to charge overnight and the city EV will be able to do so using a standard 110-volt circuit
Discount Rate The discount rate translates costs incurred in the future to present-day costs Because we are interested in the resource costs of advanced technology vehicles to society as a whole we set the discount rate to the social (as opposed to the private) discount rate20 The social discount rate is defined as the social opportunity cost of capital and is often based on the long-run risk-free (or low-risk) return on capital (Tietenberg 1992 p 88) Examples include the return on US Treasury bonds Estimates of the long-run risk-free return are typically 3 to 5 percent net of inflation
Parameters Used to Estimate Incremental Lifecycle Costs of DHFCVs Table 415 lists the parameters used to estimate the incremental lifecycle costs of a
DHFCV relative to an ICEV that meets the SULEV exhaust and near-zero evaporative emission exhaust standards The key parameters in the incremental operating costs are the DHFCVrsquos fuel economy in miles per kilogram of hydrogen and the cost of hydrogen in dollars per kilogram The Methanol Institute summarizes the findings of eight studies on the expected fuel economy of DHFCVs21 The efficiencies range from 55 to 106 miles per equivalent gallon of gasoline and the Methanol Institute uses 65 to 85 miles in its analysis The two measuresmdashmiles per equivalent gallon of gasoline and miles per kilogram of hydrogenmdashare very close and we use 65 to 85 miles per kilogram for our cost projections for 2006 to 2010 For high-volume lifecycle cost projections we set the efficiency at 85 miles per kilogram
Appendix D derives an estimate of the cost of hydrogen fuel We assume that hydrogen is sold at filling stations that generate hydrogen from natural gas piped to the site Assumptions on the cost of natural gas and the cost of the reformer that generates hydrogen ____________
20Consumers are thought to apply much higher discount rates when buying durable goods See for example Kavalec 1996 p 30
21See httpwwwmethanolorgfuelcellspecialcontadini_pg1html Tables 1 and 2
-69-
from natural gas result in hydrogen costs of $232 to $316 per kilogram between 2006 and 2010 The costs fall to $185 to $233 per kilogram for high-volume production of reformers To put these numbers in perspective $200 per kilogram corresponds to $0027 per mile in a vehicle that gets 75 miles per kilogram Fuel cost for a mid-size ICEV that
Table 415
Parameters Used to Calculate Lifetime Operating Costs of a DHFCV Relative to a Comparable ICEVa
Parameter 2006-2010 Volume Production Initial vehicle cost ($) 8300-15200 1200 - 3900 Vehicle efficiency
DHFCV (mikg of hydrogen) 65-85 85 ICEV (migal) 25-30 25-30
Fuel cost Gasoline ($gal) 056-149 056-149 Hydrogen ($kg) 232-316 185-233
Maintenance costs ($mi) DHFCV 006 006 ICEV 006 006
aThe comparable ICEV used in the calculations is mid-size meets the SULEV and near-zero evaporative emission standards and averages 25 to 30 miles per gallon
averages 275 miles per gallon when gasoline (net of taxes) is $100 per gallon is $0036 per mile
Little information is available on the maintenance costs of DHFCVs relative to ICEVs A DHFCVrsquos electric power train has fewer parts than an ICEVrsquos drivetrain and may be cheaper to maintain The reliability and maintenance costs of a PEM fuel cell however are uncertain Lacking better information we set the maintenance costs of DHFCVs equal to those for ICEVs
Parameters Used to Estimate Incremental Lifecycle Costs of GHEVs GHEVs may be cheaper to operate than standard ICEVs because of their higher gas
mileage Following CARB (2000b p 114) we set the efficiency of a four-passenger GHEV to 45 miles per gallon between 2003 and 2007 and assume that improvements in vehicle design will increase the fuel economy to 55 miles per gallon in volume production (see Table 416)22 These fuel economies are 50 and 57 percent greater respectively than the 30 and 35 miles per gallon that CARB (2000b p 115) assumes for a comparable ICEV
In its initial analysis of hybrid costs CARB concluded that hybrid maintenance costs may be higher than those of standard gasoline vehicles because hybrids contain both a conventional ____________
22CARBrsquos estimate of 45 miles per gallon is based on published fuel mileage figures for currently available hybrids
-70-
and an electric drive system CARB noted that little was known about hybrid operating costs however and ldquoin the absence of more specific informationrdquo set maintenance costs at $0075 per mile (CARB 2000b p 108) CARB later reexamined the maintenance costs of hybrids and
-71-
Table 416
Parameters Used to Calculate Incremental Lifecycle Cost of a GHEV Relative to a Comparable ICEVa
Parameter
2003-2007
High-Volume Production
Initial vehicle cost ($) (including first battery and off-board charger)
2300-3300 500-900
Vehicle efficiency (migal) GHEV(ATPZEV) 45 55 ICEV 30 35
Fuel costs ($gal) 056-149 056-149 Maintenance costs ($mi)
GHEV(ATPZEV) 006-078 006-065 ICEV 006 006
aThe comparable ICEV used in the calculations is mid-size meets the SULEV and near-zero evaporative standards and averages 30 miles per gallon between 2003 and 2007 and 35 miles per gallon when GHEVs are in volume production
concluded that incremental maintenance costs would be zero CARB noted that there may be some incremental maintenance costs associated with the battery or electric drive components (eg the 2002 Toyota Prius requires a coolant change for the electric power inverter at 34000 miles) but that there may be less brake wear due to regenerative braking (CARB 2001h p 167)
CARB never explicitly addresses the costs associated with maintaining and possibly replacing the battery in hybrids There is uncertainty over whether one battery will last the entire life of the vehicle As noted in Subsection 43 a recent report put the life expectancy of a NiMH hybrid battery at five to eight years Ford reports that the battery in its Escape hybrid will have to be replaced at least once during a 15-year vehicle life Honda implies that 15 years in service is beyond todayrsquos battery technology Toyota believes that scheduled replacement of the battery will not be required over a 15-year lifetime but that unscheduled maintenance is possible (CARB 2001h p 129)
This uncertainty drives us to develop a range for hybrid maintenance costs The lower end of the range is $006 per mile equal to the maintenance costs of standard ICEVs The upper end allows for the accumulation of enough money over the life of the vehicle to replace the battery once For 2003 to 2007 we take the upper estimate for the cost of the battery ($2000mdashsee Subsection 43) add 30 percent for indirect costs (see Subsection 46) and add $125 for installation (lower than the $500 assumed cost to replace the much larger full-function EV pack) The sum translates into $0018 per mile resulting in a maintenance cost range that runs from $006 to $007 per mile In high-volume production the pack costs $500 resulting in a range of $006 to $0065 per mile
-72-
Method for Calculating Incremental Lifecycle Costs We assume that each of the parameters is statistically independent and uniformly
distributed on its specified range We then randomly draw a value from each parameter range and use the resulting set of values to calculate the incremental lifetime operating cost and incremental lifecycle cost of each advanced technology vehicle relative to an ICEV We repeat this process 10000 times and report the 5th and 95th percentiles of the distribution Given assumptions on the distributions of the parameters if we repeated the process for constructing the interval over and over this interval would contain the true incremental cost 90 percent of the time We chose to repeat the process 10000 times because the distribution is stable to two significant digits with this number
Findings on Incremental Lifecycle Costs Results of our analysis of incremental lifetime operating and lifecycle costs are reported in
Table 417 The second and third columns show our findings on the incremental lifetime operating cost in the near term and in volume production respectively The fourth and fifth columns add in the incremental initial cost of the vehicle and show the incremental lifecycle cost The brackets in each cell contain the 90 percent probability interval for the estimate
Full-Function EVs During the first five years of the program the lifetime operating cost of full-function EVs with NiMH batteries may be higher or lower than that of an ICEV meeting the SULEV exhaust and near-zero evaporative emission standards As can be seen in the second column of Table 417 the 90 percent probability interval runs from -$1600 to $4000 Once the high incremental production cost for these vehicles is included the incremental lifecycle cost ranges from $17300 to $27800 Our analysis suggests that even in volume production the lifecycle cost of full-function EVs with NiMH batteries will remain substantially above that for ICEVs The incremental cost estimates range from $3100 to $8700
PbA batteries are cheaper than NiMH batteries but their short cycle life means that the lifetime operating cost will likely be somewhat greater for full-function EVs with PbA batteries than for their NiMH-powered counterparts Incremental lifecycle cost is a good deal lower however because the initial vehicle is cheaper Between 2003 and 2007 there will still be a substantial lifecycle cost premium for full-function EVs powered with PbA batteries ($9000 to $18400) Incremental lifecycle cost may be small in volume production ($200) but there is an equally good chance that incremental lifecycle cost will remain substantial (the upper end of the 90 percent probability interval is $5100) Thus even with PbA batteries the lifecycle cost of full-function EVs is likely to exceed that of ICEVs What is more questions remain about whether PbA batteries are feasible for full-function EVs that have a range of roughly 100 miles
-73-
Table 417
Incremental Lifetime Operating and Lifecycle Costs of Advanced Technology Vehicles (incremental over a vehicle meeting SULEV and near-zero evaporative emission standards)
($1000s per vehicle 90 percent probability intervals in brackets)a
Incremental Lifetime Operating Cost Incremental Lifecycle Cost Vehicle Technology
Near Term
High-Volume Production
Near Term
High-Volume Production
2003-2007 2003-2007 Full-function EV
NiMH [-16 40] [-31 10] [173 278] [31 87] PbA [-11 52] [-25 51] [90 184] [02 51]
City EV NiMH [-13 05] [-16 -03] [81 129] [05 24] PbA [-11 10] [-13 -01] [51 99] [-04 12]
GHEV [-14 08] [-15 03] [13 37] [-09 04] PZEV 0 0 [006 023] [006 023] 2006-2010 2006-2010 DHFCV [-21 20] [-34 03] [78 156] [-13 34] aDiscounted to the time of vehicle sale using a 4 percent discount rate
since the size and weight of these batteries make it difficult to design such a vehicle with acceptable space and handling
City EVs Mainly because of their smaller battery packs city EVs have a much lower incremental lifecycle cost than full-function EVs do Between 2003 and 2007 the operating cost of a city EV with either PbA or NiMH batteries may be above or below that of a small ICEV Substantial incremental vehicle production cost between 2003 and 2007 still means however that incremental lifecycle cost for a city EV remains sizable with either type of battery
For high-volume production our analysis predicts that if battery cycle life reaches the most optimistic expectations and vehicle efficiencies improve somewhat the lifecycle cost of a city EV with PbA batteries could be comparable to that of a small ICEV As shown in Table 417 the 90 percent probability interval ranges from -$400 to $1200 Again however note that manufacturers are choosing to use NiMH batteries and NiCd batteries in their city EVs despite the higher costs which suggests that PbA batteries do not work well in a city EV design
GHEVs The cost of servicing and possibly replacing the battery in a GHEV more than offsets the savings due to this vehiclersquos higher gas mileage Our estimates of incremental lifetime operating cost range from -$1400 to $800 per vehicle for vehicles produced between 2003 and 2007 and from -$1500 to $300 in high-volume production Once the incremental cost of the vehicle is added in the hybridrsquos lifecycle cost is $1300 to $3700 greater than that of a standard ICEV between 2003 and 2007 Incremental lifecycle cost runs from -$900 to $400 in volume production
-74-
PZEVs The greater incremental lifecycle cost of a PZEV relative to an ICEV that meets the SULEV exhaust and near-zero evaporative emission standards is due only to the increased initial cost of a PZEV Our estimates range from $60 to $235 from 2003 on
DHFCVs Given our assumptions on the cost of hydrogen fuel fuel efficiency and vehicle maintenance the lifetime operating cost of a DHFCV may be several thousand dollars less than that of an ICEV The midpoint of the estimate for incremental operating cost between 2006 and 2010 is near zero although there is enough uncertainty in the parameters that the upper end of the 90 percent probability interval reaches $2000 Very high initial vehicle cost means that the incremental lifecycle cost of DHFCVs remains high through 2010 Plausible improvements in fuel-cell technology and reductions in the cost of providing hydrogen fuel may ultimately reduce the lifecycle cost for this vehicle to below that for an ICEV (the lower end of the probability interval is -$1300) However this is by no means guaranteed The upper end of the interval is $3400
- 4 VEHICLE PRODUCTION AND LIFECYCLE COST
-
- 41 KEY VEHICLE COMPONENTS
-
- Battery-Powered Electric Vehicles
- Direct Hydrogen Fuel-Cell Vehicles
-
- Table 41
-
- Specifications of BPEVs
-
- Full-Function EVs
-
- ~8
- DC permanent magnet
-
- Figure 41mdashSingle PEM Fuel Cell
-
- Table 42
-
- Specifications of Prototype DHFCVs
-
- Gasoline Hybrid Electric Vehicles
- Gasoline Partial Zero Emission Vehicles
-
- Table 43
-
- Specifications of Typical GHEVs
-
- 97
- 086
-
- 42 OVERVIEW OF FACTORS THAT CAUSE COSTS TO DECLINE
-
- Production Scale Economies
- Learning
- Technological Advances
- How Cost Reduction Factors Enter Our Analysis
-
- 43 COMPONENT COSTS OF BATTERY-POWERED ELECTRIC VEHICLES AND GASOLINE HYBRID ELECTRIC VEHICLES
-
- Battery Modules and Auxiliaries
-
- Figure 42mdashNiMH Module Cost as a Function of Prod
- Figure 43mdashPbA Module Cost as a Function of Produ
-
- Table 44
-
- EV Battery Module Costs($ per kWh)
-
- Table 45
-
- EV Battery Auxiliary Costs($ per kWh)
-
- Motors and Controllers
-
- Figure 44mdashDC Motor Cost as a Function of Product
-
- Table 46
-
- Estimate of High-Volume Costs for 53-kW DC Motor 67-kW AC Motor and 70-kW DC and AC Motor Controllers($)
-
- Motor
- Motor Controller
-
- Figure 45mdashCombined Cost of 50-kW Motor and Motor
-
- Table 47
-
- Motor and Motor Controller Costs for Full-Function EVs and City EVs ($ per motor and controller)
-
- EV Transmission and Other EV Auxiliaries
- Integrated Charger
- Savings From Exclusion of Internal Combustion Engine Vehicle Components
-
- Table 48
-
- Breakdown of Current and Potential Power Needs of an ICEV
-
- 44 COMPONENT COSTS OF DIRECT HYDROGEN FUEL-CELL VEHICLES
-
- Overview of Recent Studies on PEM Fuel-Cell Systems
-
- Table 49
-
- Summary of Studies on Fuel-Cell Costs
-
- MR1578_ch4B_Finalpdf
-
- Figure 46mdashPEM Fuel-Cell System Costs as a Functi
- Fuel-Cell Components
-
- Table 410
-
- Platinum Loading in Membrane Electrode Assembly
-
- Hydrogen Tank for a Fuel-Cell Vehicle
- 45 PZEV COSTS
-
- Figure 47mdashCost of Tank That Stores 4 kg of Hydro
-
- 46 INCREMENTAL VEHICLE PRODUCTION COSTS
-
- Multipliers Used to Calculate Indirect Costs
- Incremental Vehicle Production Costs
-
- Table 411
-
- Breakdown of Manufacturerrsquos Suggested Retail Pric
-
- Table 412
-
- Incremental Vehicle Production Costs (relative to an ICEV meeting SULEV exhaust and near-zero evaporative emission standards) (estimated ranges in brackets $1000s per vehicle)
-
- NiMH
- City EV
- NiMH
-
- 47 INCREMENTAL LIFECYCLE COSTS
-
- Parameters Used to Estimate Incremental Lifecycle Costs of Full-Function and City EVs
-
- Table 413
-
- Parameters Used to Calculate Lifetime Operating Cost of a Full-Function EV Relative to a Comparable ICEVa
-
- Initial Vehicle Cost ($) (including first battery and off-board charger)
- Vehicle Life
- Parameters Affecting Battery Replacement Cost
- Parameters Affecting Fuel Costs
- Discount Rate ()
-
- Table 414
-
- Parameters Used to Calculate Lifetime Operating Cost of a City EV Relative to a Comparable ICEVa
-
- Initial Vehicle Cost ($) (including first battery and off-board charger)
- Vehicle Life
- Parameters Affecting Battery Cost
- Parameters Affecting Fuel Costs
- Other Costs
- Discount Rate ()
-
- Parameters Used to Estimate Incremental Lifecycle Costs of DHFCVs
-
- Table 415
-
- Parameters Used to Calculate Lifetime Operating Costs of a DHFCV Relative to a Comparable ICEVa
-
- Initial vehicle cost ($)
-
- Parameters Used to Estimate Incremental Lifecycle Costs of GHEVs
-
- Table 416
-
- Parameters Used to Calculate Incremental Lifecycle Cost of a GHEV Relative to a Comparable ICEVa
-
- Initial vehicle cost ($) (including first battery and off-board charger)
-
- Method for Calculating Incremental Lifecycle Costs
- Findings on Incremental Lifecycle Costs
-
- Table 417
-
- Incremental Lifetime Operating and Lifecycle Costs of Advanced Technology Vehicles (incremental over a vehicle meeting SULEV and near-zero evaporative emission standards) ($1000s per vehicle 90 percent probability intervals in brackets)a
-
- NiMH
- City EV
- NiMH
-
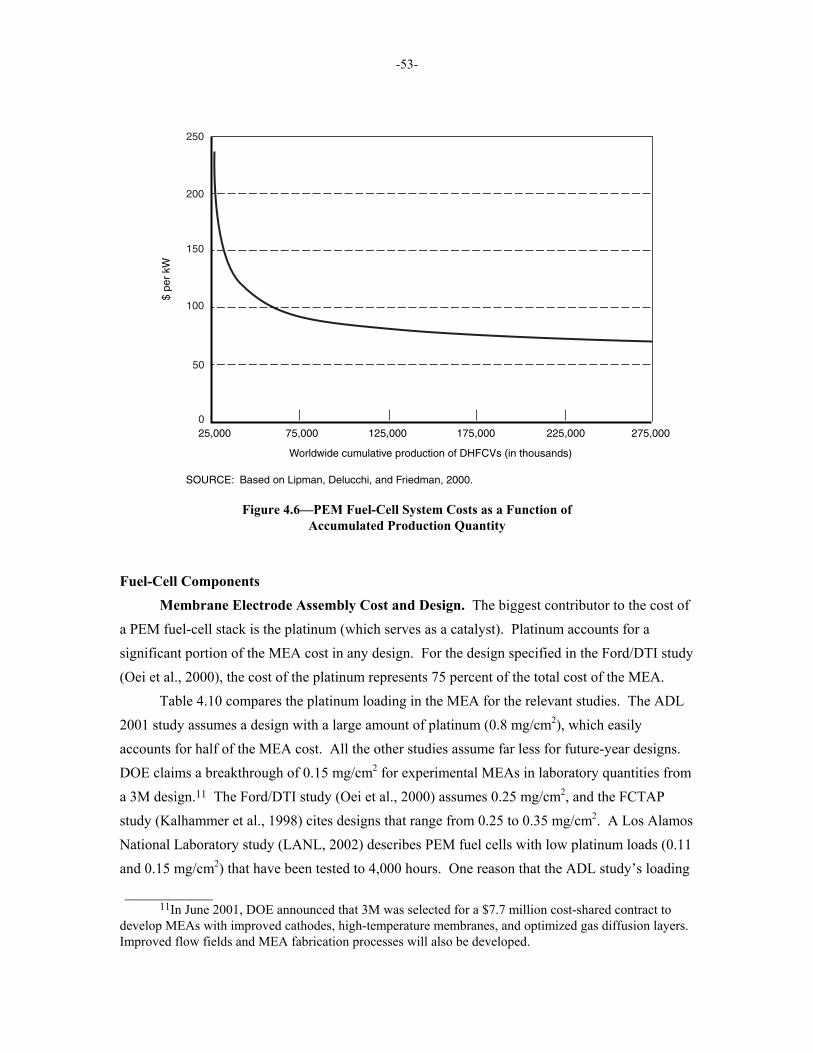
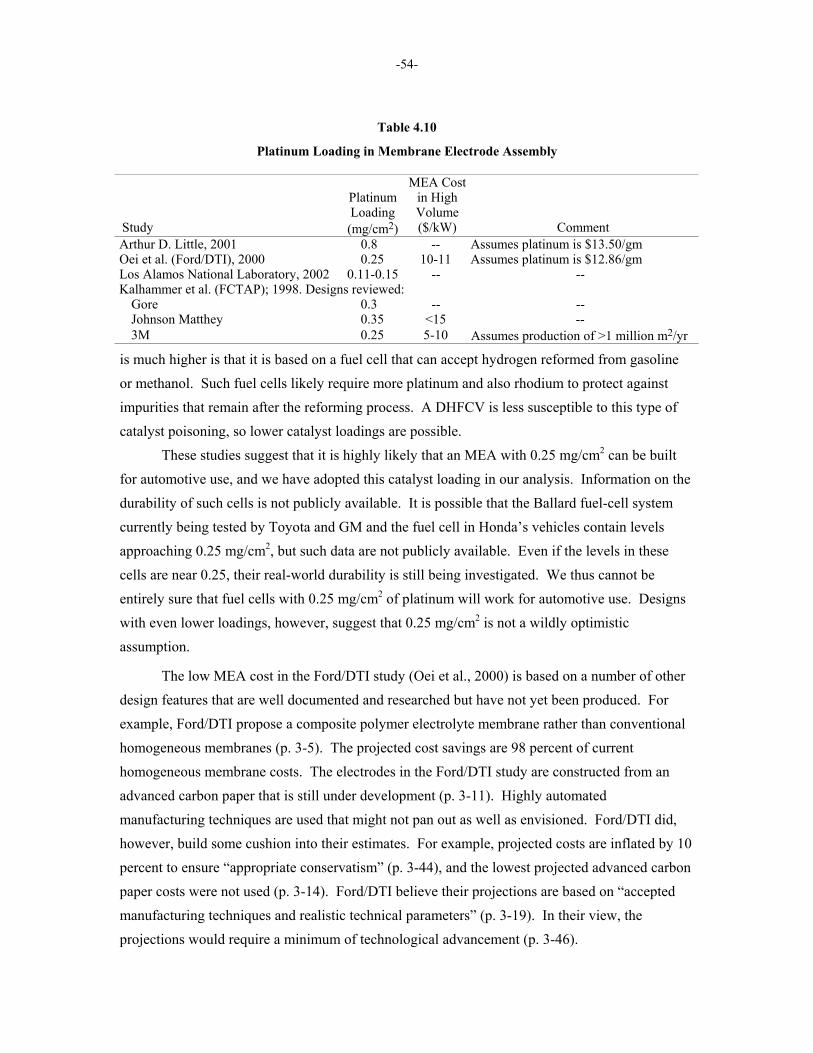
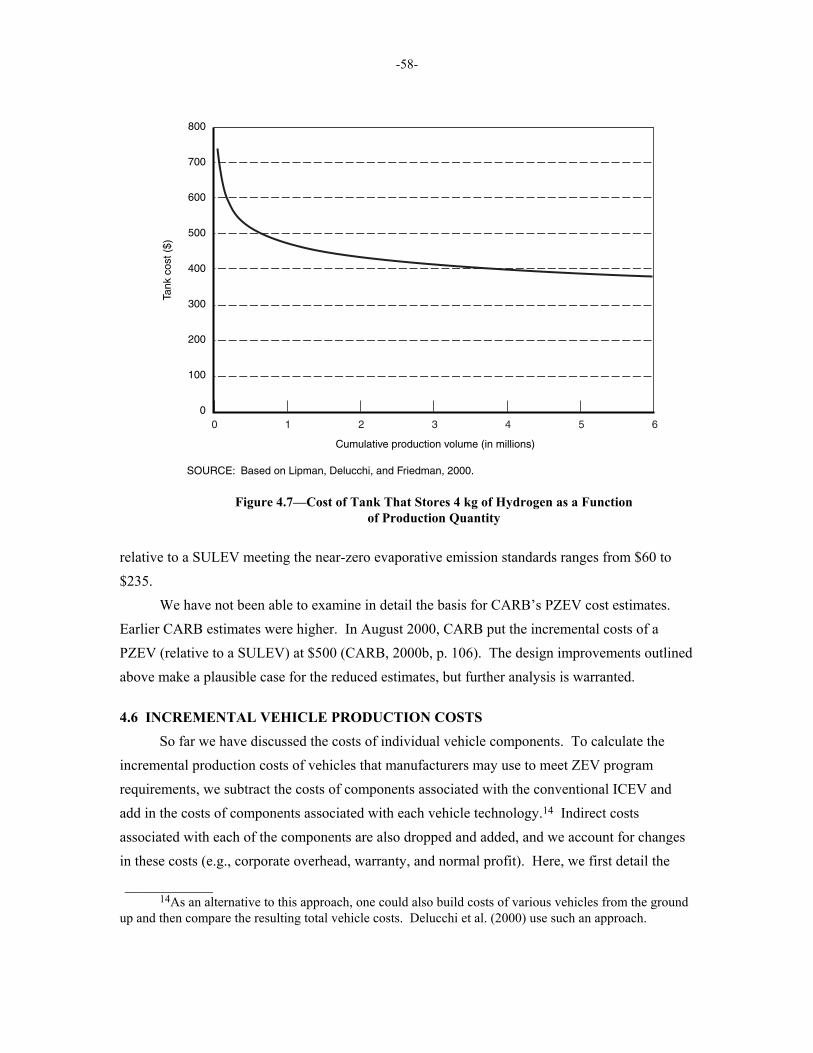
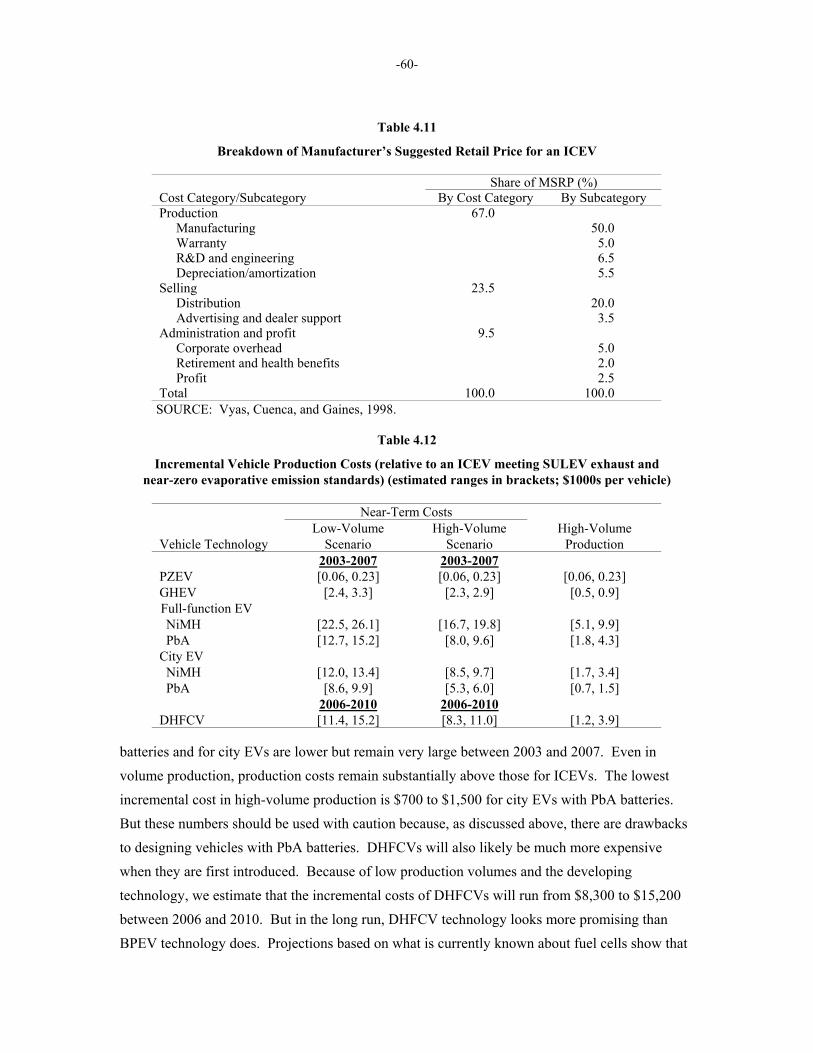
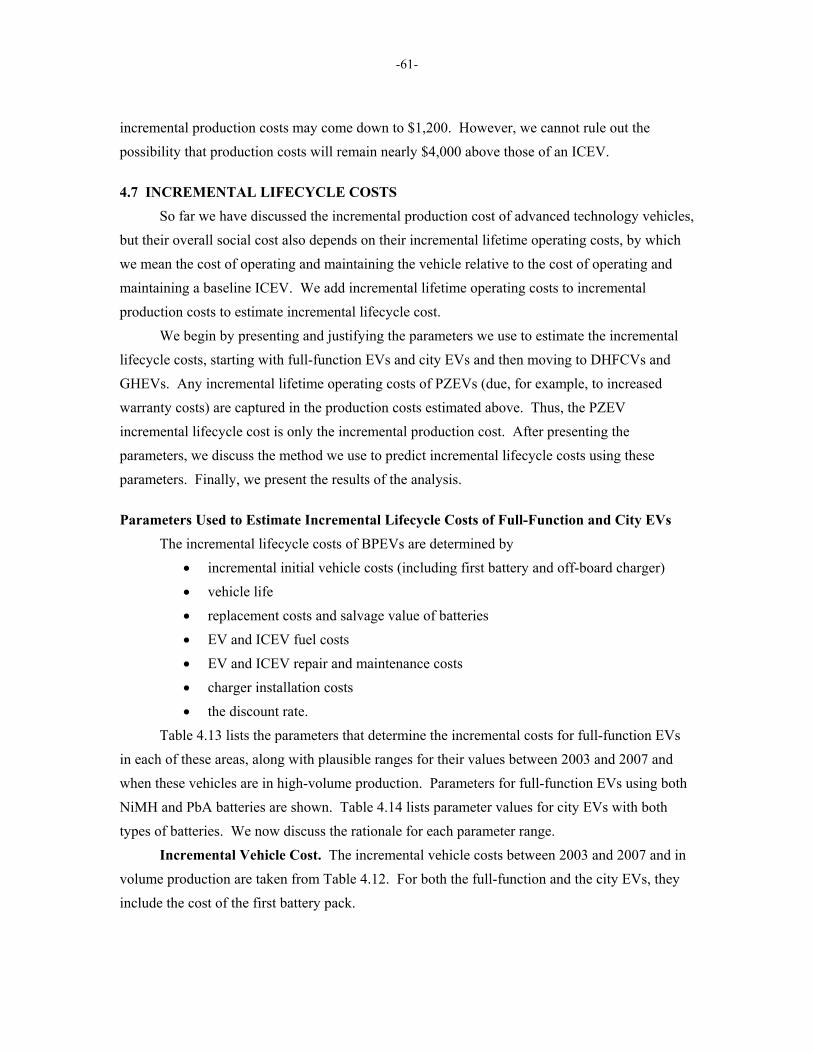
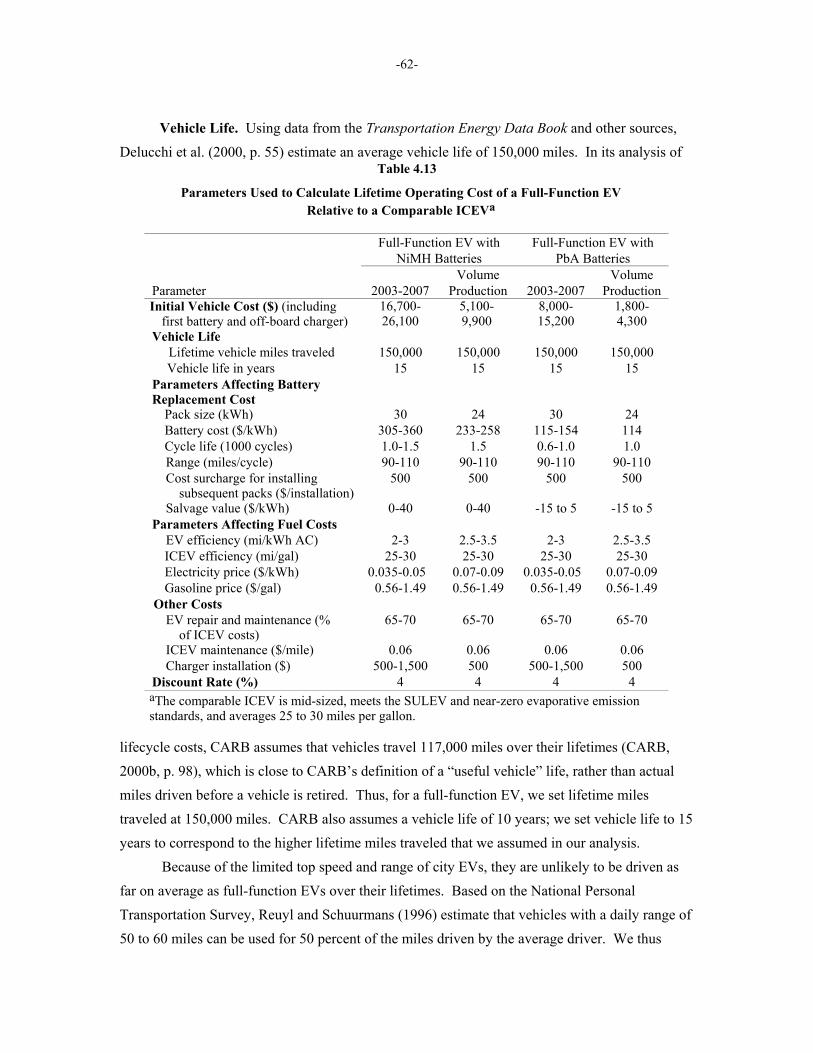
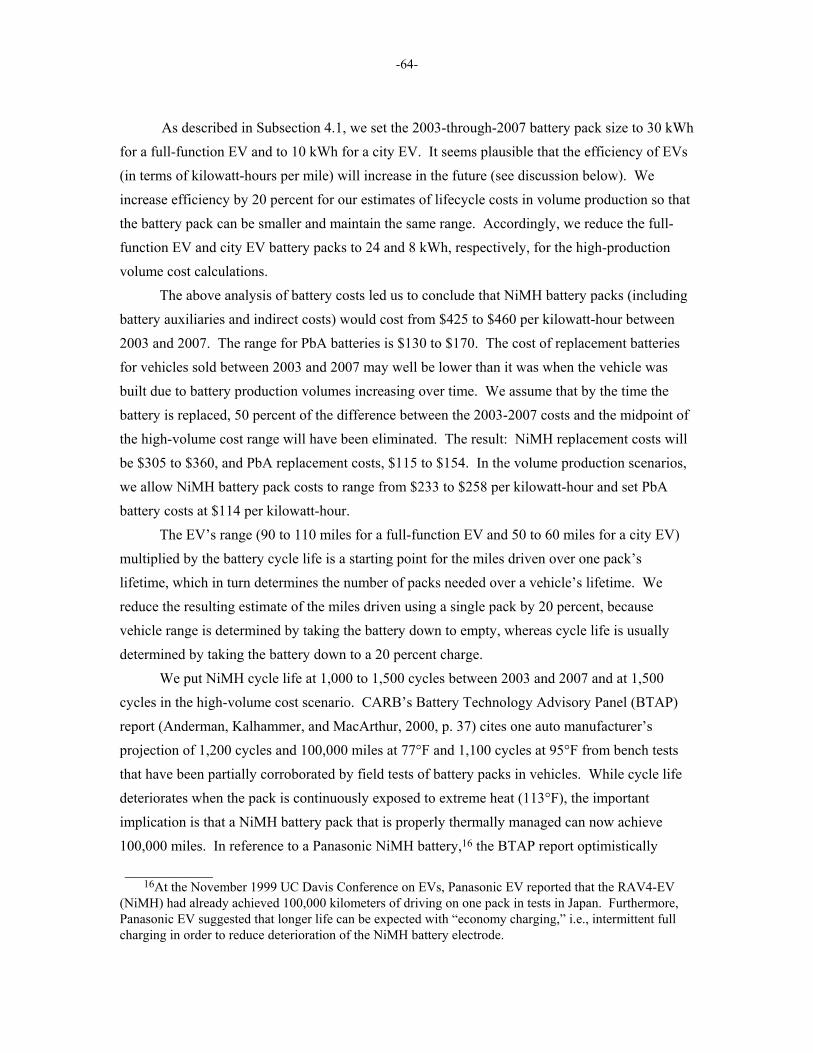
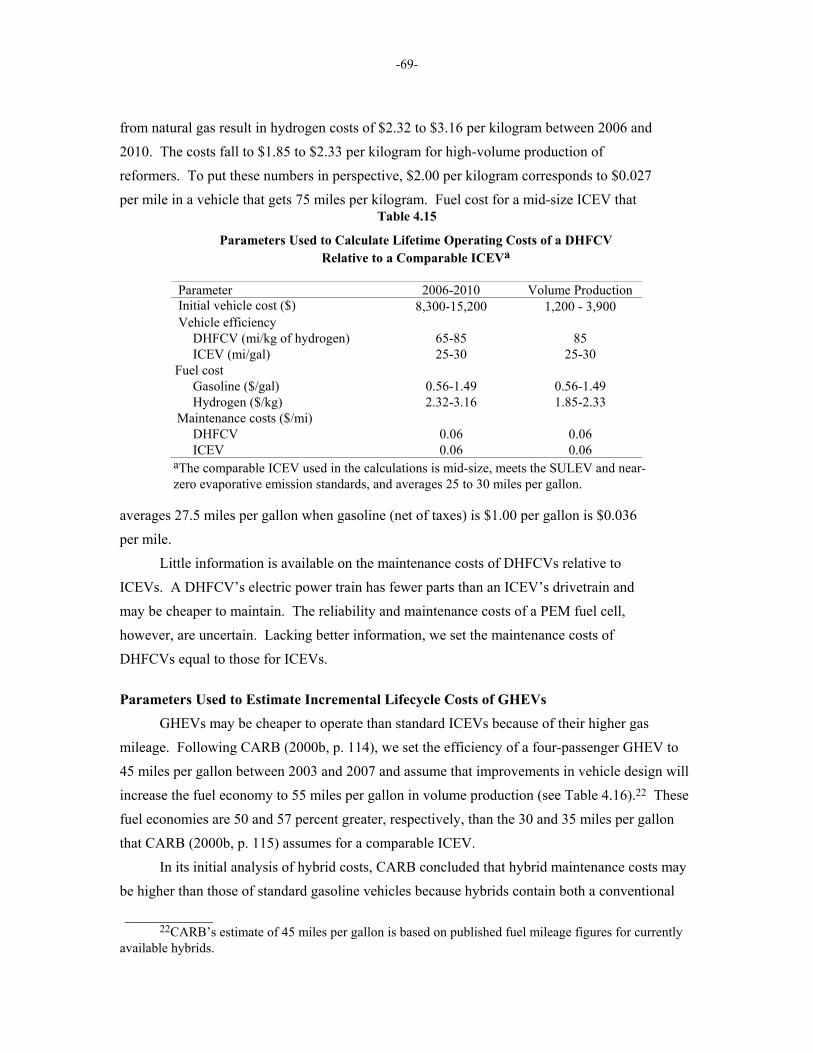
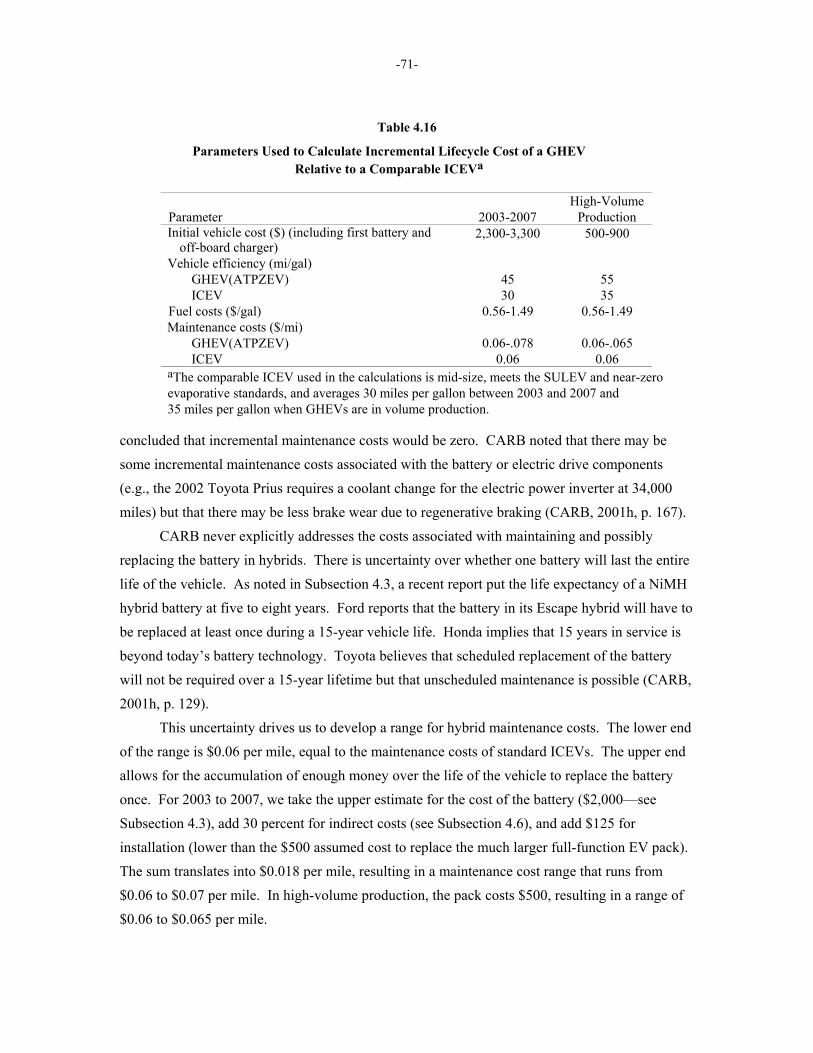
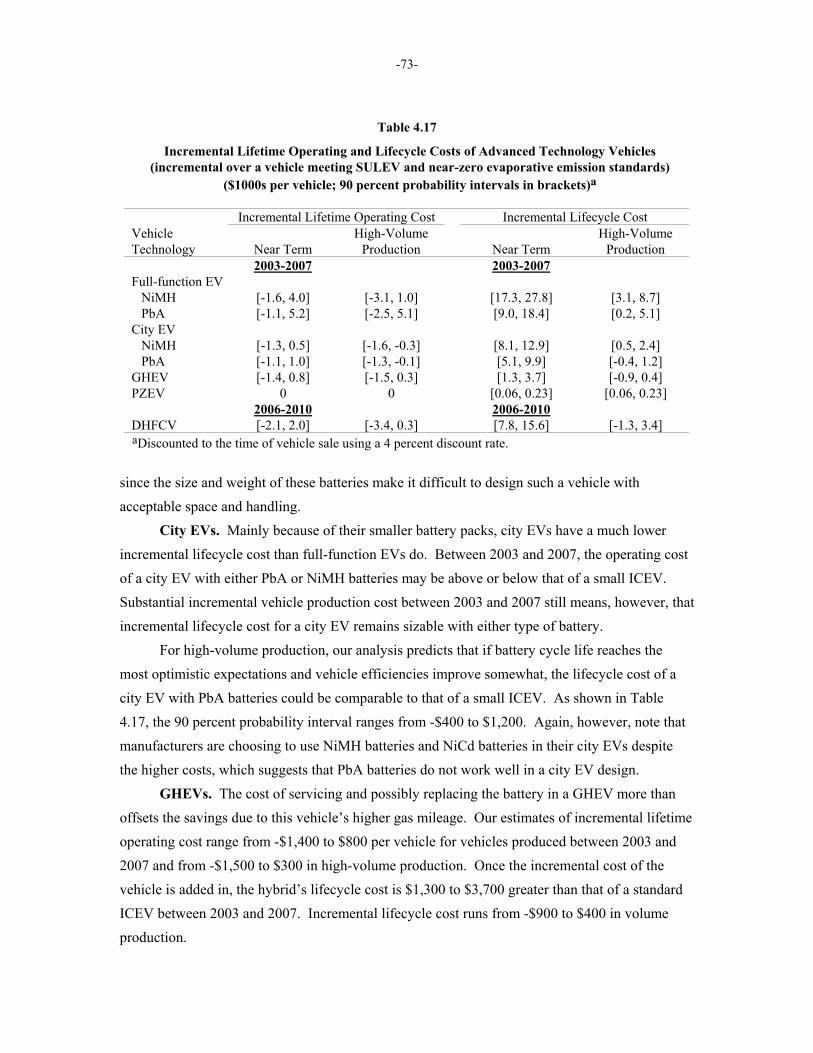