4. T C HE ONCENTRATION AND EFFECTS OF … · Demsetz and Lehn (1985) found a non-significant...
21
Romanian Journal of Economic Forecasting – XVII (3) 2014 51 THE EFFECTS OF OWNERSHIP CONCENTRATION AND ORIGIN ON LISTED FIRMS’ VALUE: EMPIRICAL EVIDENCE FROM ROMANIA Georgeta VINTILĂ 1 Ştefan Cristian GHERGHINA 2 Mihai NEDELESCU 3 Abstract This paper aims at exploring the relationship between ownership concentration and firm value by using panel data for firms listed on the Bucharest Stock Exchange (BSE). Additionally, we investigate the influence of ownership origin on firm value. Results drawn from a longitudinal analysis of a sample of all BSE listed companies, except for financial firms, provide support for a nonlinear relationship between the percentage of shares held by the three largest shareholders, considered individually, and firm value. Also, the nonlinear relationship is confirmed for the sum of holdings of the two largest shareholders, while the sum of holdings of the three largest shareholders exhibit a positive influence on firm value. Finally, if we consider the ownership origin, the results provide support for a positive relationship between the residence of the largest shareholder and firm value, while the influence of the sum of foreign investors’ holdings on firm value is nonlinear. Keywords: corporate governance, ownership concentration, ownership origin, firm value, panel data analysis JEL Classification: G32, G34 Introduction Because there are different interests between the investors as suppliers of finance to corporations, and the management of the companies, the agency problem is obvious. Thus, corporate governance deals with the mechanisms by which principals mitigate the agency dilemma. Ownership concentration, as internal corporate governance 1 The Bucharest University of Economic Studies, E-mail: [email protected] 2 The Bucharest University of Economic Studies, E-mail: [email protected] 3 Romanian-American University, E-mail: [email protected] 4.
Transcript of 4. T C HE ONCENTRATION AND EFFECTS OF … · Demsetz and Lehn (1985) found a non-significant...

Romanian Journal of Economic Forecasting – XVII (3) 2014 51
THE EFFECTS OF OWNERSHIP
CONCENTRATION AND ORIGIN ON LISTED FIRMS’ VALUE: EMPIRICAL EVIDENCE FROM ROMANIA
Georgeta VINTILĂ1 Ştefan Cristian GHERGHINA2
Mihai NEDELESCU3
Abstract
This paper aims at exploring the relationship between ownership concentration and firm value by using panel data for firms listed on the Bucharest Stock Exchange (BSE). Additionally, we investigate the influence of ownership origin on firm value. Results drawn from a longitudinal analysis of a sample of all BSE listed companies, except for financial firms, provide support for a nonlinear relationship between the percentage of shares held by the three largest shareholders, considered individually, and firm value. Also, the nonlinear relationship is confirmed for the sum of holdings of the two largest shareholders, while the sum of holdings of the three largest shareholders exhibit a positive influence on firm value. Finally, if we consider the ownership origin, the results provide support for a positive relationship between the residence of the largest shareholder and firm value, while the influence of the sum of foreign investors’ holdings on firm value is nonlinear. Keywords: corporate governance, ownership concentration, ownership origin, firm
value, panel data analysis JEL Classification: G32, G34
Introduction
Because there are different interests between the investors as suppliers of finance to corporations, and the management of the companies, the agency problem is obvious. Thus, corporate governance deals with the mechanisms by which principals mitigate the agency dilemma. Ownership concentration, as internal corporate governance 1 The Bucharest University of Economic Studies, E-mail: [email protected] 2 The Bucharest University of Economic Studies, E-mail: [email protected] 3 Romanian-American University, E-mail: [email protected]
4.

Institute for Economic Forecasting
Romanian Journal of Economic Forecasting –XVII (3) 2014 52
mechanism, is emphasized through the number of large block owners which have the incentives and required resources to monitor and discipline the management. Also, the agency problem could arise because of a lack of convergence between the interests of the majority shareholders and minority shareholders. This paper aims at providing the first empirical evidences regarding the influence of ownership concentration and origin on firm value, by using a sample of companies listed on the Bucharest Stock Exchange (BSE) over the period 2007-2011. After we have documented on the past researches regarding the relationship between ownership and firm value in Central and Eastern Europe (Smith, Cin, and Vodopivec, 1997; Claessens and Djankov, 1999; Akimova and Schwödiauer, 2004; Earle, Kucsera, and Telegdy, 2005), we concluded that the studies on Romania analyzed the privatisation process started after 1989. Even if the privatisation process is not over entirely in Romania, we provide updated evidence drawing on data from Romania, a market identified by a high average ownership concentration similar to the Continental Europe and much of the non-Anglo-American markets. The remainder of the paper is organized as follows: in the following section we present a review of the relevant literature and develop the hypotheses to be tested in the empirical work; the next section describes the sample, variables, and methods, followed by the results in section four; we conclude by relating our findings, the limitations of our study, and potential directions for future research.
1. Literature Review and Hypotheses Development
Ownership Concentration and Firm Value in Previous Literature
Through the ownership concentration all the premises which allow large blockholders to follow their own interests are established; nevertheless, the influence on firm value being different. On the one hand, ownership concentration positively influences firm value, because the investors with high stakes are more interested in monitoring the company directors. On the other hand, the influence of ownership concentration on firm value could be negative, because a highly concentrated ownership could mean underdeveloped capital markets. However, control as a disciplinary mechanism is inefficient. Also, some of the shareholders with large holdings could establish certain commercial or financial relations according to their aims but contrary to the company goals. Thus, this behaviour adopted by the largest shareholders in some cases is harmful with respect to minority shareholders. According to La Porta, Lopez-de-Silanes, Shleifer, and Vishny (2002), high levels of ownership concentration are typical in countries with relatively weak protection of the investors, revealing the dispute between majority and minority shareholders. In this way the distinction between French civil law countries which have the weakest protection and common law countries which have the strongest protection of outside investors, both shareholders and creditors, is reflected, with the German civil law and Scandinavian countries law being in between. As a consequence, the agency problem is different in these countries. In common law countries, the consequence of a low level of ownership concentration is reflected through the agency dispute between managers and
The Effects of Ownership Concentration
Romanian Journal of Economic Forecasting – XVII (3) 2014 53
shareholders, because the shareholders have a low power of monitoring and control. In civil law countries, the companies are owned and controlled by shareholders with high stakes, the agency conflict between managers and shareholders being reduced, but there are disputes between majority and minority shareholders. The majority shareholders own the power and the required incentives to prevent the expropriation, to the benefit of minority shareholders. However, there could be a situation identified through the expropriation of minority shareholders initiated by the majority shareholders. Thereby, the studies regarding the relationship between ownership concentration and firm value are wide, but the results are not convergent. Thus, there are studies which provide empirical support for a positive relationship between ownership concentration and firm performance (Berle and Means, 1932; Claessens and Djankov, 1999; Mitton, 2002). Besides, there are studies which show a non-significant relationship between ownership concentration and firm performance (Demsetz and Lehn, 1985; Demsetz and Villalonga, 2001). Berle and Means (1932) underlined the separation of ownership and control in modern corporations with diffused ownership and the negative influence on firm value. In this context, there are companies managed by persons other than their owner(s), where the management benefits from the freedom in the use of the companies’ resources, which would not be the case if the companies were managed by its/their owners(s) or if ownership interests were more concentrated. Because often the interests of management and shareholders are not the same, Berle and Means (1932) mentioned the fact that when managers have low stakes in the companies they run daily and the ownership is diffused the benefits are in management’s favor than in the shareholders’ favor. The inverse correlation between the diffused ownership structure and firm performance was challenged by Demsetz (1983). According to Demsetz (1983), the ownership structure identified in different companies, either diffused or concentrated, ought to be influenced by the interests of the shareholders in order to maximize the profit. As a consequence, there should be no systematic relation between variations in ownership structure and variations in firm performance. A concentrated ownership structure could limit the agency problem, so that the proper framework to increase the value of the firm is developed. This fact could be explained through an efficient monitoring process. Thus, a highly concentrated ownership causes an increase in the incentives and power of the shareholders with large holdings, in order to monitor the management at low cost. Becht and Röell (1999) showed the concentration of voting power in Continental Europe relative to the U.S.A. and the U.K. However, the agency problem, as mentioned above, is different. While in the U.S.A. there are conflicts of interest between managers and diffused shareholders, characterized by a low interventionism, in Continental Europe there are large blockholders which could exercise control over management. On the other hand, Holderness and Sheehan (1988) identified the fact that investment expenditures, corporate reorganizations, accounting rates of return, and Tobin’s Q ratio are equivalent for both types of ownership structure. An increase in stock prices when majority blocks were traded and substantial management turnover were revealed. However, the hypothesis that individuals or corporations holding majority blocks of stock in publicly traded corporations used the resources of the companies for their

Institute for Economic Forecasting
Romanian Journal of Economic Forecasting –XVII (3) 2014 54
welfare was rejected. It was mentioned that the only difference between the diffused and concentrated ownership structure was represented by larger wages and bonuses for majority shareholders than for similar executives in diffusely held firms. Also, the majority shareholders exercise control over management not only by monitoring, but also by placing their representatives in top management positions. According to Zwiebel (1995), if there is a majority shareholder with large holdings, the presence of additional shareholders will reduce the liquidity of the firm’s shares on the market, seeming unlikely to contribute to further monitoring of management. Thus, additional blockholders show small marginal contributions to the managerial monitoring, in this way serving only to increase the costs of concentration by reducing the trading activity and the information value of the share price. On the other hand, when there is not a majority shareholder, the existence of multiple medium-sized owners is beneficial because they form coalitions in order to exercise a common control over management. If the largest shareholder holds a minority stake, additional blockholders serve actively in the monitoring process, and for a given size of the largest blockholder, the firm’s share liquidity is diminished at a reduced rate. Claessens and Djankov (1999) concluded that a 10% increase in concentration of the top five investors leads to a 2% increase in short-term labor productivity and a 3% increase in short-term profitability. According to Mitton (2002), higher disclosure quality and higher ownership concentration determined better stock price performance during the East Asian financial crisis (July 1997 to August 1998). Also, the presence of a strong blockholder was beneficial during the crisis, because a strong blockholder has the incentive and power to prevent expropriation of minority shareholders. Earle et al. (2005) analysed the relationship between ownership structure and firm performance by using a sample of all companies listed on the Budapest Stock Exchange. The authors have concluded that the percentage of shares held by the largest blockholder and the sum of holdings of the largest and the second largest blockholder positively influenced firm performance. When controlled for the size of the largest block, point estimates of the marginal effects of additional blocks were negative. This result implied the fact that when the largest blockholder held a percentage of shares below 50%, additional blockholders had a larger negative effect. The results exhibited by Earle et al. (2005) are inconsistent with Zwiebel’s (1995) prediction, in a company there are more shareholders with high stakes. Thus, the marginal costs of concentration may outweigh the benefits which could result from the monitoring process. Mínguez-Vera and Martín-Ugedo (2007) identified a positive effect of shareholdings on firm value when the major shareholders were individuals. It was argued that individuals as shareholders showed a positive effect in limiting the conflicts between shareholders and directors. Additionally, the results provided support for a non-significant relationship between the major shareholder as an institution and the firm value. However, a non-significant relationship resulted between the concentration of shareholdings and firm value. When the authors considered the possible endogeneity of the concentration of shareholdings and the degree of control, the results showed a positive influence of the concentration of shareholdings on Tobin’s Q ratio, consistent with Berle and Means (1932).
The Effects of Ownership Concentration
Romanian Journal of Economic Forecasting – XVII (3) 2014 55
Demsetz and Lehn (1985) found a non-significant relationship between the concentration of shareholdings, represented by the percentage of shares controlled by the top five shareholders and top 20 shareholders, and the accountig profit rate. According to Morck, Shleifer, and Vishny (1988), the failure of Demsetz and Lehn (1985) to find a relationship between ownership concentration and profitability could be due to their use of a linear specification that does not capture an important nonmonotonicity. Demsetz and Villalonga (2001) showed that the fraction of shares owned by the five largest shareholders show a negative influence on financial performance, while the fraction of shares owned by management provides support for a positive influence. When the endogeneity of ownership structure was taken into consideration both variables regarding ownership structure showed a non-significant relationship with firm performance. Thus, according to Demsetz and Villalonga (2001), ownership structures, whether diffused or concentrated, that maximize shareholder expected returns are those that emerge from the interplay of market forces. The above discussion on the relationship between ownership concentration and firm value suggests the following hypothesis: Hypothesis 1. The concentration of the shareholdings within the companies listed on the Bucharest Stock Exchange positively influences firm value.
Ownership Origin and Firm Value in Literature The origin of ownership is influenced by the investment barriers and information asymmetry. Stulz (1981) asserted the fact that certain limits as government restrictions, taxes, and high transaction cost, determined the investors to invest in foreign assets only after the return they offered was satisfactorily high in order to compensate for the encountered barriers. Because before the transition period the foreign ownership was restricted, the beneficial effects were observed more deeply in the transition economies than in the stable economies. Besides, these benefits could appear with a certain delay. Thus, Konings (2001) found only in Poland that foreign firms performed better than firms without foreign participation. In Bulgaria and Romania, no robust evidence was found of a positive foreign ownership effect, because the companies from these countries were undergoing the restructuring process whose effects were showed in the subsequent period. Smith et al. (1997) concluded that a percentage point increase in foreign ownership is associated with an increase of about 3.9% in value added. Also, Khanna and Palepu (1999) found that Tobin’s Q ratio is positively related to the presence of foreign institutional investors. Douma, Rejie and Rezaul (2006) documented a positive influence of foreign ownership on firm performance. It was argued that the average shareholdings of foreign corporations were significantly higher than foreign institutions, the incentives and the rewards to monitor being higher. According to Douma et al. (2006) these corporations do not have time to devote their time and attention to a multitude of firms in which they invest, compared to the fund managers from foreign financial institutions. Aydin, Sayim, and Yalama (2007) concluded that the foreign-owned companies listed at Istanbul Stock Exchange, performed better than the companies with domestic owners.
Institute for Economic Forecasting
Romanian Journal of Economic Forecasting –XVII (3) 2014 56
Furthermore, there are studies which identified a nonlinear relationship between foreign ownership and firm value. Thus, Akimova and Schwödiauer (2004) showed that a rise in foreign ownership has a positive impact on performance up to a threshold of 39%, above which the impact began to diminish. This result is due to an institutional environment adverse to foreign ownership. Ferris and Park (2005) identified that Q rises until foreign ownership reaches approximately 40% to 45%, and then falls back. It was argued that large foreign institutional investors invest in well-performing firms and serve actively the monitoring process. However, foreign institutional investors are interested in the firm activities for a long time contrary to the perception of short-term speculators. Ferreira and Matos (2008) showed that the companies with higher ownership by foreign and independent institutions are characterized by higher firm valuations, better operating performance, and lower capital expenditures. However, foreign and independent institutions are involved in monitoring the companies worldwide. Barbosa and Louri (2005) researched whether multinational corporations operating in Greece and Portugal performed differently than domestic companies. There resulted non-significant differences which could explain the performance in both countries. However, multinational corporations operating in Greece were significantly more profitable than Greek-owned firms, if a specific measure of profitability as gross return on assets was considered and only for the firms in the upper quantiles The above discussion on the relationship between ownership origin and firm value suggests the following hypothesis: Hypothesis 2. The percentage of shares held by the foreign investors within the companies listed on the Bucharest Stock Exchange shows a nonlinear relationship with firm value.
2. Data and Estimation
Sample and Data Description We examine the impact of ownership concentration and origin on firm value over the period 2007-2011. The sample for this research is drawn from firms listed on the Bucharest Stock Exchange by all the three tiers as follows: 63 companies in 2007, 67 companies in 2008, and 68 companies between 2009 and 2011, amounting 334 statistical observations. We did not consider in our sample the listed financial firms (11), including three credit institutions, five Romanian Financial Investment Companies (SIFs), one financial investment company, Bucharest Stock Exchange and the investment fund “Fondul Proprietatea” (FP), because this sector of activity is subject to different disclosure requirements. The Romanian Financial Investment Companies were created as a result of voucher privatisation in order to tranfer to the population 30% of the shareholdings owned by the Romanian State. Besides SIFs, the investment fund “Fondul Proprietatea” (FP) was created in order to compensate the persons who were abusively expropriated during the communist regime. However, our sample does not comprise the companies from `Unlisted` tier (25 companies) and from `International` tier (two companies). The domains are varied: wholesale/retail, construction, pharmaceuticals, manufacturing, plastics, machinery and equipment, metalurgy, food, chemicals, basic resources, transportation and storage, tourism,

The Effects of Ownership Concentration
Romanian Journal of Economic Forecasting – XVII (3) 2014 57
utilities. In order to test the hypotheses, we have considered variables related to corporate governance and financial variables. Information about ownership concentration and origin comes from the BSE webpage and from the Annual Reports of the Administrators. Financial information comes from the Annual Reports of the companies. All the data were hand-collected. Table 1 summarizes the definition and measurement of all the variables used in this paper. We have considered the percentage of shares held by the three largest shareholders, both separately and aggregated, because the percentage of shares held by the next shareholders was not too high to cause significant changes. However, this has been influenced by a high level of holdings corresponding to the largest shareholder.
Table 1 Definition and Measurement of Variables
Variables Definition and Measurement Firm Value Variables
QAdj Industry-adjusted Tobin’s Q ratio. Q was computed as the market value of assets divided by the book value of assets, where the market value of assets equalled the book value of assets plus the market value of common equity less the sum of the book values of common equity.
Ownership Concentration Variables S1 The percentage of shares held by the largest shareholder (%). S12 The percentage of shares held by the largest shareholder, squared
(%). D Dummy variable:
If the percentage of shares held by the largest shareholder > a certain threshold (30%, 40%, 50%, 60%, 70%), D = 1; If the percentage of shares held by the largest shareholder < a certain threshold (30%, 40%, 50%, 60%, 70%), D = 0.
S2 The percentage of shares held by the second largest shareholder (%).
S22 The percentage of shares held by the second largest shareholder, squared (%).
S3 The percentage of shares held by the third largest shareholder (%). S32 The percentage of shares held by the third largest shareholder
squared (%). C2 The sum of holdings of the largest and the second largest
shareholders (%). C22 The sum of holdings of the largest and the second largest
shareholders, squared (%). C3 The sum of holdings of the three largest shareholders (%). C32 The sum of holdings of the three largest shareholders, squared (%). SOver5 The sum of holdings of the shareholders with at least 5% stakes
(%).

Institute for Economic Forecasting
Romanian Journal of Economic Forecasting –XVII (3) 2014 58
Variables Definition and Measurement NSOver5 The number of shareholders with at least 5% stakes. HHI Herfindahl-Hirschmann index of ownership concentration, computed
by summing up the squared percentage of shares controlled by each shareholder with at least 5% stakes (%).
Minority The sum of holdings of the shareholders with stakes below 5% (%). Ownership Origin Variables
S1Res Dummy variable indicating the state of residence of the largest shareholder: • If the largest shareholder is Romanian = 0; • If the largest shareholder is Foreigner = 1;
SOver5RO The sum of holdings of the Romanian shareholders with at least 5% stakes (%).
SOver5RO2 The sum of holdings of the Romanian shareholders with at least 5% stakes, squared (%).
SOver5Foreign The sum of holdings of the foreign shareholders with at least 5% stakes (%).
SOver5Foreign2 The sum of holdings of the foreign shareholders with at least 5% stakes, squared (%).
NSOver5RO The number of Romanian shareholders with at least 5% stakes. NSOver5Foreign The number of foreign shareholders with at least 5% stakes.
Firm-level control variables Size Firm size, as annual average number of employees (logarithmic
values). Lev Leverage, computed as debt/book value of assets. SGrowth Sales growth, as the relative increase in sales from the previous
year (%). Listing Number of years since the listing on the BSE (logarithmic values). According to regulations, the companies listed on the BSE are required to disclose all the shareholders with at least 5% holdings. Based on previous studies regarding the relationship between corporate governance and firm value, we consider Tobin’s Q ratio as a proxy for firm value. Consistent with Gompers, Ishii, and Metrick (2003) and Bebchuck, Cohen and Ferrell (2009), we follow Kaplan and Zingales’ (1997) method for the computation of Q (the definition of Tobin’s Q ratio is listed in Table 1. However, we have not considered the market value of debt at the numerator, respectively the replacement cost of assets at denominator, consistent with previous studies (La Porta et al., 2002; Doidge, Karolyi, and Stulz, 2004; Gozzi, Levine, and Schmukler, 2008). After we have computed the Tobin’s Q ratio for each company, we have adjusted it according to the industry membership, following the methodology described by Eisenberg, Sundgren, and Wells (1998), because in our sample were included companies from thirteen economic sectors. Thus, the difference between firm Tobin’s Q ratio and the industry’s median Tobin’s Q ratio is ∆Q, while the industry-
The Effects of Ownership Concentration
Romanian Journal of Economic Forecasting – XVII (3) 2014 59
adjusted measure of Tobin’s Q ratio (QAdj) is defined as follows: QAdj = sign(∆Q)*sqrt(|∆Q|), where sign(∆Q) is the sign of the difference between firm Tobin’s Q ratio and the industry’s median Tobin’s Q ratio. We decided to use median instead of mean because our data did not follow a normal distribution. There are many firm characteristics that could be related to both Tobin’s Q ratio and corporate governance. Therefore, we included several control variables. Thus, we used the logarithm of the annual average number of employees to control for the size of the companies. Fama and Jensen (1983) argued that large companies are more diversified than small companies, the failure risk being reduced. According to Short and Keasey (1999), size positively influences firm performance, because large companies could obtain funds, both internal and external, more easily. However, large corporations could create entry barriers through economies of scale. Consistent with McConnell and Servaes (1990), Morck et al. (1988), and Short and Keasey (1999), we included leverage to control for the level of indebtedness. Large companies could support a higher debt-contracting sustained by the disclosure in the information flow to the creditors. Besides, indebtedness could determine several problems as overinvestment (Jensen, 1986) or underinvestment (Myers, 1977). While Jensen (1986) emphasized the importance of indebtedness in order to limit the managerial discretion regarding the use of cash flow, according to Myers (1977), the inclusion of the debt in capital structure determines a reduction in the investments in profitable projects. Stulz (1988) mentioned the fact that high inside ownership should be associated with higher leverage. Also, inside ownership concentration diminishes the chance that hostile takeovers are successful. The next control variable included in the empirical analysis is sales growth as a measure of growth oppotunities. Morck et al. (1988) argued that if managers own high shareholdings in new, faster growing companies that tended to have high Qs, the positive relationship between board ownership and Q might be spurious. McConnell and Servaes (1995) provided support for a negative correlation between corporate value and leverage for high-growth firms and a positive correlation for low-growth firms, as a consequence of the monitoring function induced by indebtedness. The last control variable we use is the logarithm of the number of years since listing on the BSE in order to reflect the age of the company. According to Black, Jang, and Kim (2006) and Balasubramanian, Black, and Khanna (2010), new firms are likely to be faster-growing and perhaps more intangible asset intensive, which can lead to higher Tobin’s Q ratio.
Empirical Specification and Methods In order to study the influence of ownership concentration and origin on firm value we employ multivariate regression analysis in a panel data framework, both fixed effects (FE) and without cross-sectional effects (NE). However, the panel data analysis offers the advantage of exploring cross-sectional and time series data simultaneously. Thus, we will consider the following specification:
Firm_Valueit = α + βXit + γZit + uit (1)
Institute for Economic Forecasting
Romanian Journal of Economic Forecasting –XVII (3) 2014 60
where for each company (i = 1, ..., 68), over the period 2007-2011, we use as dependent variable the industry-adjusted Tobin’s Q ratio as a proxy for firm value, and several explanatory variables, as below: Xit is a vector of variables related to ownership concentration and origin, while Zit is a vector of control variables. Additionally, considering that the relationship between ownership concentration, origin, and firm value could be nonlinear, we estimate the following multivariate regression model for panel data:
Firm_Valueit = α + βXit + γXit2+ φZit + uit (2)
where: Xit is a vector of variables related to ownership concentration and origin, Xit2 is
a vector of squared variables related to ownership concentration and origin, and Zit is a vector of control variables. If the parameters β and γ have different signs after estimation, we find support for a nonlinear relationship, conditioned by the statistical validation. We find the inflection points by setting the partial derivatives ∂Firm_Value/∂X equal to zero and, after that, solving for X. Consistent with Earle et al. (2005), we consider the possibility suggested by Zwiebel (1995), according to whom the ownership concentration have different effects when the largest shareholder is very large than when that is less dominant. Thus, similar to Earle et al. (2005), we estimate the following model, the variables employed being described in Table 1:
Firm_Valueit = α + γ1S1itDit + γ2(SOver5it - S1it)Dit + γ3S1it(1 - Dit) + + γ 4(SOver5it - S1it)(1 - Dit) + Firm_valueit-1 + βZit+ uit (3)
Also, similarly to Earle et al. (2005), if γ 1 > 0, γ 2 = 0, γ 3 = 0 and γ 4 > 0, there could be a regime switch associated with a threshold for the largest shareholder’s stakes below which any additional shareholders with high stakes add value and above which they do not. As we described in Table 1, we consider several thresholds for the holdings corresponding to the largest shareholder.
4. Empirical Results
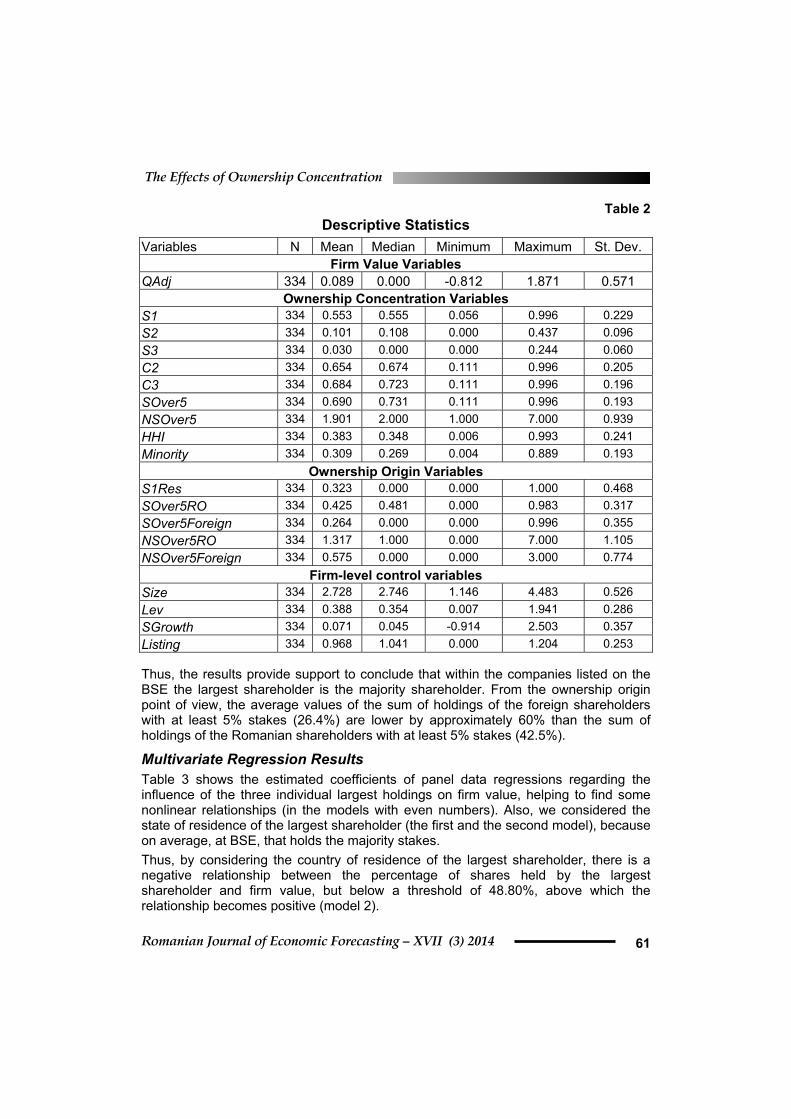
Descriptive Statistics Table 2 provides descriptive statistics for the variables employed in the empirical research. The statistics regarding ownership concentration variables reveals that, on average, the percentage of shares held by the largest shareholder is very high (55.3%). However, there are companies listed on the BSE within the holdings of the largest shareholder which exceed the threshold of 90%. As regards the second and the third largest shareholder, both average and maximum values of their shareholdings are much lower than those of the largest shareholder. However, the average values corresponding to the sum of holdings of the largest and the second largest shareholders and to the sum of holdings of the three largest shareholders are not very different (C2 = 65.4%, while C3 = 68.4%).
The Effects of Ownership Concentration
Romanian Journal of Economic Forecasting – XVII (3) 2014 61
Table 2 Descriptive Statistics
Variables N Mean Median Minimum Maximum St. Dev. Firm Value Variables
QAdj 334 0.089 0.000 -0.812 1.871 0.571 Ownership Concentration Variables
S1 334 0.553 0.555 0.056 0.996 0.229 S2 334 0.101 0.108 0.000 0.437 0.096 S3 334 0.030 0.000 0.000 0.244 0.060 C2 334 0.654 0.674 0.111 0.996 0.205 C3 334 0.684 0.723 0.111 0.996 0.196 SOver5 334 0.690 0.731 0.111 0.996 0.193 NSOver5 334 1.901 2.000 1.000 7.000 0.939 HHI 334 0.383 0.348 0.006 0.993 0.241 Minority 334 0.309 0.269 0.004 0.889 0.193
Ownership Origin Variables S1Res 334 0.323 0.000 0.000 1.000 0.468 SOver5RO 334 0.425 0.481 0.000 0.983 0.317 SOver5Foreign 334 0.264 0.000 0.000 0.996 0.355 NSOver5RO 334 1.317 1.000 0.000 7.000 1.105 NSOver5Foreign 334 0.575 0.000 0.000 3.000 0.774
Firm-level control variables Size 334 2.728 2.746 1.146 4.483 0.526 Lev 334 0.388 0.354 0.007 1.941 0.286 SGrowth 334 0.071 0.045 -0.914 2.503 0.357 Listing 334 0.968 1.041 0.000 1.204 0.253 Thus, the results provide support to conclude that within the companies listed on the BSE the largest shareholder is the majority shareholder. From the ownership origin point of view, the average values of the sum of holdings of the foreign shareholders with at least 5% stakes (26.4%) are lower by approximately 60% than the sum of holdings of the Romanian shareholders with at least 5% stakes (42.5%).
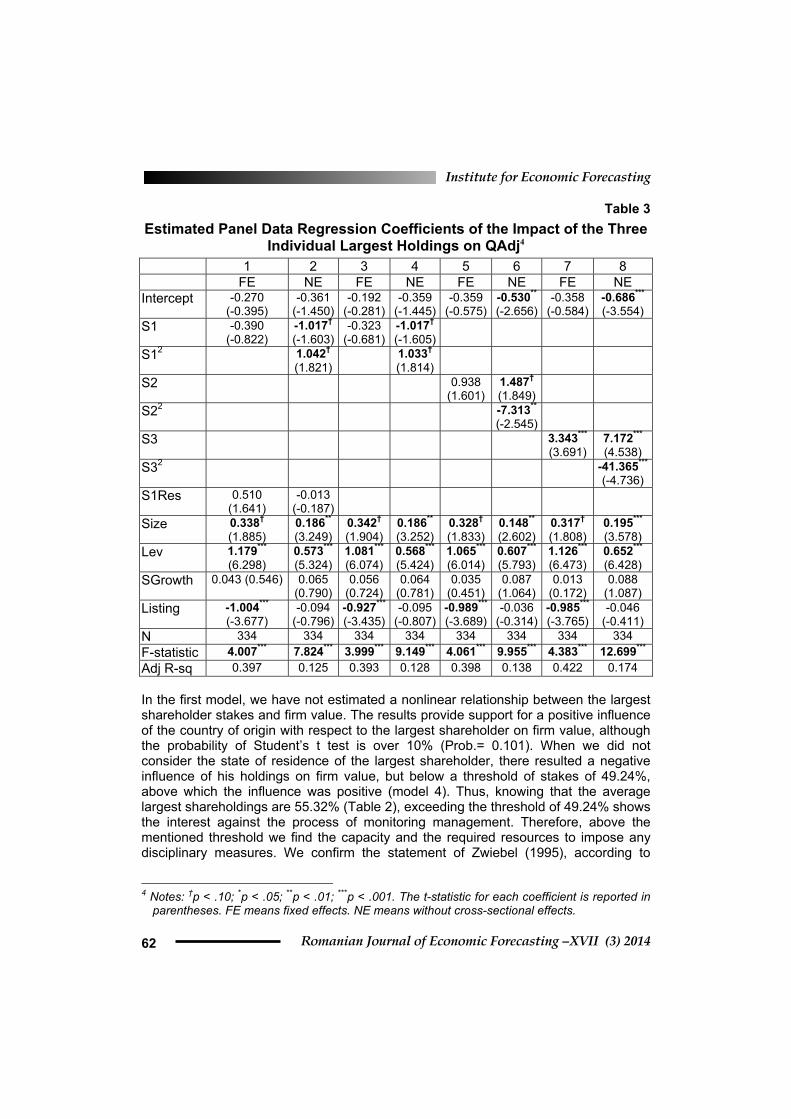
Multivariate Regression Results Table 3 shows the estimated coefficients of panel data regressions regarding the influence of the three individual largest holdings on firm value, helping to find some nonlinear relationships (in the models with even numbers). Also, we considered the state of residence of the largest shareholder (the first and the second model), because on average, at BSE, that holds the majority stakes. Thus, by considering the country of residence of the largest shareholder, there is a negative relationship between the percentage of shares held by the largest shareholder and firm value, but below a threshold of 48.80%, above which the relationship becomes positive (model 2).
Institute for Economic Forecasting
Romanian Journal of Economic Forecasting –XVII (3) 2014 62
Table 3 Estimated Panel Data Regression Coefficients of the Impact of the Three
Individual Largest Holdings on QAdj4 1 2 3 4 5 6 7 8 FE NE FE NE FE NE FE NE Intercept -0.270
(-0.395) -0.361
(-1.450)-0.192
(-0.281)-0.359
(-1.445)-0.359
(-0.575)-0.530**
(-2.656)-0.358
(-0.584) -0.686*** (-3.554)
S1 -0.390 (-0.822)
-1.017†
(-1.603)-0.323
(-0.681)-1.017†
(-1.605)
S12 1.042† (1.821)
1.033† (1.814)
S2 0.938 (1.601)
1.487† (1.849)
S22 -7.313**
(-2.545)
S3 3.343*** (3.691)
7.172*** (4.538)
S32 -41.365*** (-4.736)
S1Res 0.510 (1.641)
-0.013 (-0.187)
Size 0.338† (1.885)
0.186** (3.249)
0.342† (1.904)
0.186** (3.252)
0.328† (1.833)
0.148** (2.602)
0.317† (1.808)
0.195*** (3.578)
Lev 1.179*** (6.298)
0.573***
(5.324)1.081***
(6.074)0.568***
(5.424)1.065***
(6.014)0.607***
(5.793)1.126*** (6.473)
0.652*** (6.428)
SGrowth 0.043 (0.546) 0.065 (0.790)
0.056 (0.724)
0.064 (0.781)
0.035 (0.451)
0.087 (1.064)
0.013 (0.172)
0.088 (1.087)
Listing -1.004*** (-3.677)
-0.094 (-0.796)
-0.927***
(-3.435)-0.095
(-0.807)-0.989***
(-3.689)-0.036
(-0.314)-0.985*** (-3.765)
-0.046 (-0.411)
N 334 334 334 334 334 334 334 334 F-statistic 4.007*** 7.824*** 3.999*** 9.149*** 4.061*** 9.955*** 4.383*** 12.699*** Adj R-sq 0.397 0.125 0.393 0.128 0.398 0.138 0.422 0.174 In the first model, we have not estimated a nonlinear relationship between the largest shareholder stakes and firm value. The results provide support for a positive influence of the country of origin with respect to the largest shareholder on firm value, although the probability of Student’s t test is over 10% (Prob.= 0.101). When we did not consider the state of residence of the largest shareholder, there resulted a negative influence of his holdings on firm value, but below a threshold of stakes of 49.24%, above which the influence was positive (model 4). Thus, knowing that the average largest shareholdings are 55.32% (Table 2), exceeding the threshold of 49.24% shows the interest against the process of monitoring management. Therefore, above the mentioned threshold we find the capacity and the required resources to impose any disciplinary measures. We confirm the statement of Zwiebel (1995), according to
4 Notes: †p < .10; *p < .05; **p < .01; ***p < .001. The t-statistic for each coefficient is reported in
parentheses. FE means fixed effects. NE means without cross-sectional effects.
The Effects of Ownership Concentration
Romanian Journal of Economic Forecasting – XVII (3) 2014 63
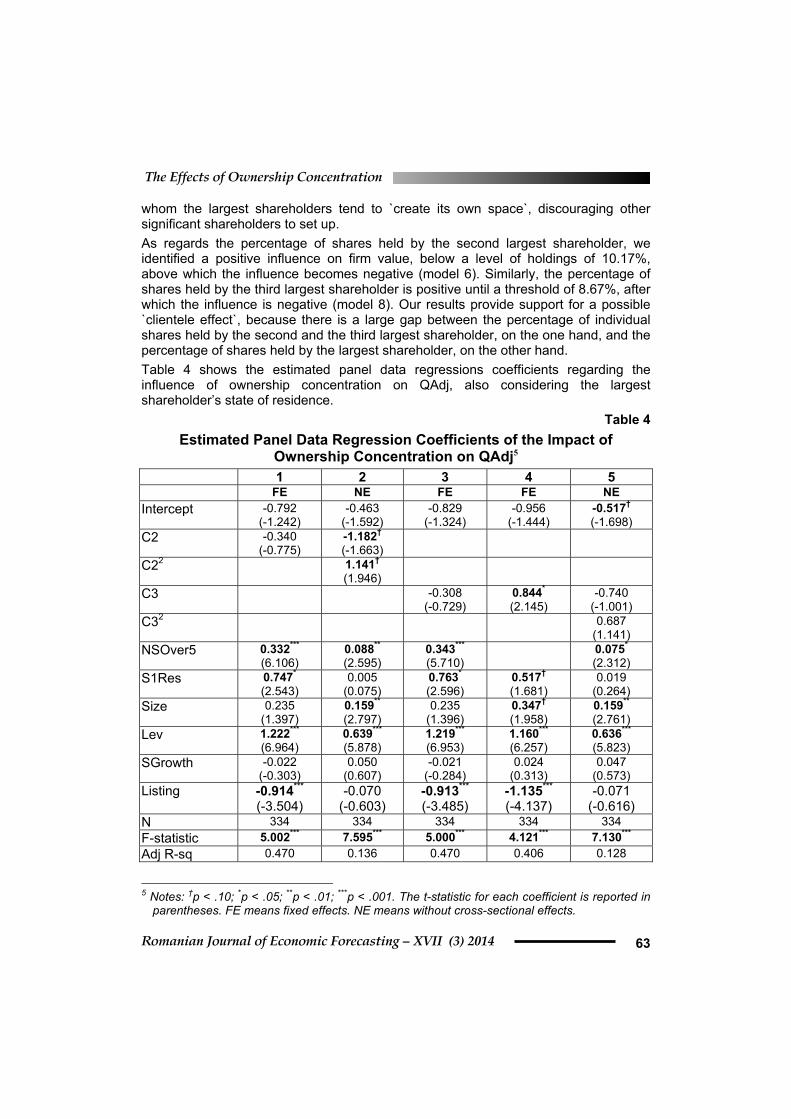
whom the largest shareholders tend to `create its own space`, discouraging other significant shareholders to set up. As regards the percentage of shares held by the second largest shareholder, we identified a positive influence on firm value, below a level of holdings of 10.17%, above which the influence becomes negative (model 6). Similarly, the percentage of shares held by the third largest shareholder is positive until a threshold of 8.67%, after which the influence is negative (model 8). Our results provide support for a possible `clientele effect`, because there is a large gap between the percentage of individual shares held by the second and the third largest shareholder, on the one hand, and the percentage of shares held by the largest shareholder, on the other hand. Table 4 shows the estimated panel data regressions coefficients regarding the influence of ownership concentration on QAdj, also considering the largest shareholder’s state of residence.
Table 4 Estimated Panel Data Regression Coefficients of the Impact of
Ownership Concentration on QAdj5 1 2 3 4 5 FE NE FE FE NE Intercept -0.792
(-1.242) -0.463
(-1.592) -0.829
(-1.324) -0.956
(-1.444) -0.517† (-1.698)
C2 -0.340 (-0.775)
-1.182† (-1.663)
C22 1.141† (1.946)
C3 -0.308 (-0.729)
0.844* (2.145)
-0.740 (-1.001)
C32 0.687 (1.141)
NSOver5 0.332*** (6.106)
0.088** (2.595)
0.343*** (5.710)
0.075* (2.312)
S1Res 0.747* (2.543)
0.005 (0.075)
0.763* (2.596)
0.517† (1.681)
0.019 (0.264)
Size 0.235 (1.397)
0.159** (2.797)
0.235 (1.396)
0.347† (1.958)
0.159** (2.761)
Lev 1.222*** (6.964)
0.639*** (5.878)
1.219*** (6.953)
1.160*** (6.257)
0.636*** (5.823)
SGrowth -0.022 (-0.303)
0.050 (0.607)
-0.021 (-0.284)
0.024 (0.313)
0.047 (0.573)
Listing -0.914*** (-3.504)
-0.070 (-0.603)
-0.913*** (-3.485)
-1.135*** (-4.137)
-0.071 (-0.616)
N 334 334 334 334 334 F-statistic 5.002*** 7.595*** 5.000*** 4.121*** 7.130*** Adj R-sq 0.470 0.136 0.470 0.406 0.128
5 Notes: †p < .10; *p < .05; **p < .01; ***p < .001. The t-statistic for each coefficient is reported in
parentheses. FE means fixed effects. NE means without cross-sectional effects.
Institute for Economic Forecasting
Romanian Journal of Economic Forecasting –XVII (3) 2014 64
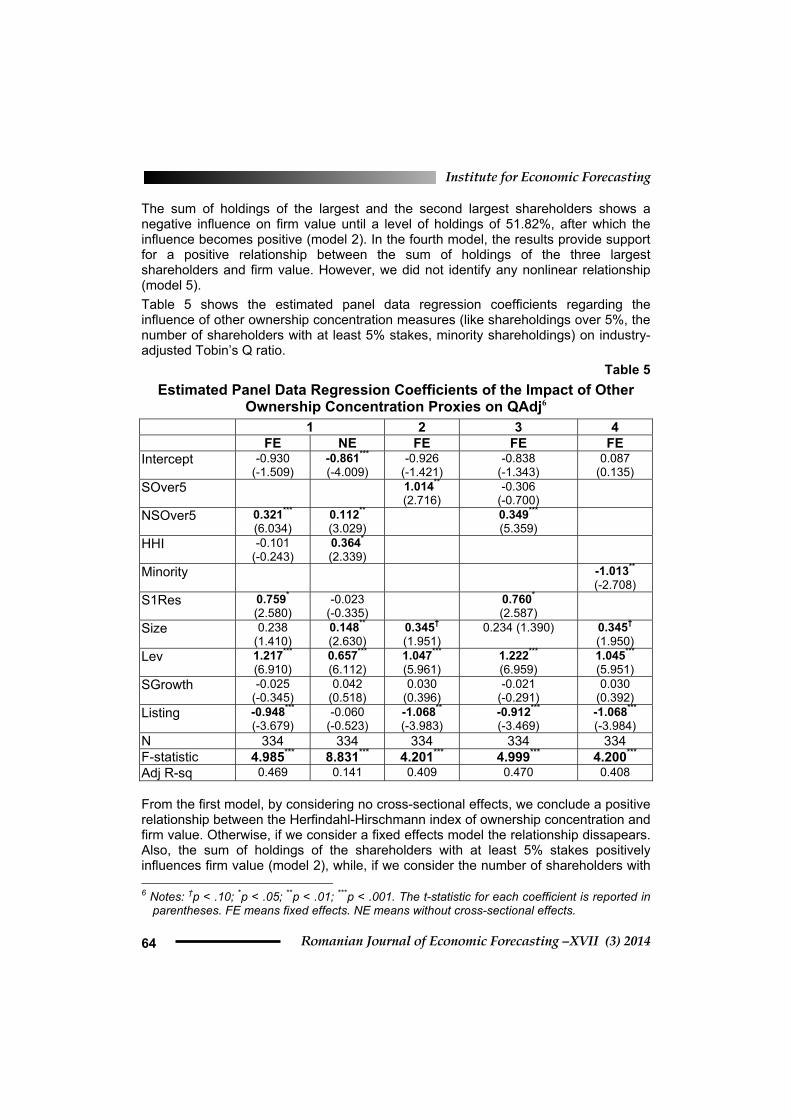
The sum of holdings of the largest and the second largest shareholders shows a negative influence on firm value until a level of holdings of 51.82%, after which the influence becomes positive (model 2). In the fourth model, the results provide support for a positive relationship between the sum of holdings of the three largest shareholders and firm value. However, we did not identify any nonlinear relationship (model 5). Table 5 shows the estimated panel data regression coefficients regarding the influence of other ownership concentration measures (like shareholdings over 5%, the number of shareholders with at least 5% stakes, minority shareholdings) on industry-adjusted Tobin’s Q ratio.
Table 5 Estimated Panel Data Regression Coefficients of the Impact of Other
Ownership Concentration Proxies on QAdj6 1 2 3 4 FE NE FE FE FE Intercept -0.930
(-1.509) -0.861*** (-4.009)
-0.926 (-1.421)
-0.838 (-1.343)
0.087 (0.135)
SOver5 1.014** (2.716)
-0.306 (-0.700)
NSOver5 0.321*** (6.034)
0.112** (3.029)
0.349*** (5.359)
HHI -0.101 (-0.243)
0.364* (2.339)
Minority -1.013** (-2.708)
S1Res 0.759* (2.580)
-0.023 (-0.335)
0.760* (2.587)
Size 0.238 (1.410)
0.148** (2.630)
0.345† (1.951)
0.234 (1.390) 0.345†
(1.950) Lev 1.217***
(6.910) 0.657*** (6.112)
1.047*** (5.961)
1.222*** (6.959)
1.045***
(5.951) SGrowth -0.025
(-0.345) 0.042
(0.518) 0.030
(0.396) -0.021
(-0.291) 0.030
(0.392) Listing -0.948***
(-3.679) -0.060
(-0.523) -1.068** (-3.983)
-0.912*** (-3.469)
-1.068***
(-3.984) N 334 334 334 334 334 F-statistic 4.985*** 8.831*** 4.201*** 4.999*** 4.200*** Adj R-sq 0.469 0.141 0.409 0.470 0.408 From the first model, by considering no cross-sectional effects, we conclude a positive relationship between the Herfindahl-Hirschmann index of ownership concentration and firm value. Otherwise, if we consider a fixed effects model the relationship dissapears. Also, the sum of holdings of the shareholders with at least 5% stakes positively influences firm value (model 2), while, if we consider the number of shareholders with 6 Notes: †p < .10; *p < .05; **p < .01; ***p < .001. The t-statistic for each coefficient is reported in
parentheses. FE means fixed effects. NE means without cross-sectional effects.
The Effects of Ownership Concentration
Romanian Journal of Economic Forecasting – XVII (3) 2014 65
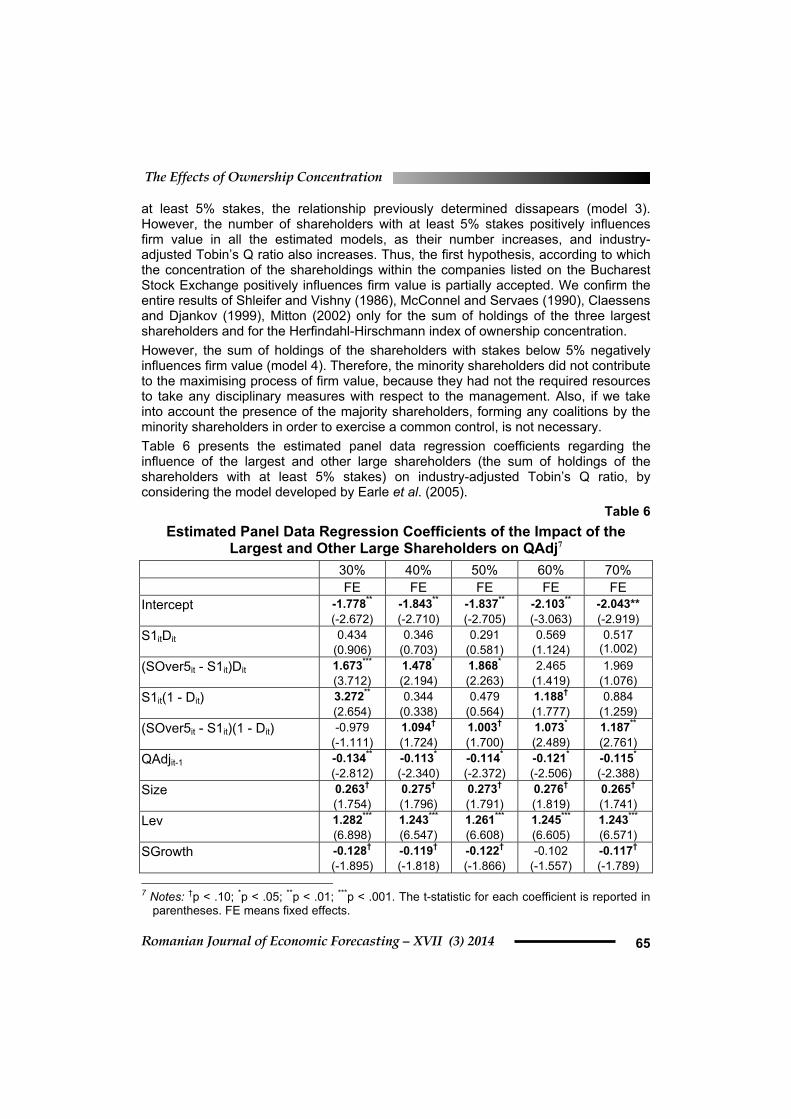
at least 5% stakes, the relationship previously determined dissapears (model 3). However, the number of shareholders with at least 5% stakes positively influences firm value in all the estimated models, as their number increases, and industry-adjusted Tobin’s Q ratio also increases. Thus, the first hypothesis, according to which the concentration of the shareholdings within the companies listed on the Bucharest Stock Exchange positively influences firm value is partially accepted. We confirm the entire results of Shleifer and Vishny (1986), McConnel and Servaes (1990), Claessens and Djankov (1999), Mitton (2002) only for the sum of holdings of the three largest shareholders and for the Herfindahl-Hirschmann index of ownership concentration. However, the sum of holdings of the shareholders with stakes below 5% negatively influences firm value (model 4). Therefore, the minority shareholders did not contribute to the maximising process of firm value, because they had not the required resources to take any disciplinary measures with respect to the management. Also, if we take into account the presence of the majority shareholders, forming any coalitions by the minority shareholders in order to exercise a common control, is not necessary. Table 6 presents the estimated panel data regression coefficients regarding the influence of the largest and other large shareholders (the sum of holdings of the shareholders with at least 5% stakes) on industry-adjusted Tobin’s Q ratio, by considering the model developed by Earle et al. (2005).
Table 6 Estimated Panel Data Regression Coefficients of the Impact of the
Largest and Other Large Shareholders on QAdj7 30% 40% 50% 60% 70% FE FE FE FE FE Intercept -1.778**
(-2.672) -1.843** (-2.710)
-1.837**
(-2.705) -2.103** (-3.063)
-2.043** (-2.919)
S1itDit 0.434 (0.906)
0.346 (0.703)
0.291 (0.581)
0.569 (1.124)
0.517 (1.002)
(SOver5it - S1it)Dit 1.673*** (3.712)
1.478* (2.194)
1.868*
(2.263) 2.465
(1.419) 1.969
(1.076) S1it(1 - Dit) 3.272**
(2.654) 0.344
(0.338) 0.479
(0.564) 1.188† (1.777)
0.884 (1.259)
(SOver5it - S1it)(1 - Dit) -0.979 (-1.111)
1.094† (1.724)
1.003†
(1.700) 1.073* (2.489)
1.187** (2.761)
QAdjit-1 -0.134** (-2.812)
-0.113* (-2.340)
-0.114*
(-2.372) -0.121* (-2.506)
-0.115* (-2.388)
Size 0.263† (1.754)
0.275† (1.796)
0.273†
(1.791) 0.276† (1.819)
0.265† (1.741)
Lev 1.282*** (6.898)
1.243*** (6.547)
1.261***
(6.608) 1.245*** (6.605)
1.243*** (6.571)
SGrowth -0.128† (-1.895)
-0.119† (-1.818)
-0.122†
(-1.866) -0.102
(-1.557) -0.117† (-1.789)
7 Notes: †p < .10; *p < .05; **p < .01; ***p < .001. The t-statistic for each coefficient is reported in
parentheses. FE means fixed effects.
Institute for Economic Forecasting
Romanian Journal of Economic Forecasting –XVII (3) 2014 66
30% 40% 50% 60% 70% FE FE FE FE FE Listing 0.086
(0.236) 0.253
(0.677) 0.242
(0.652) 0.250
(0.686) 0.282
(0.768) N 266 266 266 266 266 F-statistic 6.497*** 6.122*** 6.149*** 6.262*** 6.160***
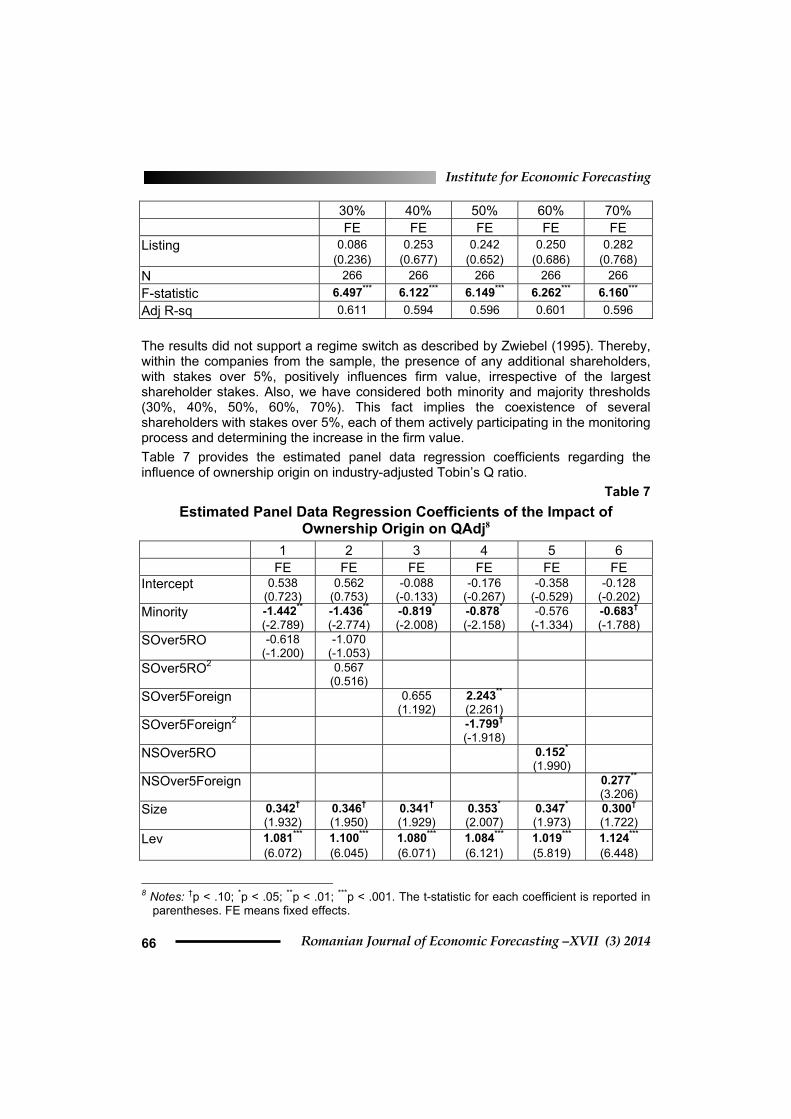
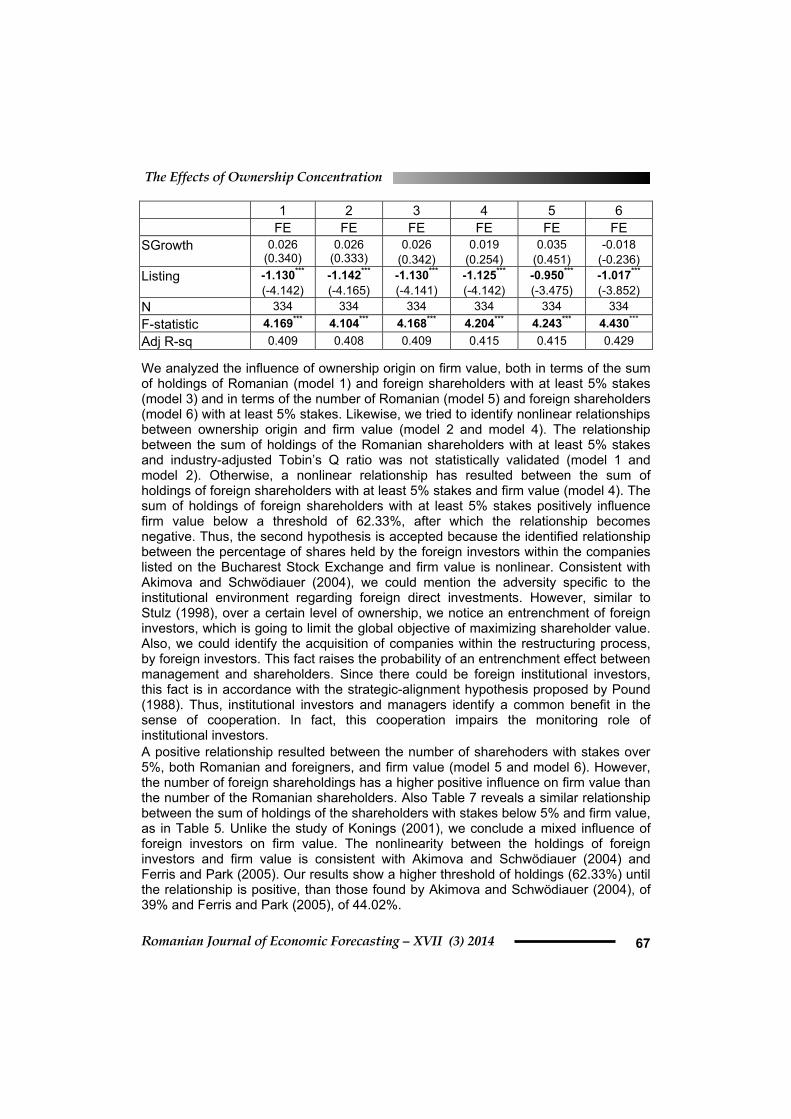
Adj R-sq 0.611 0.594 0.596 0.601 0.596 The results did not support a regime switch as described by Zwiebel (1995). Thereby, within the companies from the sample, the presence of any additional shareholders, with stakes over 5%, positively influences firm value, irrespective of the largest shareholder stakes. Also, we have considered both minority and majority thresholds (30%, 40%, 50%, 60%, 70%). This fact implies the coexistence of several shareholders with stakes over 5%, each of them actively participating in the monitoring process and determining the increase in the firm value. Table 7 provides the estimated panel data regression coefficients regarding the influence of ownership origin on industry-adjusted Tobin’s Q ratio.
Table 7 Estimated Panel Data Regression Coefficients of the Impact of
Ownership Origin on QAdj8 1 2 3 4 5 6 FE FE FE FE FE FE Intercept 0.538
(0.723) 0.562
(0.753) -0.088
(-0.133) -0.176
(-0.267) -0.358
(-0.529) -0.128
(-0.202) Minority -1.442**
(-2.789) -1.436** (-2.774)
-0.819* (-2.008)
-0.878* (-2.158)
-0.576 (-1.334)
-0.683† (-1.788)
SOver5RO -0.618 (-1.200)
-1.070 (-1.053)
SOver5RO2 0.567 (0.516)
SOver5Foreign 0.655 (1.192)
2.243** (2.261)
SOver5Foreign2 -1.799† (-1.918)
NSOver5RO 0.152* (1.990)
NSOver5Foreign 0.277** (3.206)
Size 0.342† (1.932)
0.346† (1.950)
0.341† (1.929)
0.353* (2.007)
0.347* (1.973)
0.300† (1.722)
Lev 1.081*** (6.072)
1.100*** (6.045)
1.080*** (6.071)
1.084*** (6.121)
1.019*** (5.819)
1.124*** (6.448)
8 Notes: †p < .10; *p < .05; **p < .01; ***p < .001. The t-statistic for each coefficient is reported in
parentheses. FE means fixed effects.
The Effects of Ownership Concentration
Romanian Journal of Economic Forecasting – XVII (3) 2014 67
1 2 3 4 5 6 FE FE FE FE FE FE SGrowth 0.026
(0.340) 0.026
(0.333) 0.026
(0.342) 0.019
(0.254) 0.035
(0.451) -0.018
(-0.236) Listing -1.130***
(-4.142) -1.142*** (-4.165)
-1.130*** (-4.141)
-1.125*** (-4.142)
-0.950*** (-3.475)
-1.017*** (-3.852)
N 334 334 334 334 334 334 F-statistic 4.169*** 4.104*** 4.168*** 4.204*** 4.243*** 4.430*** Adj R-sq 0.409 0.408 0.409 0.415 0.415 0.429 We analyzed the influence of ownership origin on firm value, both in terms of the sum of holdings of Romanian (model 1) and foreign shareholders with at least 5% stakes (model 3) and in terms of the number of Romanian (model 5) and foreign shareholders (model 6) with at least 5% stakes. Likewise, we tried to identify nonlinear relationships between ownership origin and firm value (model 2 and model 4). The relationship between the sum of holdings of the Romanian shareholders with at least 5% stakes and industry-adjusted Tobin’s Q ratio was not statistically validated (model 1 and model 2). Otherwise, a nonlinear relationship has resulted between the sum of holdings of foreign shareholders with at least 5% stakes and firm value (model 4). The sum of holdings of foreign shareholders with at least 5% stakes positively influence firm value below a threshold of 62.33%, after which the relationship becomes negative. Thus, the second hypothesis is accepted because the identified relationship between the percentage of shares held by the foreign investors within the companies listed on the Bucharest Stock Exchange and firm value is nonlinear. Consistent with Akimova and Schwödiauer (2004), we could mention the adversity specific to the institutional environment regarding foreign direct investments. However, similar to Stulz (1998), over a certain level of ownership, we notice an entrenchment of foreign investors, which is going to limit the global objective of maximizing shareholder value. Also, we could identify the acquisition of companies within the restructuring process, by foreign investors. This fact raises the probability of an entrenchment effect between management and shareholders. Since there could be foreign institutional investors, this fact is in accordance with the strategic-alignment hypothesis proposed by Pound (1988). Thus, institutional investors and managers identify a common benefit in the sense of cooperation. In fact, this cooperation impairs the monitoring role of institutional investors. A positive relationship resulted between the number of sharehoders with stakes over 5%, both Romanian and foreigners, and firm value (model 5 and model 6). However, the number of foreign shareholdings has a higher positive influence on firm value than the number of the Romanian shareholders. Also Table 7 reveals a similar relationship between the sum of holdings of the shareholders with stakes below 5% and firm value, as in Table 5. Unlike the study of Konings (2001), we conclude a mixed influence of foreign investors on firm value. The nonlinearity between the holdings of foreign investors and firm value is consistent with Akimova and Schwödiauer (2004) and Ferris and Park (2005). Our results show a higher threshold of holdings (62.33%) until the relationship is positive, than those found by Akimova and Schwödiauer (2004), of 39% and Ferris and Park (2005), of 44.02%.

Institute for Economic Forecasting
Romanian Journal of Economic Forecasting –XVII (3) 2014 68
Additionally, if we analyse the influence of control variables on firm value, the results provide support for a positive relationship between leverage and firm value. Thus, the importance of indebtedness as stated by Jensen (1986), as a way of limiting managerial discretion in using the cash-flow, is confirmed. Except for coefficient estimates from Table 6, the relationship between the relative increase in sales from the previous year and firm value was not statistically validated. We identified a positive relationship between the size of the companies and industry-adjusted Tobin’s Q ratio, while the relationship between the number of years since the listing on the BSE and firm value was negative, the average time since listing being ten years.
5. Concluding Discussion
The aim of this paper was to investigate the influence of ownership concentration and origin on firm value, in order to provide the first empirical evidence for the companies listed on the Bucharest Stock Exchange, characterized by a highly concentrated ownership. Thus, with some exceptions, the ownership concentration showed a positive influence on firm value. The exceptions are represented by the nonlinear relationships between the percentage of shares held by the three largest shareholders considered separately and firm value, on the one hand, and the sum of holdings of the largest and the second largest blockholders and firm value, on the other hand. However, by controlling for the size of the largest shareholder, the marginal effects of additional shareholders with stakes over 5% were positive. Additionally, after we investigated the impact of ownership origin on firm value, the results provided support for a positive influence of the country of residence of the largest shareholder on firm value. Subsequently, by considering the percentage of shares held by foreign investors with at least 5% stakes, a positive relationship with firm value until a threshold of 62.33%, below which the influence became negative. The arguments are represented by the institutional environment from Romania regarding the foreign investments, as well as the own goals of foreign investors. The limitations of this study result from the size of the sample, given by the context of a small Romanian capital market. As future research directions, the relationship between ownership concentration and firm value could be analysed by taking into consideration the identity of the shareholders: insiders, institutional investors, State, employees. However, there could be controlled for the possible endogeneity of a firm’s ownership structure, since the current research did not control for endogeneity. In fact, there are several authors (Hermalin and Weisbach, 2003; Himmelberg, Hubbard, and Palia, 1999; Denis and Kruse, 2000; Wintoki, Linck, and Netter, 2012) who argued that firm performance and corporate governance were simultaneously determined by unobservable firm-specific factors, as well governance changes are determined by past, present, or expected characteristics of the firm. According to Schultz, Tan, and Walsh (2010) the dynamic generalized method of moments (GMM) panel specifications, as developed by Holtz-Eakin, Newey, and Rosen (1988), Arellano and Bond (1991), Arellano and Bover (1995), and Blundell and Bond (1998), can overcome the estimation problems caused by unobservable heteroskedasticity,
The Effects of Ownership Concentration
Romanian Journal of Economic Forecasting – XVII (3) 2014 69
simultaneity, and dynamic endogeneity, and produce unbiased and consistent estimates by employing valid internal instruments during estimation. Therefore, we will employ a dynamic panel GMM specification procedure that is robust to endogeneity, simultaneity, and heterogeneity.
References
Akimova, I. and Schwödiauer G., 2004. Ownership structure, corporate governance, and enterprise performance: Empirical Results for Ukraine. International Advances in Economic Research, 10(1), pp. 28-42.
Arellano M. and Bover, O., 1995. Another look at the instrumental variable estimation of error component models. Journal of Econometrics, 68(1), pp. 29-51.
Arellano, M. and Bond, S., 1991. Some tests of specification for panel data: Monte Carlo evidence and an application to employment equation. Review of Economic Studies, 58(2), pp. 277-297.
Aydin, N., Sayim, M., and Yalama A., 2007. Foreign ownership and firm performance: Evidence from Turkey. International Research Journal of Finance and Economics, 11, pp. 103-111.
Balasubramanian, N., Black, B. S., and Khanna, V., 2010. The relation between firm-level corporate governance and market value: A case study of India. Emerging Markets Review, 11, pp. 319-340.
Barbosa, N., and Louri, H., 2005. Corporate performance: Does ownership matter? A comparison of foreign - and domestic - owned firms in Greece and Portugal. Review of Industrial Organization, 27(1), pp. 73-102.
Becht, M. and Röell, A., 1999. Blockholdings in Europe: An international comparison. European Economic Review, 43(4-6), pp. 1049-1056.
Berle, A. and Means, G., 1932. The modern corporation and private property. New York: Macmillan.
Black, B., Jang, H., and Kim, W., 2006. Does corporate governance affect firm value? Evidence from Korea. Journal of Law, Economics & Organization, 22(2), pp. 366-413.
Blundell, R. and Bond, S., 1998. Initial conditions and moment restrictions in dynamic panel data models. Journal of Econometrics, 87(1), pp. 115-143.
Claessens, S. and Djankov, S., 1999. Ownership concentration and corporate performance in the Czech Republic. Journal of Comparative Economics, 27(3), pp. 498-513.
Demsetz, H. and Lehn, K., 1985. The structure of corporate ownership: causes and consequences. The Journal of Political Economy, 93(6), pp. 1155-1177.
Demsetz, H. and Villalonga, B., 2001. Ownership structure and corporate performance. Journal of Corporate Finance, 7(3), pp. 209-233.
Demsetz, H., 1983. The structure of ownership and the theory of the firm. Journal of Law and Economics, 26(2), pp. 375-390.
Denis, D.J. and Kruse, T. A., 2000. Managerial discipline and corporate restructuring following performance decline. Journal of Financial Economics, 55(3), pp. 391-424.

Institute for Economic Forecasting
Romanian Journal of Economic Forecasting –XVII (3) 2014 70
Doidge, C. Karolyi, G.A. and Stulz, R., 2004. Why are foreign firms listed in the U.S. worth more?. Journal of Financial Economics, 71(2), pp. 205-238.
Douma, S. Rejie, G. and Rezaul, K., 2006. Foreign and domestic ownership, business groups, and firm performance: evidence from a large emerging market. Strategic Management Journal, 27(7), pp. 637-657.
Earle, S.J. Kucsera, C. and Telegdy, A., 2005. Ownership concentration and corporate performance on the Budapest Stock Exchange: Do too many cooks spoil the goulash?. Corporate Governance: An International Review, 13(2), pp. 254-264.
Eisenberg, T., Sundgren, S. and Wells, M. T., 1998. Larger board size and decreasing firm value in small firms. Journal of Financial Economics, 48(1), pp. 35-54.
Fama, E.F. and Jensen, M.C., 1983. Separation of Ownership and Control. Journal of Law and Economics, 26(2), pp. 301-325.
Ferreira, M.A. and Matos, P., 2008. The colors of investors’ money: The role of institutional investors around the world. Journal of Financial Economics, 88(3), pp. 499-533.
Ferris, S.P. and Park, K., 2005. Foreign ownership and firm value: Evidence from Japan. Advances in Financial Economics, 11, pp. 29.
Gompers, P., Ishii, J., and Metrick, A., 2003. Corporate governance and equity prices. Quarterly Journal of Economics, 118(1), pp. 107-156.
Gozzi, J.C. Levine, R., and Schmukler, S. L., 2008. Internationalization and the evolution of corporat evaluation. Journal of Financial Economics, 88(3), pp. 607-632.
Hermalin, B.E. and Weisbach, M. S., 2003. Board of directors as an endogenously determined institution: A survey of the economics literature. Economic Policy Review, 9(1), pp. 7-26.
Himmelberg, C.P. Hubbard, R.G. and Palia, D., 1999. Understanding the determinants of managerial ownership and the link between ownership and performance. Journal of Financial Economics, 53(3), pp. 353-384.
Holderness, C.G. and Sheehan, D.P., 1988. The role of majority shareholders in publicly held corporations: An exploratory analysis. Journal of Financial Economics, 20, pp. 317-346.
Holtz-Eakin, D. Newey, W. and Rosen, H. S., 1988. Estimating vector autoregressions with panel data. Econometrica, 56(6), pp. 1371-1395.
Jensen, M. C., 1986. Agency costs of free cash flow, corporate finance and takeovers. American Economic Review, 76(2), pp. 323-339.
Kaplan, S. and Zingales, L., 1997. Do investment-cash flow sensitivities provide useful measures of financing constraints?. Quarterly Journal of Economics, 112(1), pp. 169-216.
Khanna, T. and Palepu, K., 1999. Emerging market business groups, foreign investors, and corporate governance, National Bureau of Economic Research Working Paper 6955.
Konings, J., 2001. The effects of direct foreign investment on domestic firms. Evidence from firm level panel data in emerging economies. Economics of Transition, 9(3), pp. 619-633.
The Effects of Ownership Concentration
Romanian Journal of Economic Forecasting – XVII (3) 2014 71
La Porta, R. Lopez-de-Silanes, F. Shleifer, A., and Vishny, R., 2002. Investor protection and corporate valuation. The Journal of Finance, 57(3), pp. 1147-1170.
Lin, F-L., 2014. Board Ownership and Firm Value in Taiwan - A Panel Smooth Transition Regression Model. Romanian Journal of Economic Forecasting, 16(4), pp. 148-160.
McConnell, J.J. and Servaes, H. 1990. Additional evidence on equity ownership and corporate value. Journal of Financial Economics, 27(2), pp. 595-612.
McConnell, J.J. and Servaes, H., 1995. Equity ownership and the two faces of debt. Journal of Financial Economics, 39(1), pp. 131-157.
Mínguez-Vera, A. and Martín-Ugedo, J. F., 2007. Does ownership structure affect value? A panel data analysis for the Spanish market. International Review of Financial Analysis, 16(1), pp. 81-98.
Mitton, T., 2002. A cross-firm analysis of the impact of corporate governance on the East Asian financial crisis. Journal of Financial Economics, 64(2), pp. 215-241.
Morck, R., Shleifer, A., and Vishny, R. W., 1988. Management ownership and market valuation: An empirical analysis. Journal of Financial Economics, 20, pp. 293-315.
Myers, S.C., 1977. Determinants of corporate borrowing. Journal of Financial Economics, 5(2), pp. 147-175.
Pound, J., 1988. Proxy contests and the efficiency of shareholder oversight. Journal of Financial Economics, 20, pp. 237-265.
Schultz, E.L. Tan, D.T. and Wlash, K.D., 2010. Endogeneity and the corporate governance - performance relation. Australian Journal of Management, 35(2), pp. 145-163.
Shleifer, A. and Vishny, R.W., 1986. Large shareholders and corporate control. Journal of Political Economy, 94(3), pp. 461-489.
Short, H. and Keasey, K., 1999. Managerial ownership and the performance of firms: Evidence from the U.K. Journal of Corporate Finance, 5(1), pp. 79-101.
Smith, S.C. Cin B-C. and Vodopivec, M., 1997. Privatization incidence, ownership forms, and firm performance: Evidence from Slovenia. Journal of Comparative Economics, 25(2), pp. 158-179.
Stulz, R.M., 1981. On the effects of barriers to international investment. The Journal of Finance, 36(4), pp. 923-934.
Stulz, R.M., 1988. Managerial control of voting rights: Financing policies and the market for corporate control. Journal of Financial Economics, 20, pp. 25-54.
Wintoki, M.B. Linck, J.S. and Netter, J.M., 2012. Endogeneity and the dynamics of internal corporate governance. Journal of Financial Economics,105(3), pp. 581-606.
Zwiebel, J., 1995. Block Investment and Partial Benefits of Corporate Control. Review of Economic Studies, 62(2), pp. 161-185.