4 Investigation of EMC in Wireless Communication …...Digital wireless communication services...
10
81 GOTOH Kaoru et al. 1 Introduction It is widely known that the electromagnet- ic waves (referred to as “electromagnetic dis- turbance”) emitted from electric and electronic devices such as household electrical appli- ances interfere with other devices or broadcast and communications services in the surround- ing area. Many countermeasures have been implemented for both the source and affected systems [1] . In view of the determination of restrictions on electromagnetic disturbance, the CISPR has established specifications for mea- suring equipment and legal limits of electro- magnetic disturbance emitted by electric and electronic devices (See examples[2]and[3] ). The electromagnetic disturbance measuring equipment specified by the CISPR features four detectors in the frequency ranges from 9 kHz to 1,000 MHz—specifically, peak, aver- age, RMS (root mean square), and QP (quasi- peak) detectors. In particular, the characteris- tics of the QP detector are determined such that the indicated value of the electromagnetic disturbance measurement shows high correla- tion with the affection that electromagnetic 4 Investigation of EMC in Wireless Communication Systems 4-1 Electromagnetic Disturbance Measurement by Using Amplitude Probability Distribution for Protecting Digital Wireless Communication Systems GOTOH Kaoru, ISHIGAMI Shinobu, MATSUMOTO Yasushi, SHINOZUKA Takashi, and YAMANAKA Yukio Digital wireless communication services spread rapidly in recent decades, and RF distur- bance emitted from electric devices has higher frequency and wider bandwidth because of large increasing in clock speed of recent electric devices. However, the disturbance measurement methods specified in the international special committee on radio interference (CISPR) is unable to follow such situation at the present. Amplitude probability distribution (APD) measurement, which has been studied at CISPR as a new international standard, is known by the works of NICT that APD readings of disturbance correlate well with communication quality degradation of victim digital wireless communication systems. We report the latest findings in that studies and the situation of the international stan- dardization, and their application. Keywords Disturbance measurement, Amplitude Probability Distribution, Bit error rate, Microwave ovens, Internal interference noise
Transcript of 4 Investigation of EMC in Wireless Communication …...Digital wireless communication services...
81GOTOH Kaoru et al.
1 Introduction
It is widely known that the electromagnet-ic waves (referred to as “electromagnetic dis-turbance”) emitted from electric and electronicdevices such as household electrical appli-ances interfere with other devices or broadcastand communications services in the surround-ing area. Many countermeasures have beenimplemented for both the source and affectedsystems[1]. In view of the determination ofrestrictions on electromagnetic disturbance, theCISPR has established specifications for mea-
suring equipment and legal limits of electro-magnetic disturbance emitted by electric andelectronic devices (See examples[2]and[3]).The electromagnetic disturbance measuringequipment specified by the CISPR featuresfour detectors in the frequency ranges from9 kHz to 1,000 MHz—specifically, peak, aver-age, RMS (root mean square), and QP (quasi-peak) detectors. In particular, the characteris-tics of the QP detector are determined suchthat the indicated value of the electromagneticdisturbance measurement shows high correla-tion with the affection that electromagnetic
4 Investigation of EMC in WirelessCommunication Systems
4-1 Electromagnetic Disturbance Measurementby Using Amplitude Probability Distribution for Protecting Digital Wireless Communication Systems
GOTOH Kaoru, ISHIGAMI Shinobu, MATSUMOTO Yasushi, SHINOZUKA Takashi, and YAMANAKA Yukio
Digital wireless communication services spread rapidly in recent decades, and RF distur-bance emitted from electric devices has higher frequency and wider bandwidth because of largeincreasing in clock speed of recent electric devices. However, the disturbance measurementmethods specified in the international special committee on radio interference (CISPR) is unableto follow such situation at the present.
Amplitude probability distribution (APD) measurement, which has been studied at CISPR asa new international standard, is known by the works of NICT that APD readings of disturbancecorrelate well with communication quality degradation of victim digital wireless communicationsystems. We report the latest findings in that studies and the situation of the international stan-dardization, and their application.
KeywordsDisturbance measurement, Amplitude Probability Distribution, Bit error rate, Microwave ovens, Internal interference noise
82 Journal of the National Institute of Information and Communications Technology Vol.53 No.1 2006
disturbance can cause in AM radios. The QPdetector is thus extremely effective in protect-ing analog broadcasts and communications.However, electric and electronic devices haverecently become smaller and begun to employhigher speed digital components, causing elec-tromagnetic disturbance in higher frequenciesand wider bandwidth ranges. Further, we areseeing rapid growth in digital wireless com-munication and broadcast services that usefrequency bands of 1 GHz or higher, whichhas led to new demands for the protection ofdigital systems. To protect digital wirelesscommunication systems in these increasinglycomplex electromagnetic environments, it isurgent that we conduct studies on methods ofmeasuring electromagnetic disturbance at orabove 1 GHz, and establish a correspondinginternational standard.
Amplitude probability distribution (APD)measurement is a longstanding method ofmeasuring impulse noise such as that causedby lightning. Despite its early implementation,the electromagnetic disturbance valuesobtained with this method continue to show ahigh correlation with degradation in perfor-mance of wireless communication services ofthe affected digital wireless communicationsystems, as NICT has demonstrated in paststudies. More specifically, a report was issuedon experiments conducted with the aim of reg-ulating electromagnetic disturbance emittedby microwave ovens. This report presentedexperimental confirmation of the correlationbetween APD measurement for microwaveovens and the BER degradation characteristicsof an affected PHS system[4]. Meanwhile,NICT has developed its own general-purposeAPD measuring equipment (See example[5]).
Based on these experimental results andthe demonstrated practicality of the measuringequipment, NICT proposed APD measure-ment to the CISPR as a candidate method formeasuring electromagnetic disturbance at orabove 1 GHz. APD measurement is nowunder deliberation for use in internationalstandardization. The CISPR has completedvoting and approval on the specifications of
the APD measuring equipment by its membernations, and the specifications are now in thefinal stage of publication as an internationalstandard[6]. In preparation for the proposal ofAPD measurement, NICT studied equationsexpressing the relationship between APDmeasurement of electromagnetic disturbanceand BER degradation in affected systems andperformed a number of verification experi-ments[7][8]. NICT also studied a method forregulating electromagnetic radiation distur-bance from industrial, scientific, and medical(ISM) equipment using APD measurement[9]and investigated electromagnetic radiation dis-turbance limits. APD measurement has alsogained attention in industry as well as in thefield of international standardization, as seenin recent attempts to perform EMC evaluationof modules in electronic devices based onAPD measurement. NICT is conducting therelevant technological development in collab-oration with Taiyo Yuden Co., Ltd.[10]. Thisarticle provides an overview of APD measure-ment, discusses the correlation between theresults of APD measurement of interferingdisturbance and BER degradation of theaffected systems, and describes examples ofAPD measurement applications, in that order.
2 Amplitude probability distribu-tion measurement
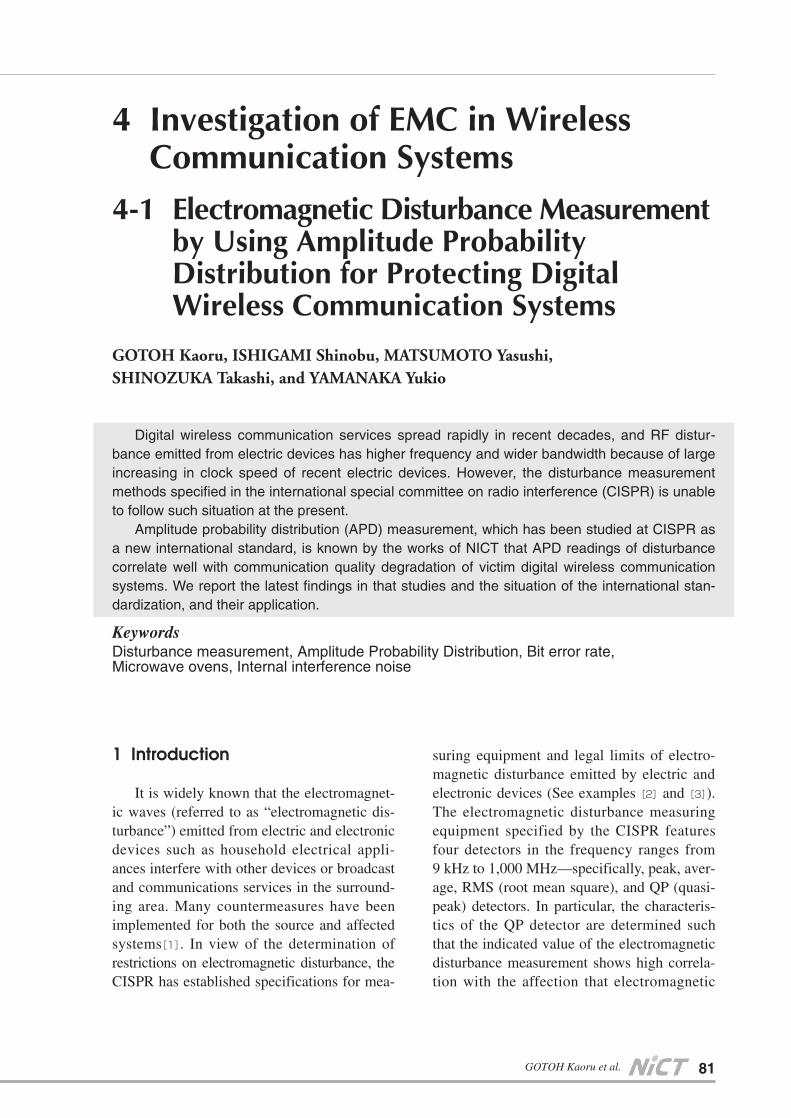
Amplitude probability distribution (APD)is defined as the “probability of time that theamplitude of disturbance exceeds a specifiedlevel”. Figure 1 shows a diagram illustratingthis concept. The vertical axis is the intensityof the disturbance envelope and the horizontalaxis represents time. Wi indicates the range inwhich the disturbance envelope, x (t), exceedsthe threshold x k. The variable n is the numberof times that x (t) exceeds x k. T0 is the totaltime of measurement. Here, the probability oftime that x (t) exceeds x k is expressed asAPD(x k) in the following equation:
(1)
83GOTOH Kaoru et al.
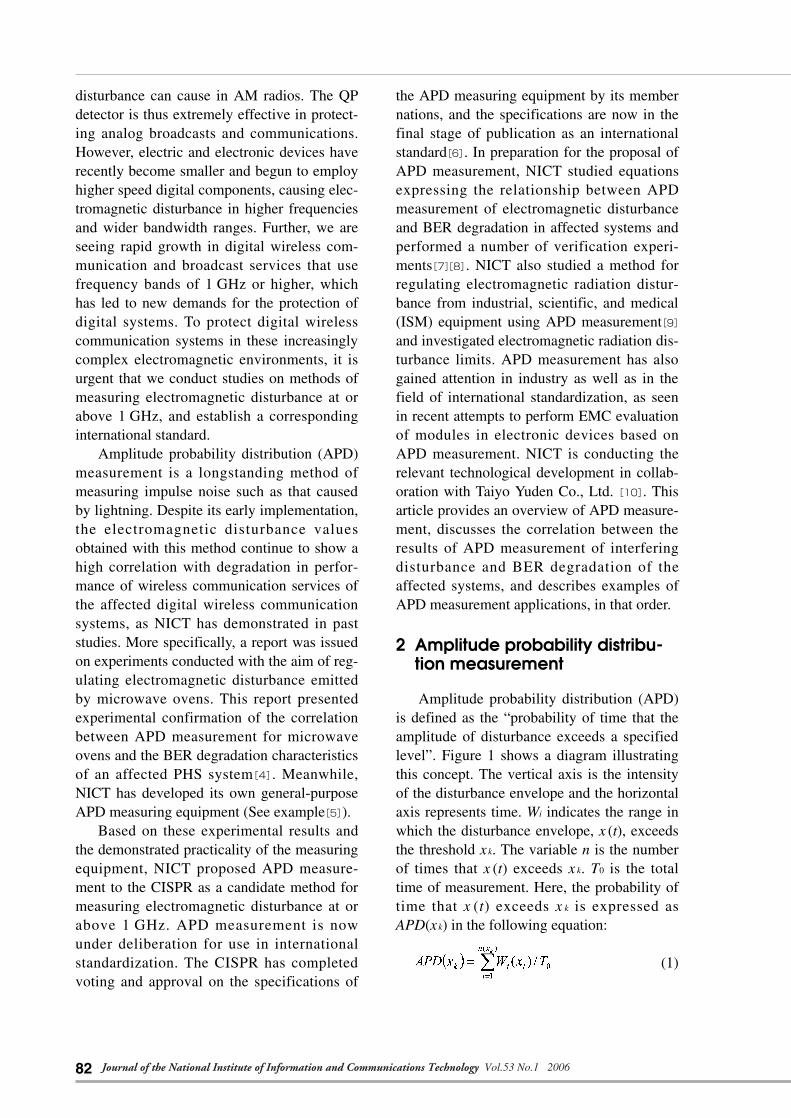
The time probability distribution, APD (x),with the threshold x as the variable, is general-ly referred to as the amplitude probability dis-tribution. Figure 2 shows an example repre-sentation of this distribution. The horizontalaxis is the intensity of the disturbance enve-lope taken as the threshold, and the verticalaxis is the time probability as expressed byEquation (1). By definition, it is obvious thatAPD is expressed with the cumulative distrib-ution, F(x), of x(t).
(2)
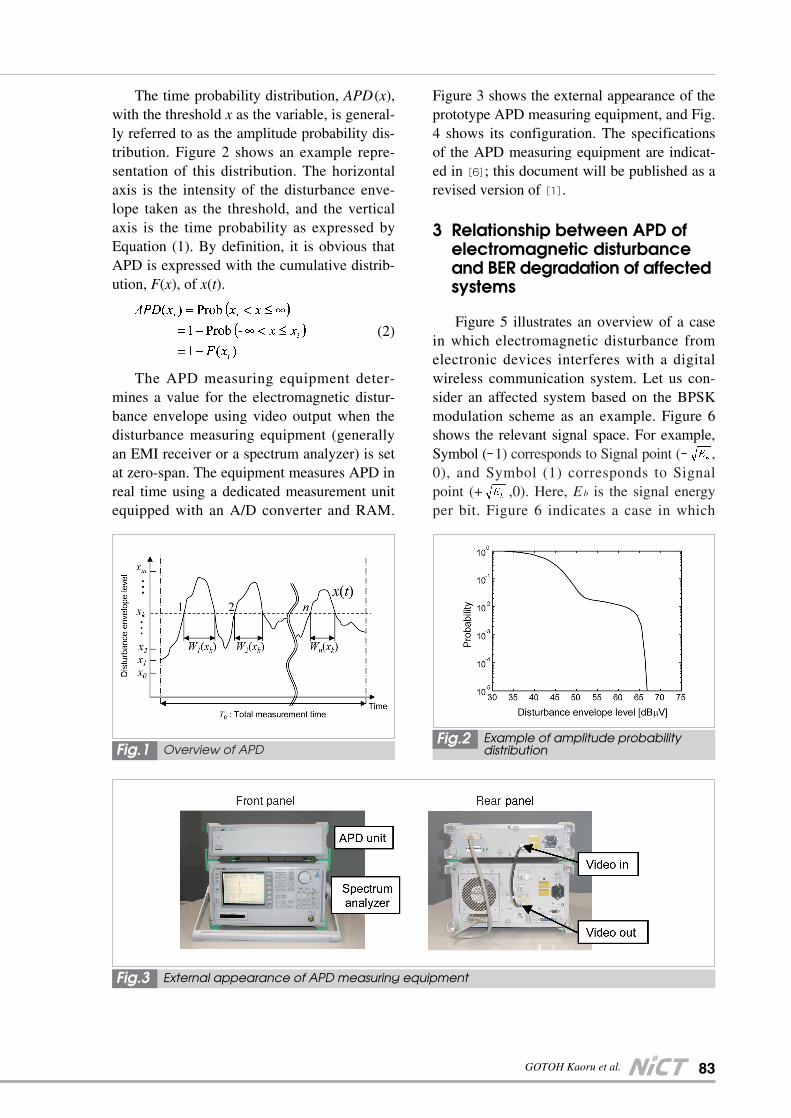
The APD measuring equipment deter-mines a value for the electromagnetic distur-bance envelope using video output when thedisturbance measuring equipment (generallyan EMI receiver or a spectrum analyzer) is setat zero-span. The equipment measures APD inreal time using a dedicated measurement unitequipped with an A/D converter and RAM.
Figure 3 shows the external appearance of theprototype APD measuring equipment, and Fig.4 shows its configuration. The specificationsof the APD measuring equipment are indicat-ed in[6]; this document will be published as arevised version of[1].
3 Relationship between APD ofelectromagnetic disturbanceand BER degradation of affectedsystems
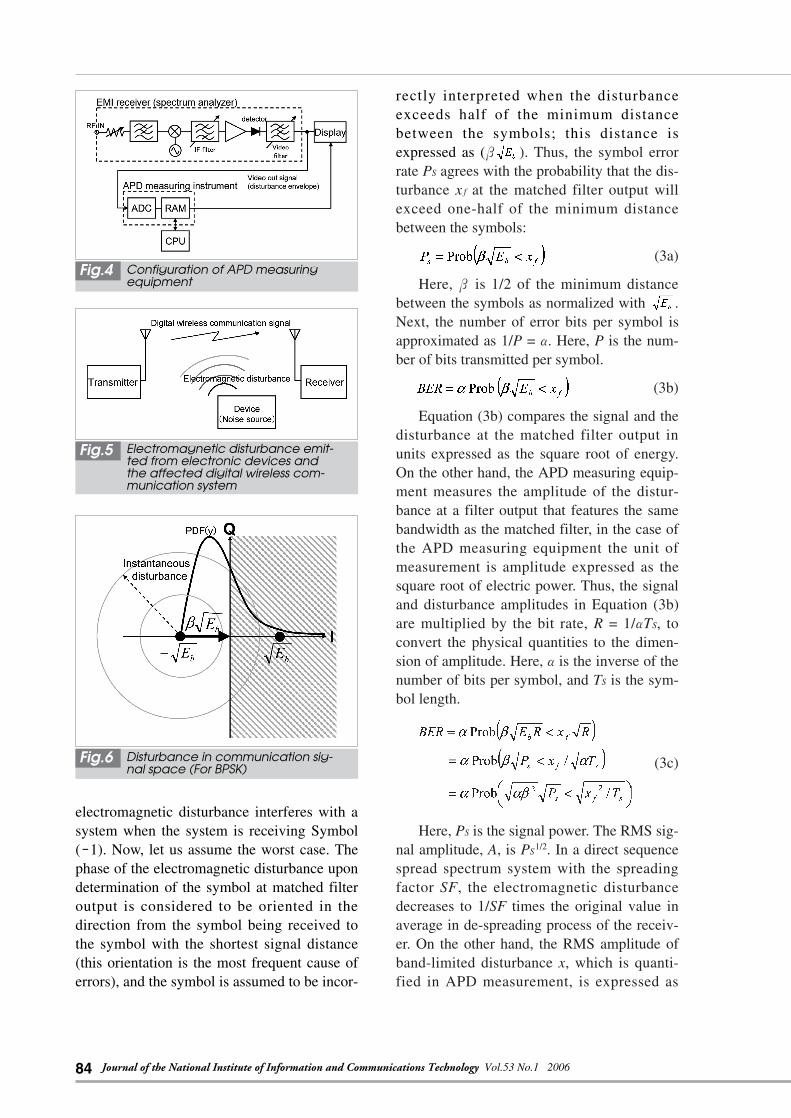
Figure 5 illustrates an overview of a casein which electromagnetic disturbance fromelectronic devices interferes with a digitalwireless communication system. Let us con-sider an affected system based on the BPSKmodulation scheme as an example. Figure 6shows the relevant signal space. For example,Symbol (-1) corresponds to Signal point (- ,0), and Symbol (1) corresponds to Signalpoint (+ ,0). Here, Eb is the signal energyper bit. Figure 6 indicates a case in which
Fig.1 Overview of APDFig.2 Example of amplitude probability
distribution
Fig.3 External appearance of APD measuring equipment
84 Journal of the National Institute of Information and Communications Technology Vol.53 No.1 2006
electromagnetic disturbance interferes with asystem when the system is receiving Symbol(-1). Now, let us assume the worst case. Thephase of the electromagnetic disturbance upondetermination of the symbol at matched filteroutput is considered to be oriented in thedirection from the symbol being received tothe symbol with the shortest signal distance(this orientation is the most frequent cause oferrors), and the symbol is assumed to be incor-
rectly interpreted when the disturbanceexceeds half of the minimum distancebetween the symbols; this distance isexpressed as (β ). Thus, the symbol errorrate PS agrees with the probability that the dis-turbance x f at the matched filter output willexceed one-half of the minimum distancebetween the symbols:
(3a)
Here,β is 1/2 of the minimum distancebetween the symbols as normalized with .Next, the number of error bits per symbol isapproximated as 1/P =α. Here, P is the num-ber of bits transmitted per symbol.
(3b)
Equation (3b) compares the signal and thedisturbance at the matched filter output inunits expressed as the square root of energy.On the other hand, the APD measuring equip-ment measures the amplitude of the distur-bance at a filter output that features the samebandwidth as the matched filter, in the case ofthe APD measuring equipment the unit ofmeasurement is amplitude expressed as thesquare root of electric power. Thus, the signaland disturbance amplitudes in Equation (3b)are multiplied by the bit rate, R = 1/αTS, toconvert the physical quantities to the dimen-sion of amplitude. Here,αis the inverse of thenumber of bits per symbol, and TS is the sym-bol length.
(3c)
Here, PS is the signal power. The RMS sig-nal amplitude, A, is PS
1/2. In a direct sequencespread spectrum system with the spreadingfactor SF, the electromagnetic disturbancedecreases to 1/SF times the original value inaverage in de-spreading process of the receiv-er. On the other hand, the RMS amplitude ofband-limited disturbance x, which is quanti-fied in APD measurement, is expressed as
Fig.4 Configuration of APD measuringequipment
Fig.5 Electromagnetic disturbance emit-ted from electronic devices andthe affected digital wireless com-munication system
Fig.6 Disturbance in communication sig-nal space (For BPSK)
85GOTOH Kaoru et al.
. Thus, the relationship between theAPD of the electromagnetic disturbance andthe BER degradation of the affected digitalwireless communication system is expressedas the following equation[7]:
(3)
Here, the following assumptions must besatisfied for Equation (3) to hold.(1) The phase of the electromagnetic distur-
bance takes the worst value so that theoccurrence of a symbol error is most possi-ble in the digital wireless communicationsystem.
(2) The bandwidth of APD measuring receiveris equal to the signal bandwidth of theaffected wireless system.
(3) The system noise level of the APD mea-suring equipment is equal to the systemnoise level of the receiver of the affectedsystem.
(4) The receiver of the affected systememploys coherent detection.Figure 7 shows the configuration of an
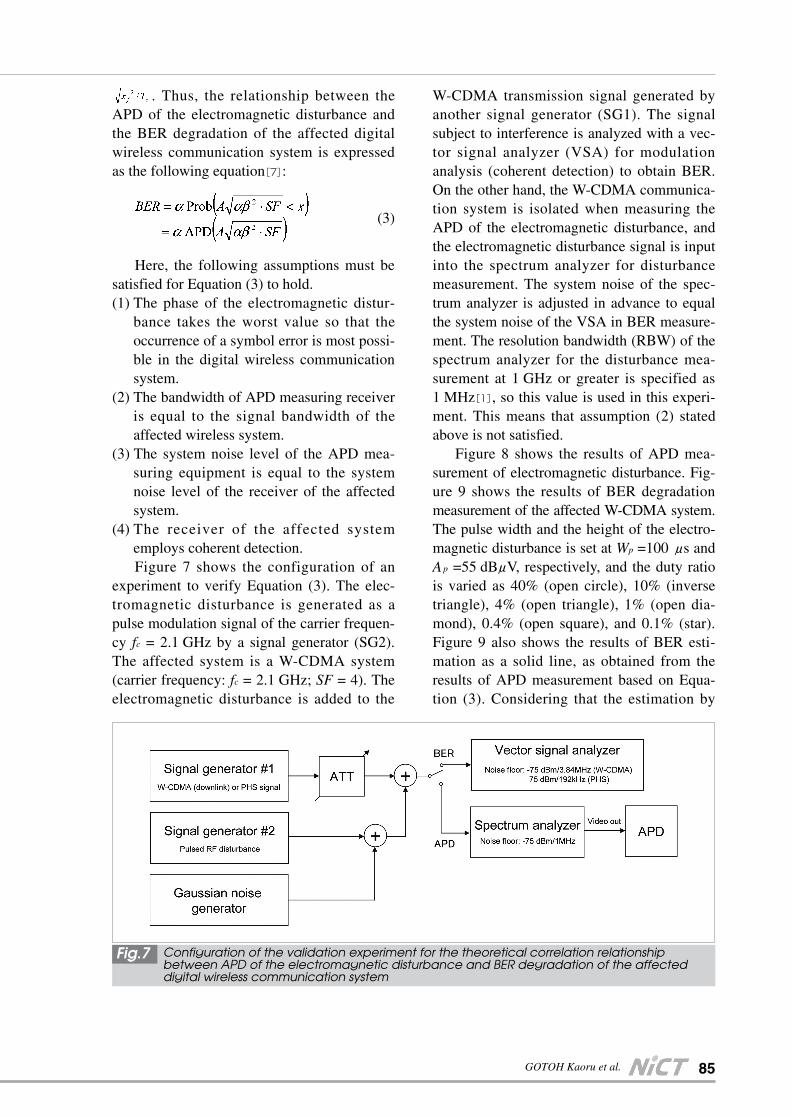
experiment to verify Equation (3). The elec-tromagnetic disturbance is generated as apulse modulation signal of the carrier frequen-cy fc = 2.1 GHz by a signal generator (SG2).The affected system is a W-CDMA system(carrier frequency: fc = 2.1 GHz; SF = 4). Theelectromagnetic disturbance is added to the
W-CDMA transmission signal generated byanother signal generator (SG1). The signalsubject to interference is analyzed with a vec-tor signal analyzer (VSA) for modulationanalysis (coherent detection) to obtain BER.On the other hand, the W-CDMA communica-tion system is isolated when measuring theAPD of the electromagnetic disturbance, andthe electromagnetic disturbance signal is inputinto the spectrum analyzer for disturbancemeasurement. The system noise of the spec-trum analyzer is adjusted in advance to equalthe system noise of the VSA in BER measure-ment. The resolution bandwidth (RBW) of thespectrum analyzer for the disturbance mea-surement at 1 GHz or greater is specified as1 MHz[1], so this value is used in this experi-ment. This means that assumption (2) statedabove is not satisfied.
Figure 8 shows the results of APD mea-surement of electromagnetic disturbance. Fig-ure 9 shows the results of BER degradationmeasurement of the affected W-CDMA system.The pulse width and the height of the electro-magnetic disturbance is set at Wp =100μs andAp =55 dBμV, respectively, and the duty ratiois varied as 40% (open circle), 10% (inversetriangle), 4% (open triangle), 1% (open dia-mond), 0.4% (open square), and 0.1% (star).Figure 9 also shows the results of BER esti-mation as a solid line, as obtained from theresults of APD measurement based on Equa-tion (3). Considering that the estimation by
Fig.7 Configuration of the validation experiment for the theoretical correlation relationshipbetween APD of the electromagnetic disturbance and BER degradation of the affecteddigital wireless communication system

86 Journal of the National Institute of Information and Communications Technology Vol.53 No.1 2006
Equation (3) corresponds to worst-case condi-tions, the estimation of BER degradationbased on APD measurement is adequate com-pared with the results of BER measurement. Itis clear that Equation (3) uniquely correlatesthe results of APD measurement of the elec-tromagnetic disturbance and BER degradationof the affected digital wireless communicationsystem. For a more strict validation, one needsto perform experiments on communicationmethods other than W-CDMA systems and touse actual (not experimentally prepared) elec-tromagnetic disturbance.
4 Application of APD (1)—Regula-tion of electromagnetic distur-bance emitted from ISM equip-ment—
The previous section showed the correla-tion between APD measurement of electro-magnetic disturbance and BER degradation ofthe affected system. As an application exam-ple of APD measurement based on the correla-tion characteristics, this section introduces theregulation of electromagnetic disturbanceemitted from industrial, scientific, and medical(ISM) equipment.
CISPR11[3]specifies the method of mea-surement and the limits on electromagneticdisturbance emitted from ISM equipment.More specifically, the regulation stipulates
peak measurement at RWB =1 MHz andVBW (video band width) of ≥1 MHz, andweighted measurement at RWB=1 MHz andVBW=10 Hz. This requirement specifies thelimits for these quantities in each frequencyband. Microwave ovens are the most commonitems of ISM equipment. The electromagneticdisturbance emitted from microwave ovensconsists of irregular pulse noise, and peakmeasurement and weighting measurementalone cannot sufficiently describe the charac-teristics of such disturbance. For example,when the duty ratio of the measured signal islow, peak measurement overestimates theeffects of the disturbance on the affected sys-tem. Weighted measurement, on the otherhand, tends to underestimate these effects.Further, it is difficult to interpret the actualphysical significance of the values obtained inweighted measurement, as these are represent-ed as logarithmic means. These values alsopose a problem in that they are significantlyinfluenced by system noise in the disturbancemeasuring equipment.
On the other hand, APD measurement,which contains statistical amplitude informa-tion for electromagnetic disturbance andwhich is correlated with BER degradation ofthe affected system, is considered to be aneffective measuring method in regulating elec-tromagnetic disturbance from ISM equipment.The problem here lies in determining the lim-
Fig.8 Results of APD measurement forelectromagnetic disturbance(pulse modulated)
Fig.9 Results of BER degradation of theaffected W-CDMA system and theestimated values
87GOTOH Kaoru et al.
its of the electromagnetic disturbance fromISM equipment. There are two points of viewon this matter. One involves establishing lim-its in view of protecting user equipment usingdigital wireless communication in the sur-rounding area, and the other views these limitsin light of consistency with the limits of thecurrent peak and weighted measurements.Here we consider the APD limits for ISMequipment from both of these points of view.
First, let us determine APD limits basedon Equation (3) using the receiver sensitivityrequired for the user equipment of digitalwireless communication services. Here wetake user equipment for W-CDMA and PHSsystems as examples. Table 1 shows therespective system specifications: parametersαandβand the receiver sensitivity required forthe user equipment[11][12].
We can determine the degree of electro-magnetic disturbance that satisfies therequired sensitivity of the user equipment as asingle point on the APD, based on the follow-ing equation derived from Equation (3).
(4)
Here, F is the antenna factor, and L s is thespecified communication signal level for guar-anteeing the required value of BER (BERr).The solid stars in Fig. 10 indicate the pointsestimated from Equation (4) for the W-CDMAand PHS systems.
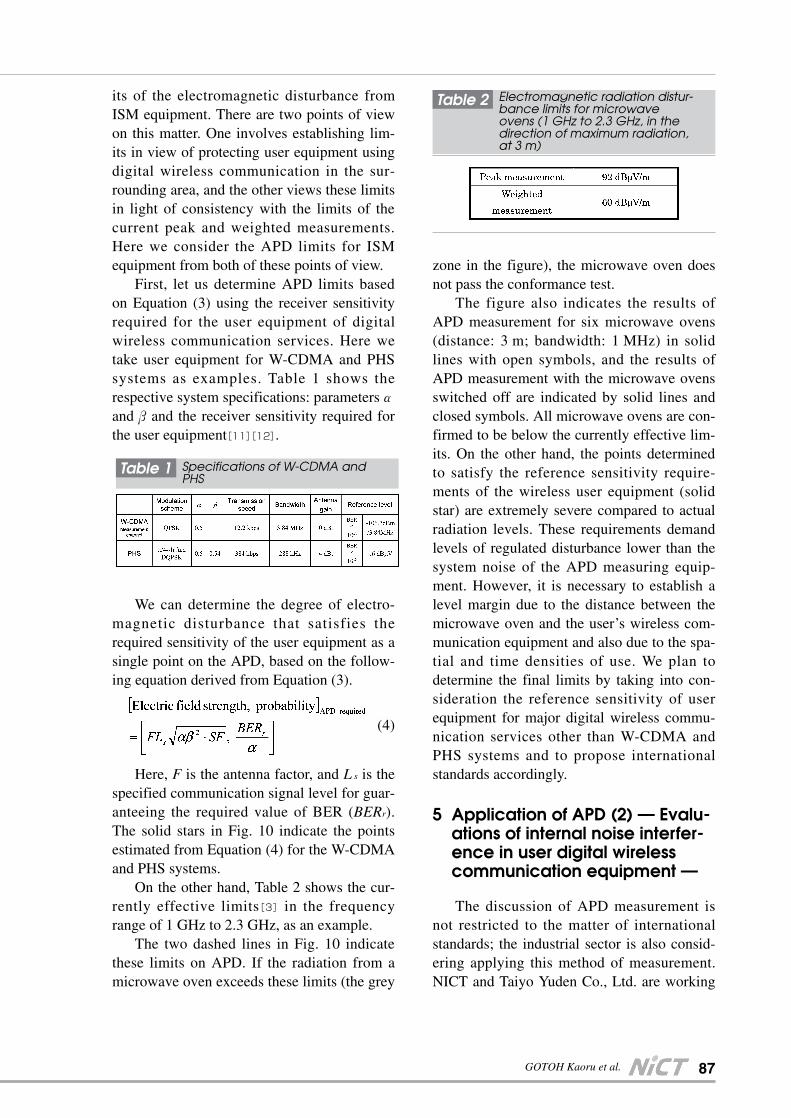
On the other hand, Table 2 shows the cur-rently effective limits[3] in the frequencyrange of 1 GHz to 2.3 GHz, as an example.
The two dashed lines in Fig. 10 indicatethese limits on APD. If the radiation from amicrowave oven exceeds these limits (the grey
zone in the figure), the microwave oven doesnot pass the conformance test.
The figure also indicates the results ofAPD measurement for six microwave ovens(distance: 3 m; bandwidth: 1 MHz) in solidlines with open symbols, and the results ofAPD measurement with the microwave ovensswitched off are indicated by solid lines andclosed symbols. All microwave ovens are con-firmed to be below the currently effective lim-its. On the other hand, the points determinedto satisfy the reference sensitivity require-ments of the wireless user equipment (solidstar) are extremely severe compared to actualradiation levels. These requirements demandlevels of regulated disturbance lower than thesystem noise of the APD measuring equip-ment. However, it is necessary to establish alevel margin due to the distance between themicrowave oven and the user’s wireless com-munication equipment and also due to the spa-tial and time densities of use. We plan todetermine the final limits by taking into con-sideration the reference sensitivity of userequipment for major digital wireless commu-nication services other than W-CDMA andPHS systems and to propose internationalstandards accordingly.
5 Application of APD (2) — Evalu-ations of internal noise interfer-ence in user digital wirelesscommunication equipment —
The discussion of APD measurement isnot restricted to the matter of internationalstandards; the industrial sector is also consid-ering applying this method of measurement.NICT and Taiyo Yuden Co., Ltd. are working
Table 1 Specifications of W-CDMA andPHS
Table 2 Electromagnetic radiation distur-bance limits for microwaveovens (1 GHz to 2.3 GHz, in thedirection of maximum radiation,at 3 m)

88 Journal of the National Institute of Information and Communications Technology Vol.53 No.1 2006
together on the development of an EMC eval-uation method based on APD measurementfor electronic components in user equipment.This represents a new approach to solving theproblem of internal noise interference in userdigital wireless communication equipment.
Internal noise interference is a phenome-non through which the electromagnetic distur-bance generated in an electronic device causesdegradation in its own performance. General-ly, this consists primarily of conductive noisedue to electromagnetic coupling between thenoise source and the body of the user deviceor other internal circuits. However, in userwireless communication equipment, BERdegradation may also occur due to radiationnoise from the electronic components in theequipment itself, as the antenna near the noisesource picks up this noise. To eliminate thistype of problem, it is important to performEMC evaluation for each electronic compo-nent constituting the digital wireless commu-nication equipment. Such an evaluation is alsoindustrially advantageous in that the manufac-turers of the electronic components can guar-antee the reliability of their products and dis-tinguish differences in performance relative tothe products of other manufacturers. However,
the electromagnetic disturbance from electron-ic components generally consists of non-sta-tionary noise at relatively low intensities.Thus, it is difficult to measure this noise, andan appropriate evaluation method has yet to beestablished. As it has already been confirmedthat BER degradation can be estimated basedon the results of APD measurement of exter-nal noise, it is expected that APD measure-ment will also prove effective in internal noiseinterference evaluation, including BER degra-dation evaluation for user equipment.
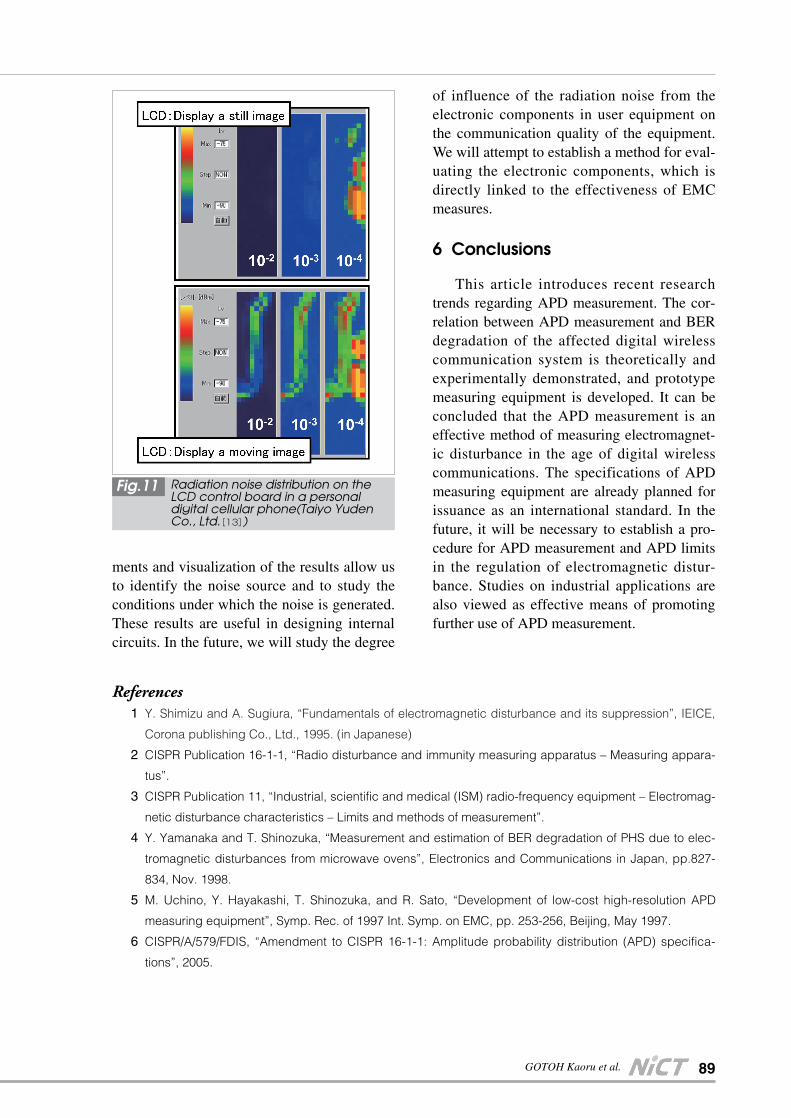
Figure 11 shows the two-dimensional dis-tribution of radiation noise on the LCD controlboard in a personal digital cellular phone[13].APD measurement was performed at eachpoint within the two-dimensional space bymoving a loop antenna on the board. The fig-ure shows the levels of radiation noise withtime probabilities of 10-2, 10-3, and 10-4, as col-ored maps. The upper figure corresponds tothe case in which the LCD displays a stillimage and the lower figure corresponds to thecase in which the LCD is displaying a movingimage. S-shaped noise distribution is clearlyobserved in the measurement with the movingpicture display while it is only barely observedwith the still image display. These measure-
Fig.10 Consideration of the APD limits of electromagnetic disturbance emitted from ISM equip-ment
89GOTOH Kaoru et al.
ments and visualization of the results allow usto identify the noise source and to study theconditions under which the noise is generated.These results are useful in designing internalcircuits. In the future, we will study the degree
of influence of the radiation noise from theelectronic components in user equipment onthe communication quality of the equipment.We will attempt to establish a method for eval-uating the electronic components, which isdirectly linked to the effectiveness of EMCmeasures.
6 Conclusions
This article introduces recent researchtrends regarding APD measurement. The cor-relation between APD measurement and BERdegradation of the affected digital wirelesscommunication system is theoretically andexperimentally demonstrated, and prototypemeasuring equipment is developed. It can beconcluded that the APD measurement is aneffective method of measuring electromagnet-ic disturbance in the age of digital wirelesscommunications. The specifications of APDmeasuring equipment are already planned forissuance as an international standard. In thefuture, it will be necessary to establish a pro-cedure for APD measurement and APD limitsin the regulation of electromagnetic distur-bance. Studies on industrial applications arealso viewed as effective means of promotingfurther use of APD measurement.
Fig.11 Radiation noise distribution on theLCD control board in a personaldigital cellular phone(Taiyo YudenCo., Ltd.[13])
References01 Y. Shimizu and A. Sugiura, “Fundamentals of electromagnetic disturbance and its suppression”, IEICE,
Corona publishing Co., Ltd., 1995. (in Japanese)
02 CISPR Publication 16-1-1, “Radio disturbance and immunity measuring apparatus – Measuring appara-
tus”.
03 CISPR Publication 11, “Industrial, scientific and medical (ISM) radio-frequency equipment – Electromag-
netic disturbance characteristics – Limits and methods of measurement”.
04 Y. Yamanaka and T. Shinozuka, “Measurement and estimation of BER degradation of PHS due to elec-
tromagnetic disturbances from microwave ovens”, Electronics and Communications in Japan, pp.827-
834, Nov. 1998.
05 M. Uchino, Y. Hayakashi, T. Shinozuka, and R. Sato, “Development of low-cost high-resolution APD
measuring equipment”, Symp. Rec. of 1997 Int. Symp. on EMC, pp. 253-256, Beijing, May 1997.
06 CISPR/A/579/FDIS, “Amendment to CISPR 16-1-1: Amplitude probability distribution (APD) specifica-
tions”, 2005.

90 Journal of the National Institute of Information and Communications Technology Vol.53 No.1 2006
07 K. Gotoh, Y. Matsumoto, Y. Yamanaka, and T. Shinozuka, “APD Measurement for the Disturbance Eval-
uation Related to the Performance of Digital Communication Systems”, IEICE Trans. on Communica-
tions, Vol. E88-B, No.8 pp.3235-3241, Aug. 2005.
08 CISPR/A/572/DTR, “Background material to Amplitude Probability Distribution (APD) Specifications”,
2005.
09 K. Gotoh, S. Ishigami, Y. Matsumoto, Y. Yamanaka, and T. Shinozuka “Utilization of APD for measure-
ments of radiation from microwave ovens”, EMC Europe Workshop (Electromagnetic Compatibility of
Wireless system), pp.175-178 Roma, Italy, Sep. 2005.
10 K. Hori, S, Kazama, K. Gotoh, and Y. Matsumoto, “A new evaluation method for internal disturbance
noise of digital wireless communication equipments”, JIEP, 2006.(in Japanese)
11 3GPP TSG25.211, 3rd Generation Partnership Project, 2003.
12 RCR STD-28, ARIB, 2002
13 S. Kazama, K. Hori, and H. Tsutagaya, “The new electromagnetic noise evalution method for internal
EMC problem in wireless communication equipment”, Nikkei electronics, no.919, pp.115--122, 2006. (in
Japanese)
GOTOH Kaoru, Dr. Eng.
Researcher, EMC Measurement Group,Wireless Communications Department
Electromagnetic Compatibility, Wire-less Communications
MATSUMOTO Yasushi, Dr. Eng.
Group leader, Communications systemEMC group, Wireless CommunicationsDepartment
Electromagnetic Compatibility, Wire-less Communications
ISHIGAMI Shinobu, Dr. Eng.
Senior Researcher, EMC MeasurementGroup, Wireless CommunicationsDepartment
Electromagnetic Compatibility
SHINOZUKA Takashi
Research Supervisor, Wireless Commu-nications Department
Electromagnetic Compatibility
YAMANAKA Yukio
Group Leader, EMC MeasurementGroup, Wireless CommunicationsDepartment
EMC Measurement