
4 g lte_drive_test_parameters
29
Drive Test Parameters RF Engineer: Chaturanan (Aryan) Title : 4G, LTE, Parameters
-
Upload
aryan-chaturanan -
Category
Technology
-
view
527 -
download
1
Transcript of 4 g lte_drive_test_parameters

Drive Test ParametersRF Engineer: Chaturanan (Aryan)
Title : 4G, LTE, Parameters

RSRP • RSRP :- Reference signal receive power.
•RSRP (dBm) = RSSI (dBm) -10*log (12*N)
where RSSI = Received Signal Strength IndicatorN: number of RBs across the RSSI is measured and depends on the
BW• Significance : - RSRP is the most basic of the UE physical layermeasurements and is the linear average power (in watts) of the downlink
reference signals (RS) across the channel bandwidth for the Resource elements that carry cell specific Reference Signals. Knowledge of absolute RSRP provides the UE with essential information about the strength of cells from which path loss can be calculated and used in the algorithms for determining the optimum power settings for operating the network. Reference signal receive power is used both in idle and connected states
• Range :- -44 to -140 dBm
• RSRP term is used for coverage same as RSCP in 3G.

RSRP Plot & Threshold

RSRQ
• RSRQ :- Reference signal receive quality.
RSRQ = RSRP / (RSSI / N)
N is the number of resource blocks over which the RSSI is measured
RSSI is wide band power, including intra cell power, interference and noise.
• Significance :- It provides the Indication of Signal Quality . Measuring RSRQ becomes particularly important near the cell edge when decisions need to be made, regardless of absolute RSRP, to perform a handover to the next cell. Reference signal receive quality is used only during connected states
•Range :- -3 to -19.5 dB
• RSRQ term is used for Quality same as Ec/No in 3G.
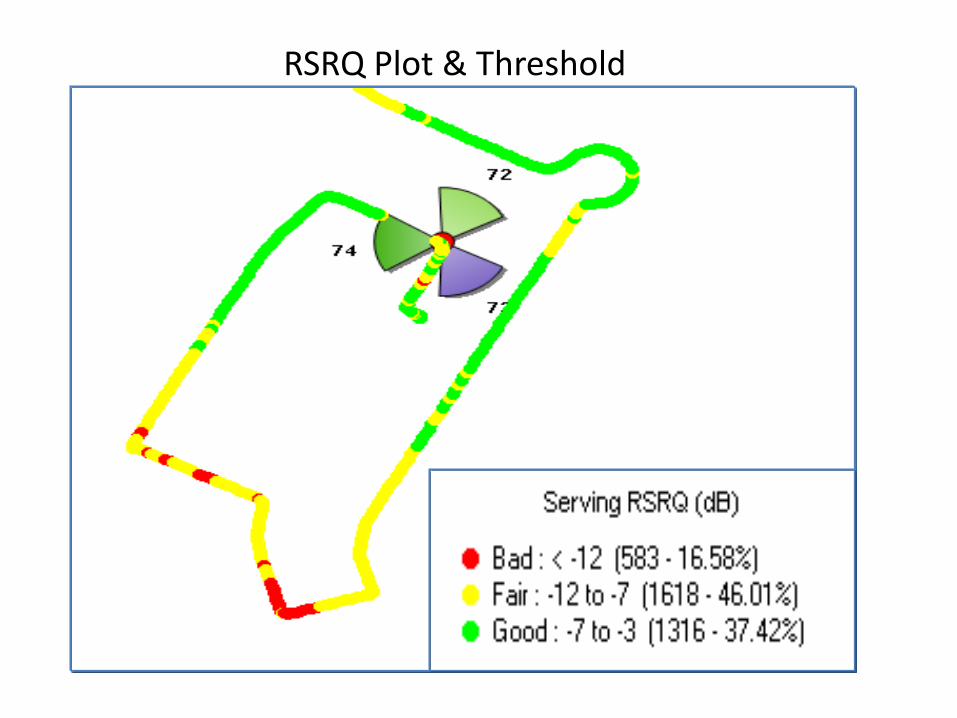
RSRQ Plot & Threshold

SINR
• SINR :- Signal to Noise Ratio.
SINR = S / I + N
S -- Average Received Signal PowerI -- Average Interference powerN -- Noise Power
• Significance : Is a way to measure the Quality of LTE Wireless Connections. As the energy of signal fades with distance i.e Path Loss due to environmental parameters ( e.g. background noise , interfering strength of other simultaneous transmission)
Radio Conditions for SINR Measurement
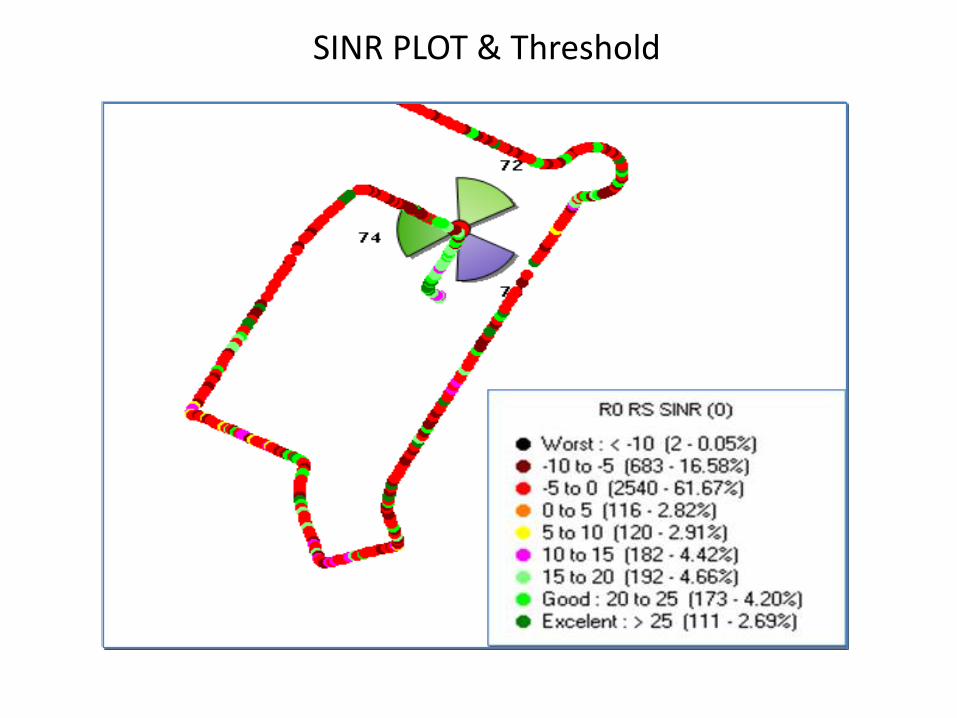
SINR PLOT & Threshold

RSSI
• RSSI :- Received Signal Strength Indicator.
• RSSI = wideband power = noise + serving cell power + interference power
• RSSI=12*N*RSRP• RSSI per resource block is measured over 12 resource elements.
N: number of RBs across the RSSI is measured and depends on the BWBased on the above:
RSRP (dBm) = RSSI (dBm) -10*log (12*N)
• Significance – Is the parameter represents the entire received power including the wanted power from the serving cell as well as all the co channel power & other sources of noise
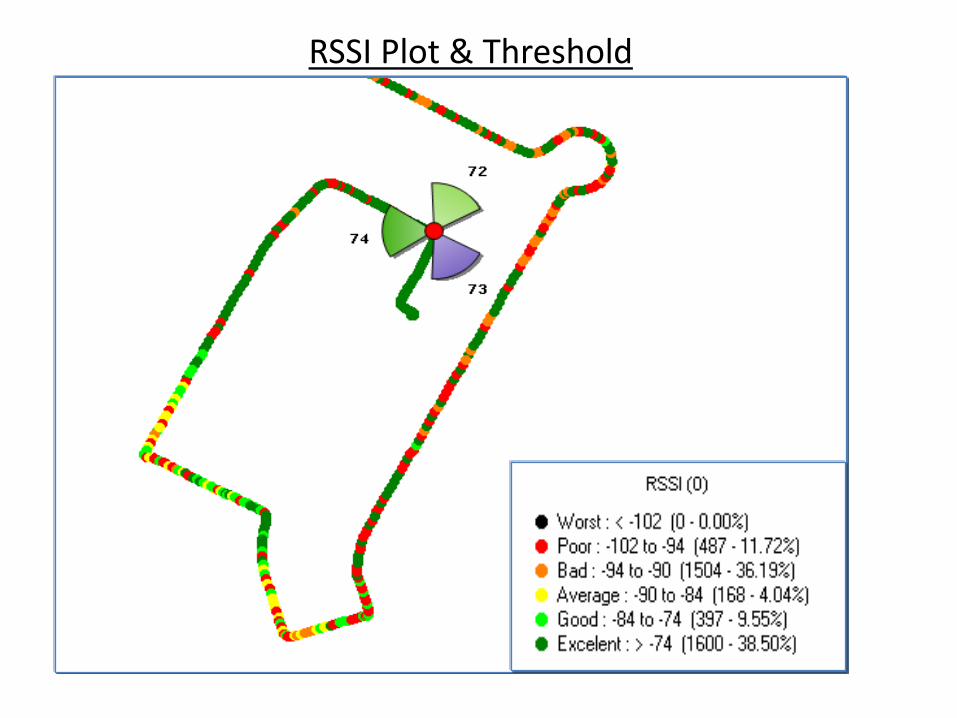
RSSI Plot & Threshold

CQI
• CQI :- Channel Quality Indicator.
• Range :- 1 to 15
Significance: CQI is a measurement of the communication quality of wireless channels i.e. it indicates the downlink mobile radio channel quality as experienced by the UE .CQI can be a value representing a measure of channel quality for a given channel. Typically, a high value CQI is indicative of a channel with high quality and vice versa.
• CQI is measured in the Dedicated mode only.
•CQI depends on the RF conditions.
• Better the CQI better the throughput will get and vice versa.
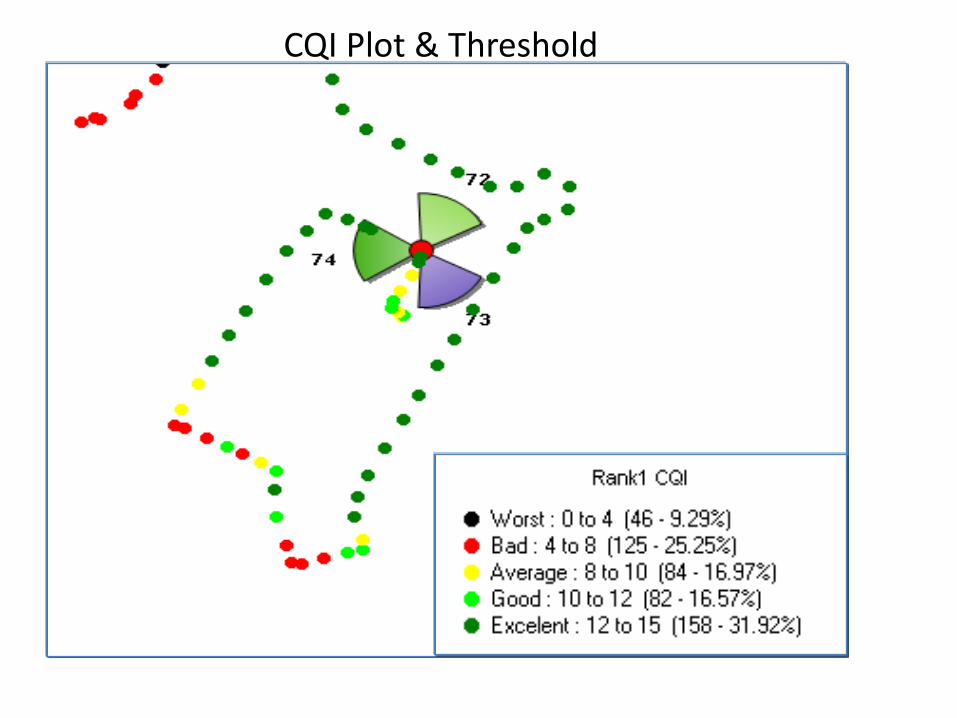
CQI Plot & Threshold

PCI
• PCI :- Physical Cell Id• Range :- 0 to 503
• Significance - PCI used to identify the cell & is used to transmit the data
• PCI = PSS + 3*SSSPSS is Primary Synchronization Signal ( Identifies Cell Id ). PSS value can be 0, 1 & 2SSS is Secondary Synchronization Signal ( identifies Cell Idgroup).SSS value can be 0 to 167.
There is no standard way for planning of PCIs but there are some guidelines.
• Co‐PCI assignment for close sites needs to be avoided• Sectors on the same eNode B should have the same SSS code but different PSS (assuming three sectored sites).
This is not mandatory but helps synchronization of UEs and improves traceability of the PCI assignment.• Co‐PCI assignment for the neighbors needs to be avoided. If the neighbors are Co‐PCI, the handover process
may fail. Also, this is the trickiest requirement. (We will be adding an analysis in the LTE toolbox that evaluatesthe PCI assignment and detects this condition)
• It is common to allocate a separate set of PCIs for outdoor cells and indoor cells. The reason is againmanagement of the PCIs and the fact that indoor cells are rarely tri‐sectored. They are usually deployed invariety of antenna configurations.

PCI Plot & Threshold

BLER
• BLER :- Block Error Rate
•Block Error Ratio is defined as the ratio of the number of erroneous blocksreceived to the total number of blocks transmitted.
Significance - A simple method by which a UE can choose an appropriate CQI value could be based on a set of Block Error Rate (BLER) thresholds . The UE would report the CQI value corresponding to the Modulation Coding Schemes that ensures BLER ≤ 10% based on the measured received signal quality
• BLER is Calculated using Cyclic Redundancy error Checking method
High BLER leads to loss of Peak rates & efficiency•BLER threshold should be low i.e. ≤ 10%

Throughput
Downlink Throughput-In E-UTRAN may use a maximum of 2 Tx antennas at the ENodeB and
2 Rx antennas at the UE ( MIMO ).
Significance - Target for averaged user throughput per MHz, 3 to 4 timesRelease 6 HSDPA i.e Higher user throughput as compared to 3G ( Over
300 Mbps downlink as compared to 14 Mbps in UMTS)
- The supported user throughput should scale with the spectrumbandwidth.

Uplink Throughput
-In E-UTRAN uses a maximum of a single Tx antenna at the UE and 2 Rxantennas at the E Node B.
- Greater user throughput should be achievable using multiple Txantennas at the UE ( MIMO )
.- Significance- Target for averaged user throughput per MHz, 2 to 3 times
Release 6 Enhanced Uplink i.e Higher user throughput as compared to 3G (Over 50 Mbps Uplink as compared to 5.76 Mbps in UMTS)
- The user throughput should scale with the spectrum bandwidthprovided that the maximum transmit power is also scaled.

Latency
• Reduced transit times for user packets (reduced latency), an order of magnitude shorter than that can be provided in 3G networks (i.e. the user plane -data latency will be lower than 10ms and under 100 ms for control plane -signaling)
• Significance - Low delay/latency due to fewer Nodes , Shorter TTI , Shorter Messages & quicker node response leads to more efficient use of radio spectrum & Higher Capacity
• Control plane deals with signaling and control functions, while user plane deals with actual user data transmission
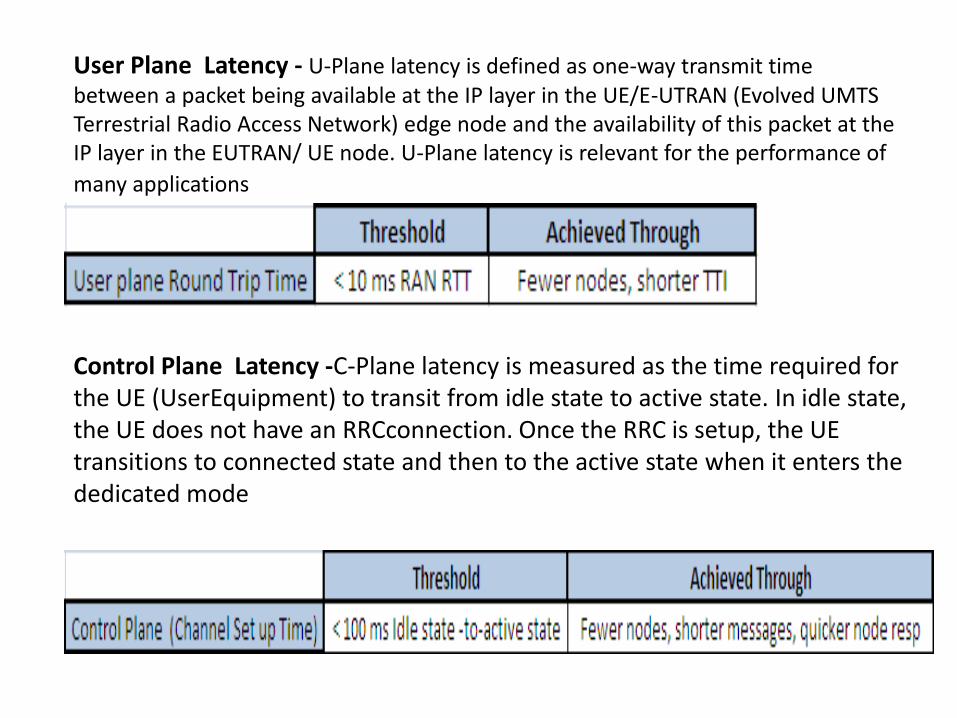
User Plane Latency - U-Plane latency is defined as one-way transmit timebetween a packet being available at the IP layer in the UE/E-UTRAN (Evolved UMTS Terrestrial Radio Access Network) edge node and the availability of this packet at the IP layer in the EUTRAN/ UE node. U-Plane latency is relevant for the performance of
many applications
Control Plane Latency -C-Plane latency is measured as the time required for the UE (UserEquipment) to transit from idle state to active state. In idle state, the UE does not have an RRCconnection. Once the RRC is setup, the UE transitions to connected state and then to the active state when it enters the dedicated mode
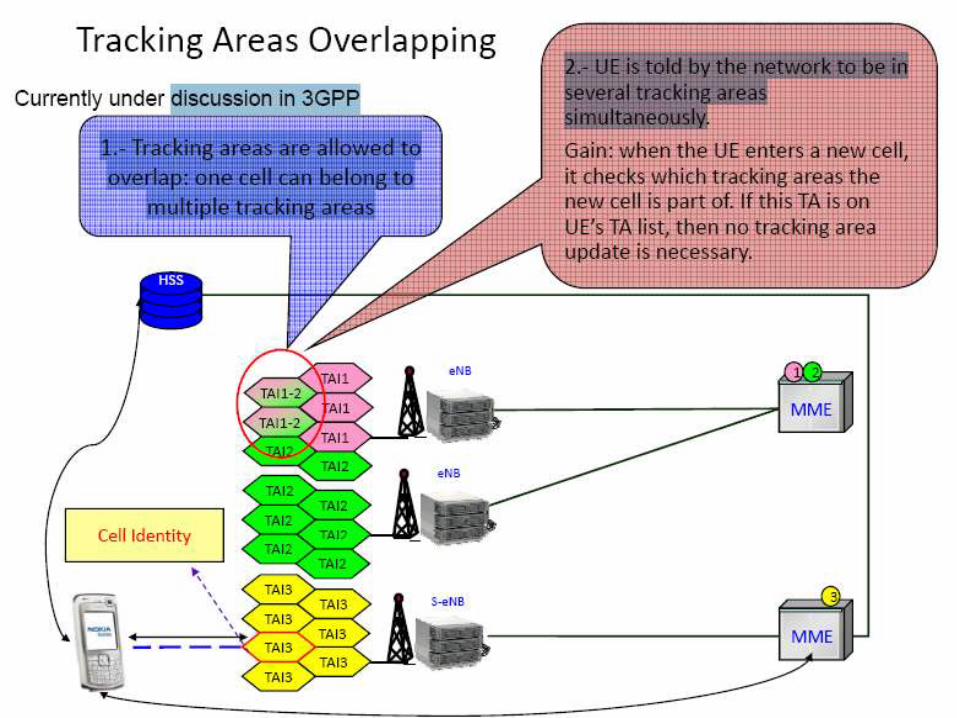
Tracking Area Code
Tracking Area (TA)
It is the successor of location and routing areas from 2G/3G.
When a UE attached is to the network, the MME will knowthe UE’s position on tracking area level which is then storedin the HSS database. In case the UE has to be paged, thiswill be done in the full tracking area.
Tracking areas are identified by a Tracking Area Identity(TAI).
TAI is constructed from the MCC, MNC, and TAC (TrackingArea Code)
A Tracking Area (TA) includes one or several E-UTRAN cells


Timing Advance
The time it takes for the radio signal to travel from the UE to
the eNB’s receiver across the radio interface. Thus, it is equivalent to the distance between the UE and the cell’s antenna
Significance - When UE wish to establish RRC connection with eNB, it transmits aRandom Access Preamble, eNB estimates the transmission timing of the terminalbased on this. Now eNB transmits a Random Access Response which consists oftiming advance command, based on that UE adjusts the terminal transmit timing.
The timing advance is initiated from E-UTRAN with MAC message that implies andadjustment of the timing advance.
Why timing advance??
• Because the UL resources are orthogonal and this fact has to be
maintained
• Different UEs in the cell may have different position and therefore
different propagation delay ‐> this may affect synchronization
• Only UL timing advance no DL
• In DL possible to manage synchronized transmission to several UEs

TA Requirements
•Timing Advance adjustment delay
The UE shall adjust the timing of its uplink transmission timing at
sub- frame n+6 for a timing advancement command received in
sub- frame n.
•Timing Advance adjustment accuracy
The UE shall adjust the timing of its transmissions with a relative
accuracy better than or equal to ±4* TS seconds to the signaled
timing advance value compared to the timing of preceding uplink
transmission. The timing advance command is expressed in
multiples of 16* TS and is relative to the current uplink timing.


Timing Advance• How often ‐> what is the frequency of Timing Advance?– Granularity of 0,52us corresponding to 78 m– Dependent on the UE speed:– 1. E.g. 72 km/h = 20 m/s– ‐> 78 m in approx 4 s– ‐> an update every 4 seconds– 2. E.g. 500 km/h = 130 m/s– 78 m approx 2 times per second– ‐> Maximum of 2 updates per second• How is the Node‐B measuring the TA?• Based on received PUSCH on TTI basis• CQI reports on PUCCH• How is the timing advance signaled to the UE??• At MAC layer (peer to peer signaling)
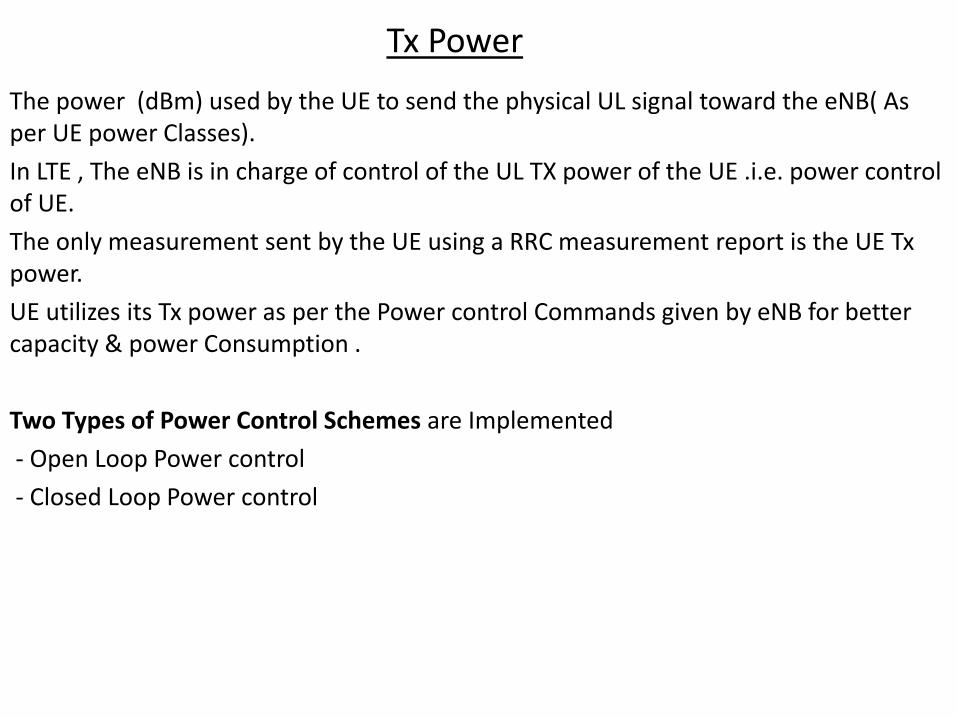
Tx Power
The power (dBm) used by the UE to send the physical UL signal toward the eNB( As per UE power Classes).
In LTE , The eNB is in charge of control of the UL TX power of the UE .i.e. power control of UE.
The only measurement sent by the UE using a RRC measurement report is the UE Tx power.
UE utilizes its Tx power as per the Power control Commands given by eNB for better capacity & power Consumption .
Two Types of Power Control Schemes are Implemented
- Open Loop Power control
- Closed Loop Power control
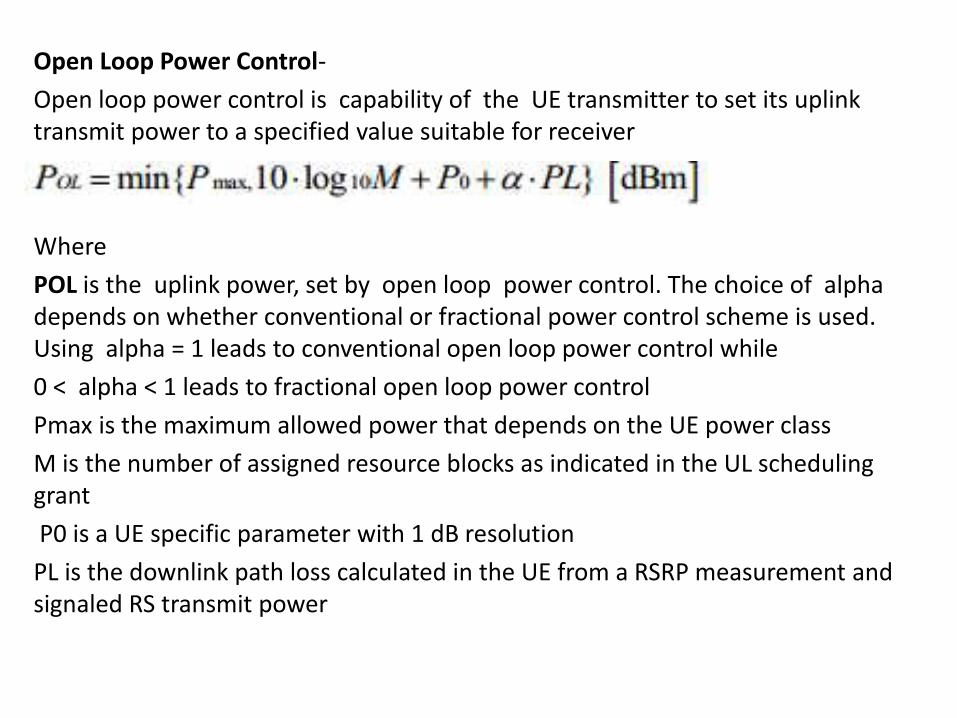
Open Loop Power Control-
Open loop power control is capability of the UE transmitter to set its uplink transmit power to a specified value suitable for receiver
Where
POL is the uplink power, set by open loop power control. The choice of alpha depends on whether conventional or fractional power control scheme is used. Using alpha = 1 leads to conventional open loop power control while
0 < alpha < 1 leads to fractional open loop power control
Pmax is the maximum allowed power that depends on the UE power class
M is the number of assigned resource blocks as indicated in the UL scheduling grant
P0 is a UE specific parameter with 1 dB resolution
PL is the downlink path loss calculated in the UE from a RSRP measurement and signaled RS transmit power

• Closed Loop power Control –
Closed loop power control is capability of the UE to adjust the uplink transmit power in accordance with the closed loop correction value also known as transmit power control (TPC) commands. TPC commands are transmitted, by the eNB towards the UE, based on the closed loop signal-to-interference and noise ratio (SINR) target and measured received SINR. In a closed-loop power control system, the uplink receiver at the eNB estimates the SINR of the received signal, and compares it with the desired SINR target value. When the received SINR is below the SINR target, a TPC command is transmitted to the UE to request for an increase in the transmitter power. Otherwise, the TPC command will request for a decrease in transmitter power.

Thanks